4.1. Comparing Different Algorithms and Magnification Results of AFM
Table 4 and
Table 5 present the statistical analysis of pore structure using different algorithms. It is important to note that the choice of algorithm and magnification can have a notable impact on coal pore volume and surface roughness. The Threshold and Chen’s algorithms exhibit significant influence on the results, while variations in magnification (×200 and ×4000) also yield different outcomes.
At an image magnification of ×200, the Threshold algorithm yields a range of pore numbers between 127 and 264, while Chen’s algorithm results in a range of pore numbers spanning from 154 to 288. On the other hand, at an image magnification of ×4000, the Threshold algorithm produces a pore number range of 494 to 1056, whereas Chen’s algorithm generates a pore number range of 563 to 1220. Whether the analysis is based on the Threshold algorithm or Chen’s algorithm, the smallest pore sizes characterized at ×4000 magnification are smaller than those observed at ×200 magnification. For instance, using the Threshold algorithm, the smallest pore sizes for DFS are 0.18 nm and 0.35 nm at ×4000 and ×200 magnifications, respectively. Similarly, with Chen’s algorithm, the smallest pore sizes for DFS are 0.12 nm and 0.28 nm at ×4000 and ×200 magnifications, respectively. However, there is not much variation observed in the maximum pore sizes characterized between different magnifications. For example, with the Threshold algorithm, the maximum pore sizes characterized are 220.4 nm and 219.2 nm at ×4000 and ×200 magnifications, respectively. Similarly, using Chen’s algorithm, the maximum pore sizes are 234.5 nm and 235.3 nm at ×4000 and ×200 magnifications, respectively. The porosity obtained by calculations based on different algorithms is shown in
Figure 7.
The discrepancy between the results obtained from the Threshold and Chen’s algorithms can be attributed primarily to variations in pore shape. The presence of numerous ink-bottle-shaped pores, characterized by a small orifice and a larger throat, leads to smaller pore size measurements with the Threshold algorithm compared to Chen’s algorithm. Regarding the disparities between ×200 and ×4000 images, they arise primarily from the inherent heterogeneity of coal. The broader scope of the AFM image captures a more pronounced manifestation of this heterogeneity. It is important to note that the absolute deviation between ×200 and ×4000 images is irregular, indicating that the strength of heterogeneity characteristics is contingent on the specific region selected within the AFM image.
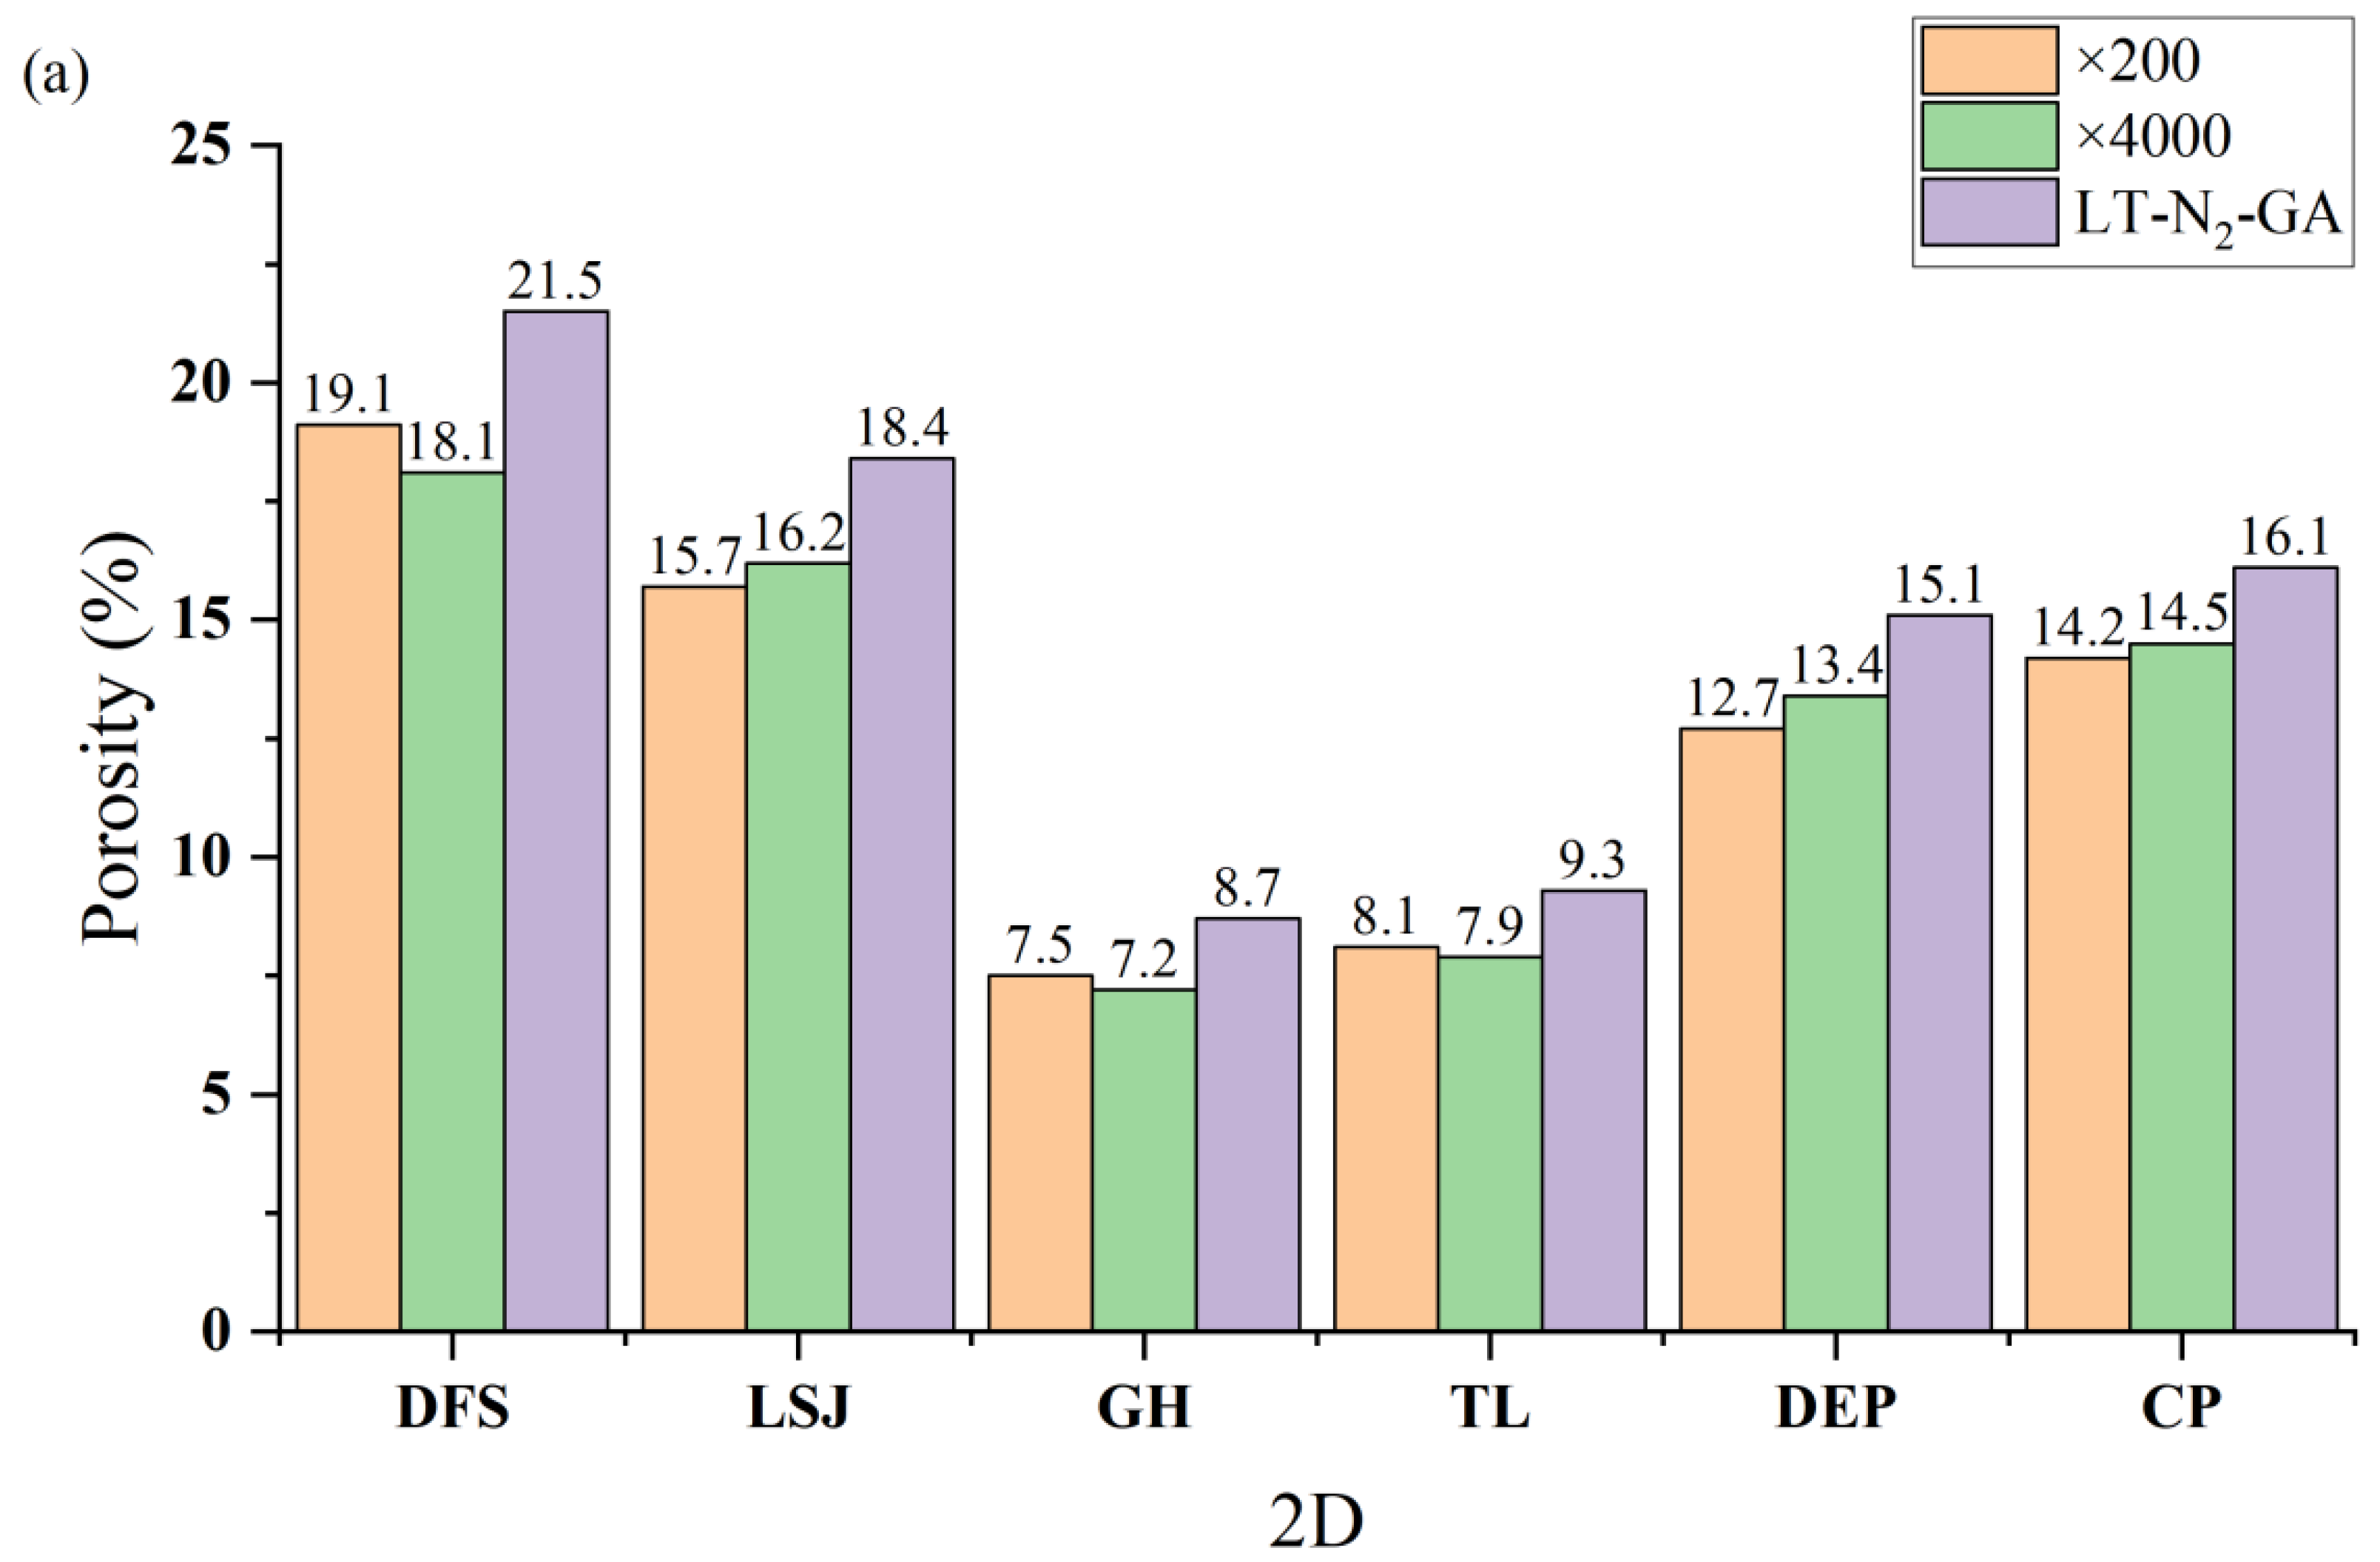
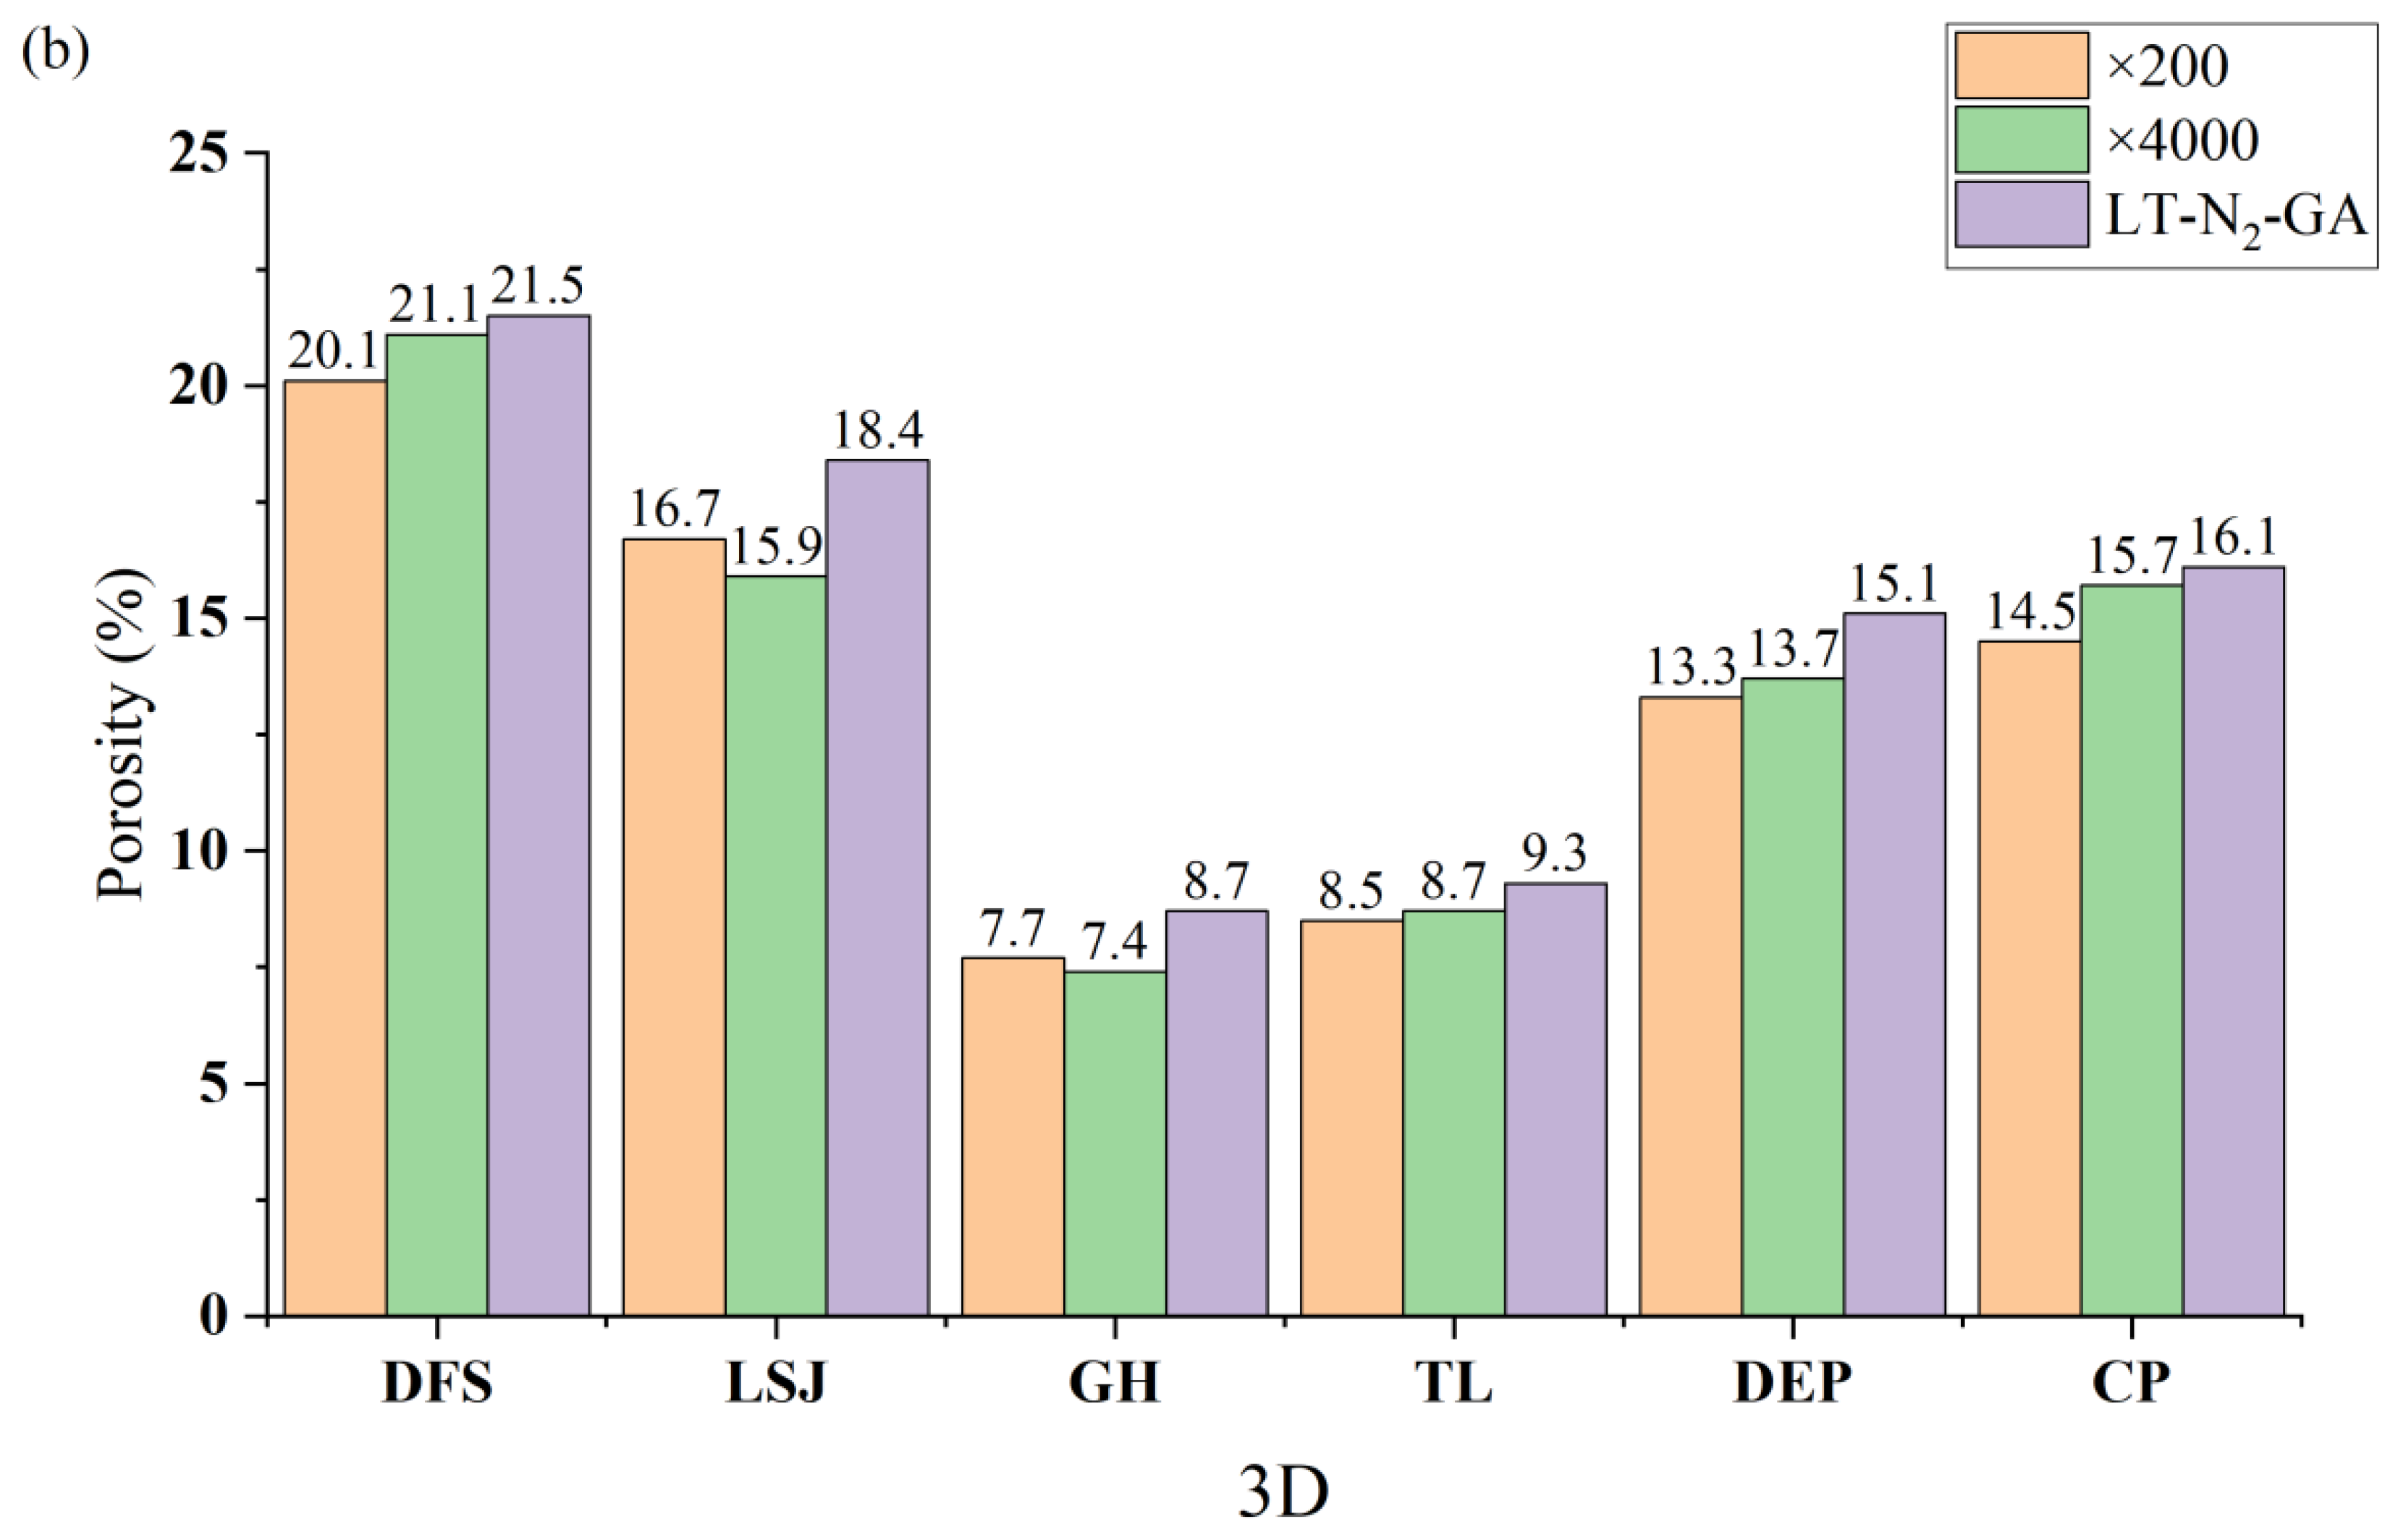
Figure 7 presents the porosity values obtained using different methods. The porosity distribution obtained from the Threshold algorithm ranges from 7.2% to 19.1%, while Chen’s algorithm yields a porosity range of 7.4% to 21.1%. Conversely, the porosity values determined through LT-N
2-GA measurements fall within the range of 8.7% to 21.5%. Notably, the results obtained from Chen’s algorithm exhibit a closer resemblance to the porosity values derived from LT-N
2-GA measurements. Moreover, the difference in porosity between ×200 and ×4000 nm magnifications is similar, suggesting that the effect of magnification on porosity calculations can be considered negligible.
Table 6 provides the values of surface roughness for different magnifications. At ×200 magnification, the
Rsk values range from −0.73 to 0.19, the
Rku values range from 4.35 to 13.1, the
Rq values range from 52.2 to 132, and the
Ra values range from 30.7 to 107. On the other hand, at ×4000 magnification, the
Rsk values range from −0.31 to 0.19, the
Rku values range from 2.74 to 5.51, the
Rq values range from 3.85 to 21.1, and the
Ra values range from 2.60 to 16.23. Notably, the
Rq and
Ra values at ×200 magnification are 5–14 times higher than those at ×4000 magnification, with the largest difference observed in the LSJ sample. This can be attributed to the increased variation in height from the mean line as magnification increases, indicating a rougher outer surface. The differences in
Rsk and
Rku values between ×200 and ×4000 magnifications are relatively small. However, the
Rsk and
Rku values at ×4000 magnification are generally higher, suggesting a greater prominence of surface peaks at lower magnifications.
4.2. Pore Structure Evolution on the Second Coalification Jump
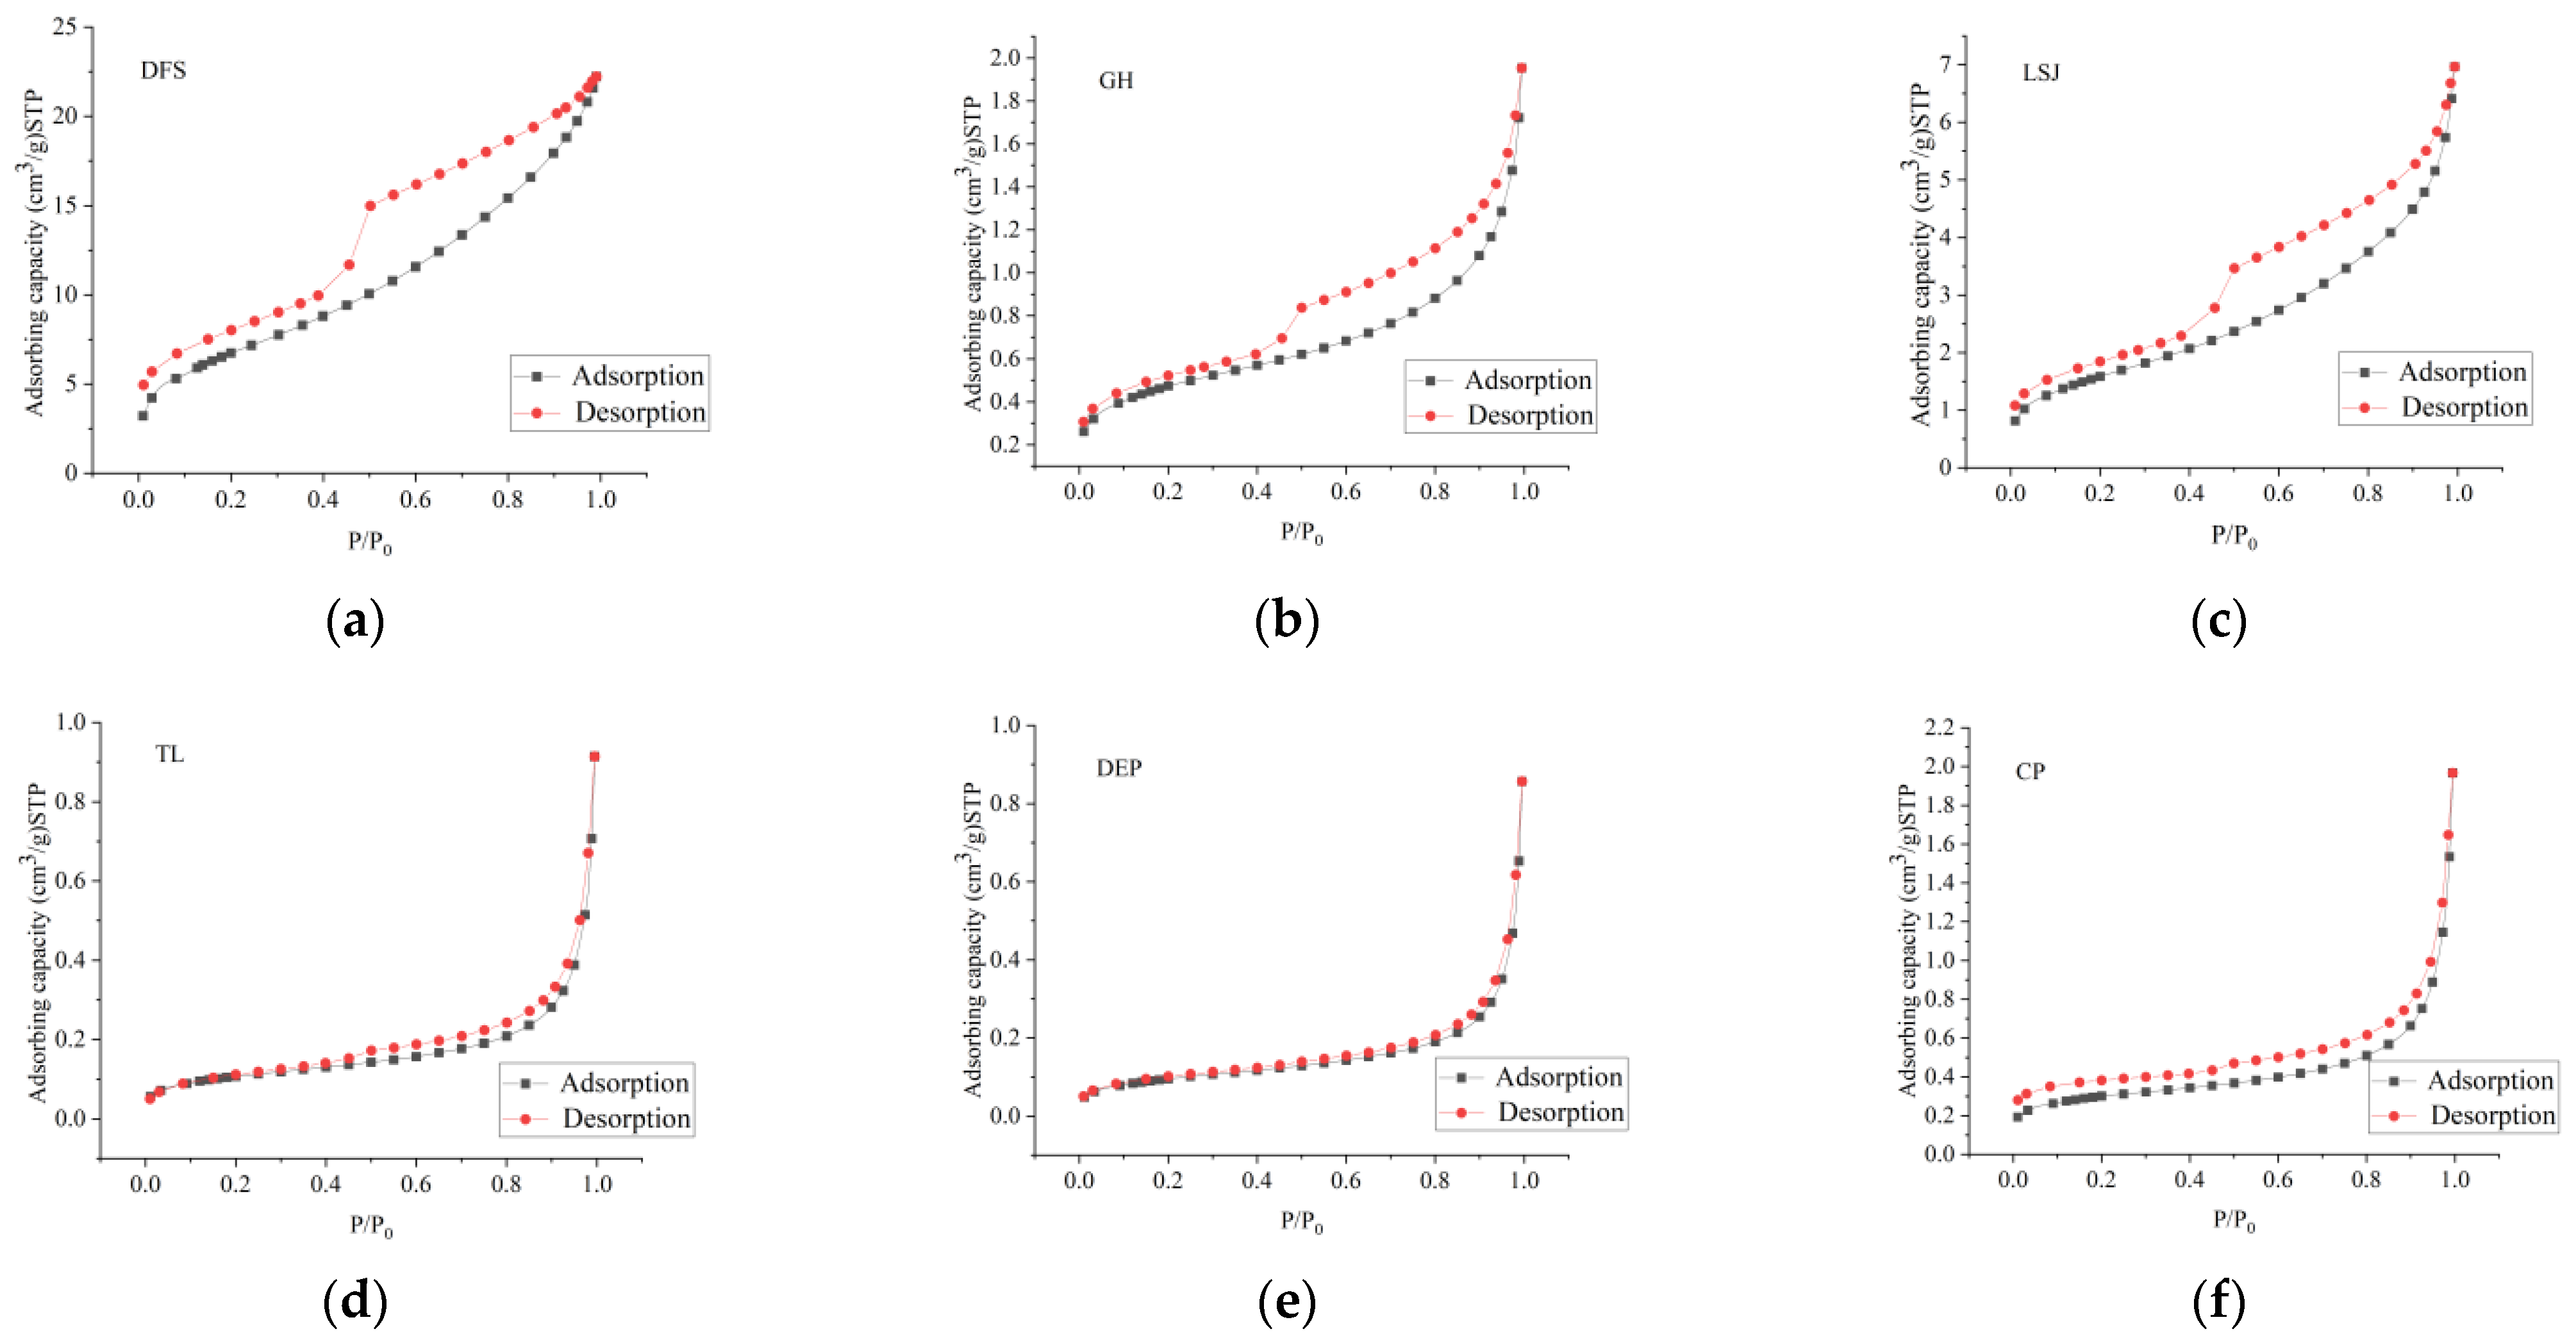
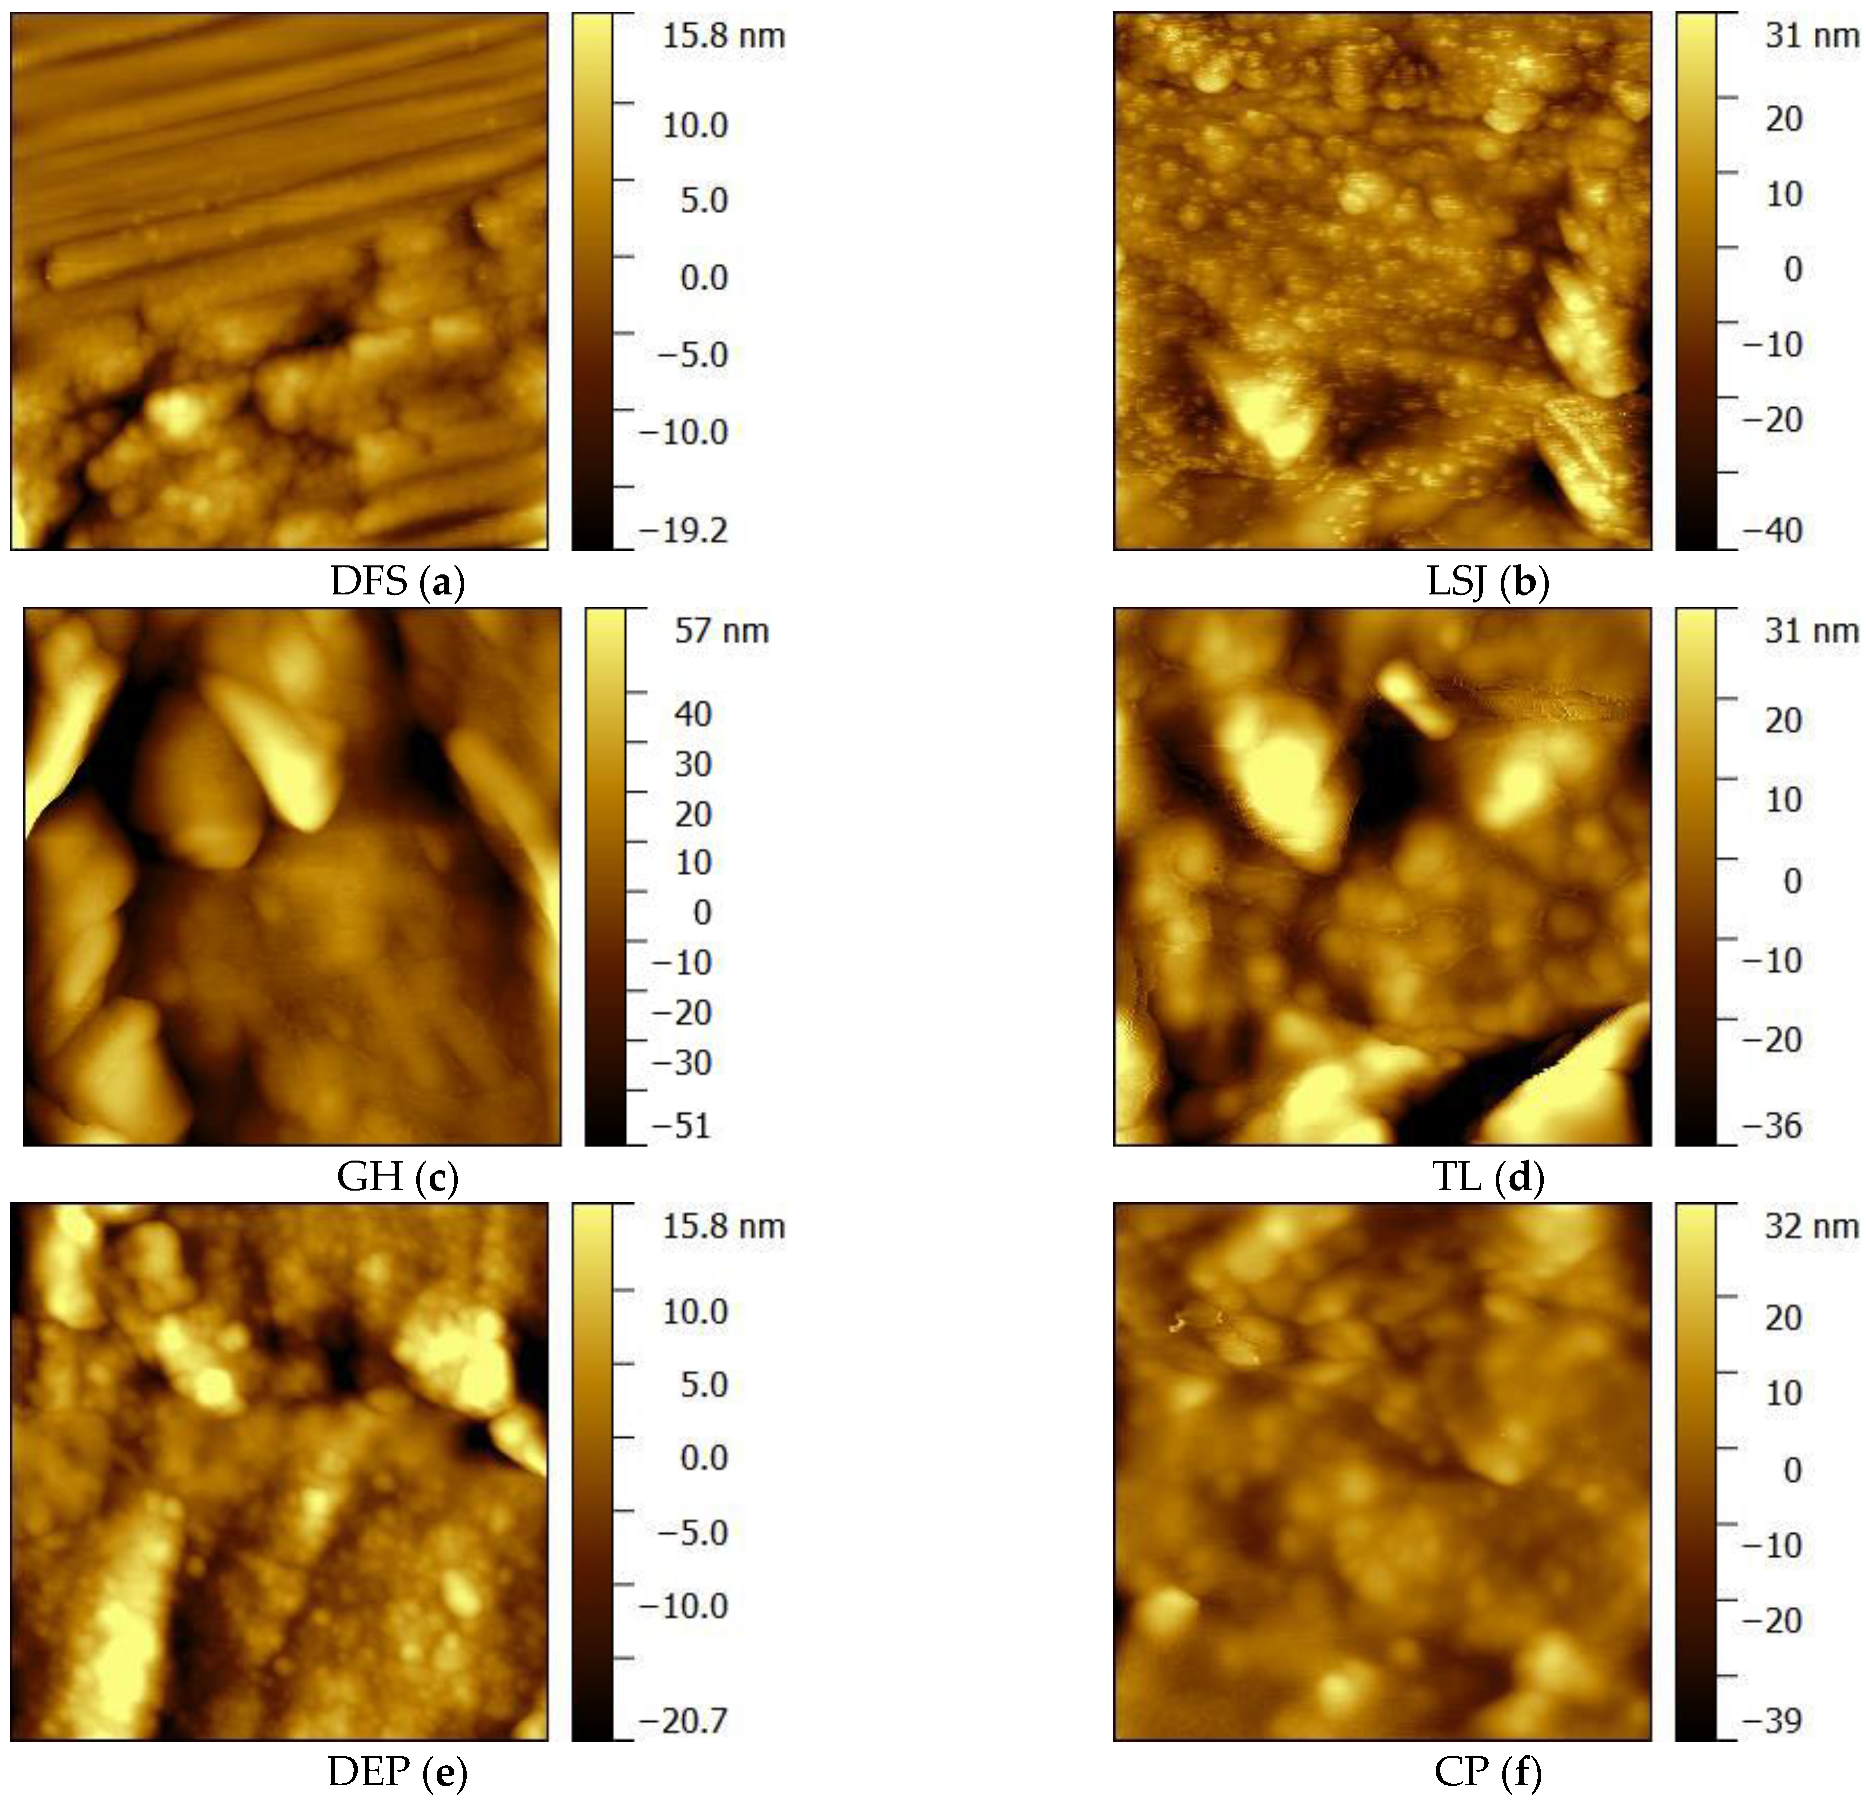
In the LT-N2-GA images, high-volatile bituminous coals and middle-volatile bituminous coals exhibit a higher presence of cylindrical pores, while low-volatile bituminous coal displays a significant proportion of wedge-shaped pores. On the other hand, the AFM images reveal distinct characteristics for each coal type. In high-volatile bituminous coal, linear parallel cracks are prevalent, extending over considerable distances, and the surface exhibits a banded structure with varying widths. Middle-volatile bituminous coal exhibits an increase in the width of microcracks on the surface, along with the coexistence of microcracks and pores. Low-volatile bituminous coal displays a fibrous surface structure that tends to be compact and flattened in morphology. By combining the LT-N2-GA and AFM images, it becomes apparent that the pore structure of bituminous coal gradually narrows as the degree of metamorphism increases. Furthermore, larger cracks diminish while the presence of micro-cracks becomes more pronounced.
The pore volume, specific surface area (SSA), pore number, pore size, and porosity can be effectively determined through LT-CO2-GA, LT-N2-GA, and AFM experiments. These pore characteristics exhibit a close relationship with coal ranks. The SSA, PV, and pore number demonstrate a rapid decline within the Ro,max = 1.19%~1.29%, followed by a gradual increase within the Ro,max = 1.37%~1.97%. However, the observed values for pore size and porosity differ slightly. The maximum pore size exhibits irregular changes, while the minimum pore size increases between Ro,max = 1.19%~1.37% before gradually decreasing. Conversely, the variation in porosity follows an opposite trend, wherein it rapidly decreases within the Ro,max = 1.19%~1.37% and then increases.
The observed phenomenon can be attributed to the changes in the macromolecular structure during the second coalification jump. Low metamorphic coal exhibits an irregular molecular structure, with long side chains and numerous functional groups, leading to the formation of a relatively loose spatial structure with significant micropores SSA and PV. As coal rank increases, the presence of oxygen-containing functional groups and alkyl side chains decreases, while aromatic nuclei increase. This results in a compression of the coal structure, leading to the lowest values of SSA and PV at this stage (Ro,max = 1.19%~1.29%). With further coalification, a substantial number of aromatic layers are formed, enhancing the ordering of macromolecules and causing the aromatics to be arranged more closely. This arrangement leads to the formation of new cracks, resulting in an increase in micropores SSA and PV, and a decrease in pore size (Ro,max = 1.37%~1.97%). It is important to note that the changes in porosity and micropore characteristics are not identical.
This discrepancy can be attributed to the stage between Ro,max = 1.29%~1.6%, where the length of aliphatic chains decreases, leading to an increase in the aromatic system. However, the dehydrogenation of aromatic groups prevents the formation of a well-defined parallel structure in the enlarged aromatic system. As a result, the coal skeleton volume increases, causing a lag in porosity changes compared to micropore changes. Nonetheless, as the aromatic structure gradually arranges itself in a regular manner, the spacing between layers decreases, resulting in increased SSA, PV, and porosity.
4.3. Surface Roughness Evolution on the Second Coalification Jump
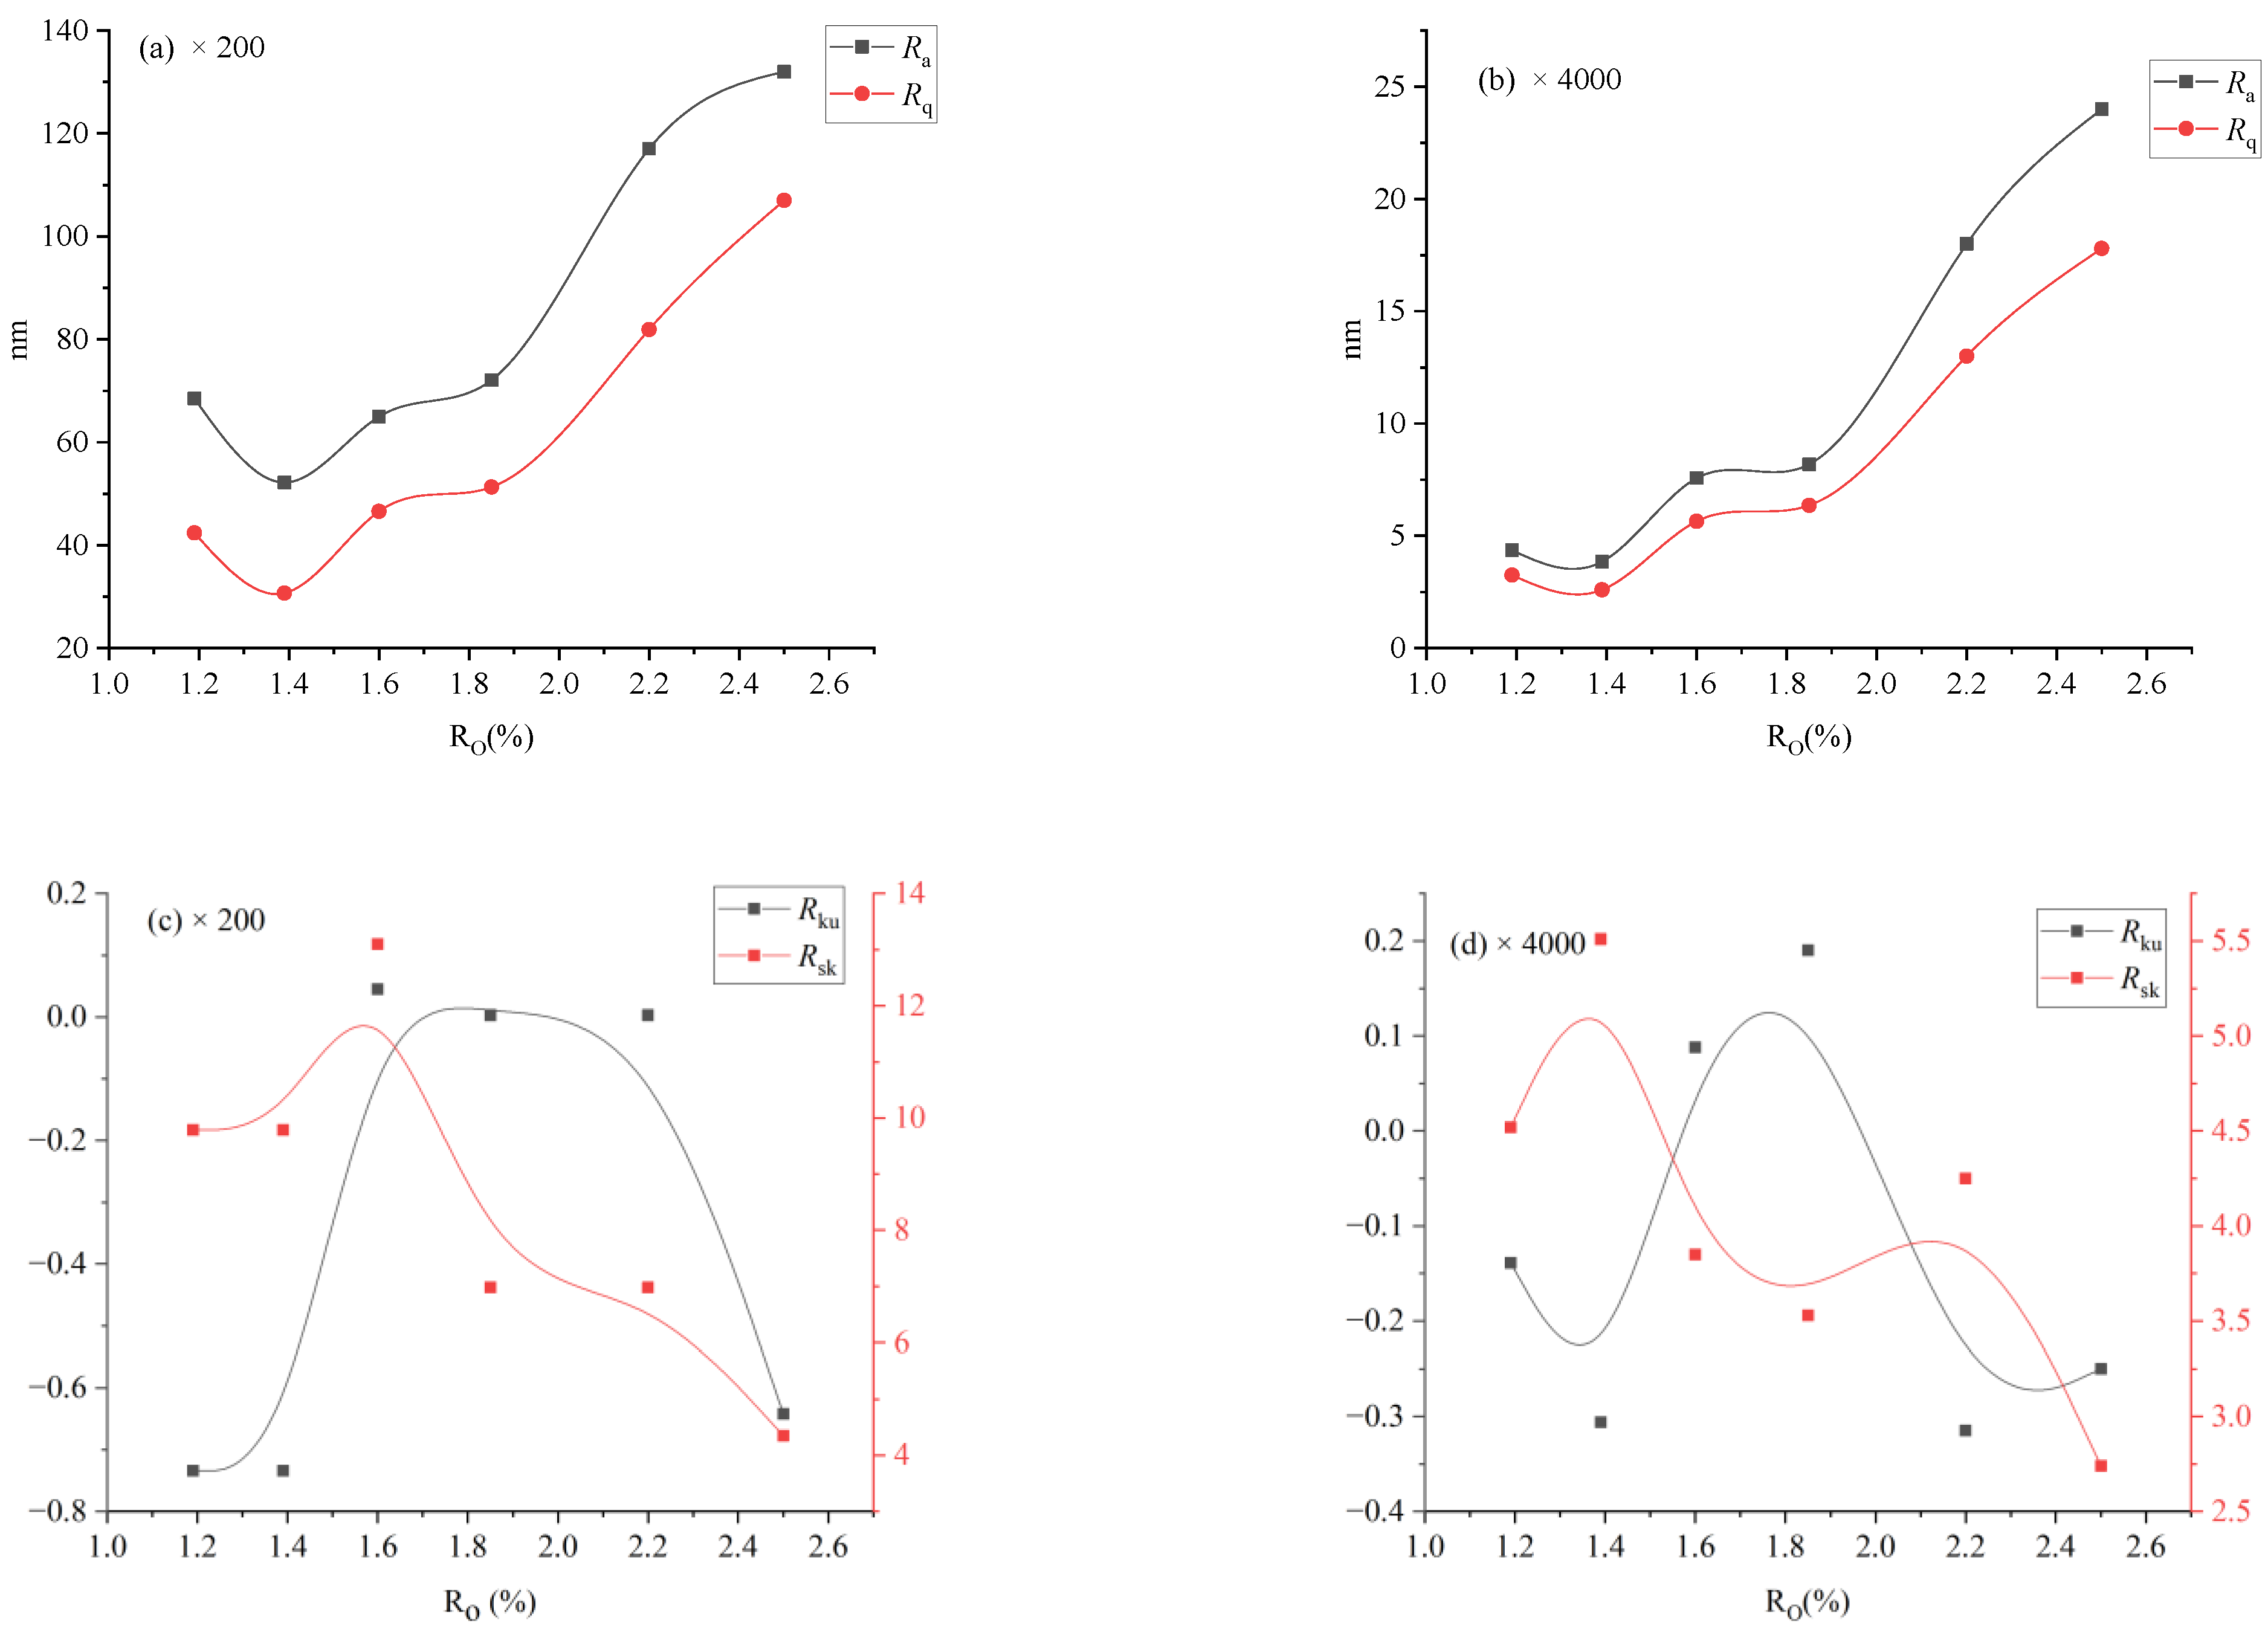
Surface roughness changed with the degree of coalification, relationships between surface roughness (
Ra,
Rq,
Rsk, and
Rku) and thermal maturity (
Ro,max) of naturally matured coals are shown in
Figure 8.
As illustrated in
Figure 8a,b, the evolution trends of
Ra and
Rq are clearly similar. As
Ro,max = 1.19–1.39%,
Ra and
Rq decrease with increasing
Ro,max, with minimum values at
Ro, max = 1.39%; as
Ro,max = 1.39–1.80%,
Ra and
Rq increase with increasing
Ro,max slowly, and more rapidly when
Ro,max = 1.8–2.5%. As illustrated in
Figure 8c,d, no significant correlation was observed between
Rsk or
Rku and
Ro,max, suggesting that
Ro,max does not exert control over either
Rsk or
Rku. It is noteworthy that for GH and TL, the major surface heights are below the average (
Rsk < 0), while for other samples, more surface heights are above the average (
Rsk > 0). Additionally, all samples demonstrated
Rku > 0, indicating a concentration of all sample surface heights around the average value.
The surface roughness of coal can be influenced by both its composition and nanopore development. In coals with relatively low thermal maturity (
Ro,max < 1.3%), the surface roughness is primarily controlled by micro-composition and mineral composition. However, in coals with higher maturity (
Ro,max > 1.3%), nanopore development plays a more dominant role [
40]. Thus, the observed variation in surface roughness of bituminous coal with increasing coal rank aligns with the trend observed in nanopore development, wherein it initially decreases and then increases.
4.4. Effect of the 3D Pore Structure on CH4 Adsorption Capacity
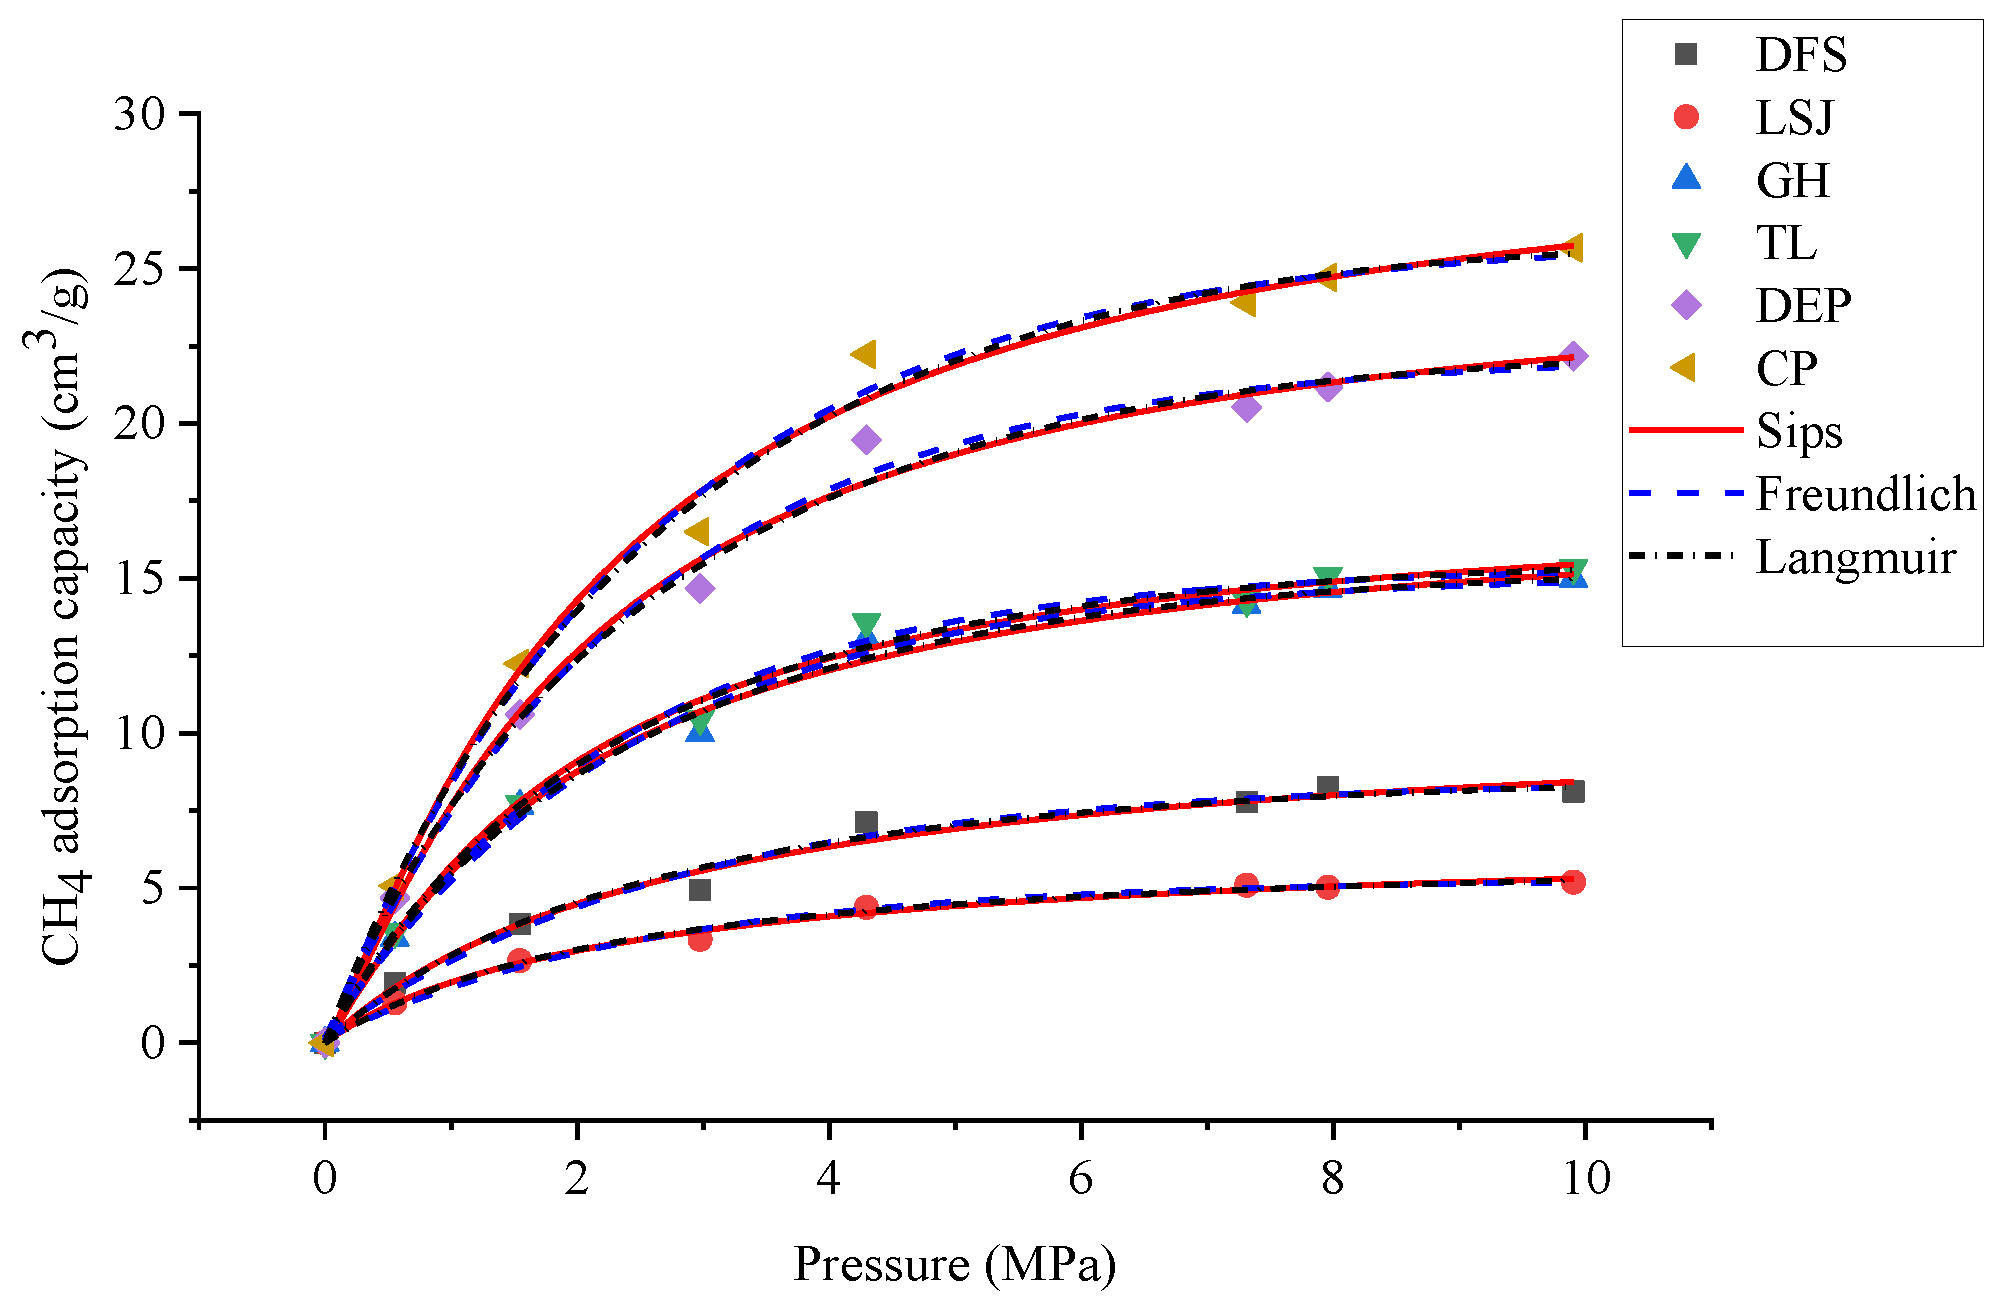
To investigate the relationship between the 3D pore structure and the adsorption capacity of CH4, HP-CH4-GA was carried out on different samples. The Langmuir, Freundlich, and Sips adsorption models were employed to simulate the adsorption isotherms, as illustrated in
Figure 9. The isotherm model constants and nonlinear regression parameters are summarized in
Table 7. The adsorption isotherm data were analyzed using three different models: Langmuir, Freundlich, and Sips. Among these models, the Sips model demonstrated a strong fit to the experimental data, exhibiting a higher correlation coefficient (
R2 = 0.9958). According to Milan et al. [
35], the Sips model is well-suited for capturing the adsorption site interactions that occur on the heterogeneous surface of the adsorbent. In contrast, the Langmuir model assumes monolayer adsorption on a homogeneous surface. Given these considerations, the Sips model is considered more appropriate for accurately characterizing the isothermal adsorption behavior of bituminous coal. The
Qmax of CH
4 was 5.30~25.12 cm
3/g according to the Sips adsorption model.
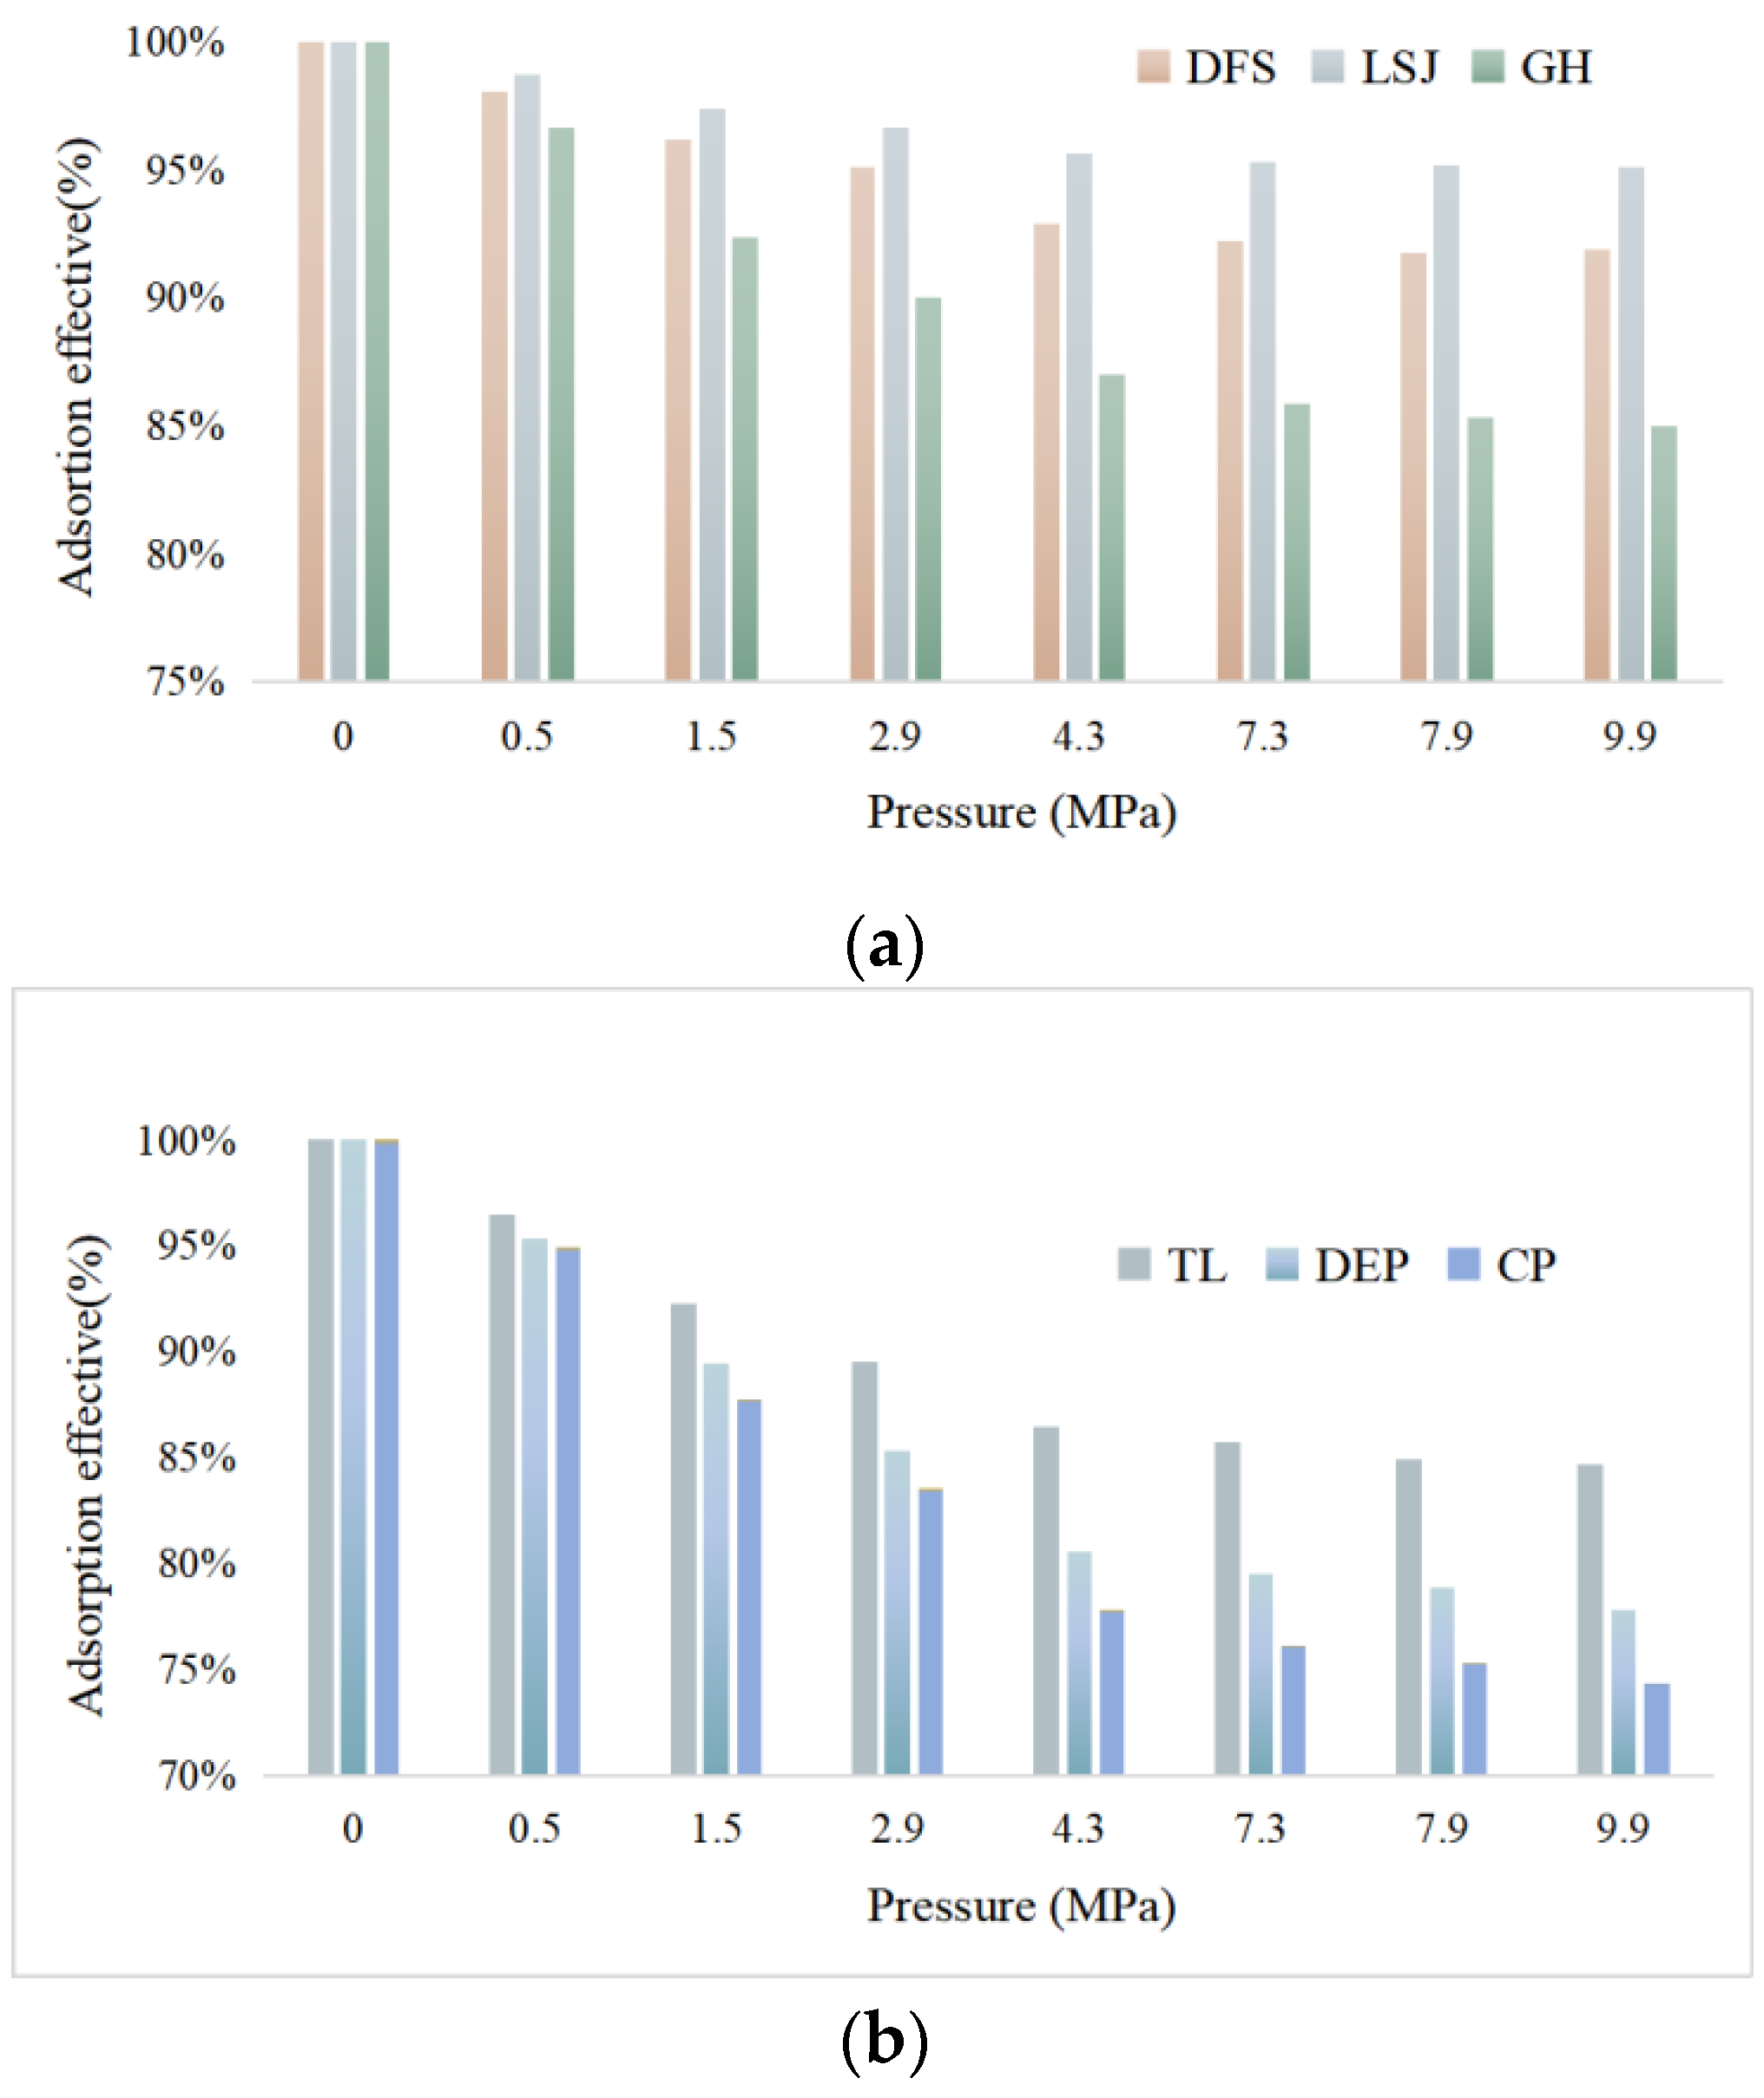
The adsorption effective capacities of the samples are presented in
Figure 10. The results indicate that the adsorption capacity of bituminous coal exhibits a trend of initially decreasing and then increasing with increasing coal rank, and it also increases with higher pressure. The order of adsorption capacity from highest to lowest is CP > DEP > TL > GH > DFS > LSJ. The observed ordering of adsorption capacities aligns with the ordering of the
Qmax.
Previous studies commonly suggest that the gas adsorption capacity of coal is influenced by micro- and mesopores [
41,
42,
43]. However, the analysis of pore structure in this study reveals that there is no evident linear relationship between porosity, micropore volume, or specific surface area and coal reservoir adsorption capacity, particularly for lignite and bituminous coal [
44,
45]. Notably, in this study, the micropore volume and specific surface area of DFS (43.354, 0.019) and TL (48.049, 0.019) are comparable. However, the
Qmax and effective adsorption capacity of TL (9.98, 91%) are higher than those of DFS (17.95, 84%). Similarly, although the micropore volume and specific surface area of GH (43.354, 0.019) are smaller than those of TL (48.049, 0.019), the
Qmax and effective adsorption capacity are comparable. These findings suggest that additional factors beyond micropore volume and specific surface area contribute to the adsorption capacity of coal reservoirs. Functional groups and surface roughness are recognized as factors that can influence adsorption capacity. While there have been numerous studies investigating the impact of functional groups on adsorption, the relationship between surface roughness and coal adsorption capacity has received relatively less attention.
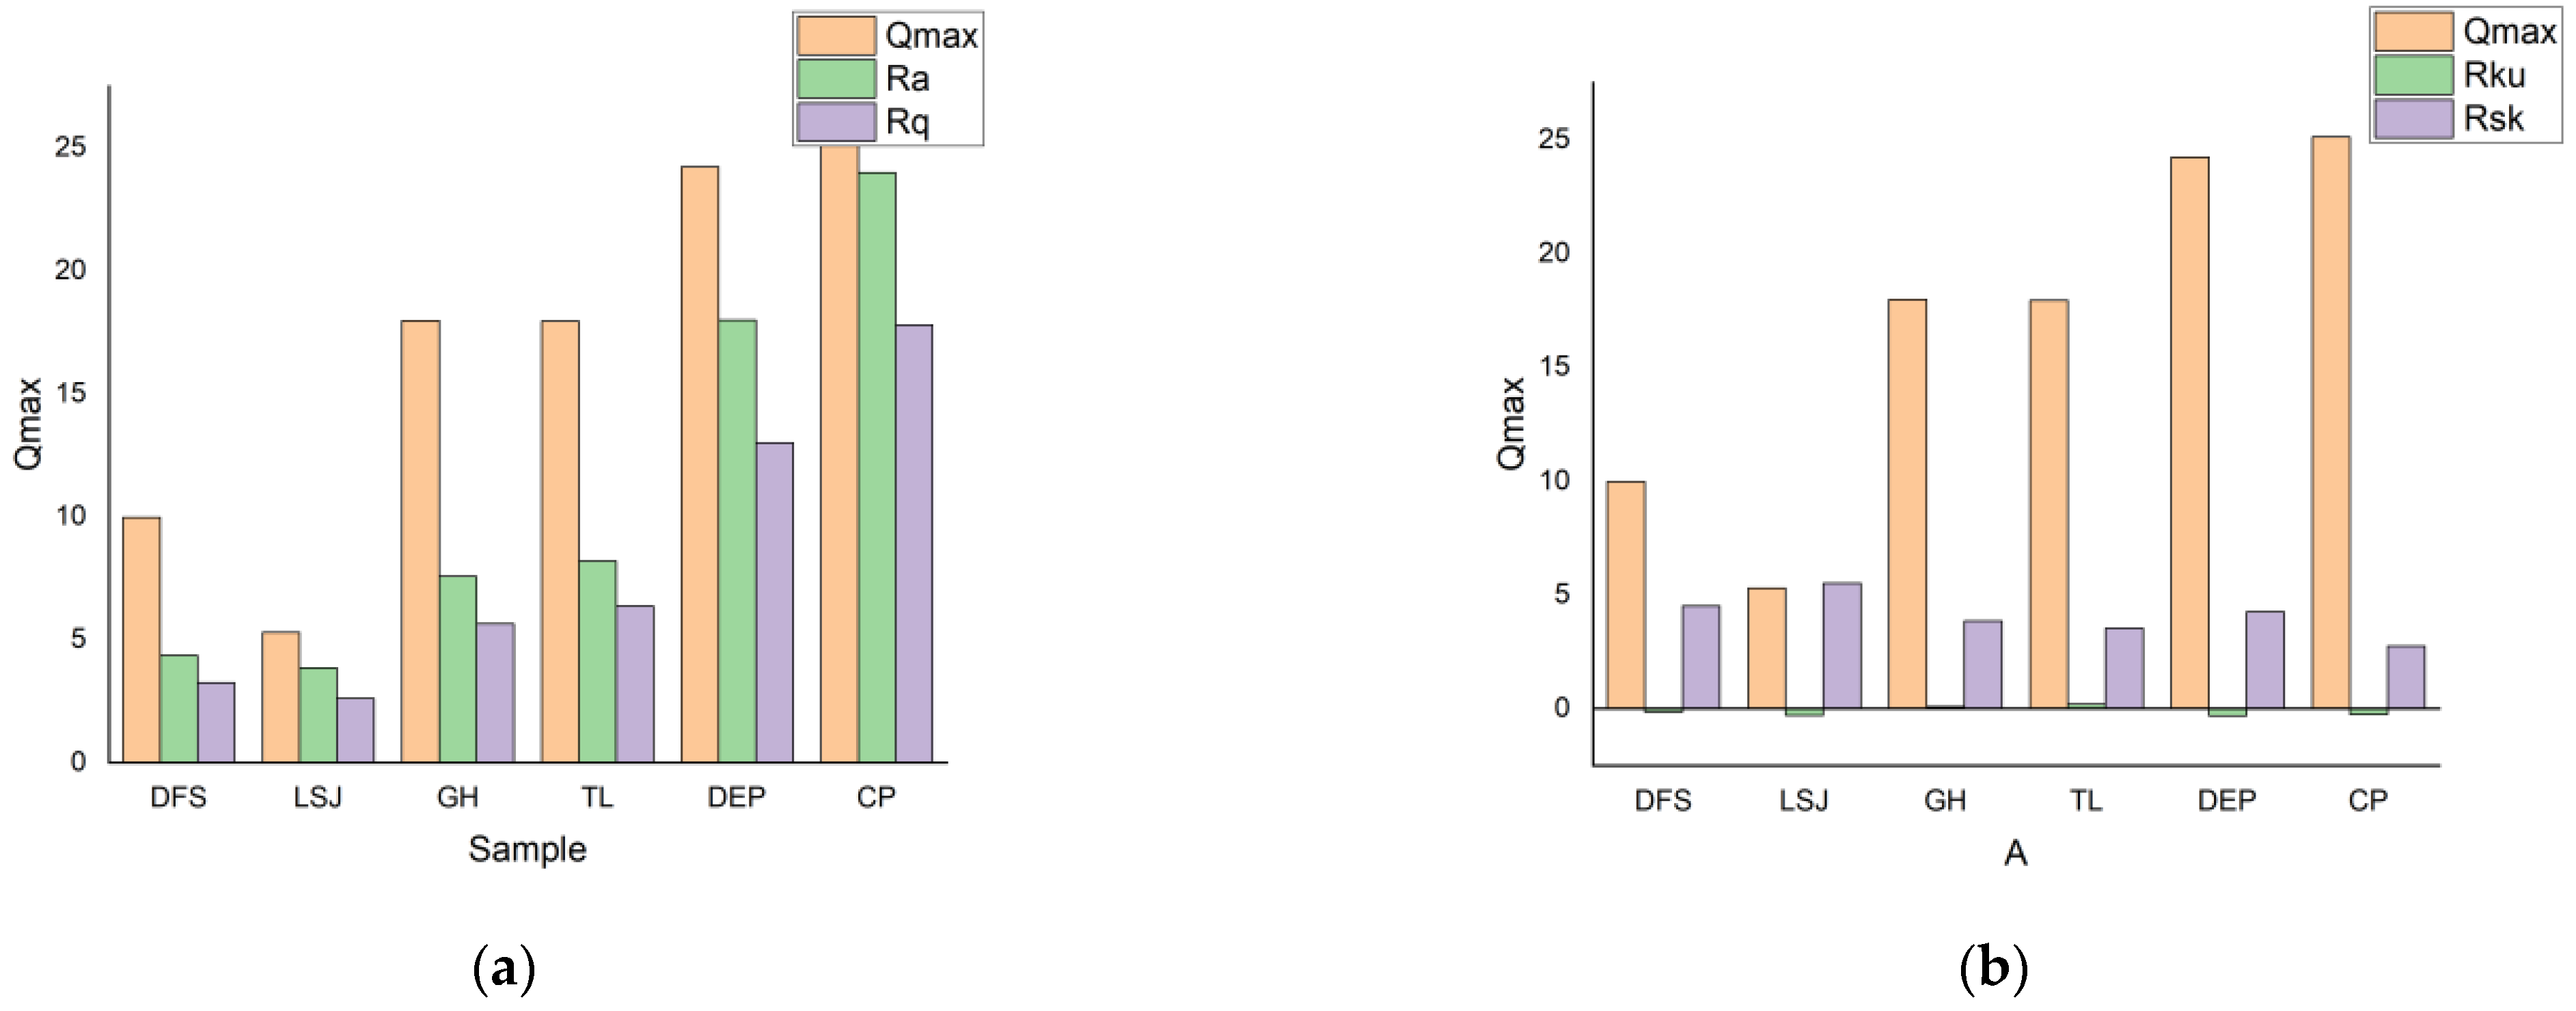
Generally, it has been observed that samples exhibiting a lower surface roughness tend to have a smaller specific surface area and gas adsorption capacity, whereas samples with a higher surface roughness exhibit a larger specific surface area. This increased surface roughness provides more space for gas adsorption [
46,
47]. The relationship between 3D surface roughness and
Qmax for all samples is presented in
Figure 11. The
Rsk and
Rku values of the samples exhibit a positive correlation with
Qmax, as they represent the degree of fluctuation in the sample’s storage space, reflecting the combined surface area and volume characteristics. According to the definitions of
Rsk and
Rku, a greater fluctuation in coal results in a higher gas storage capacity. Therefore,
Rsk and
Rku can be used as indicators of gas adsorption capacity. Similarly, the values of
Ra and
Rq also show a positive correlation with
Qmax. Smaller values of
Ra and
Rq indicate a smoother coal surface, which leads to reduced friction between the gas and coal surfaces. This reduction in friction weakens the intermolecular forces between the gas and coal, resulting in stronger gas adsorption capacity. These findings highlight the significant influence of
Ra,
Rq,
Rsk, and
Rku values on the analysis of gas adsorption volume.


