
Performance of a New Grouting Material under the Coupling Effects of Freeze–Thaw and Sulfate Erosion

Abstract
1. Introduction
2. Test
2.1. Raw Material
2.2. Test Scheme
2.3. Test Method
2.3.1. Basic Performance Test Method for Slurry
2.3.2. Mass Loss Rate
2.3.3. Relative Dynamic Elastic Modulus
2.3.4. Compressive Strength Loss Rate
2.3.5. Mineralogical and Microstructural Analysis
- (1)
- XRD analysis
- (2)
- SEM analysis
- (3)
- TG analysis
3. Results
3.1. Appearance of Damage in Specimens
3.2. Mass Loss Rate
3.3. Relative Dynamic Modulus of Elasticity
3.4. Compressive Strength Loss Rate
3.5. Uniaxial Compressive Stress–Strain Curve
3.6. Mineralogical and Microstructural Analysis
3.6.1. XRD Analysis
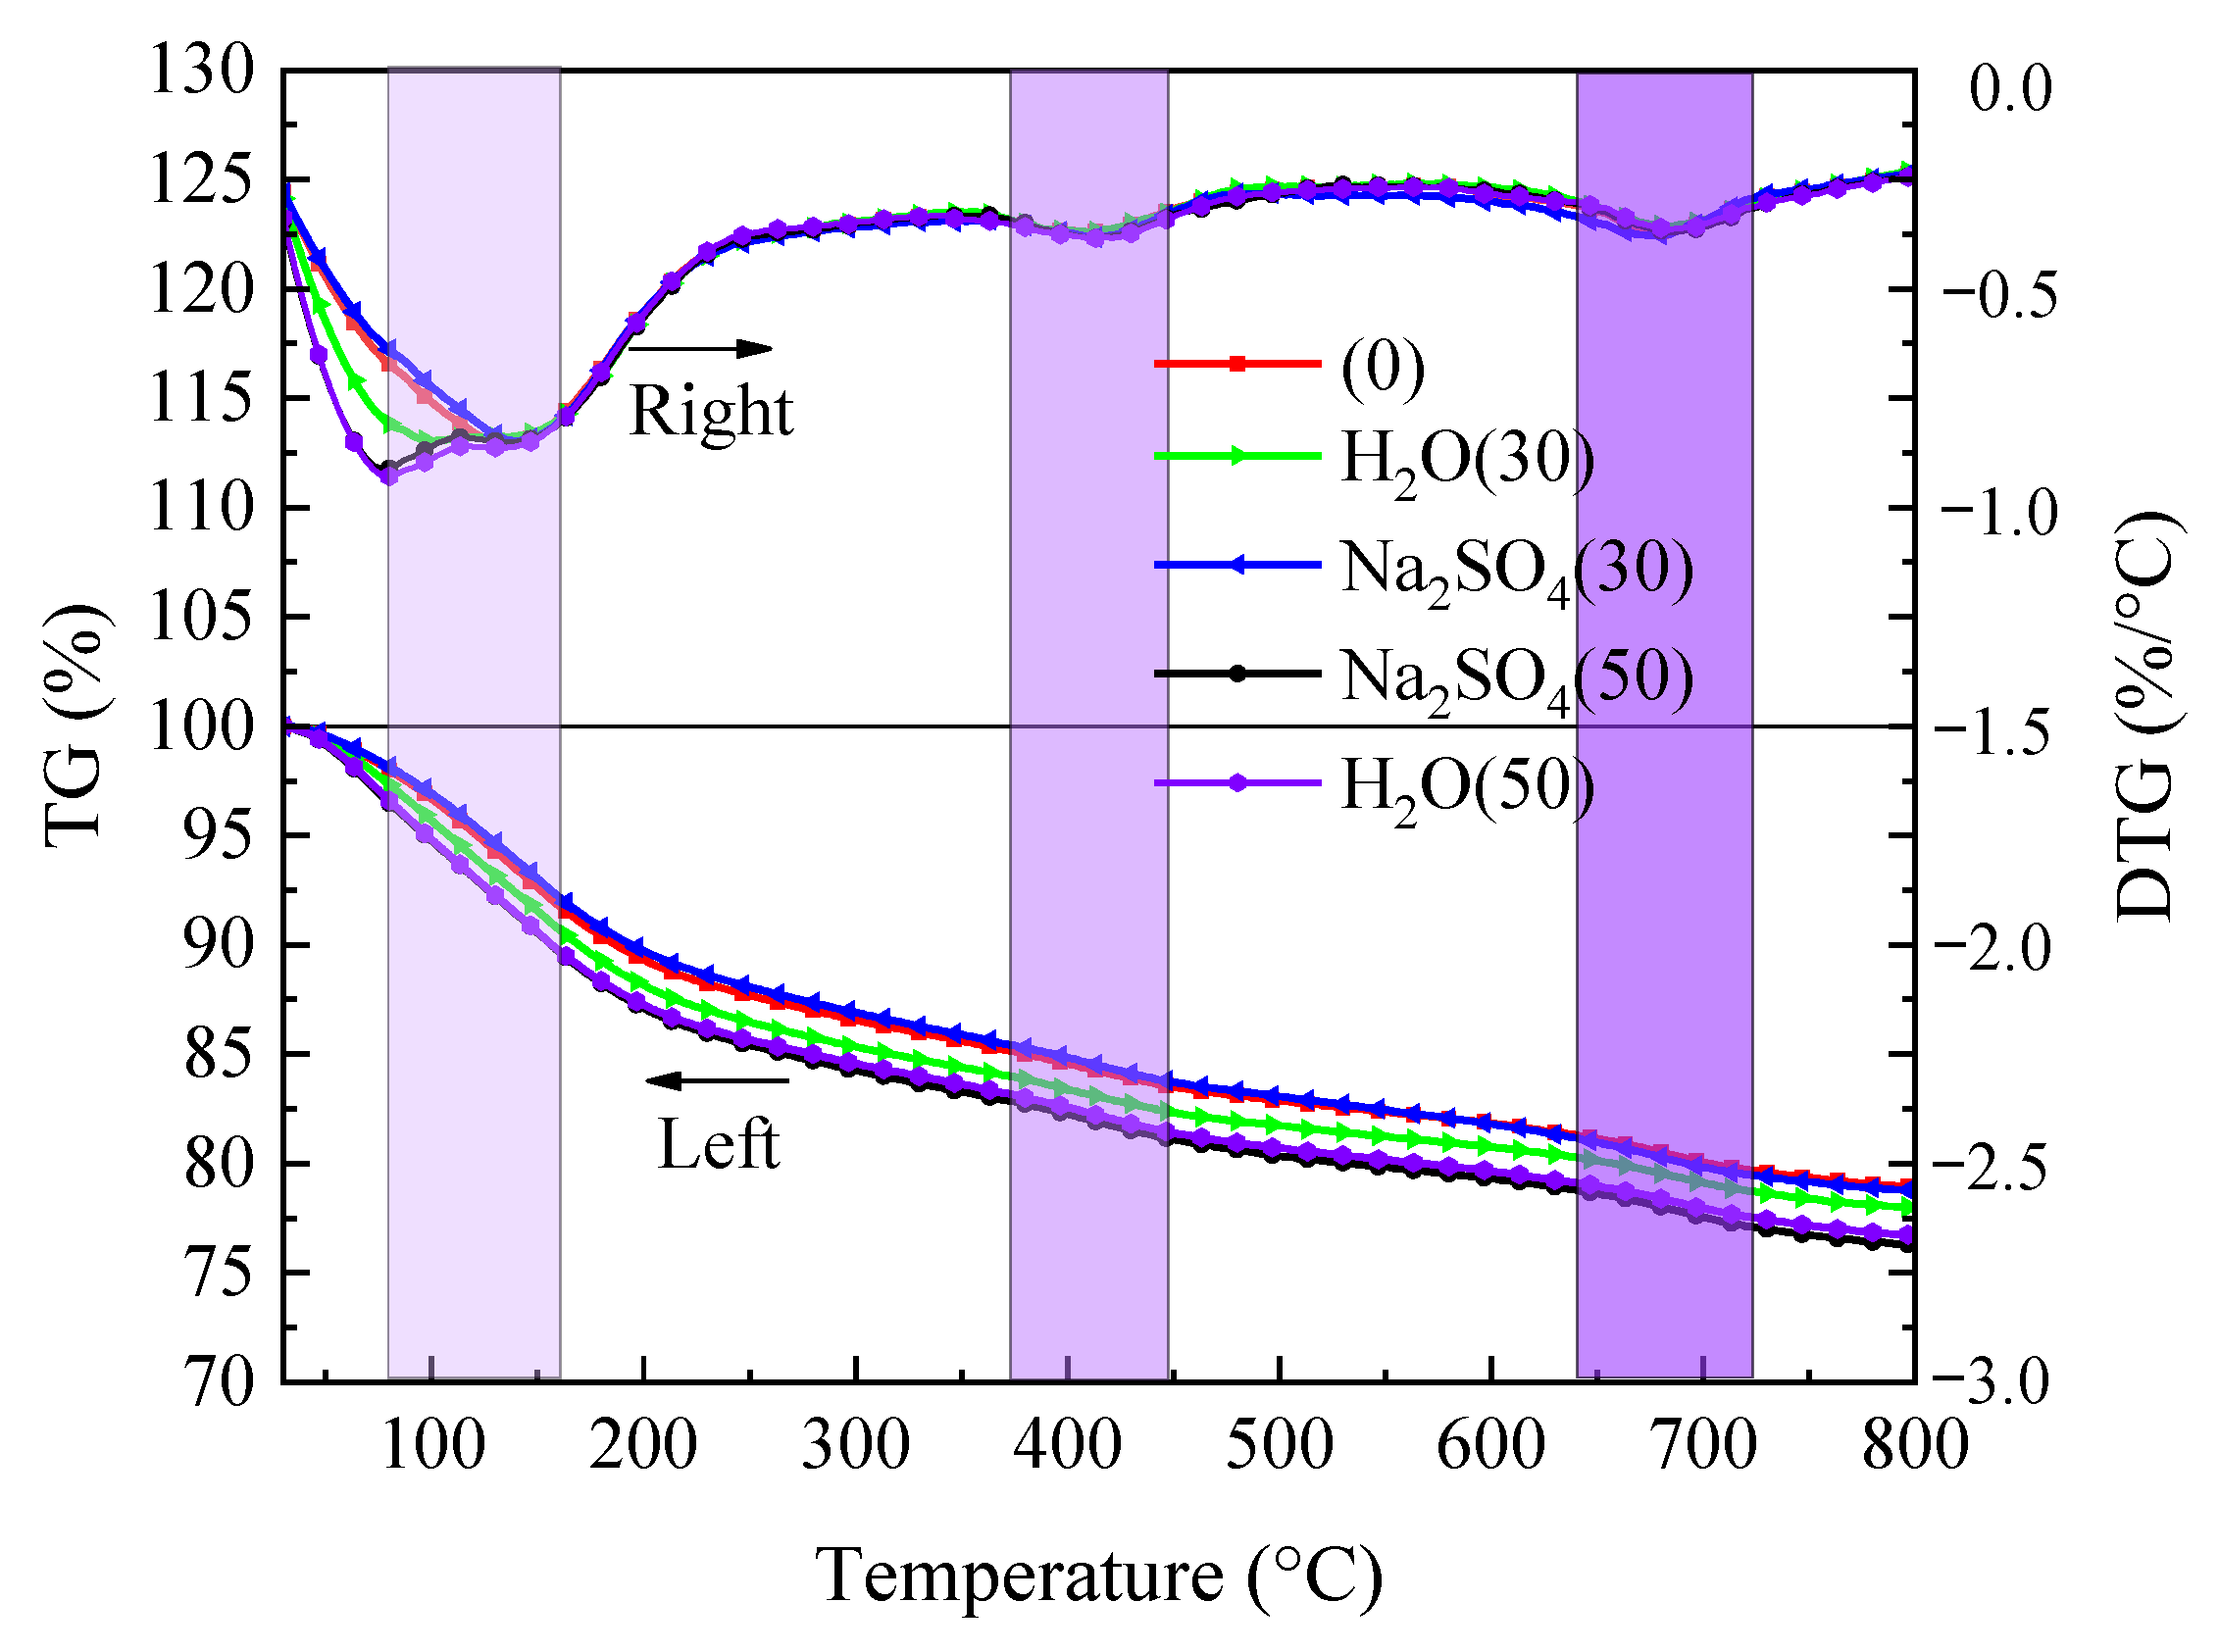
3.6.2. TGA Analysis
3.6.3. SEM Analysis
4. Conclusions
- (1)
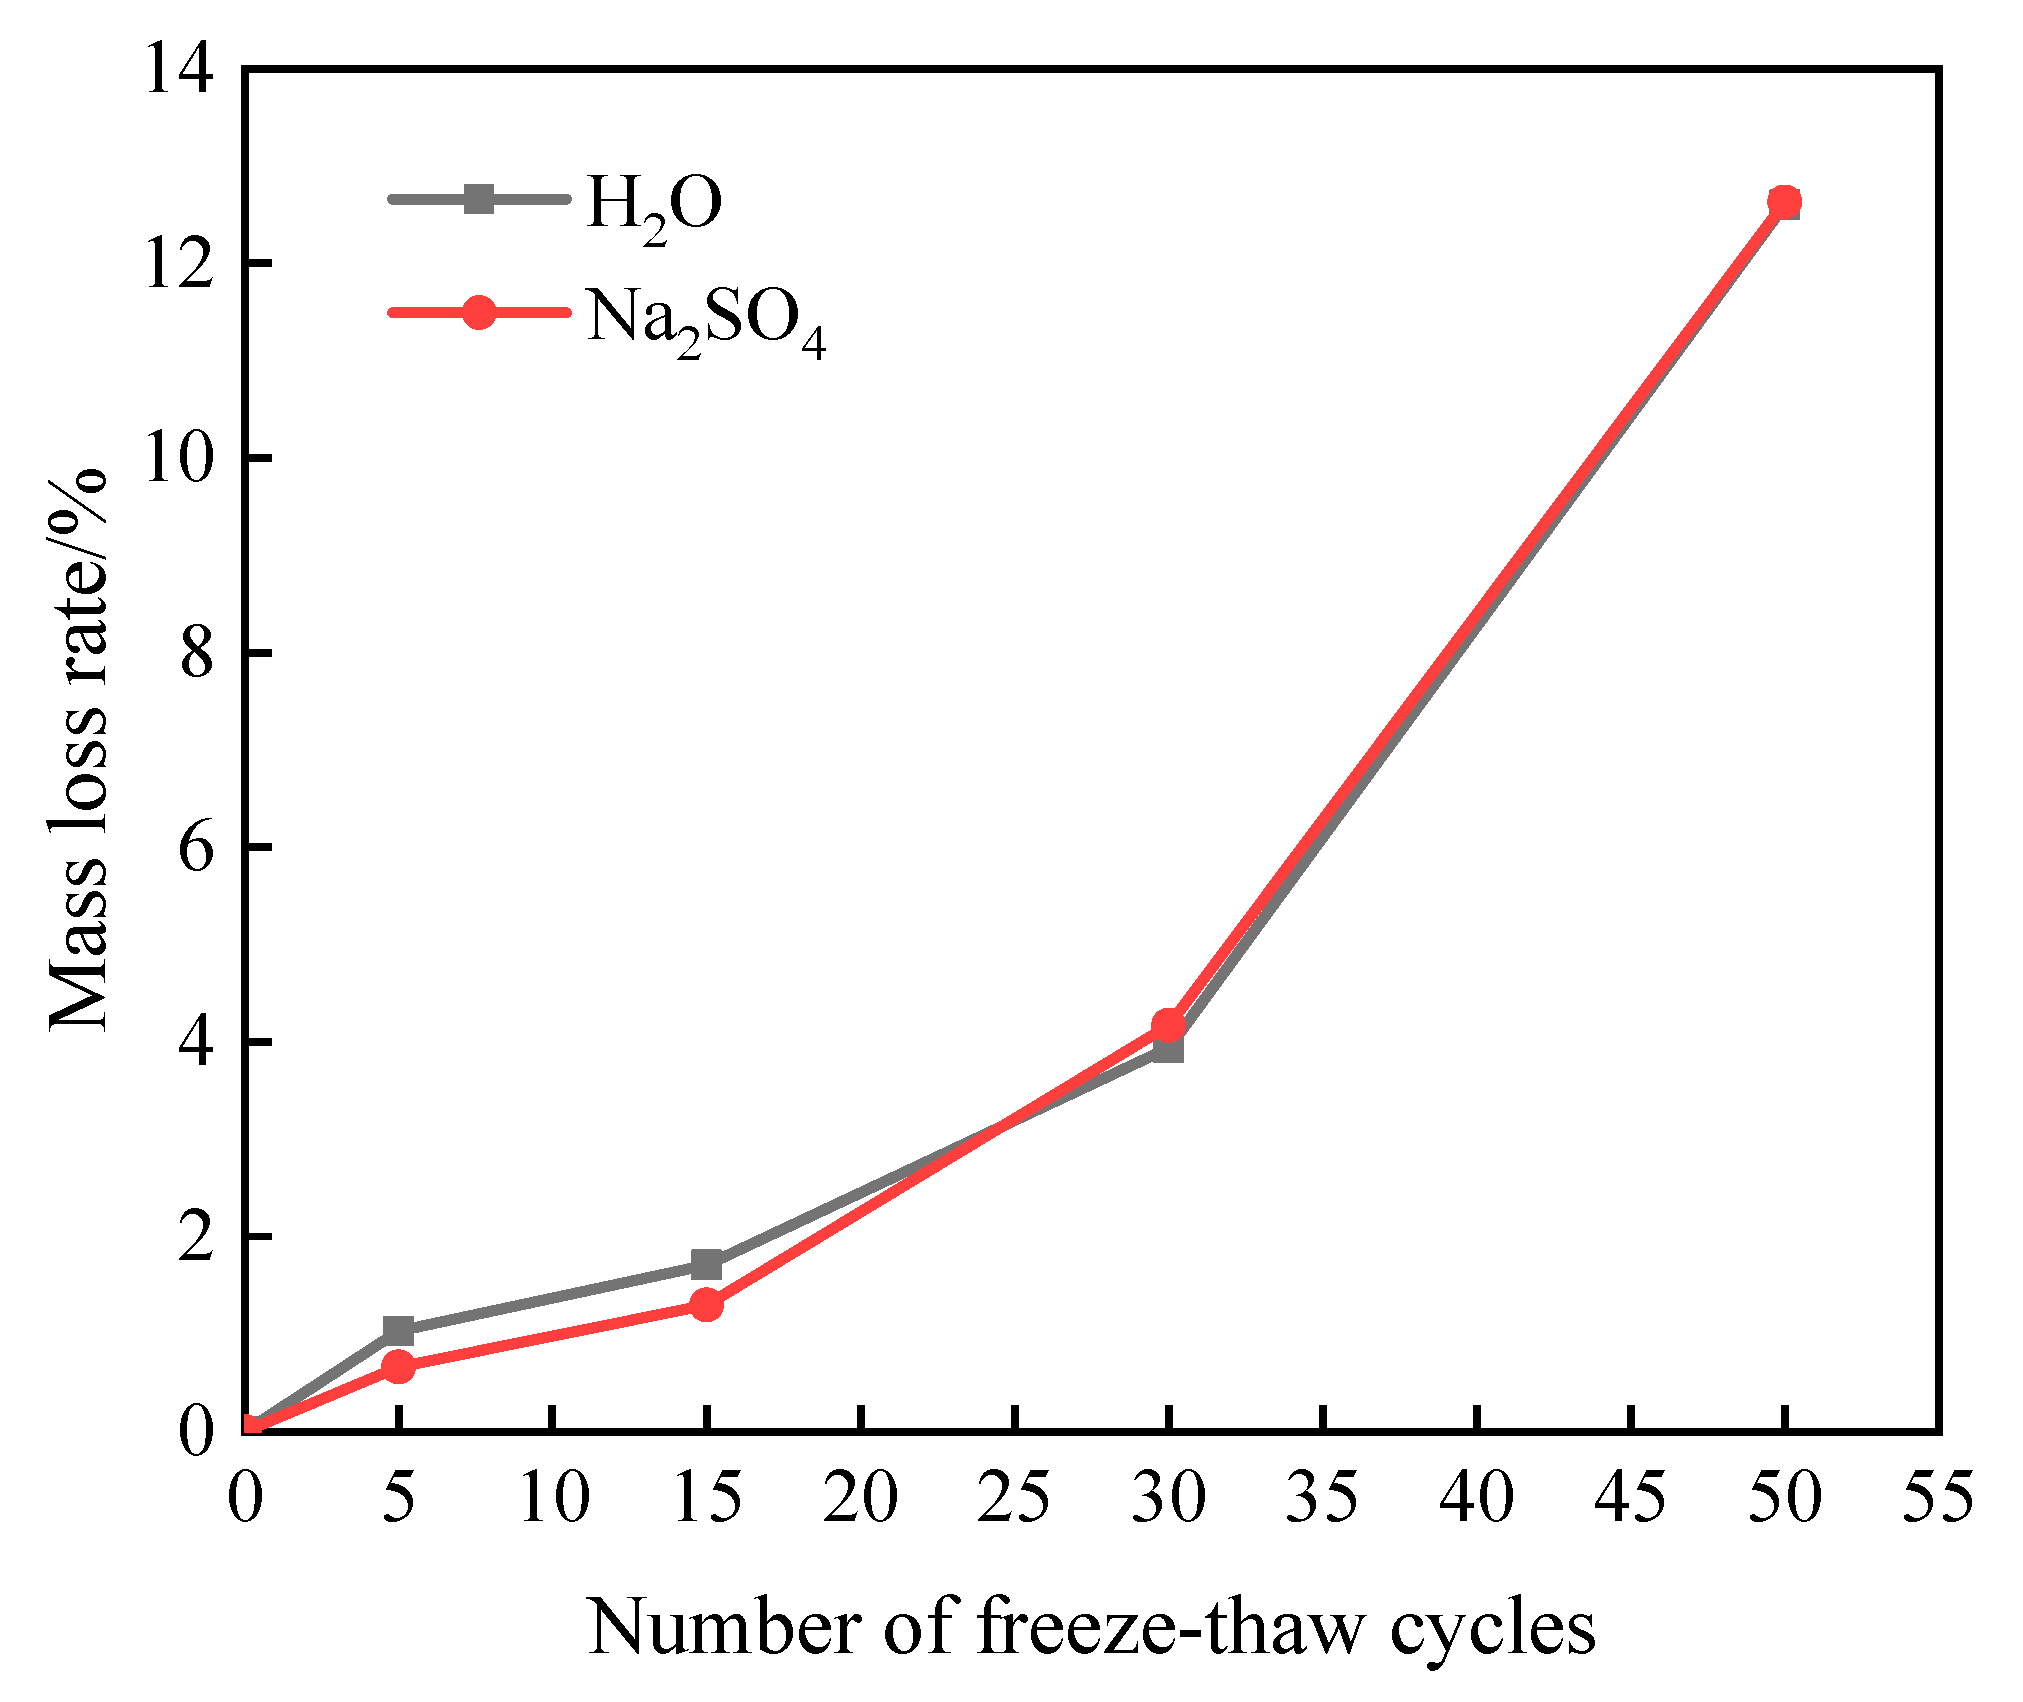
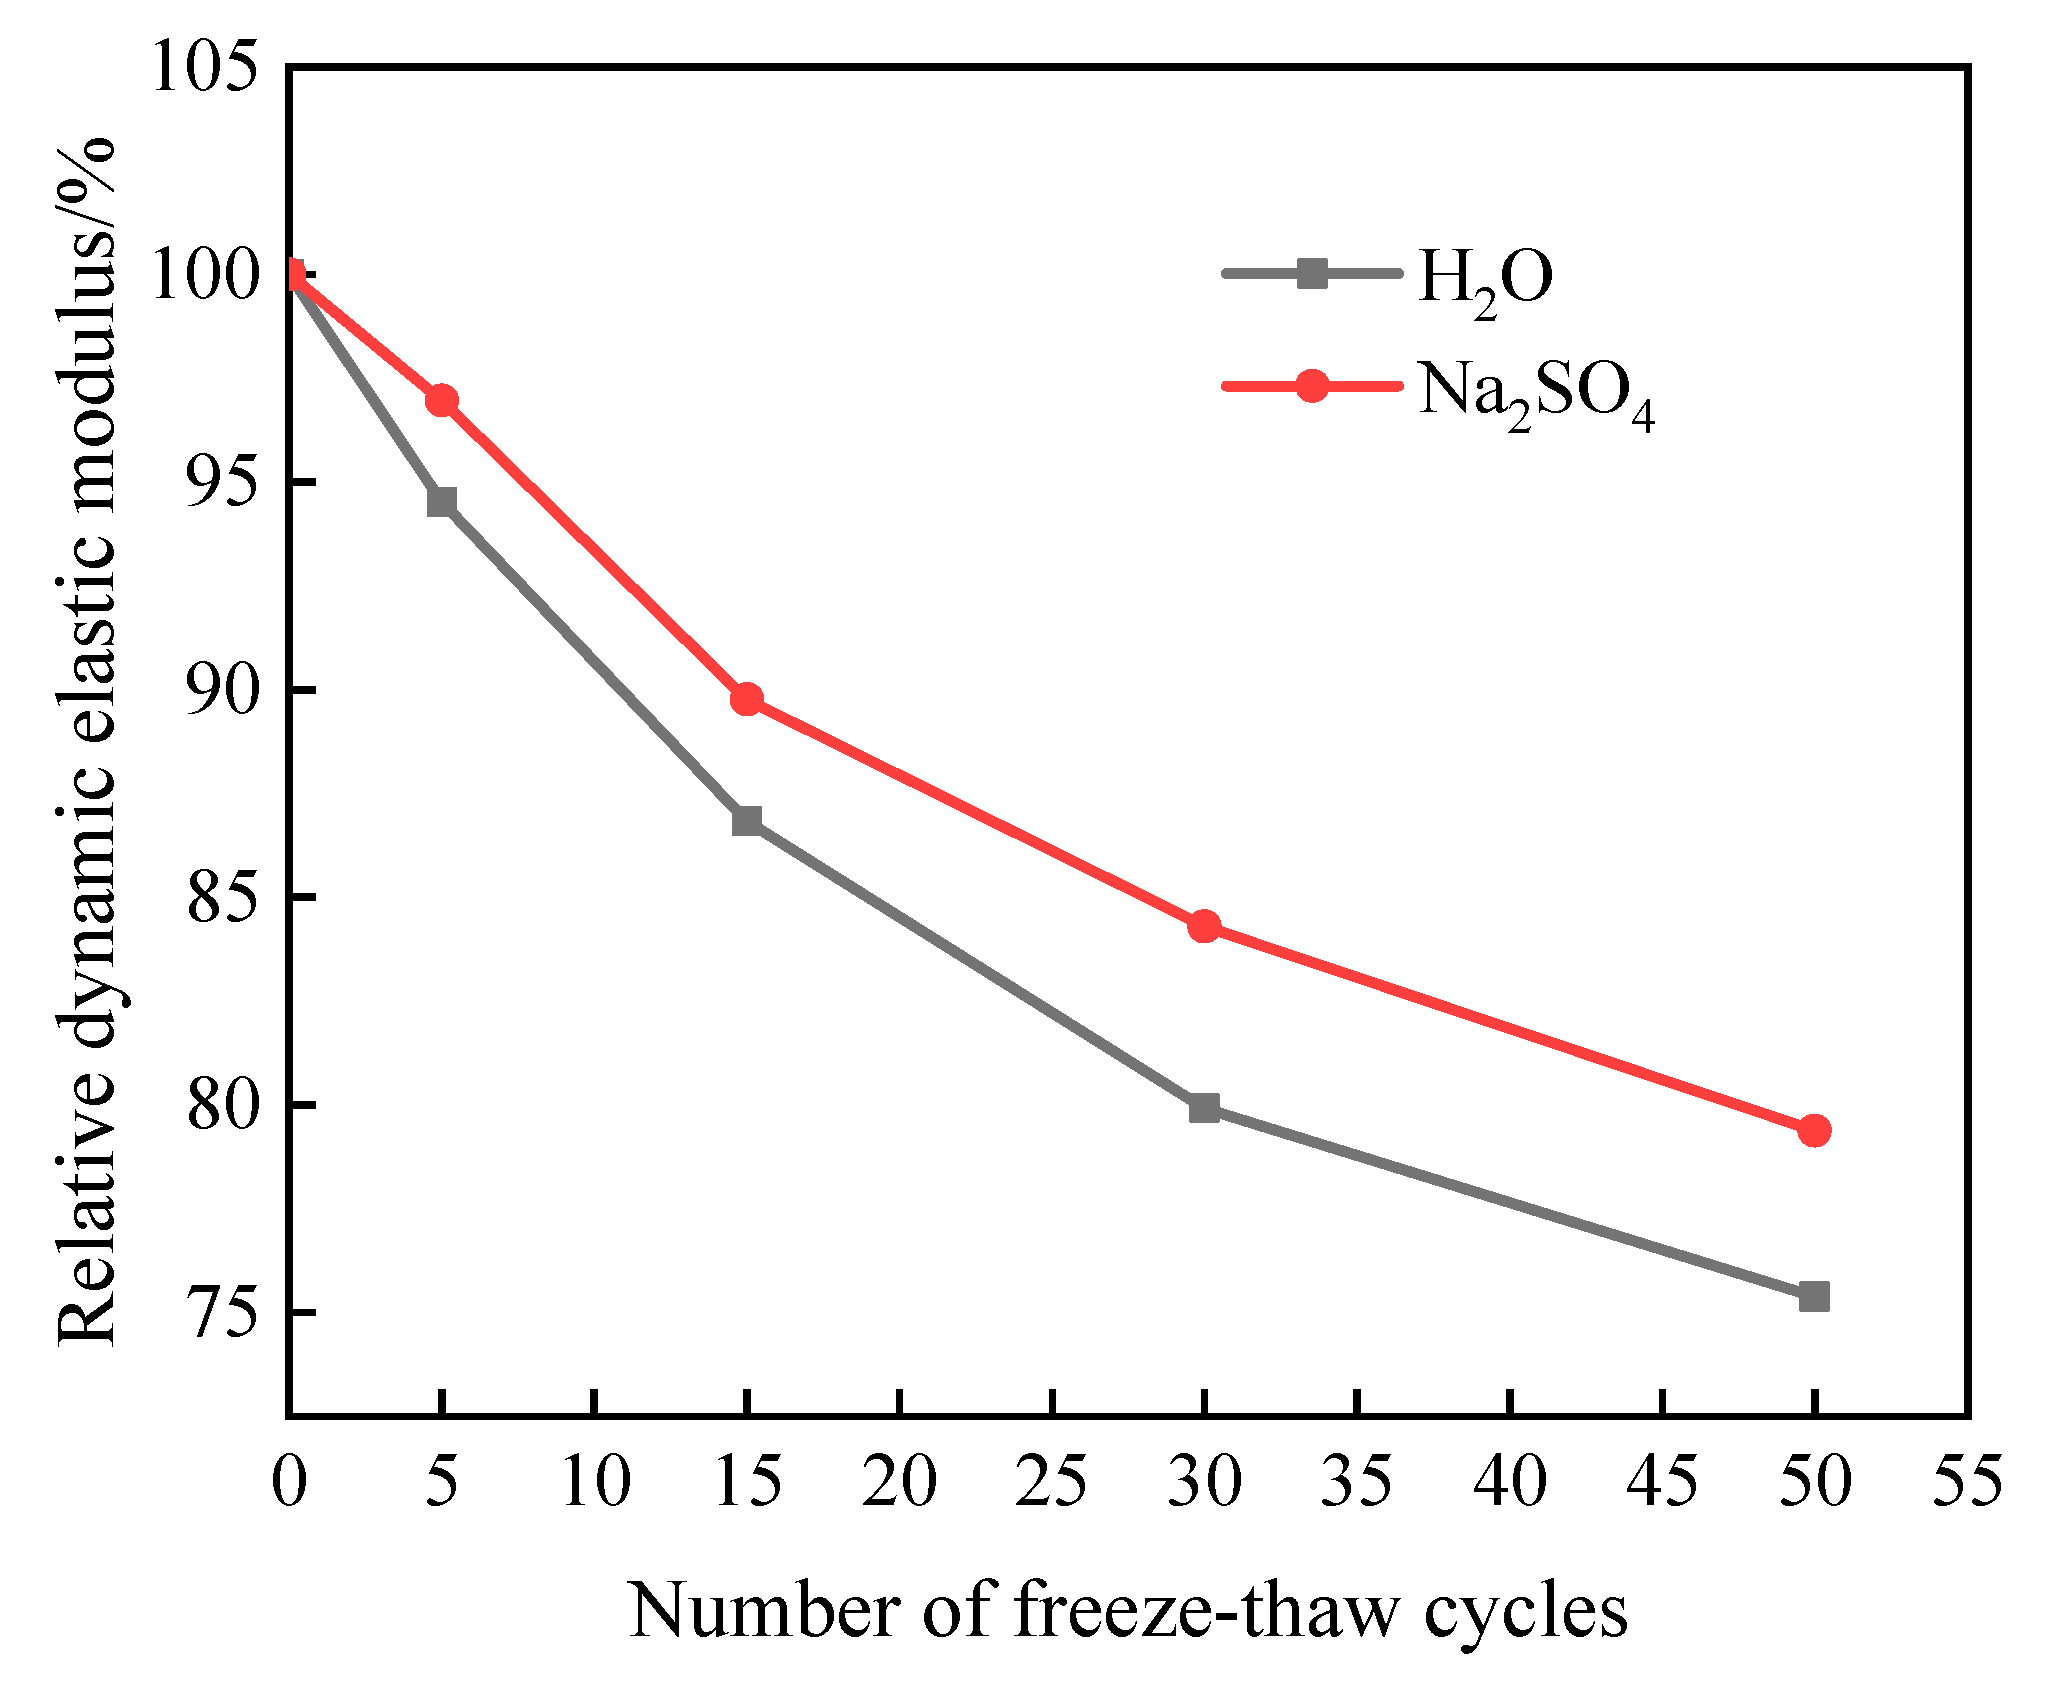
- When the specimens were subjected to 50 freeze–thaw cycles in an aqueous solution and sodium sulfate solution, the mass loss rate was more than 5%, but the relative dynamic elastic modulus was more than 75% of the initial value, indicating that the freeze–thaw cycles had a greater impact on the quality of cement-based grouting materials than on the relative dynamic elastic modulus; that is, the surface erosion damage of the material samples was more serious than the damage to the internal structure.
- (2)
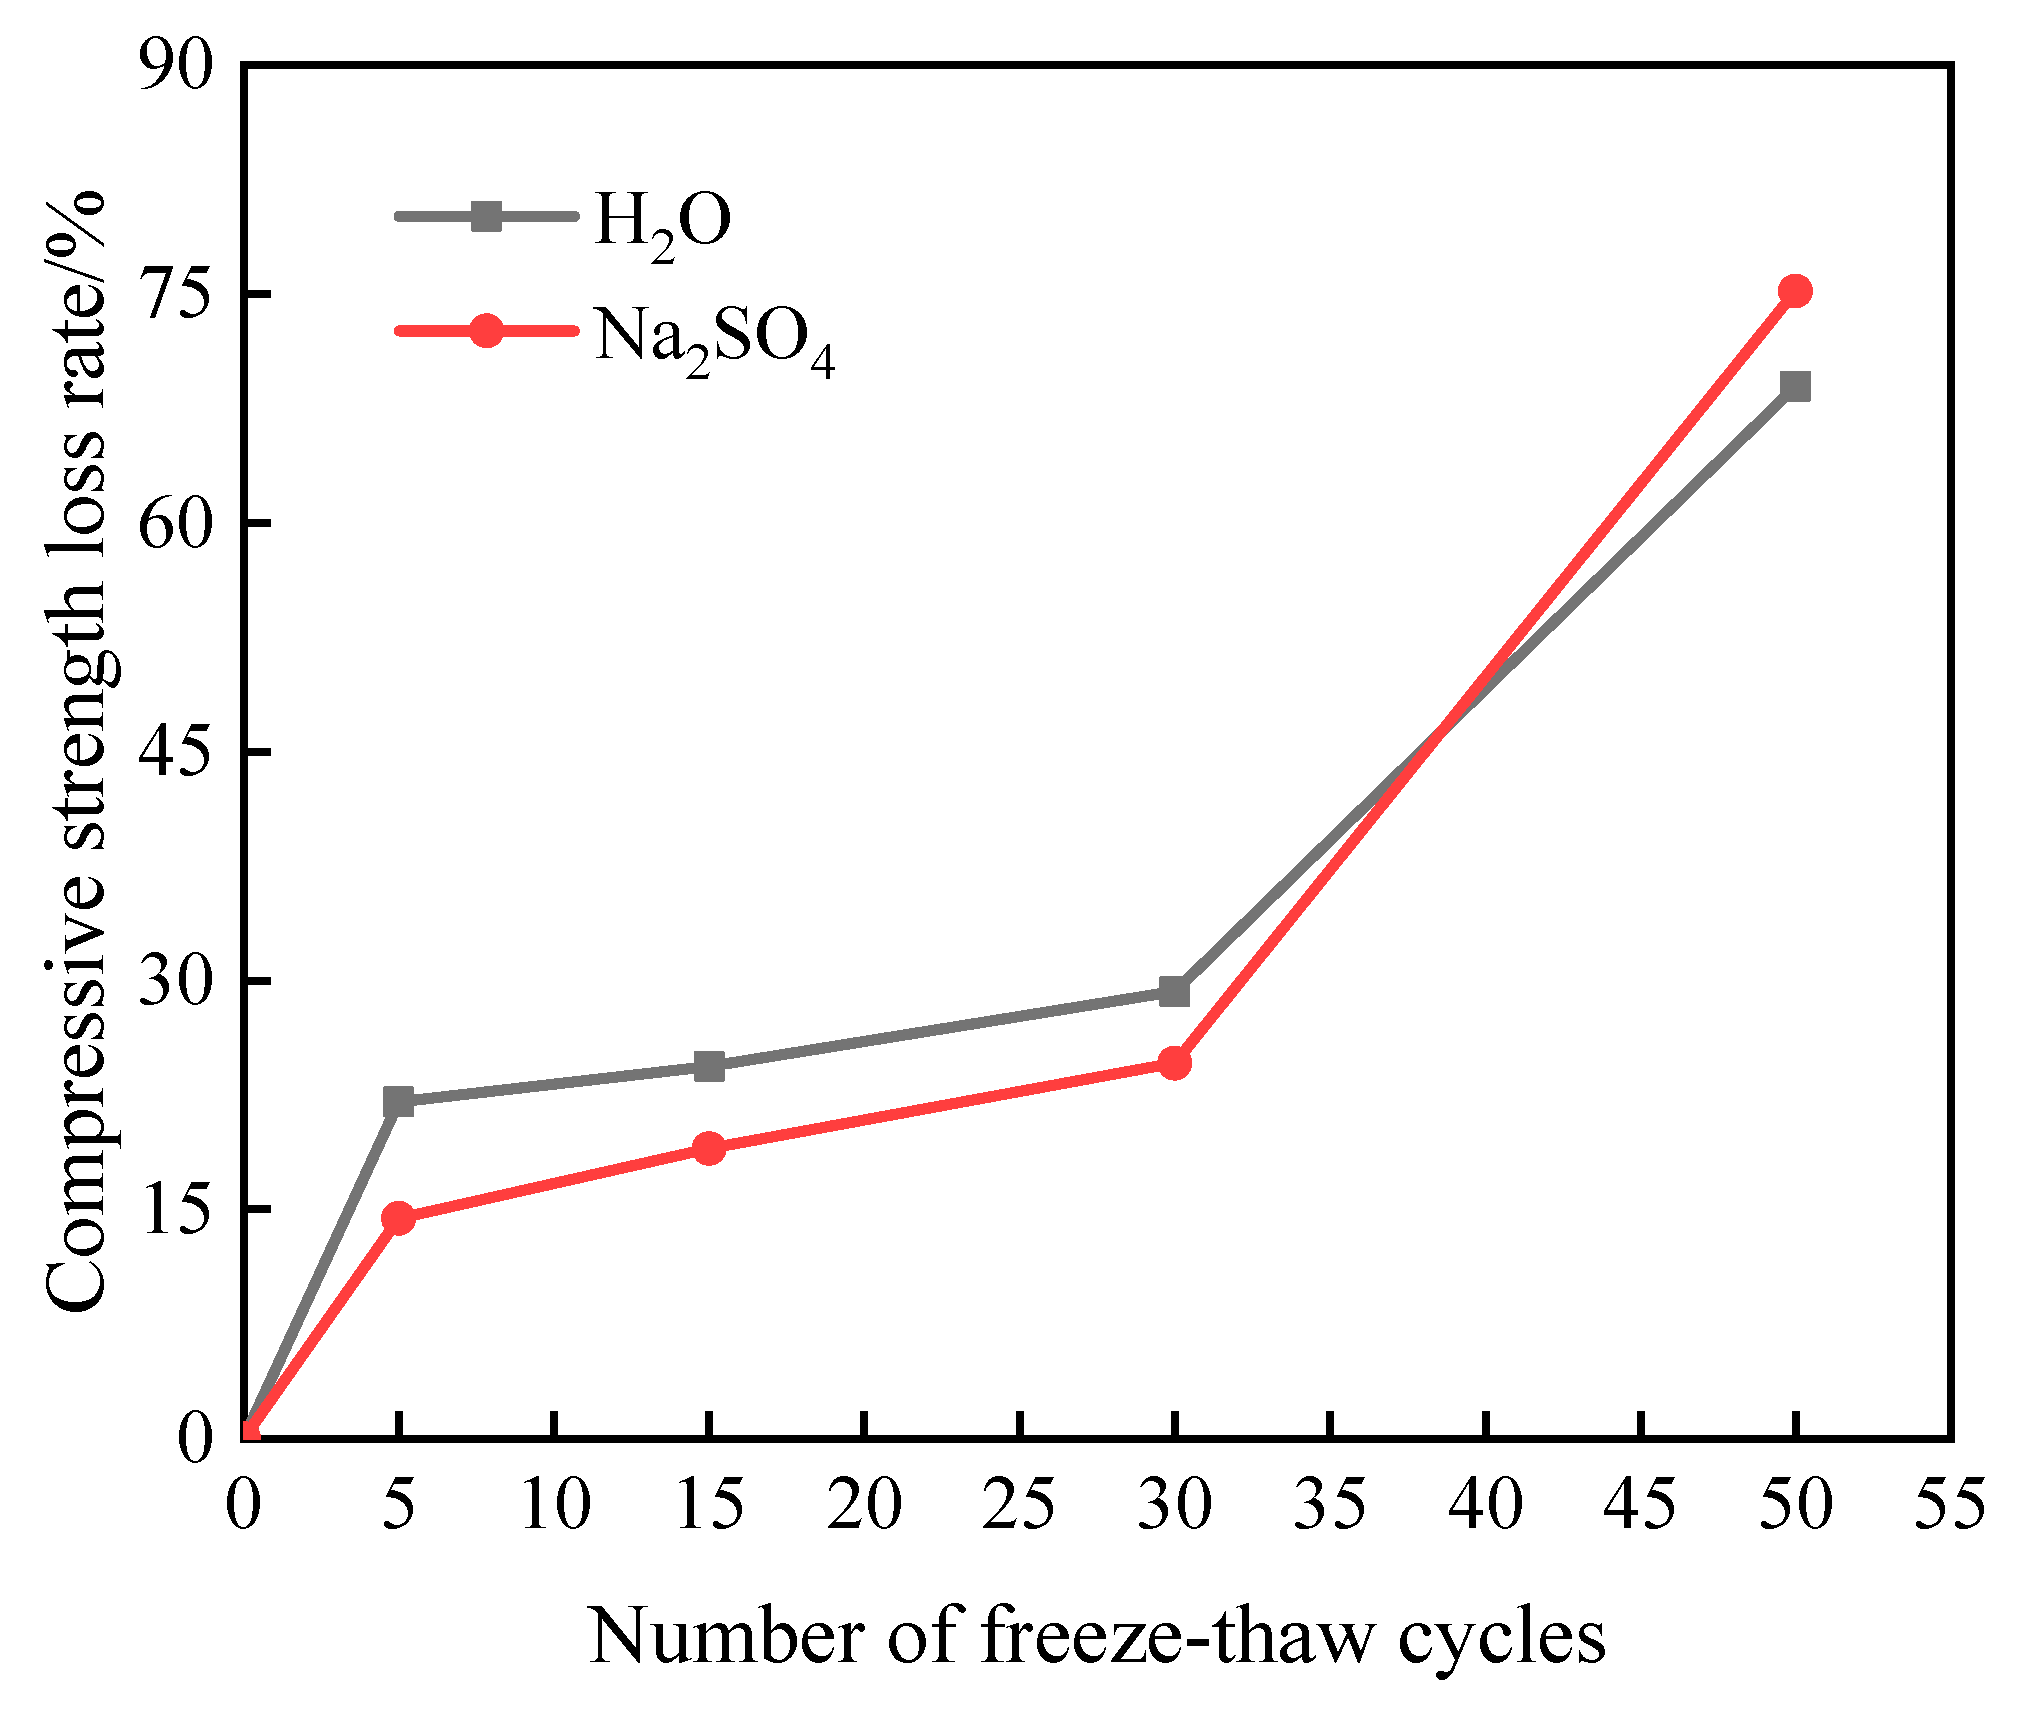
- Before the number of freeze–thaw cycles reaches 30, the compressive strength loss rate of the specimens in the two solutions is less than 30%, showing good freeze resistance. After 50 freeze–thaw cycles, the compressive strength loss rate of the samples in aqueous solution and Na2SO4 solution reached 68.93% and 75.17%, respectively, indicating that the combined action of sulfate and freeze–thaw cycles deepened the internal damage degree of the grouting materials in the late test period.
- (3)
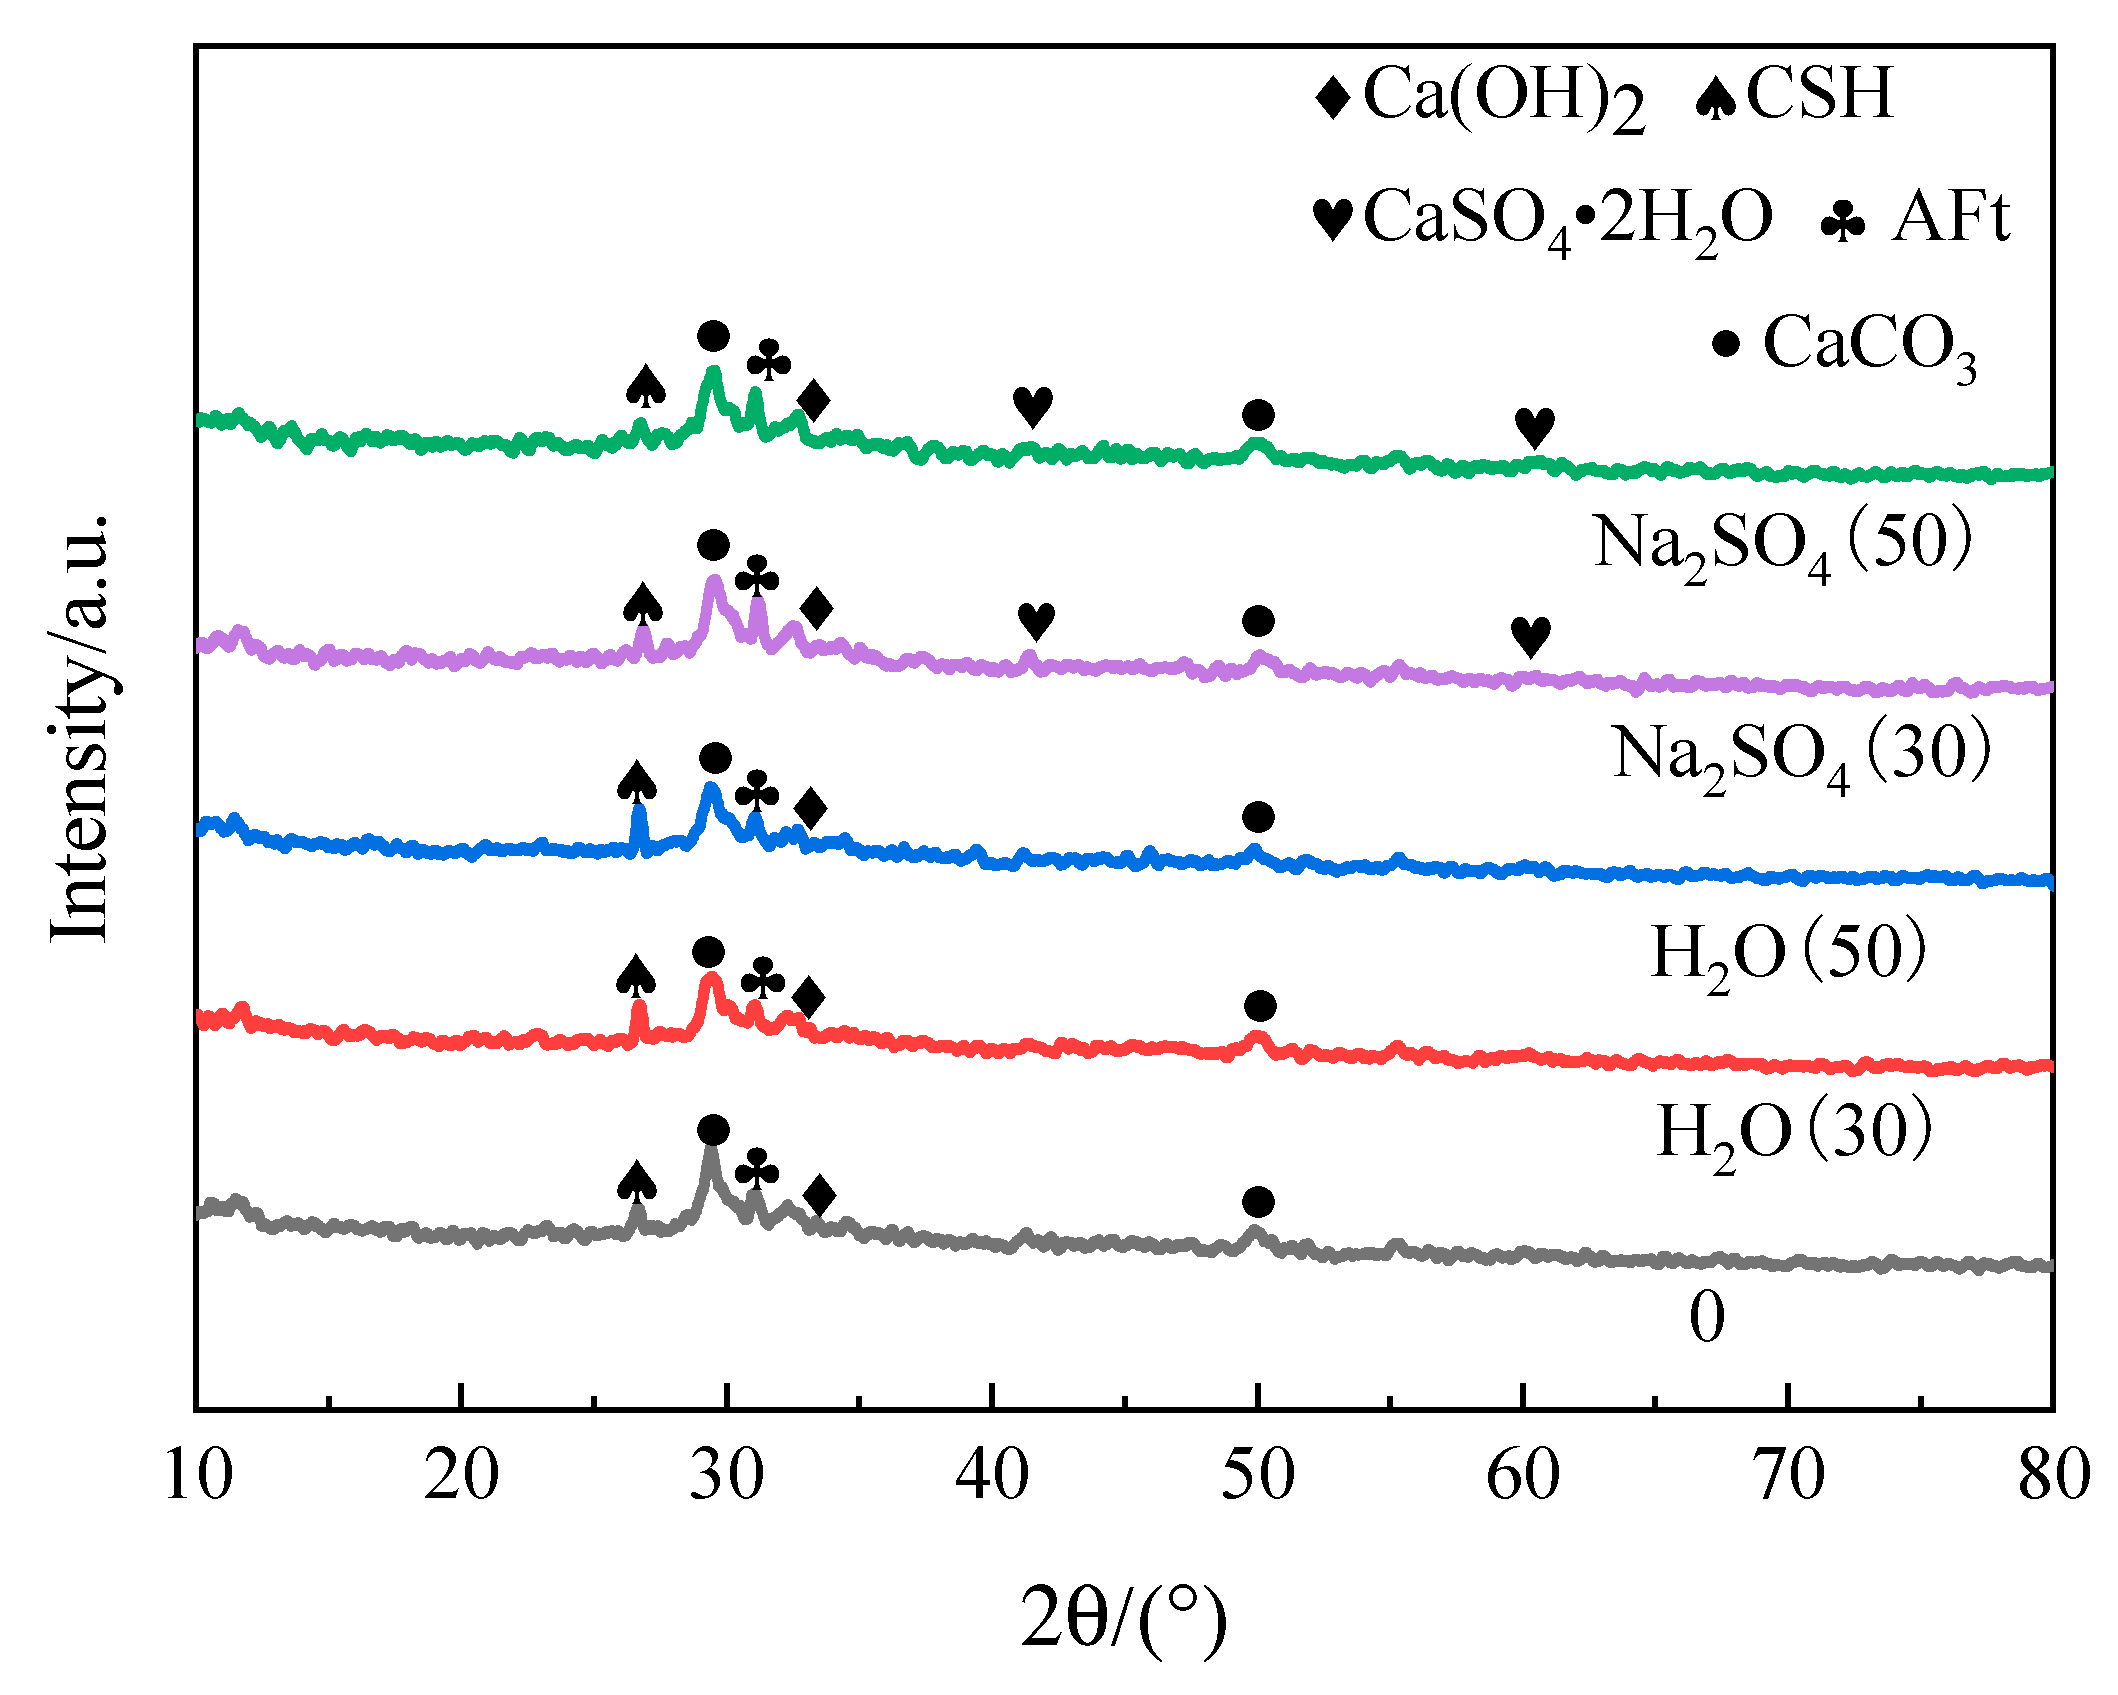
- Mineralogical and microstructural analysis shows that SO42− in the solution leads to the decomposition of C-S-H gel and the formation of CaSO4•2H2O in the sample, and the widening of crack width aggravates the internal deterioration of the structure, indicating that the deterioration rate of grouting material under freeze–thaw and sulfate erosion increases.
Author Contributions
Funding
Data Availability Statement
Acknowledgments
Conflicts of Interest
References
- Wang, Z.P.; Peng, X.; Zhao, Y.T.; Yang, H.Y.; Xu, L.L. Effect of sulfate attack on hydration of calcium aluminate cement at 5–40 °C. J. Chin. Ceram. Soc. 2019, 47, 1538–1545. [Google Scholar]
- Li, X.H.; Zhang, Q.S.; Zhang, X.; Lan, X.D.; Zuo, J.X. Grouting diffusion mechanism in heterogeneous fault-fracture zone. Adv. Eng. Sci. 2018, 50, 67–76. [Google Scholar]
- Zhu, X.F.; Song, P.T.; Du, F.; Wang, J.; Zhang, W.; Zhou, Y.X.; Leng, F.G. Research on durability and water dispersibility of high performance shield grouting material. Concrete 2021, 157–160. [Google Scholar]
- Jiao, L. Study on corrosion resistance of grouting materials for subsea tunnels and its engineering application. Mod. Tunn. Technol. 2022, 59, 256–262. [Google Scholar]
- Liu, C.Y.; Pang, Y.Z.; Zuo, L.M.; Zhao, X.H.; Liu, Y.F. Effect of gypsum on properties of soda residue-fly ash slurry under compound activation. J. Yangtze River Sci. Res. 2019, 36, 120–125. [Google Scholar]
- Zhao, A.L.; Wu, Z.L.; Liu, J.Y. Experimental study on water stability and frost resistance of a new type of foamed lightweight soil grouting material in highway goaf. Highway 2016, 61, 207–211. [Google Scholar]
- Wang, Y.; Cao, Y.S.; Cui, L.; Si, Z.Y.; Wang, H.J. Effect of external sulfate attack on the mechanical behavior of cemented paste backfill. Constr. Build. Mater. 2020, 263, 120968. [Google Scholar] [CrossRef]
- Wang, X.F.; Wang, W.W.; Liu, Q.; Shu, Z.; Luo, H.J.; Ji, S.D.; Zhu, J.F. Effects of metakaolin on sulfate and sulfuric acid resistance of grouting restoration materials. Constr. Build. Mater. 2022, 349, 128714. [Google Scholar] [CrossRef]
- Ding, Q.G.; Yang, J.; Hou, D.S.; Zhang, G.Z. Insight on the mechanism of sulfate attacking on the cement paste with granulated blast furnace slag: An experimental and molecular dynamics study. Constr. Build. Mater. 2018, 169, 601–611. [Google Scholar] [CrossRef]
- Liu, L.P.; Xie, M.J.; He, Y.; Li, Y.Y.; Wei, A.H.; Cui, X.M.; Shi, C.J. Expansion behavior and microstructure change of alkali-activated slag grouting material in sulfate environment. Constr. Build. Mater. 2020, 260, 119909. [Google Scholar] [CrossRef]
- Li, B.; Ma, Q.Y.; Zhang, F. Influence mechanism analysis of ultrafine ground granulated blast furnace slag and silica fume on properties of cement-based slurry. Bull. Chin. Ceram. Soc. 2022, 41, 4342–4352. [Google Scholar]
- GB/T 50082-2009; Test Method for Long-Term Performance and Durability of Ordinary Concrete. Standards Press of China: Beijing, China, 2009.
- Liu, H.Z. Research on the Effect of Freeze-Thaw Cycle and Sulfate Erosion on the Damage of Cement Mortar; Qingdao Technological University: Qingdao, China, 2015. [Google Scholar]
- Tian, W.; Li, X.S.; Wang, F. Experimental study on deterioration mechanism of concrete under freeze-thaw cycles coupled with sulfate solution. Bull. Chin. Ceram. Soc. 2019, 38, 702–710. [Google Scholar]
- Weng, J.H.; Wang, R.L.; Li, Z.Y.; Wang, H.; Liu, J.H.; Liu, Q.Y. Study on the influence of baixiangshan iron tailings micro powder on the properties of cementitious grout. Metal Mine 2022, 41–47. [Google Scholar]
- Jiang, L.; Niu, D.T. Study on constitutive relation of concrete under sulfate attack and freeze-thaw environment. Adv. Eng. Sci. 2016, 48, 71–78. [Google Scholar]
- Ding, P.C.; Hou, Y.B.; Han, D.; Zhang, X.; Cao, S.X.; Li, C.Q. Effect of freeze-thaw cycles on mechanical and microstructural properties of tailings reinforced with cement-based material. Minerals 2022, 12, 413. [Google Scholar] [CrossRef]
- Liu, K.W.; Sun, D.S.; Wang, A.G.; Li, Y.; Deng, M. Mechanical strength and microstructure of grouting materials with long-term lmmersion in sodium sulfate solution. J. Mater. Sci. Eng. 2018, 36, 403–407. [Google Scholar]
- Kunther, W.; Lothenbach, B.; Skibsted, J. Influence of the Ca/Si ratio of the C-S-H phase on the interaction with sulfate ions and its impact on the ettringite crystallization pressure. Cem. Concr. Res. 2015, 69, 37. [Google Scholar] [CrossRef]
- Jia, Z.J.; Chen, C.; Shi, J.J. The microstructural change of CSH at elevated temperature in Portland cement/GGBFS blended system. Cem. Concr. Res. 2019, 123, 105773. [Google Scholar] [CrossRef]
- Alarcon-Ruiz, L.; Platret, G.; Massieu, E.; Ehrlacher, A. The use of thermal analysis in assessing the effect of temperature on a cement paste. Cem. Concr. Res. 2005, 35, 609–613. [Google Scholar] [CrossRef]
- Liu, M.H.; Zhao, Y.D.; Xiao, Y.X.; Yu, Z.Y. Performance of cement pastes containing sewage sludge ash at elevated temperatures. Constr. Build. Mater. 2019, 211, 785–795. [Google Scholar] [CrossRef]
- Qu, F.L.; Li, W.G.; Tang, Z.; Wang, K.J. Property degradation of seawater sea sand cementitious mortar with GGBFS and glass fiber subjected to elevated temperatures. J. Mater. Res. Technol. 2021, 13, 366–384. [Google Scholar] [CrossRef]
- Rozière, E.; Loukili, A.; Hachem, E.R.; Grondin, F. Durability of concrete exposed to leaching and external sulphate attack. Cem. Concr. Res. 2009, 39, 1188. [Google Scholar] [CrossRef]


| Raw Material | Mass Fraction (%) | |||||||||
|---|---|---|---|---|---|---|---|---|---|---|
| CaO | SiO2 | Al2O3 | Fe2O3 | MgO | Na2O | K2O | SO3 | TiO2 | Loss | |
| OPC | 66.3 | 19.60 | 6.50 | 3.50 | 0.70 | 0.60 | 0.30 | 2.50 | — | — |
| UFS | 39.25 | 33.40 | 15.15 | 0.31 | 7.67 | 0.38 | 0.39 | 2.38 | 0.62 | 0.11 |
| SF | 0.10 | 96.46 | 0.31 | 0.07 | 0.11 | 0.97 | — | — | — | 2.60 |
| Performance Index | Bleeding Rate (%) | Fluidity (mm) | Viscosity (s) | Compressive Strength (MPa) | Flexural Strength (MPa) | ||||
|---|---|---|---|---|---|---|---|---|---|
| 3 Days | 7 Days | 28 Days | 3 Days | 7 Days | 28 Days | ||||
| Optimized slurry | 1.6 | 307 | 33.46 | 9.7 | 15.9 | 27.3 | 4.5 | 5.2 | 7.5 |
| Number | 0 | 10 | 15 | 30 | 50 | |
|---|---|---|---|---|---|---|
| Solution | ||||||
| Na2SO4 |  |  |  |  |  | |
| H2O |  |  |  |  | ||
Disclaimer/Publisher’s Note: The statements, opinions and data contained in all publications are solely those of the individual author(s) and contributor(s) and not of MDPI and/or the editor(s). MDPI and/or the editor(s) disclaim responsibility for any injury to people or property resulting from any ideas, methods, instructions or products referred to in the content. |
© 2023 by the authors. Licensee MDPI, Basel, Switzerland. This article is an open access article distributed under the terms and conditions of the Creative Commons Attribution (CC BY) license (https://creativecommons.org/licenses/by/4.0/).
Share and Cite
Ma, Q.; Li, B. Performance of a New Grouting Material under the Coupling Effects of Freeze–Thaw and Sulfate Erosion. Materials 2023, 16, 5448. https://doi.org/10.3390/ma16155448
Ma Q, Li B. Performance of a New Grouting Material under the Coupling Effects of Freeze–Thaw and Sulfate Erosion. Materials. 2023; 16(15):5448. https://doi.org/10.3390/ma16155448
Chicago/Turabian StyleMa, Qinyong, and Biao Li. 2023. "Performance of a New Grouting Material under the Coupling Effects of Freeze–Thaw and Sulfate Erosion" Materials 16, no. 15: 5448. https://doi.org/10.3390/ma16155448
APA StyleMa, Q., & Li, B. (2023). Performance of a New Grouting Material under the Coupling Effects of Freeze–Thaw and Sulfate Erosion. Materials, 16(15), 5448. https://doi.org/10.3390/ma16155448