Article

Study of TiO2 on the Voltage Holdoff Capacity of Cr/Mn-Doped Al2O3 Ceramic in Vacuum

1
Beijing Vacuum Electronics Research Institute, Beijing 100015, China
2
State Key Laboratory of Electrical Insulation and Power Equipment, Xi’an Jiaotong University, Xi’an 710049, China
*
Author to whom correspondence should be addressed.
Materials 2023, 16(14), 5048; https://doi.org/10.3390/ma16145048
Submission received: 26 June 2023 / Revised: 15 July 2023 / Accepted: 16 July 2023 / Published: 17 July 2023

Abstract

:
With the development of vacuum electronic devices toward high power, high frequency, and miniaturization, the voltage holdoff capacity of the insulation materials in devices has also been raised to a higher demand. Cr/Mn/Ti-doped Al2O3 ceramics were prepared, and the bulk density, micromorphology, phase composition, resistivity, secondary electron emission coefficient, and surface flashover threshold in the vacuum of the Al2O3 were characterized. The results show that the addition of TiO2 to the Al2O3 ceramic can promote the sintering of the ceramic. The Cr/Mn/Ti-doped Al2O3 ceramic with a homogeneous microstructure can be obtained by an appropriate amount of TiO2 addition. In the process of the heat treatment, the TiO2 in the ceramics was reduced to a certain degree, which had an impact on the microstructure of the Al2O3 ceramic. Adding a small amount of TiO2 can improve the voltage holdoff performance in the vacuum. The value of the surface flashover threshold in the vacuum of the Cr/Mn/Ti-doped Al2O3 ceramic containing 1 wt.% TiO2 reached a value of 33 kV, which is 32% higher than that of the basic Al2O3 ceramic. The preparation of Al2O3 ceramics with a high voltage holdoff capacity in a vacuum provides fundamental technical support for the development of vacuum electronic devices.

1. Introduction

Al2O3 ceramics play a significant role in vacuum electronic devices, such as high-voltage insulation, vacuum sealing, power transmission, and support fixation [1,2]. Studies have shown that as a solid insulator, the voltage holdoff capacity of Al2O3 ceramics in a vacuum is often lower than vacuum gaps of the same size. The surface of the insulator is the weakest point in vacuum-insulation systems because its bulk voltage holdoff capacity is generally greater than the vacuum gap of the same size [3,4]. Surface flashover occurs in many vacuum electronic devices when the applied voltage exceeds a certain value, resulting in the failure of or damage to the device [5,6,7,8,9,10]. With the development of vacuum electronic devices toward high power, high frequency, and miniaturization, such as high-power klystron and high-power pseudo spark switch, the operating voltage of the device increases exponentially, making surface flashover of Al2O3 ceramics become an important factor affecting their reliability and restricting the development of vacuum electronic devices [11,12,13,14,15]. Therefore, improving the surface voltage holdoff capacity of Al2O3 ceramics has become one of the urgent problems to be solved in the field of vacuum electronics.
Surface flashover is related to many factors, such as the materials’ characteristics, shape structure, and surface roughness of the ceramic. According to secondary electron emission avalanche theory (SEEA) [16,17,18], the initiation of a surface flashover is usually started by the emission of electrons (generally by field emission or thermal field emission) from the cathode triple junction (CTJ—the interface where the insulator, cathode, and vacuum are in close proximity). Some of the electrons impact the surface of the insulator, producing additional electrons by secondary emission. Some of these secondary electrons will again strike the surface, producing tertiary electrons. Continuation of this process results in the development of an SEEA. The final stages of surface flashover are predominantly thought to occur in desorbed surface gas or in vaporized insulator material. Hence, the secondary electron yield (SEY) of the ceramic is an important factor affecting its surface flashover voltage. Therefore, the SEY of the ceramic should be reduced as much as possible to improve its surface flashover voltage. In addition, the high surface resistivity of the ceramic is averse to charge leakage, which will increase the strength of the local electric field, leading to the occurrence of surface flashover.
Researchers have improved the surface voltage holdoff capacity of Al2O3 ceramics through surface modification and the bulk doping method. Tangal S. Sudarshan et al. [19] reduced the SEY of Al2O3 ceramics and improved their surface flashover voltage in a vacuum by coating Cr2O3 on the surface. Yamamoto O. et al. [20] studied the influence of surface roughness on the surface voltage holdoff capacity of dielectric materials and improved the surface flashover voltage of Al2O3 ceramics by roughening the surface. Zheng Jiagui et al. [21] reduced the SEY of Al2O3 ceramics to 2~3 by coating Cr, Mn, and Ti on the surface. Zhang Hao et al. [22] improved the surface flashover voltage of a glass ceramic by adding Cr2O3 to it. However, the mechanism of surface flashover of insulating materials in a vacuum is complex, and the research content involves multidisciplines, which are closely related to the composition and microstructure of materials. Therefore, further systematic and in-depth research on ceramic materials with a high-voltage holdoff capacity is needed to provide key basic technology support for the development of vacuum electronic devices toward high power, high frequency, and miniaturization.
Among the methods to improve the voltage holdoff capacity of insulating materials in a vacuum, surface modification can improve the surface properties without changing the intrinsic structure of the ceramic, thus increasing its surface flashover voltage. However, this method has large structural limitations, and the evaporation of coatings within the device is difficult to control. Bulk doping is easier to achieve for some special structures, and the material performance is relatively stable. The SEY of Cr2O3 [16] is very low, and MnO2 has low resistivity. They are usually used to improve the voltage holdoff capacity of Al2O3 ceramics as additives. The properties of Cr2O3 and MnO2-doped Al2O3 ceramics were studied previously by our research group. The results show that the SEY of Al2O3 ceramics can be reduced effectively by adding Cr2O3 to the ceramics, while the surface resistivity of Al2O3 ceramics can be reduced by one order of magnitude with the addition of MnO2. However, with the increase in the addition of MnO2, the grain size of the Al2O3 ceramic increases, the bulk density of the Al2O3 ceramic decreases, and the uniformity of the microstructure becomes worse. In this paper, in order to further reduce the resistivity of the Al2O3 ceramic, on the basis of the previous research on Cr2O3 and MnO2-doped Al2O3 ceramics, we chose TiO2, with semiconductor properties, as an additive, and studied the effect of the TiO2 addition on the performance of the Al2O3 ceramics. TiO2 has low resistivity, but few studies have been reported on the effects of TiO2 on the resistivity and voltage holdoff capacity of Al2O3 ceramics, since the valence of Ti changes in different compounds and its mechanism of action in materials is complicated [23,24]. On the basis of Cr/Mn-doped Al2O3 ceramics, we fixed Cr2O3:MnO2 = 1:1 (mass ratio) in this paper and studied the effects of the additional amount of TiO2 on the microstructure, phase composition, secondary electron emission characteristics, resistivity, and surface flash properties of the Al2O3 ceramic in a vacuum.

2. Experimental Procedures

2.1. Samples Preparation

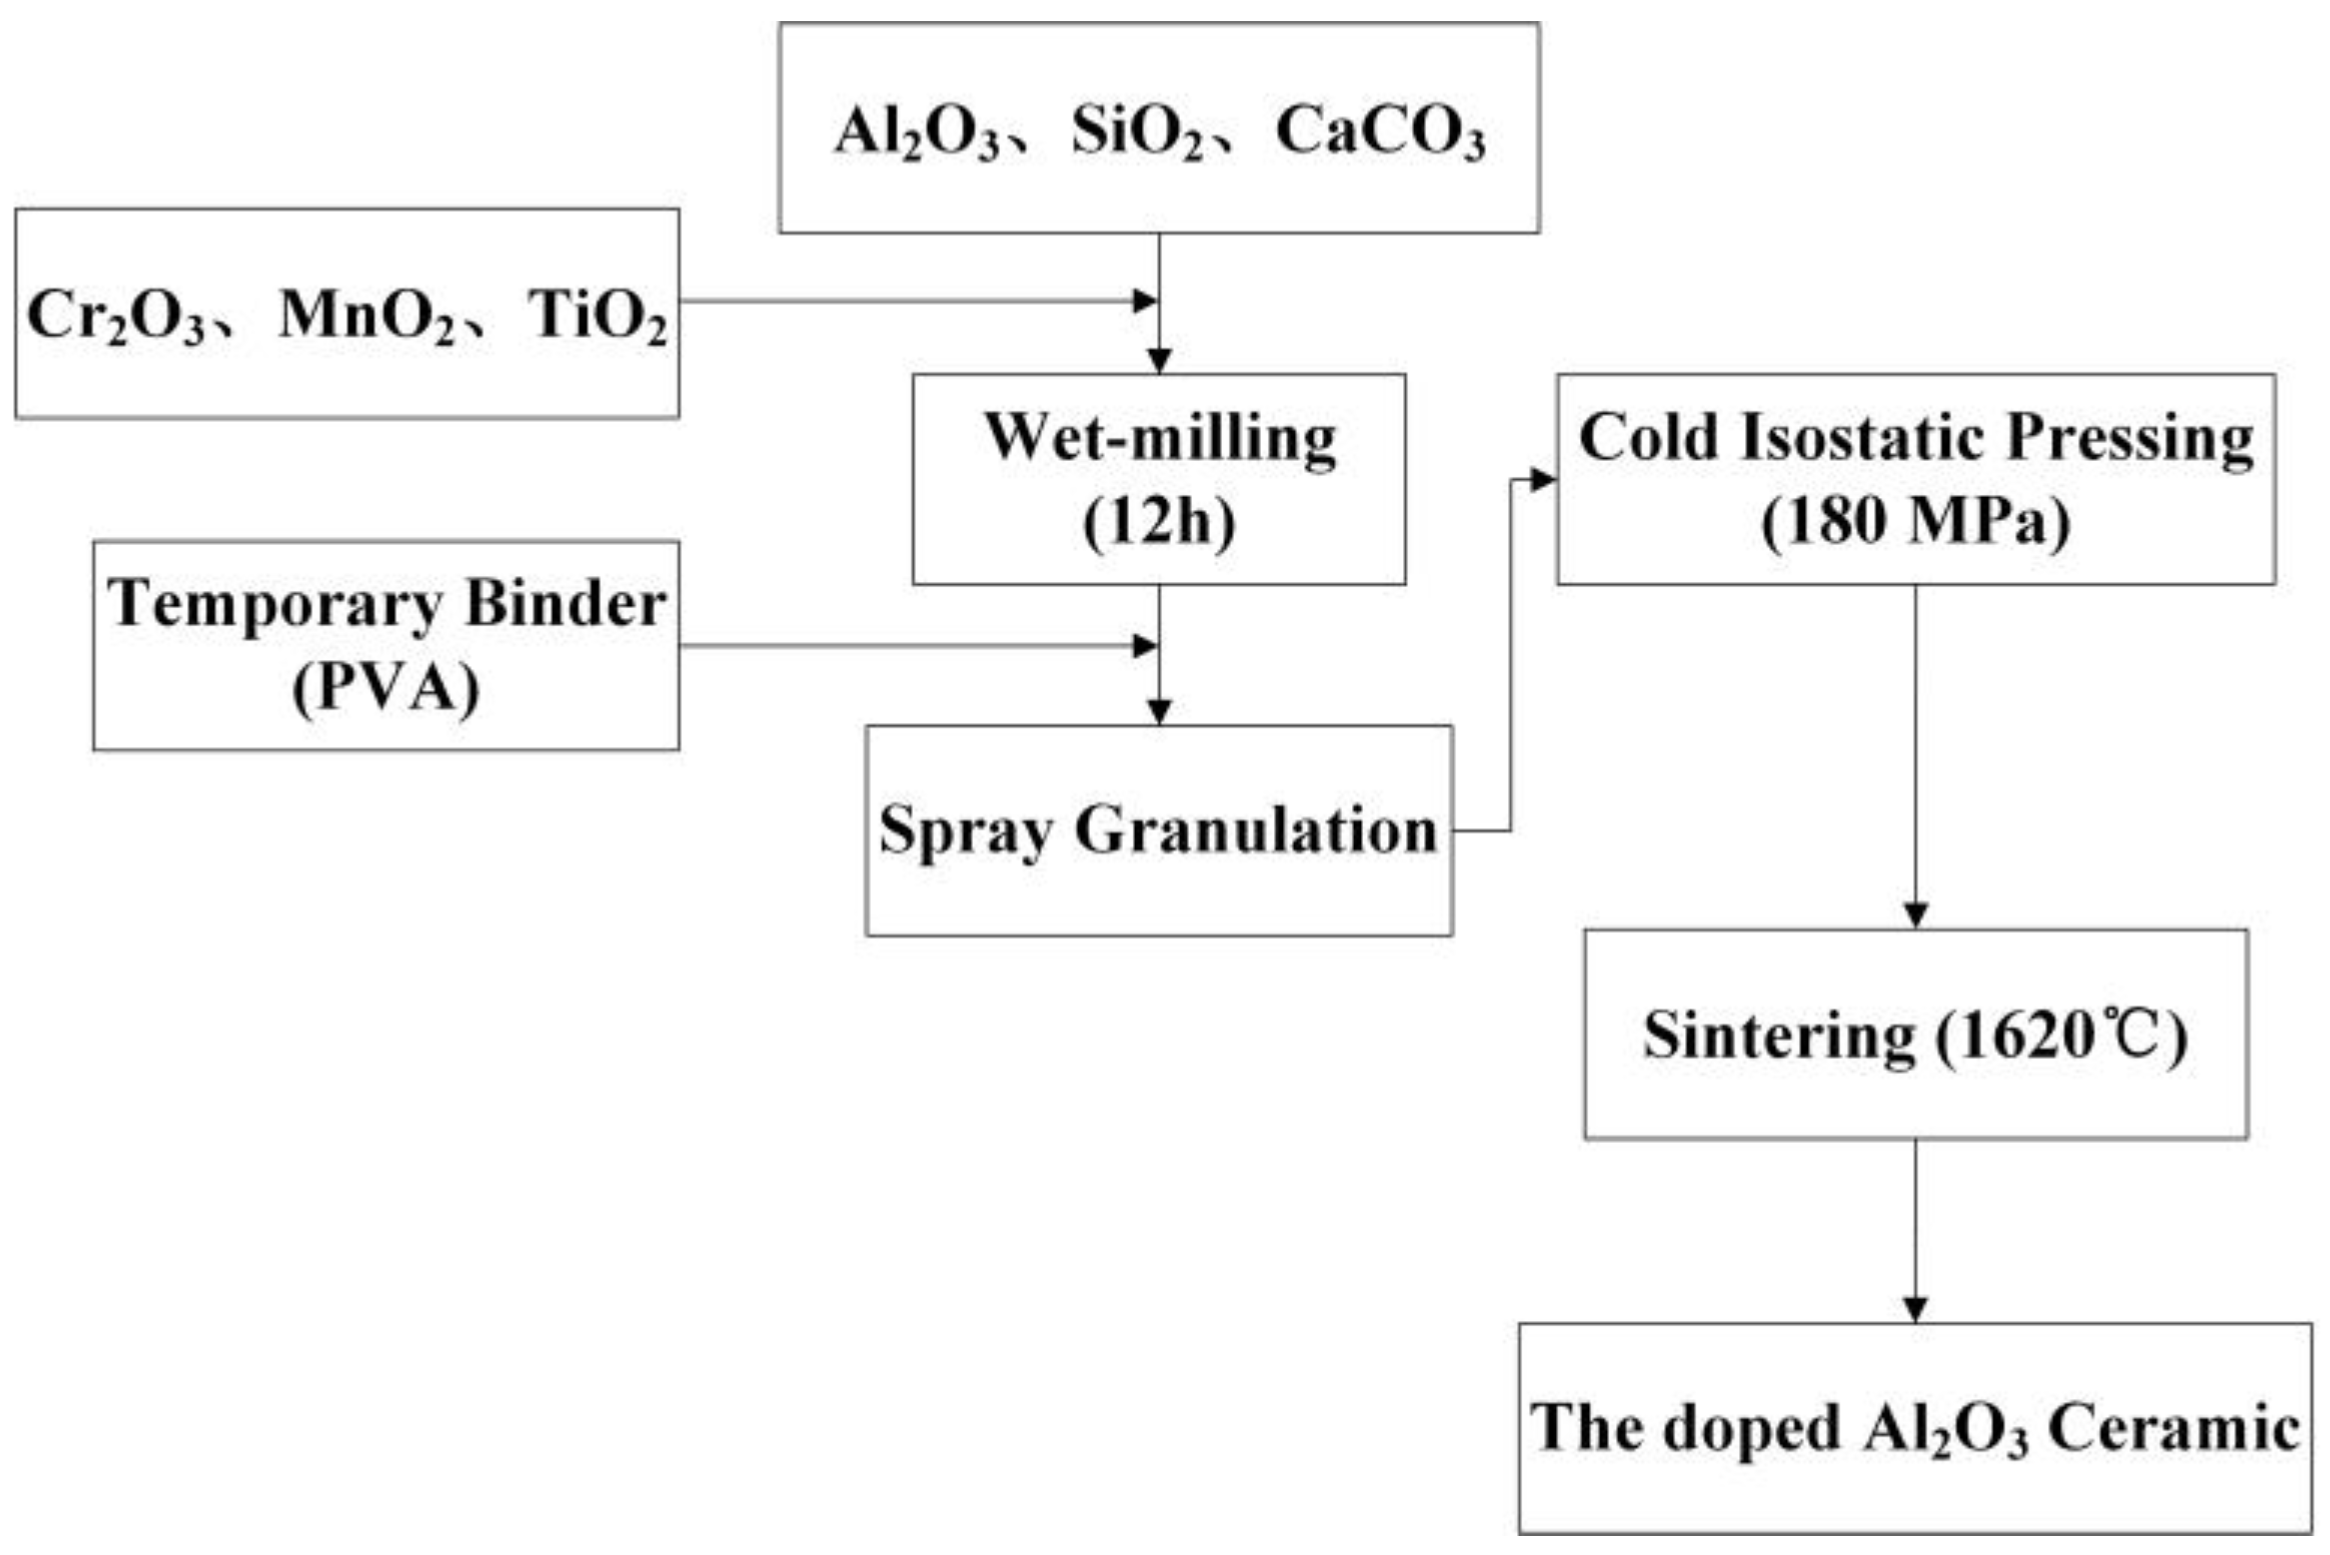
The 95% Al2O3 ceramics were chosen as fundamental Al2O3 ceramic materials. SiO2 and CaO were introduced in the form of silica and calcium carbonate as additives to promote the liquid phase sintering of Al2O3 ceramics. Cr2O3, MnO2, and TiO2 were added to the ceramic as additives. The Al2O3 ceramics were prepared from high-purity raw materials (≥99.9%). The ceramic powders were prepared by spray granulation method, then were formed by cold isostatic pressing. After that, the green ceramic bodies were sintered under air atmosphere using a high-temperature muffle furnace. Figure 1 shows the preparation process of the Cr/Mn/Ti-doped Al2O3 ceramics. The parameters of the sintering process are shown in Table 1.
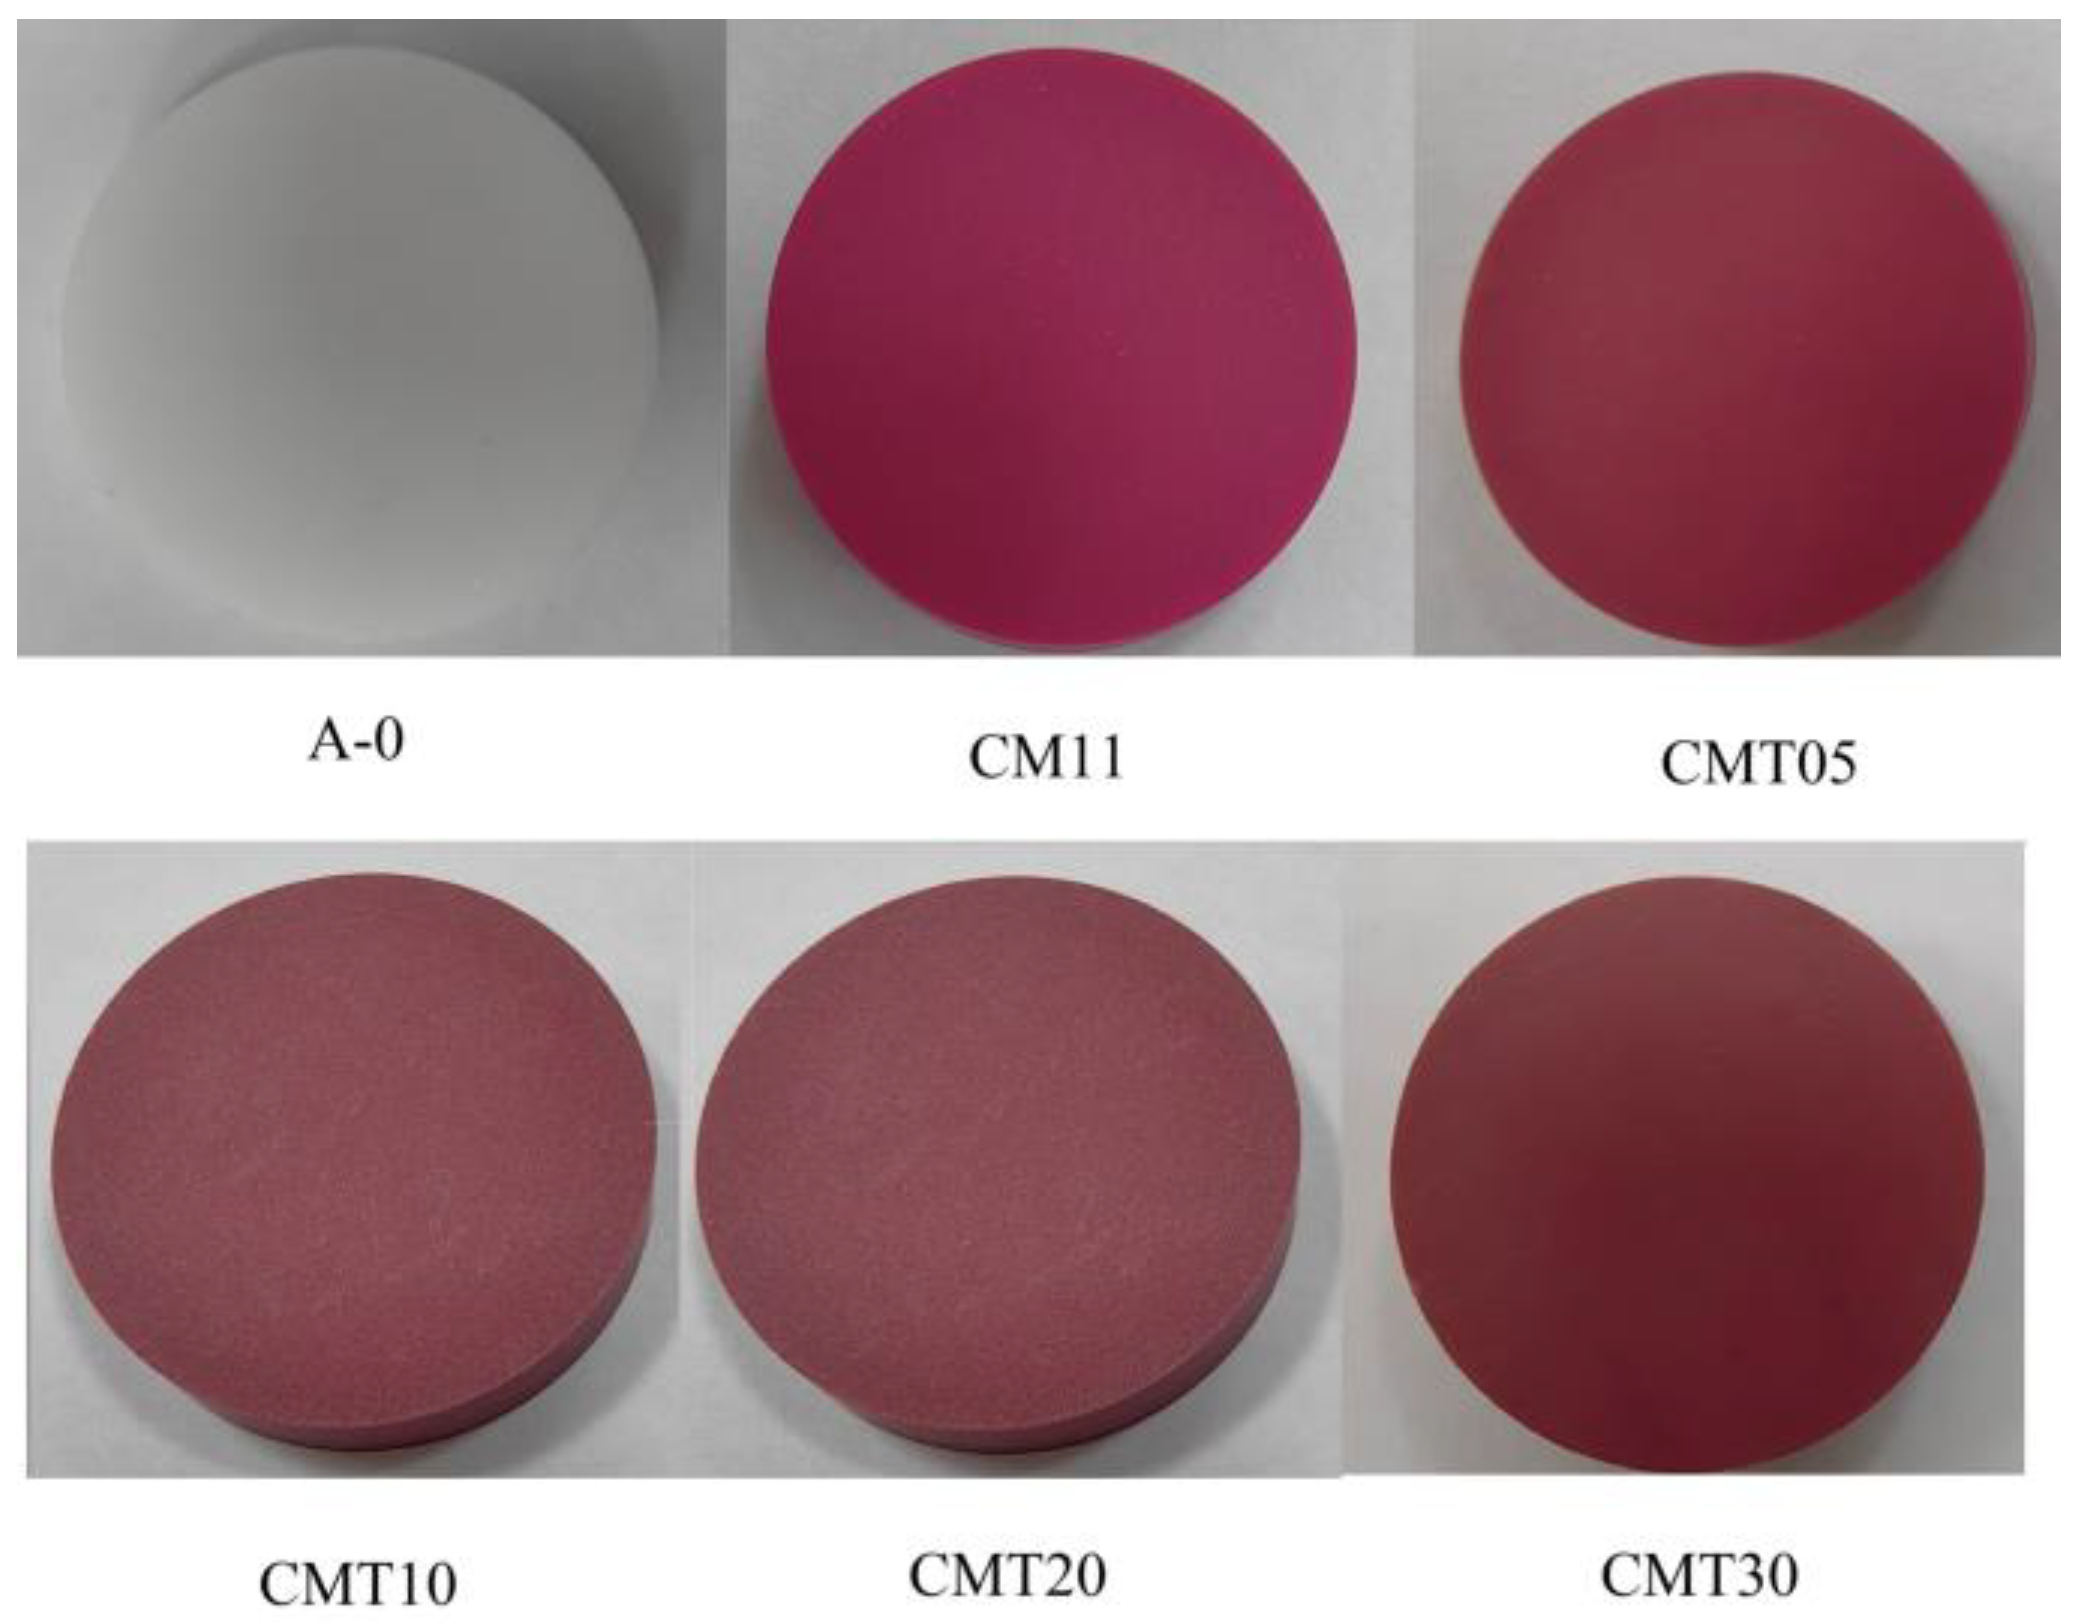
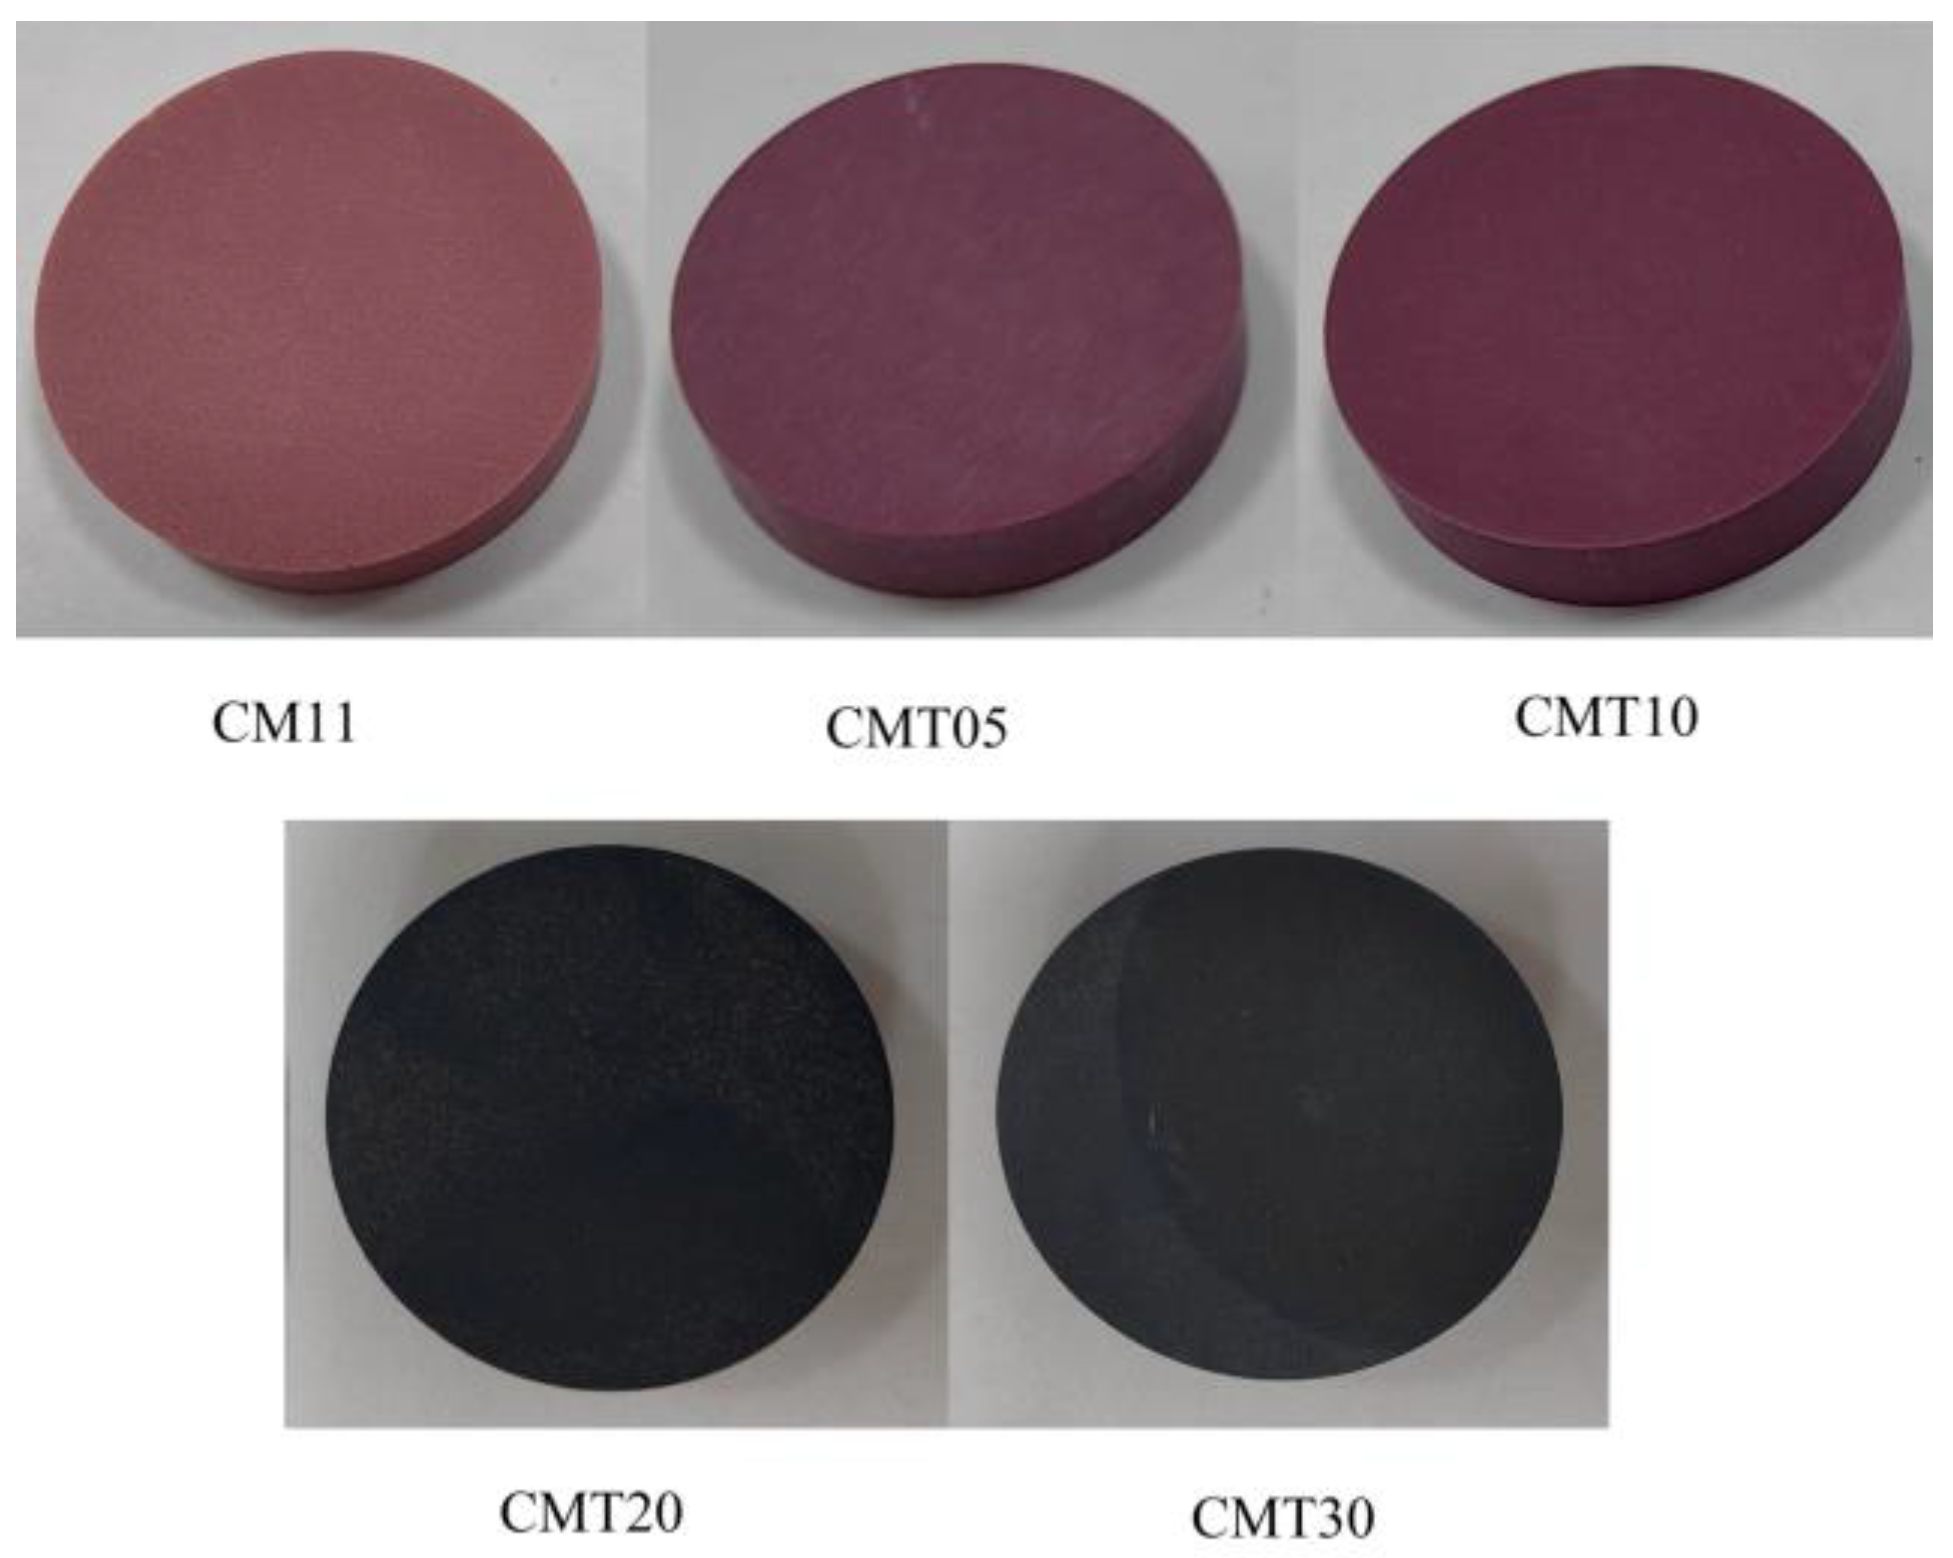
The prepared ceramics were processed into samples with dimensions of Φ 26 mm × 5 mm, Φ 26 mm × 1 mm, and Φ 40 mm × 2 mm via grinding for testing the surface flashover voltage in a vacuum, secondary electron emission characteristics, and resistivity, respectively. The samples were numbered according to the amount of TiO2 added, as shown in Table 2, and photos of the samples are shown in Figure 2.
A portion of samples were loaded into a high-temperature hydrogen furnace and heat treatment was performed at 1450 °C under wet hydrogen conditions to study the effect of the heat treatment process on the properties of the ceramics, considering the requirements of metallization and welding when applied in vacuum electronic devices. The parameters of the heat treatment process are shown in Table 3.

2.2. Samples Characterization

2.2.1. Bulk Density, Resistivity, and Microstructure Characterization

The bulk density of the samples was measured by Archimedes’ drainage method. High resistance meter (SM7120, HITACHI, Tokyo, Japan) was used to measure the surface resistivity and volume resistivity of the samples. Scanning electron microscope (SU3800, HITACHI, Tokyo, Japan) was applied to observe the microstructure of the samples. The microscopic composition of the samples was analyzed using X-ray diffractometer (D8 Advance, BRUKER, Karlsruhe, Germany) and X-ray photoelectron spectrometer (SM7120, HITACHI, Tokyo, Japan).

2.2.2. Test of Secondary Electron Emission Characteristics

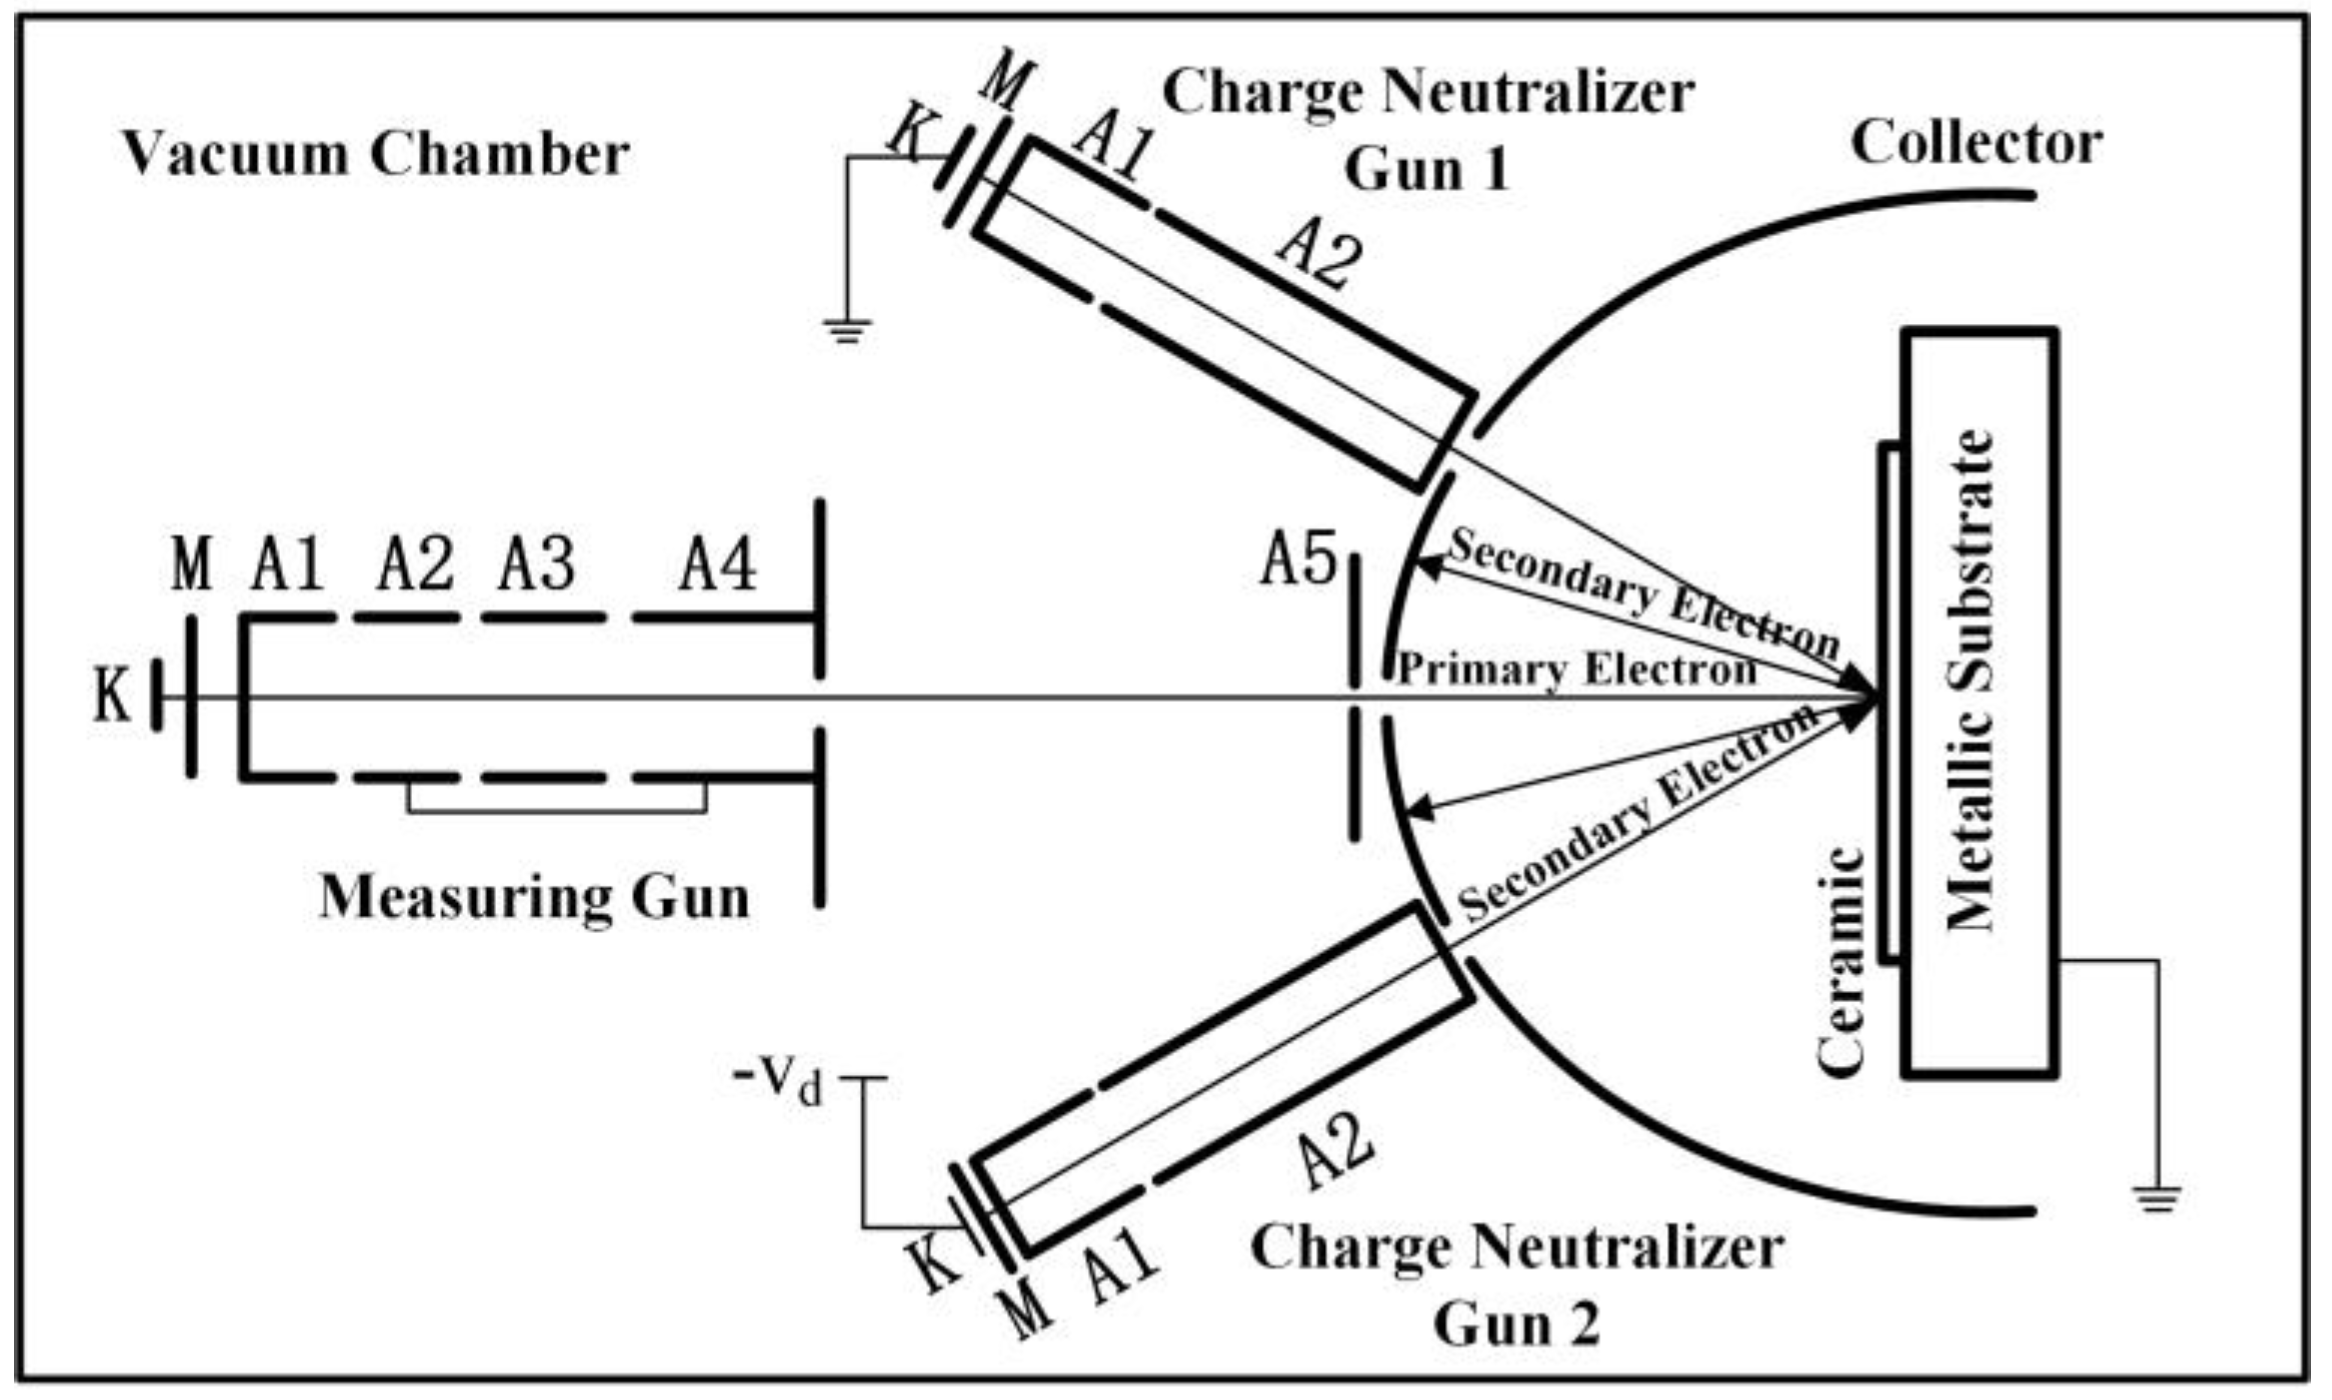
There will be charges accumulated on the surface when a ceramic is bombarded by electrons. In order to eliminate the influence of surface charge accumulation, the three-gun method was applied to measure the SEY of the ceramic materials. A diagrammatic sketch of the test system’s structure is shown in Figure 3. The system works as follows: the first charge neutralizer gun, which is a low-energy electron gun, is activated to remove the positive surface charges when they appear on the ceramic surface. The second charge neutralizer gun is activated to remove the negative surface charges when they appear on the ceramic surface. The surface potential of the ceramics is stabilized to ground potential by the cooperation of two neutralizer guns to eliminate the charge accumulated on the ceramic surface, in order to ensure the accuracy of secondary electron emission testing [25]. During the secondary electron emission test, the incident electron beam is perpendicular to the sample; the primary electron energy range is 0~3500 eV; the incident current is 0.1 μA with a pulse width of 5 μs; the temperature during the test is kept as room temperature; and the vacuum degree of the cavity is lower than 1 × 10⁻⁵ Pa.

2.2.3. Test of Surface Flashover Threshold in Vacuum

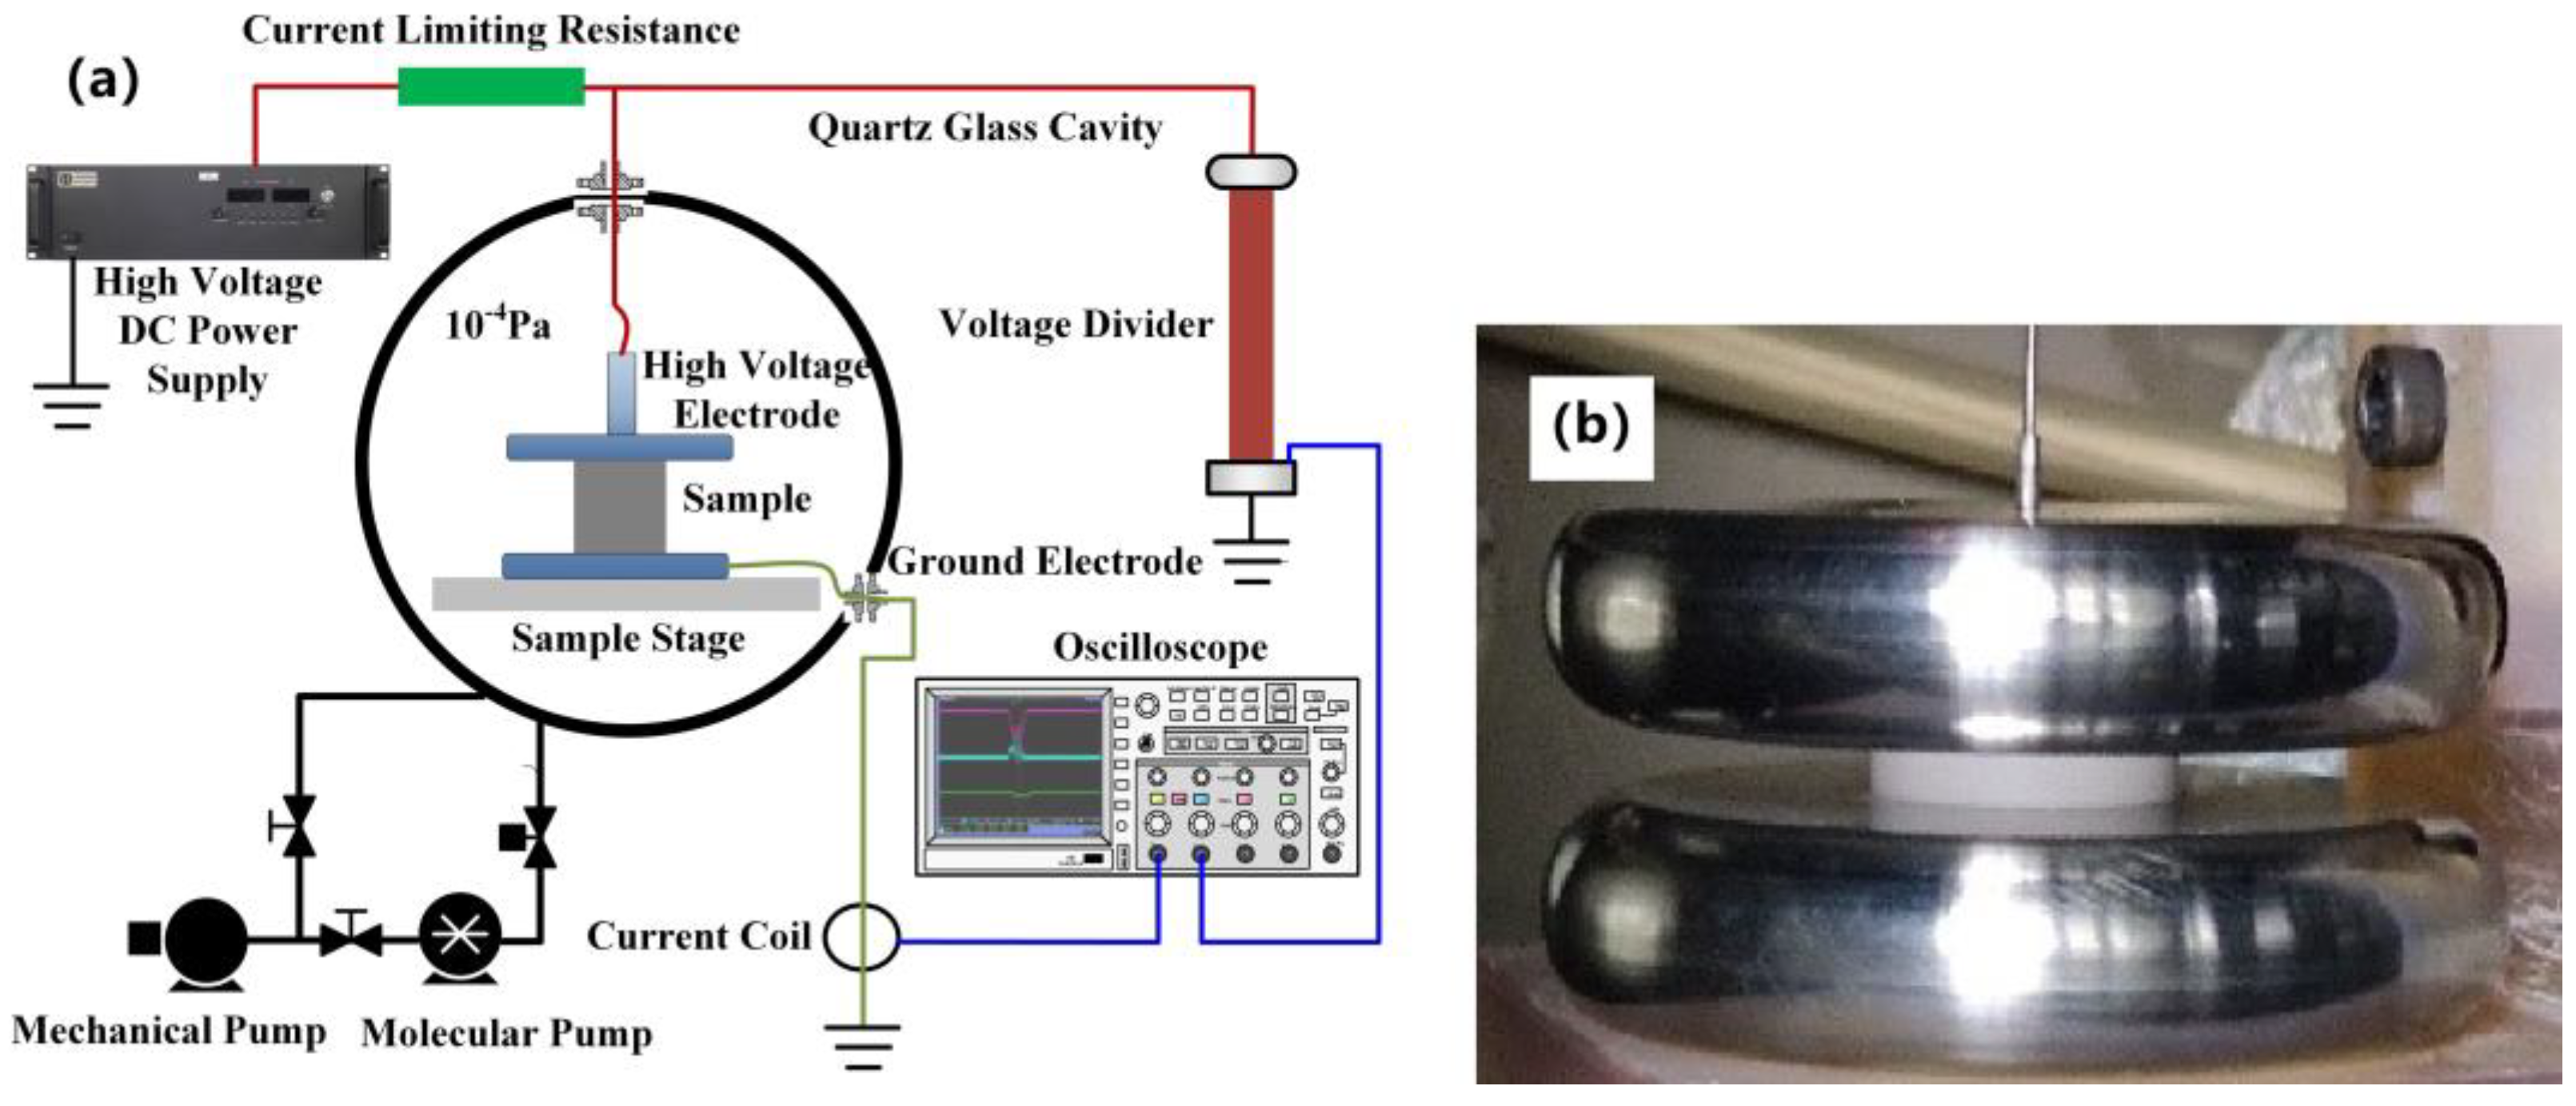
A DC high-voltage vacuum test system was used to test the surface flashover threshold of Al2O3 ceramics in a vacuum, and the diagrammatic sketch of the testing device is shown in Figure 4a. The electrodes were disc-shaped flat shape made of stainless steel, with a diameter of 66 mm, and a distance between electrodes of the sample height, i.e., 5 mm. A photo of the flat electrode and test structure is shown in Figure 4b. The test started when the vacuum degree of the chamber reached 1 × 10⁻⁴ Pa. During the test, a negative polarity DC voltage with the linear rise rate of 500 V/s was applied to the sample until the surface flashover occurred. Then, we gradually reduced the voltage until the surface flashover completely disappeared. If this voltage is repeatedly applied to the sample 3 times, and the sample can avoid flashover and remain stable, then the voltage was recorded as the surface flashover threshold in a vacuum. The voltage holdoff capacity of Al2O3 ceramics in a vacuum is represented by the surface flashover threshold, denoted by Uho. Five samples were tested per group, and the average value of Uho was calculated as the final result.

3. Results and Discussions

3.1. Bulk Density and Micromorphology

The influence of TiO2 on the bulk density and micromorphology of the Al2O3 ceramics was studied. It can be seen from Table 4 that we can increase the bulk density of the ceramics by adding a little amount of TiO2 to Cr/Mn-doped Al2O3 ceramics. The bulk density of the Al2O3 ceramics with 1 wt.% TiO2 is highest, reaching 3.810 g/cm3. After that, the bulk density of the Al2O3 ceramics decreases with the increase in the content of TiO2. The addition of TiO2 to the Al2O3 ceramics has an effect on their sintering properties. TiO2 can form the finite solid solution with Al2O3 when it is added to ceramics. In the range of 1300 °C–1700 °C, the solid solubility of TiO2 in the α- Al2O3 ceramics is 0.27 wt.% [26]. The TiO2 residual is located at the grain boundary, in which case it can react with MnO2 and form a low-temperature eutectic mixture. The low eutectic presents a liquid phase during sintering, which reduces the sintering temperature of Al2O3 ceramics [27]. Secondly, in a TiO2-Al2O3 solid solution, Ti4+ replaces Al3+, which produces lattice deformation and a large number of cation vacancies. The energy potential barrier required for lattice particle diffusion is reduced and the lattice is activated, which is conducive to the diffusion and transfer of substances and promotes the sintering of ceramics.
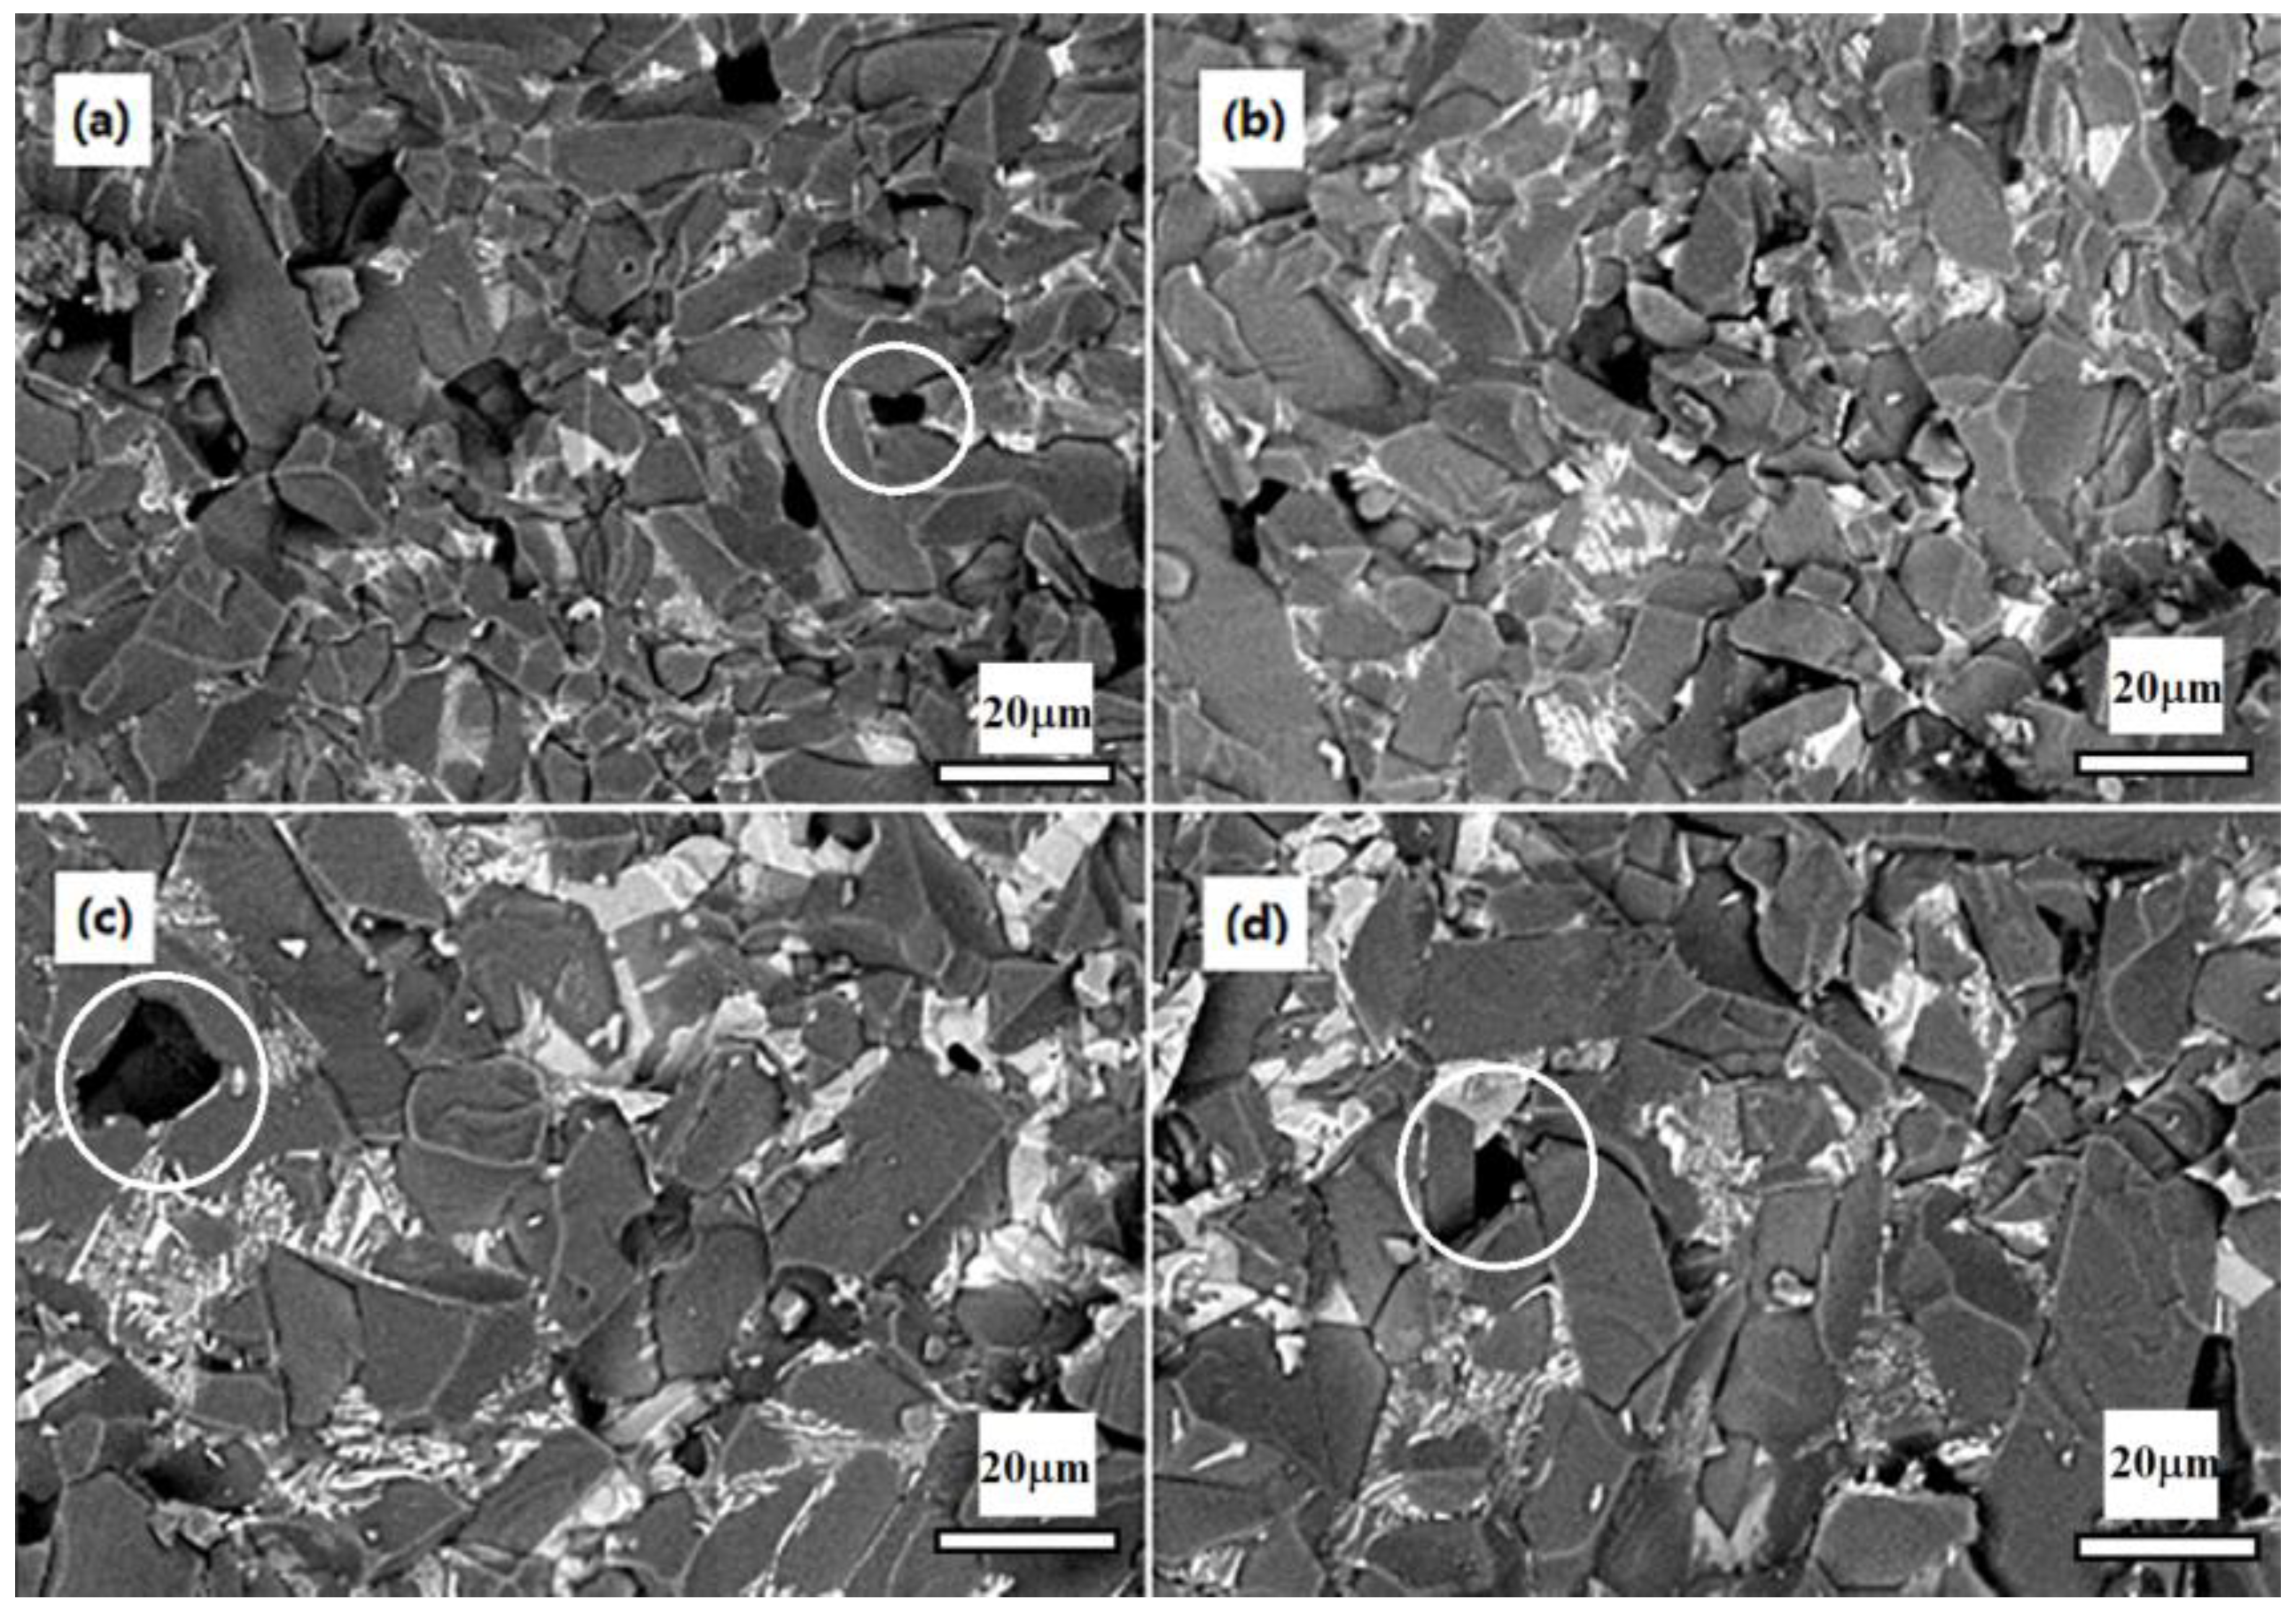
Figure 5 shows the fractured surface of the Cr/Mn/Ti-doped Al2O3 ceramics. We can find from Figure 5 that there is little difference in the microstructures between CMT05 and CMT10, and there are mainly elongated grains, with an average particle size of about 8–10 μm. As the amount of TiO2 continued to increase, the grain size of the CMT20 and CMT30 samples increased, and large grains appeared locally, as shown in Figure 5c,d. The addition of excessive TiO2 to ceramics makes a local abnormal grain growth during the ceramic sintering process. The pores in the ceramic cannot be discharged promptly, which is likely to cause pores wrapped up (as circled in the Figure 5) in the interior and boundary of the grains, resulting in the reduction in the bulk density of the ceramics, and the uniformity of the microstructure will also become worse.

3.2. Microstructure and Phase Composition

XPS and XRD were applied to analyze the microstructure and phase composition of the Al2O3 ceramics. Since Ti is a variable valence element, its elemental valence and phase composition in the ceramics may change during the sintering and heat treatment. Figure 6 shows the XPS pattern of CMT30. The XPS pattern of Ti 2p in Figure 6b shows that the binding energy of the Ti 2p1/2 energy level of Ti4+ in the untreated samples is 464.4 eV, and the binding energy of the Ti 2p3/2 energy level is 459.2 eV [28,29]. After the heat treatment, the binding energy of the Ti 2penergy level of the samples moves toward the direction of lower energy, indicating that hydrogen has a certain degree of reduction on TiO2 during the heat treatment.
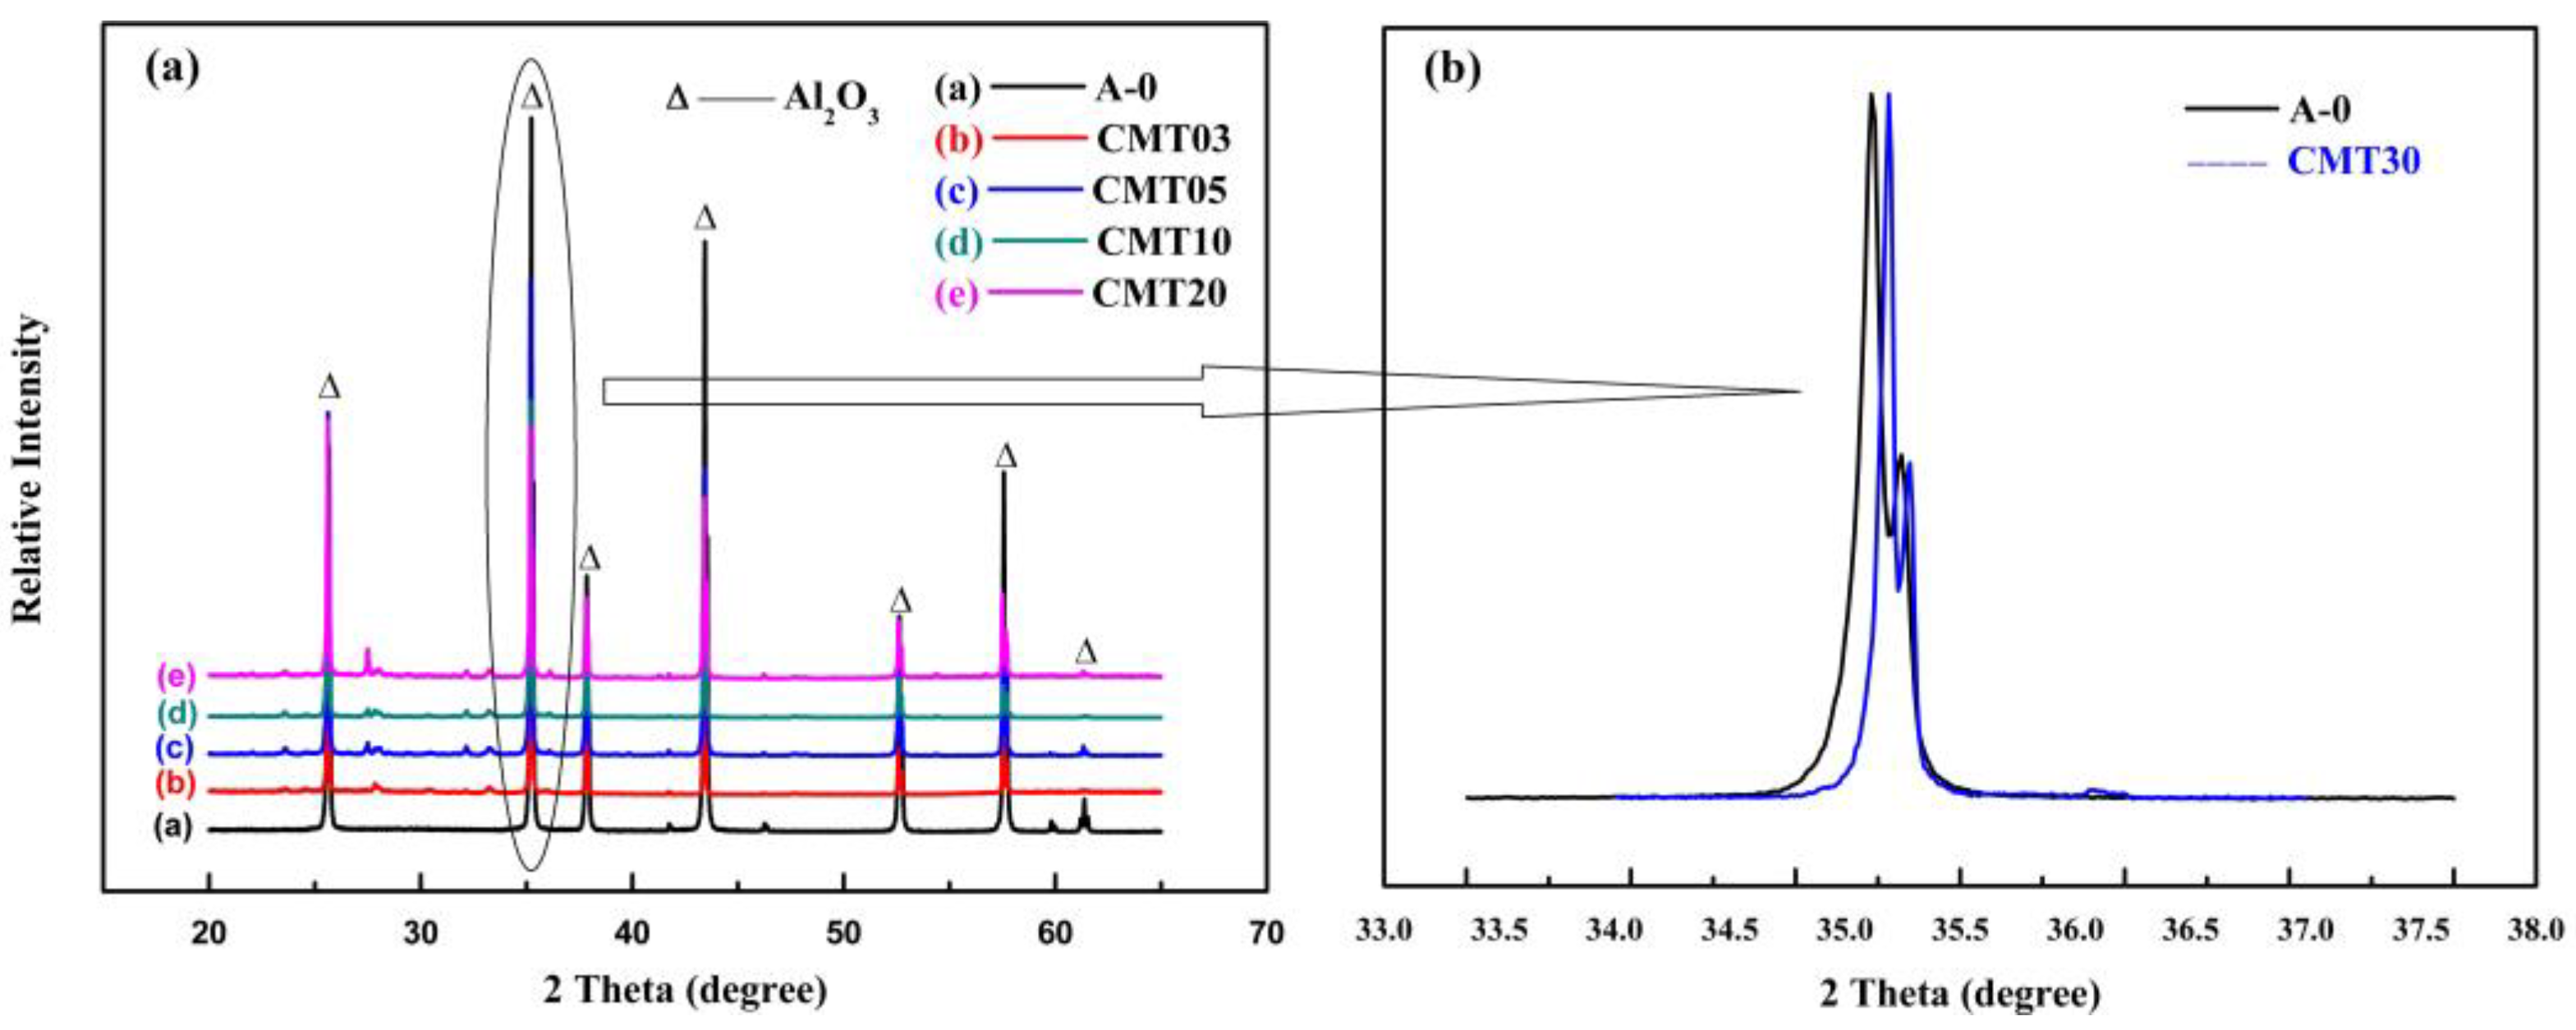
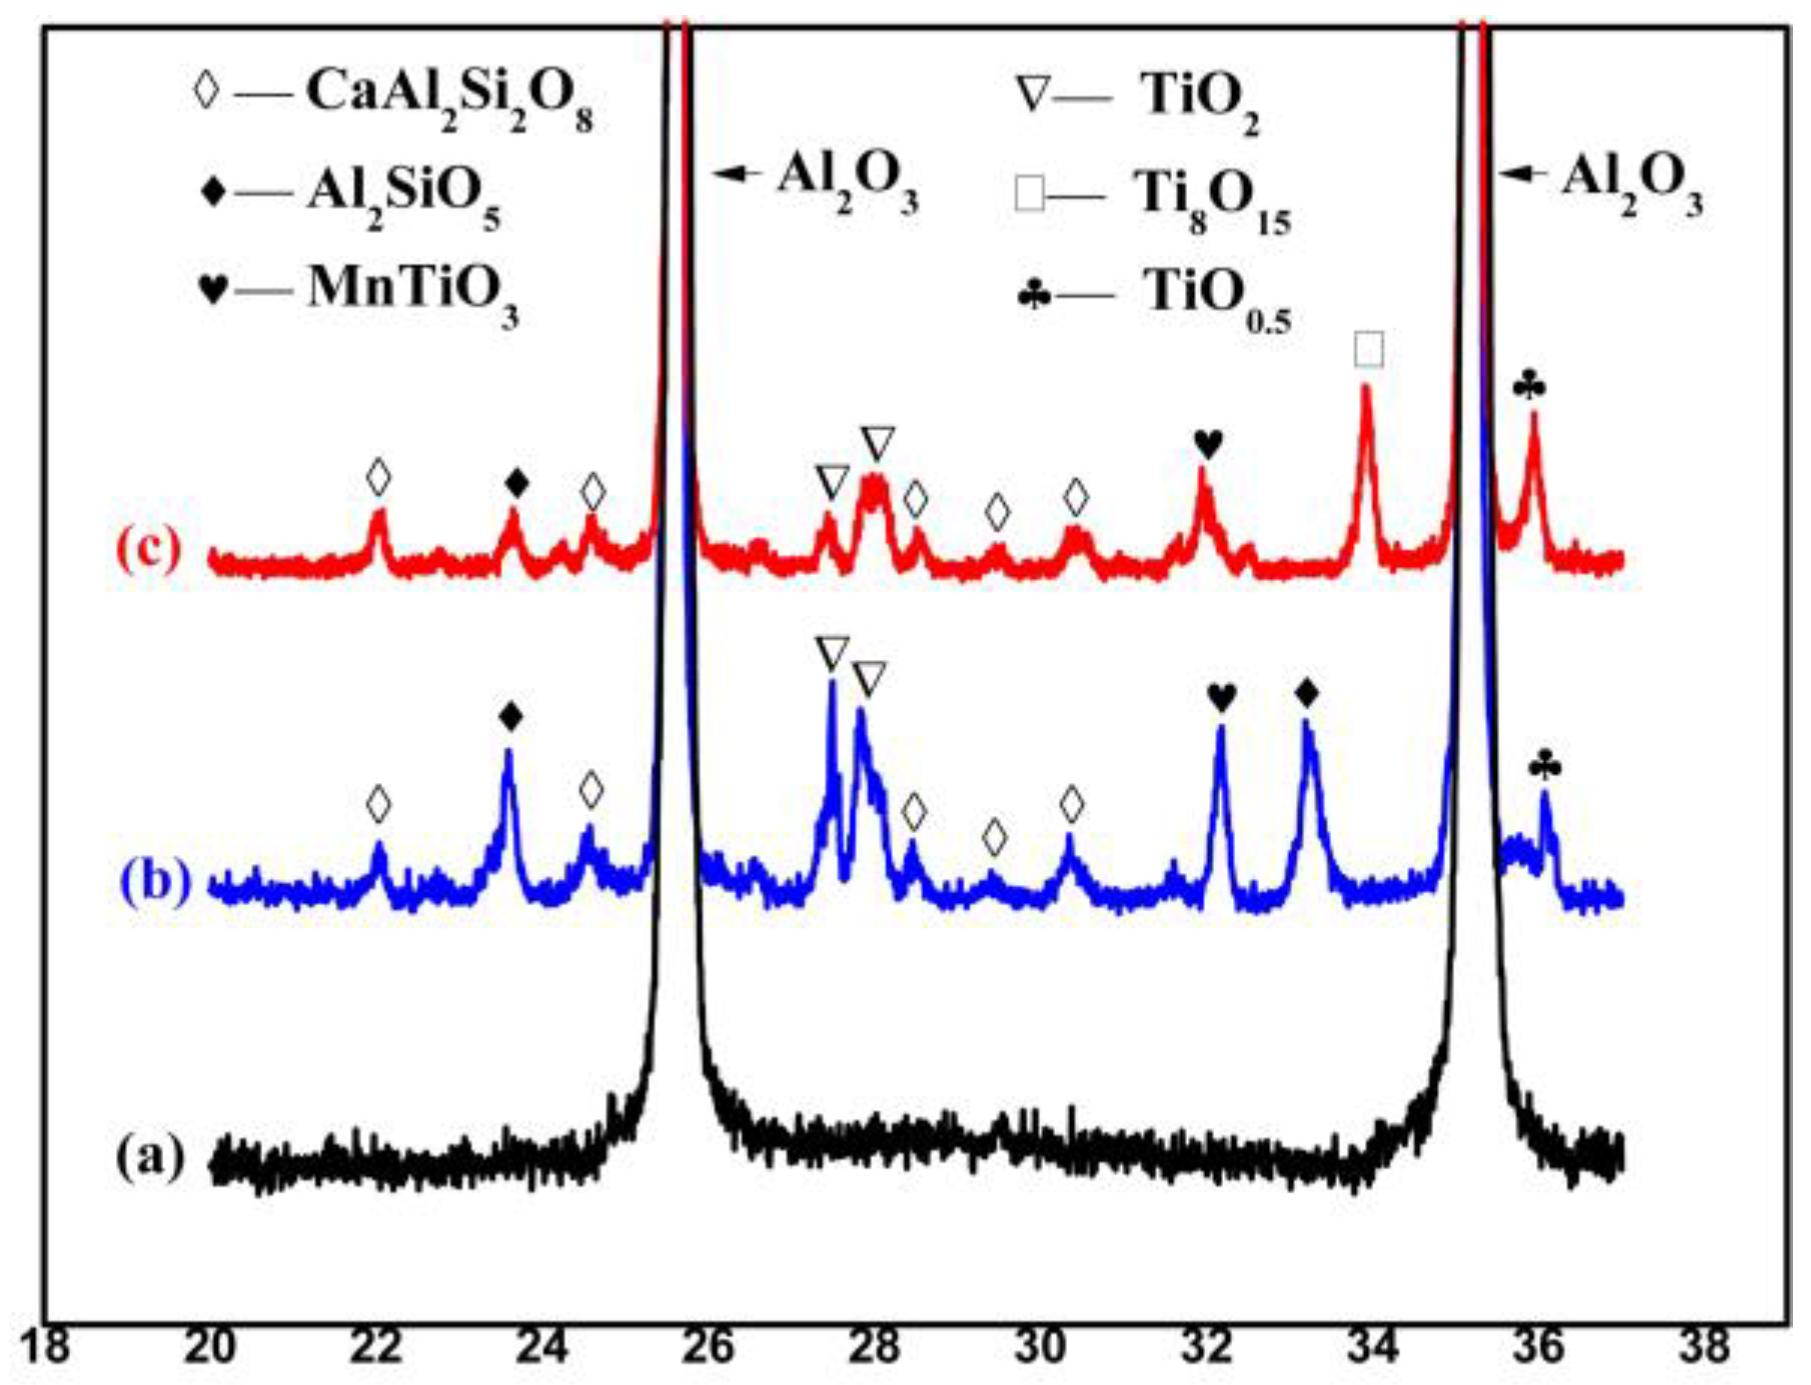
Figure 7 and Figure 8 show the XRD patterns of the Al2O3 ceramics. It can be seen that the basic Al2O3 ceramics A-0 only contain the phase of Al2O3. The locally enlarged image in Figure 7b shows that the characteristic peak of the Al2O3 at 2 Theta = 35.15 shifts toward a small angle direction. This is due to the solid solution of TiO2 and Al2O3. Ti4+ replaces Al3+, which changes the cell parameters of Al2O3. Combined with Figure 8, we can find that in addition to the main crystal phase of Al2O3, the CMT30 sample also contains a small amount of other crystal phases such as CaAl2Si2O8, Al2SiO5, and MnTiO3, which are generated by the reaction of Al2O, CaO, SiO2, MnO2, and TiO2 in the ceramics. Figure 8 is the particle comparison of the XRD data of the A-0 and CMT30 samples after normalization, displaying that the CMT30 sample before and after the heat treatment contained both TiO2 and TiO0.5. And the content of the TiO2 phase decreased and the content of the TiO0.5 phase increased in CMT30 after the heat treatment. In addition, after the heat treatment, the Ti8O15 phase appeared in CMT30. Both the XPS and XRD results show that TiO2 in Al2O3 ceramics was reduced during the heat treatment process, resulting in an increase in the content of the anoxic phase in the Cr/Mn/Ti-doped Al2O3 ceramics.

3.3. Secondary Electron Emission Characteristics

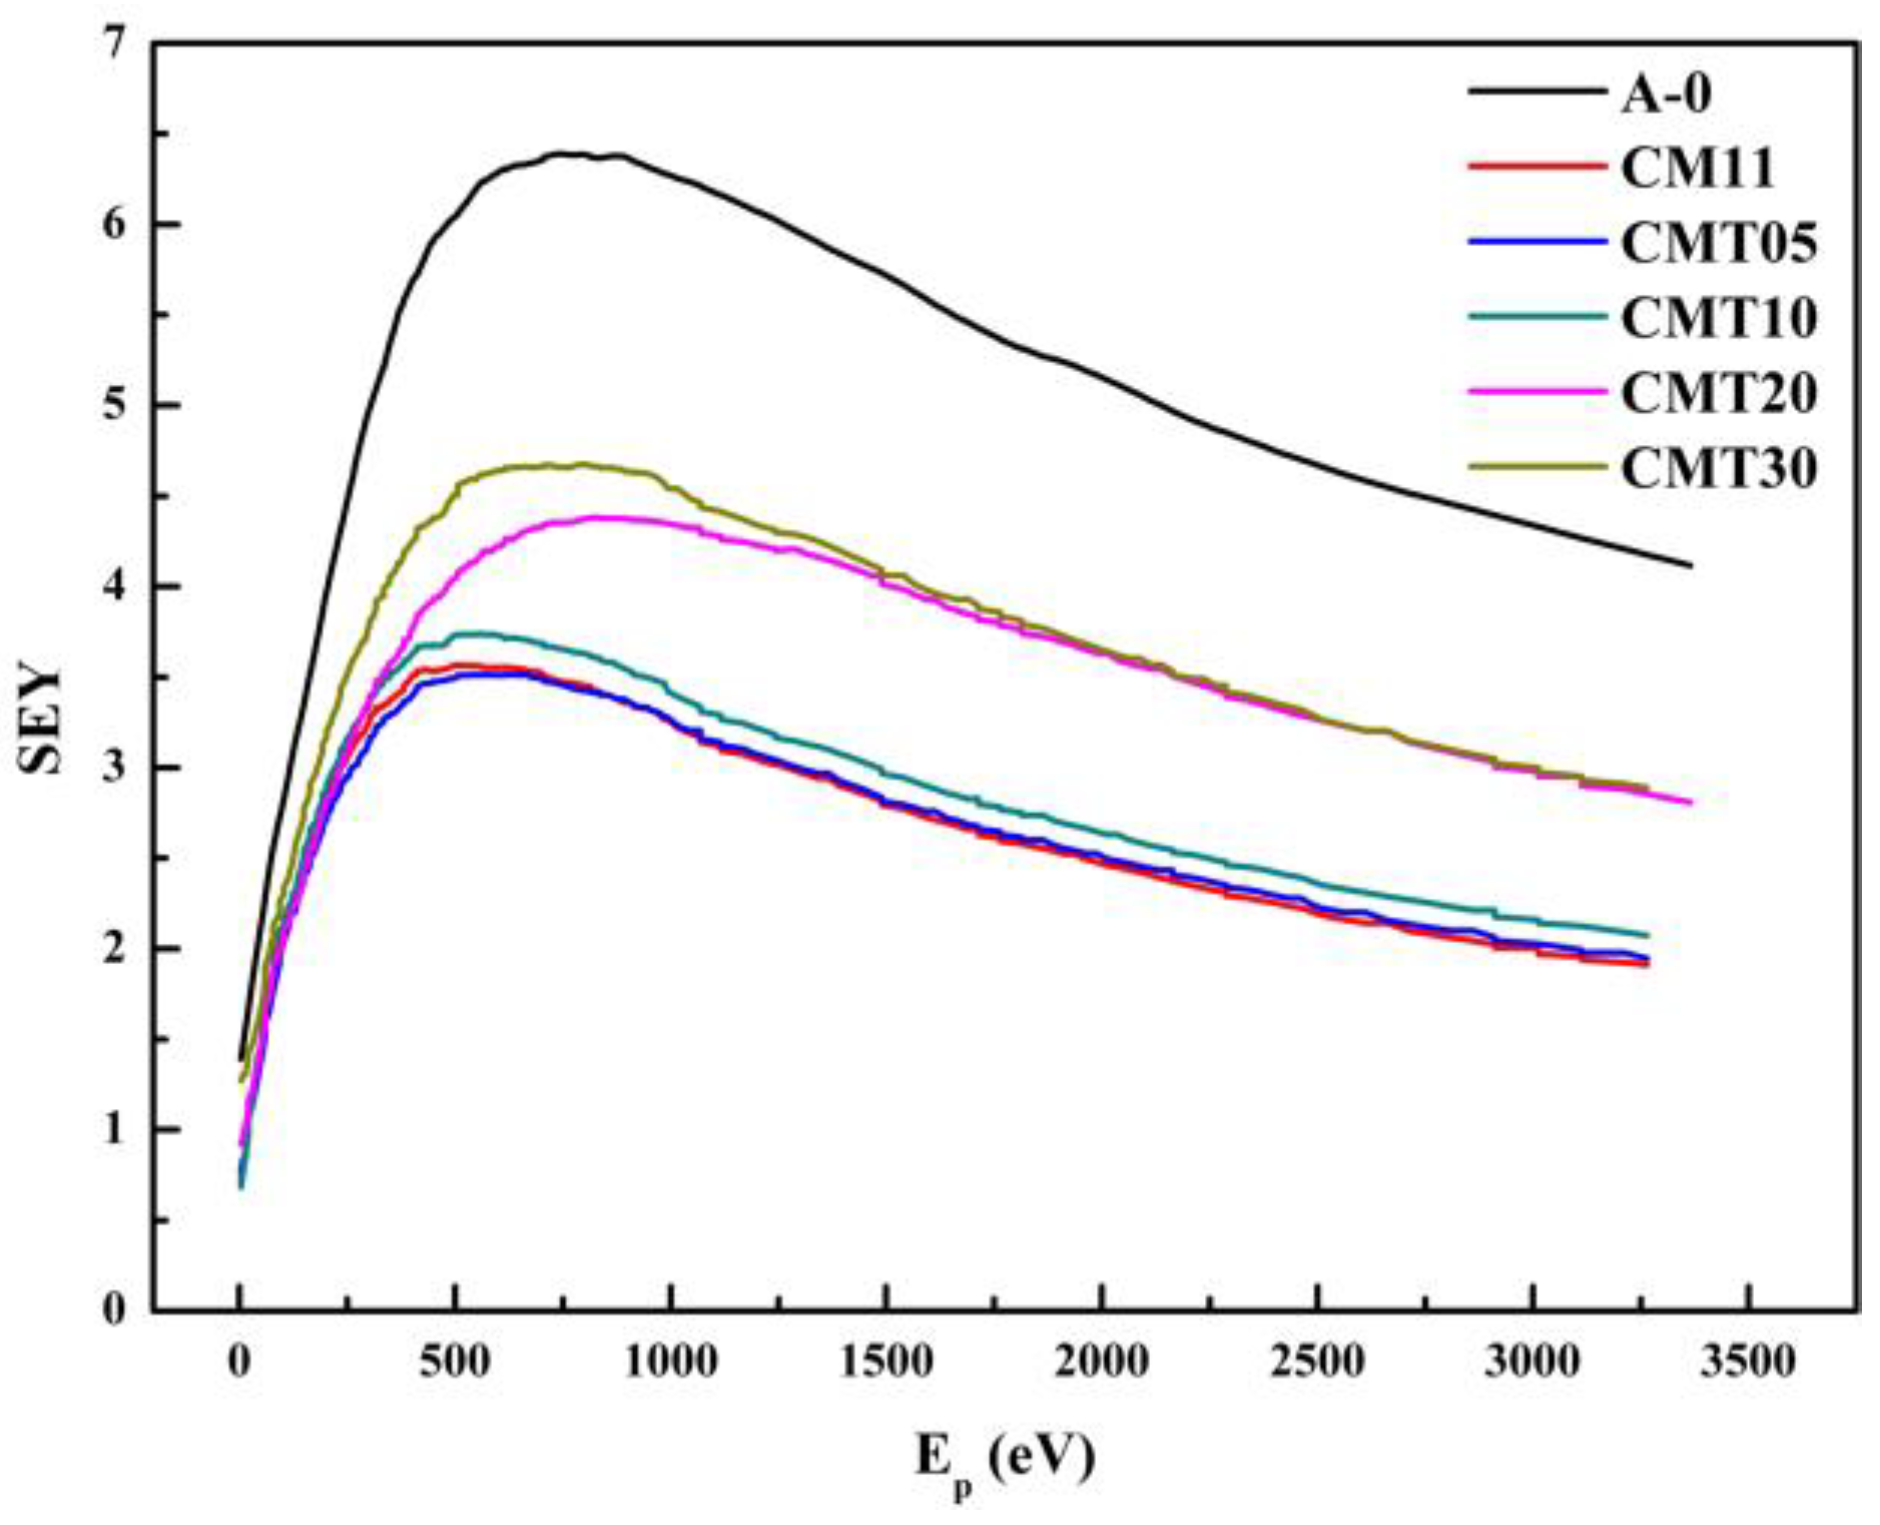
According to the SEEA theory [16,17,18], secondary electron emission of ceramics is a factor which influences the surface flashover voltage directly. We measured the SEY of the Al2O3 ceramics with different contents of TiO2. The secondary electron emission curves and maximum value of the SEY are shown in Figure 9 and Table 5, respectively.
The results show that the SEY of the Cr/Mn- or Cr/Mn/Ti-doped Al2O3 ceramics is significantly lower than that of the basic Al2O3 ceramics, because Cr2O3 with a low secondary electron emission coefficient as an additive can effectively reduce the SEY of the Al2O3 ceramics. While the SEY of the ceramics increases with the increase in the content of TiO2. Particularly, the SEY of the ceramics increases significantly when the content of TiO2 is more than 2 wt.%. This is mainly attributed to the effect of TiO2 on the microstructure of the Al2O3 ceramics. Adding TiO2 to the Al2O3 ceramics can promote the process of sintering. The grain size of the ceramics increases significantly when the content of TiO2 is more than 2 wt.%.
According to the SEEA theory, the primary electrons are accelerated by the electric field and gain energy, then they collide with the surface of the ceramic and produce the secondary electrons. The secondary electrons collide with the surface again under the effect of the electric field, after they escape from the surface. The whole process is repeated and the number of electrons multiplies rapidly, eventually leading to the occurrence of the electron avalanche. Electron avalanches cause the release of adsorbed gas on the ceramic surface, which is ionized by high-energy electrons, producing a large amount of plasma. Eventually, surface flashover occurs. Usually, the main factors affecting the collisional ionization process are the energy of the electron before the collision and the ionization energy of the collided lattice molecule or atom. The collisional ionization coefficient α is commonly used to describe the collisional ionization. The collisional ionization coefficient of an electron is the number of collisional ionizations produced by an electron traveling a unit distance under the action of the electric field. And the collisional ionization coefficient can generally be expressed as follows:
α = A e x p ( B V i λ E )
where Vi is the ionization energy of the collided lattice molecule or atom, λ is the mean free path of the electron, and E is the electric field strength. A, B are constants related to materials. It can be found from the expression of the collisional ionization coefficient that the mean free path of the electron influences the coefficient directly. A longer mean free path of the electron means that the electron is subjected to the electric field force between the two collisions for a longer time under the effect of the electric field, making ionization easy to occur. The grain size of the ceramics increases significantly when the content of TiO2 is more than 2 wt.%. And the mean free path of the secondary electrons increases in the process of escape. The ionization coefficient of recollision ionization also becomes larger, which makes ionization easier to occur, resulting in the increase in the SEY.

3.4. Surface and Volume Resistivity

The surface resistivity of the ceramics is another important factor that affects the voltage holdoff capacity in a vacuum. The high surface resistivity of the ceramics is not conducive to charge leakage, resulting in an increase in the local field strength. And the surface flashover is aggravated. Thus, the surface resistivity of the ceramics must be reduced to a certain extent in order to improve the voltage holdoff capacity. It can be seen from the resistivity of the Al2O3 ceramics in Table 6 that the resistivity of the Cr/Mn-doped Al2O3 ceramics did not change a lot before and after the heat treatment, while the resistivity of the Al2O3 ceramics with TiO2 changed significantly.
When TiO2 was added to the Cr/Mn-doped Al2O3 ceramics, the change in the resistivity of the ceramics was not significant before the heat treatment, and the surface resistance of the ceramics was one order of magnitude lower than that of the basic Al2O3 ceramics. With the increase in the content of TiO2, the surface resistivity of the ceramics did not change much. The volume resistivity of the CMT20 and CMT30 was reduced by two orders of magnitude compared with the base Al2O3 ceramics A-0. After the heat treatment, the resistivity of the Cr/Mn/Ti-doped Al2O3 ceramics decreased significantly. The surface resistivity and volume resistivity of the CMT10 decreased by 4 and 5 orders of magnitude compared with the base Al2O3 ceramics, reaching 7.6 × 10¹¹ Ω and 3.47 × 10¹¹ Ω·cm, respectively. The resistivity exceeded the measuring range of the high resistance meter (˂108 Ω) when the content of TiO2 was more than 3 wt.%. The color of the samples changed significantly after the heat treatment, as shown in Figure 10.
According to the XPS results in Figure 6, the binding energy of the Ti 2p level in the sample moved to the direction of low energy after the heat treatment. TiO2 was reduced by hydrogen to a certain extent, and the O:Ti ratio declined. The XRD analysis results show, meanwhile, that the content of the anoxic phase in the ceramics increased after the heat treatment. According to the relevant literature [30,31], the formation of anoxic phase TinO2n−1 will significantly reduce the resistivity of the ceramics. And the higher the content of the anoxic phase, the darker the ceramic color and the smaller the resistivity are. This is also consistent with the pattern of the samples’ color in the experiment.

3.5. Voltage Holdoff Capacity in Vacuum

We measured the surface flashover threshold of the Al2O3 ceramics, and the size of the samples was Φ 26 mm × 5 mm. The surface flashover threshold of the samples before and after the heat treatment were tested by experiments, and the results are shown in Table 7.
As shown in Table 7, the surface flashover threshold slightly increased when a small amount of TiO2 was added to the ceramics. However, the surface flashover threshold of the ceramics changed significantly after the heat treatment. The effect of the heat treatment process on the Al2O3 ceramics with the TiO2 additive was different from the basic Al2O3 ceramics A-0 and the Cr/Mn-doped Al2O3 ceramics CM11. The Uho of the Cr/Mn/Ti-doped Al2O3 ceramics with a small amount of TiO2 was significantly improved after the heat treatment. The Uho of CMT11 reached 33 kV, which was 32% higher than that of the basic Al2O3 ceramics. After the heat treatment with wet hydrogen, the Uho of the basic Al2O3 ceramics slightly decreased, while the Uho of the Cr/Mn/Ti-doped Al2O3 ceramics increased significantly. The Uho of the Cr/Mn/Ti-doped Al2O3 ceramics in a vacuum is higher than that of the base Al2O3 ceramics, which is mainly attributed to the following three aspects. Firstly, the SEY of the Cr/Mn/Ti-doped Al2O3 ceramics is obviously lower than that of the basic Al2O3 ceramics, which makes the secondary electron avalanche hard to happen on the surface of the ceramics when the voltage is applied; thus, the surface flashover threshold is larger. Secondly, the surface resistivity of the sample with TiO2 did not change a lot compared with the basic Al2O3 ceramics before the heat treatment, but the surface resistivity and volume resistivity of the Cr/Mn/Ti-doped Al2O3 ceramics were significantly lower than those of the basic Al2O3 ceramics after the heat treatment. The low surface resistivity of the ceramics can make the surface charge be conducted timely and effectively, so the probability of the flashover occurrence along the surface can be reduced. Finally, the bulk density and microstructure uniformity of the ceramics can be improved with a small amount of TiO2 addition, which can increase the stability of the ceramics in the process of the applied voltage.
According to the data of the surface flashover threshold in a vacuum from Table 7, when the content of TiO2 was more than 1 wt.%, the Uho of CMT20 and CMT30 were very low after the heat treatment, which were 18 kV and 15 kV, respectively. This is because the resistivity of the ceramics after the heat treatment with wet hydrogen was too low. When the voltage was applied to the ceramics, there was a large leakage current, resulting in the action of power failure protection, and the power of the high-voltage equipment was cut. So, the test value of the surface flashover threshold was very low.

4. Conclusions

In this paper, Al2O3 ceramics with a high surface flashover threshold in a vacuum were prepared by bulk doping Cr2O3, MnO2, and TiO2, and the effect of the content of TiO2 on the properties of the Al2O3 ceramics was studied. The main conclusions are as follows:
(1)
The addition of TiO2 to the Al2O3 ceramics can promote the sintering of the ceramics, and ceramics with a high volume density and uniform microstructure can be prepared by an appropriate additive amount of TiO2.
(2)
TiO2 in the ceramics was reduced during the heat treatment with wet hydrogen condition. The resistivity of the Cr/Mn/Ti-doped Al2O3 ceramics decreased significantly with the appearance of the anoxic phase.
(3)
The microstructure of the Cr/Mn/Ti-doped Al2O3 ceramics with 1 wt.% TiO2 is uniform and compact, and the surface resistivity of the sample is reduced to 7.6 × 10¹¹ Ω. The surface flashover threshold in a vacuum reaches 33 kV, which is 32% higher than that of the basic Al2O3 ceramics.
(4)
The resistivity of the ceramics will be too low when the content of TiO2 exceeds 2 wt.%, resulting in a large leakage flow and low surface flashover threshold during the experiment.

Author Contributions

Conceptualization, D.F.; methodology, D.F.; validation, D.F. and X.W.; formal analysis, D.F. and X.W.; investigation, D.F.; data curation, D.F., X.W., B.S. and G.Z.; writing—original draft preparation, D.F.; writing—review and editing, D.F. and X.W.; supervision, S.Z.; project administration, S.Z. All authors have read and agreed to the published version of the manuscript.

Funding

This research received no external funding.

Data Availability Statement

Data available on request due to restrictions eg privacy or ethical.

Acknowledgments

This work was completed at the Beijing Vacuum Electronic Research Institute, Beijing University. And thanks for the favor from the colleagues in our research group.

Conflicts of Interest

The authors declare no conflict of interest.

References

  1. Goswami, A.P.; Roy, S.; Das, G.C. Effect of powder, chemistry and morphology on the dielectric properties of liquid-phase-sintered alumina. Ceram. Int. 2002, 28, 439–445. [Google Scholar] [CrossRef]
  2. Yang, Z.H.; Chen, N.; Qin, X.M. Fabrication of Porous Al2O3 Ceramics with Submicron-Sized Pores Using a Water-Based Gelcasting Method. Materials 2018, 11, 1784. [Google Scholar] [CrossRef] [Green Version]
  3. Yang, L.L.; Wang, D.Z.; Zhou, G.X.; Lan, Z.D.; Yang, Z.H. Glass-Ceramic Coating on Silver Electrode Surface via 3D Printing. Materials 2023, 16, 3276. [Google Scholar] [CrossRef] [PubMed]
  4. Sun, G.-Y.; Guo, B.-H.; Mu, H.-B.; Song, B.-P.; Zhou, R.-D.; Zhang, S.; Zhang, G.-J. Flashover strength improvement and multipactor suppression in vacuum using surface charge preconditioning on insulator. J. Appl. Phys. 2018, 124, 134102. [Google Scholar] [CrossRef]
  5. Pillai, A.S.; Hackam, R. Surface flashover of solid insulators in atmospheric air and in vacuum. J. Appl. Phys. 1985, 58, 146–153. [Google Scholar] [CrossRef]
  6. Miller, C.H. Flashover of insulators in vacuum: The last twenty years. IEEE Trans. Dielectr. Electr. Insul. 2016, 22, 3641–3657. [Google Scholar] [CrossRef]
  7. Yan, P.; Shao, T.; Wang, J.; Gao, W.; Yuan, W.; Pan, R.; Zhang, S.; Sun, G. Experimental investigation of surface flashover in vacuum using nanosecond pulses. IEEE Trans. Dielectr. Electr. Insul. 2007, 14, 634–642. [Google Scholar] [CrossRef]
  8. Liebault, J.; Vallayer, J.; Goeuriot, D.; Treheux, D.; Thevenot, F. How the trapping of charges can explain the dielectric breakdown performance of alumina ceramics. J. Eur. Ceram. Soc. 2001, 21, 389–397. [Google Scholar] [CrossRef]
  9. Hawley, R. Solid insulators in vacuum: A Review. Vacuum 1968, 18, 383–390. [Google Scholar] [CrossRef]
  10. Seif, M.N.; Balk, T.J.; Beck, M.J. Desorption from Hot Scandate Cathodes: Effects on Vacuum Device Interior Surfaces after Long-Term Operation. Materials 2020, 13, 5149. [Google Scholar] [CrossRef]
  11. Li, S. Improvement of surface flashover in vacuum. High Volt. 2020, 5, 122–133. [Google Scholar] [CrossRef]
  12. Vlieks, A.; Allen, M.; Callin, R.; Fowkes, W.; Hoyt, E.; Lebacqz, J.; Lee, T. Breakdown phenomena in high power klystrons. IEEE Trans. Electr. Insul. 1989, 24, 1023–1028. [Google Scholar] [CrossRef] [Green Version]
  13. Tafazoli, M. A study of on-orbit spacecraft failures. Acta Astronaut. 2009, 64, 195–205. [Google Scholar] [CrossRef]
  14. Cravey, W.; Devlin, G.; Mayberry, C.; Downing, J. Investigation of a high voltage vacuum insulator for the DARHT accelerator. In Proceedings of the 11th IEEE International Pulsed Power Conference, Baltimore, MD, USA, 29 June–2 July 1997; pp. 555–558. [Google Scholar]
  15. Zhou, L.; Li, Z.H.; Wang, Z.; Liang, C.; Li, M.; Qi, J.; Chu, Y. Design of a 5-MA 100-ns linear-transformer-driver accelerator for wire array Z-pinch experiments. Phys. Rev. Accel. Beams 2016, 19, 030401. [Google Scholar] [CrossRef] [Green Version]
  16. Anderson, R.A.; Tucker, W.K. Vacuum surface flashover from bipolar stress. J. Appl. Phys. 1985, 58, 3346–3349. [Google Scholar] [CrossRef]
  17. Anderson, R.A. Mechanism of pulsed surface flashover involving electron-stimulated desorption. J. Appl. Phys. 1980, 51, 1414–1421. [Google Scholar] [CrossRef]
  18. Cross, J. High speed photography of surface flashover in vacuum. IEEE Trans. Electr. Insul. 1978, EI-13, 145–148. [Google Scholar] [CrossRef]
  19. Sudarshan, T.S.; Cross, J.D. The Effect of Chromium Oxide Coatings on Surface Flashover of Alumina Spacers in Vacuum. IEEE Trans. Electr. Insul. 1976, EI-11, 32–35. [Google Scholar] [CrossRef]
  20. Yamamoto, O.; Takuma, T.; Fukuda, M.; Nagata, S.; Sonoda, T. Improving Withstand Voltage by Roughening the Surface of an Insulating Spacer Used in Vacuum. IEEE Trans. Dielectr. Electr. Insul. 2003, 10, 550–556. [Google Scholar] [CrossRef] [Green Version]
  21. Zheng, J.G.; Jiang, L.X.; Cai, Y.P. Secondary Electron Emission Characteristic of Insulated Al2O3 Ceramics with Cr2O3 Coating. J. Inorg. Mater. 2001, 16, 497–502. [Google Scholar]
  22. Zhang, H.; Xu, Y.; Qiao, G.; Ma, D.; Jin, H. Effects of Cr2O3 Addition on Microstructure and Vacuum Flashover Performance of Glass-Ceramics. IEEE Trans. Dielectr. Electr. Insul. 2014, 21, 1882–1886. [Google Scholar] [CrossRef]
  23. Katarina, L.D.; Dragana, K.M.; Marica, N.P.; Mioljub, V.N.; Slobodanka, P.G.; Dragan, V.L.; Dragan, D.M. Photoacoustic Characterization of TiO2 Thin-Films Deposited on Silicon Substrate Using Neural Networks. Materials 2023, 16, 2865. [Google Scholar]
  24. Zhou, W.B.; Li, T.L.; Lan, D.; Sun, C.Y.; Yang, S.T. Influence of TiO2, Al2O3, and Basicity on Viscosity and Structure of High Titanium-Bearing Blast Furnace Slag. Materials 2023, 16, 2575. [Google Scholar]
  25. Cai, Y.; Wang, D.; Qi, K.; He, Y. Measurement of total electron emission yield of insulators based on self-terminating charge neutralization. Rev. Sci. Instrum. 2022, 93, 055103-1–055103-7. [Google Scholar] [CrossRef]
  26. Hong, S.H.; Kim, D.Y. Effect of liquid content on the abnormal grain growth of alumina. J. Am. Ceram. Soc. 2001, 84, 1597–1600. [Google Scholar] [CrossRef]
  27. Liang, J. Black Alumina Ceramic Packaging Materials and Lamination Technology. Huazhong Univ. Sci. Technol. 2007. [Google Scholar]
  28. Bak, T.; Nowotny, J.; Rekas, M.; Sorrell, C. Defect chemistry and semiconducting properties of titanium dioxide: II. Defect diagrams. J. Phys. Chem. Solids 2003, 64, 1057–1067. [Google Scholar] [CrossRef]
  29. Victory, V.A.; Valery, G.K.; Natalia, V.P.; Zhang, Z. Ti 2p and O 1s core levels and chemical bonding in titanium-bearing oxide. J. Electron Spectrosc. Relat. Phenom. 2006, 152, 18–24. [Google Scholar]
  30. Ohmori, A.; Park, K.-C.; Inuzuka, M.; Arata, Y.; Inoue, K.; Iwamoto, N. Electrical conductivity of plasma-sprayed titanium (rutile) coatings. Thin Solid Film. 1991, 201, 1–8. [Google Scholar] [CrossRef]
  31. He, D.Y.; Zhang, H.; Jiang, J.M.; Li, X. Effect of H2 flow rate on electrical conductivity of APS TiO2 coatings. Hanjie Xuebao 2009, 30, 4. [Google Scholar]
Figure 1. Preparation process of the Al2O3 ceramics samples.
Materials 16 05048 g001
Figure 2. Photos of the Al2O3 ceramics before heat treatment.
Materials 16 05048 g002
Figure 3. Diagrammatic sketch of secondary electrons emission characteristics test system.
Materials 16 05048 g003
Figure 4. (a) Diagrammatic sketch of the testing device of surface flashover threshold in vacuum; (b) Photo of the flat electrode and test structure.
Materials 16 05048 g004
Figure 5. SEM of the doped Al2O3 ceramics: (a) CMT05; (b) CMT10; (c) CMT20; (d) CMT30.
Materials 16 05048 g005
Figure 6. XPS pattern of CMT30: (a) full spectrum; (b) XPS pattern of Ti 2p of the sample before/after heat treatment.
Materials 16 05048 g006
Figure 7. XRD pattern of the Al2O3 ceramics with different content of TiO2: (a) Full spectrum; (b) Partial enlarge view of A-0 and CMT30.
Materials 16 05048 g007
Figure 8. Partial comparison of XRD pattern: (a) A-0; (b) CMT30 before heat treatment; (c) CMT30 after heat treatment.
Materials 16 05048 g008
Figure 9. Secondary electron yield (SEY) curves of the Al2O3 ceramics with different content of TiO2.
Materials 16 05048 g009
Figure 10. Photos of the Cr/Mn/Ti-doped Al2O3 ceramics after heat treatment.
Materials 16 05048 g010
Table 1. Sintering parameters of the Al2O3 ceramics samples.
Temperature, °C25–500500–500500–13001300–16201620–1620
Time, min297120267200240
Table 2. Sample number and addition amount of TiO2.
Sample NumberCr2O3:MnO2TiO2, wt.%
A-0--
CM111:1-
CMT051:10.5
CMT101:11
CMT201:12
CMT301:13
Table 3. Parameters of heat treatment process.
Temperature, °C25–10001000–10001000–14501450–14501450–10001000–200200–25
Time, min85201006030furnace cooling
AtmosphereWet hydrogen, dew point 26–27 °CDry nitrogen
Table 4. Bulk density of Al2O3 ceramics with different content of TiO2.
Sample NumberBulk Density, g/cm3
A-03.75
CM113.782
CMT053.782
CMT103.810
CMT203.744
CMT303.716
Table 5. Maximum value of SEY of the Al2O3 ceramics with different content of TiO2.
Sample NumberSEEY
A-06.388
CM113.566
CMT053.513
CMT103.739
CMT204.379
CMT304.675
Table 6. Resistivity of the Al2O3 ceramics with different content of TiO2.
Sample NumberSurface Resistivity, ΩVolume Resistivity, Ω·cm
Before Heat TreatmentAfter Heat TreatmentBefore Heat TreatmentAfter Heat Treatment
A-07.405 × 10154.854 × 10152.35 × 10164.353 × 1016
CM117.21 × 10146.72 × 10143.81 × 10154.65 × 1015
CMT057.23 × 10145.236 × 10147.875 × 10158.254 × 1014
CMT104.875 × 10147.6 × 10114.10 × 10153.47 × 1011
CMT201.77 × 10146.68 × 1082.06 × 10141.41 × 1010
CMT301.57 × 1014˂1082.96 × 1014˂108
Table 7. Value of surface flashover threshold in vacuum of the Al2O3 ceramics.
Sample NumberUho, kV
Before Heat TreatmentAfter Heat Treatment
A-02725
CM112928
CMT053028
CMT103033
CMT202818
CMT302715
Disclaimer/Publisher’s Note: The statements, opinions and data contained in all publications are solely those of the individual author(s) and contributor(s) and not of MDPI and/or the editor(s). MDPI and/or the editor(s) disclaim responsibility for any injury to people or property resulting from any ideas, methods, instructions or products referred to in the content.