
Photocatalytic Evaluation and Application as a Sensor for the Toxic Atmospheres (Propane and Carbon Monoxide) of Nickel Antimonate (NiSb2O6) Powders


 and
and
Abstract
1. Introduction
2. Materials and Methods
2.1. Synthesis of NiSb2O6 Powders
2.2. Physical Characterization
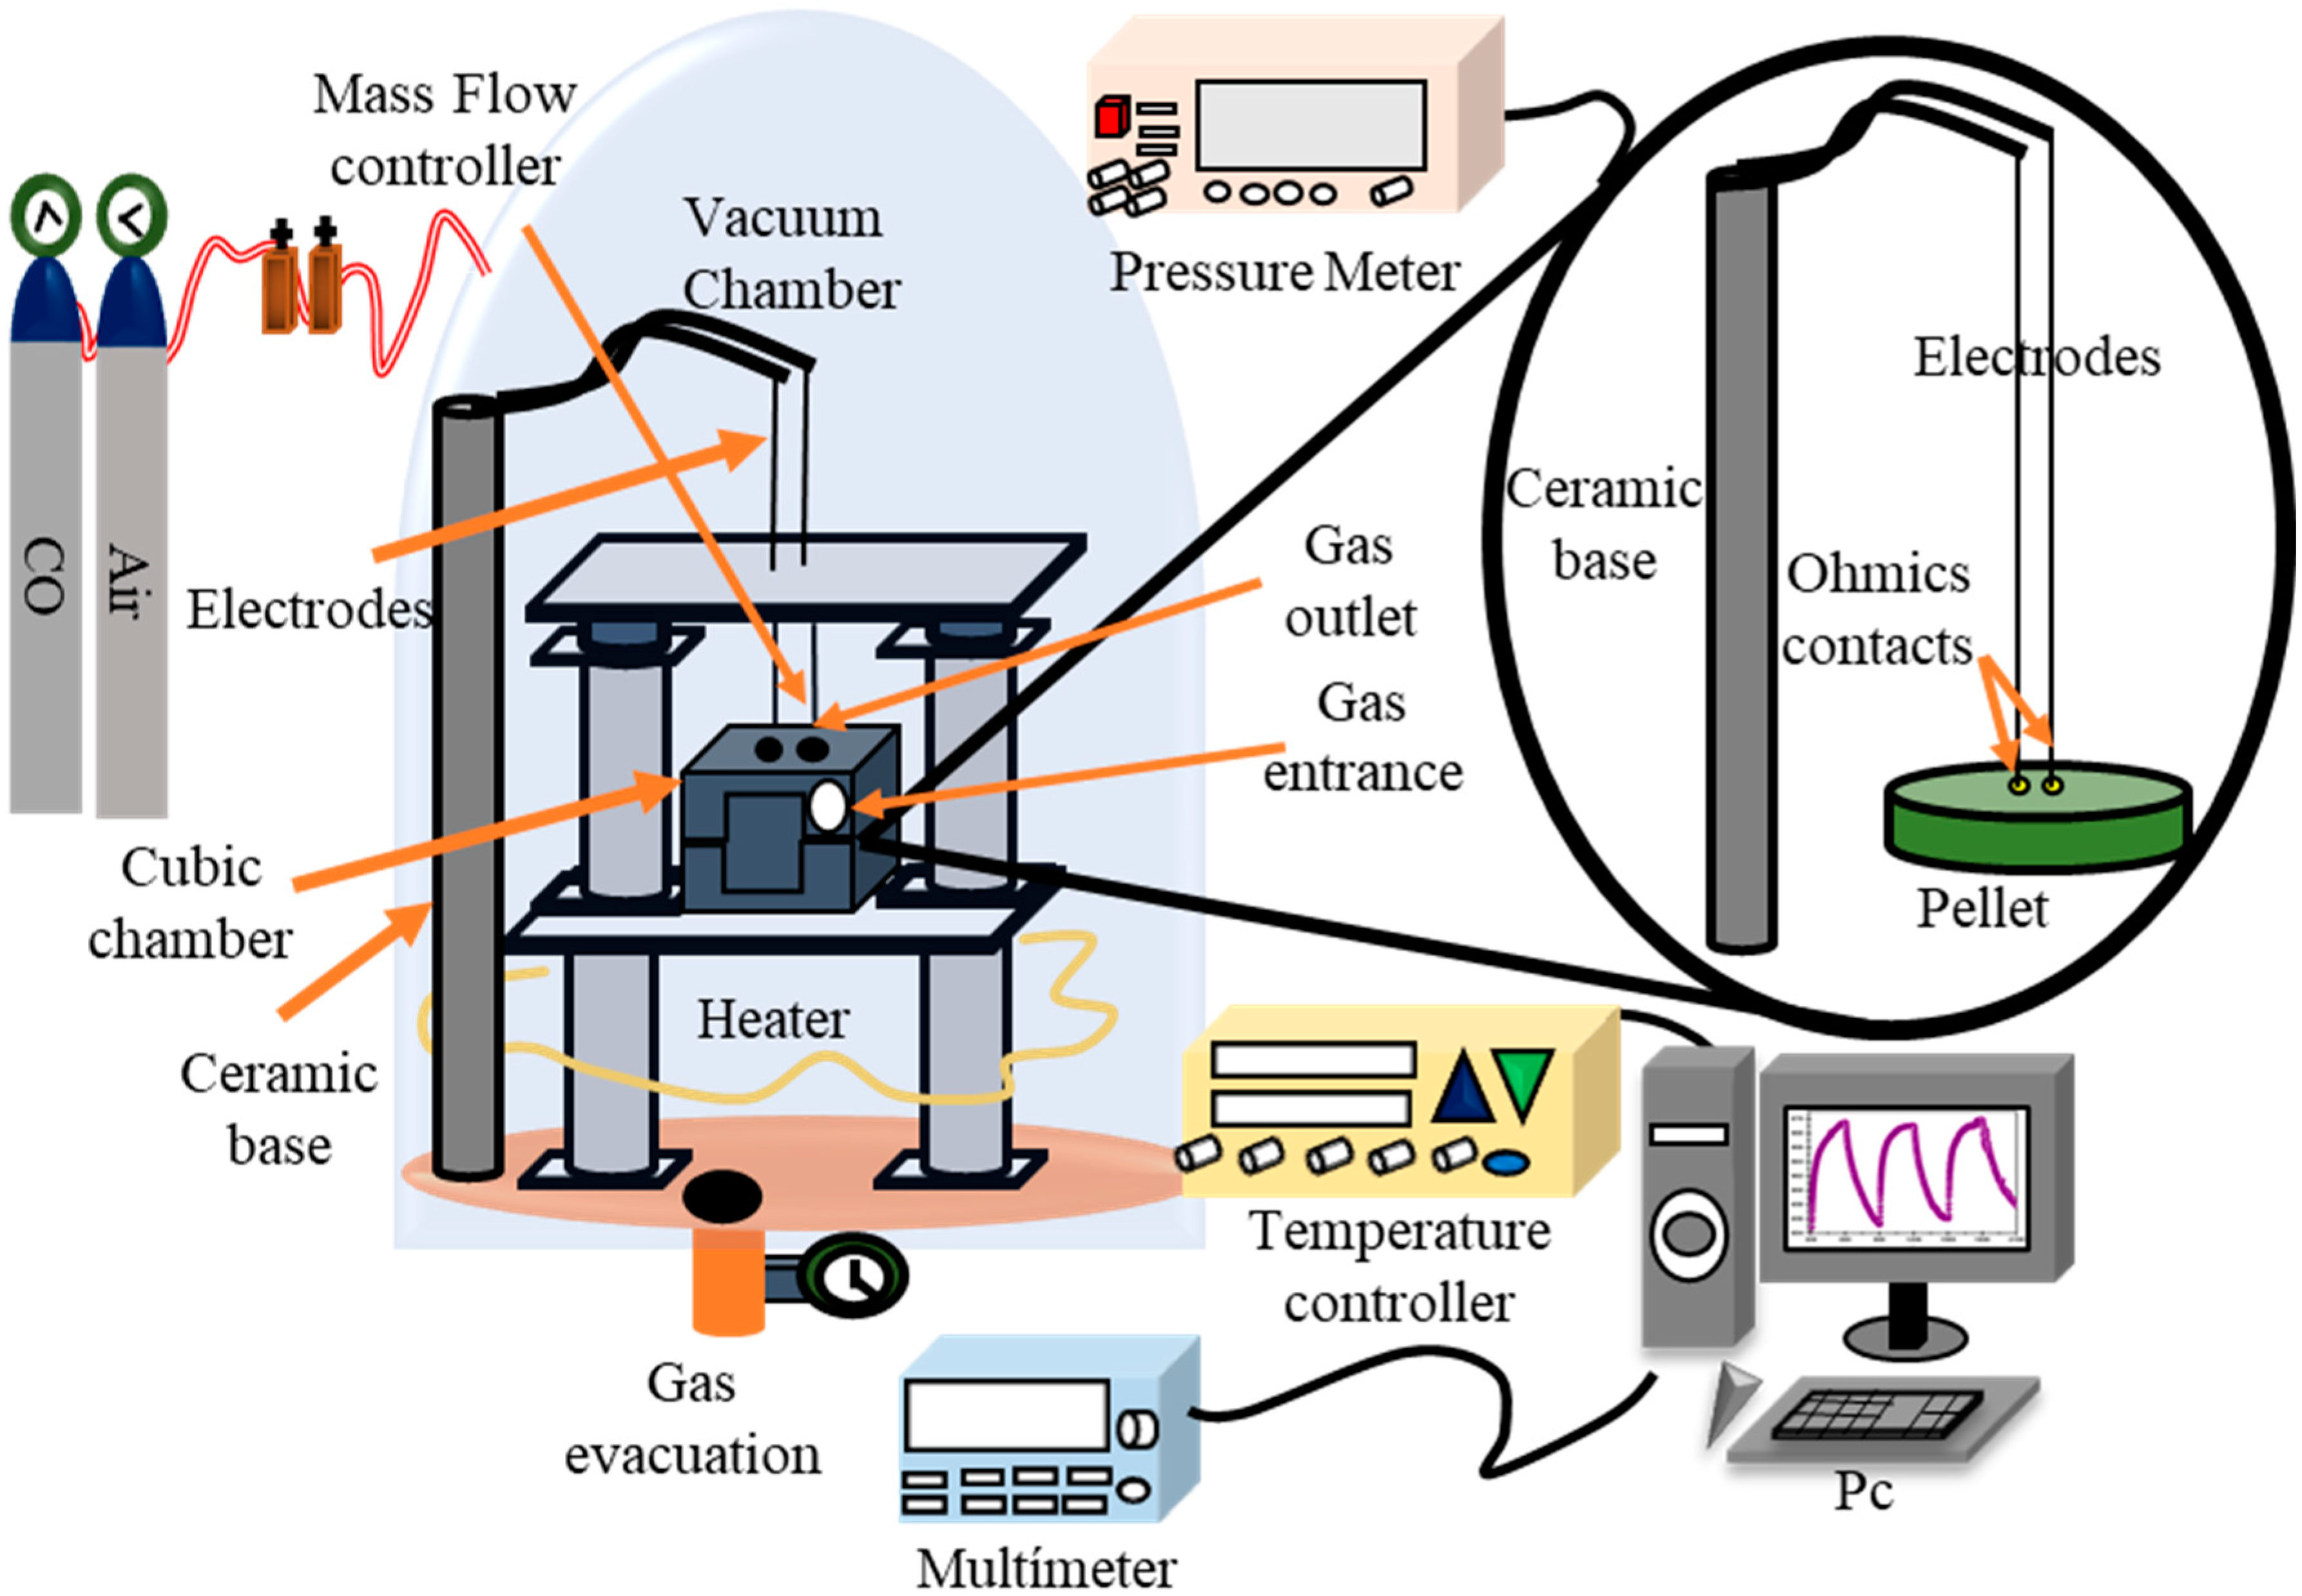
2.3. Gas Sensing Test
2.4. Photocatalytic Activity Test
3. Results
3.1. XRD Analysis
3.2. SEM Analysis
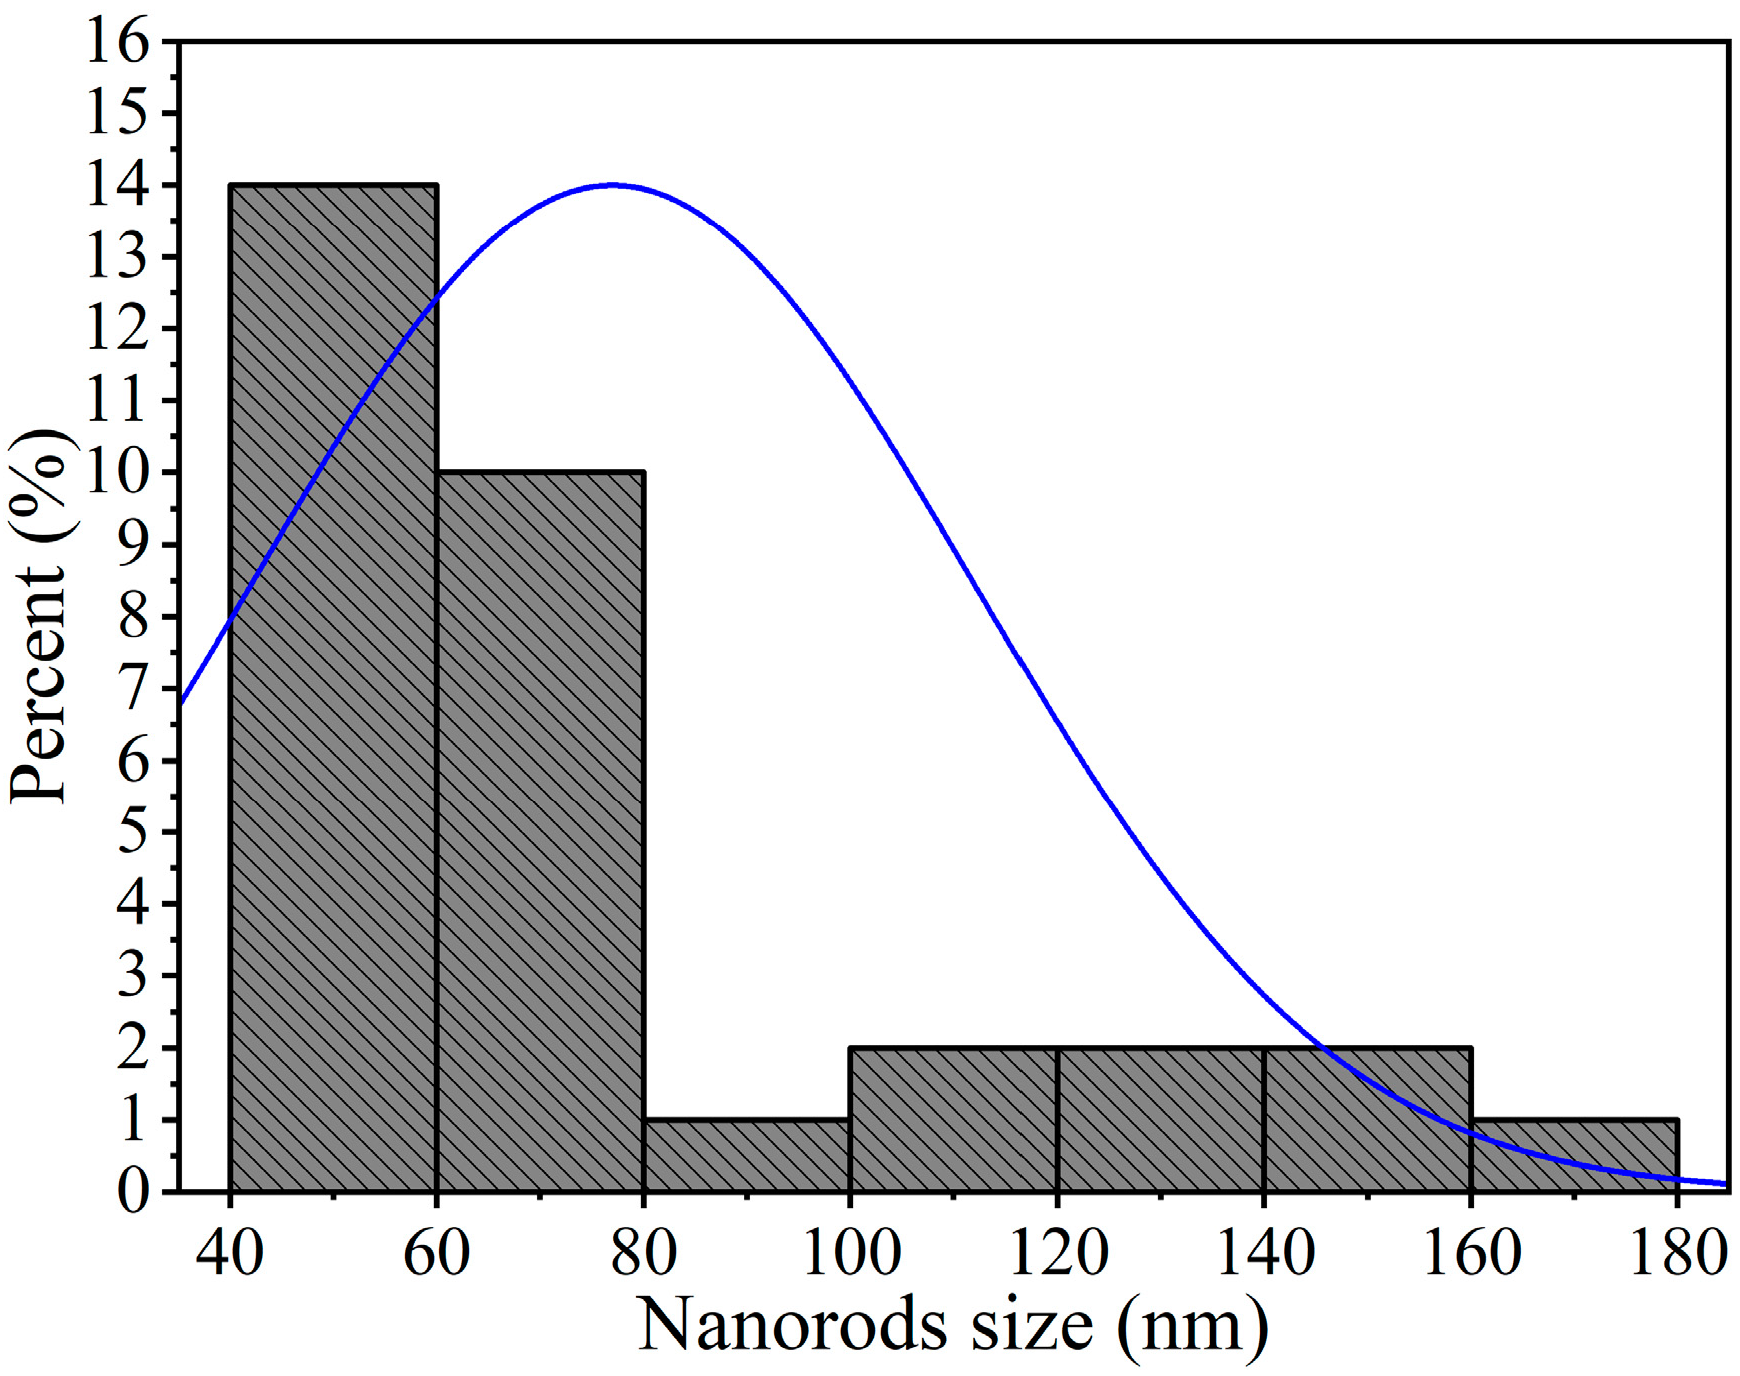
3.3. TEM Analysis
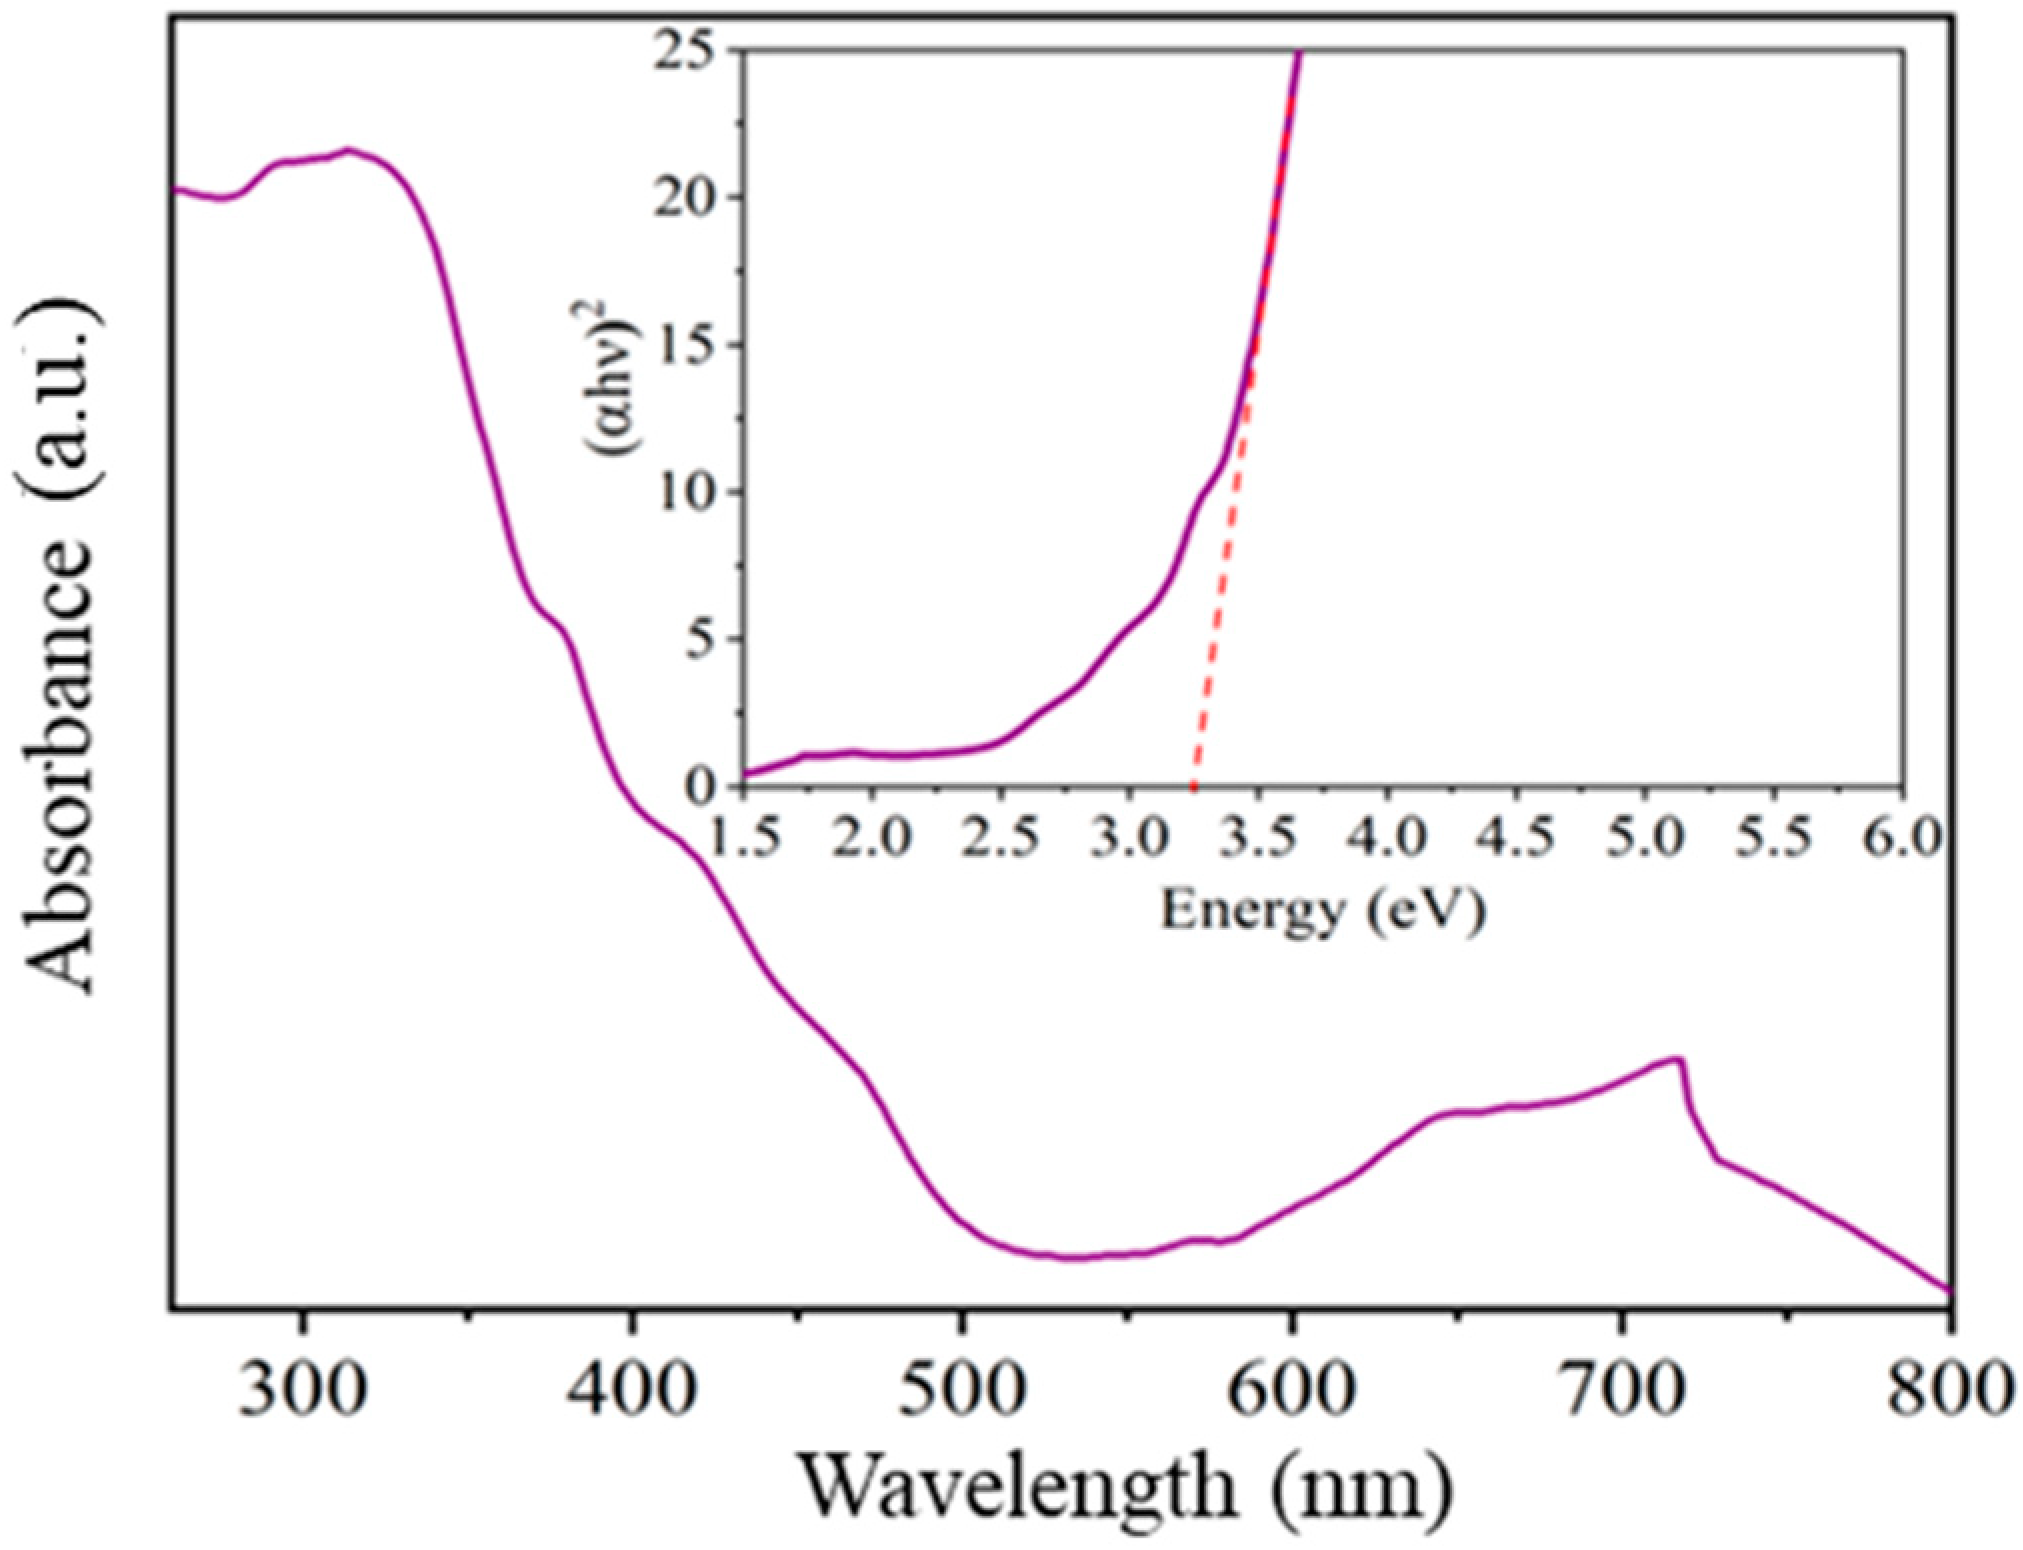
3.4. UV-Vis Analysis
3.5. Static Tests in CO and C3H8
3.6. Photocatalytic Tests
4. Conclusions
Author Contributions
Funding
Institutional Review Board Statement
Informed Consent Statement
Data Availability Statement
Acknowledgments
Conflicts of Interest
References
- Petrica Bala, G.; Râjnoveanu, R.-M.; Tudorache, E.; Motișan, R.; Oancea, C. Air pollution exposure the (in)visible risk factor for respiratory diseases. Environ. Sci. Pollut. Res. 2021, 28, 19615–19628. [Google Scholar] [CrossRef] [PubMed]
- Singh, A.; Agrawa, M. Acid rain and its ecological consequences. J. Environ. Biol. 2008, 29, 15–24. [Google Scholar] [PubMed]
- Masson, N.; Piedrahita, R.; Hannigan, M. Approach for quantification of metal oxide type semiconductor gas sensors used for ambient air quality monitoring. Sens. Actuators B 2015, 208, 339–345. [Google Scholar] [CrossRef]
- Dey, A. Semiconductor metal oxide gas sensors: A review. Mater. Sci. Eng. B 2018, 229, 206–217. [Google Scholar] [CrossRef]
- Deng, Z.; Meng, G.; Fang, X.; Dong, W.; Shao, J.; Wang, S.; Tong, B. A novel ammonia gas sensors based on p-type delafossite AgAlO2. J. Alloy. Compd. 2019, 17, 52–58. [Google Scholar] [CrossRef]
- Majura Bulemo, P.; Doo Kim, L. Recent advances in ABO3 perovskites: Their gas-sensing performance as resistive-type gas sensors. J. Korean Ceram. Soc. 2020, 57, 24–39. [Google Scholar] [CrossRef]
- Souri, M.; Amoli, H.S. Gas sensing mechanisms in ABO3 perovskite materials at room temperature: A review. Mater. Sci. Semicond. Process. 2023, 156, 107271. [Google Scholar] [CrossRef]
- Zhang, C.; Liu, K.; Zheng, Z.; Debliquy, M. Defect engineering of nanostructured ZnSnO3 for conductometric room temperature CO2 sensors. Sens. Actuators B Chem. 2023, 384, 133628. [Google Scholar] [CrossRef]
- Li, Y.; Yuan, Z.; Meng, F. Spinel-Type Materials Used for Gas Sensing: A Review. Sensors 2020, 20, 5413. [Google Scholar] [CrossRef]
- Singh, S.; Singh, A.; Singh, A.; Rathore, S.; Yadav, B.-C.; Tandon, P. Nanostructured cobalt antimonate: A fast responsive and highly stable sensing material for liquefied petroleum gas detection at room temperature. RSC Adv. 2020, 10, 33770. [Google Scholar] [CrossRef]
- Guillén-Bonilla, H.; Flores-Martínez, M.; Rodríguez-Betancourtt, V.-M.; Guillen-Bonilla, A.; Reyes-Gómez, J.; Gildo-Ortiz, L.; de la Luz Olvera Amador, M.; Santoyo-Salazar, J. A Novel Gas Sensor Based on MgSb2O6 Nanorods to Indicate Variations in Carbon Monoxide and Propane Concentrations. Sensors 2016, 16, 177. [Google Scholar] [CrossRef]
- Michel, C.-R.; López-Contreras, N.-L.; López-Alvarez, M.-A.; Martínez-Preciado, A.-H. Gas selectivity of nanostructured ZnSb2O6 synthesized by a colloidal method. Sens. Actuators B Chem. 2012, 171–172, 686–690. [Google Scholar] [CrossRef]
- Singh, A.; Singh, A.; Singh, S.; Tandon, P. Nickel antimony oxide (NiSb2O6): A fascinating nanostructured material for gas sensing application. Chem. Phys. Lett. 2016, 646, 41–46. [Google Scholar] [CrossRef]
- Rodríguez-Betancourtt, V.-M.; Guillén-Bonilla, H.; Flores-Martínez, M.; Guillen-Bonilla, A.; Moran-Lazaro, J.-P.; Guillen-Bonilla, J.-T.; González, M.-A.; de la Luz Olvera Amador, M. Gas Sensing Properties of NiSb2O6 Micro and Nanoparticles in Propane and Carbon Monoxide Atmospheres. J. Nanomater. 2017, 2017, 8792567. [Google Scholar] [CrossRef]
- Guerra, F.-D.; Attia, M.-F.; Whitehead, D.-C.; Alexis, F. Nanotechnology for Environmental Remediation: Materials and Applications. Molecules 2018, 23, 1760. [Google Scholar] [CrossRef] [PubMed]
- Ganie, A.-S.; Bano, S.; Nishat, K.; Sultana, S.; Rehman, Z.; Rahman-Mohammed, M.; Suhail, S.; Coulon, F.; Khan, M.-Z. Nanoremediation technologies for sustainable remediation of contaminated environments: Recent advances and challenges. Chemosphere 2021, 275, 130065. [Google Scholar] [CrossRef]
- Arunkumar, N.; Naraginti, S. Facile synthesis of nanostructured trirutile antimonates M(II)Sb2O6 (M = Co, Cu, Ni, Fe) and its visible photocatalytic studies. Inorg. Nano-Met. Chem. 2022, 52, 151–160. [Google Scholar] [CrossRef]
- Liu, W.; Lin, P.; Jin, H.; Xue, H.; Zhang, Y.; Li, Z. Nanocrystalline ZnSb2O6: Hydrothermal synthesis, electronic structure and photocatalytic activity. J. Mol. Catal. A Chem. 2011, 349, 80–85. [Google Scholar] [CrossRef]
- Zhang, M.; Chen, L.; Yao, S.; Long, Y.; Li, W.; Wang, Z. Effect of calcination temperature on the photocatalytic activity of CaSb2O6 nanoparticles prepared by co-precipitation method. Catal. Commun. 2014, 48, 29–32. [Google Scholar] [CrossRef]
- Sunku, M.; Venkataswamy, P.; Bindu-Hima, G.; Srilekha, P.; Srinivas, M.; Vithal, M. A Novel Approach for Generation of Oxygen Vacancies in Trirutile MnSb2O6 and Their Impact on Photocatalytic Degradation of MO Dye. Eur. J. Inorg. Chem. 2022, 26, e202200550. [Google Scholar]
- Papi, N.; Hakimyfard, A.; Tahmasebi, N.; Samimifar, M. Photocatalytic degradation of water pollutant dye by solid state synthesized Ni1-xLnxSb2O6 (Ln=Eu, Gd, Ho and Yb) nanocomposites. Int. J. Nano Dimens. 2020, 11, 377–391. [Google Scholar]
- Ramírez-Ortega, J.A.; Guillén-Bonilla, J.T.; Guillén-Bonilla, A.; Rodríguez-Betancourtt, V.M.; Gildo-Ortiz, L.; Blanco-Alonso, O.; Soto-García, V.M.; Jiménez-Rodríguez, M.; Guillén-Bonilla, H. Preparation of powders containing Sb, Ni, and O for the design of a novel CO and C3H8 sensor. Appl. Sci. 2021, 11, 9536. [Google Scholar] [CrossRef]
- Guillén, H.; Rodríguez Betancourtt, V.M.; Guillen, J.T.; Gildo, L.; Guillen, A.; Casallas, Y.; Blanco, O.; Reyes, J. Sensitivity tests of pellets made from manganese antimonate nanoparticles in carbon monoxide and propane atmospheres. Sensors 2018, 18, 2299. [Google Scholar] [CrossRef] [PubMed]
- Mahajan, S.; Jagtap, S. Metal-oxide semiconductors for carbon monoxide (CO) gas sensing: A review. Appl. Mater. Today 2020, 18, 100483. [Google Scholar] [CrossRef]
- Sahoo, R.; Santra, S.; Ray, C.; Pal, A.; Negishi, Y.; Ray, S.K.; Pal, T. Hierarchical growth of ZnFe2O4 for sensing applications. New J. Chem. 2016, 40, 1861–1871. [Google Scholar] [CrossRef]
- Kato, M.; Kajimoto, K.; Yoshimura, K.; Kosuge, K.; Masakazu, N.; Kakurai, K. Magnetic Structure of CuSb2O6. J. Phys. Soc. Jpn. 2002, 71, 187–189. [Google Scholar] [CrossRef]
- Waseda, Y.; Matsubara, E.; Shinoda, K. X-Ray Diffraction Crystallography, 1st ed.; Springer: Aoba-Ku, Japan, 2011. [Google Scholar]
- Larcher, D.; Prakash, A.S.; Laffont, L.; Womes, M.; Jumas, J.C.; Olivier-Fourcade, J.; Hedge, M.S.; Tarascon, J.M. Reactivity of antimony oxides and MSb2O6 (M=Cu,Ni,Co), trirutile-type phases with metallic lithium. Electrochem. Soc. 2006, 153, 1778–1787. [Google Scholar]
- Hakimyfard, A. Effects of reaction temperature and raw material type on optical properties and crystal phase growth of Solid state synthesized NiSb2O6 nanomaterials. J. Adv. Mater. 2018, 5, 56–65. [Google Scholar]
- Wang, S.-F.; Sun, G.Z.; Fang, L.M.; Lei, L.; Xiang, X.; Zu, X.T. A comparative study of ZnAl2O4 nanoparticles synthesized from different aluminum salts for use as fluorescence materials. Sci. Rep. 2015, 5, 12849. [Google Scholar] [CrossRef]
- Barzinjy, A.A.; Salih, S.H.; Sadraden, Z.A.; Qadir, H.M. Nanostructured device in sensing applications: A review. Eurasian J. Sci. Eng. 2018, 4, 82–98. [Google Scholar]
- Esposito, S. “Traditional” sol-gel chemistry as a powerful tool for the preparation of supported metal and metal oxide catalysts. Materials 2019, 12, 668. [Google Scholar] [CrossRef]
- Arshadi, S.; Moghaddam, J.; Eskandarian, M. LaMer diagram approach to study the nucleation and growth of Cu2O nanoparticles using supersaturation theory. Korean J. Chem. Eng. 2014, 31, 2020–2026. [Google Scholar] [CrossRef]
- Deng, Z.-X.; Wang, C.; Sun, X.-M.; Li, Y.D. Structure-directing coordination template effect of ethylenediamine in formations of ZnS and ZnSe nanocrystallites via solvothermal route. Inorg. Chem. 2002, 41, 869–873. [Google Scholar] [CrossRef]
- Li, Y.; Hu, Y.; Peng, S.; Lu, G.; Li, S. Synthesis of CdS Nanorods by an Ethylenediamine Assisted Hydrothermal Method for Photocatalytic Hydrogen Evolution. J. Phys. Chem. C 2009, 113, 9352–9358. [Google Scholar] [CrossRef]
- Singh, J.; Bhardwaj, N.; Uma, S. Single step hydrothermal based synthesis of M(II)Sb2O6 (M = Cd and Zn) type antimonates and their photocatalytic properties. Bull. Mater. Sci. 2013, 36, 287–291. [Google Scholar] [CrossRef]
- Guillén-Bonilla, A.; Rodríguez-Betancourtt, V.M.; Guillén-Bonilla, J.T.; Sánchez-Martínez, A.; Gildo-Ortiz, L.; Santoyo-Salazar, J.; Morán-Lázaro, J.P.; Guillén-Bonilla, H.; Blanco-Alonso, O. A novel CO and C3H8 sensor made of CuSb2O6 nanoparticles. Ceram. Int. 2017, 43, 13635–13644. [Google Scholar] [CrossRef]
- Balamurugan, C.; Maheswari, A.R.; Lee, D.W. Structural, optical, and selective ethanol sensing properties of p-type semiconducting CoNb2O6 nanopowder. Sens. Actuators B Chem. 2014, 205, 289–297. [Google Scholar] [CrossRef]
- Barakat, A.; Al Noaimi, M.; Suleiman, M.; Aldwayyan, A.; Hammouti, B.; Hadda, T.; Haddad, S.; Boshaala, A.; Warad, I. One step synthesis of NiO nanoparticles via solid-state thermal decomposition at low-temperature of novel aqua (2,9-dimethyl-1,10-phenanthroline) NiCl2 complex. Int. J. Mol. Sci. 2013, 14, 23941–23954. [Google Scholar] [CrossRef] [PubMed]
- Viezbicke, B.D.; Patel, S.; Davis, B.E.; Birnie, D.P., III. Evaluation of the Tauc method for optical absorption edge determination: ZnO thin films as a model system. Phys. Status Solidi B 2015, 252, 1700–1710. [Google Scholar] [CrossRef]
- Du, X.; Du, Y.; George, S.M. CO Gas Sensing by Ultrathin Tin Oxide Films Grown by Atomic Layer Deposition Using Transmission FTIR Spectroscopy. J. Phys. Chem. A 2008, 112, 9211–9219. [Google Scholar] [CrossRef]
- Wang, C.; Yin, L.; Zhang, L.; Xiang, D.; Gao, R. Metal oxide gas sensors: Sensitivity and influencing factors. Sensors 2010, 10, 2088–2106. [Google Scholar] [CrossRef] [PubMed]
- Vohs, J.M. Site requirements for the adsorption and reaction of oxygenates. Chem. Rev. 2013, 113, 4136–4163. [Google Scholar] [CrossRef] [PubMed]
- Nayyar, A.; Puri, V.; Le, D.-N. A comprehensive review of semiconductor-type gas sensors for environmental monitoring. Rev. Comput. Eng. Res. 2016, 3, 55–64. [Google Scholar] [CrossRef]
- Hua, Z.; Tian, C.; Huang, D.; Yuan, W.; Zhang, C.; Tian, X.; Wang, M.; Li, E. Power-law response of metal oxide semiconductor gas sensors to oxygen in presence of reducing gases. Sens. Actuators B Chem. 2018, 267, 510–518. [Google Scholar] [CrossRef]
- Jayaraman, V.K.; Maldonado Álvarez, A.; de la Luz Olvera Amador, M. A simple and cost-effective zinc oxide thin film sensor for propane gas detection. Mater. Lett. 2015, 157, 169–171. [Google Scholar] [CrossRef]
- Naz, F.; Saeed, K. Synthesis of barium oxide nanoparticles and its novel application as a catalyst for the photodegradation of malachite green dye. Appl. Water Sci. 2022, 12, 121. [Google Scholar] [CrossRef]
- Chang, C.J.; Hsu, M.-H.; Weng, Y.-C.; Tsay, C.-Y.; Lin, C.-K. Hierarchical ZnO nanorod-array films with enhanced photocatalytic performance. Thin Solid Film. 2013, 528, 167–174. [Google Scholar] [CrossRef]
- Zhang, S.; Du, Y.; Jiang, H.; Liu, Y.; Chen, R. Controlled synthesis of TiO2 nanorod arrays immobilized on ceramic membranes with enhanced photocatalytic performance. Ceram. Int. 2017, 43, 7261–7270. [Google Scholar] [CrossRef]
- Chang, Y.-C.; Lin, J.-C.; Wu, S.-H. One-step growth of Na2Ti3O7 nanorods for enhanced photocatalytic activities and recyclability. J. Alloy. Compd. 2018, 749, 955–960. [Google Scholar] [CrossRef]
- Wei, X.; Zhu, G.; Fang, J.; Chen, J. Characterization, and Photocatalysis of Well-Dispersible Phase-Pure Anatase TiO2 Nanoparticles. Int. J. Photoenergy 2013, 2013, 726872. [Google Scholar] [CrossRef]
- Xu, A.-W.; Gao, Y.; Liu, H.Q. The Preparation, Characterization, and their Photocatalytic Activities of Rare-Earth-Doped TiO2 Nanoparticles. J. Catal. 2002, 207, 151–157. [Google Scholar] [CrossRef]


| Trirutile Semiconductor | Analyte | Photocatalytic Performance (%) | Reference |
|---|---|---|---|
| CaSb2O6 | Methyl orange | 94 | 19 |
| CoSb2O6 | Acridine orange | 61 | 54 |
| MgSb2O6 | P-bromophenol | 89 | 53 |
| ZnSb2O6 | Methyl orange | 75 | 18 |
| MnSb2O6 | Methyl orange | 85 | 20 |
| CuSb2O6 | Rhodamine 6 g | 96 | 55 |
| NiSb2O6 | Malachite green | 96 | 21 |
Disclaimer/Publisher’s Note: The statements, opinions and data contained in all publications are solely those of the individual author(s) and contributor(s) and not of MDPI and/or the editor(s). MDPI and/or the editor(s) disclaim responsibility for any injury to people or property resulting from any ideas, methods, instructions or products referred to in the content. |
© 2023 by the authors. Licensee MDPI, Basel, Switzerland. This article is an open access article distributed under the terms and conditions of the Creative Commons Attribution (CC BY) license (https://creativecommons.org/licenses/by/4.0/).
Share and Cite
Morales-Bautista, J.; Guillén-Bonilla, H.; Guillén-Bonilla, A.; Rodríguez-Betancourtt, V.-M.; Ramírez-Ortega, J.A.; Guillén-Bonilla, J.T. Photocatalytic Evaluation and Application as a Sensor for the Toxic Atmospheres (Propane and Carbon Monoxide) of Nickel Antimonate (NiSb2O6) Powders. Materials 2023, 16, 5024. https://doi.org/10.3390/ma16145024
Morales-Bautista J, Guillén-Bonilla H, Guillén-Bonilla A, Rodríguez-Betancourtt V-M, Ramírez-Ortega JA, Guillén-Bonilla JT. Photocatalytic Evaluation and Application as a Sensor for the Toxic Atmospheres (Propane and Carbon Monoxide) of Nickel Antimonate (NiSb2O6) Powders. Materials. 2023; 16(14):5024. https://doi.org/10.3390/ma16145024
Chicago/Turabian StyleMorales-Bautista, Jacob, Héctor Guillén-Bonilla, Alex Guillén-Bonilla, Verónica-María Rodríguez-Betancourtt, Jorge Alberto Ramírez-Ortega, and José Trinidad Guillén-Bonilla. 2023. "Photocatalytic Evaluation and Application as a Sensor for the Toxic Atmospheres (Propane and Carbon Monoxide) of Nickel Antimonate (NiSb2O6) Powders" Materials 16, no. 14: 5024. https://doi.org/10.3390/ma16145024
APA StyleMorales-Bautista, J., Guillén-Bonilla, H., Guillén-Bonilla, A., Rodríguez-Betancourtt, V.-M., Ramírez-Ortega, J. A., & Guillén-Bonilla, J. T. (2023). Photocatalytic Evaluation and Application as a Sensor for the Toxic Atmospheres (Propane and Carbon Monoxide) of Nickel Antimonate (NiSb2O6) Powders. Materials, 16(14), 5024. https://doi.org/10.3390/ma16145024