
Preparation of MoS2 Nanospheres using a Hydrothermal Method and Their Application as Ammonia Gas Sensors Based on Delay Line Surface Acoustic Wave Devices


Abstract
1. Introduction
2. Materials and Methods
2.1. Preparation of Molybdenum Disulfide Nanospheres
2.2. Fabrication of Surface Acoustic Wave Devices
2.3. Sensor Fabrication
2.4. Material Analysis and Sensor Measurement
3. Results and Discussion
3.1. Performance of the Designed Surface Acoustic Wave Device
3.2. Characteristic Analysis of Molybdenum Disulfide
3.3. Analysis of Ammonia Gas Sensor
4. Conclusions
Author Contributions
Funding
Institutional Review Board Statement
Informed Consent Statement
Data Availability Statement
Conflicts of Interest
References
- Kampa, M.; Castanas, E. Human health effects of air pollution. Environ. Pollut. 2008, 2, 362–367. [Google Scholar] [CrossRef] [PubMed]
- Clappier, A.; Thunis, P.; Beekmann, M.; Putaud, J.; de Meij, A. Impact of SOx, NOx and NH3 emission reductions on PM2. 5 concentrations across Europe: Hints for future measure development. Environ. Int. 2021, 156, 106699. [Google Scholar] [CrossRef]
- Zhou, Y.; Li, X.; Wang, Y.; Tai, H.; Guo, Y. UV Illumination−enhanced molecular ammonia detection based on a ternary−reduced graphene oxide–titanium dioxide–Au composite film at room temperature. Anal. Chem. 2018, 5, 3311–3318. [Google Scholar] [CrossRef] [PubMed]
- Zhang, D.; Yang, Z.; Li, P.; Pang, M.; Xue, Q. Flexible self−powered high−performance ammonia sensor based on Au−decorated MoSe2 nanoflowers driven by single layer MoS2−flake piezoelectric nanogenerator. Nano Energy 2019, 65, 103974. [Google Scholar] [CrossRef]
- Li, H.-Y.; Lee, C.-S.; Kim, D.H.; Lee, J.-H. Flexible room−temperature NH3 sensor for ultrasensitive, selective, and humidity−independent gas detection. ACS Appl. Mater. Interfaces 2018, 33, 27858–27867. [Google Scholar] [CrossRef]
- Kumar, A.; Sanger, A.; Kumar, A.; Chandra, R. Fast response ammonia sensors based on TiO2 and NiO nanostructured bilayer thin films. RSC Adv. 2016, 81, 77636–77643. [Google Scholar] [CrossRef]
- Van Toan, N.; Hung, C.M.; Van Duy, N.; Hoa, N.D.; Le, D.T.T.; Van Hieu, N. Bilayer SnO2–WO3 nanofilms for enhanced NH3 gas sensing performance. Mater. Sci. Eng. B 2017, 224, 163–170. [Google Scholar] [CrossRef]
- Li, P.; Wang, B.; Qin, C.; Han, C.; Sun, L.; Wang, Y. Band−gap−tunable CeO2 nanoparticles for room−temperature NH3 gas sensors. Ceram. Int. 2020, 11, 19232–19240. [Google Scholar] [CrossRef]
- Perrozzi, F.; Emamjomeh, S.M.; Paolucci, V.; Taglieri, G.; Ottaviano, L.; Cantalini, C. Thermal stability of WS2 flakes and gas sensing properties of WS2/WO3 composite to H2, NH3 and NO2. Sens. Actuators B Chem. 2017, 243, 812–822. [Google Scholar] [CrossRef]
- Yan, W.; Hu, M.; Wang, D.; Li, C. Room temperature gas sensing properties of porous silicon/V2O5 nanorods composite. Appl. Surf. Sci. 2015, 346, 216–222. [Google Scholar] [CrossRef]
- Chen, X.; Zhao, S.; Zhou, P.; Cui, B.; Liu, W.; Wei, D.; Shen, Y. Room−temperature NO2 sensing properties and mechanism of CuO nanorods with Au functionalization. Sens. Actuators B Chem. 2021, 328, 129070. [Google Scholar] [CrossRef]
- Jakubik, W.; Powroźnik, P.; Wrotniak, J.; Krzywiecki, M. Theoretical analysis of acoustoelectrical sensitivity in SAW gas sensors with single and bi−layer structures. Sens. Actuators B Chem. 2016, 236, 1069–1074. [Google Scholar] [CrossRef]
- Rana, L.; Gupta, R.; Tomar, M.; Gupta, V. ZnO/ST−Quartz SAW resonator: An efficient NO2 gas sensor. Sens. Actuators B Chem. 2017, 252, 840–845. [Google Scholar] [CrossRef]
- Raj, V.B.; Tomar, M.; Nimal, A.; Sharma, M.U.; Gupta, V. Nano−crystalline SnO2 thin film based surface acoustic wave sensor for selective and fast detection of NO2 gas. Adv. Sci. Lett. 2014, 5–6, 1124–1128. [Google Scholar] [CrossRef]
- Wang, S.-H.; Shen, C.-Y.; Lien, Z.-J.; Wang, J.-H. Nitric oxide sensing properties of a surface acoustic wave sensor with copper−ion−doped polyaniline/tungsten oxide nanocomposite film. Sens. Actuators B Chem. 2017, 243, 1075–1082. [Google Scholar] [CrossRef]
- Jakubik, W.P. Surface acoustic wave−based gas sensors. Thin Solid Films 2011, 520, 986–993. [Google Scholar] [CrossRef]
- Wang, W.; Liu, X.; Mei, S.; Jia, Y.; Liu, M.; Xue, X.; Yang, D. Development of a Pd/Cu nanowires coated SAW hydrogen gas sensor with fast response and recovery. Sens. Actuators B Chem. 2019, 243, 157–164. [Google Scholar] [CrossRef]
- Akbari, E.; Jahanbin, K.; Afroozeh, A.; Yupapin, P.; Buntat, Z. Brief review of monolayer molybdenum disulfide application in gas sensor. Phys. B Condens. Matter 2018, 545, 510–518. [Google Scholar] [CrossRef]
- Chava, R.K.; Do, J.Y.; Kang, M. Hydrothermal growth of two dimensional hierarchical MoS2 nanospheres on one dimensional CdS nanorods for high performance and stable visible photocatalytic H2 evolution. Appl. Surf. Sci. 2018, 433, 240–248. [Google Scholar] [CrossRef]
- Bai, J.; Shen, Y.; Zhao, S.; Chen, Y.; Li, G.; Han, C.; Wei, D.; Yuan, Z.; Meng, F. Flower−like MoS2 hierarchical architectures assembled by 2D nanosheets sensitized with SnO2 quantum dots for high−performance NH3 sensing at room temperature. Sens. Actuators B Chem. 2022, 353, 131191. [Google Scholar] [CrossRef]
- Chung, C.-Y.; Chen, Y.-C.; Chung, C.-J.; Kao, K.-S. The photoluminescence responses of two−dimensional atomic layers of MoS2 excited by surface acoustic wave device. Mod. Phys. Lett. B 2022, 36, 2241004. [Google Scholar] [CrossRef]
- Tang, G.; Zhang, J.; Liu, C.; Zhang, D.; Wang, Y.; Tang, H.; Li, C. Synthesis and tribological properties of flower−like MoS2 microspheres. Ceram. Int. 2014, 40, 11575–11580. [Google Scholar] [CrossRef]
- Ballantine, D., Jr.; White, R.M.; Martin, S.J.; Ricco, A.J.; Zellers, E.; Frye, G.; Wohltjen, H. Acoustic Wave Sensors: Theory, Design and Physico–Chemical Applications; Elsevier: Amsterdam, The Netherlands, 1996. [Google Scholar]
- Morgan, D. Surface Acoustic Wave Filters: With Applications to Electronic Communications and Signal Processing; Academic Press: Cambridge, MA, USA, 2010; p. 9. [Google Scholar]
- Ricco, A.; Martin, S.; Zipperian, T. Surface acoustic wave gas sensor based on film conductivity changes. Sens. Actuators 1985, 8, 319–333. [Google Scholar] [CrossRef]
- Penza, M.; Aversa, P.; Cassano, G.; Wlodarski, W.; Kalantar, K. Layered SAW gas sensor with single−walled carbon nanotube−based nanocomposite coating. Sens. Actuators B Chem. 2007, 127, 168–178. [Google Scholar] [CrossRef]
- Tang, Y.-L.; Li, Z.-J.; Ma, J.-Y.; Su, H.-Q.; Guo, Y.-J.; Wang, L.; Du, B.; Chen, J.-J.; Zhou, W.; Yu, Q.-K. Highly sensitive room−temperature surface acoustic wave (SAW) ammonia sensors based on Co3O4/SiO2 composite films. J. Hazard. Mater. 2014, 280, 127–133. [Google Scholar] [CrossRef]
- Burman, D.; Raha, H.; Manna, B.; Pramanik, P.; Guha, P.K. Substitutional doping of MoS2 for superior gas−sensing applications: A proof of concept. ACS Sens. 2021, 6, 3398–3408. [Google Scholar] [CrossRef]
- Mak, K.F.; Lee, C.; Hone, J.; Shan, J.; Heinz, T.F. Atomically thin MoS2: A new direct−gap semiconductor. Phys. Rev. Lett. 2010, 105, 136805. [Google Scholar] [CrossRef]
- Wang, W.; Zhen, Y.; Zhang, J.; Li, Y.; Zhong, H.; Jia, Z.; Xiong, Y.; Xue, Q.; Yan, Y.; Alharbi, N.S. SnO2 nanoparticles−modified 3D−multilayer MoS2 nanosheets for ammonia gas sensing at room temperature. Sens. Actuators B Chem. 2020, 321, 128471. [Google Scholar] [CrossRef]
- Sharma, S.; Kumar, A.; Kaur, D. Room temperature ammonia gas sensing properties of MoS2 nanostructured thin film. In AIP Conference Proceedings; AIP Publishing LLC: Melville, NY, USA, 2018; p. 030261. [Google Scholar]
- Liu, B.; Chen, L.; Liu, G.; Abbas, A.N.; Fathi, M.; Zhou, C. High−performance chemical sensing using Schottky−contacted chemical vapor deposition grown monolayer MoS2 transistors. ACS Nano 2014, 8, 5304–5314. [Google Scholar] [CrossRef]
- Wenbo, L.; Rong, Q.; Shangjun, Z.; Hong, J.; Cheng, S.; Yueqin, Z. MoS2 with Different Morphologies: Preparation and Gas−sensing Property of NH3. J. Inorg. Mater. 2022, 37, 1135–1140. [Google Scholar]
- Constantinoiu, I.; Miu, D.; Viespe, C. Surface acoustic wave sensors for ammonia detection at room temperature based on SnO2/Co3O4 bilayers. J. Sens. 2019, 2019, 8203810. [Google Scholar] [CrossRef]
- Guo, Y.; Long, G.; Tang, Y.; Wang, J.; Tang, Q.; Zu, X.; Ma, J.; Du, B.; Torun, H.; Fu, Y. Surface acoustic wave ammonia sensor based on SiO2–SnO2 composite film operated at room temperature. Smart Mater. Struct. 2020, 29, 095003. [Google Scholar] [CrossRef]
- Tang, Y.; Ao, D.; Li, W.; Zu, X.; Li, S.; Fu, Y.Q. NH3 sensing property and mechanisms of quartz surface acoustic wave sensors deposited with SiO2, TiO2, and SiO2−TiO2 composite films. Sens. Actuators B Chem. 2018, 254, 1165–1173. [Google Scholar] [CrossRef]
- Xu, X.; Zu, X.; Ao, D.; Yu, J.; Xiang, X.; Xie, W.; Tang, Y.; Li, S.; Fu, Y. NH3−sensing mechanism using surface acoustic wave sensor with AlO (OH) film. Nanomaterials 2019, 9, 1732. [Google Scholar] [CrossRef]
- Zhao, L.; Wang, R.; Cao, Q. Highly Sensitive Surface Acoustic Wave NH3 Gas Sensor Based on TiO2 Film. Sens. Mater. 2020, 32, 4111–4119. [Google Scholar] [CrossRef]


| Precursors | pH1 | pH3 | pH5 |
|---|---|---|---|
| Element | Atomic % | Atomic % | Atomic % |
| S | 61.32 | 65.24 | 67.57 |
| Mo | 38.68 | 34.76 | 32.43 |
| Atomic ratio (S/Mo) | 1.59 | 1.88 | 2.08 |
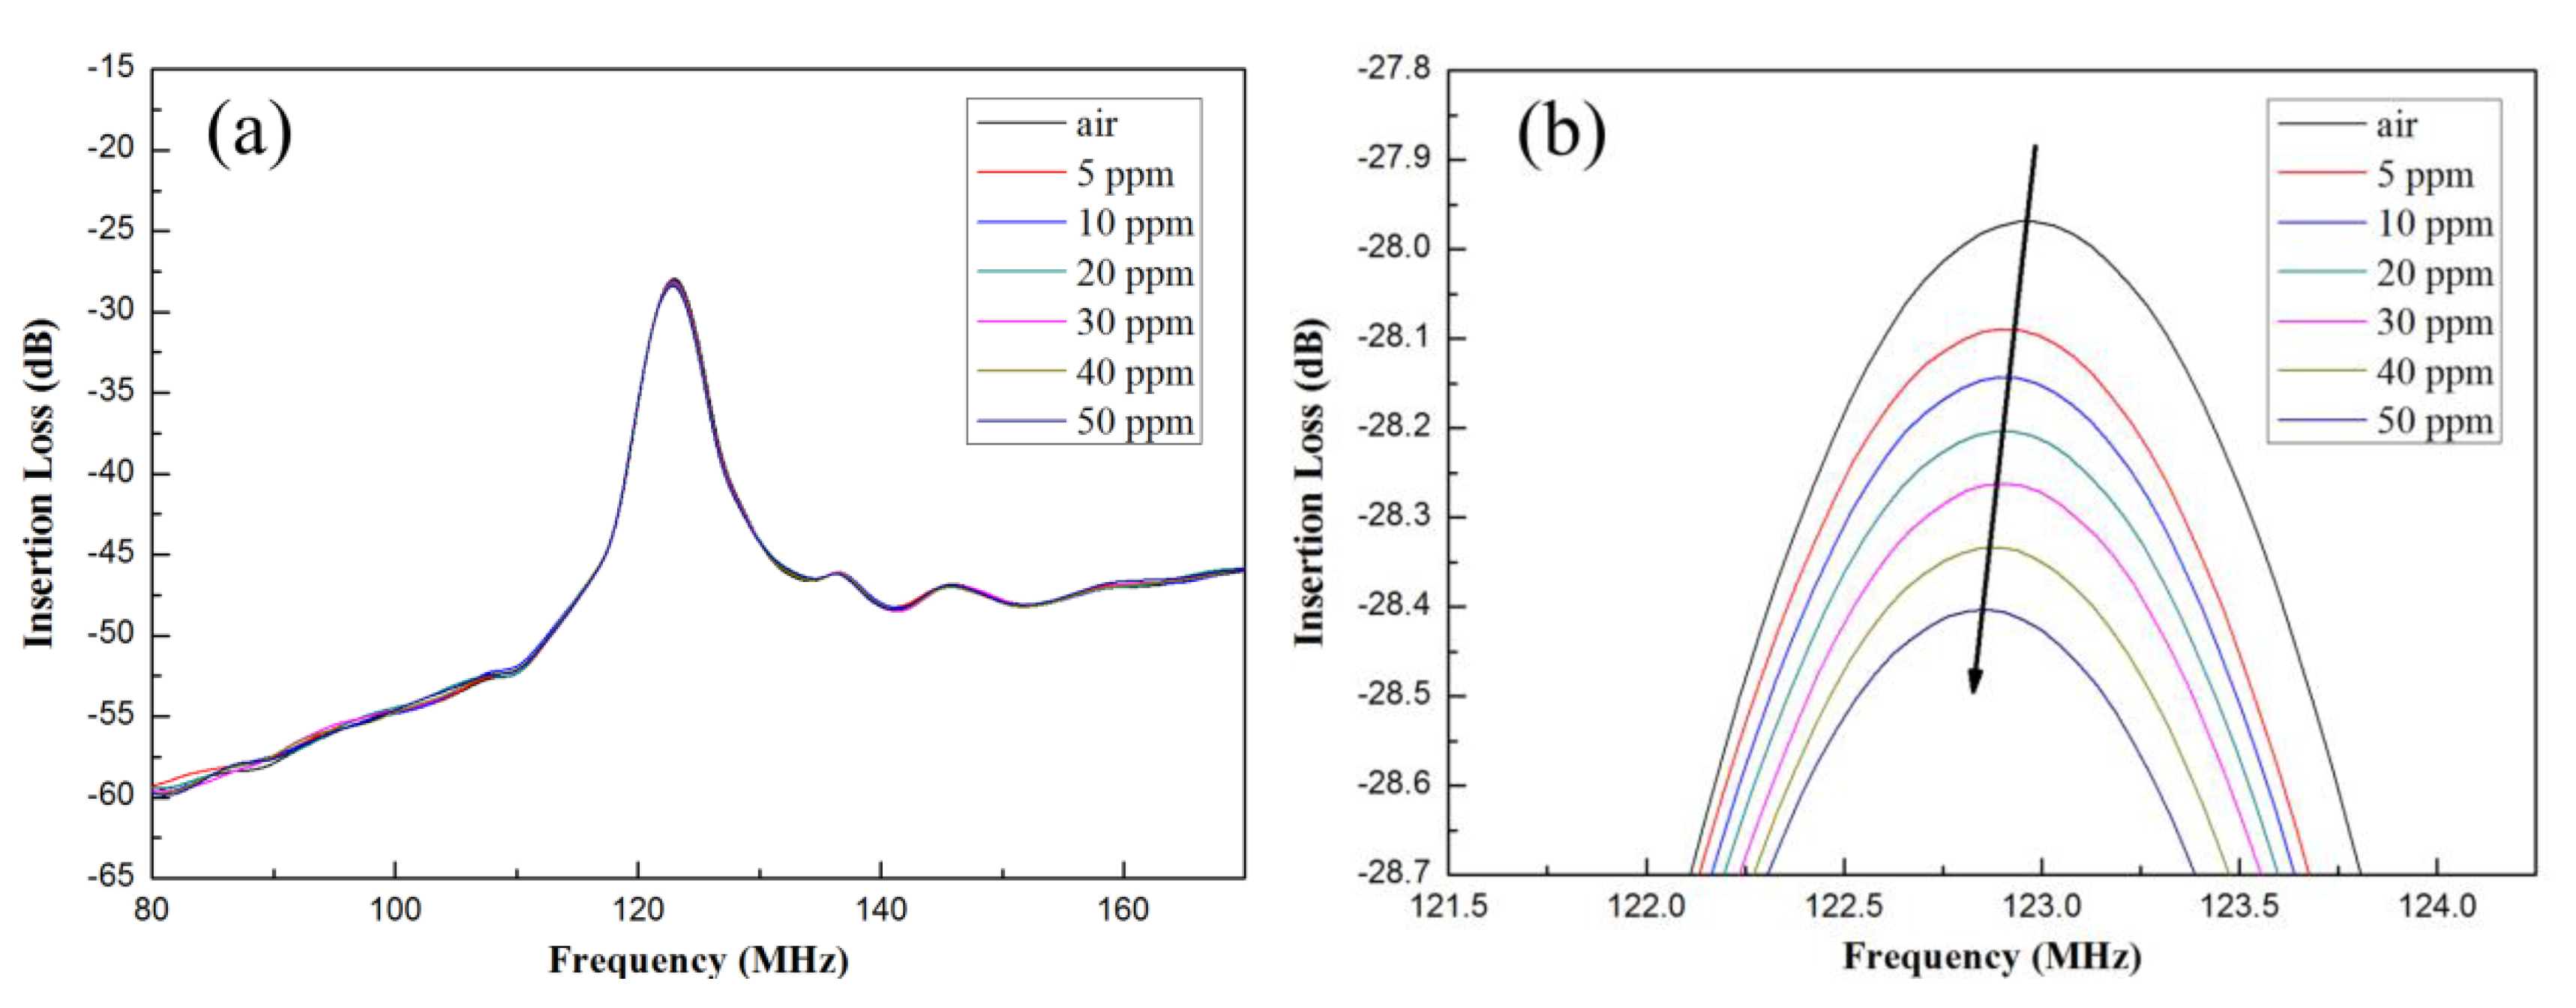
| Concentration of NH3 (in ppm) | Resonant Frequency (in MHz) | Shift in Frequency (in kHz) |
|---|---|---|
| 0 | 122.956197 | Reference |
| 5 | 122.931808 | 24.389 |
| 10 | 122.915316 | 40.881 |
| 20 | 122.898117 | 58.08 |
| 30 | 122.881384 | 74.813 |
| 40 | 122.864918 | 91.279 |
| 50 | 122.848529 | 107.668 |
Disclaimer/Publisher’s Note: The statements, opinions and data contained in all publications are solely those of the individual author(s) and contributor(s) and not of MDPI and/or the editor(s). MDPI and/or the editor(s) disclaim responsibility for any injury to people or property resulting from any ideas, methods, instructions or products referred to in the content. |
© 2023 by the authors. Licensee MDPI, Basel, Switzerland. This article is an open access article distributed under the terms and conditions of the Creative Commons Attribution (CC BY) license (https://creativecommons.org/licenses/by/4.0/).
Share and Cite
Chung, C.-Y.; Chen, Y.-C.; Juang, F.-R.; Kao, K.-S.; Lee, E.-I. Preparation of MoS2 Nanospheres using a Hydrothermal Method and Their Application as Ammonia Gas Sensors Based on Delay Line Surface Acoustic Wave Devices. Materials 2023, 16, 4703. https://doi.org/10.3390/ma16134703
Chung C-Y, Chen Y-C, Juang F-R, Kao K-S, Lee E-I. Preparation of MoS2 Nanospheres using a Hydrothermal Method and Their Application as Ammonia Gas Sensors Based on Delay Line Surface Acoustic Wave Devices. Materials. 2023; 16(13):4703. https://doi.org/10.3390/ma16134703
Chicago/Turabian StyleChung, Chan-Yu, Ying-Chung Chen, Feng-Renn Juang, Kuo-Sheng Kao, and En-I Lee. 2023. "Preparation of MoS2 Nanospheres using a Hydrothermal Method and Their Application as Ammonia Gas Sensors Based on Delay Line Surface Acoustic Wave Devices" Materials 16, no. 13: 4703. https://doi.org/10.3390/ma16134703
APA StyleChung, C.-Y., Chen, Y.-C., Juang, F.-R., Kao, K.-S., & Lee, E.-I. (2023). Preparation of MoS2 Nanospheres using a Hydrothermal Method and Their Application as Ammonia Gas Sensors Based on Delay Line Surface Acoustic Wave Devices. Materials, 16(13), 4703. https://doi.org/10.3390/ma16134703