Article

Synthesis and Evaluation of Engineering Properties of Polymer-Coated Glass Beads

1
School of Architectural, Civil and Environmental Engineering, Korea University, Seoul 02841, Republic of Korea
2
Department of Civil and Environmental Engineering, Hanyang University, Seoul 04763, Republic of Korea
3
Department of Civil Engineering, Chonnam National University, Gwangju 61186, Republic of Korea
*
Author to whom correspondence should be addressed.
Materials 2023, 16(12), 4476; https://doi.org/10.3390/ma16124476
Submission received: 16 May 2023 / Revised: 9 June 2023 / Accepted: 17 June 2023 / Published: 20 June 2023

Abstract

:
Modern construction projects are often challenging, which has increased the demand for innovative materials that ensure improved safety, durability, and functionality. To explore the potential of enhancing soil material functionality, this study synthesized polyurethane on the surface of glass beads and evaluated their mechanical properties. The synthesis of polymer proceeded according to a predetermined procedure, where the polymerization was confirmed through analysis of chemical structure by Fourier transform infrared spectroscopy (FT-IR) and microstructure observation by a scanning electron microscope (SEM) after complete synthesis. The constrained modulus (M) and the maximum shear modulus (Gmax) of mixtures with synthesized materials were examined by using an oedometer cell equipped with bender elements under a zero lateral strain condition. Both M and Gmax decreased with an increase in the contents of polymerized particles due to a decrease in the number of interparticle contacts and contact stiffness induced by the surface modification. The adhesion property of the polymer induced a stress-dependent change in M but was observed to have little effect on Gmax. Compared to the behavior of the rubber-sand mixtures, polymerized particles show the advantage of a smaller reduction of M.

1. Introduction

In response to the sophistication of industrial structures and the diversification of social structures, contemporary construction projects require high-rise, large-scale, and lightweight structures, such as skyscrapers and long-span bridges. At the same time, demand for construction materials to improve the lifespan and maintenance efficiency of structures is increasing. As a result, the perception of construction materials is changing to innovative, future-oriented materials that facilitate ongoing maintenance, ensure the safety and durability of buildings, and withstand extreme environmental conditions [1,2,3].
In civil engineering, soil is one of the fundamental and crucial construction materials when starting a construction project. The mechanical properties of soils are a result of extensive interactions between the solid soil particles and the materials filling the void spaces [4,5]. However, because raw soils do not satisfy the required engineering properties for construction projects, many attempts have been made to improve these properties for various applications. These methods can be broadly categorized into physical and chemical stabilization [6]. The former method aims to modify the physical properties or structure of soil, such as through compaction, mixing of anomalous materials, etc. [6,7,8,9]. On the other hand, the latter method improves the soils’ properties by changing the chemical composition of soils by applying cement, lime, etc. [1,2,6,10,11]. However, these conventional methods achieved soil improvement with the help of additional materials such as anomalous materials, cement and lime rather than improving the properties of the geomaterial itself.
Unlike the described methods, this study attempts to improve the fundamental function of geomaterial by synthesizing a polymeric material directly on the surface of glass beads. Among the various polymers used in civil engineering, rubber-like polymers are selected herein because they exhibit unique properties when mixed with geomaterials. Rubber is a ductile material with a strong damping property, and it has been evaluated in various usages such as subgrade material, lightweight backfill, retaining wall, slope stability, and retaining wall when mixed with soil [12,13,14,15]. The inclusion of soft rubber into soils can change the physical properties of soils, including extreme void ratios, hydraulic characteristics, elastic modulus, and friction angle [16,17,18,19,20], as well as the dynamic properties of soils, such as damping ratio and degradation curves of damping ratio and normalized shear [19,21,22,23,24,25]. However, because rubber is highly ductile, an increase in compressibility and decrease in shear modulus are to be expected as the rubber content in a soil-rubber mixture increase. To confirm the polymerization on the surface of the glass beads, FT-IR (Fourier transform infrared spectroscopy) analysis and visual observation of the surface morphology using SEM (scanning electron microscopy) are performed. Then, the effect of polymerized glass bead content on the compressibility and small strain stiffness is investigated through modified one-dimensional compression tests with bender elements. Compared to the physical combination of a rubber-soil mixture, the introduction of surface-modified glass beads with rubber-like polymer is expected to exhibit distinct engineering properties due to modified contact interactions. In particular, it is expected to function as a composite material that exhibits the behavior of both the rubber and the soil.

2. Experimental Program

In this study, polyurethane was polymerized at the surface of pretreated mono-sized spherical glass beads. The mechanical properties of the surface-modified particle mixtures were then measured by performing a one-dimensional compression test with an instrumented oedometer cell. The experimental process is summarized in the flowchart outlined in Figure 1, and the details are described in the following sections.

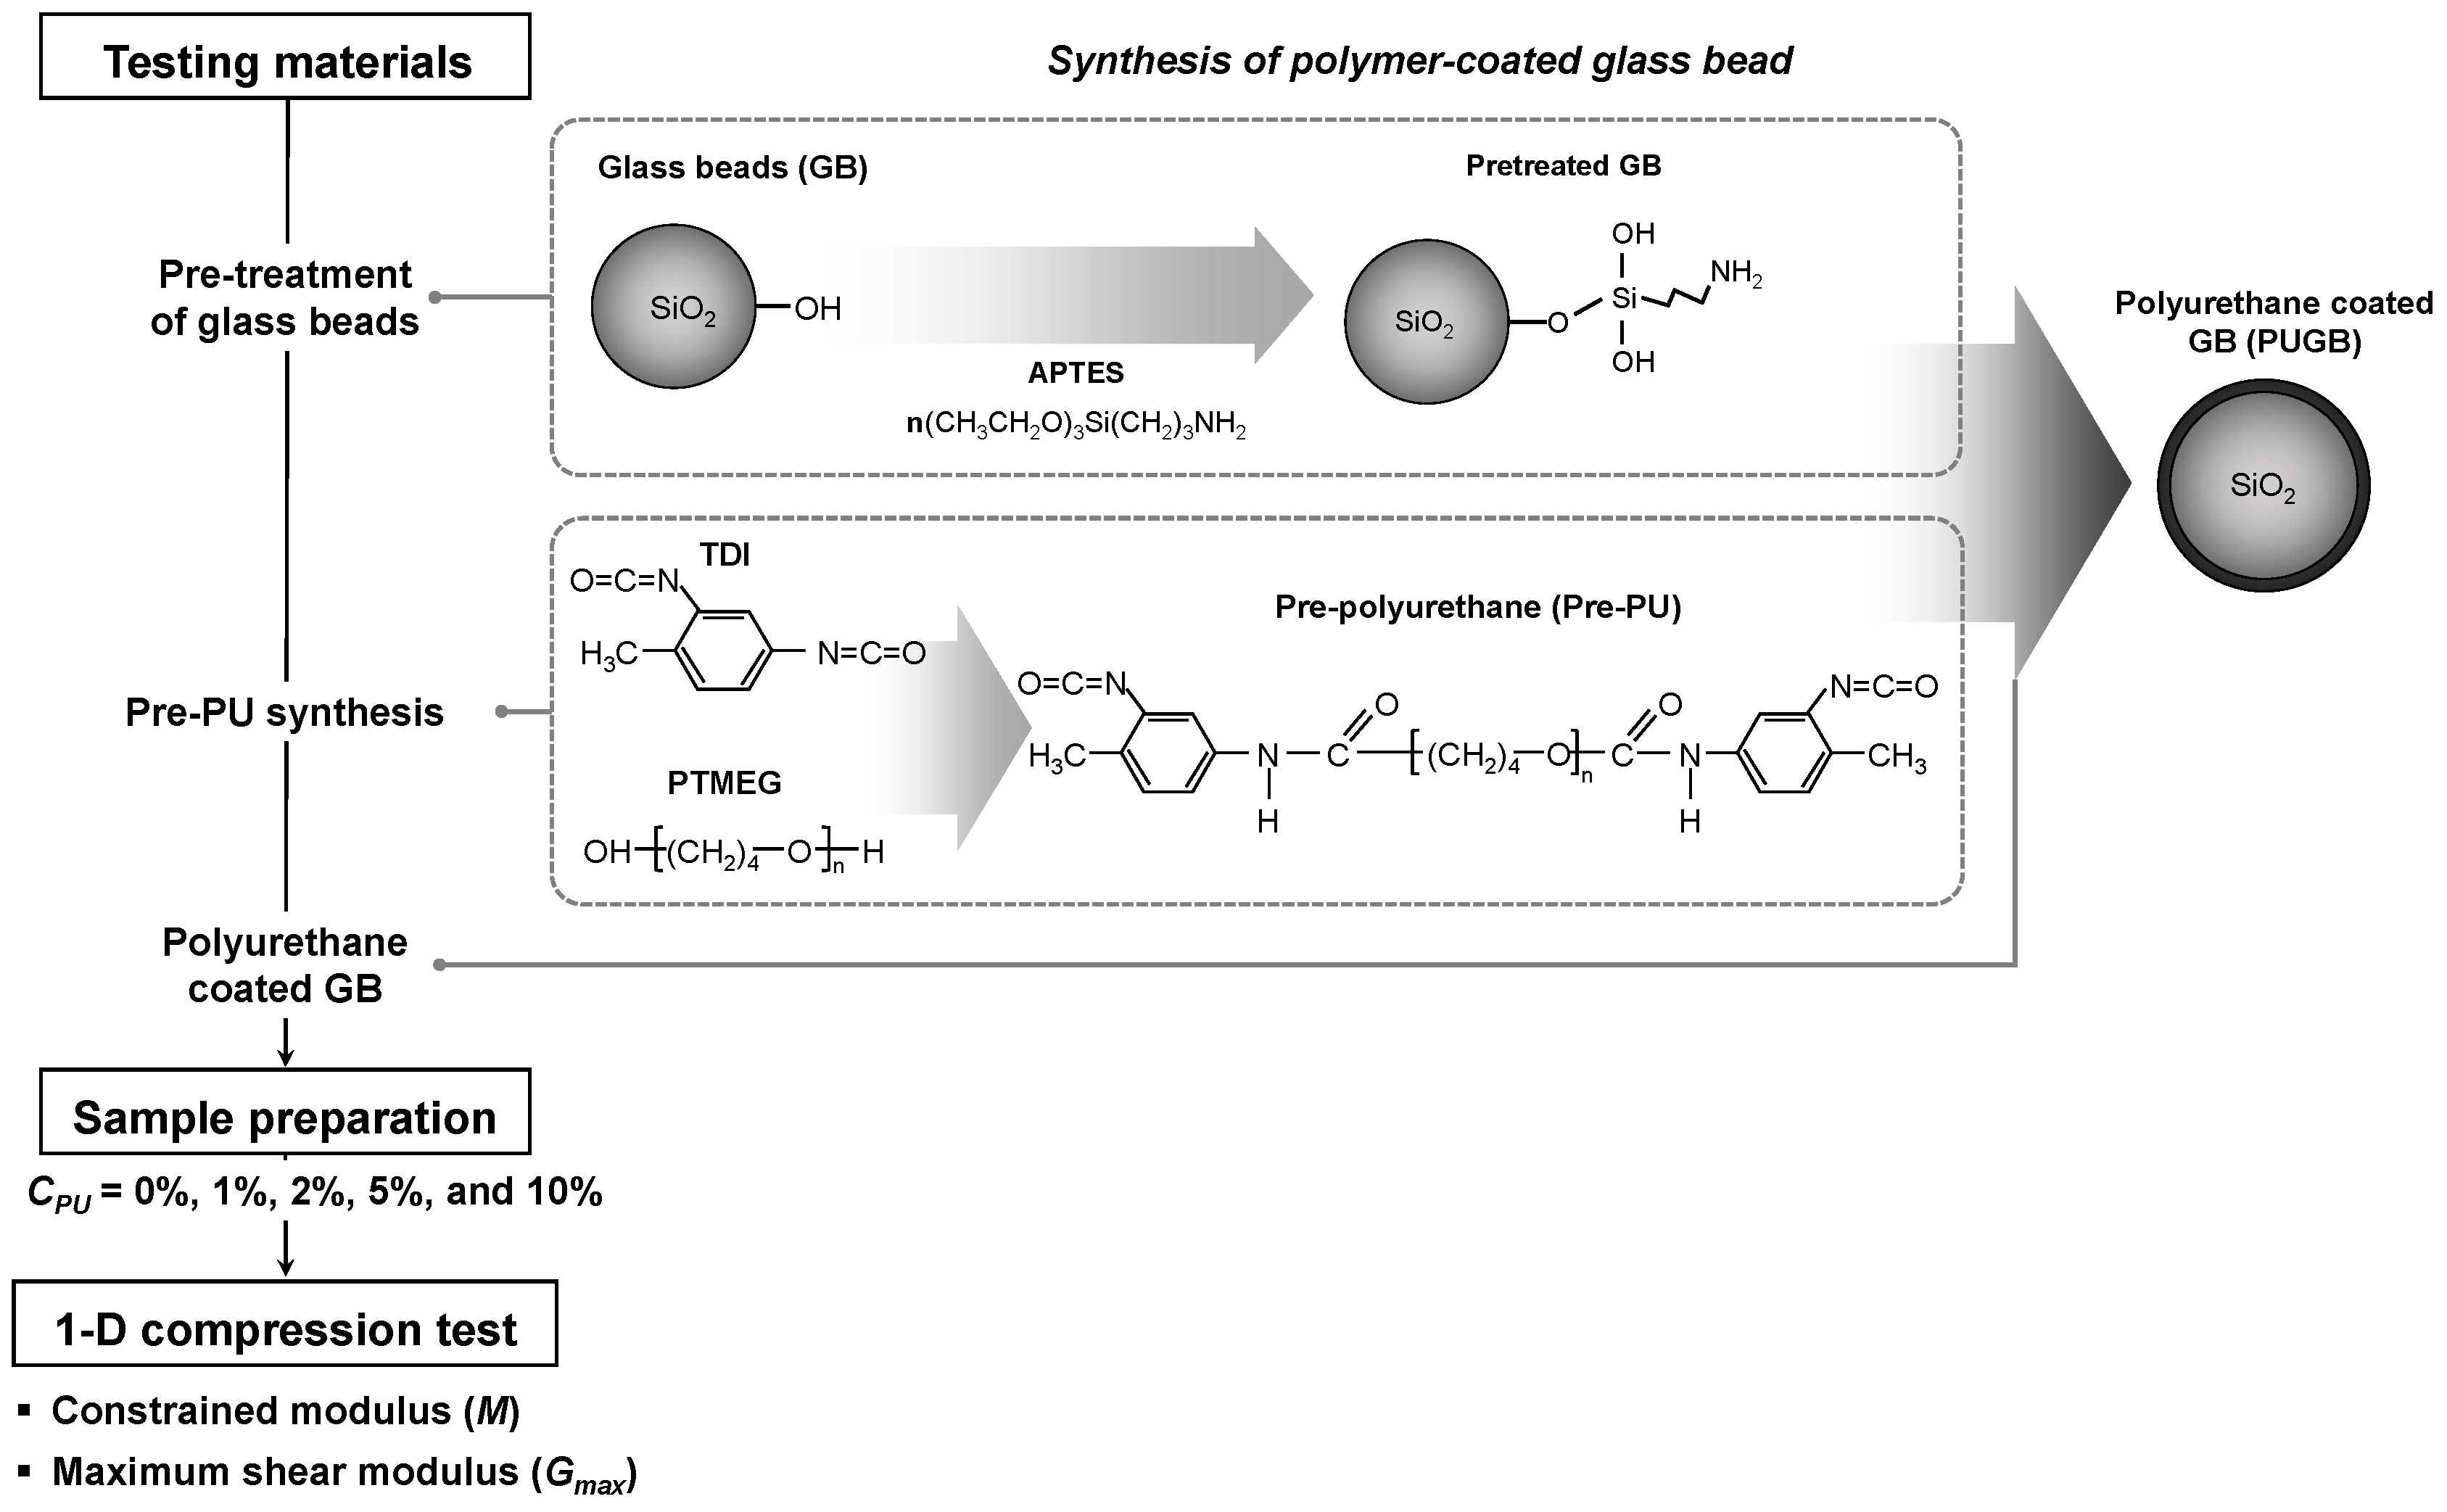
2.1. Testing Materials

The mono-sized spherical glass beads (GB, B&K Media Co., Ltd., Hwaseong, Gyeonggi, Korea) were used to avoid particle shape and size effects. The specific gravity (Gs) of the GBs is 2.48 (ASTM D854), and the median particle size (D50) of GB is 0.51 mm (ASTM D6913). Other index properties are listed in Table 1. Before the synthesizing process, the pretreatment of GB was conducted using the silane coupling agent: 3-aminopropyltriethoxysilane (APTES, Sigma Aldrich, St. Louis, MO, USA). For the pre-polyurethane synthesis, toluene diisocyanate (TDI; the isomer mixture ratio between 2,4- and 2,6-TDI was 80:20) (Sigma Aldrich) and poly tetramethylene ether glycol (PTMEG, 1000 g/mol) (Sigma Aldrich) were prepared. Two types of TDI were mixed in the weight ratio of 80:20. APTES and PTMEG were dehydrated under vacuum drying at 80 °C for 12 h before use [26].

2.2. Synthesis of Polyurethane-Coated Glass Bead (PUGB)

Surface modification of the GBs was achieved through a rapid reaction between the NCO group and OH group, which allowed the silanol group (Si-OH) to react with the terminal isocyanate groups (R-N=C=O) of the polyurethane prepolymer (pre-PU) (Figure 1) [26]. Before synthesis, the GBs were first immersed in 1% (w/w) APTES in anhydrous toluene (99.8%, Samchun Chemicals, Seoul, Korea) [27] and stirred for 1 week to enhance the number of silanol groups on their surfaces. Thereafter, the GBs were washed with anhydrous toluene, deionized water, and ethanol (Samchun Chemicals). The pre-PU was prepared using the method described by Chen et al. [26]: 0.052 mol of the dehydrated PTMEG was added to a three-necked flask and stirred at 80 °C for 30 min. Then, 0.103 mol of TDI was added to the flask to react with the PTMEG. The mixture was stirred for more than 1 h to induce an adequate reaction. The surface-modified GBs were then prepared by stirring a mixture of 1% (w/w) of pre-PU with the silane-treated GB at 80° for 24 h.

2.3. Sample Preparation and Experimental Procedure

The polyurethane-coated GB (PUGB) content in the mixture (CPU) was defined as the ratio of the weight of PUGB (WPUGB) to the weight of the total mixture (Wt), as follows:
C P U = W P U G B W t = W P U G B W G B + W P U G B
where WGB is weight of the pure GBs. Five different mixtures were prepared with different CPU values of 0% (i.e., pure GB), 1%, 2%, 5%, and 10% to explore the effects of CPU on the behavior of the mixture. An instrumented oedometer cell mounted with the bender elements was used to investigate the stress-dependent and small-strain characteristics of the mixtures under the zero lateral strain condition. The inner diameter and height of the cell were 100 mm and 72.5 mm, respectively. A pair of bender elements was installed on the top cap and another pair on the bottom plate to measure the shear wave velocity (Vs). The shear wave velocity was calculated based on the first arrival time (tfirst) and tip-to-tip distance between the bender elements (Ltip-to-tip) [28]. A predetermined amount of the mixture was poured into the cell. For each CPU, the mixtures were consistently prepared to three different relative densities (Dr) of 40%, 60%, and 80%. The mixture was loaded to 450 kPa with a load increment ratio of 1 and unloaded to ~1 kPa. A linear variable displacement transducer (LVDT) with a precision of 0.001 mm was used to monitor the vertical displacement of the mixtures during the loading and unloading steps. Vertical settlement and shear wave were measured in each step.

3. Experimental Results

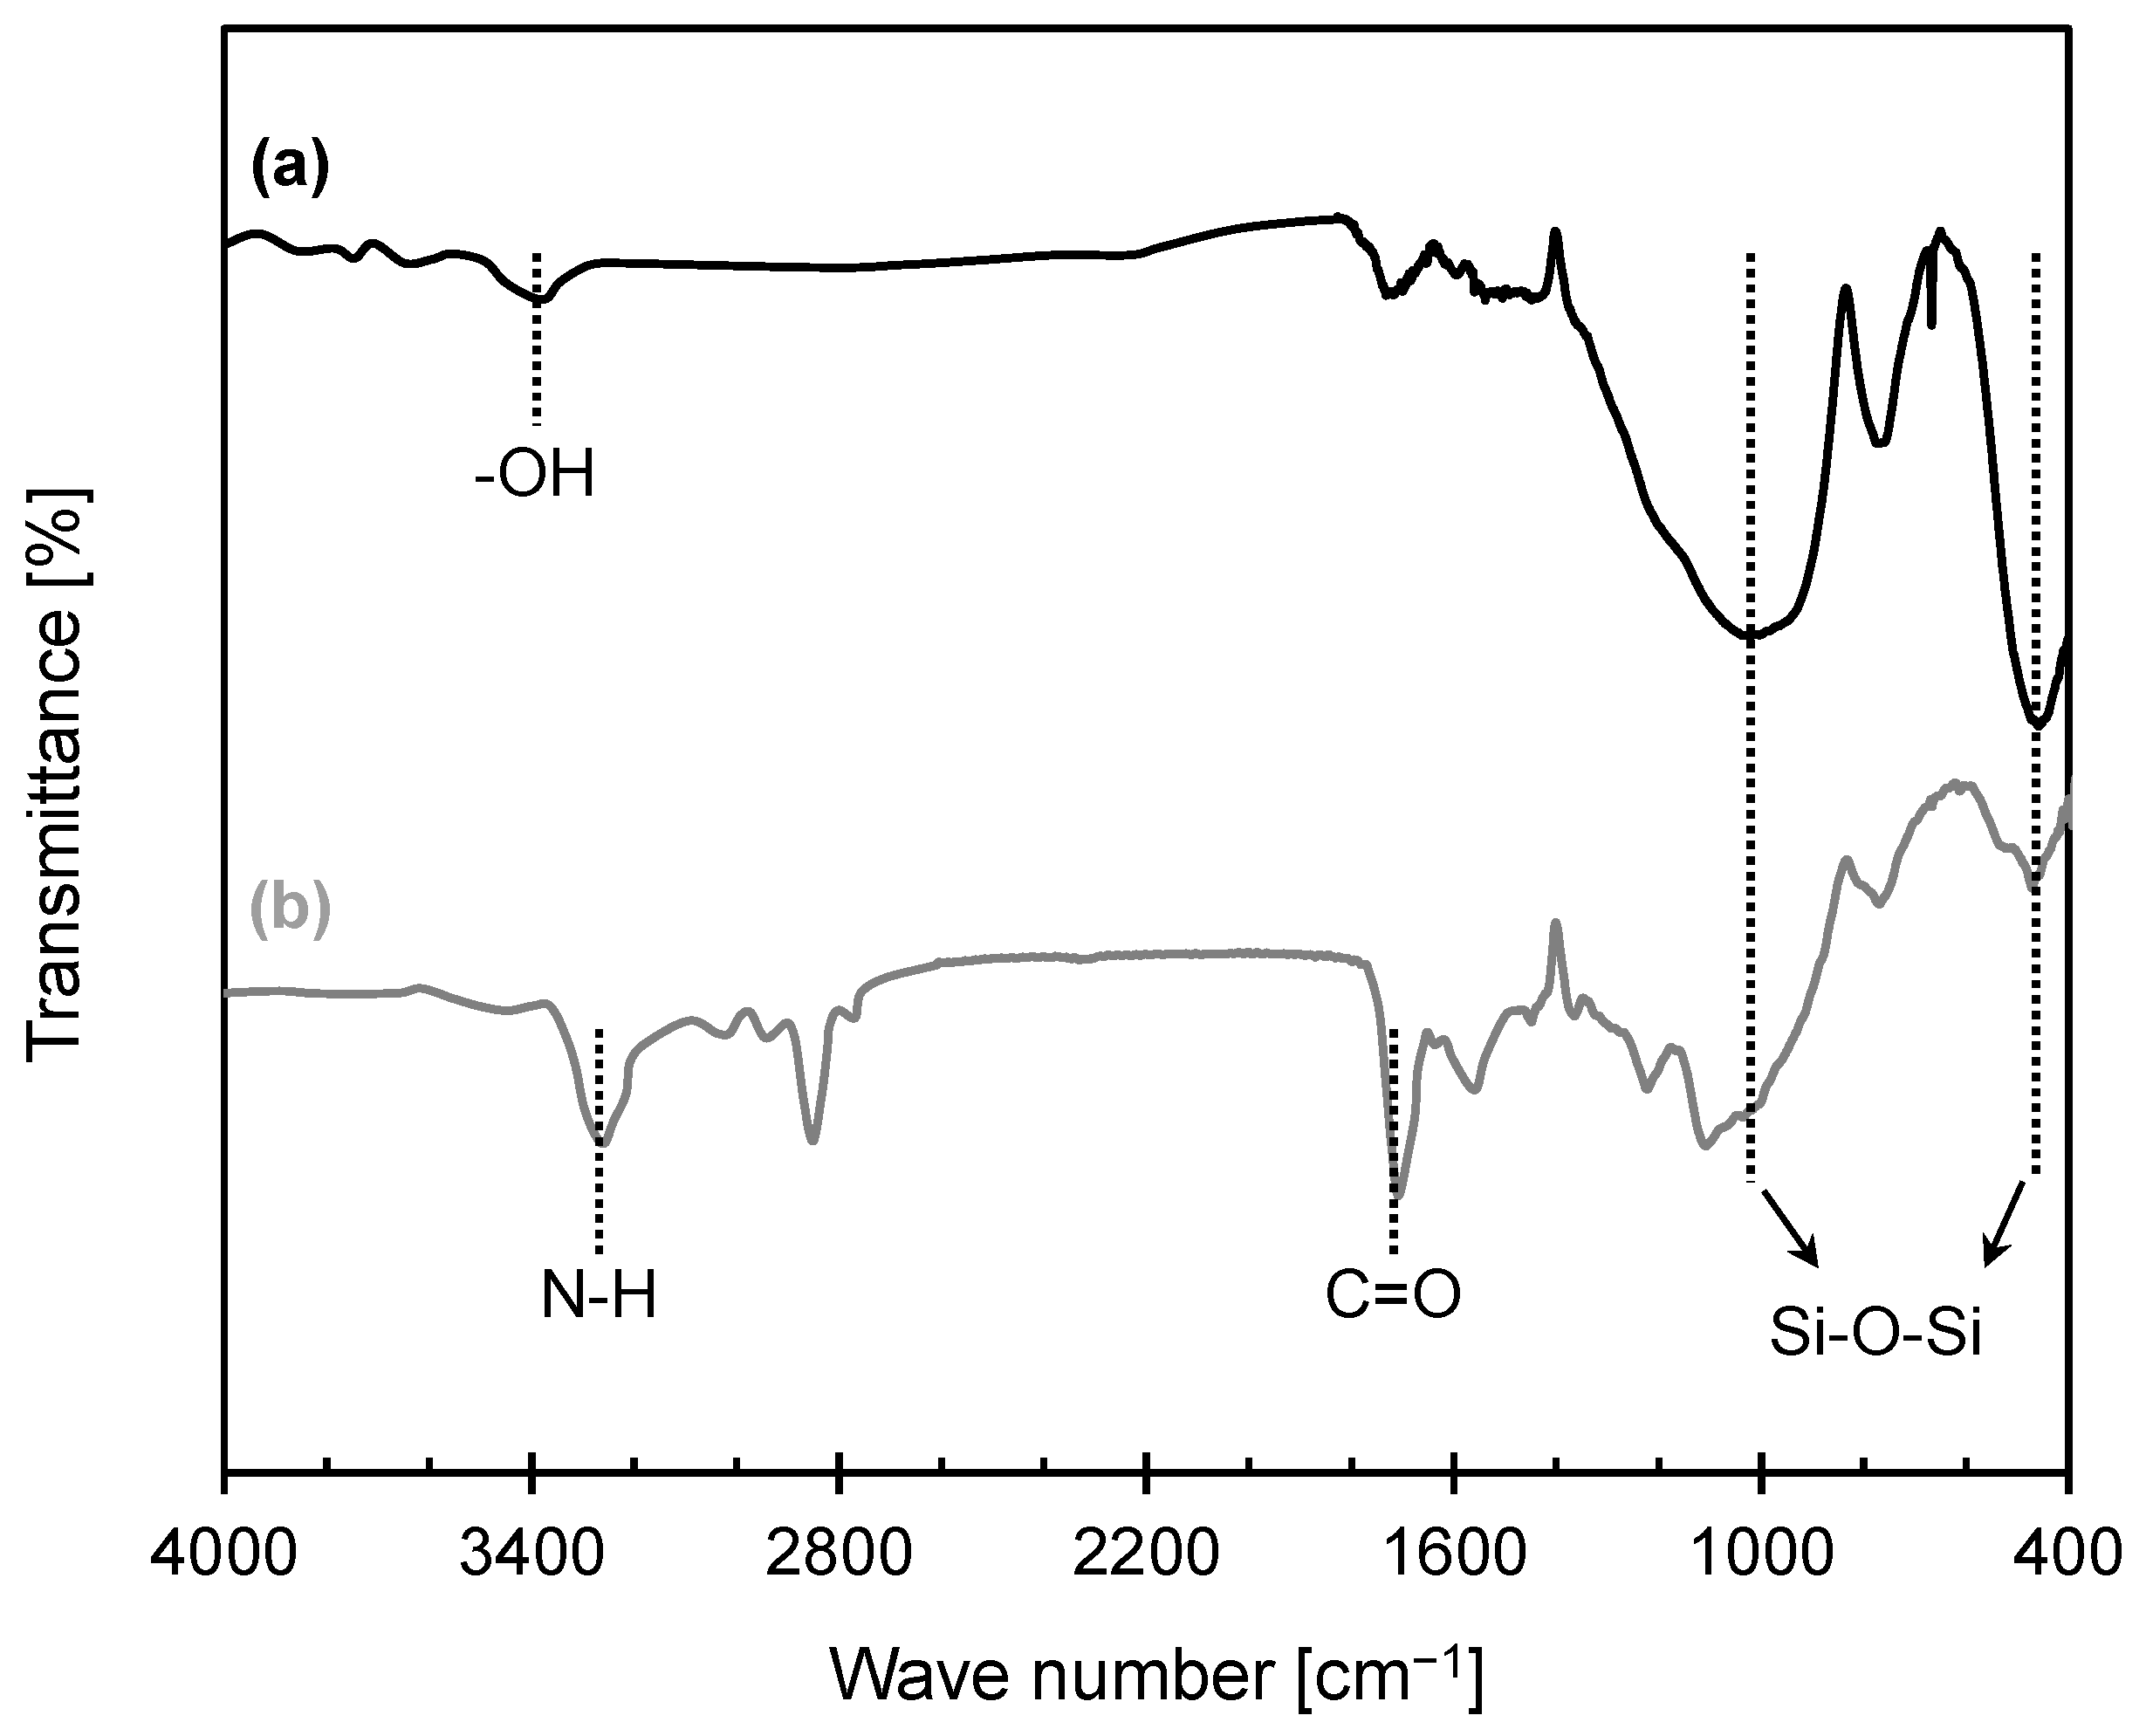
3.1. Analysis of Chemical Structure

Figure 2 presents a comparison of the FT-IR spectra of the GBs before and after the synthesis process. Since the FT-IR analysis is based on the interaction of infrared radiation with molecules, the response of the sample at different wavenumbers are the characteristics of different functional groups present in the sample. Therefore, the analysis of FT-IR enables the identification of compounds. In particular, the -OH functional group of pretreated GB and N-H and C=O groups of PUGB are of interest, as they exhibit the characteristics of chemical bonds described in Figure 1. The spectrum of pretreated GB exhibited a clear peak close to wavenumbers 1100 cm−1 and 470 cm−1, assigned to the silica network (Si-O-Si) [29]. Moreover, the peak at around 3450 cm−1, representing the OH groups on the GB surface [30], confirmed that APTES effectively enhanced the silanol groups, which results in a higher chance of reacting with the pre-PU. Notably, the PUGB particles exhibited adsorption peaks at 3330 cm−1 and 1730 cm−1, which originated from the stretching vibrations of the N-H and C=O groups, thereby confirming the successful pre-PU coating on the pretreated GB surface (Figure 1) [26]. The observed attenuated peak at 3450 cm−1 for PUGB also supported the occurrence of a chemical reaction between the OH groups on the GB surface.

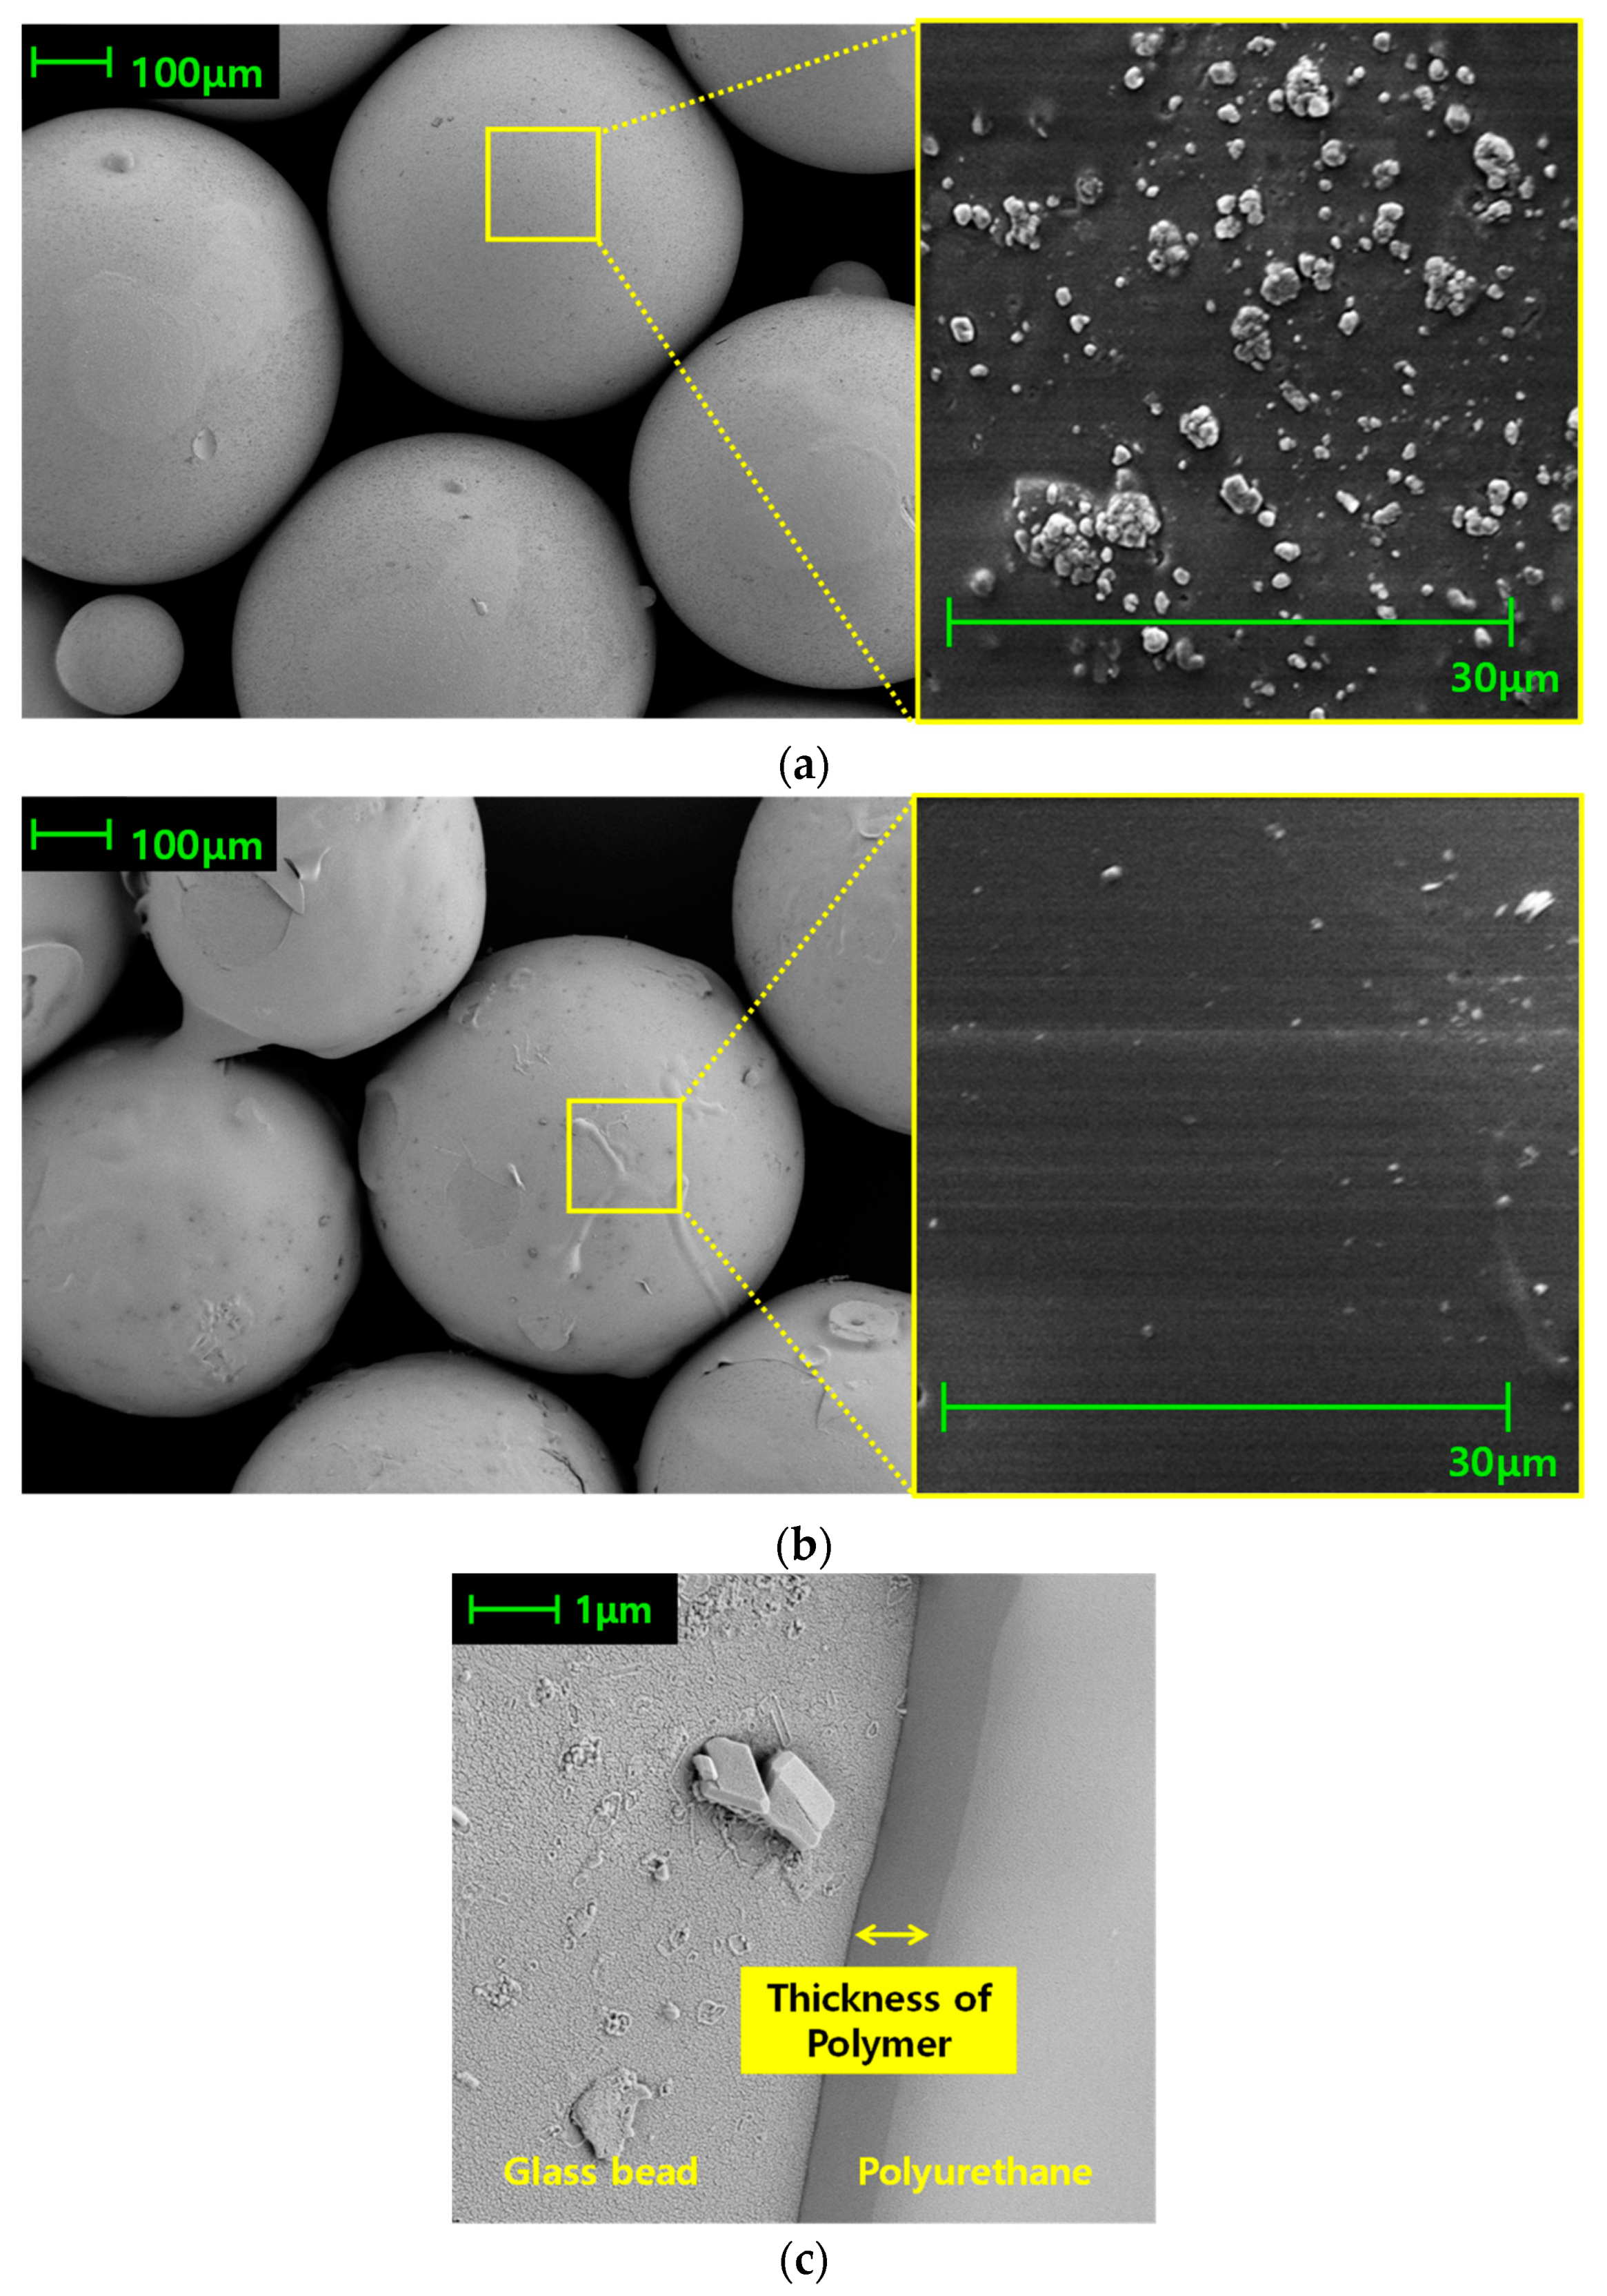
3.2. Microstructure Observation

Since the polymer synthesis was confirmed by FT-IR analysis, the morphology changes of the GB surface before and after polymer synthesis were observed by SEM images (Figure 3). Figures on the 100 μm scale indicate that surface modification by the polymerization was unaffected by the shape or size of the pure GB particles and that the synthesized polymer completely covers the GBs. The close-up image of the pure GB surface (right side of Figure 3a) reveals the presence of wedge-shaped protuberances on the surface, whereas in the case of PUGB (right side of Figure 3b), the synthesized polymer covers them, resulting in a relatively smooth surface. The thickness of coated polymer on the GB was measured to be nearly constant at ~0.9 μm (Figure 3c). Accordingly, it was inferred that the surface modification did not alter the size distribution of the GBs, but the aforementioned changes in surface roughness may lead to different behaviors of the PUGB-GB mixtures depending on their CPU.

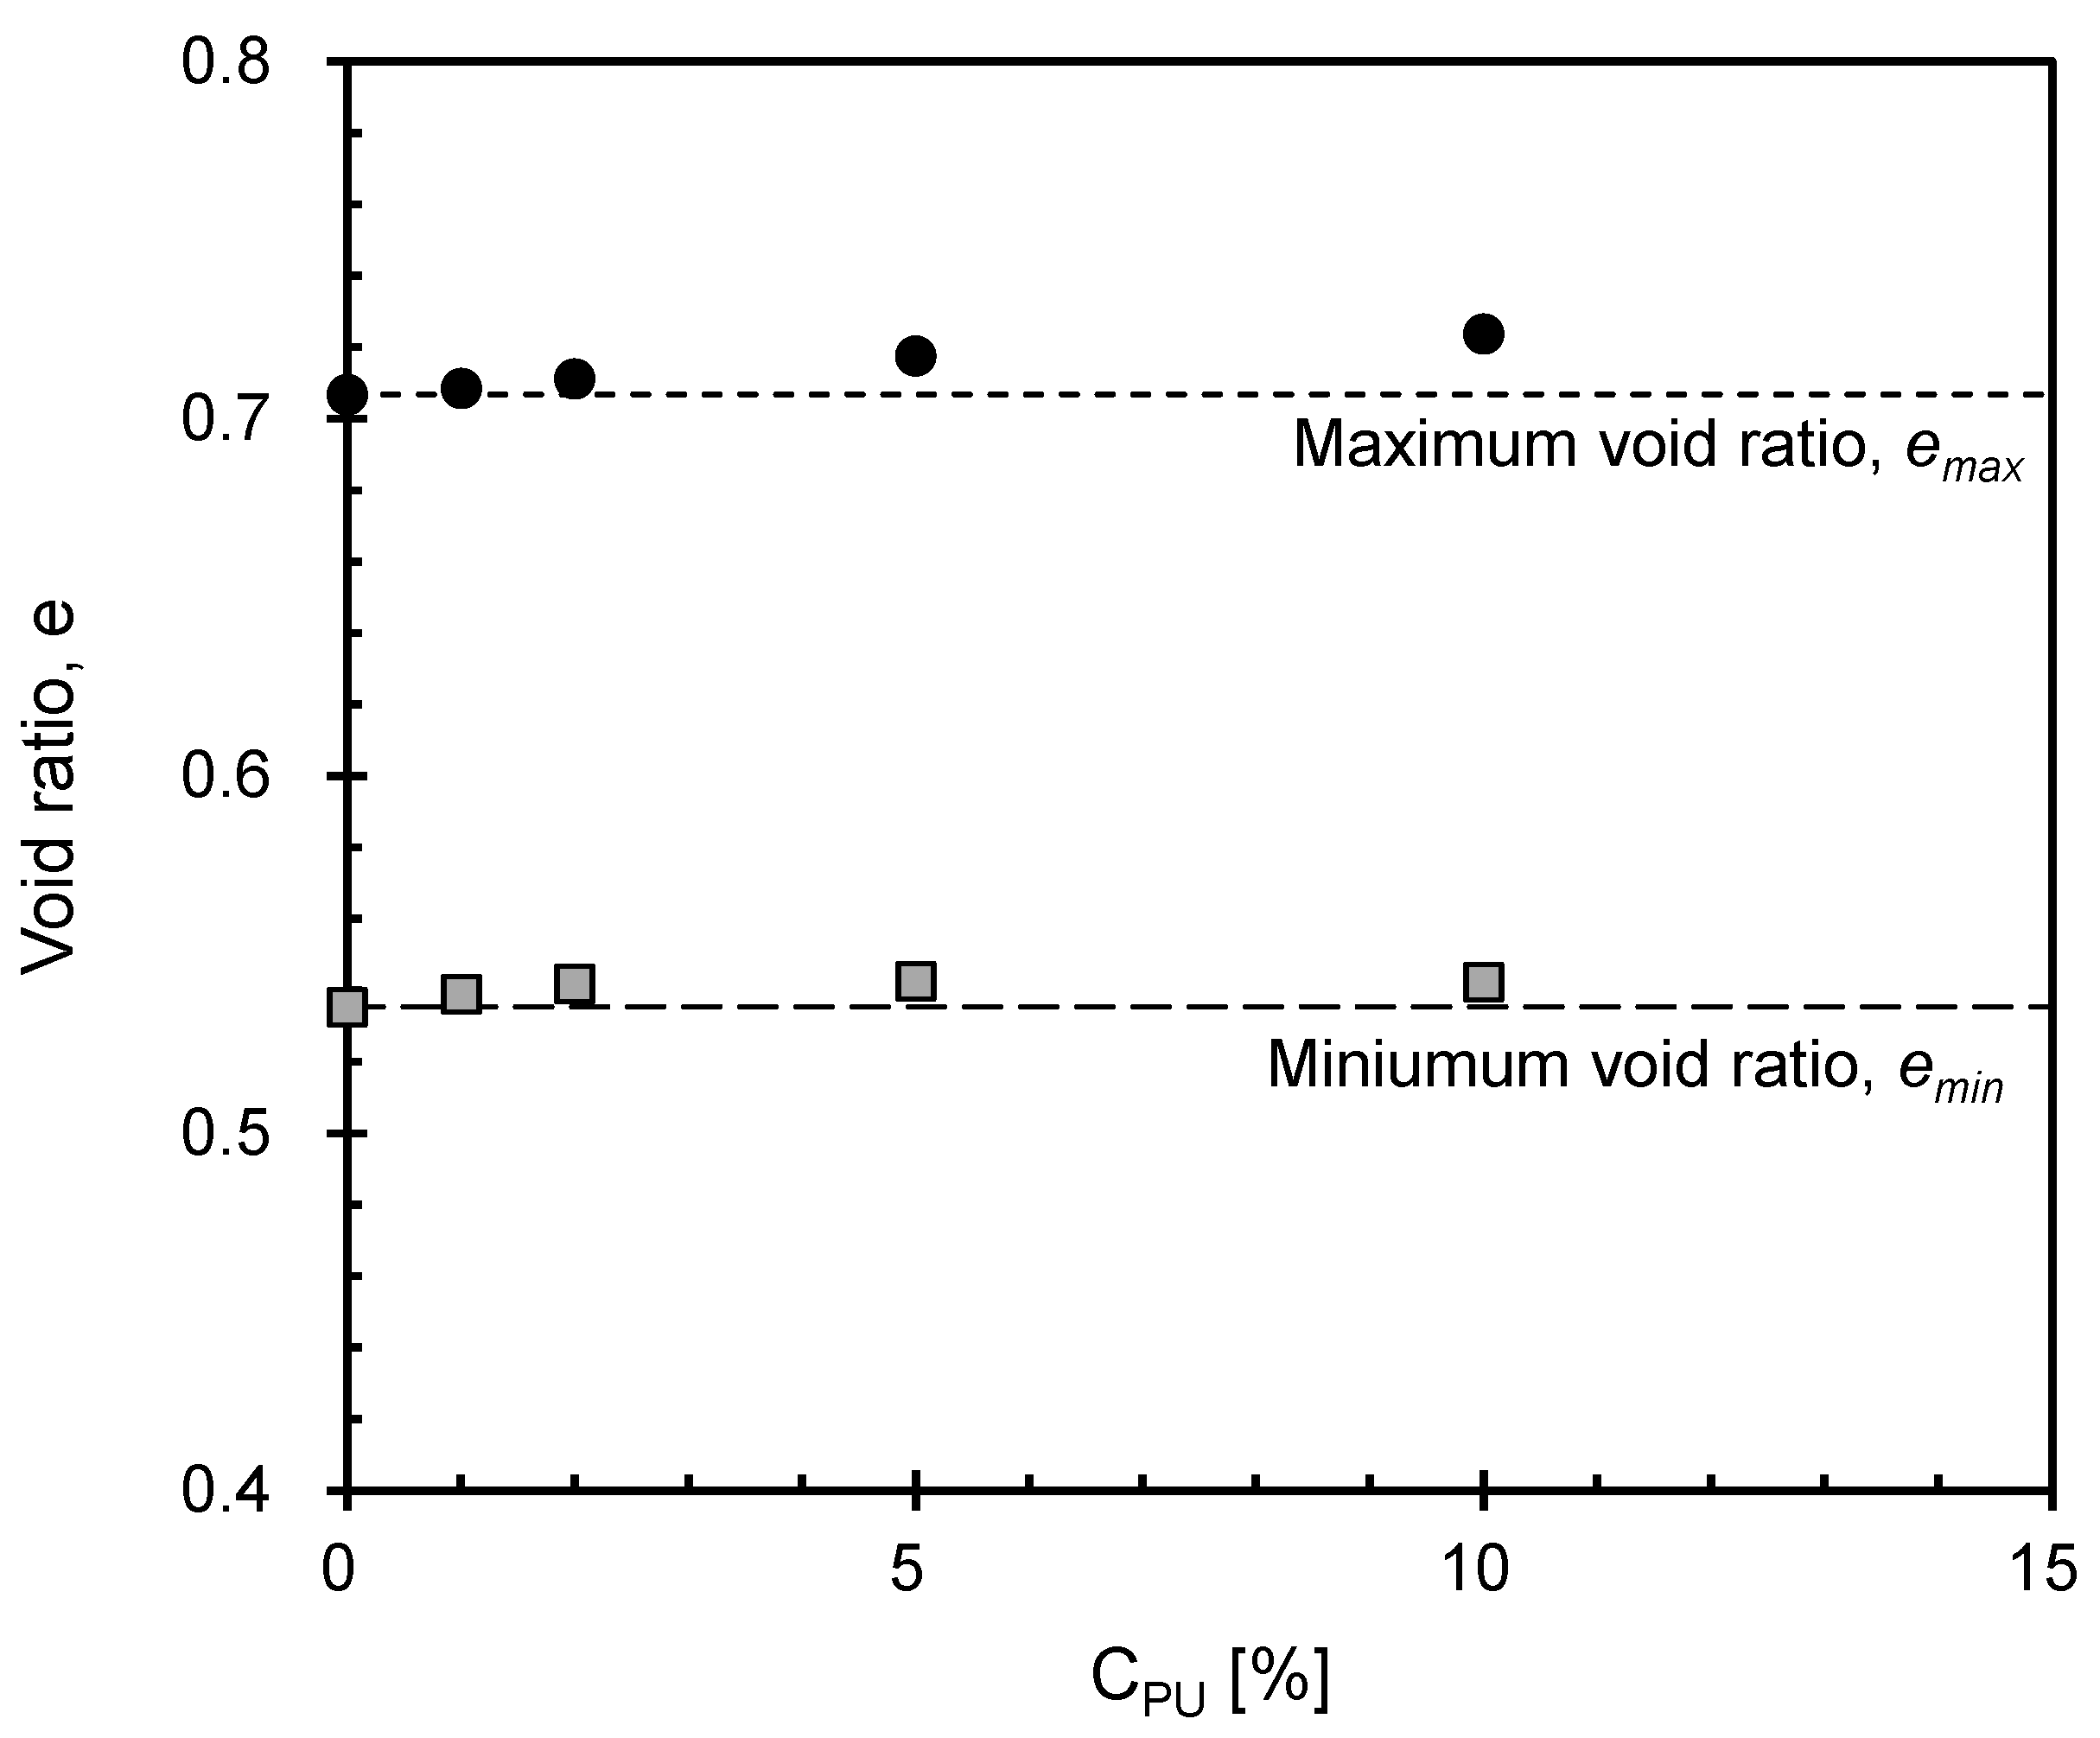
3.3. Variation of Extreme Void Ratios

The variations in maximum void ratio (emax) and minimum void ratio (emin) of the PUGB-GB mixtures having various CPU values are illustrated in Figure 4. The change in emin with CPU was relatively insignificant, while emax increased slightly as CPU increased. This may be attributed to the increased contact area between the particles resulting from reduced surface roughness due to surface modification, which enhanced the influence of the intrinsic adhesive properties of the polymer [31,32]. Particularly, Yu et al. [33] demonstrated that the adhesive forces between flat glass and polyurethane increased as the particle contact number increased. Thus, an increase in CPU leads to an increase in particle adhesion, resulting in higher emax. However, because the adhesion forces were not high enough to withstand the stress exerted during vibratory table testing (i.e., emin measurement), an insignificant effect of CPU was observed.

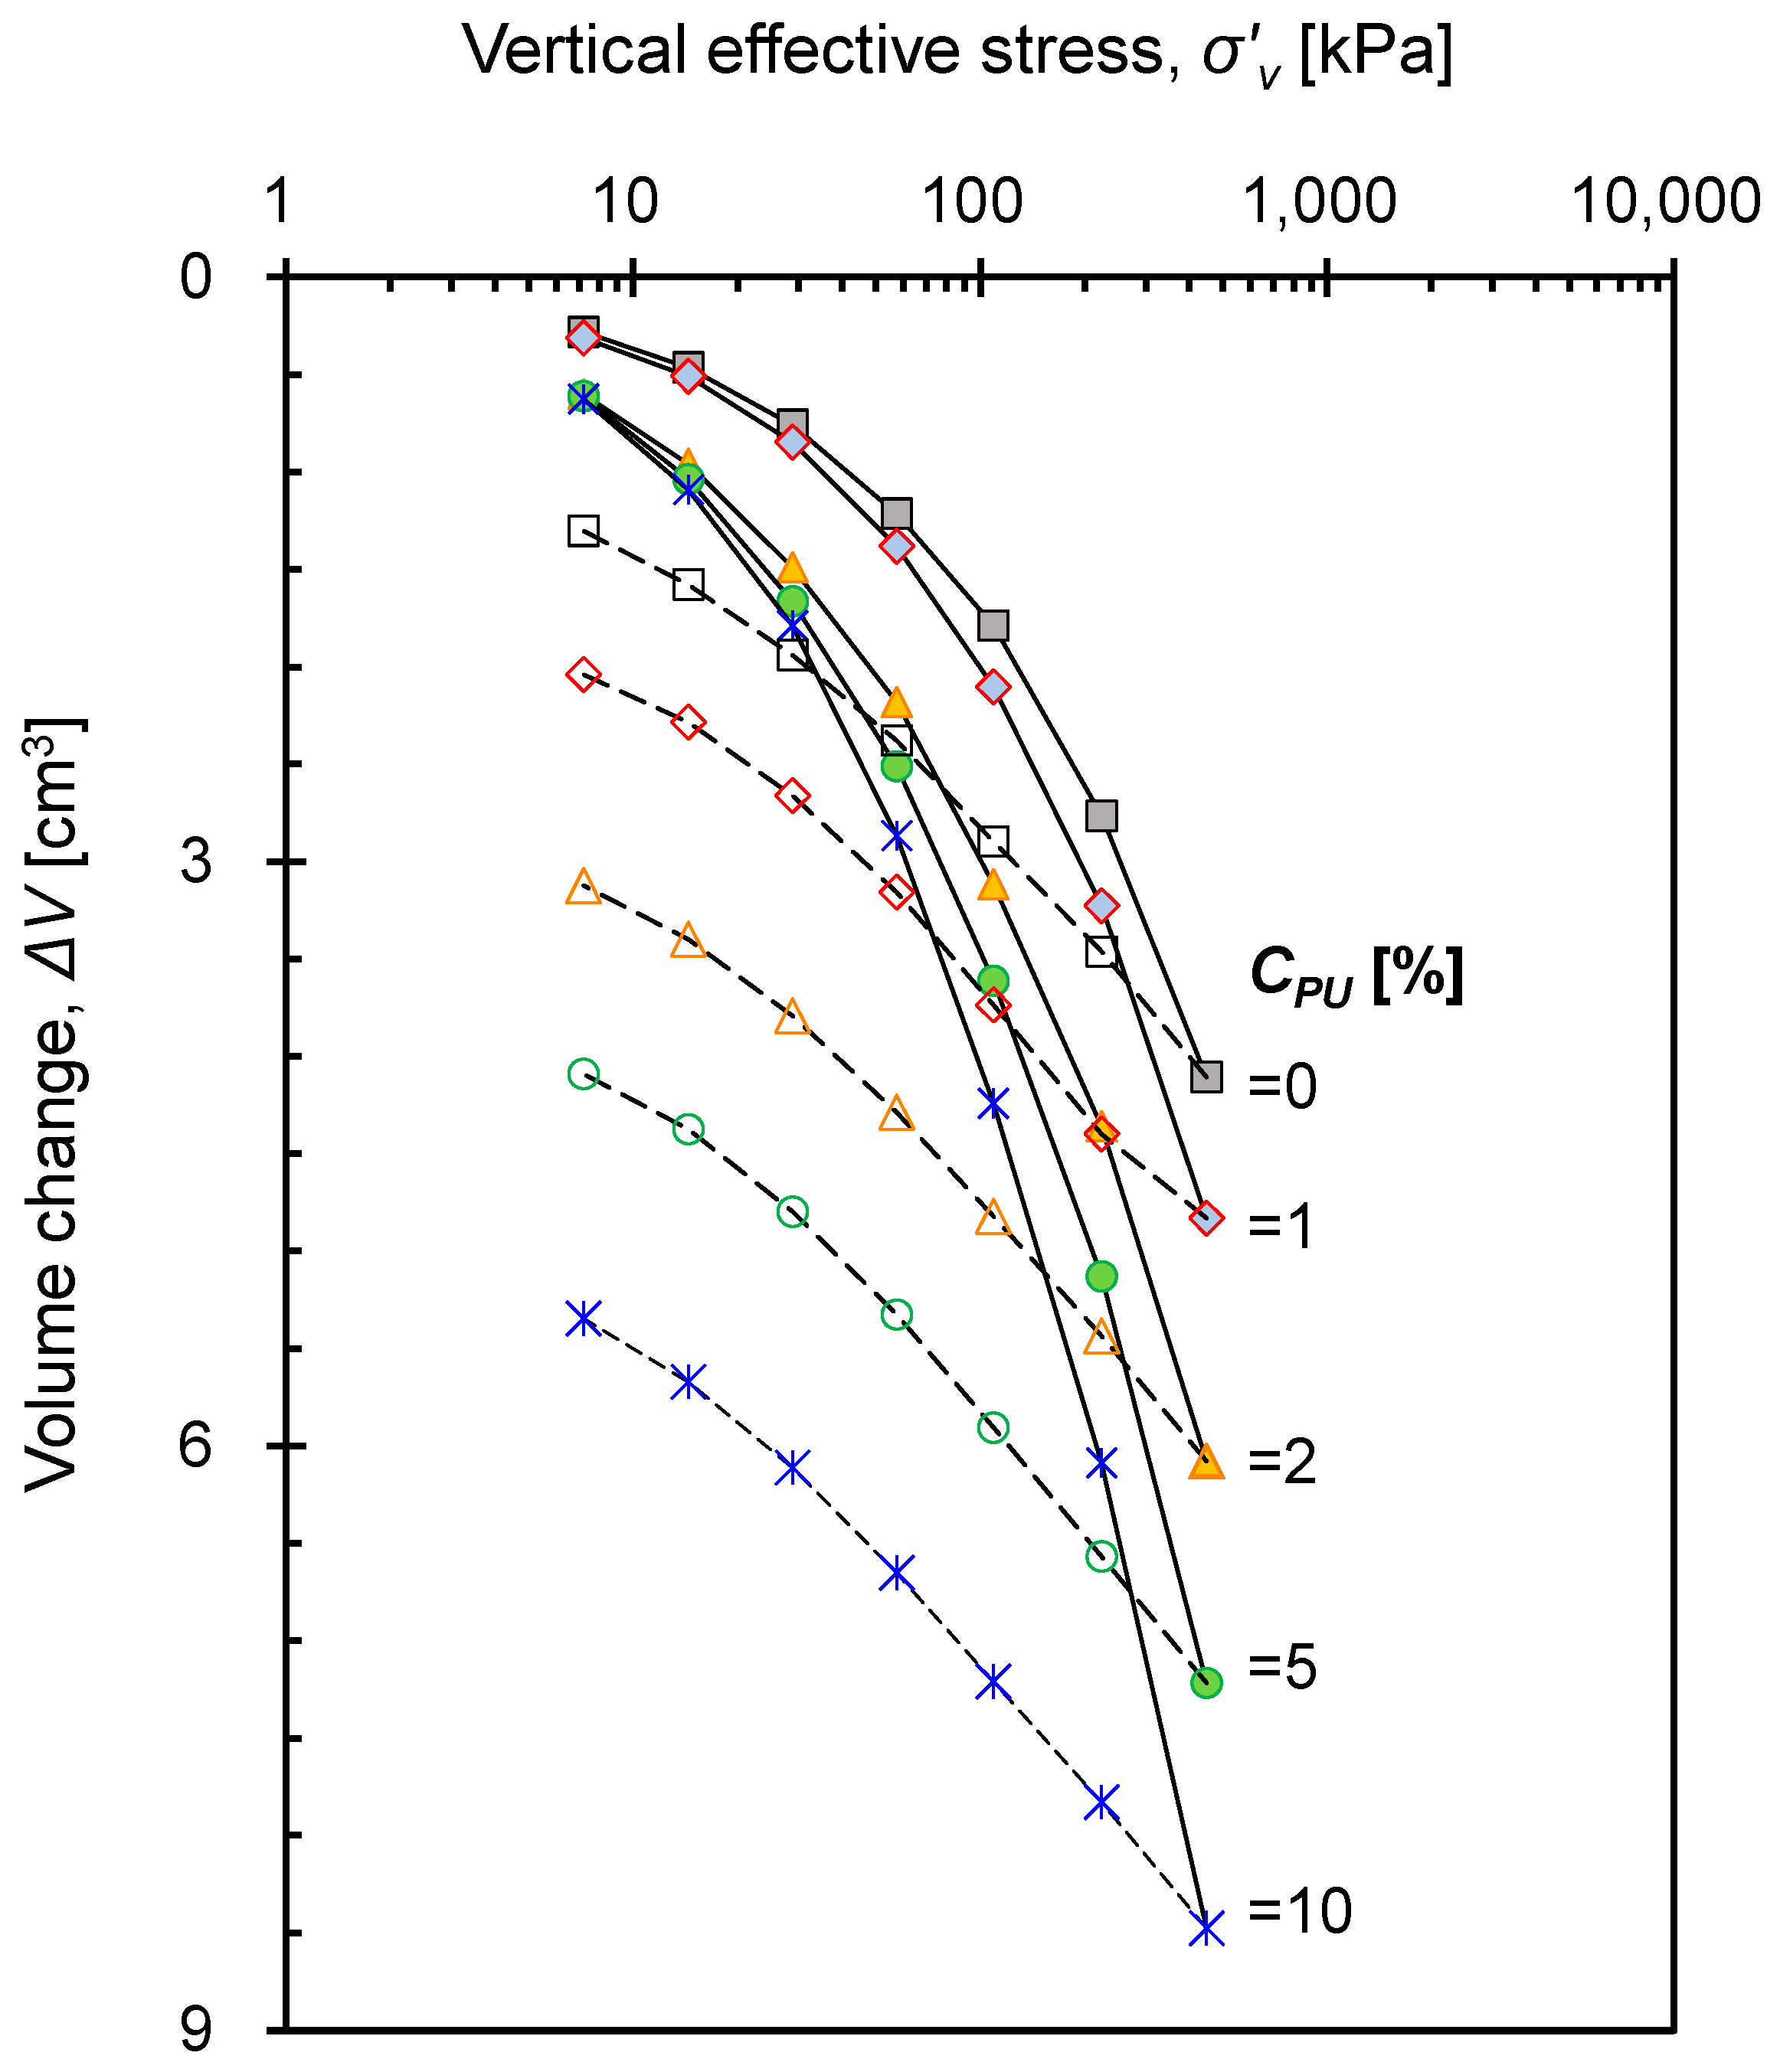
3.4. Vertical Compressibility at Zero-Lateral Strain

Figure 5 shows the evolution of the volume change (ΔV) behavior of the PUGB-GB mixtures determined on the basis of settlement during loading and unloading under the zero-lateral strain condition. At a given relative density, ΔV of the mixture increased as the applied vertical stress and CPU increased. The volumetric change refers to the particle rearrangement behavior induced by particle rolling and sliding [34]. Accordingly, the increase in ΔV with CPU reflects that the PUGB particles were rearranged more easily than the GB particles, which was attributed to the increased initial void ratio and reduced surface roughness. The aforementioned adhesion forces of polymer may initially resist the particle rearrangement; however, it rather served to aggregate the particles around the PUGB with vertical stress increment, leading to higher ΔV with increasing CPU.
The constrained modulus (M) was calculated as the slope of the vertical effective stress–strain curve, where the measured value represents M at the average vertical stress (σ’v,avg )of two vertical stresses applied sequentially. Figure 6 only shows the variation of M with the average vertical stress at Dr = 60%, as consistent variation trends were observed at varying Dr. As expected, M decreased with CPU because of the increased number of particles with reduced surface roughness. However, the CPU = 1% mixture exhibited a similar variation in M as that of the CPU = 0% mixture (i.e., pure GB), reflecting the insignificant effect of PUGB particles on mixture behavior.
The stress-dependent variation of M at different CPU values were observed through the trend line of M at ranges of σ’v,avg = 4~84 kPa. For mixtures with low CPU (≤1%), the M at σ’v,avg > 100 kPa follows similar trends to those of trend lines. However, for mixtures with CPU > 1%, the M at σ’v,avg > 100 kPa deviates from the trend line and increases rapidly, approaching M of pure GB. It is inferred that the adhesion of the polymer brings the pure GBs into closer contact with the PUGBs, which initially increases the mixture compressibility. However, when a certain stress level at which no further interactions between PUGBs are induced, the fabric of GBs may start to govern the mixture behavior. As a result, the mixtures exhibit GB-like behavior and approach the M value of pure GB. Although further study is needed to determine the precise onset of interactions, the stress-dependent behavior of PUGB-GB mixtures with CPU > 1% was observed at σ’v,avg ~ 100 kPa in this study.

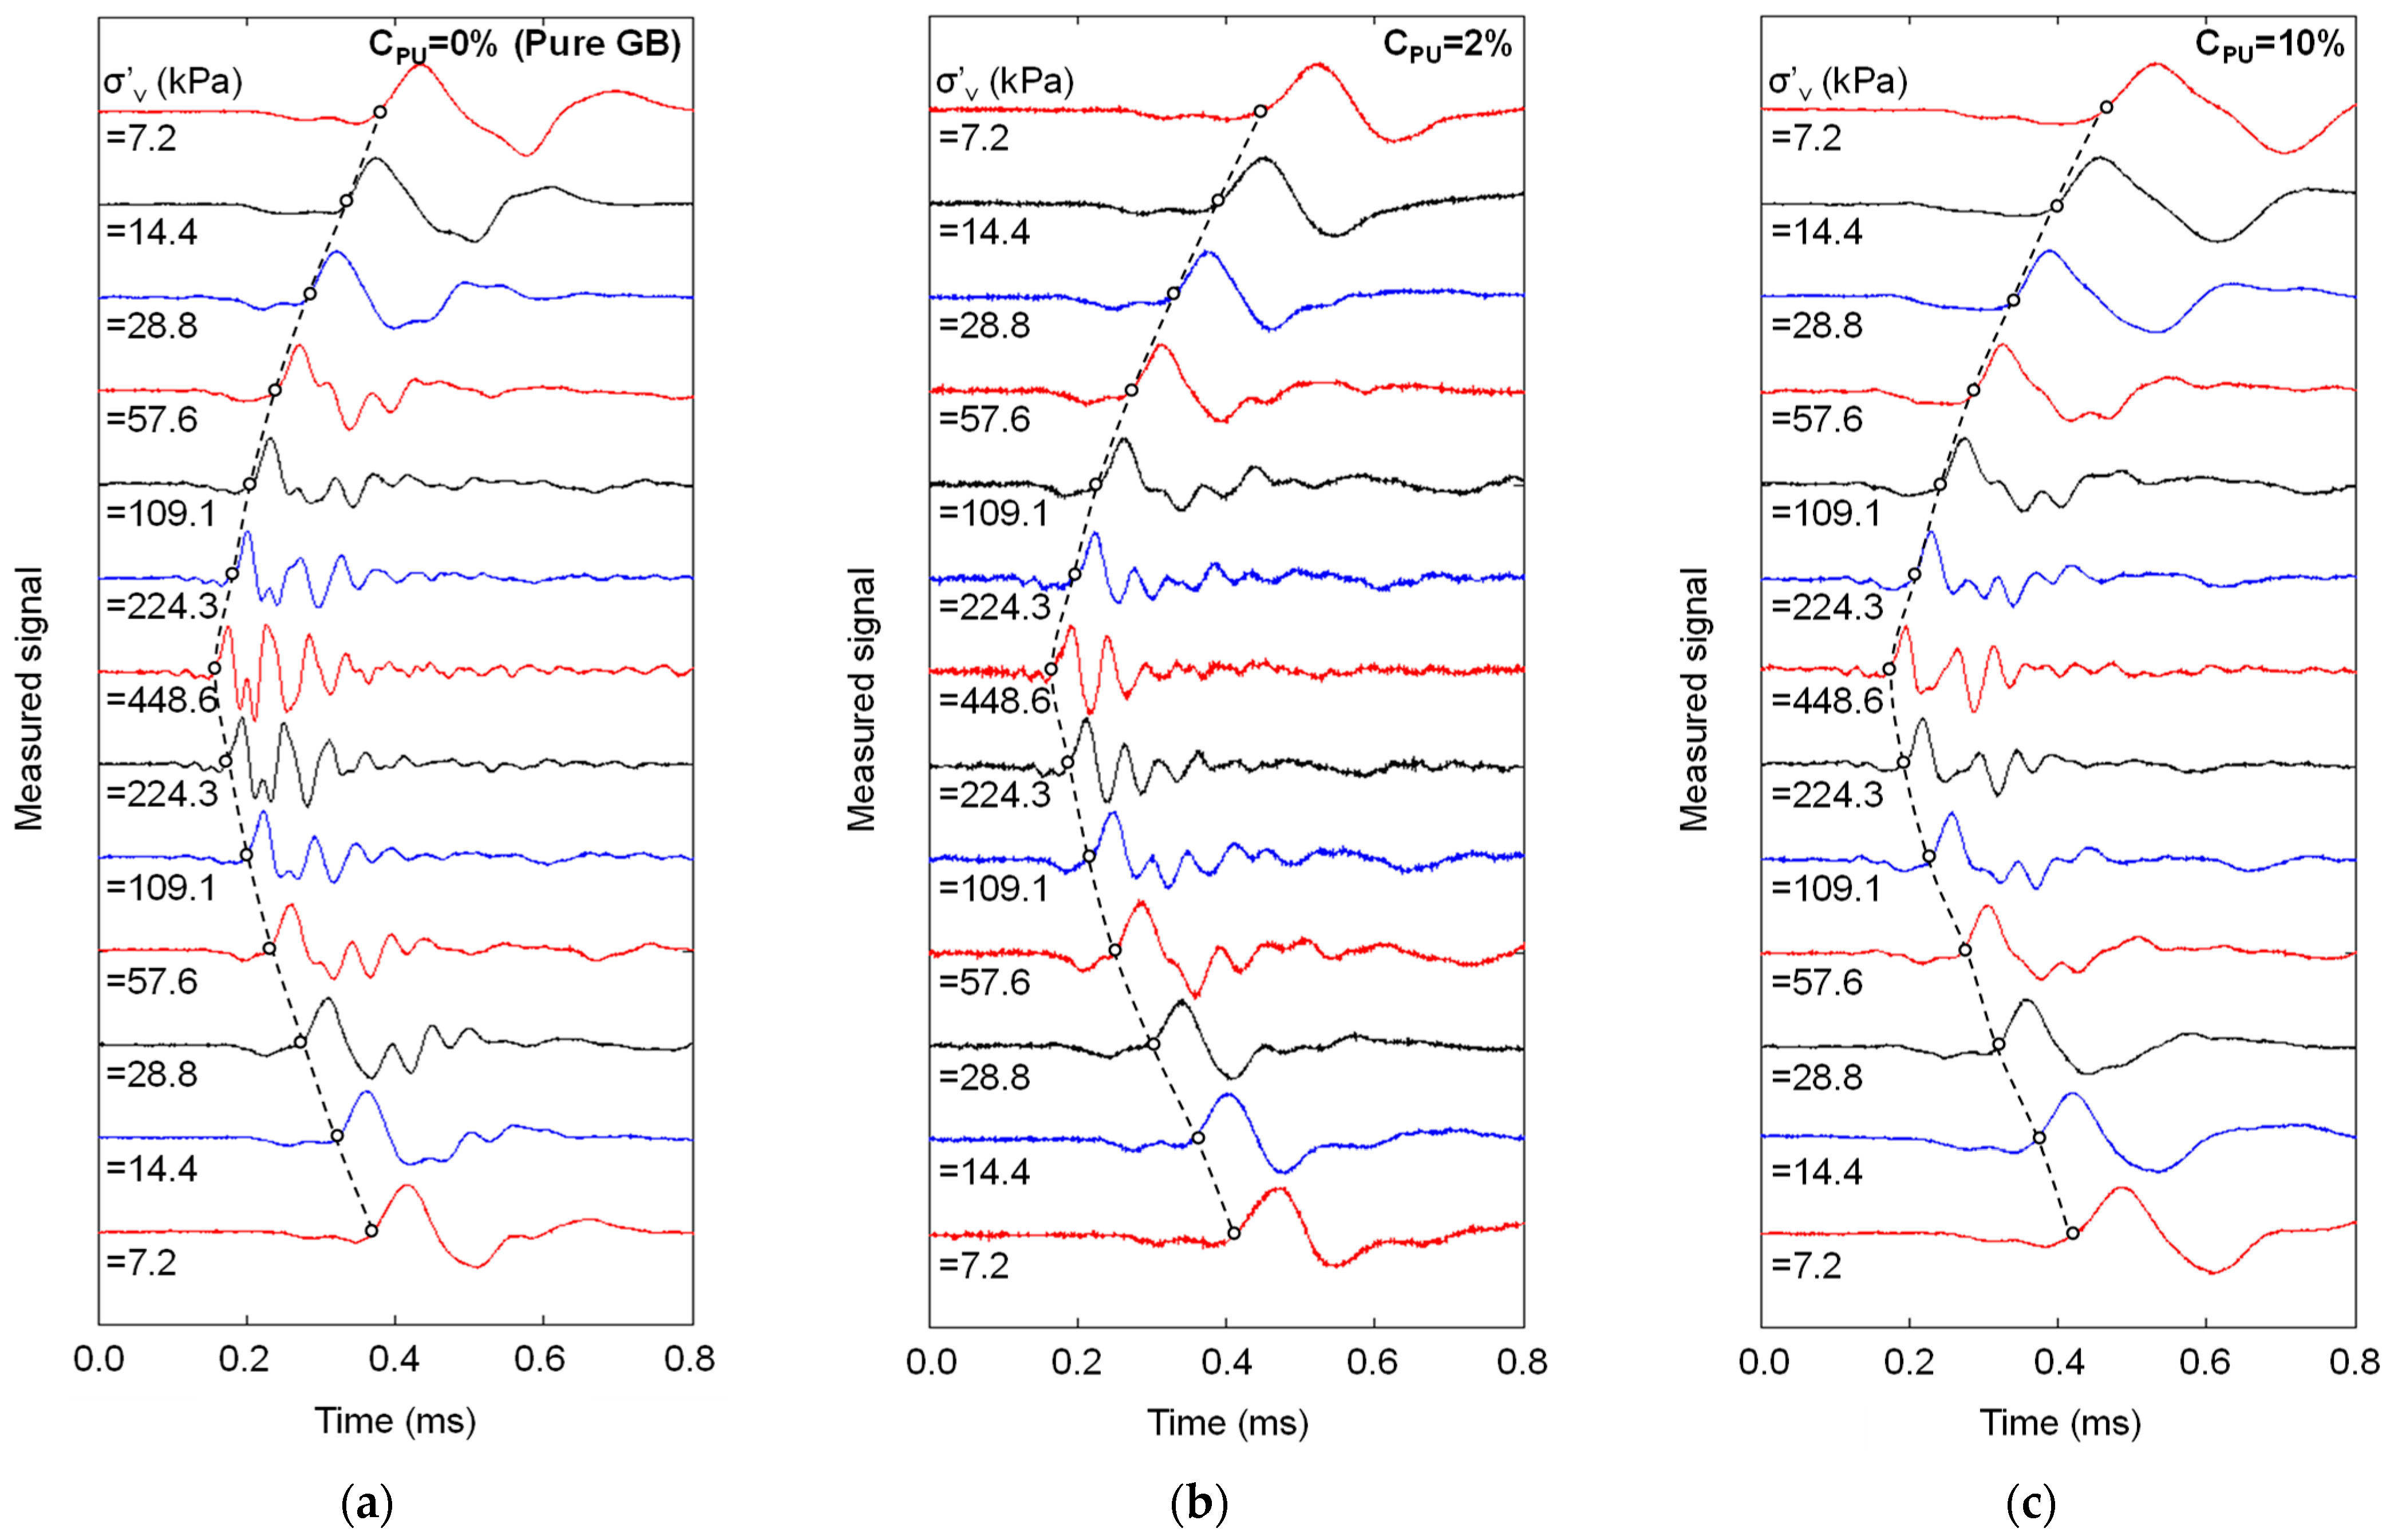
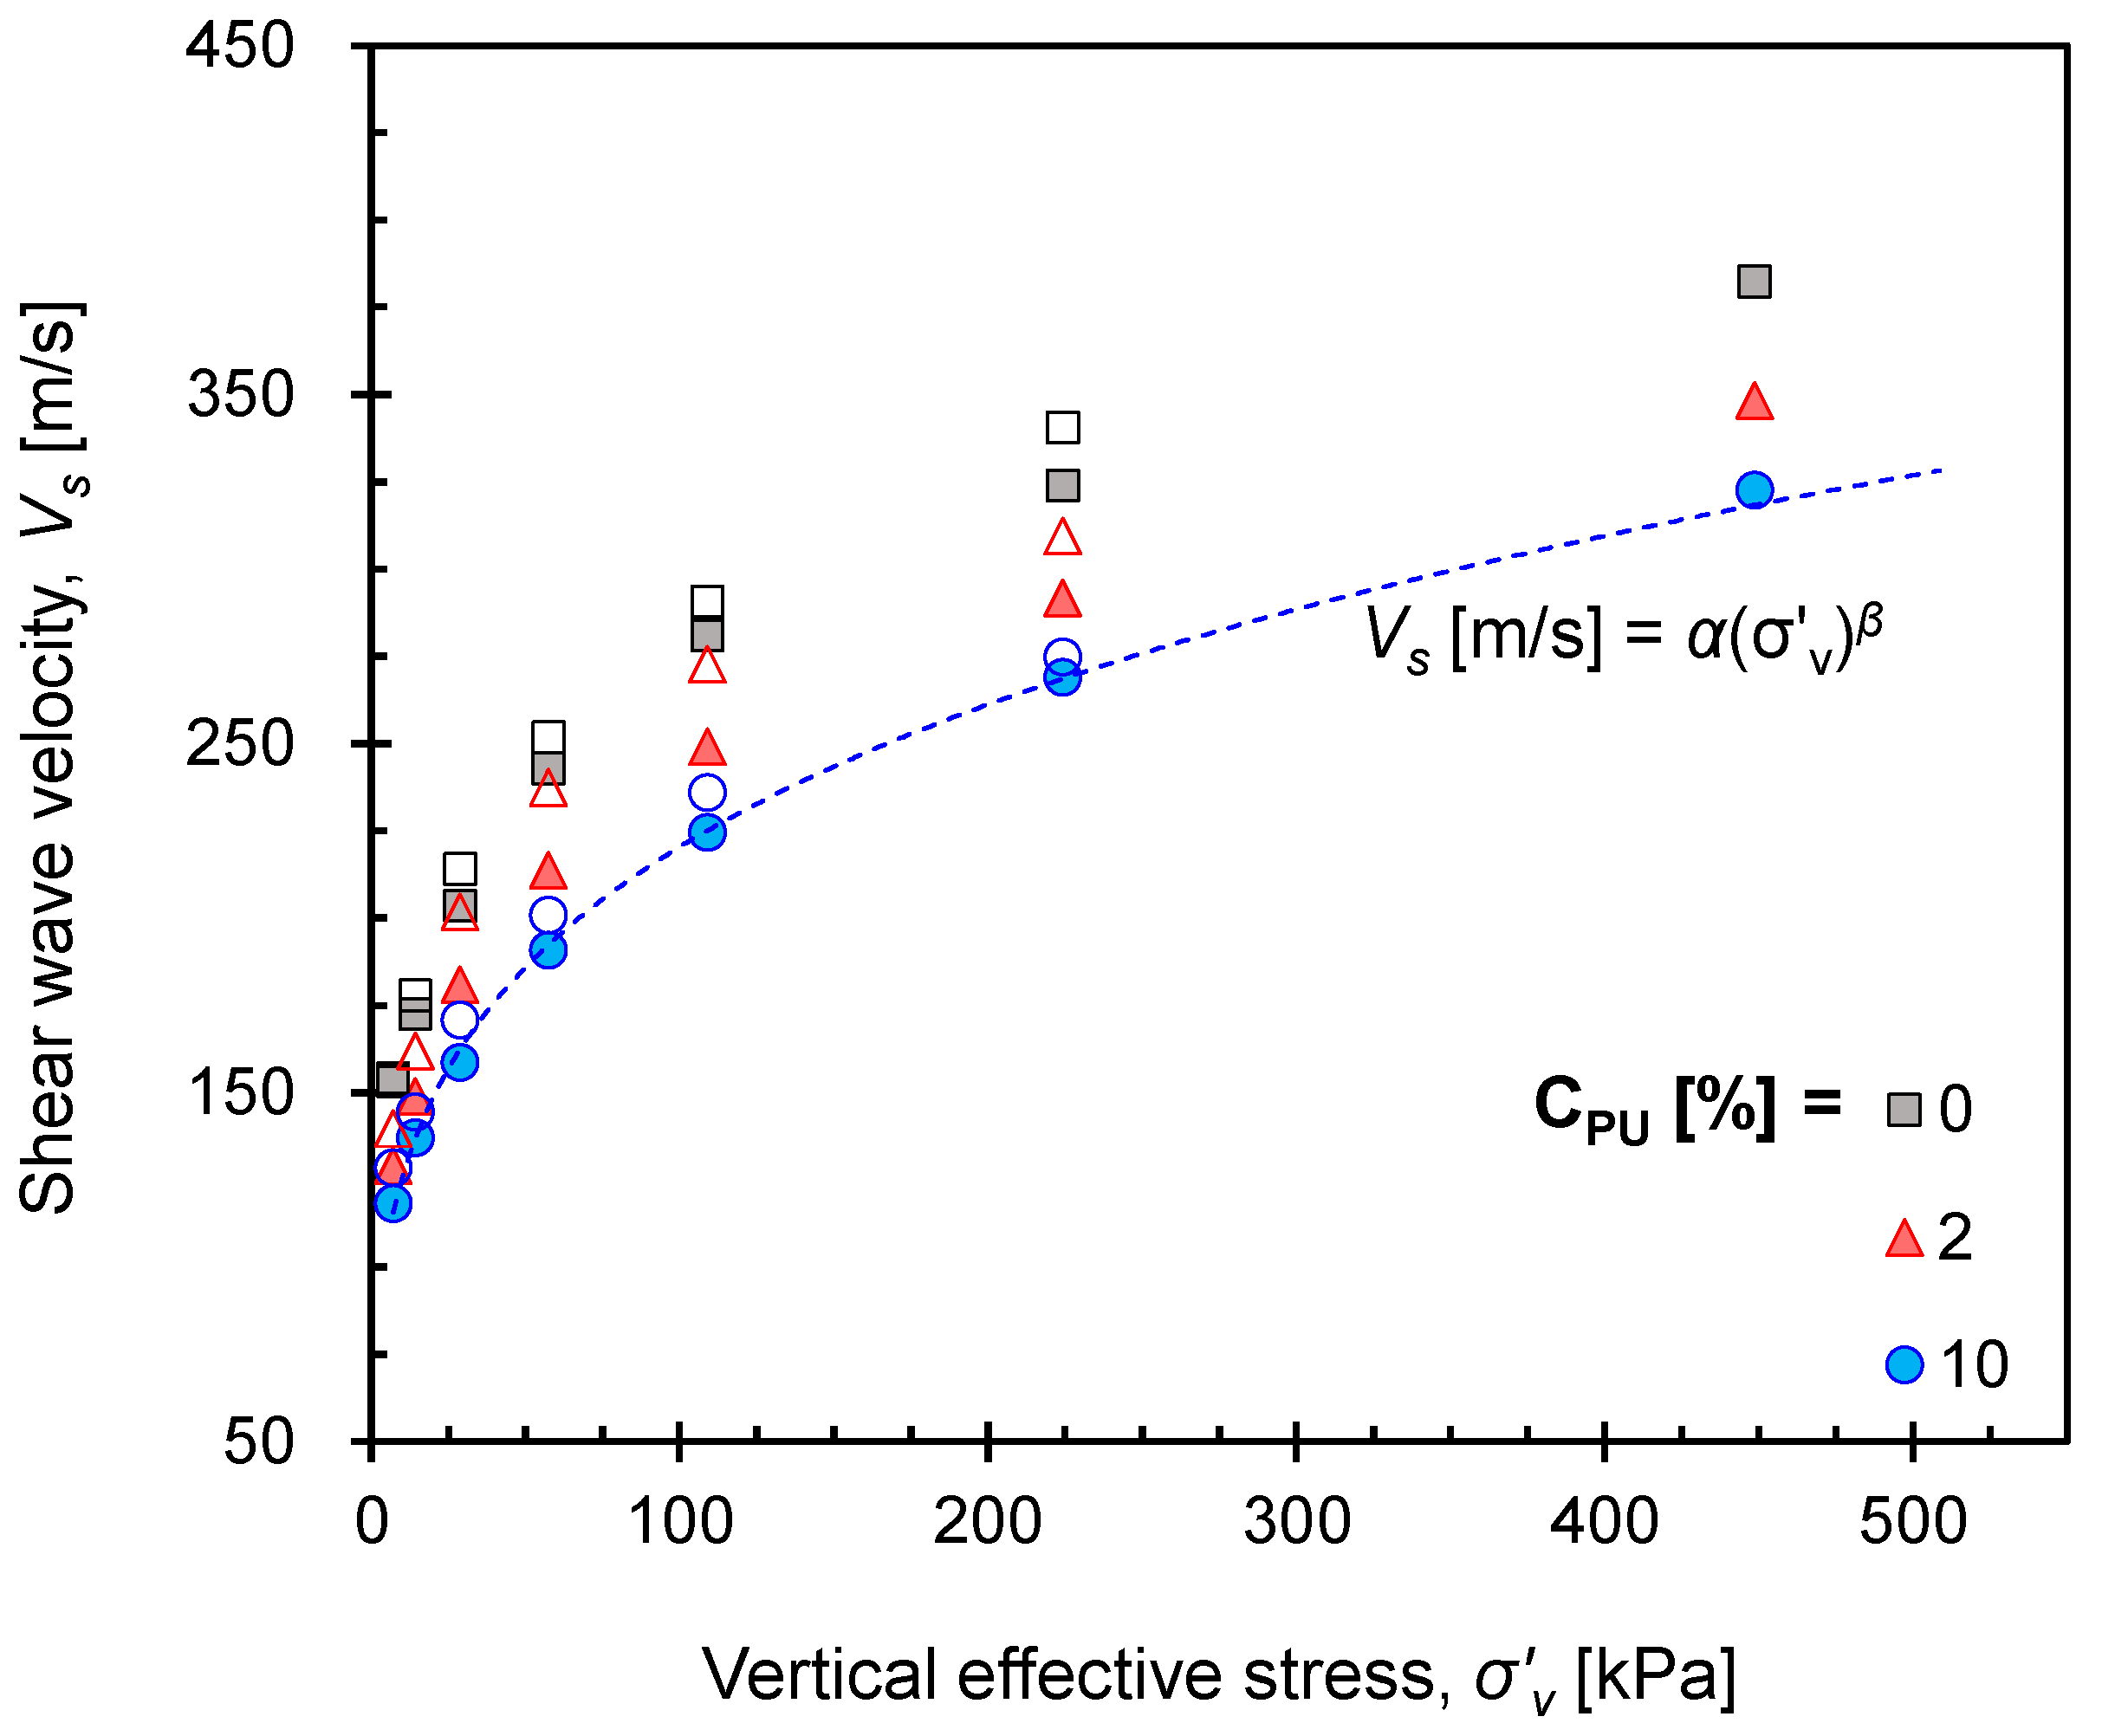
3.5. Shear Wave Velocity Vs

The propagation of shear wave traces during the loading and unloading stages of the selected mixtures with the initial Dr of 60% are plotted in Figure 7. The first arrival time decreased, and the resonant frequency increased with vertical stresses [28,35,36]. As the CPU increased, the first arrival time of the mixture increased under the same vertical effective stress, indicating that the polymer coating on the GB surface lowered the contact stiffness. Nonetheless, the resonant frequency of the signal decreased in a negligible range with the increasing CPU, indicating insignificant changes in the global material properties with CPU.
The shear wave velocity was then calculated from the measured signals and travel distances. As the increases in the applied stress and relative density induced higher contact area followed by higher contact stiffness, a higher shear wave velocity was observed. On the contrary, because the increase in CPU decreased the contact stiffness between particles, a lower shear wave velocity was measured with CPU, regardless of the initial Dr and loading/unloading states (Figure 8).

4. Discussion

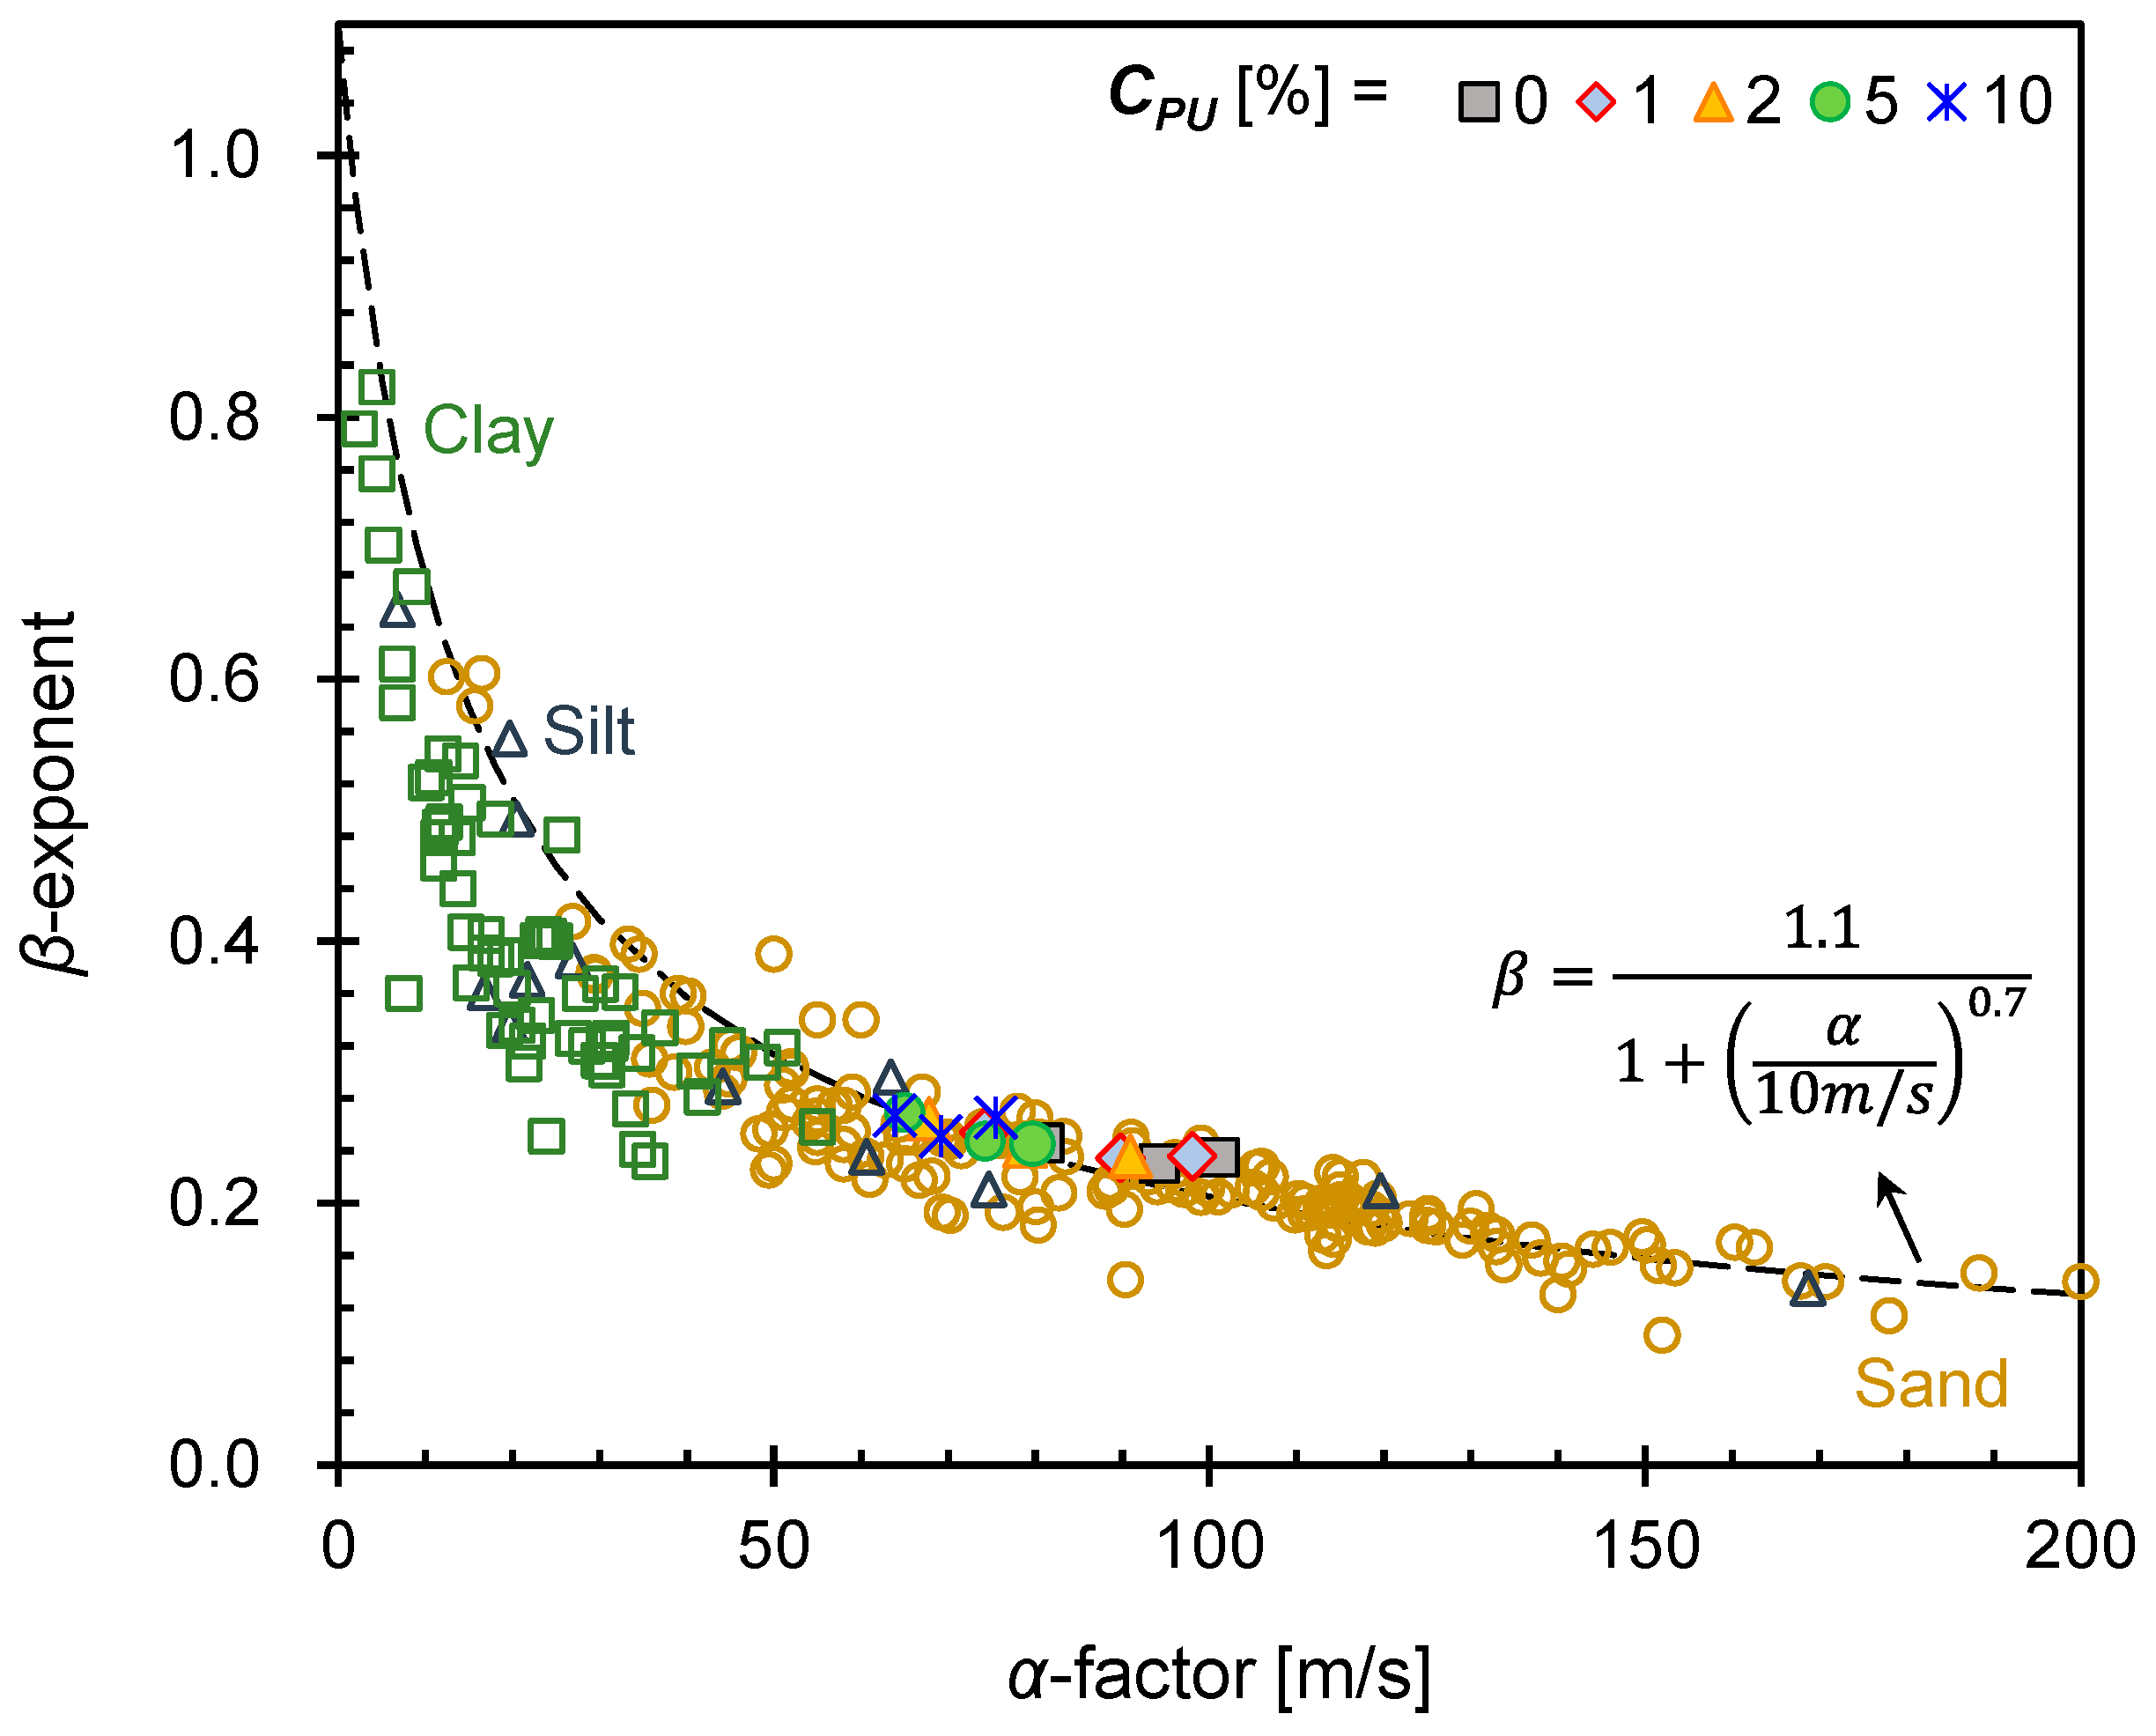
4.1. Relationship between α and β

The shear wave velocity can be expressed as a power function of the effective stress [37,38,39,40], as follows:
V s = α ( σ v 1   k P a ) β
where the α-factor [m/s] is the shear wave velocity at 1 kPa confinement, and the β-exponent indicates the stress sensitivity of the shear wave velocity. Both α and β were determined experimentally on the basis of particle packing, fabric, mineral properties, and contact characteristics, such as the coordination number and contact stiffness [41]. Therefore, α and β have a range of values that depends on both intrinsic properties and state conditions of the given soil types: clay, silt, and sand [42,43,44]. Comparing the relationship between the α-factor and β-exponent obtained in this study with data of different various geomaterials [42,43,45,46,47] can be helpful in identifying the behavior of PUGB-GB mixtures (Figure 9). The most recent comprehensive work regarding the α-β relationship is suggested by Ramirez et al. [42], where the suggested relationship is plotted together in Figure 9. For denser and coarser materials, a higher α-factor and a lower β-exponent are expected due to the smaller changes in the interparticle contact number with increasing stress [41]. The values of the α-factor and β-exponent of the tested pure GB indicate that the behavior of pure GB is equivalent to that of pure sand. Furthermore, the increase in CPU did not modify the global properties of the materials since the relation of α and β parameters still lies on the suggested trend line. Also, it is notable that PUGB-GB mixtures exhibit sand-like parameters, regardless of CPU, confirming the findings in Figure 7. Still, the increase in CPU decreased the contact stiffness, resulting in a decrease and an increase in the α-factor and β-exponent, respectively. The relationships of α and β obtained in this study are adequately consistent with the suggested trend line for soils, despite the change in CPU. This finding reinforces that the PUGB can still act as a geomaterial.

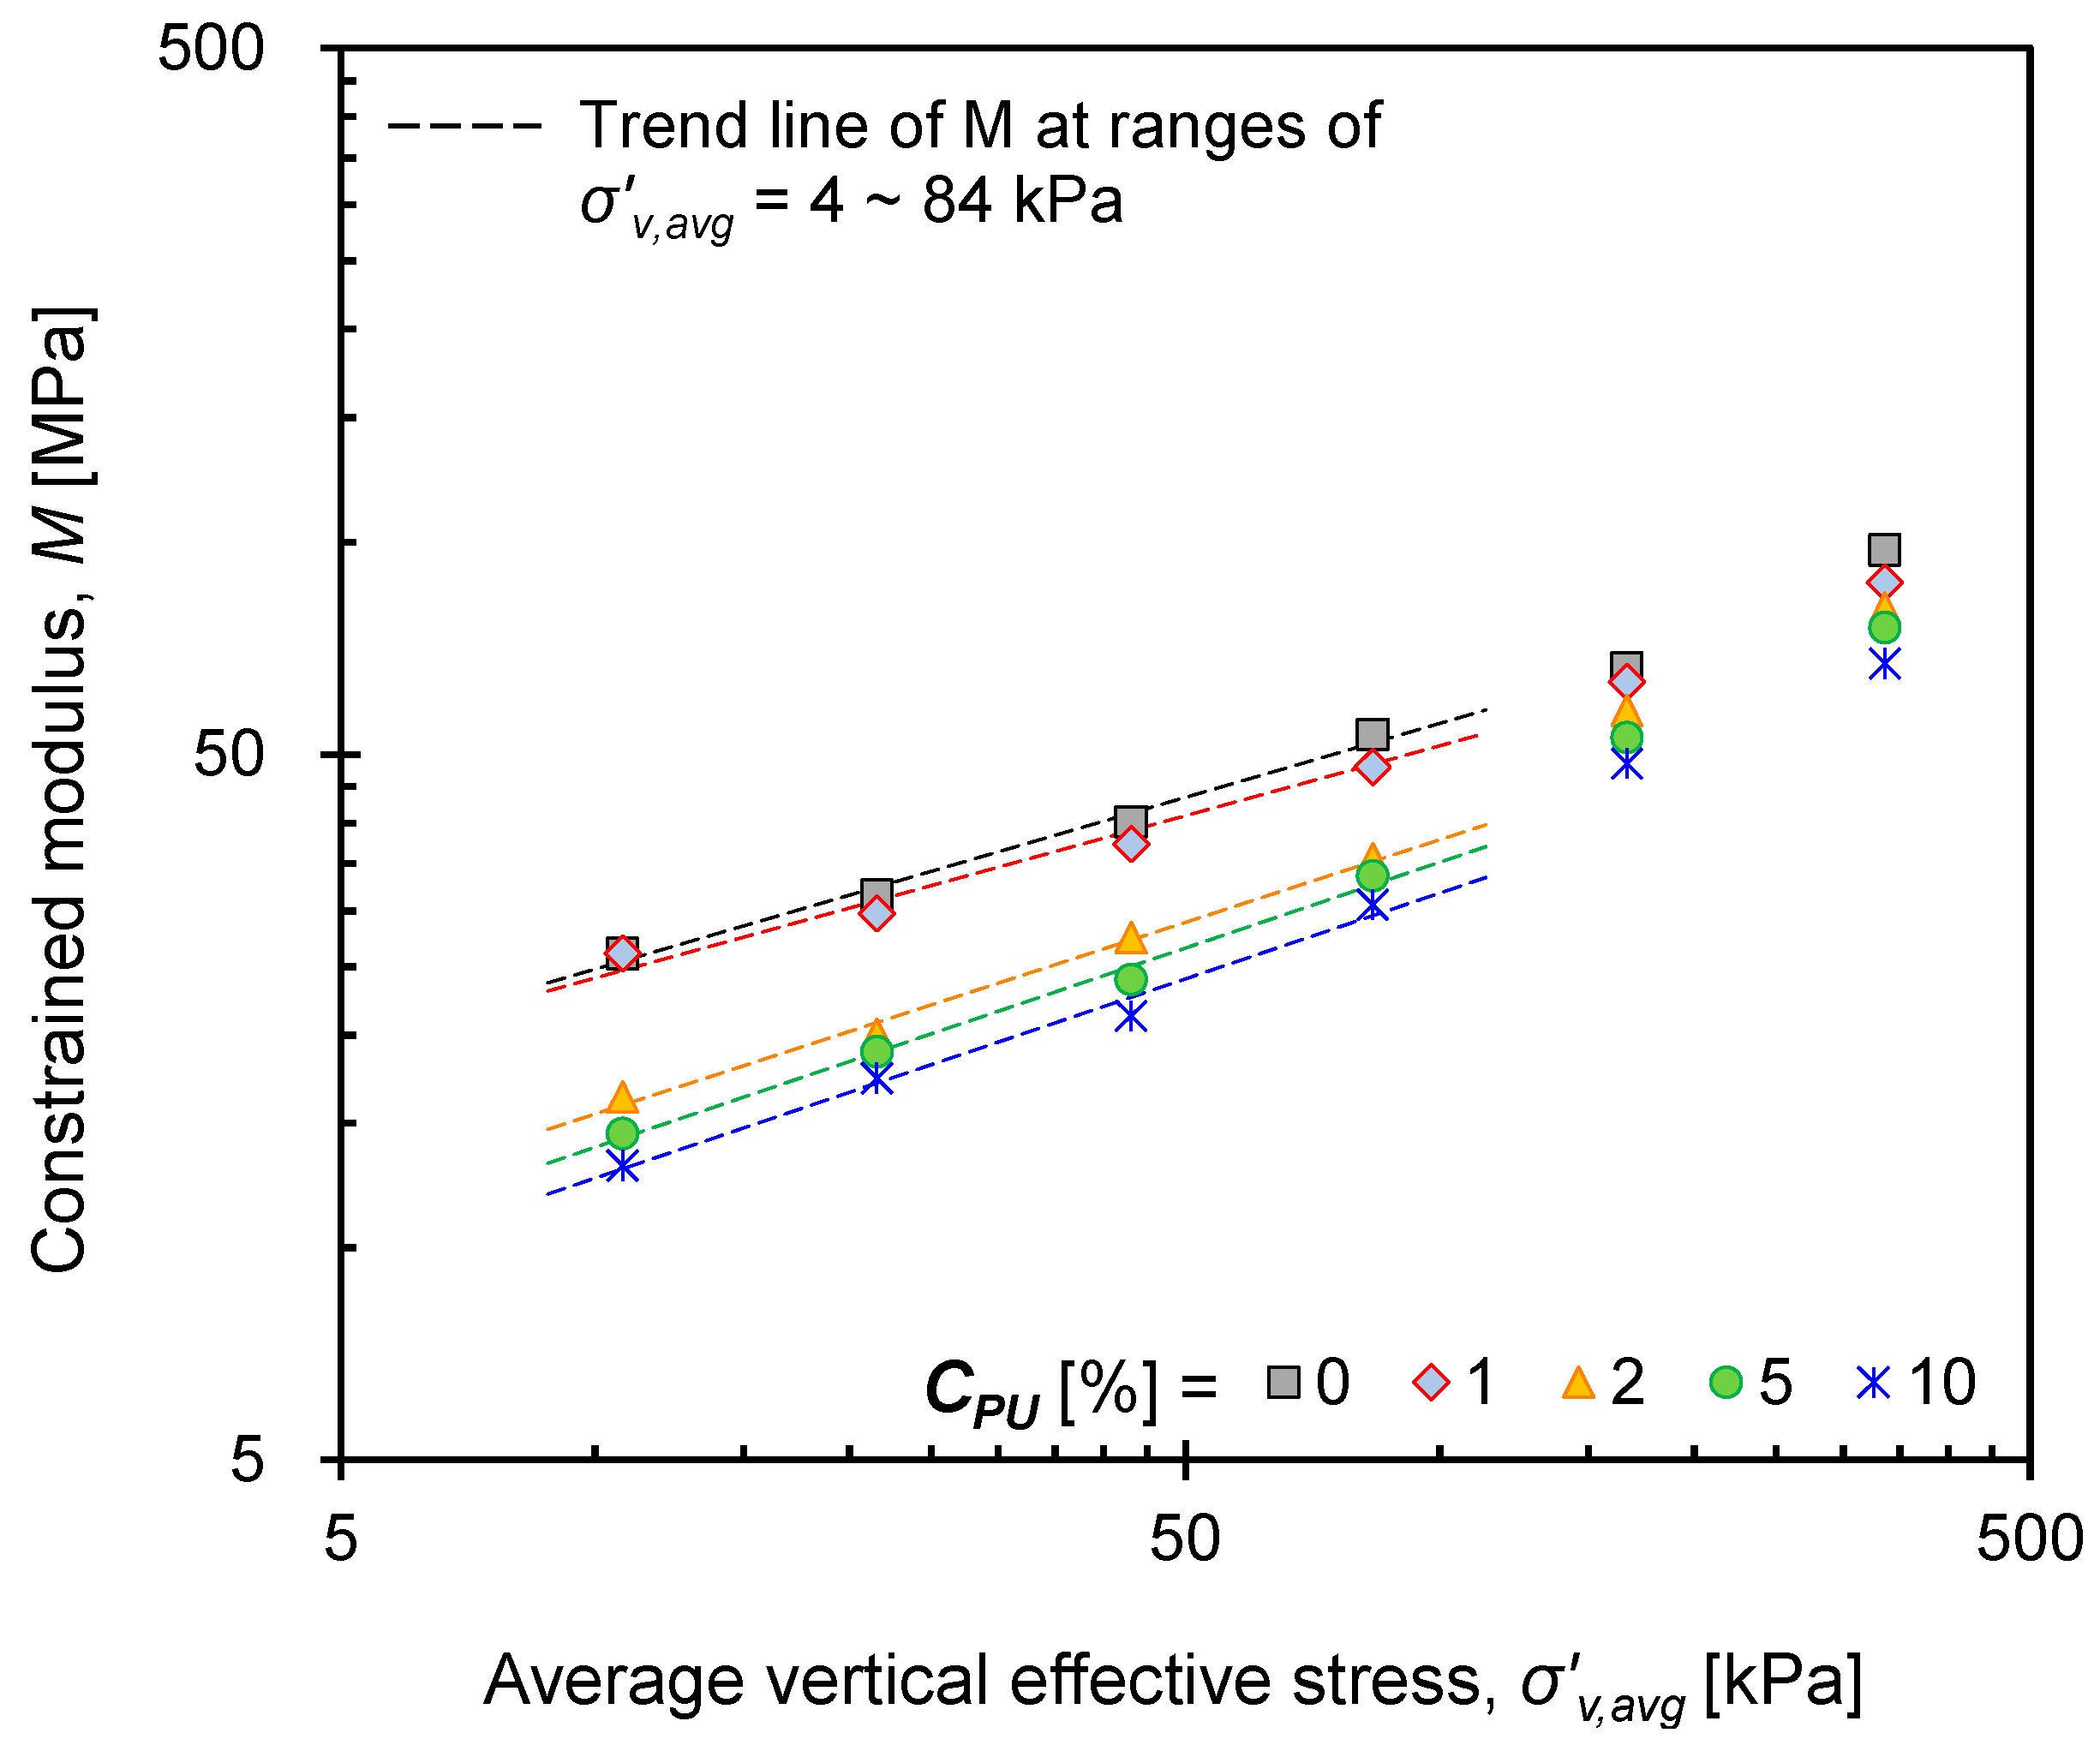
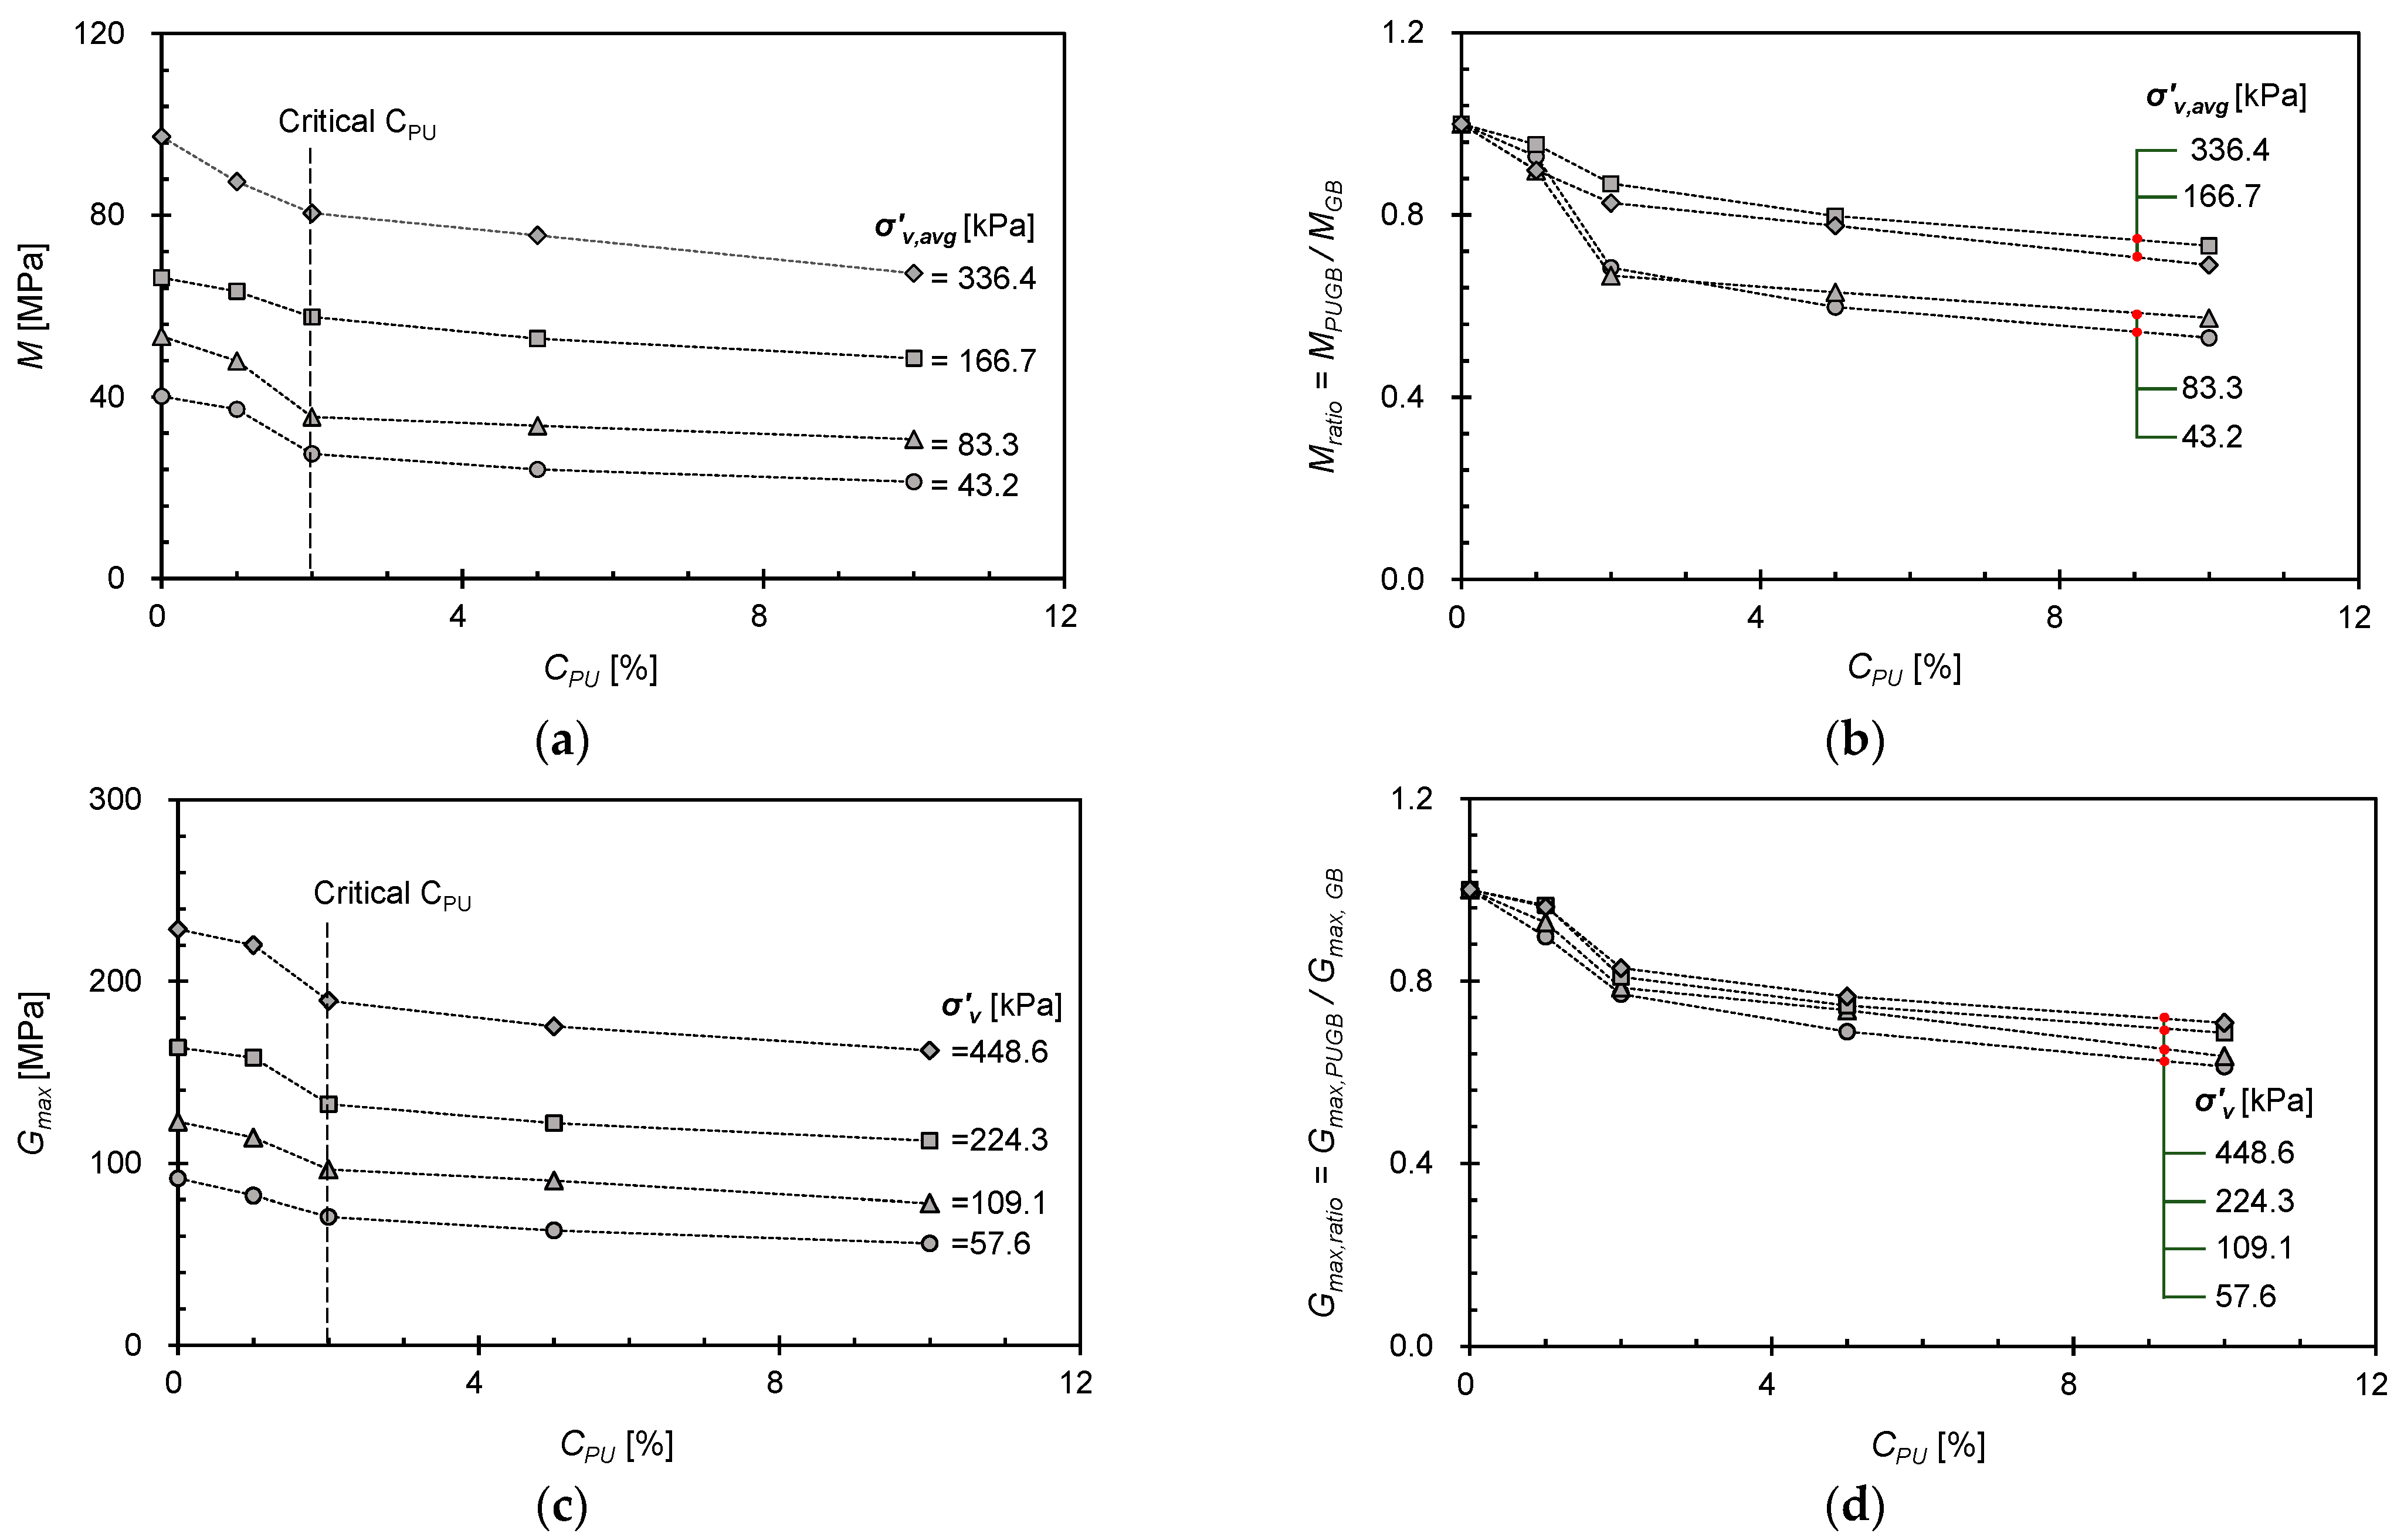
4.2. Variation and Transition Behavior of M and Gmax with CPU

As examined, the behaviors of the PUGB mixtures were controlled by CPU: the constrained modulus (M) represents the stress-dependent deformation due to fabric and skeletal changes under intermediate strain, while the maximum shear modulus (Gmax) was influenced by the interparticle contact characteristics under small strains [36,48]. The effects of CPU on each modulus at various stress levels are compared in Figure 10a,c. As the total particle contact number increased with the (average) vertical effective stress (σ’v, or σ’v,avg), followed by an increase in interparticle contact stiffness, both M and Gmax increased. As CPU increased, M and Gmax decreased because the surface roughness decreased, which facilitated particle rearrangement and reduced particle contact stiffness. The variation of M, however, showed stress-dependent behavior that could be distinguished at σ’v,avg = ~100 kPa, as summarized in Figure 6. To evaluate the stress-dependent behaviors of both M and Gmax, the modulus ratio (Mratio = MPUGB-GB/MGB or Gmax,ratio = Gmax,PUGB-GB/Gmax,GB), which is the ratio between the moduli of the mixture and those of pure GB, was compared (Figure 10b,d). The comparison results clearly show that the variation of the Mratio for CPU is divided at σ’v,avg = ~100 kPa (Figure 10b), while the constant trend of the Gmax,ratio is according to the stress level (Figure 10d). Thus, it can be interpreted that the effect of the polymer coating on the GB surface depends on both stress and strain. Figure 10 clearly shows a significant decrease in M and Gmax at CPU = ~2%, after which the effect of CPU was negligible (Figure 10a,c). Therefore, CPU = ~2% can be assumed to be the critical CPU for PUGB particles to start controlling the mixture behavior.
The modulus ratio such as Mratio and Gmax,ratio of tested PUGB-GB mixtures were then compared with those of rubber-sand mixtures reported by Lee et al. [36]. Lee et al. [36] performed the one-dimensional compression test of rubber-sand mixtures prepared with various size ratios (SR = medium diameter ratio between rubber and sand = D50,rubber/D50,sand) and volumetric sand fractions (=Vsand/Vtotal). The modulus ratios (Mratio and Gmax,ratio) of tested PUGB-GB mixtures were plotted with the modulus ratios of the rubber-sand mixtures at three representative SRs including larger (SR = 4.7), similar (SR = 1.0), and smaller (SR = 0.35) rubber compared to sand and are shown in Figure 11. Note that the SR of PUGB is close to 1.0. The weight fractions of the rubber-sand mixtures are calculated based on the volumetric sand fraction given the specific gravity of sand (Gs,sand = 2.62) and rubber (Gs,rubber = 1.16). The modulus ratio at a specific stress level is computed by averaging the modulus ratio of applied stresses that come before and after the given stress, in sequential order. Figure 11 demonstrates that PUGB-GB mixtures possess a significant advantage in terms of their larger Mratio, indicating reduced compressibility compared with rubber-sand mixtures. Furthermore, the Gmax,ratio of PUGB-GB mixtures is similar to that of rubber-sand mixtures. These results suggest that PUGB-GB mixtures provide improved performance in terms of compressibility while maintaining Gmax similar to that of pure geomaterials.
Further analysis on Gmax was performed to reveal a “measure of state” because Gmax is known to be controlled by the nature of interparticle contact and coordination [41]. The Gmax values of uncemented granular materials can be predicted using the following semiempirical power function in conjunction with the effective vertical stress and mass density of the material (ρ), as suggested by [28]:
G m a x = ρ V s 2 = A ( σ v 1   k P a ) B
where A and B = experimentally determined factor and exponent, respectively. The A-factor denotes Gmax of the mixture at the σ v of 1 kPa, which is related to the initial packing of the mixtures, while the B-exponent indicates the stress sensitivity of Gmax reflecting the contact behavior and fabric changes within mixtures [41]. Generally, the A-factor increases while the B-exponent decrease as the stiffness of the mixture increases [41,49]. Therefore, the increase and decrease of the A-factor and B-exponent with the CPU increment indicates the decrease in material stiffness with CPU (Figure 12). Moreover, the remarkable changes in the A-factor and B-exponent are observed at CPU = ~2%, which is the critical CPU. Still, the B-exponent appeared to be similar to that of pure GB, thus confirming that the introduction of PUGB particles did not alter the global behavioral properties of the mixtures within the tested CPU range.

4.3. Potential Use of Surface-Modified Materials as Geotechnical Materials

The behaviors of the PUGB-GB mixtures could lead to several advantages over those of the conventional soil-rubber mixtures. An increase in the rubber content of a soil-rubber mixture increases the damping ratio of the mixture owing to the material properties of rubber [50,51,52], but at the same time increases the compressibility of the mixture [36,53]. However, for PUGB-GB mixtures, the increase in compressibility was not as large as those for soil-rubber mixtures despite the increase in CPU (Figure 11). Although it was necessary to confirm the dynamic behavior according to the shear strain rate through additional resonant column tests, it is presumed that the dynamic behavior of the PUGB-GB mixture will improve owing to the influence of PU polymer. Therefore, the PUGB-GB mixtures can possibly be utilized as new geomaterials that overcome the shortcomings of traditional soil-rubber mixtures.

5. Conclusions

This study aims to improve the functionality of glass beads (GB) by synthesizing polyurethane on their surface while also evaluating the mechanical properties of their mixtures with polymerized particles (PUGB). One-dimensional compression tests using an instrumented oedometer cell equipped with bender elements were performed to investigate the effect of the contents of the polymerized particles (CPU) on the constrained and shear moduli of their mixtures. The key findings can be summarized as follows:
(1)
Polymer coating on the GB surface reduced the surface roughness, increasing the contact area of the particles as the CPU increased. The intrinsic adhesion of the polymer increased the maximum void ratio of PUGB-GB mixtures. However, the minimum void ratios of the mixtures showed negligible changes with CPU because the adhesion could not withstand the stress applied during the vibration table test.
(2)
Lower constrained modulus (M) was observed for the PUGB-GB mixture with higher CPU as the vertical deformation increased due to an increase in the initial void ratio of the mixture and a decrease in surface roughness.
(3)
The shear wave velocity (Vs) of the mixtures decreased with CPU because coated polymer reduced the contact stiffness between particles.
(4)
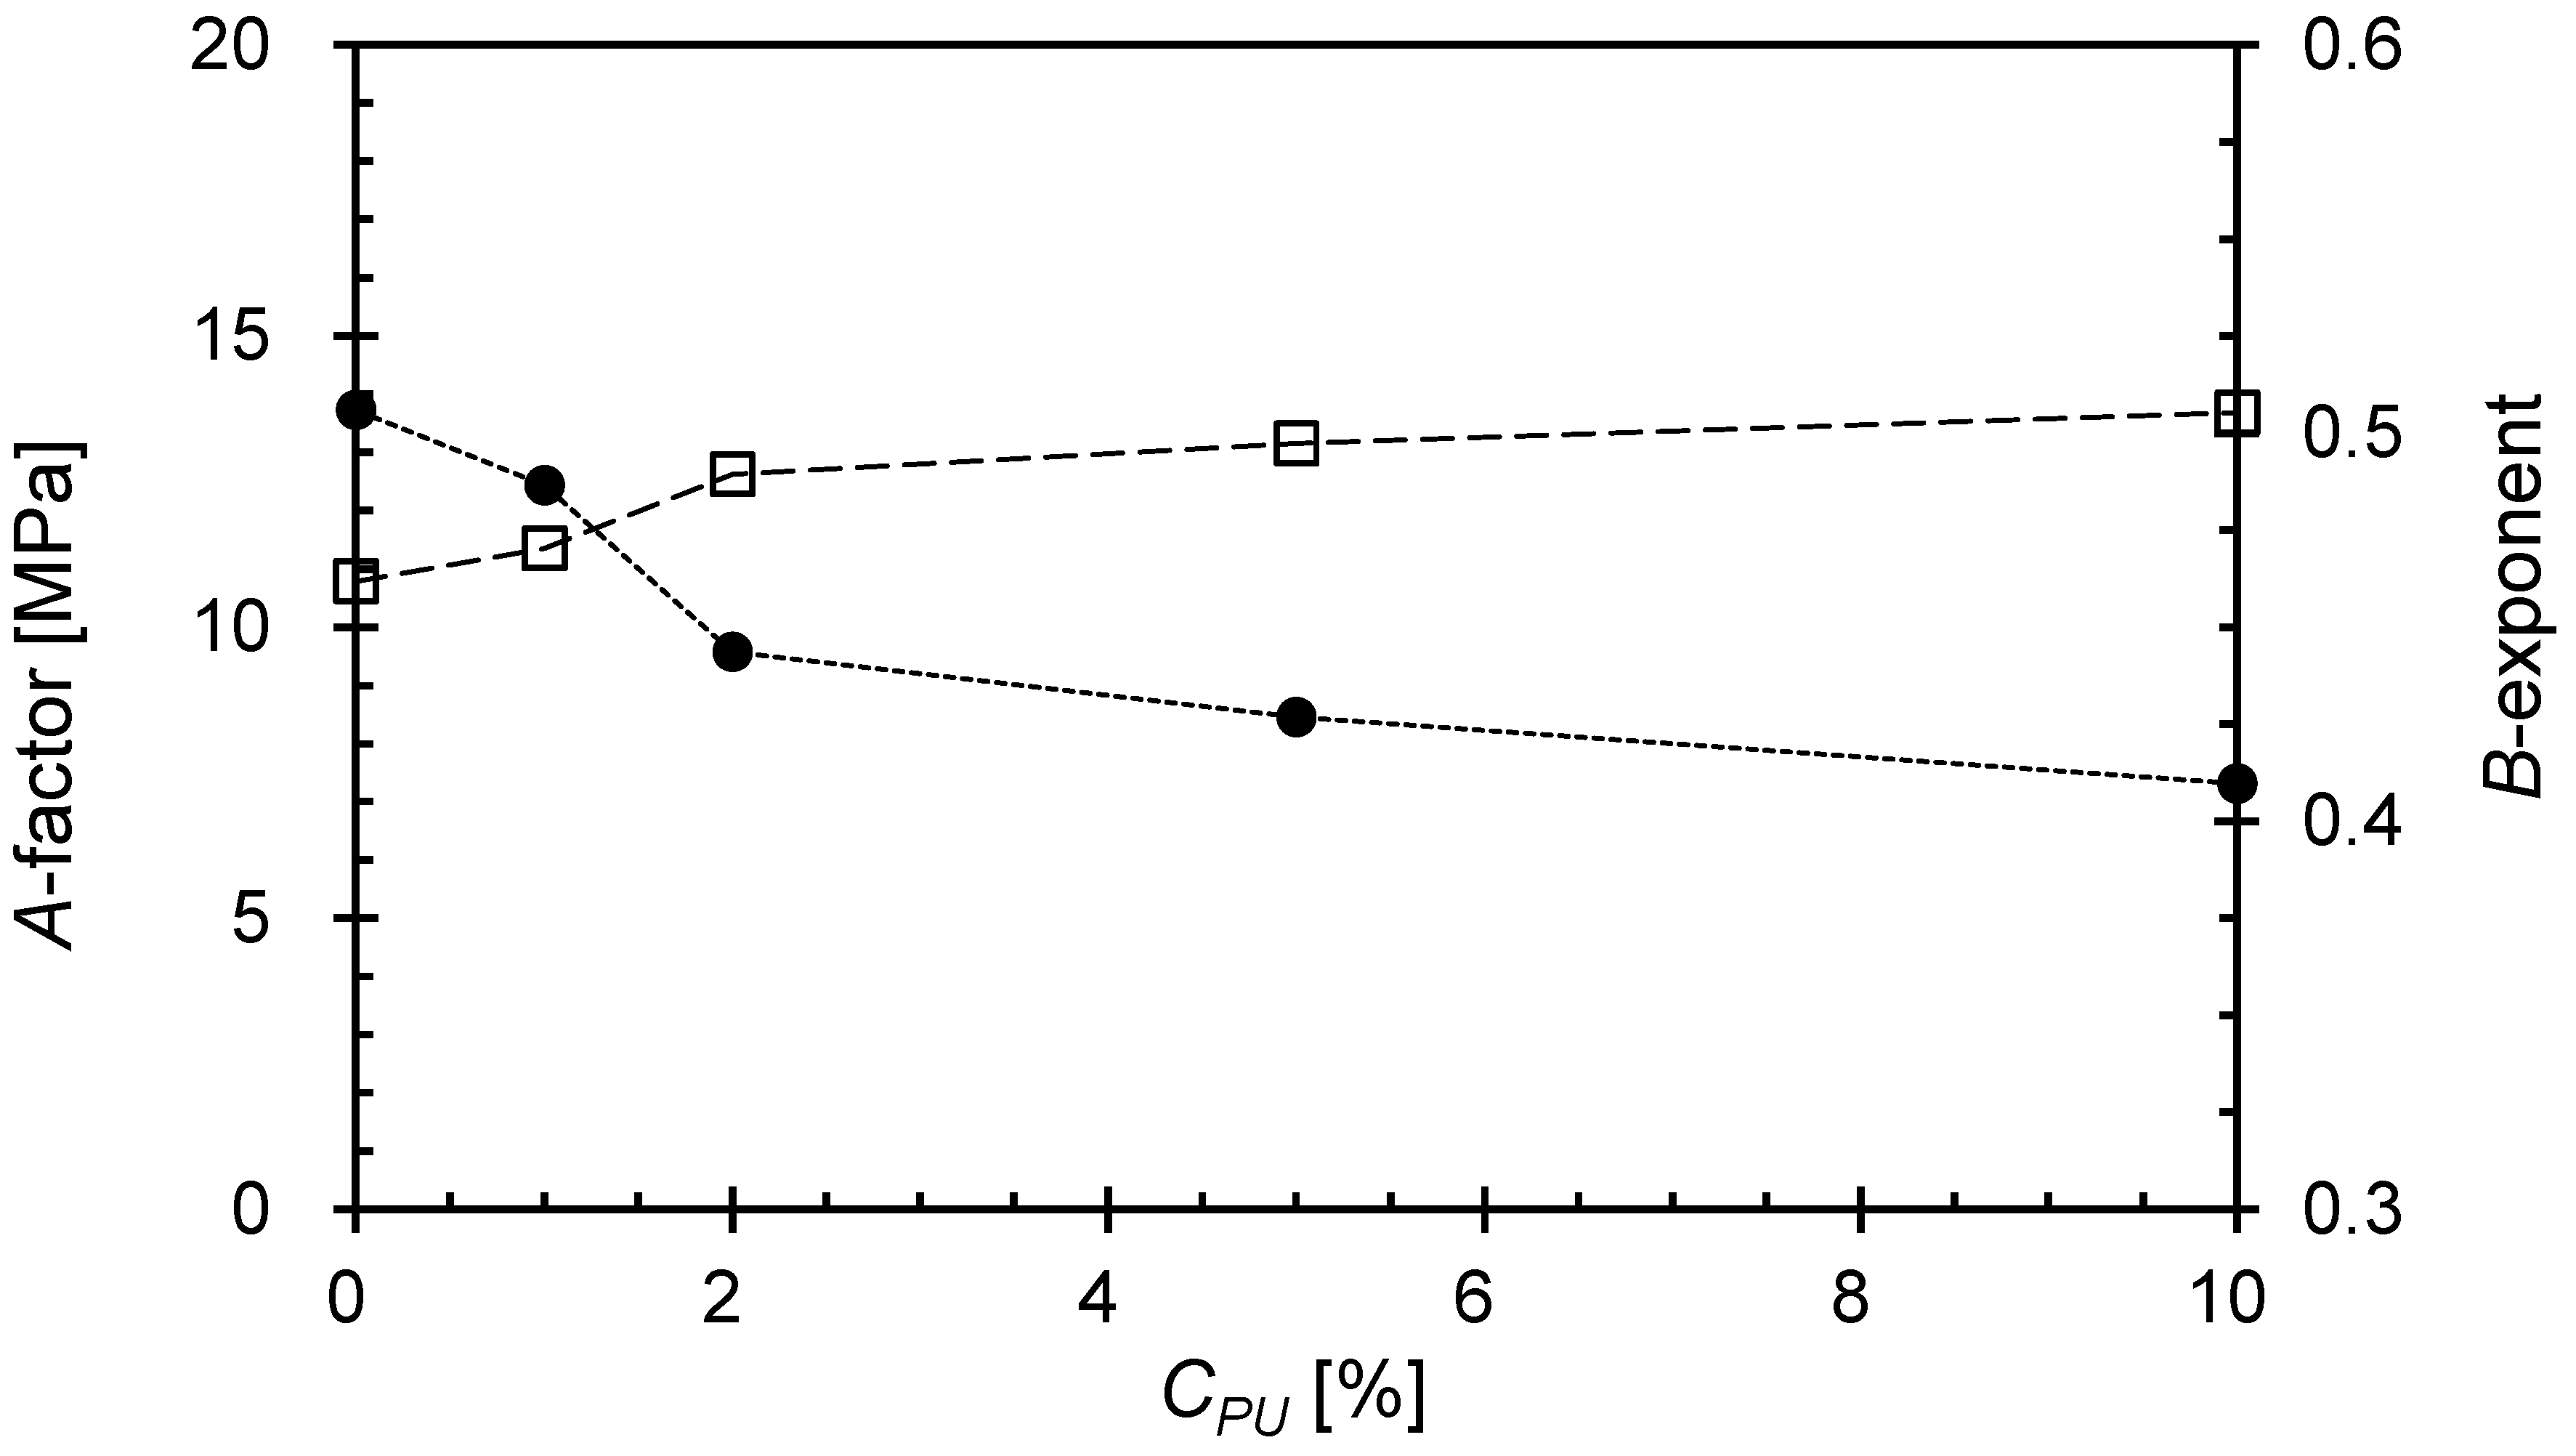
The critical CPU, at which the PUGB particles start to become involved in the load-carrying skeleton of the mixture, was found to be ~2%. This finding was also confirmed by the A-factor and B-exponent values, which describe the measured state of the maximum shear modulus (Gmax), which are also found to vary significantly at CPU = ~2%.
(5)
The stress- and strain- dependent behavior of the PUGB-GB mixture is demonstrated by comparing the evolution of modulus, where the trends of M exhibit changes at certain average stress, while variation trends of Gmax remain constant over the ranges of applied stress.
(6)
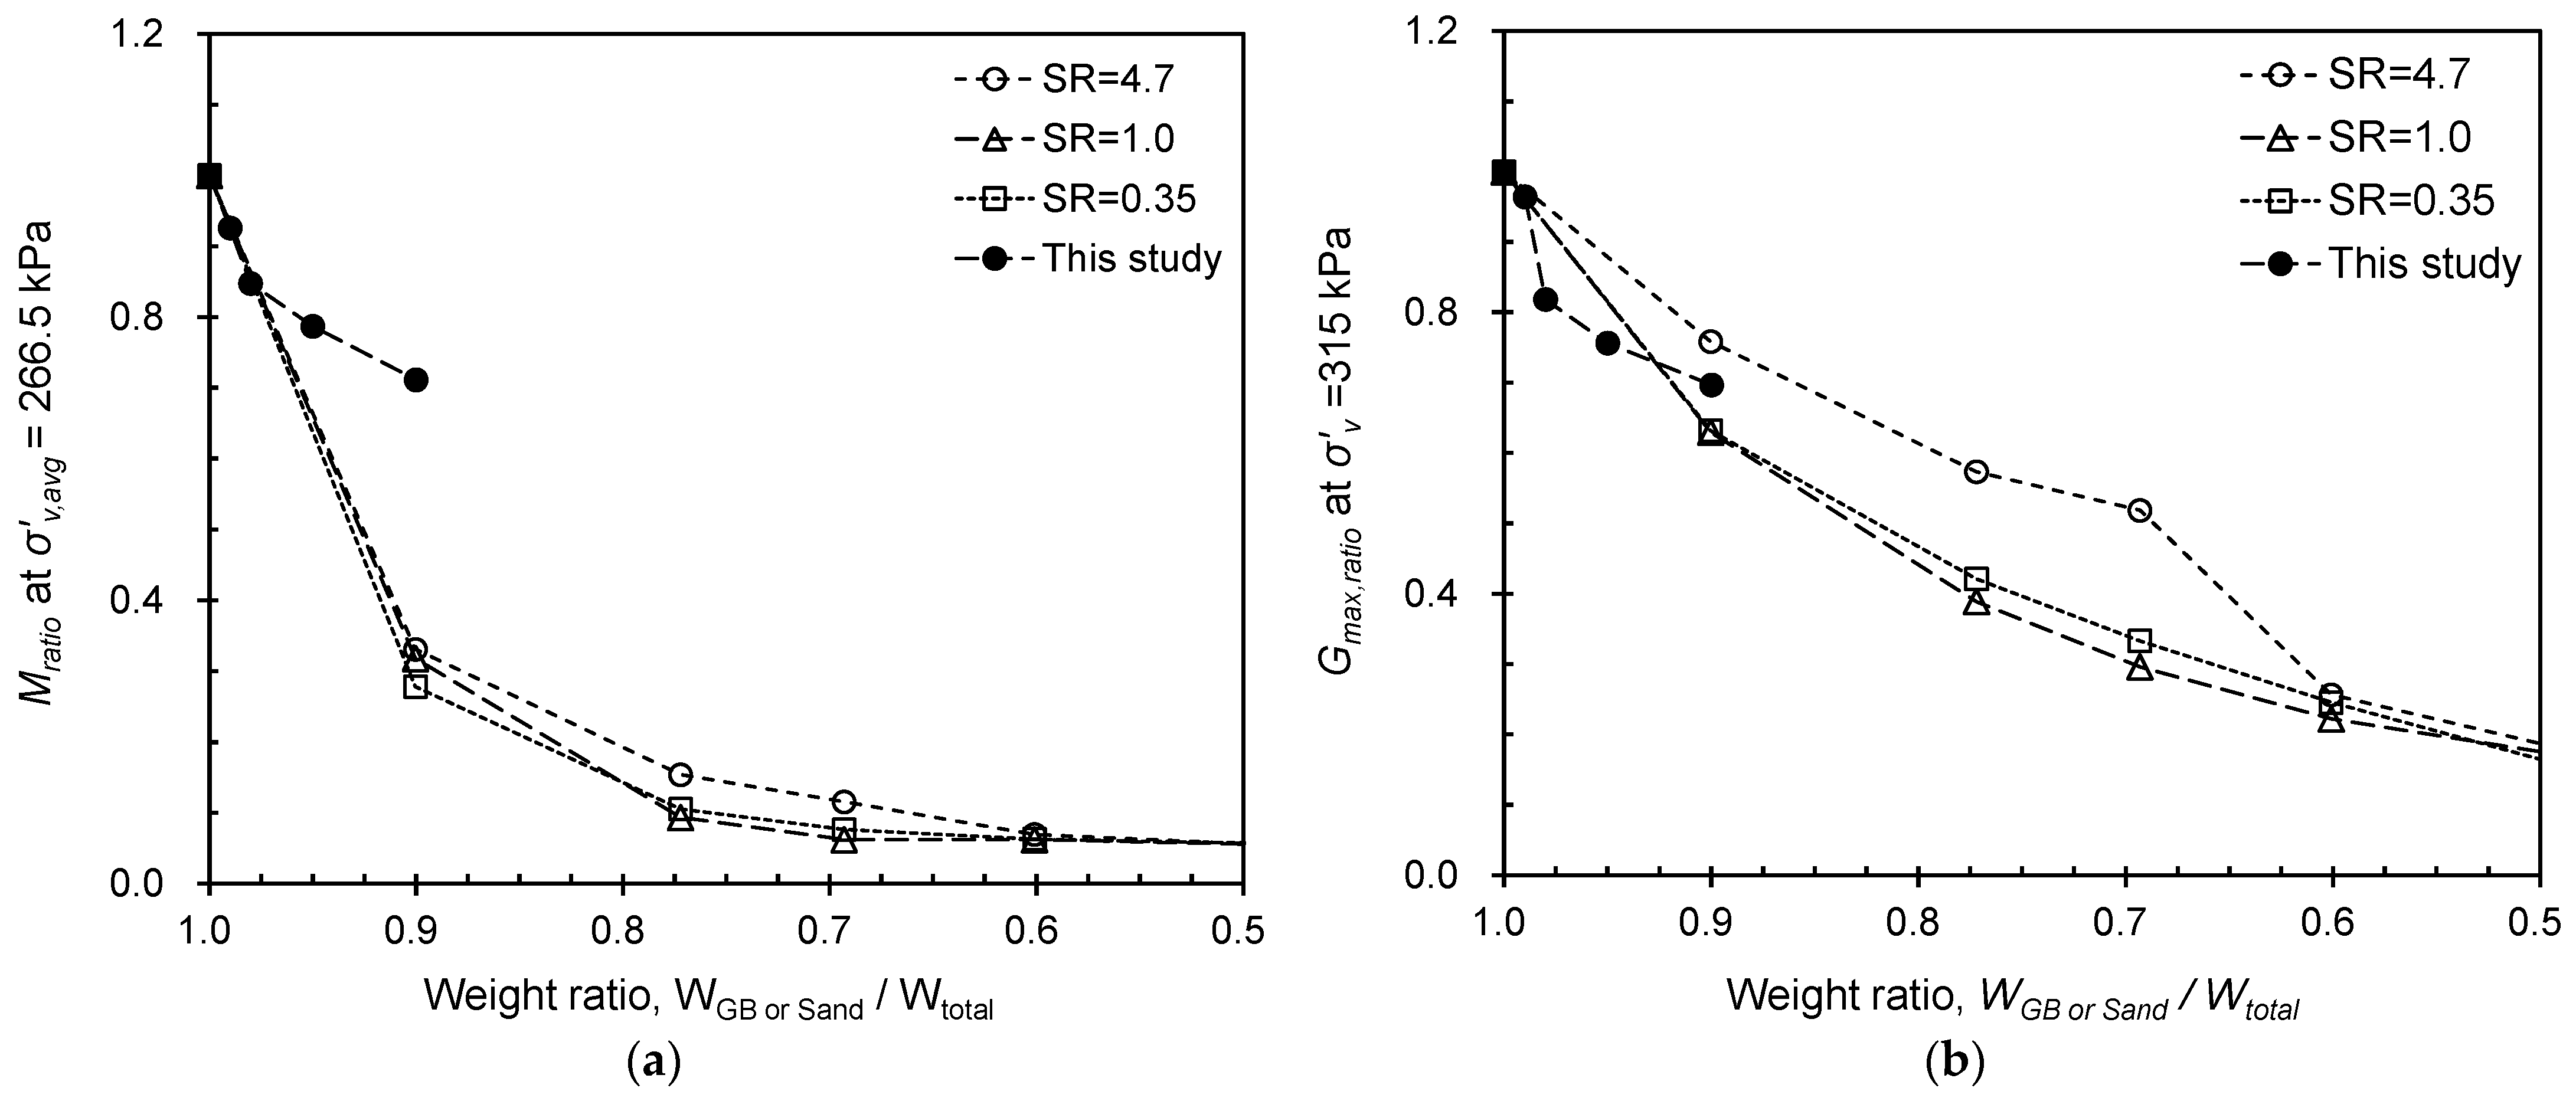
Comparing the behavior of PUGB-GB mixtures and the rubber-sand mixtures, it can be seen that the introduction of PUGB particles leads to a smaller M reduction with a similar Gmax of the mixture compared to rubber.
This study evaluated the potential application of polymer coating for enhancing the performance of PUGB-GB mixtures. Further studies on the analysis of the dynamic behavior of PUGB-GB mixtures are expected to expand their promising prospects for various applications.

Author Contributions

Formal analysis, B.Y., H.C. and C.L.; Writing—original draft, B.Y.; Writing—review & editing, C.L. All authors have read and agreed to the published version of the manuscript.

Funding

This work was supported by a National Research Foundation of Korea (NRF) grant funded by the Korea government (MSIT) (No. NRF-2022R1A4A1033838).

Institutional Review Board Statement

Not applicable.

Informed Consent Statement

Not applicable.

Data Availability Statement

All data, models, and code generated or used during the study appear in the published article.

Acknowledgments

Special thanks to Ewusi Wilson Rodney who conducted a series of tests, we have gained valuable insights/obtained crucial data/achieved significant progress.

Conflicts of Interest

The authors declare no conflict of interest.

References

  1. Susilorini, R.M.I.R.; Hardjasaputra, H.; Tudjono, S.; Hapsari, G.; Wahyu, S.R.; Hadikusumo, G.; Sucipto, J. The Advantage of Natural Polymer Modified Mortar with Seaweed: Green Construction Material Innovation for Sustainable Concrete. Procedia Eng. 2014, 95, 419–425. [Google Scholar] [CrossRef] [Green Version]
  2. Gao, S.; Zhao, G.; Guo, L.; Zhou, L.; Yuan, K. Utilization of coal gangue as coarse aggregates in structural concrete. Constr. Build. Mater. 2021, 268, 121212. [Google Scholar] [CrossRef]
  3. Soliman, A.; Hafeez, G.; Erkmen, E.; Ganesan, R.; Ouf, M.; Hammad, A.; Eicker, U.; Moselhi, O. Innovative construction material technologies for sustainable and resilient civil infrastructure. Mater. Today Proc. 2022, 60, 365–372. [Google Scholar] [CrossRef]
  4. Vincens, E.; Witt, K.J.; Homberg, U. Approaches to determine the constriction size distribution for understanding filtration phenomena in granular materials. Acta Geotech. 2015, 10, 291–303. [Google Scholar] [CrossRef]
  5. Roy, S.; Bhalla, S.K. Role of geotechnical properties of soil on civil engineering structures. Resour. Environ. 2017, 7, 103–109. [Google Scholar]
  6. Afrin, H. A review on different types soil stabilization techniques. Int. J. Transp. Eng. Technol. 2017, 3, 19–24. [Google Scholar] [CrossRef] [Green Version]
  7. Choo, H.; Yoon, B.; Lee, W.; Lee, C. Evaluation of compressibility and small strain stiffness characteristics of sand reinforced with discrete synthetic fibers. Geotext. Geomembr. 2017, 45, 331–338. [Google Scholar] [CrossRef]
  8. MolaAbasi, H.; Naderi Semsani, S.; Saberian, M.; Khajeh, A.; Li, J.; Harandi, M. Evaluation of the long-term performance of stabilized sandy soil using binary mixtures: A micro- and macro-level approach. J. Clean. Prod. 2020, 267, 122209. [Google Scholar] [CrossRef]
  9. Choo, H.; Lee, W.; Lee, C. Compressibility and small strain stiffness of kaolin clay mixed with varying amounts of sand. KSCE J. Civ. Eng. 2017, 21, 2152–2161. [Google Scholar] [CrossRef]
  10. Huang, J.; Kogbara, R.B.; Hariharan, N.; Masad, E.A.; Little, D.N. A state-of-the-art review of polymers used in soil stabilization. Constr. Build. Mater. 2021, 305, 124685. [Google Scholar] [CrossRef]
  11. Aboulayt, A.; Jaafri, R.; Samouh, H.; Cherki El Idrissi, A.; Roziere, E.; Moussa, R.; Loukili, A. Stability of a new geopolymer grout: Rheological and mechanical performances of metakaolin-fly ash binary mixtures. Constr. Build. Mater. 2018, 181, 420–436. [Google Scholar] [CrossRef]
  12. Garga, V.K.; O’Shaughnessy, V. Tire-reinforced earthfill. Part 1: Construction of a test fill, performance, and retaining wall design. Can. Geotech. J. 2000, 37, 75–96. [Google Scholar] [CrossRef]
  13. Bosscher, P.J.; Edil, T.B.; Kuraoka, S. Design of highway embankments using tire chips. J. Geotech. Geoenvironmental Eng. 1997, 123, 295–304. [Google Scholar] [CrossRef]
  14. Poh, P.S.; Broms, B.B. Slope stabilization using old rubber tires and geotextiles. J. Perform. Constr. Facil. 1995, 9, 76–79. [Google Scholar] [CrossRef]
  15. Zornberg, J.G.; Christopher, B.R.; LaRocque, C.J. Applications of tire bales in transportation projects. In Recycled Materials in Geotechnics; ASCE: Reston, VA, USA, 2005; pp. 42–60. [Google Scholar]
  16. Masad, E.; Taha, R.; Ho, C.; Papagiannakis, T. Engineering properties of tire/soil mixtures as a lightweight fill material. Geotech. Test. J. 1996, 19, 297–304. [Google Scholar]
  17. Mohajerani, A.; Burnett, L.; Smith, J.V.; Markovski, S.; Rodwell, G.; Rahman, M.T.; Kurmus, H.; Mirzababaei, M.; Arulrajah, A.; Horpibulsuk, S.; et al. Recycling waste rubber tyres in construction materials and associated environmental considerations: A review. Resour. Conserv. Recycl. 2020, 155, 104679. [Google Scholar] [CrossRef]
  18. Yang, Z.; Zhang, Q.; Shi, W.; Lv, J.; Lu, Z.; Ling, X. Advances in Properties of Rubber Reinforced Soil. Adv. Civ. Eng. 2020, 2020, 6629757. [Google Scholar] [CrossRef]
  19. Ding, Y.; Zhang, J.; Chen, X.; Wang, X.; Jia, Y. Experimental investigation on static and dynamic characteristics of granulated rubber-sand mixtures as a new railway subgrade filler. Constr. Build. Mater. 2021, 273, 121955. [Google Scholar] [CrossRef]
  20. Madhusudhan, B.R.; Boominathan, A.; Banerjee, S. Factors Affecting Strength and Stiffness of Dry Sand-Rubber Tire Shred Mixtures. Geotech. Geol. Eng. 2019, 37, 2763–2780. [Google Scholar] [CrossRef]
  21. Feng, Z.-Y.; Sutter, K.G. Dynamic properties of granulated rubber/sand mixtures. Geotech. Test. J. 2000, 23, 338–344. [Google Scholar]
  22. Senetakis, K.; Anastasiadis, A.; Pitilakis, K.; Souli, A.; Edil, T.; Dean, S. Dynamic behavior of sand/rubber mixtures. Part II: Effect of rubber content on G/Go-c-DT curves and volumetric threshold strain. J. ASTM Int. 2012, 9, 103711–1037112. [Google Scholar] [CrossRef]
  23. Li, B.; Huang, M.; Zeng, X. Dynamic Behavior and Liquefaction Analysis of Recycled-Rubber Sand Mixtures. J. Mater. Civ. Eng. 2016, 28, 04016122. [Google Scholar] [CrossRef]
  24. Madhusudhan, B.R.; Boominathan, A.; Banerjee, S. Static and Large-Strain Dynamic Properties of Sand–Rubber Tire Shred Mixtures. J. Mater. Civ. Eng 2017, 29, 04017165. [Google Scholar] [CrossRef]
  25. Rios, S.; Kowalska, M.; Viana da Fonseca, A. Cyclic and Dynamic Behavior of Sand–Rubber and Clay–Rubber Mixtures. Geotech. Geol. Eng. 2021, 39, 3449–3467. [Google Scholar] [CrossRef]
  26. Chen, L.; Wang, X.; Jia, Z.; Luo, Y.; Jia, D. Use of precipitated silica with silanol groups as an inorganic chain extender in polyurethane. Mater. Des. 2015, 87, 324–330. [Google Scholar] [CrossRef]
  27. Arslan, G.; Özmen, M.; Gündüz, B.; Zhang, X.; Ersöz, M. Surface modification of glass beads with an aminosilane monolayer. Turk. J. Chem. 2006, 30, 203–210. [Google Scholar]
  28. Lee, J.-S.; Santamarina, J.C. Bender elements: Performance and signal interpretation. J. Geotech. Geoenvironmental Eng. 2005, 131, 1063–1070. [Google Scholar] [CrossRef] [Green Version]
  29. Ozmen, M.; Can, K.; Akin, I.; Arslan, G.; Tor, A.; Cengeloglu, Y.; Ersoz, M. Surface modification of glass beads with glutaraldehyde: Characterization and their adsorption property for metal ions. J. Hazard. Mater. 2009, 171, 594–600. [Google Scholar] [CrossRef] [PubMed]
  30. Chan, C.-K.; Peng, S.-L.; Chu, I.M.; Ni, S.-C. Effects of heat treatment on the properties of poly(methyl methacrylate)/silica hybrid materials prepared by sol–gel process. Polymer 2001, 42, 4189–4196. [Google Scholar] [CrossRef]
  31. Zappone, B.; Rosenberg, K.J.; Israelachvili, J. Role of nanometer roughness on the adhesion and friction of a rough polymer surface and a molecularly smooth mica surface. Tribol. Lett. 2007, 26, 191–201. [Google Scholar] [CrossRef]
  32. Liu, D.; Sandeep, C.S.; Senetakis, K.; Nardelli, V.; Lourenço, S.D.N. Micromechanical behaviour of a polymer-coated sand. Powder Technol. 2019, 347, 76–84. [Google Scholar] [CrossRef]
  33. Yu, M.; Ji, A.-H.; Dai, Z.-D. Effect of microscale contact state of polyurethane surface on adhesion and friction. J. Bionic Eng. 2006, 3, 87–91. [Google Scholar] [CrossRef]
  34. Lambe, T.W.; Whitman, R.V. Soil Mechanics, Series in Soil Engineering; John Wiley & Sons: Hoboken, NJ, USA, 1969. [Google Scholar]
  35. Lee, C.; Lee, J.S.; Lee, W.; Cho, T.H. Experiment setup for shear wave and electrical resistance measurements in an oedometer. Geotech. Test. J. 2008, 31, 8. [Google Scholar]
  36. Lee, C.; Truong, Q.H.; Lee, W.; Lee, J.-S. Characteristics of Rubber-Sand Particle Mixtures according to Size Ratio. J. Mater. Civ. Eng. 2010, 22, 323–331. [Google Scholar] [CrossRef]
  37. Knox, D.P.; Stokoe, K.H.; Kopperman, S.E. Effect of State of Stress on Velocity of Low-Amplitude Shear Waves Propagating along Princiapl Stress Directions in Dry Sand; University of Texas: Austin, TX, USA, 1982. [Google Scholar]
  38. Roesler, S.K. Anisotropic shear modulus due to stress anisotropy. J. Geotec. Eng. Div. 1979, 105, 871–880. [Google Scholar] [CrossRef]
  39. Yu, P.; Richart, F., Jr. Stress ratio effects on shear modulus of dry sands. J. Geotech. Eng. 1984, 110, 331–345. [Google Scholar] [CrossRef]
  40. Santamarina, J.; Cascante, G. Stress anisotropy and wave propagation: A micromechanical view. Can. Geotech. J. 1996, 33, 770–782. [Google Scholar] [CrossRef]
  41. Santamarina, J.C.; Klein, K.A.; Fam, M.A. Soils and Waves; J. Wiley & Sons: New York, NY, USA, 2001. [Google Scholar]
  42. Ramirez, M.S.; Park, J.; Terzariol, M.; Jiang, J.; Santamarina, J.C. Shallow Seafloor Sediments: Density and Shear Wave Velocity. J. Geotech. Geoenvironmental Eng. 2023, 149, 04023022. [Google Scholar] [CrossRef]
  43. Cha, M.; Santamarina, J.C.; Kim, H.-S.; Cho, G.-C. Small-strain stiffness, shear-wave velocity, and soil compressibility. J. Geotech. Geoenvironmental Eng. 2014, 140, 06014011. [Google Scholar] [CrossRef] [Green Version]
  44. Ku, T.; Mayne, P.; Gutierrez, B. Hierarchy of V s modes and stress-dependency in geomaterials. In Deformation Characteristics of Geomaterials; IOS Press: Amsterdam, The Netherlands, 2011; pp. 533–540. [Google Scholar]
  45. Ku, T. Geostatic Stress State Evaluation by Directional Shear Wave Velocities, with Application towards Geocharacterization at Aiken, SC; Georgia Institute of Technology: Atlanta, GA, USA, 2012. [Google Scholar]
  46. Ku, T.; Subramanian, S.; Moon, S.-W.; Jung, J. Stress Dependency of Shear-Wave Velocity Measurements in Soils. J. Geotech. Geoenvironmental Eng. 2017, 143, 04016092. [Google Scholar] [CrossRef]
  47. Park, J.; Santamarina, J.C. Revised Soil Classification System for Coarse-Fine Mixtures. J. Geotech. Geoenvironmental Eng. 2017, 143, 04017039. [Google Scholar] [CrossRef] [Green Version]
  48. Lee, J.; Dodds, J.; Santamarina, J.C. Behavior of Rigid-Soft Particle Mixtures. J. Mater. Civ. Eng 2007, 19, 179–184. [Google Scholar] [CrossRef] [Green Version]
  49. Choo, H.; Burns, S. Effect of overconsolidation ratio on dynamic properties of binary mixtures of silica particles. Soil Dyn. Earthq. Eng. 2014, 60, 44–50. [Google Scholar] [CrossRef]
  50. Anastasiadis, A.; Senetakis, K.; Pitilakis, K. Small-strain shear modulus and damping ratio of sand-rubber and gravel-rubber mixtures. Geotech. Geol. Eng. 2012, 30, 363–382. [Google Scholar] [CrossRef]
  51. Wu, Q.; Ma, W.J.; Liu, Q.; Zhao, K.; Chen, G. Dynamic shear modulus and damping ratio of rubber-sand mixtures with a wide range of rubber content. Mater. Today Commun. 2021, 27, 102341. [Google Scholar] [CrossRef]
  52. Zhong, X.; Zeng, X.; Rose, J. Shear modulus and damping ratio of rubber-modified asphalt mixes and unsaturated subgrade soils. J. Mater. Civ. Eng. 2002, 14, 496–502. [Google Scholar] [CrossRef]
  53. Neaz Sheikh, M.; Mashiri, M.; Vinod, J.; Tsang, H.-H. Shear and compressibility behavior of sand–tire crumb mixtures. J. Mater. Civ. Eng. 2013, 25, 1366–1374. [Google Scholar] [CrossRef]
Figure 1. Flow chart of experimental program.
Materials 16 04476 g001
Figure 2. FT-IR spectrum of (a) pretreated GB and (b) GB after synthesize process (i.e., PUGB).
Materials 16 04476 g002
Figure 3. SEM images of (a) pure GB and (b) PUGB with closeups in images to evaluate the relative surface roughness and (c) cross-section of PUGB showing the thickness of polymer layer.
Materials 16 04476 g003
Figure 4. Variation of extreme void ratios with CPU. Each dashed lines indicate emax and emin at CPU, respectively = 0% (i.e., pure GB).
Materials 16 04476 g004
Figure 5. Volume change for the mixtures of Dr = 40% during loading and unloading stages at a zero-lateral strain condition.
Materials 16 04476 g005
Figure 6. Evolution of the constrained modulus with the relative density during loading (shown only in the case of Dr = 60%).
Materials 16 04476 g006
Figure 7. Time series of the shear wave traces for selected mixtures with Dr = 60% during loading and unloading: (a) CPU = 0%; (b) CPU = 2%; and (c) CPU = 10%.
Materials 16 04476 g007
Figure 8. Evolution of measured shear wave velocity for selected specimens with Dr = 60% during loading and unloading. Solid and hollow markers indicate loading and unloading stages, respectively. Note that the dotted line in the figure denotes shear wave velocity for CPU = 10% in loading stage calculated by Equation (2).
Materials 16 04476 g008
Figure 9. Relationship between α-factor and β-exponent. Hollow markers in the figure indicate relation between the α-factor and the β-exponent for different soil types from previous studies [42,43,45,46,47]. Hollow squares, triangles, and circles denote clay, silt, sand, respectively.
Materials 16 04476 g009
Figure 10. Effect of CPU on modulus ((a) M and (c) Gmax) and modulus ratio ((b) Mratio and (d) Gmax,ratio) of PUGB mixtures at various stress level. Only the PUGB mixtures with Dr = 60% are shown.
Materials 16 04476 g010
Figure 11. Comparison of modulus ratio: (a) Mratio and (b) Gmax, ratio of PUGB mixtures with rubber-sand mixtures performed by Lee et al. [36] represented by hollow markers: circles, triangles and squares denote rubber-sand mixtures with SR = 4.7, 1.0 and 0.35, respectively.
Materials 16 04476 g011
Figure 12. Variation of A-factor (solid marker) and B-exponent (hollow marker) of Equation (3) according to CPU.
Materials 16 04476 g012
Table 1. Index properties of used materials in this study.
MaterialGlass Bead (GB)Device/Technique
Specific gravity, GS2.48Pycnometer
(ASTM D845)
Median particle size D50 [mm]0.51Sieve
(ASTM D6913)
Coefficient of uniformity, Cu1.22-
Coefficient of curvature, Cc0.97-
Extreme void ratioMinimum void ratio, emin0.55Vibratory Table
(ASTM D4253)
Maximum void ratio, emax0.69Funnel
(ASTM D4254)
Disclaimer/Publisher’s Note: The statements, opinions and data contained in all publications are solely those of the individual author(s) and contributor(s) and not of MDPI and/or the editor(s). MDPI and/or the editor(s) disclaim responsibility for any injury to people or property resulting from any ideas, methods, instructions or products referred to in the content.

