
Modelling of the Flow in the Process of Washing Out Automotive Catalyst Carriers with the PbLi Alloy

 ,
,  , , ,
, , ,
Abstract
1. Introduction
2. Numerical Model of the Process
3. Materials and Methods
4. Results
4.1. Computer Simulation Results
4.2. Analysis of Platinum Washing Out Results in a Device with a Magnetohydrodynamic Pump
5. Conclusions
Author Contributions
Funding
Institutional Review Board Statement
Informed Consent Statement
Data Availability Statement
Conflicts of Interest
References
- Available online: http://www.platinum.matthey.com-pgm_market_report_february_2018.pdf (accessed on 17 April 2019).
- Suoranta, T.; Zugazua, O.; Niemela, M.; Peramaki, P. Recovery of palladium, platinum, rhodium and ruthenium from catalyst materials using microwave-assisted leaching and cloud point extraction. Hydrometallurgy 2015, 154, 56–62. [Google Scholar] [CrossRef]
- Yoo, J.S. Metal recovery and rejuvenation of metal-loaded spent catalyst. Catal. Today 1998, 44, 27–46. [Google Scholar] [CrossRef]
- Hagelüken, C. Markets for the catalyst metals platinum, palladium and rhodium. Metall 2006, 1–2, 31–42. [Google Scholar]
- Chen, S.; Shen, S.; Cheng, Y.; Wang, H.; Lv, B.; Wang, F. Effect of O2, H2 and CO pretreatments on leaching Rh from spent auto-catalysts with acidic sodium chlorate solution. Hydrometallurgy 2014, 144–145, 69–78. [Google Scholar] [CrossRef]
- Lee, J.-Y.; Raju, B.; Kumar, B.N.; Park, H.K.; Reddy, B.R. Solvent extraction separation and recovery of palladium and recovery of palladium and platinum from chloride leach liquors of spent automobile catalyst. Sep. Purif. Technol. 2010, 73, 213–218. [Google Scholar] [CrossRef]
- Swain, B.; Jeong, J.; Kim, S.-K.; Lee, J.-C. Separation of platinum and palladium from chloride solutions by solvent extraction using Alamine 300. Hydrometallurgy 2010, 104, 1–7. [Google Scholar] [CrossRef]
- Pośpiech, B. Studies of platinum recovery from solutions after leaching of spent catalysts by solvent extraction. Physicochem. Probl. Miner. Processing 2012, 48, 239–246. [Google Scholar]
- Harajanto, S.; Cao, Y.; Shibayama, A.; Naitoh, I.; Nanami, T.; Koichi, K.; Okumura, Y.; Liu, K.; Fujita, T. Leaching of Pt, Pd and Rh from automotive catalyst residue in various chloride based solutions. Mater. Trans. 2006, 47, 129–135. [Google Scholar] [CrossRef]
- Jha, M.K.; Lee, J.; Kim, M.; Jeong, J.; Kim, B.-S.; Kumar, V. Hydrometallurgical recovery/recycling of platinum by the leaching of spent catalyst: A review. Hydrometallurgy 2013, 133, 23–32. [Google Scholar] [CrossRef]
- Barakat, M.A.; Mahamoud, M.H.H. Recovery of platinum from spent catalyst. Hydrometallurgy 2004, 72, 179–184. [Google Scholar] [CrossRef]
- Kim, C.-H.; Woo, S.I.; Jeon, S.H. Recovery of Platinum-Group Metals from recycled automotive catalytic converters by carbochlorination. Ind. Eng. Chem. Res. 2000, 39, 1185–1192. [Google Scholar] [CrossRef]
- Pan, L.; Zhang, Z. Solvent extraction and separation of palladium(II) and platinum(IV) from hydrochloric acid medium with dibutyl sulfoxide. Miner. Eng. 2009, 22, 1271–1276. [Google Scholar] [CrossRef]
- Peng, Z.; Li, Z.; Lin, X.; Tang, H.; Ye, L.; Ma, Y.; Rao, M.; Zhang, Y.; Li, G.; Jiang, T. Pyrometallurgical recovery of platinum group metals from spent catalysts. JOM 2017, 69, 1553–1562. [Google Scholar] [CrossRef]
- Chiang, K.-C.; Chen, K.-L.; Chen, C.-Y.; Huang, J.-J.; Shen, Y.H.; Yeh, M.Y.; Wong, F.F. Recovery of spent alumina-supported platinum catalyst and reduction of platinum oxide via plasma sintering technique. J. Taiwan Inst. Chem. Eng. 2011, 42, 158–165. [Google Scholar] [CrossRef]
- Sasaki, H.; Maeda, M. Zn-vapour pretreatment for acid leaching of platinum group metals from automotive catalytic converters. Hydrometallurgy 2014, 147–148, 59–67. [Google Scholar] [CrossRef]
- Okabe, T.H.; Kayanuma, Y.; Yamamoto, S.; Maeda, M. Platinum recovery using calcium vapour treatment. Mater. Trans. 2013, 44, 1386–1393. [Google Scholar] [CrossRef][Green Version]
- Kayanuma, Y.; Okabe, T.H.; Maeda, M. Metal vapour treatment for enhancing the dissolution of platinum group metals from automotive catalyst scrap. Metall. Mater. Trans. B 2004, 35, 817–824. [Google Scholar] [CrossRef]
- Kim, B.-S.; Lee, J.; Seo, S.; Park, Y.-K.; Sohn, H.Y. A process for extracting precious metals from spent printed circuit boards and automobile catalyst. JOM 2004, 12, 55–58. [Google Scholar] [CrossRef]
- Taninuchi, Y.-K.; Okabe, T.H. Recovery of platinum group metals from spent catalysts using iron chloride vapor treatment. Metall. Mater. Trans. B 2018, 49, 1781–1793. [Google Scholar] [CrossRef]
- Kolliopoulos, G.; Balomenos, E.; Giannopoulou, I.; Yakoumis, I.; Panias, D. Behaviour of Platinum Group Metals during their pyrometallurgical recovery from spent automotive catalysts. Open Acess Libr. J. 2014, 1, e736. [Google Scholar] [CrossRef]
- Compernolle, S.; Wambeke, D.; de Raedt, I.; Kimpe, K.; Vanhaecke, F. Direct determination of Pd, Pt and Rh in fire assay lead buttons by laser ablation-ICP-OES: Automotive exhaust catalysts as an example. J. Anal. At. Spectrosc. 2011, 26, 1679–1684. [Google Scholar] [CrossRef]
- Jones, R.T.; Geldenhuys, I.J. The pros and cons of reductive matte smelting for PGMs. Miner. Eng. 2011, 24, 483–592. [Google Scholar] [CrossRef]
- Dong, H.; Zhao, J.; Chen, J.; Wu, Y.; Li, B. Recovery of platinum group metals from spent catalysts: A review. Int. J. Miner. Processing 2015, 145, 108–113. [Google Scholar] [CrossRef]
- Fornalczyk, A.; Saternus, M. Vapour treatment method against other pyro- and hydrometallurgical processes applied to recover platinum from used auto catalytic converters. Acta Metall. Sin.-Engl. Lett. 2013, 26, 247–256. [Google Scholar] [CrossRef]
- Fornalczyk, A.; Golak, S.; Saternus, M. Model of infiltration of spent automotive catalysts by molten metal in process of platinum metals recovery. Math. Probl. Eng. 2013, 2013, 461085. [Google Scholar] [CrossRef]
- Saternus, M.; Fornalczyk, A.; Gąsior, W.; Dębski, A.; Terlicka, S. Modifications and Improvements to the Collector Metal Method Using an mhd Pump for Recovering Platinum from Used Car Catalysts. Catalysts 2020, 10, 880. [Google Scholar] [CrossRef]
- Dębski, A.; Terlicka, S.; Gąsior, W.; Saternus, M.; Fornalczyk, A. Calorimetric studies and thermodynamic properties of Li-Pb-Pd liquid alloys. J. Mol. Liq. 2021, 339, 116791. [Google Scholar] [CrossRef]
- Terlicka, S.; Dębski, A.; Saternus, M.; Fornalczyk, A.; Gąsior, W. Calorimetric investigation of the LiPt system. J. Mol. Liq. 2020, 312, 113446. [Google Scholar] [CrossRef]
- Terlicka, S.; Dębski, A.; Gąsior, W.; Fornalczyk, A.; Saternus, M. Experimental results of the Li-Pb-Pt system obtained by the high temperature drop calorimetry. J. Mol. Liq. 2021, 332, 115824. [Google Scholar] [CrossRef]
- Golak, S.; Zagorski, R. Model and optimization of electromagnetic filtration of metals. Metalurgija 2013, 52, 215–218. [Google Scholar]
- Krat, S.A.; Popkov, A.S.; Gasparyan, Y.M.; Pisarev, A.A.; Fiflis, P.; Szott, M.; Christenson, M.; Kalathiparambil, K.; Ruzic, D.N. Wetting properties of liquid lithium on lithium compounds. Fusion Eng. Des. 2017, 117, 199–203. [Google Scholar] [CrossRef]
- Zuo, G.Z.; Ren, J.; Hu, J.S.; Sun, Z.; Yang, Q.X.; Li, J.G. Liquid lithium surface control and its effect on plasma performance in the HT-7 tokamak. Fusion Eng. Des. 2014, 89, 2845–2852. [Google Scholar] [CrossRef]
- Mirnov, S. Plasma-wall interactions and plasma behaviour in fusion devices with liquid lithium plasma facing components. J. Nucl. Mater. 2009, 390–391, 876–885. [Google Scholar] [CrossRef]
- Vertkov, A.V.; Lyublinski, I.E.; Tabares, F.; Ascasibar, E. Status and prospect of the development of liquid lithium limiters for stellarotor TJ-II. Fusion Eng. Des. 2012, 87, 1755–1759. [Google Scholar] [CrossRef]
- Xu, W.; Curreli, D.; Andruczyk, D.; Mui, T.; Switts, R.; Ruzic, D.N. Heat transfer of TEMHD driven lithium flow in stainless steel trenches. J. Nucl. Mater. 2013, 438, S422–S425. [Google Scholar] [CrossRef]
- Fiflis, P.; Press, A.; Xu, W.; Andruczyk, D.; Curreli, D.; Ruzic, D.N. Wetting properties of liquid lithium on select fusion relevant surfaces. Fusion Eng. Des. 2014, 89, 2827–2832. [Google Scholar] [CrossRef]
- Zheng, Z.J.; Ye, H.; Guo, Z.P. Recent Progress in Designing Stable Composite Lithium Anodes with Improved Wettability. Adv. Sci. 2020, 7, 2002212. [Google Scholar] [CrossRef]
- Zhao, X.; Xu, S.; Liu, J. Surface tension of liquid metal: Role, mechanism and application. Front. Energy 2017, 11, 535–567. [Google Scholar] [CrossRef]


| Parameter | Value |
|---|---|
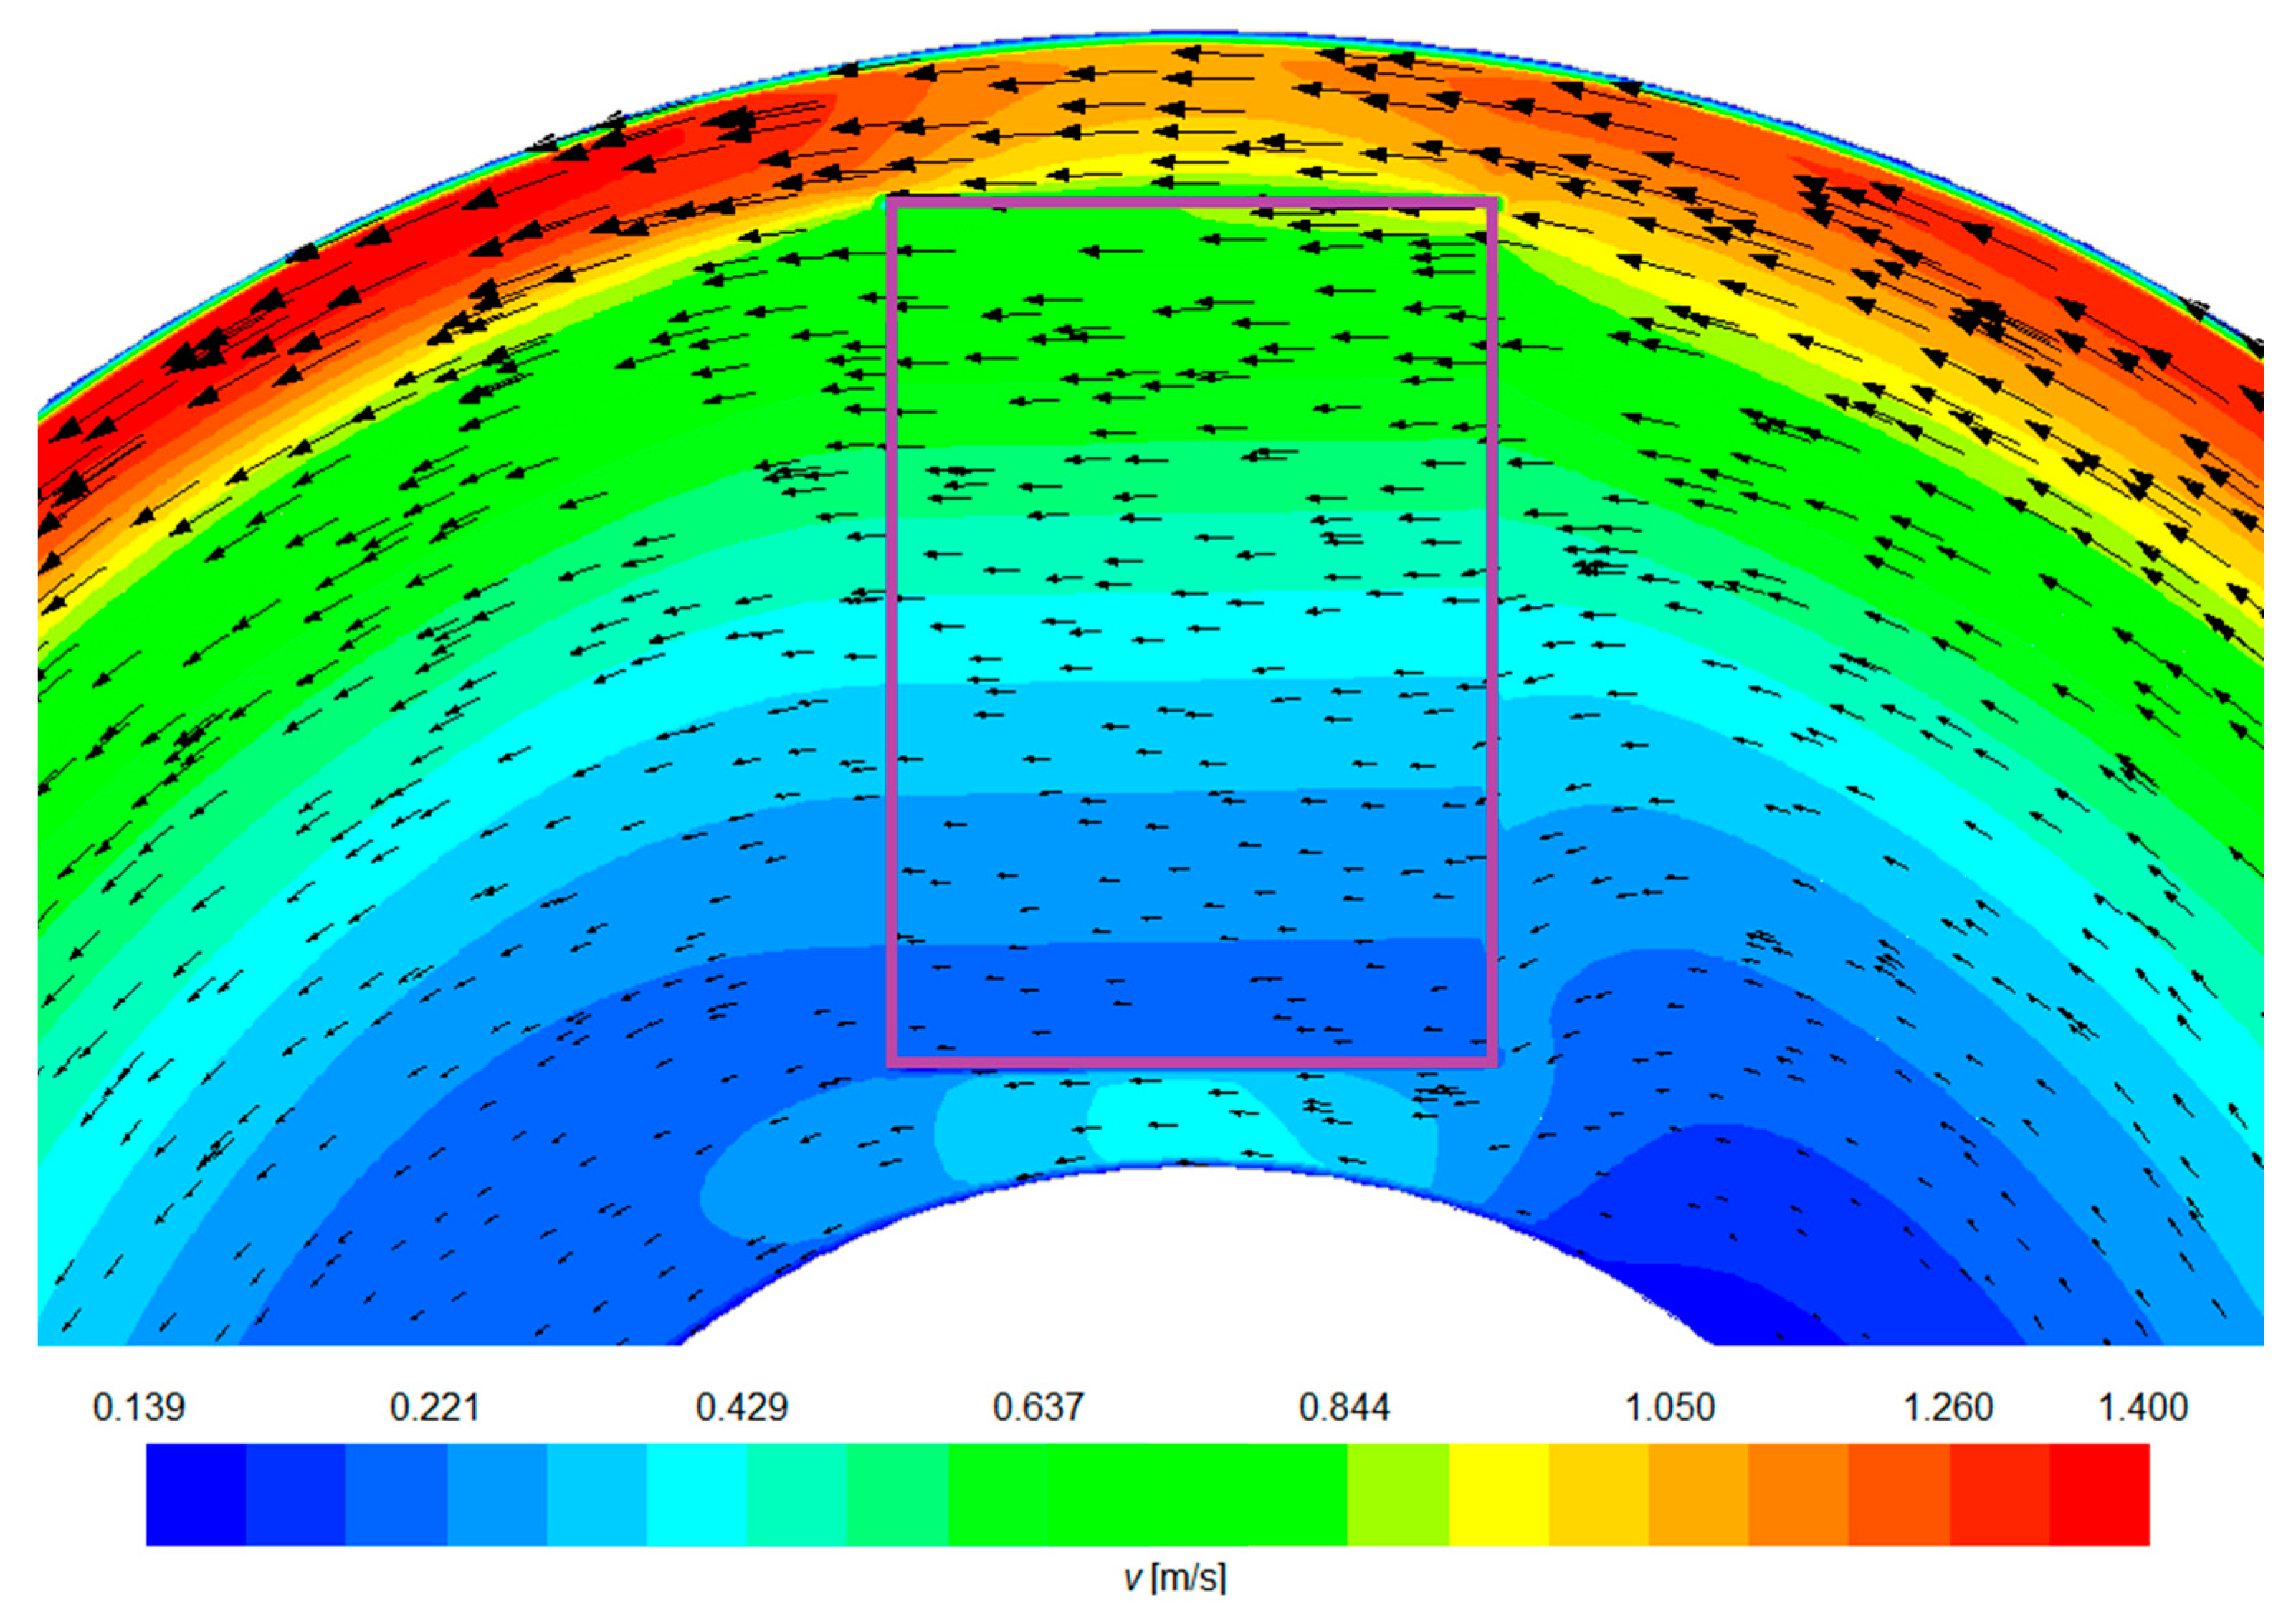
| The outer radius of the channel | 0.139 m |
| The inner radius of the channel | 0.61 m |
| The inner radius of the inductor | 0.149 m |
| The frequency of the power supply to the inductor | 50 Hz |
| Pb-Li alloy density | 10,298 kg·m−3 |
| Lead viscosity with lithium | 0.002 Pa·s |
| PbLi electrical resistivity | 10,016,106 Ωm |
| Carrier width | 40 mm |
| Carrier height | 60 mm |
| Medium hydraulic capillaries | 0.00085 m |
Publisher’s Note: MDPI stays neutral with regard to jurisdictional claims in published maps and institutional affiliations. |
© 2022 by the authors. Licensee MDPI, Basel, Switzerland. This article is an open access article distributed under the terms and conditions of the Creative Commons Attribution (CC BY) license (https://creativecommons.org/licenses/by/4.0/).
Share and Cite
Saternus, M.; Fornalczyk, A.; Gąsior, W.; Dębski, A.; Terlicka, S.; Golak, S.; Ciepliński, P. Modelling of the Flow in the Process of Washing Out Automotive Catalyst Carriers with the PbLi Alloy. Materials 2022, 15, 3119. https://doi.org/10.3390/ma15093119
Saternus M, Fornalczyk A, Gąsior W, Dębski A, Terlicka S, Golak S, Ciepliński P. Modelling of the Flow in the Process of Washing Out Automotive Catalyst Carriers with the PbLi Alloy. Materials. 2022; 15(9):3119. https://doi.org/10.3390/ma15093119
Chicago/Turabian StyleSaternus, Mariola, Agnieszka Fornalczyk, Władysław Gąsior, Adam Dębski, Sylwia Terlicka, Sławomir Golak, and Piotr Ciepliński. 2022. "Modelling of the Flow in the Process of Washing Out Automotive Catalyst Carriers with the PbLi Alloy" Materials 15, no. 9: 3119. https://doi.org/10.3390/ma15093119
APA StyleSaternus, M., Fornalczyk, A., Gąsior, W., Dębski, A., Terlicka, S., Golak, S., & Ciepliński, P. (2022). Modelling of the Flow in the Process of Washing Out Automotive Catalyst Carriers with the PbLi Alloy. Materials, 15(9), 3119. https://doi.org/10.3390/ma15093119