Article

The Effect of Increasing Nickel Content on the Microstructure, Hardness, and Corrosion Resistance of the CuFeTiZrNix High-Entropy Alloys

1
Department of Materials Science and Engineering, National Taiwan University of Science and Technology, Taipei 10672, Taiwan
2
Kyushu Institute of Technology, Graduate School of Life Science and Systems Engineering, Kitakyushu 808-0196, Japan
3
Department of Advanced Materials Science and Engineering, Kyushu University, 744 Motooka Nishi-ku, Fukuoka 819-0395, Japan
4
School of Engineering, University of San Carlos (USC), Cebu City 6000, Philippines
*
Author to whom correspondence should be addressed.
Materials 2022, 15(9), 3098; https://doi.org/10.3390/ma15093098
Submission received: 7 April 2022 / Revised: 19 April 2022 / Accepted: 24 April 2022 / Published: 25 April 2022
(This article belongs to the Special Issue Future Trends in High-Entropy Alloys)

Abstract

:
In recent years, high-entropy alloys (HEAs) that contain fine grains of intermetallic compounds (IMCs) have gained increasing attention as they have been shown to exhibit both high mechanical strength and strong corrosion resistance. One such class of HEAs is that of CuFeTiZrNi alloys. In this study, we have investigated the effect of increasing Ni content on the microstructure, hardness, and corrosion resistance of the CuFeTiZrNix alloys (where x = 0.1, 0.3, 0.5, 0.8, 1.0 in a molar ratio). The alloys used in this study were prepared in an arc melting furnace and then annealed at 900 °C. First-principles calculations of the bulk modulus were also performed for each alloy. The results revealed that increasing the Ni content had several effects. Firstly, the microstructure of the CuFeTiZrNix alloys changed from B2_BCC and Laves_C14 in the CuFeTiZrNi0.1 and CuFeTiZrNi0.3 alloys to FCC, B2_BCC, and Laves_C14 in the CuFeTiZrNi0.5 alloys; and to FCC, B2_BCC, Cu51Zr14, and Laves_C14 in the CuFeTiZrNi0.8 and CuFeTiZrNi1.0 alloys. Secondly, IMCs arising from a combination of the refractory elements (Ti and Zr) and atomic size differences were found in the interdendritic region. Thirdly, as the Ni content in the CuFeTiZrNix alloys increased, the hardness decreased, but the corrosion resistance increased.

1. Introduction

The conventional approach to producing alloys with new microstructures and properties is to combine two principal elements in differing proportions. However, in 1995, Yeh et al. introduced a novel class of alloy called high-entropy alloys (HEAs) [1,2,3]. This proposal received much attention from academics and industries, especially those connected to metallurgy [4]. HEAs consist of five or more primary elements, each with an atomic concentration between 5% and 35%, mixed in equiatomic or near-equiatomic amounts [5,6,7]. In the years since HEAs were first proposed, many combinations of elements have been explored. These existing HEA systems serve as references for designing novel HEAs. The literature relating to these existing systems reports the fabrication of simple solid solutions, such as those with face-centered cubic (FCC), body-centered cubic (BCC), and hexagonal close-packed (HCP) structures [8], and discusses the effects on the properties of the HEAs of various physical parameters, such as the entropy of mixing (ΔSmix), enthalpy of mixing (ΔHmix), atomic size differences (δ), and parameter Ω that predicts the likelihood of forming a solid solution [9,10,11,12].
Several HEAs systems are reported in the literature, all of which have excellent properties suitable for a range of applications. In particular, many existing HEAs exhibit good mechanical strength, low thermal conductivity, electrochemical corrosion, and high-temperature softening resistance, as well as high thermal structural and chemical stabilities [5,8,13,14]. However, such properties are dependent on the chemical composition. The basic elements most often are Co, Cr, Fe, Ni, and Mn, while some other refractory elements are also employed, such as Ti, Ta, Mo, Nb, Al, and Zr [8,15,16,17]. With the addition of these latter elements, HEAs form not only with a single solid-solution phase but also with some intermetallic compounds (IMCs) in the system, such as µ, σ, and χ, and well-annealed HEAs comprise Laves phases [18]. Systems of this type, such as AlCoCrFexMo0.5Ni [5], Al0.5CoCrCuFeNi [13], AlCoCrCuFeNi [19], and Al0.5CoCrCuFeNiTix [20], have been indicated as having many promising material properties.
Ye et al. have also reported the detection of many multi-phase HEAs [21]. Understanding how HEAs containing fine grains of an IMC form is important in developing future HEAs, as these phases can significantly affect the hardness of the alloys [8]. Furthermore, the effect of the Ni concentration on HEA alloys has been found by several researchers [22,23,24]. Increasing the nickel concentration from 1 to 1.8 can decrease the hardness of AlCrFeCoNix alloys by approximately 43% to 316 HV because of the development of continuous solid solutions as a result of dissolution crystallites in a nickel-rich matrix [25], which is still higher than the SUS 304 with 265 HV [26]. The effect of the Ni concentration seems to need to be more investigated for better HEA properties. At the same time, forming IMC is rather challenging [27,28], especially in novel HEAs systems such as CuFeTiZrNi alloys. In this study, we have investigated the microstructure, hardness, and corrosion resistance of CuFeTiZrNix alloys with increasing Ni content, with the aim of discovering a new high-performance HEA. We have also performed first-principles calculations to characterize the influence on the alloy structure of an increasing Ni content.

2. Experimental Procedure

2.1. Preparation of the CuFeTiZrNix Alloys and Analytical Method

High-purity (>99.9 at.%) Cu, Fe, Ti, and Zr elements were combined with varying amounts of Ni to form the CuFeTiZrNix (where x = 0.1, 0.3, 0.5, 0.8, and 1.0 in a molar ratio) alloys. The total mass of the starting material for each alloy was 3.000 ± 0.001 g, and each alloy mixture was melted at least 5 times in an arc melting furnace (Miller, Gold Star 602; Appleton, WI, USA) to ensure that all elements mixed completely. Each specimen was then individually encapsulated in a quartz tube in a near-vacuum (below 0.1 N/m2) before being annealed at 900 °C for 2 h. After annealing, the specimens were cut into pieces and mounted in the Bakelite, and then given metallurgical treatment to ensure a smooth, defect-free surface. An optical microscope (OM; Olympus BX51M; Tokyo, Japan) and field emission-scanning electron microscope (FE-SEM; Jeol JSM-6500F; Tokyo, Japan) were used to examine the surface morphology and microstructure. The composition of each phase formed in the alloys was determined using SEM with an energy dispersive spectrometer (EDS; Oxford 7418; Oxford, UK) and an electron probe micro-analyzer (EPMA; Jeol JSM-8200; Osaka, Japan). Diffraction patterns for each region in the CuFeTiZrNix alloys were generated using an X-ray diffractometer (XRD; D2 Phase Bruker; Ettlingen, Germany) with Cu-Kα radiation of 30 kV and 10 mA. A Vickers microhardness tester (HMV-2, Shimadzu; Kyoto, Japan) was employed to determine the Vickers Hardness number (HV) for each of the alloys, and the tests were carried out according to the regulation ASTM E92 [29], with each specimen subjected to 9.8 N (1 kgf) load for 15 s. Ten indentations were made on each alloy and the average value was calculated.
The Tafel extrapolation method was employed to the corrosion resistance of these five CuFeTiZrNix alloys, with a Gamry Instruments system (Echem Analyst Software; Revision 1.2, Warminster, PA, USA) being used to measure the Ecorr (corrosion potential), icorr (corrosion current density), and CR (corrosion rate). The chemical test solution used was a 3.5 wt.% solution of NaCl. The Tafel measurements were performed at ambient temperature, in accordance with a previous study [30], and the potential range of the potentiodynamic polarization test was from −0.5 to 2 V with a scan rate of 1 mV/s.
For comparison with the Tafe method, a weight-loss test was applied based on the ASTM G31-72 laboratory standard [31]. In this test, the specimens were cut into pieces and then immersed in a 3.5 wt.% NaCl solution at ambient temperature for 30 days. After immersion, the corrosion rate (CR) was determined by the equation:
Corrosion   Rate   ( CR ) = K × W D × A × T
where K is the corrosion constant (8.76 × 104 mm/year), W is the weight loss, D is the density (g/cm3), A is the immersed surface area (cm2), and T is the immersion time (h). The specimen microstructure was examined by FE-SEM after the electrochemical test to determine the type of surface corrosion that had occurred.

2.2. First-Principles Calculations

The focus of this study is the CuFeTiZrNix system, which is an alloy in which the five elements are mixed in approximately equimolar amounts. The physical properties of this CuFeTiZrNix HEA system were ascertained with first-principles calculations using the Green function approach using Akai-KKP software [32]. This approach allows us to carry out the calculation for a disordered alloy. First, the formation energies of BCC and FCC solid solutions were calculated for 10,626 compositions in which the proportions of all 5 atoms were changed from 0.00 to 1.00 in 0.05 increments. Next, the effects of Ni content were investigated in more detail by determining the formation energies of BCC, FCC, and HCP solid solutions in which Fe, Cu, Ti, and Zr were equimolarized, and only the proportion of Ni was changed. In addition, the formation energy of the Laves phase of the binary system represented by AB2 (A = Ti, Zr, B = Cu, Fe, Ni) was obtained and compared with the calculation result of the solid-solution phase. Since the ratio of the atomic radius of the two atoms forming the Laves phase is 1.05–1.67, the atoms were selected to satisfy this condition. The Laves phase has a hexagonal C14 structure, C15 structure, and C36 structure. In this study, only the experimentally confirmed C14 structure was dealt with. In the structural optimization, a stable structure was obtained with an accuracy of 0.01 Bohr. However, in HCP, the axial ratio c/a of the lattice constant was fixed at the ideal ratio of 1.633. For the C14 Laves phase, the axial ratio was also changed to obtain a stable structure with an accuracy of 0.01 Bohr. Next, the Birch–Murnaghan equation of state was applied to fit the volume dependence of the energy and the hardness of the FCC, BCC, and Laves phase (C14). Finally, the results of the calculation were evaluated via comparison with the bulk modulus.

3. Results and Discussions

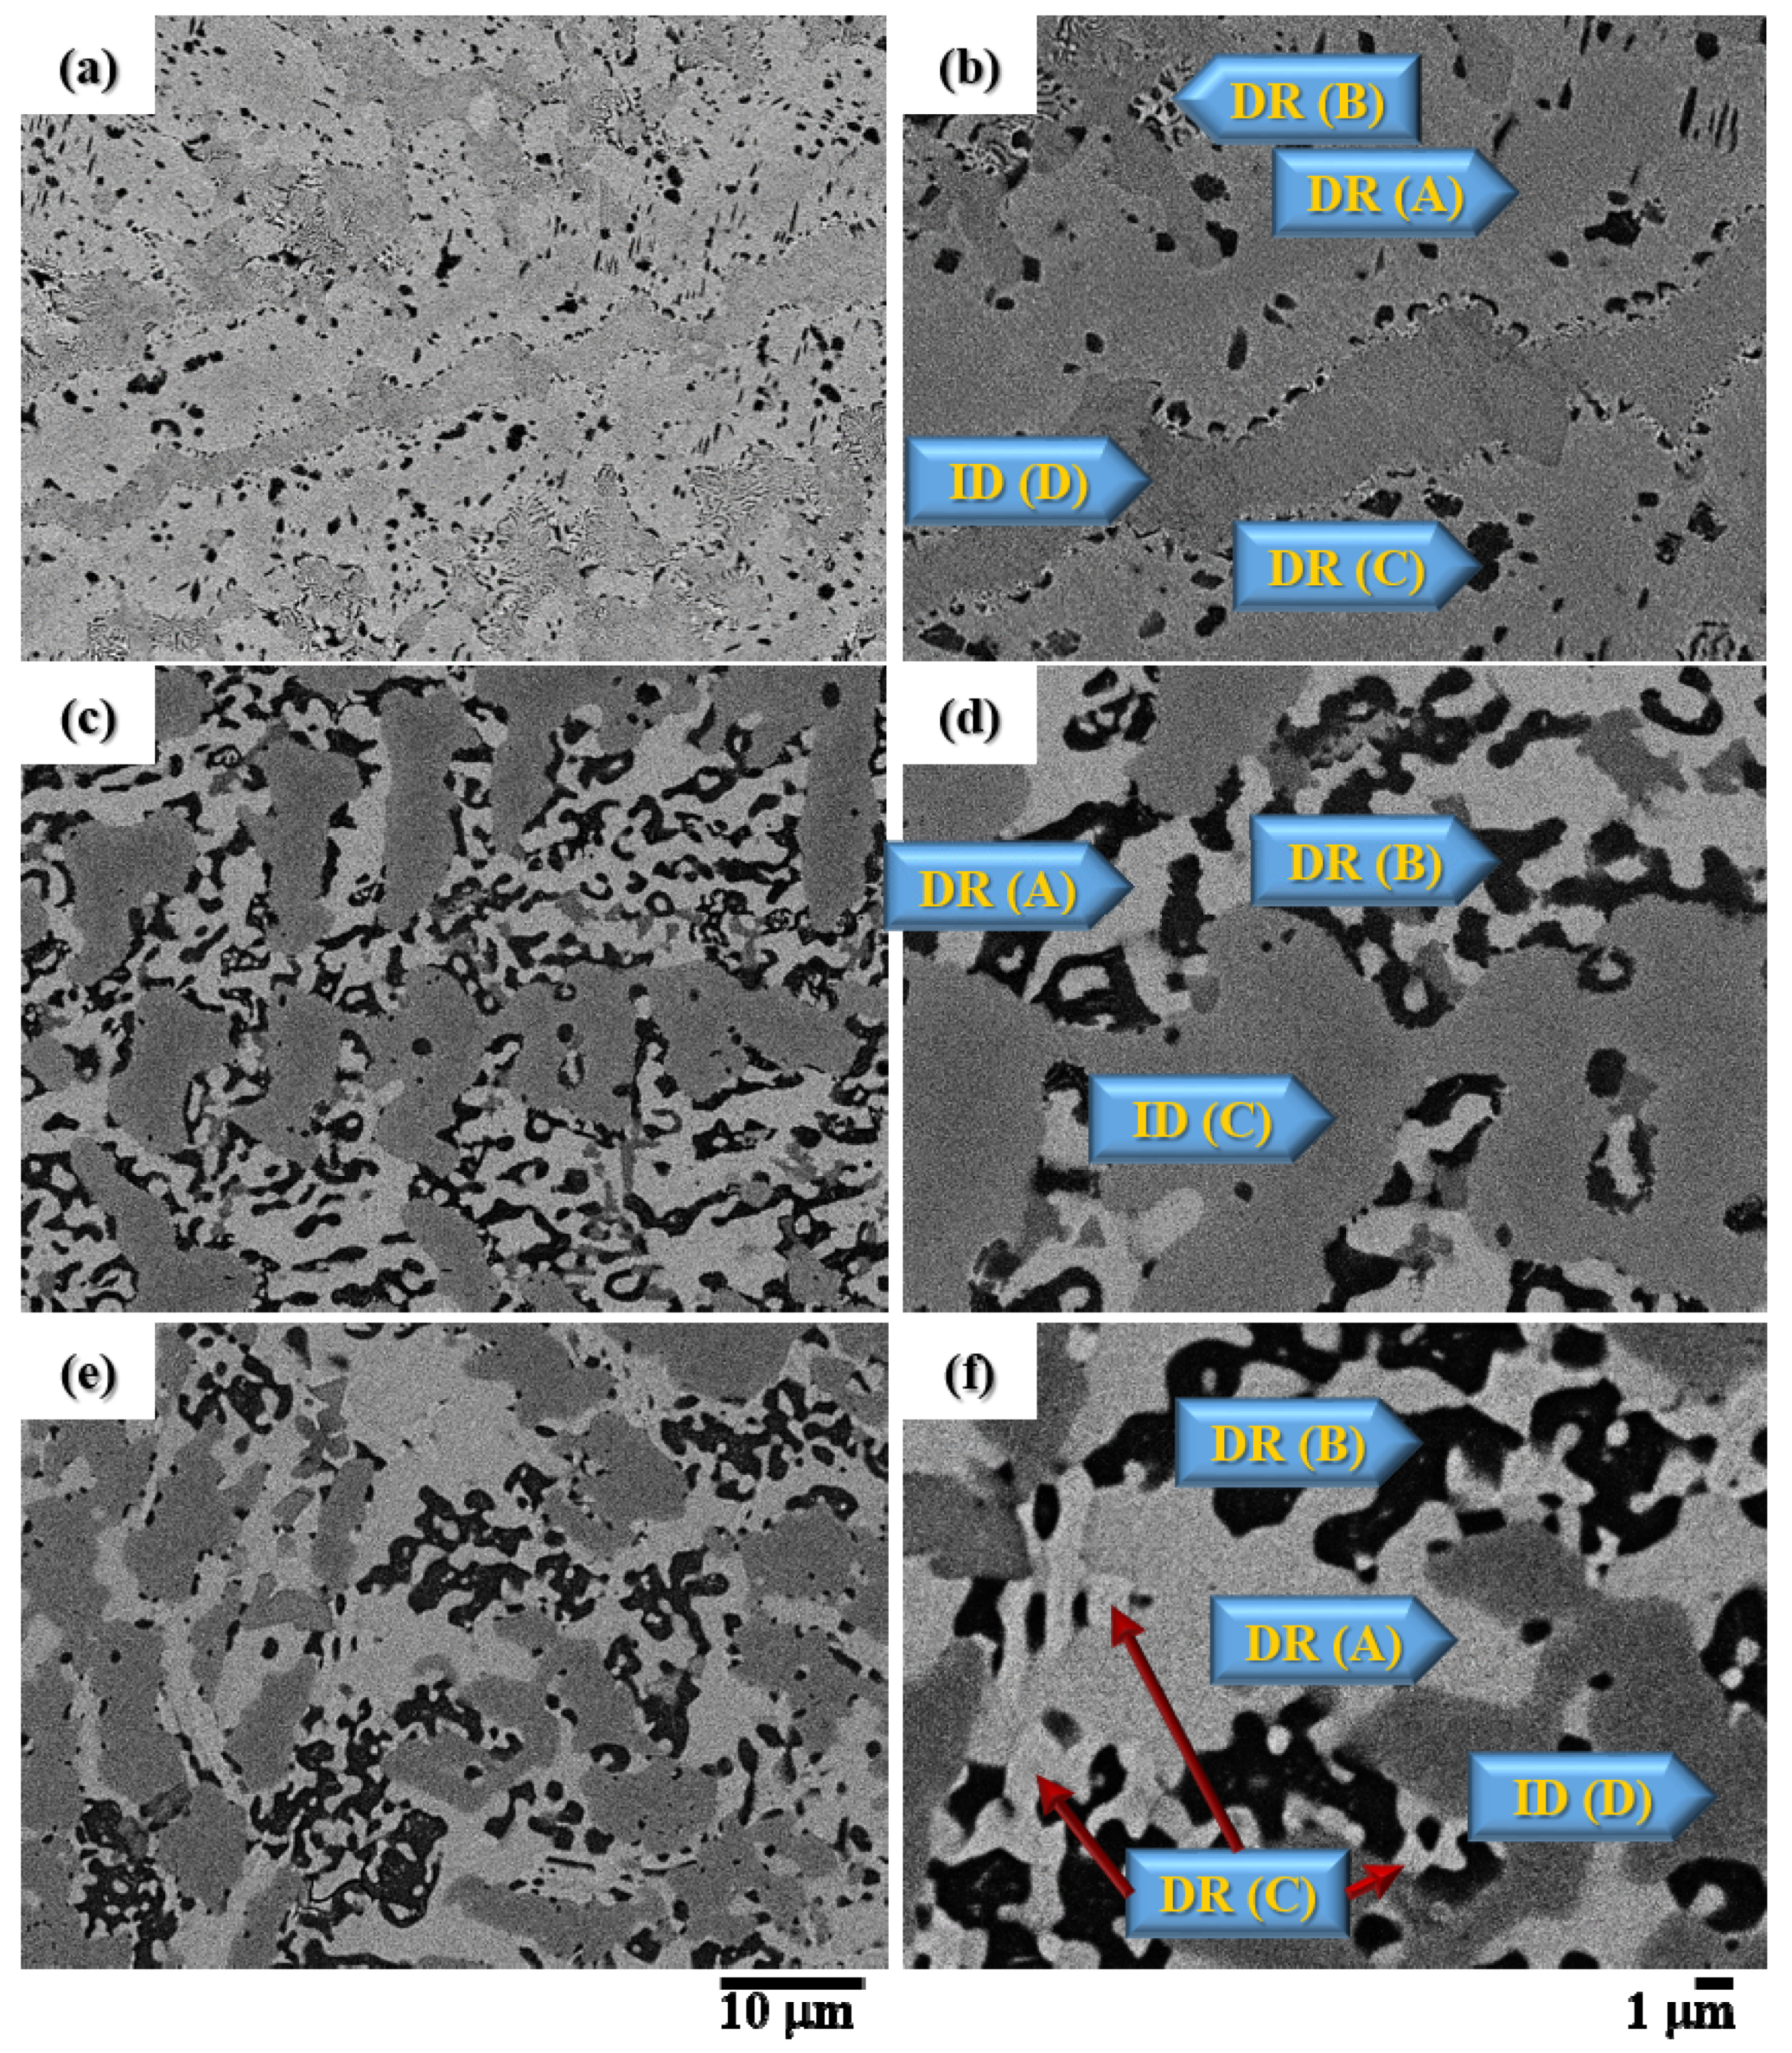
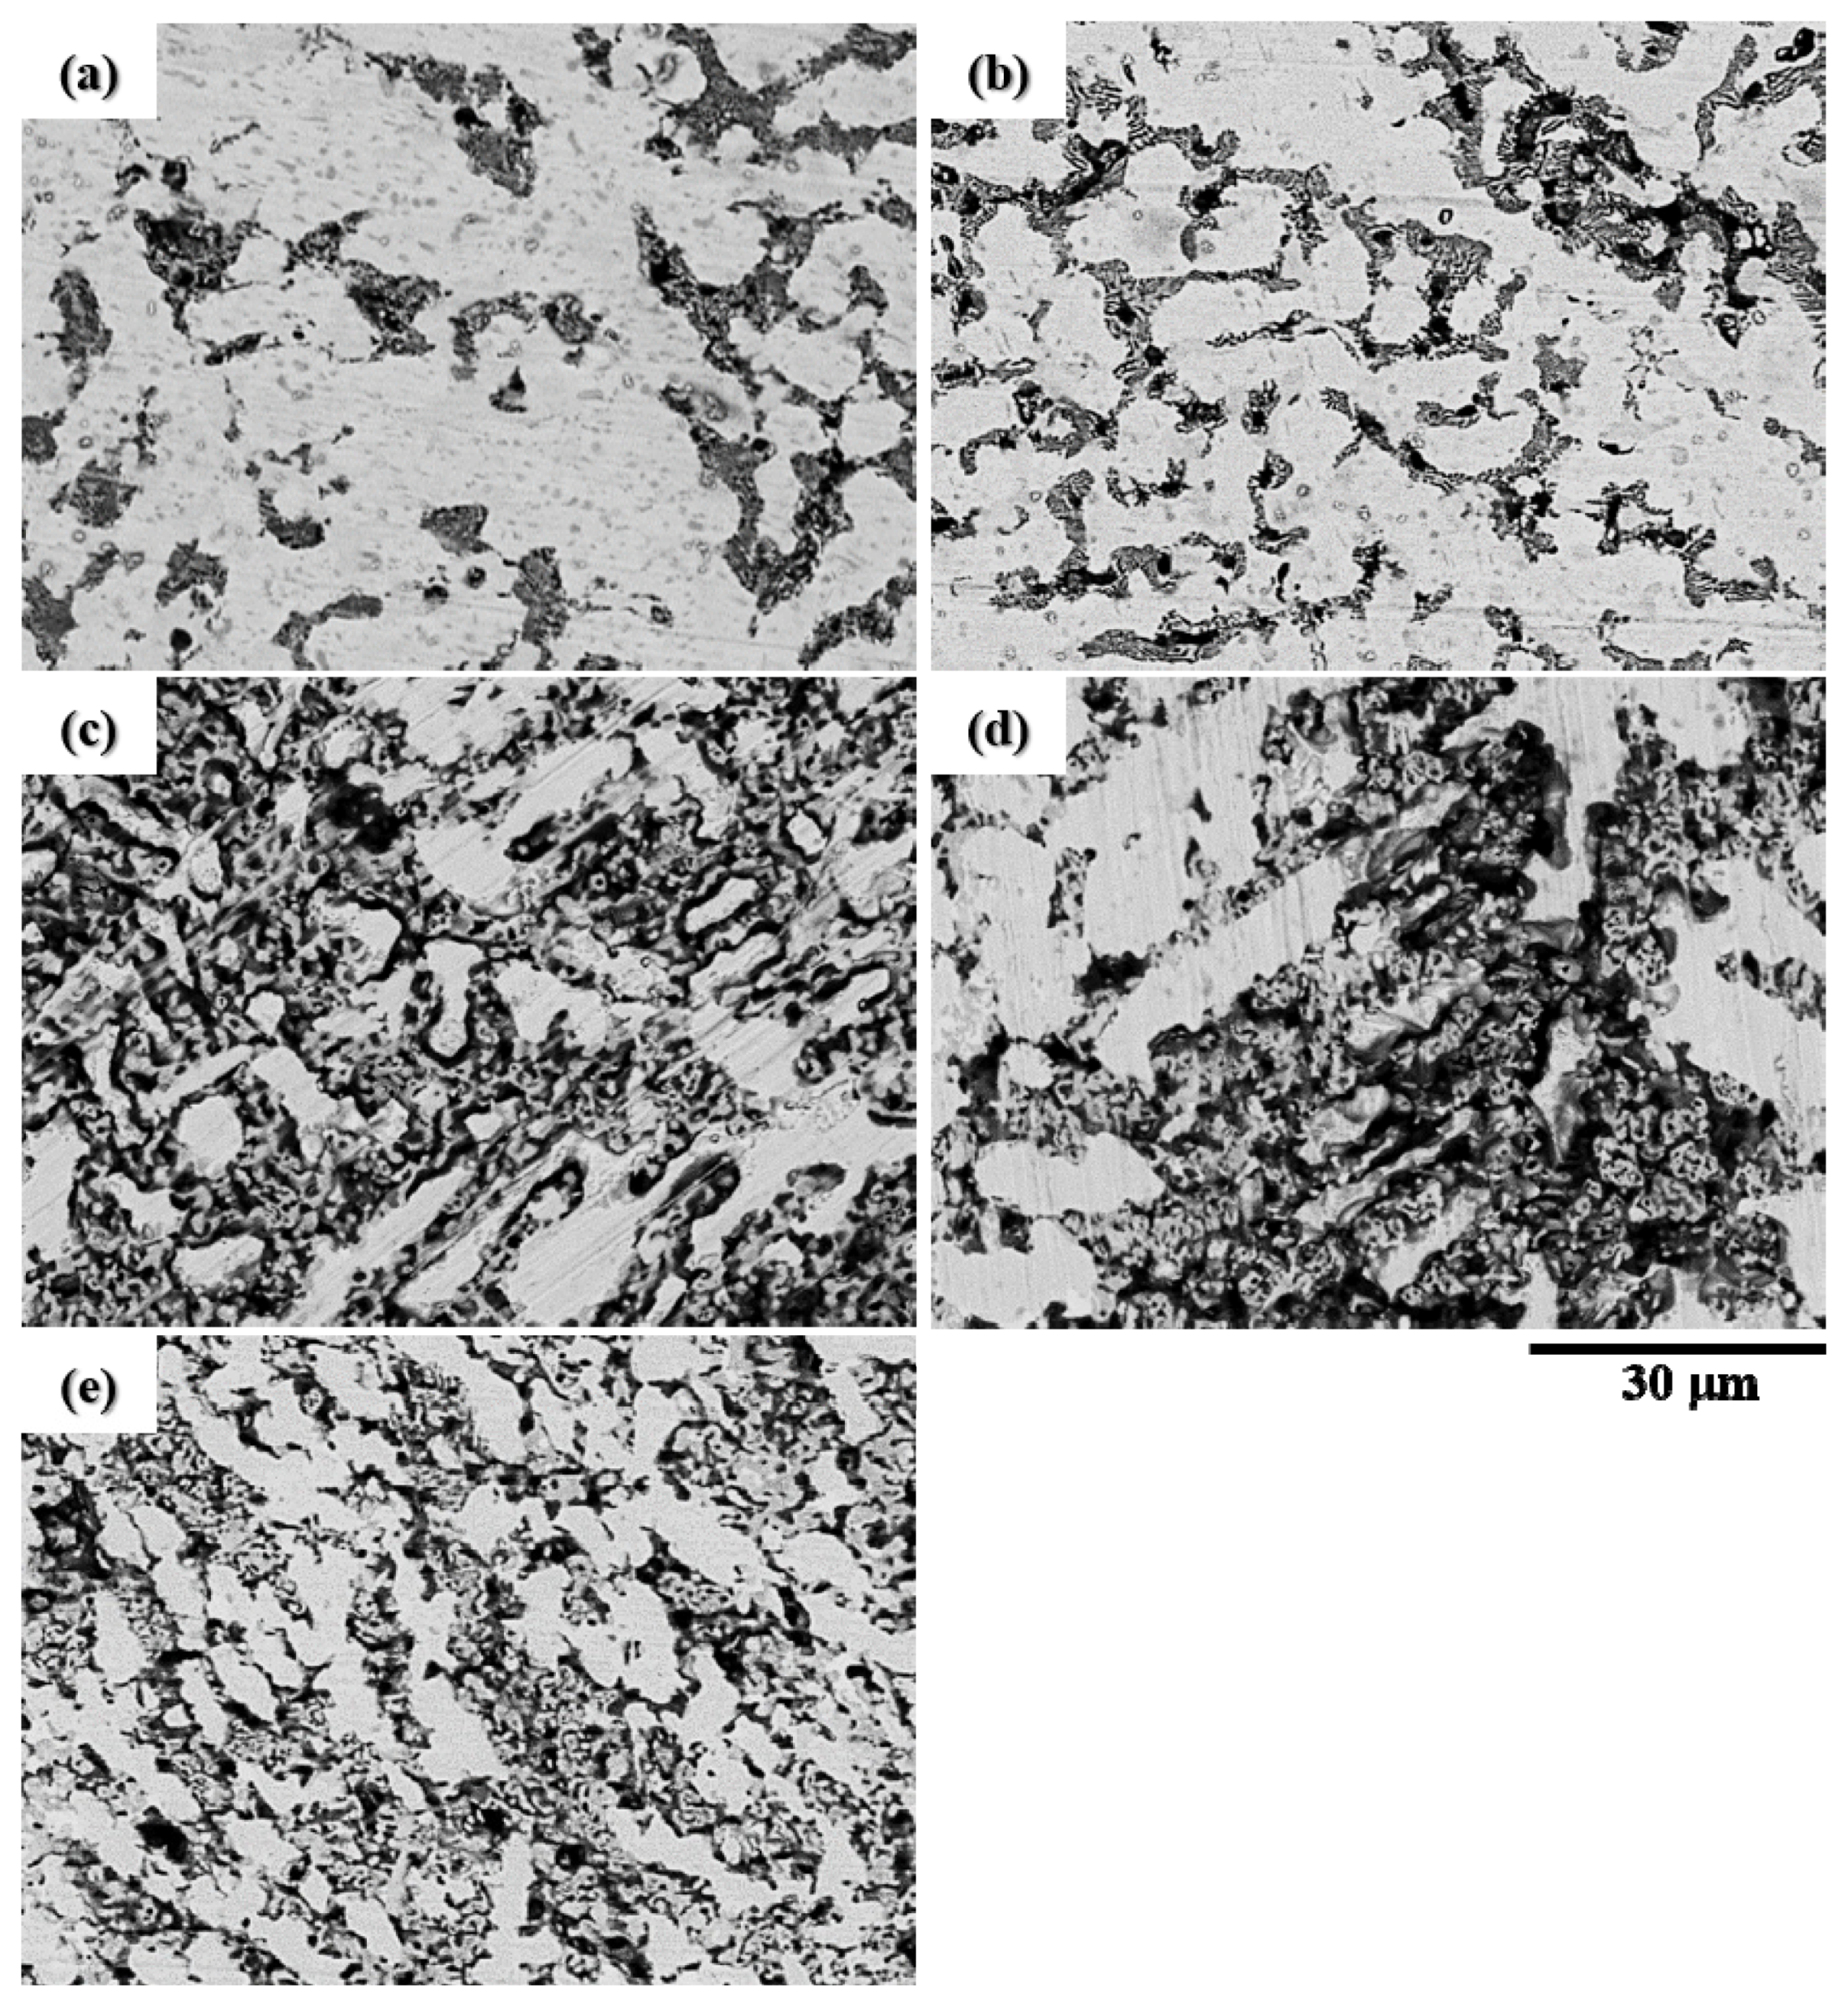
3.1. The Microstructure of the CuFeTiZrNix Alloys

Figure 1 shows the back-scattered electron images (BEI) of the CuFeTiZrNix alloys with x Figure 1a 0.1, Figure 1c 0.5, and Figure 1e 1.0; Figure 1b,d,f shows magnified images of Figure 1a,c,e. Two Dendrite (DR) and Interdendrite (ID) regions comprised of the solid solutions of the B2_BCC and FCC phases and intermetallic compounds (IMCs) of the Cu51Zr14 and Laves_C14 phases were observed. The composition of each phase is listed in Table 1. The Cu51Zr14 phase was only observed when x = 0.8 and 1.0. The Laves_C14 phases have a stoichiometry of AB2 and are normally formed when there is a large size difference between constituent atoms [33].
The mixing enthalpy (∆Hmix), mixing entropy (∆Smix), atomic radius difference (δ), valence electron concentration (VEC) and Ω [12] of the five CuFeTiZrNix alloys were calculated and are listed in Table 2. It was found that the ideal criteria for forming HEAs’ solid solution phases (FCC, BCC, and their mixtures including both ordered and disordered cases) were −22 ≤ ∆Hmix ≤ 7 kJ/mol, 11 ≤ ∆Smix ≤ 19.5 J/mol K, δ ≤ 8.5, and Ω ≥ 1 [34,35,36,37,38,39]. However, the δ and Ω values of all the CuFeTiZrNix alloys were found to be larger than 10 and 1.0, respectively.
The microstructure of the CuFeTiZrNi0.1 alloy has four distinct regions labeled A, B, C, and D in Figure 1b. The (A) light-grey and (B) white DR regions of the CuFeTiZrNi0.1 alloy were determined to be the Laves_C14 phase with crystal properties: Hexagonal structure, Pearson symbol-hP12, Space group-P63/mmc, and lattice parameters of a = 5.130 Å, and c = 8.250 Å. This Laves_C14 phase in the CuFeTiZrNi0.1 alloy was referred to as the Cu2TiZr phase and labeled as the (Cu,Fe,Ni)2TiZr phase. In this alloy, the Cu, Fe, and Ni atoms can substitute each other because they have the same structure and their atomic size and electronegativity are similar [33]. The DR (C) region, composed of considerable concentractions of Ti and Fe (dark in contrast), was of the B2_BCC phase and was referred to as the FeTi-type and labeled as the (Fe,Ni)Ti phase. The ID (D) region (dark grey) was also identified as a Laves_C14 phase (hexagonal structure, Pearson symbol: hP12, Space group: P63/mmc, a = 4.962 Å, c = 16.150 Å). It was referred to as the Fe2Zr phase and labeled the (Fe,Cu)2Zr phase. The composition of these phases in each alloy is listed in Table 1. Figure 2 shows the XRD pattern of the CuFeTiZrNi0.1 alloy. Peaks corresponding to the B2_BCC and Laves_C14 phases were found. It can be seen that the XRD result and compositional analyses are consistent with one another. In a typical alloy system, the Cu is restricted to the Dendrite (DR) region, which can be explained as being due to the bonding energy between Cu and other elements [19,24]. When the molar ratio of Ni reached 0.3, the phase at each region was seen to remain unchanged.
The XRD pattern of the CuFeTiZrNi0.5 alloy is shown in Figure 3. The characteristic peaks corresponding to the FCC, B2_BCC, and Laves_C14 phases were found. Figure 1c,d shows the alloy’s microstructure. In Figure 1d, the light grey region was labeled as DR (A); it was an FCC phase (Cu-rih, Pearson symbol: cF4, and Space group: Fm 3 ¯ m). The dark region was labeled DR (B) and it was a B2_BCC phase, which was referred to as the FeTi-type and labeled as the (Fe,Ni)Ti phase with a = 3.015 Å. This B2_BCC phase tended to form a spinodal structure as the alloy cooled [19]. Spinodal decomposition usually occurs when a system has at least one pair of atoms with a positive enthalpy of mixing [24,35]. The ID (C) (dark grey) region was a Laves_C14 phase (hexagonal structure, Pearson symbol: hP12, Space group: P63/mmc, lattice parameter: a = 4.962 Å and c = 16.15 Å); it was referred to as the Fe2Zr phase and labeled as the (Cu,Fe)2Zr phase. The detailed composition of each region is listed in Table 1. When the Ni content reached 0.5 in the molar ratio, Cu tended to bind with Ni to form an FCC phase due to the increase in Ni content increasing the electronegativity of Cu. This result indicated that this greater electronegativity had a stronger effect than the combined effect: (i) Increased mixing enthalpy, (ii) increased mixing entropy, and (iii) a minimal difference in the atomic radius [36].
As shown in Figure 4, the characteristic peaks of the FCC, B2_BCC, Laves_C14, and Cu51Zr14 phases were observed in the XRD pattern of the CuFeTiZrNi1.0 alloy. The microstructure of this alloy is shown in Figure 1e,f. Similar results for the XRD pattern and microstructure were found for the CuFeTiZrNi0.8 alloy. The microstructure of the CuFeTiZrNi1.0 alloy could be summarized as follows: (1) The DR (A) (light grey region) was an FCC phase (Cu-rich, Pearson symbol: cF4, and Space group: Fm 3 ¯ m); (2) the DR (B) (dark contrast region) was the B2_BCC phase (referred to as the FeTi-type and labeled as (Fe,Ni)Ti, a = 3.014 Å); (3) the white region-DR (C) was the Cu51Zr14 phase, which was the intermetallic compound (IMC) (hexagonal structure, Pearson symbol: hP65, Space group: P6/m, lattice parameter: a = 11.2348 Å, and c = 8.2708 Å); and (4) the ID (D) (dark grey region) was the Laves_C14 phase (hexagonal structure, Pearson symbol: hP12, Space group: P63/mmc, lattice parameter: a = 4.962 Å, and c = 16.15 Å) referred to as the Fe2Zr phase and labeled as the (Cu,Fe)2Zr phase. The evolution and composition of all the phases formed in the CuFeTiZrNix alloys are listed in Table 1. Overall, the addition of a larger molar amount of Ni to CuFeTiZrNix alloy tended to form the FCC phase. This finding indicates that the Ni acts as an FCC stabilizer.

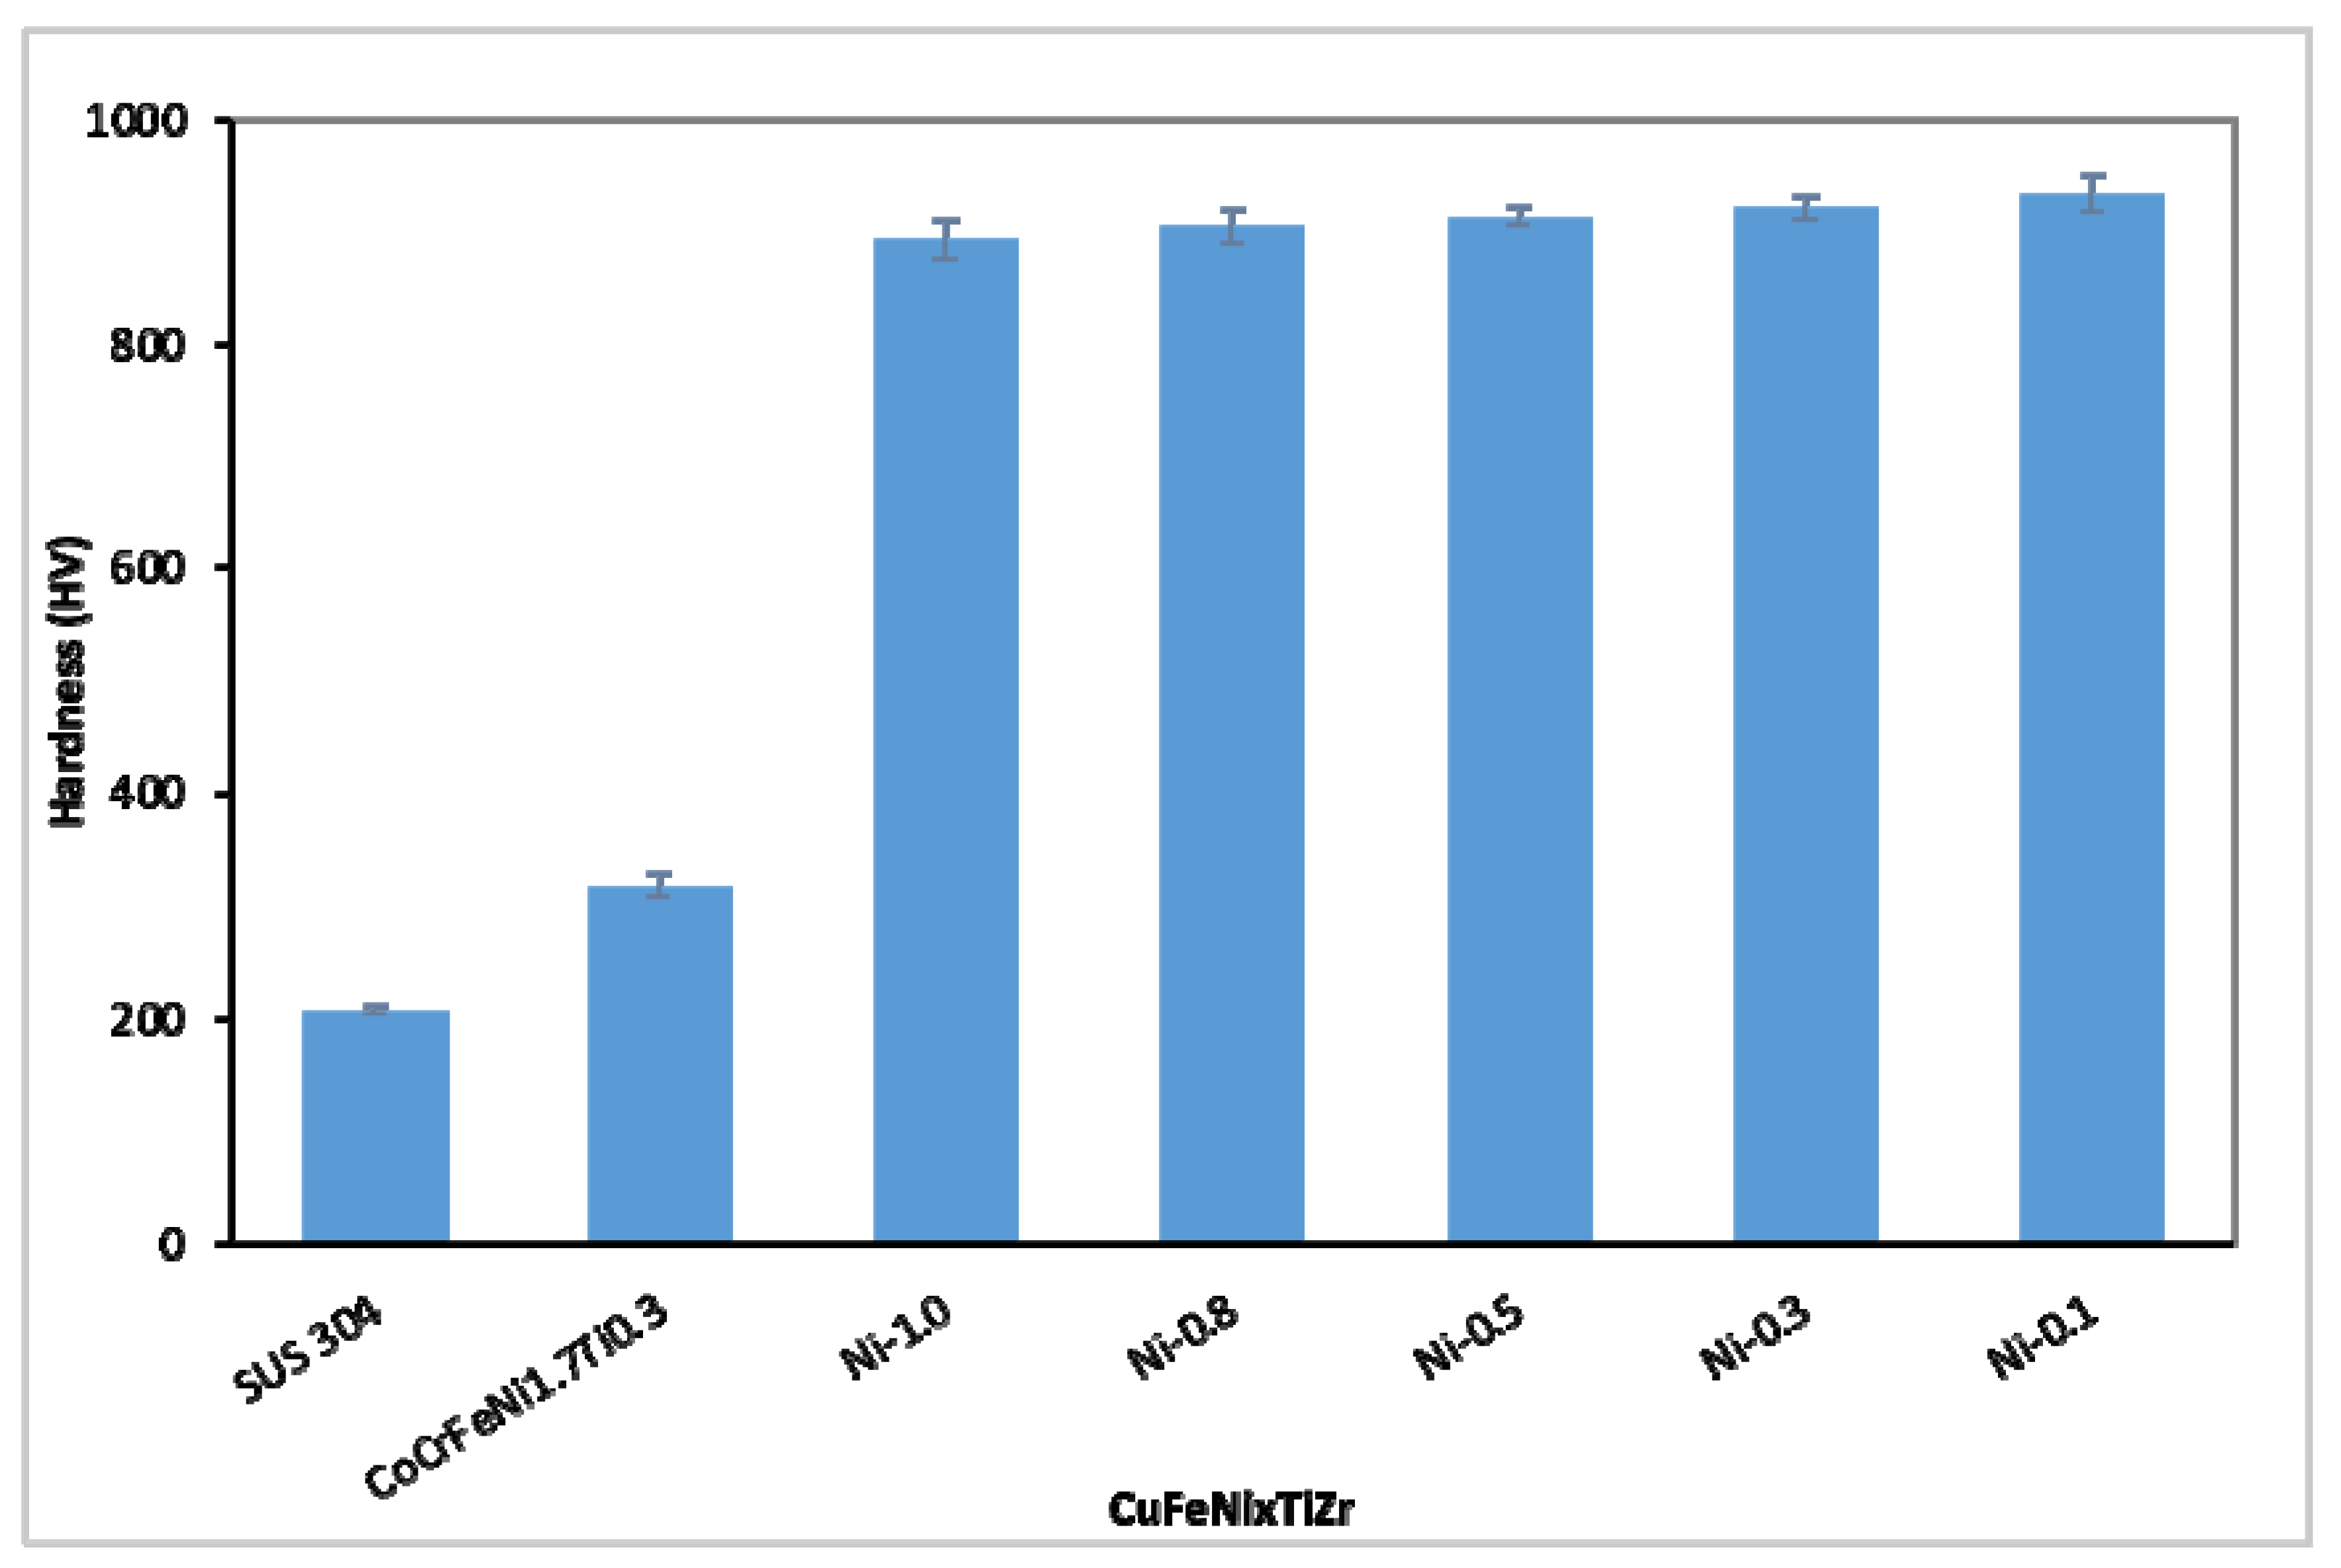
3.2. The Hardness Values of the CuFeTiZrNix Alloys

HEAs and CCAs (complex concentrated alloys) of differing compositions differ significantly in hardness values. This is due to three critical factors: (1) The hardness, (2) relative volume ratio, and (3) morphology of each of the phases of which the alloys are composed [37]. Figure 5 and Table 3 show the hardness values (HV) of the CuFeTiZrNix alloys, and also CoCrFeNi1.7Ti0.3 [38], and stainless steel 304 (SUS 304). It can be seen that the hardness values of the CuFeTiZrNix alloys were high but also very different from those of both CoCrFeNi1.7Ti0.3 and SUS 304. This is likely to be due to the CuFeTiZrNix alloys containing the Laves_C14 or IMC-Cu51Zr14 phases. The hardness of these two phases is higher than that of the BCC and FCC phases [39]. The maximum hardness was found in the CuFeTiZrNi0.1 alloy system and the value was 934.8 ± 17.0 HV. Increasing the Ni content in the CuFeTiZrNix alloys results in more of the FCC phase forming in the alloys. As the FCC phase has low hardness, this results in the hardness of the alloy gradually decreasing with increasing Ni content.

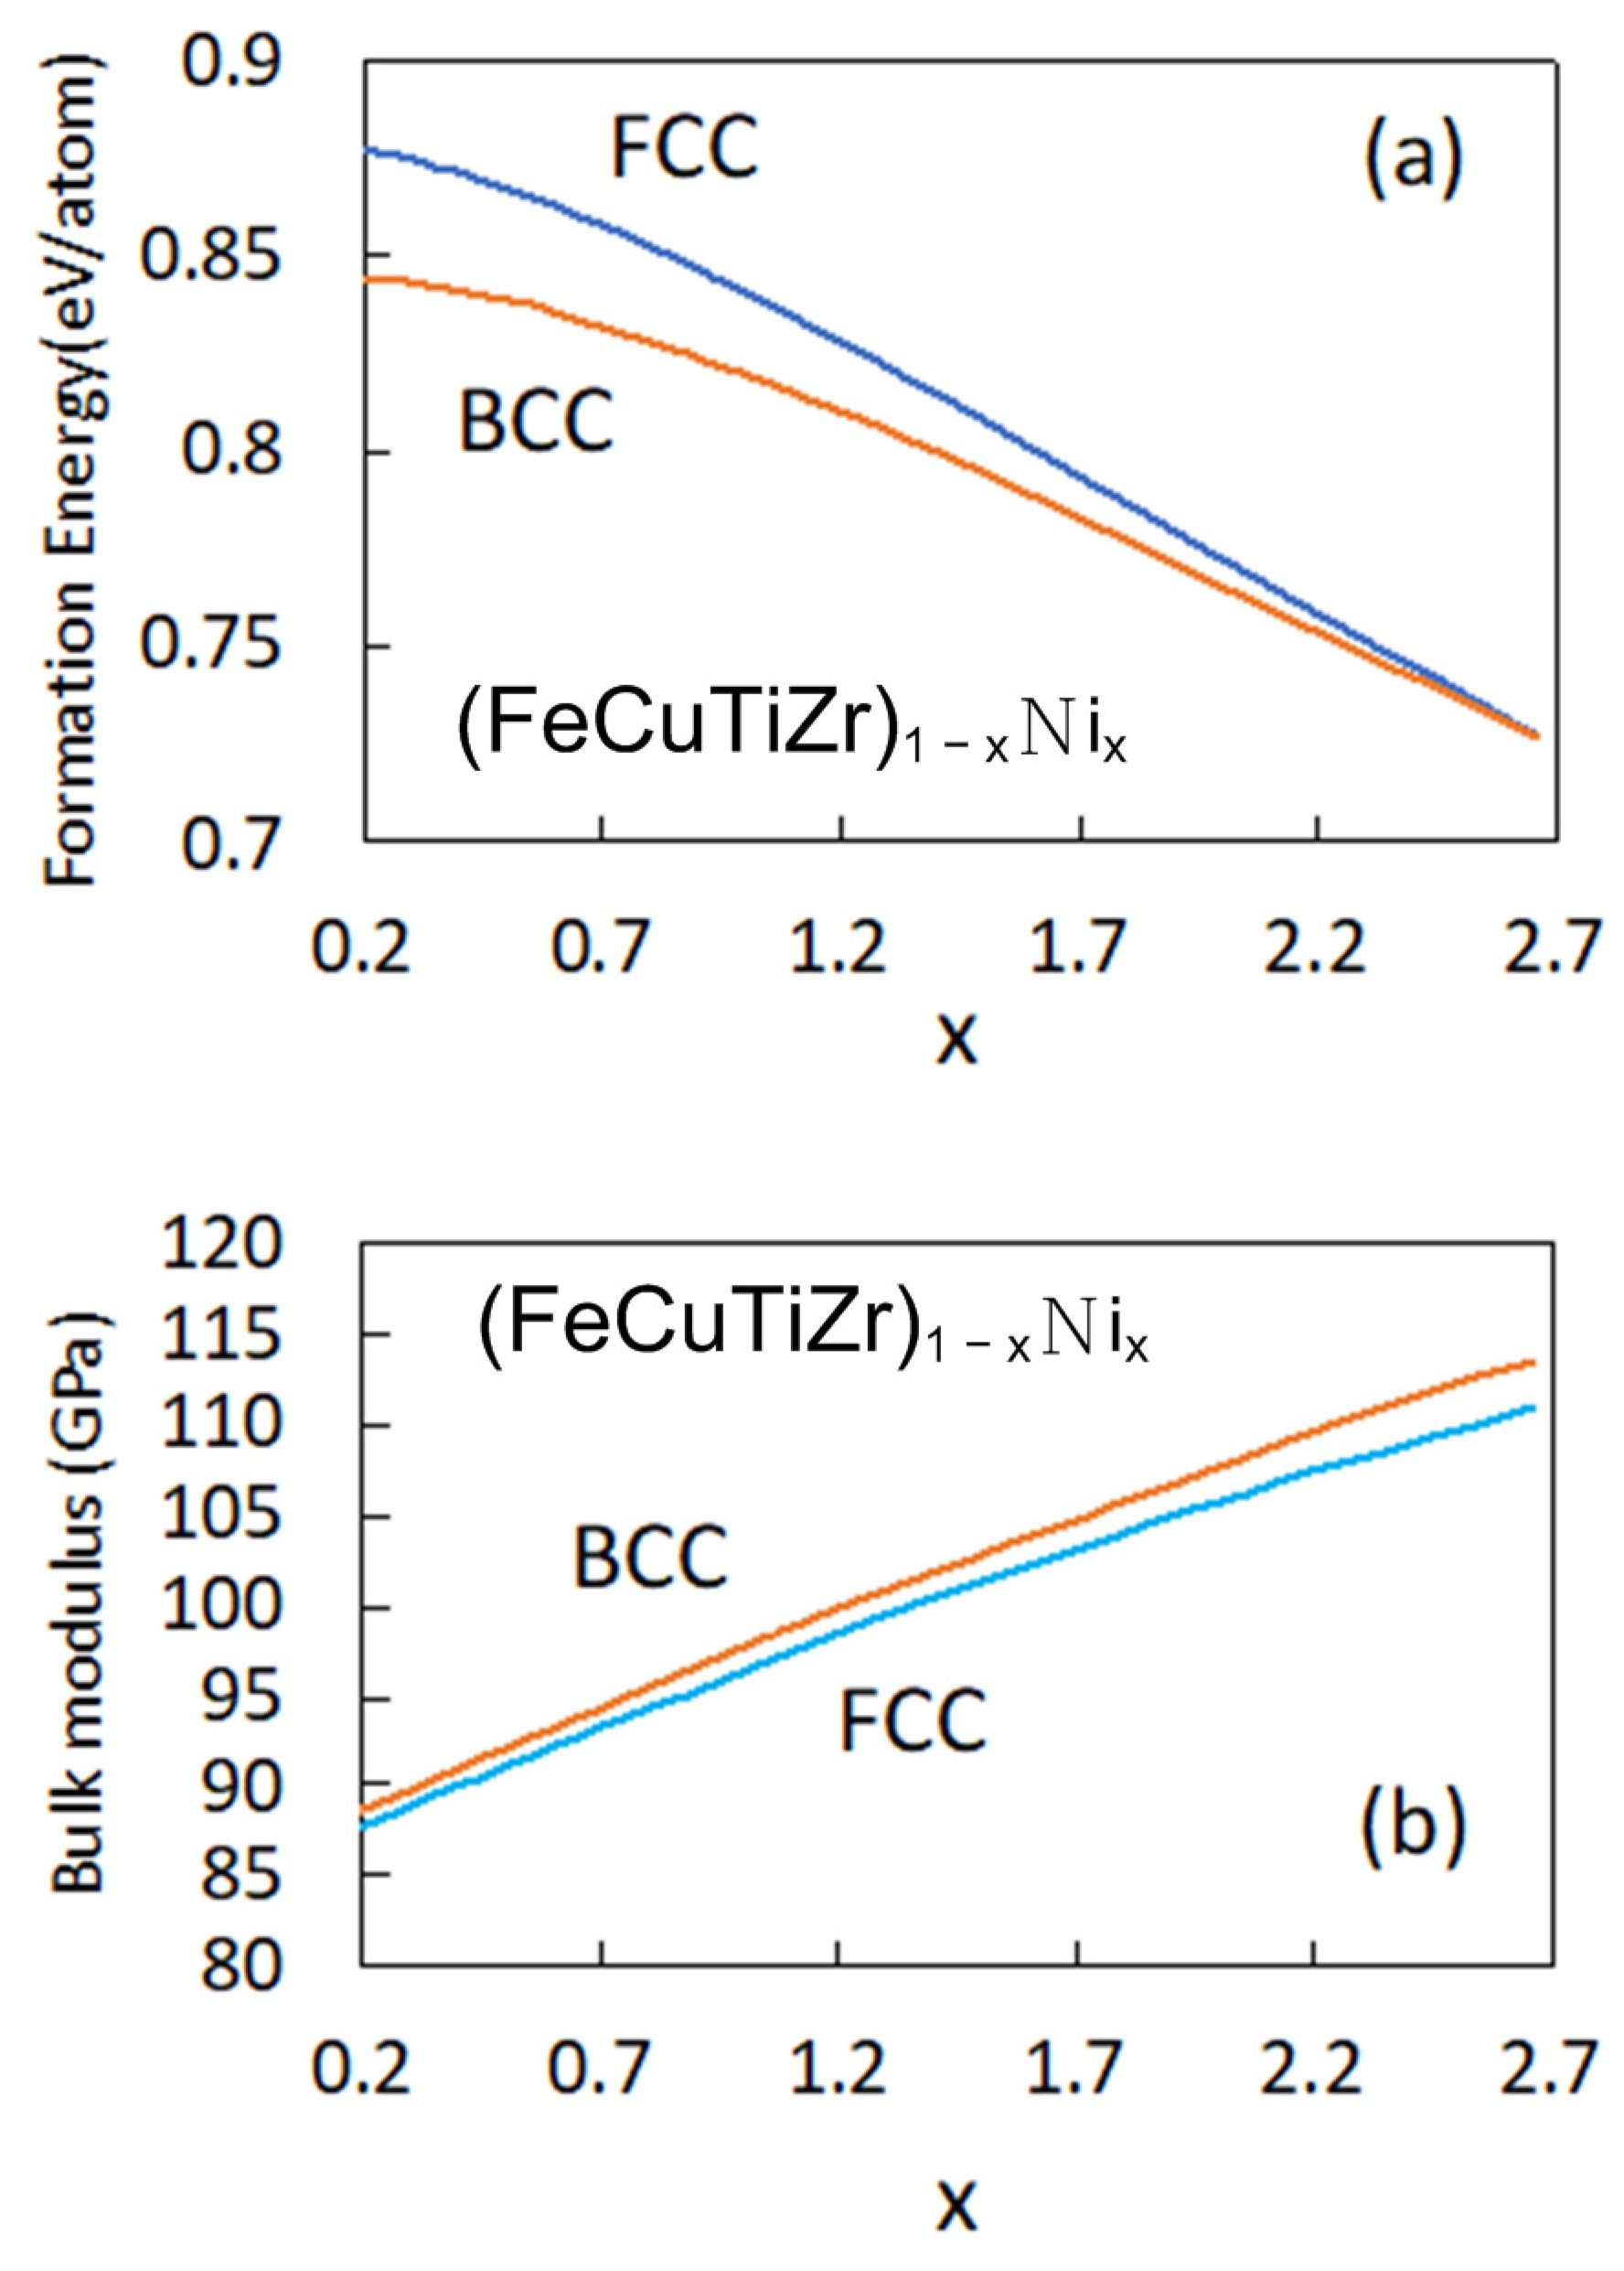
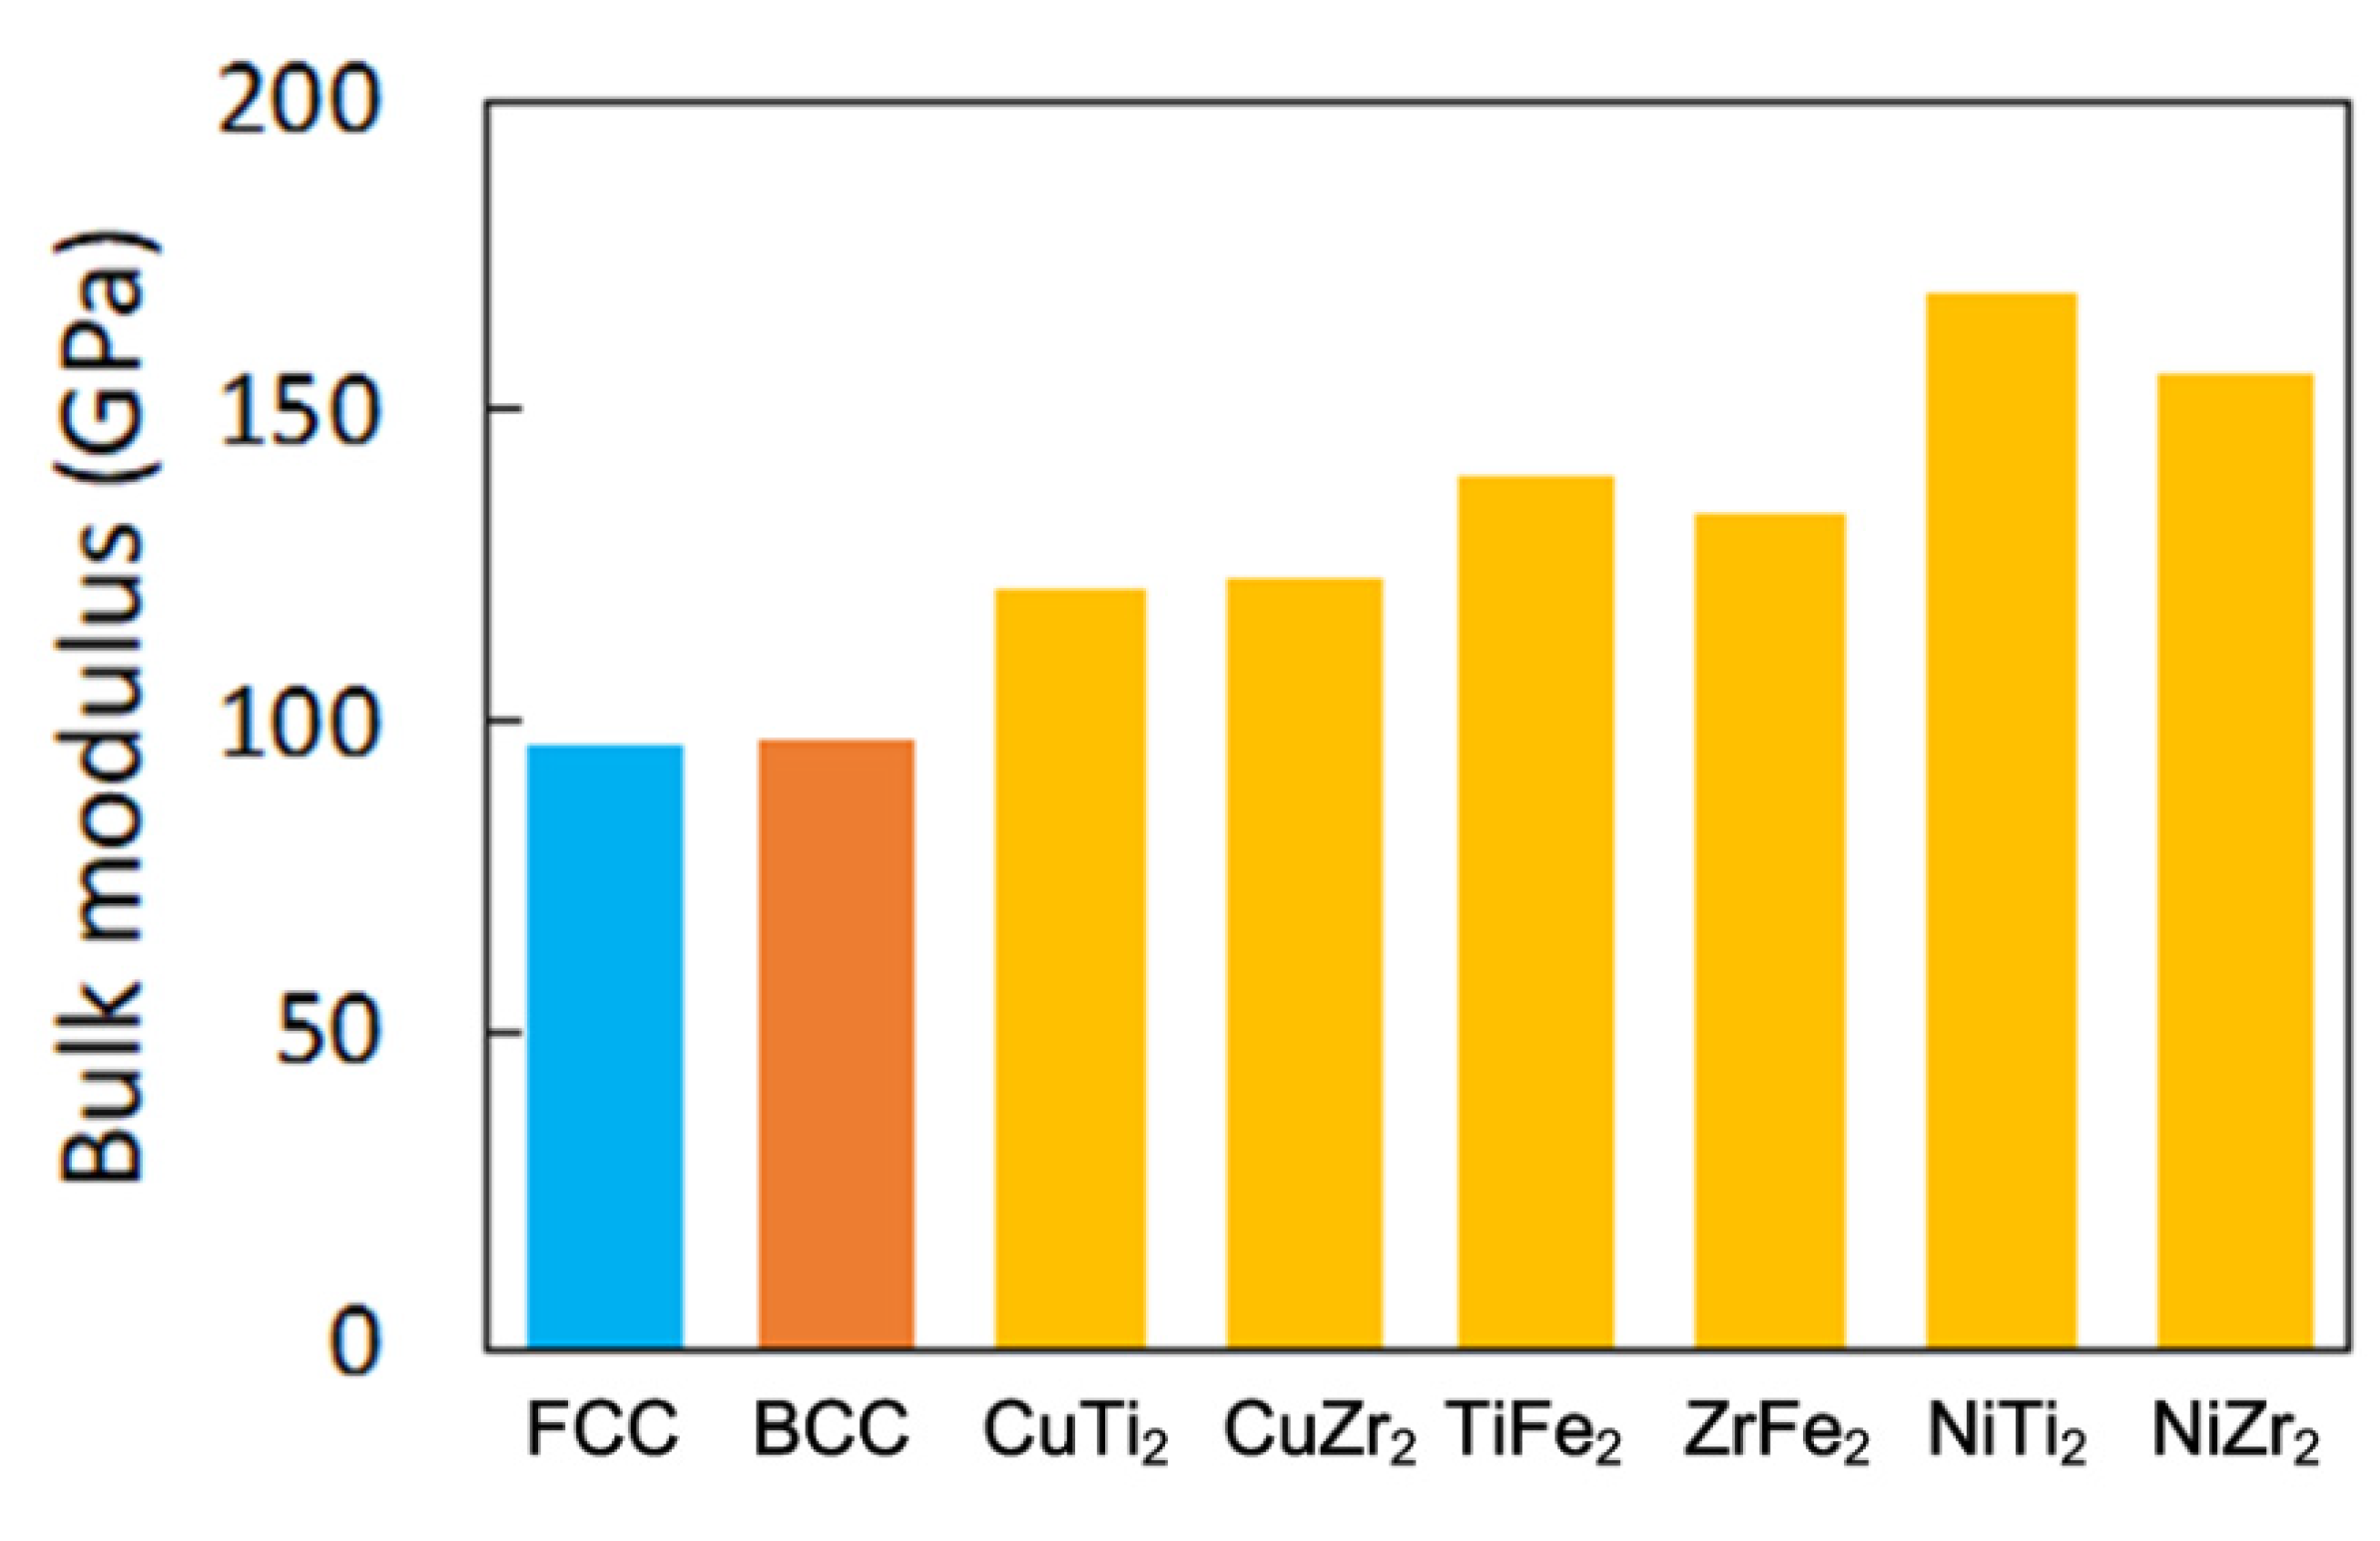
3.3. First-Principles Calculation for the Hardness Properties of the CuFeTiZrNix Alloys

Figure 6 shows the calculation results for the formation energy (Figure 6a) and bulk modulus (Figure 6b) of HEAs with equimolar amounts of Fe, Cu, Ti, and Zr, and increasing Ni content. The calculated concentration range is from 5 to 40 at.% Ni in 1 at.% increments and the amount of Ni is denoted by x in Figure 6. It can be seen from Figure 6a that the BCC phase is more stable than the FCC phase when the Ni content is increased. In addition, the difference in formation energy between BCC and FCC phases decreases as x increases, and when x = 2.67 (Ni concentration is 40 at.%), the formation energy of the FCC phase is lower than that of the BCC phase. In other words, the formation of the FCC phase became more stable than that of the BCC phase when the value of x was greater than 2.67. In the experimental observations, only the Laves phase and the BCC phase were found when at x = 0.1 or 0.3, but the FCC phase was found when x = 0.5, 0.8, and 1.0. In addition, it was found that the proportion of BCC and FCC phases increased and the proportion of the Laves phase decreased as the Ni concentration increased.
Figure 6b shows the bulk modulus of FCC and BCC phases versus the molar ratio of Ni. The bulk modulus B0 is B 0 = V 0 ( P / V ) , where V0 is the volume at the ground state, P is the pressure, and V is the volume. This bulk modulus relates to changes in volume stress and is a function of the strength of the FCC and BCC phases. It can be seen from Figure 6b that the BCC phase has a slightly higher bulk modulus than the FCC phase. Figure 6b also confirms that the bulk modulus was increased with the increase in x. In the experimental observation, it was seen that the hardness of the CuFeTiZrNix alloys decreased with increasing Ni concentration. This result is inconsistent with the calculation result that the bulk modulus increases with increasing Ni concentration. In the CuFeTiZrNix HEA alloys, the bulk modulus of the solid solution phase on hardness might be considered to have only a small effect on the alloy hardness.
Figure 7 shows the calculated results for the bulk modulus of the Laves_C14 phase for the TiCu2, ZrCu2, TiFe2, ZrFe2, TiNi2, and ZrNi2 phases compared with the FCC and BCC phases in the equimolar FeCuTiZrNix alloy. As shown in Figure 7, the six Laves_C14 phases show a higher bulk modulus than that in the FCC and BCC phases. The experimentally observed high hardness in the CuFeTiZrNix HEA is attributed to the presence of the Laves_C14 phase with a high bulk modulus, and the decrease in hardness with the increase in the Ni concentration results in the increase in FCC and BCC phases with a low bulk modulus. In other words, when the Ni content in the CuFeTiZrNix alloys was increased, more of the FCC phase was formed in CuFeTiZrNix alloys. The intermetallic compound is harder for the metallic system than the single-solution phase. Thus, more of the FCC phase forming in the CuFeTiZrNix alloys leads to a decrease in hardness. These statements are confirmed by other references that suggest that due to its solid solution or lack of an ordered phase and lower density, alloys containing an FCC phase have a reduced hardness [40]. Otherwise, the hardness would increase when the content of the FCC phase decreases because of precipitation hardening [41]. The first-principles calculations reveal that the Laves_C14 phase exhibits a higher bulk modulus than FCC and BCC and that the FCC phase is increasingly stable as the Ni concentration increases. In light of these results, it revealed that a computational study is an effective approach to predicting structural stability and hardness trends.

3.4. The Corrosion Resistance of the CuFeTiZrNix Alloys

Figure 8 shows the polarization curves obtained from the CuFeTiZrNix alloys immersed in a 3.5 wt.% solution of NaCl. It can be seen from Figure 8 that the addition of Ni improved the corrosion-resistant properties of the CuFeTiZrNix alloys in a 3.5 wt.% NaCl solution compared with those of two references: The CuFeTiZr alloy [42] and SUS 304. In particular, the corrosion potential of the CuFeTiZrNix alloys with higher Ni content (x = 0.5 to 1.0) was slightly higher than that of SUS304. This phenomenon revealed that the increase in Ni and decrease in Cu in the CuFeTiZrNix alloys led to the formation of a Ni oxide layer. The Ni oxide layer acts as a protective layer to prevent damage to the surface of the CuFeTiZrNix alloys. It is also reported in the literature that Cu in the alloys can damage this protective oxide film via a chemical reaction, for example, between Cu and the Cl of the NaCl solution, which would lead to the formation of holes or defects on the surface of the alloy [43,44]. Thus, the passivation behavior in the polarization curves of the CuFeTiZrNix alloys in the 3.5 wt.% NaCl solution occurred at an anodic branch. This passive layer protected against corrosion and decreased the rate of corrosion of the CuFeTiZrNix alloys [45]. The corrosion current (icorr) and corrosion voltage (Ecorr) values of the CuFeTiZrNix alloys immersed in the 3.5 wt.% NaCl solution were also compared with those of the CuFeTiZr [42], SUS304, and CoCrFeNi1.7Ti0.3 [38] systems. The values are listed in Table 4 and show trends consistent with those of the polarization curves presented in Figure 8.
Figure 9 show the secondary electron image (SEI) micrographs of the CuFeTiZrNi0.1 in Figure 9a, CuFeTiZrNi0.3 in Figure 9b, CuFeTiZrNi0.5 in Figure 9c, CuFeTiZrNi0.8 in Figure 9d, CuFeTiZrNi1.0 in Figure 9e, and SUS 304 in Figure 9f after the polarization test. Stress corrosion creak (SCC) was observed on the surfaces of the CuFeTiZrNi0.1 and CuFeTiZrNi0.3 alloys, as shown in Figure 9a,b. This SCC was due to the formation of a protective oxide or passivation film on the surface. As a result, the surface of the alloy was not directly exposed to the 3.5 wt.% NaCl solution. Sodium ions generated by the electrolyte exchange electrons within the reaction environment [42]. According to the literature, SCC arises from a combination of the presence of tensile stress and the specific corrosion medium leading to hydrogen embrittlement. When SCC has occurred, the metal remains intact over most of its surface while fine cracks progress through it. This SCC exhibits a brittle mechanical fracture [46]. In addition, as shown in Figure 9c–f, pitting corrosion was observed on the surface at the passivation area in both the CuFeTiZrNix (x = 0.5, 0.8, and 1.0) alloys and SUS 304. Pitting represents a highly localized attack that results in holes in the alloy. The degree of pitting decreased with increasing Ni content, and the petting cavities were smaller than those observed in the SUS 304 substrate.
Figure 10 shows the BEI morphologies of all the CuFeTiZrNix alloys following the polarization test. It can be seen that the Cu-rich regions were selectively etched while the other regions were undamaged. This shows that the other regions were relatively stable. This phenomenon results from differences in the chemical composition across the surface of the alloy. Under the action of the corrosive medium, the active region was oxidized while the other regions remained stable. This Cu-rich region corroded because the Cu atom is highly reactive and readily forms oxide. However, the resulting Cu oxide layer cannot provide good corrosion protection.
Figure 11 shows the SEI surface morphologies of the CuFeTiZrNix alloys and SUS 304 after being immersed in the 3.5 wt.% NaCl solution for 30 days. The main type of corrosion behavior observed was surface pitting of the Cu-rich region in the CuFeTiZrNix alloys. However, the pitting types between CuFeTiZrNix alloys and SUS 304 differed, with cavities being observed in the CuFeTiZrNix alloys while a knife-line attack (KLA) was seen to form in the SUS 304. This difference arose from the stabilized austenitic stainless steel being attacked intergranularly by chromium carbide precipitation [46].
The average corrosion rates of the CuFeTiZrNix alloys and SUS 304 from the polarization and immersion tests are listed in Table 5 and plotted in Figure 12. The corrosion rate obtained from the weight loss data was used only as an index of the intensity of the corrosion attack [47]. The result revealed that the corrosion rate decreased slightly with an increasing Ni content due to the corresponding decrease in Cu content. The CuFeTiZrNix alloys corroded faster than the SUS 304 because the SUS 304 contained no Cu. Cu did not generate a good protective oxide film on the surface of the alloy. The results confirmed that having more Ni and less Cu slowed down the corrosion of the surface of the CuFeTiZrNix alloy.

4. Conclusions

In this study, the microstructure, hardness, and corrosion resistance of CuFeTiZrNix high-entropy alloys were investigated. The following conclusions could be drawn.
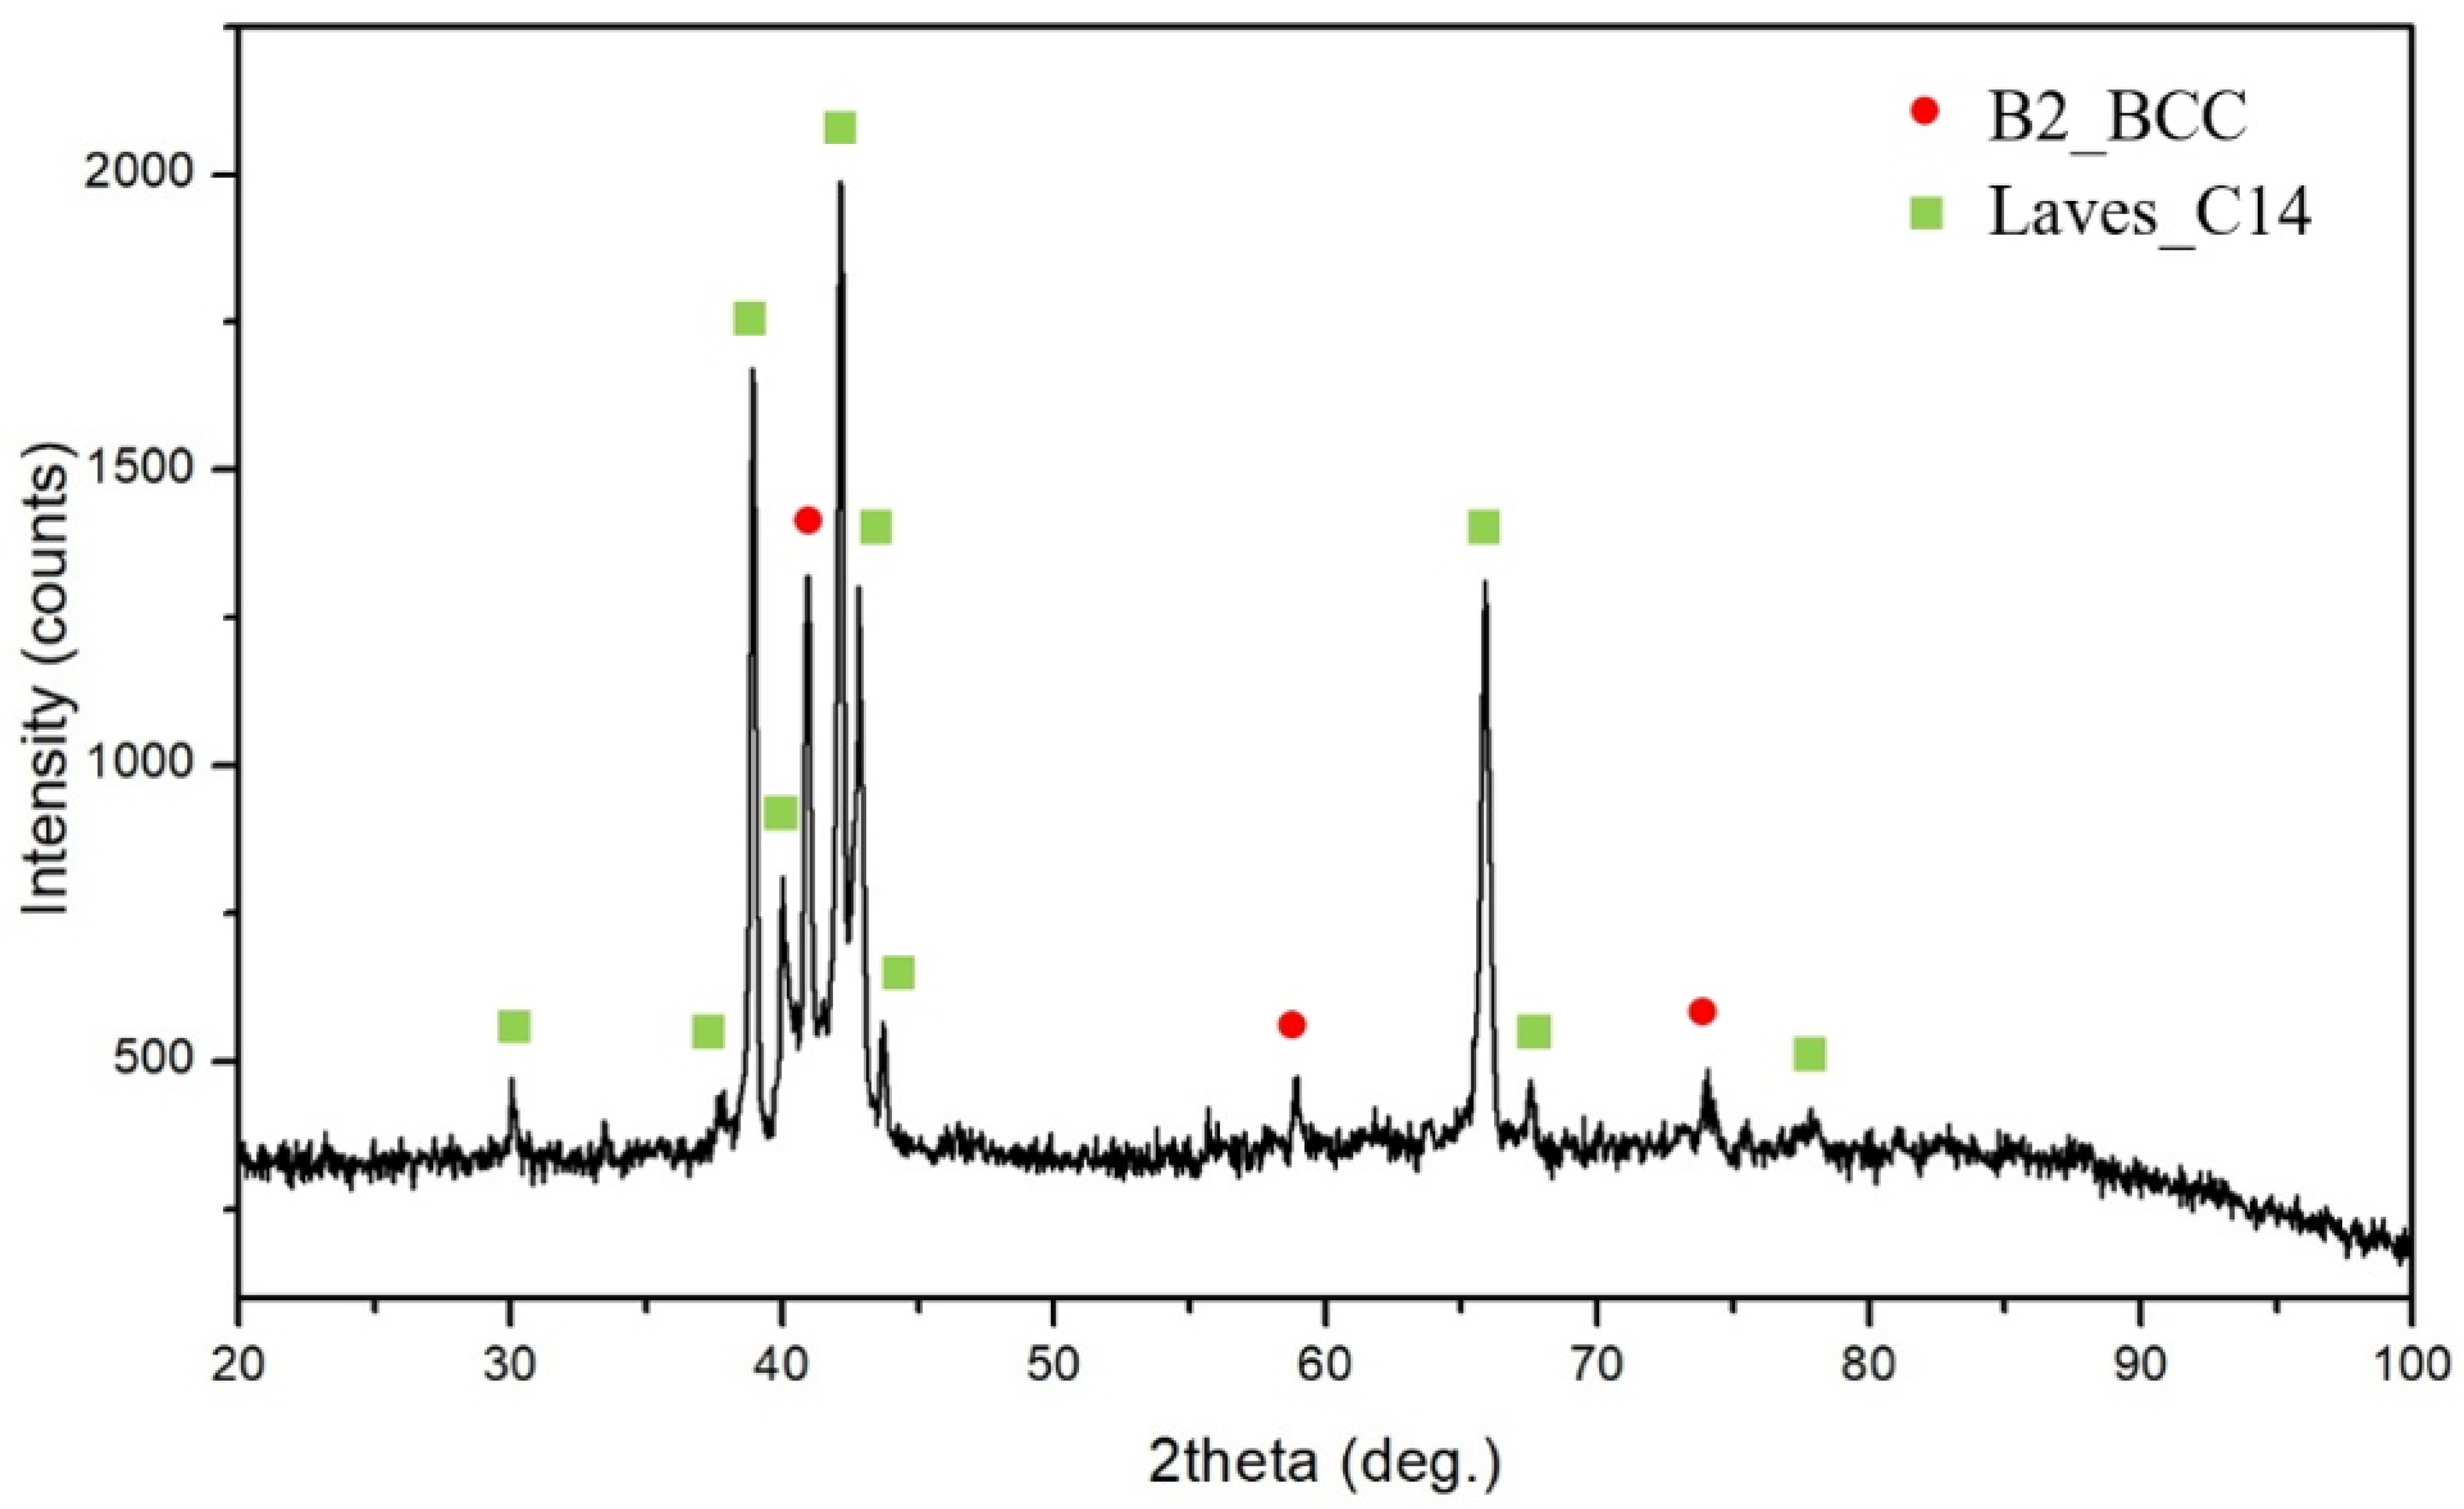
  • The B2_BCC and Laves_C14 phases were found in all CuFeTiZrNix alloys. When x was greater than 0.5, the FCC phase was also formed. When x increased to 0.8 and 1.0, the Cu51Zr14 phase was also observed in the CuFeTiZrNix alloys.
  • The hardness of the CuFeTiZrNix alloys gradually decreased with increasing Ni content. More of the FCC phase formed in the CuFeTiZrNix alloys as the Ni content increased, and, as shown by first-principles calculations of hardness, the FCC phase had the lowest bulk modulus. Thus, more of the FCC phase forming in the CuFeTiZrNix alloys leads to decreased hardness.
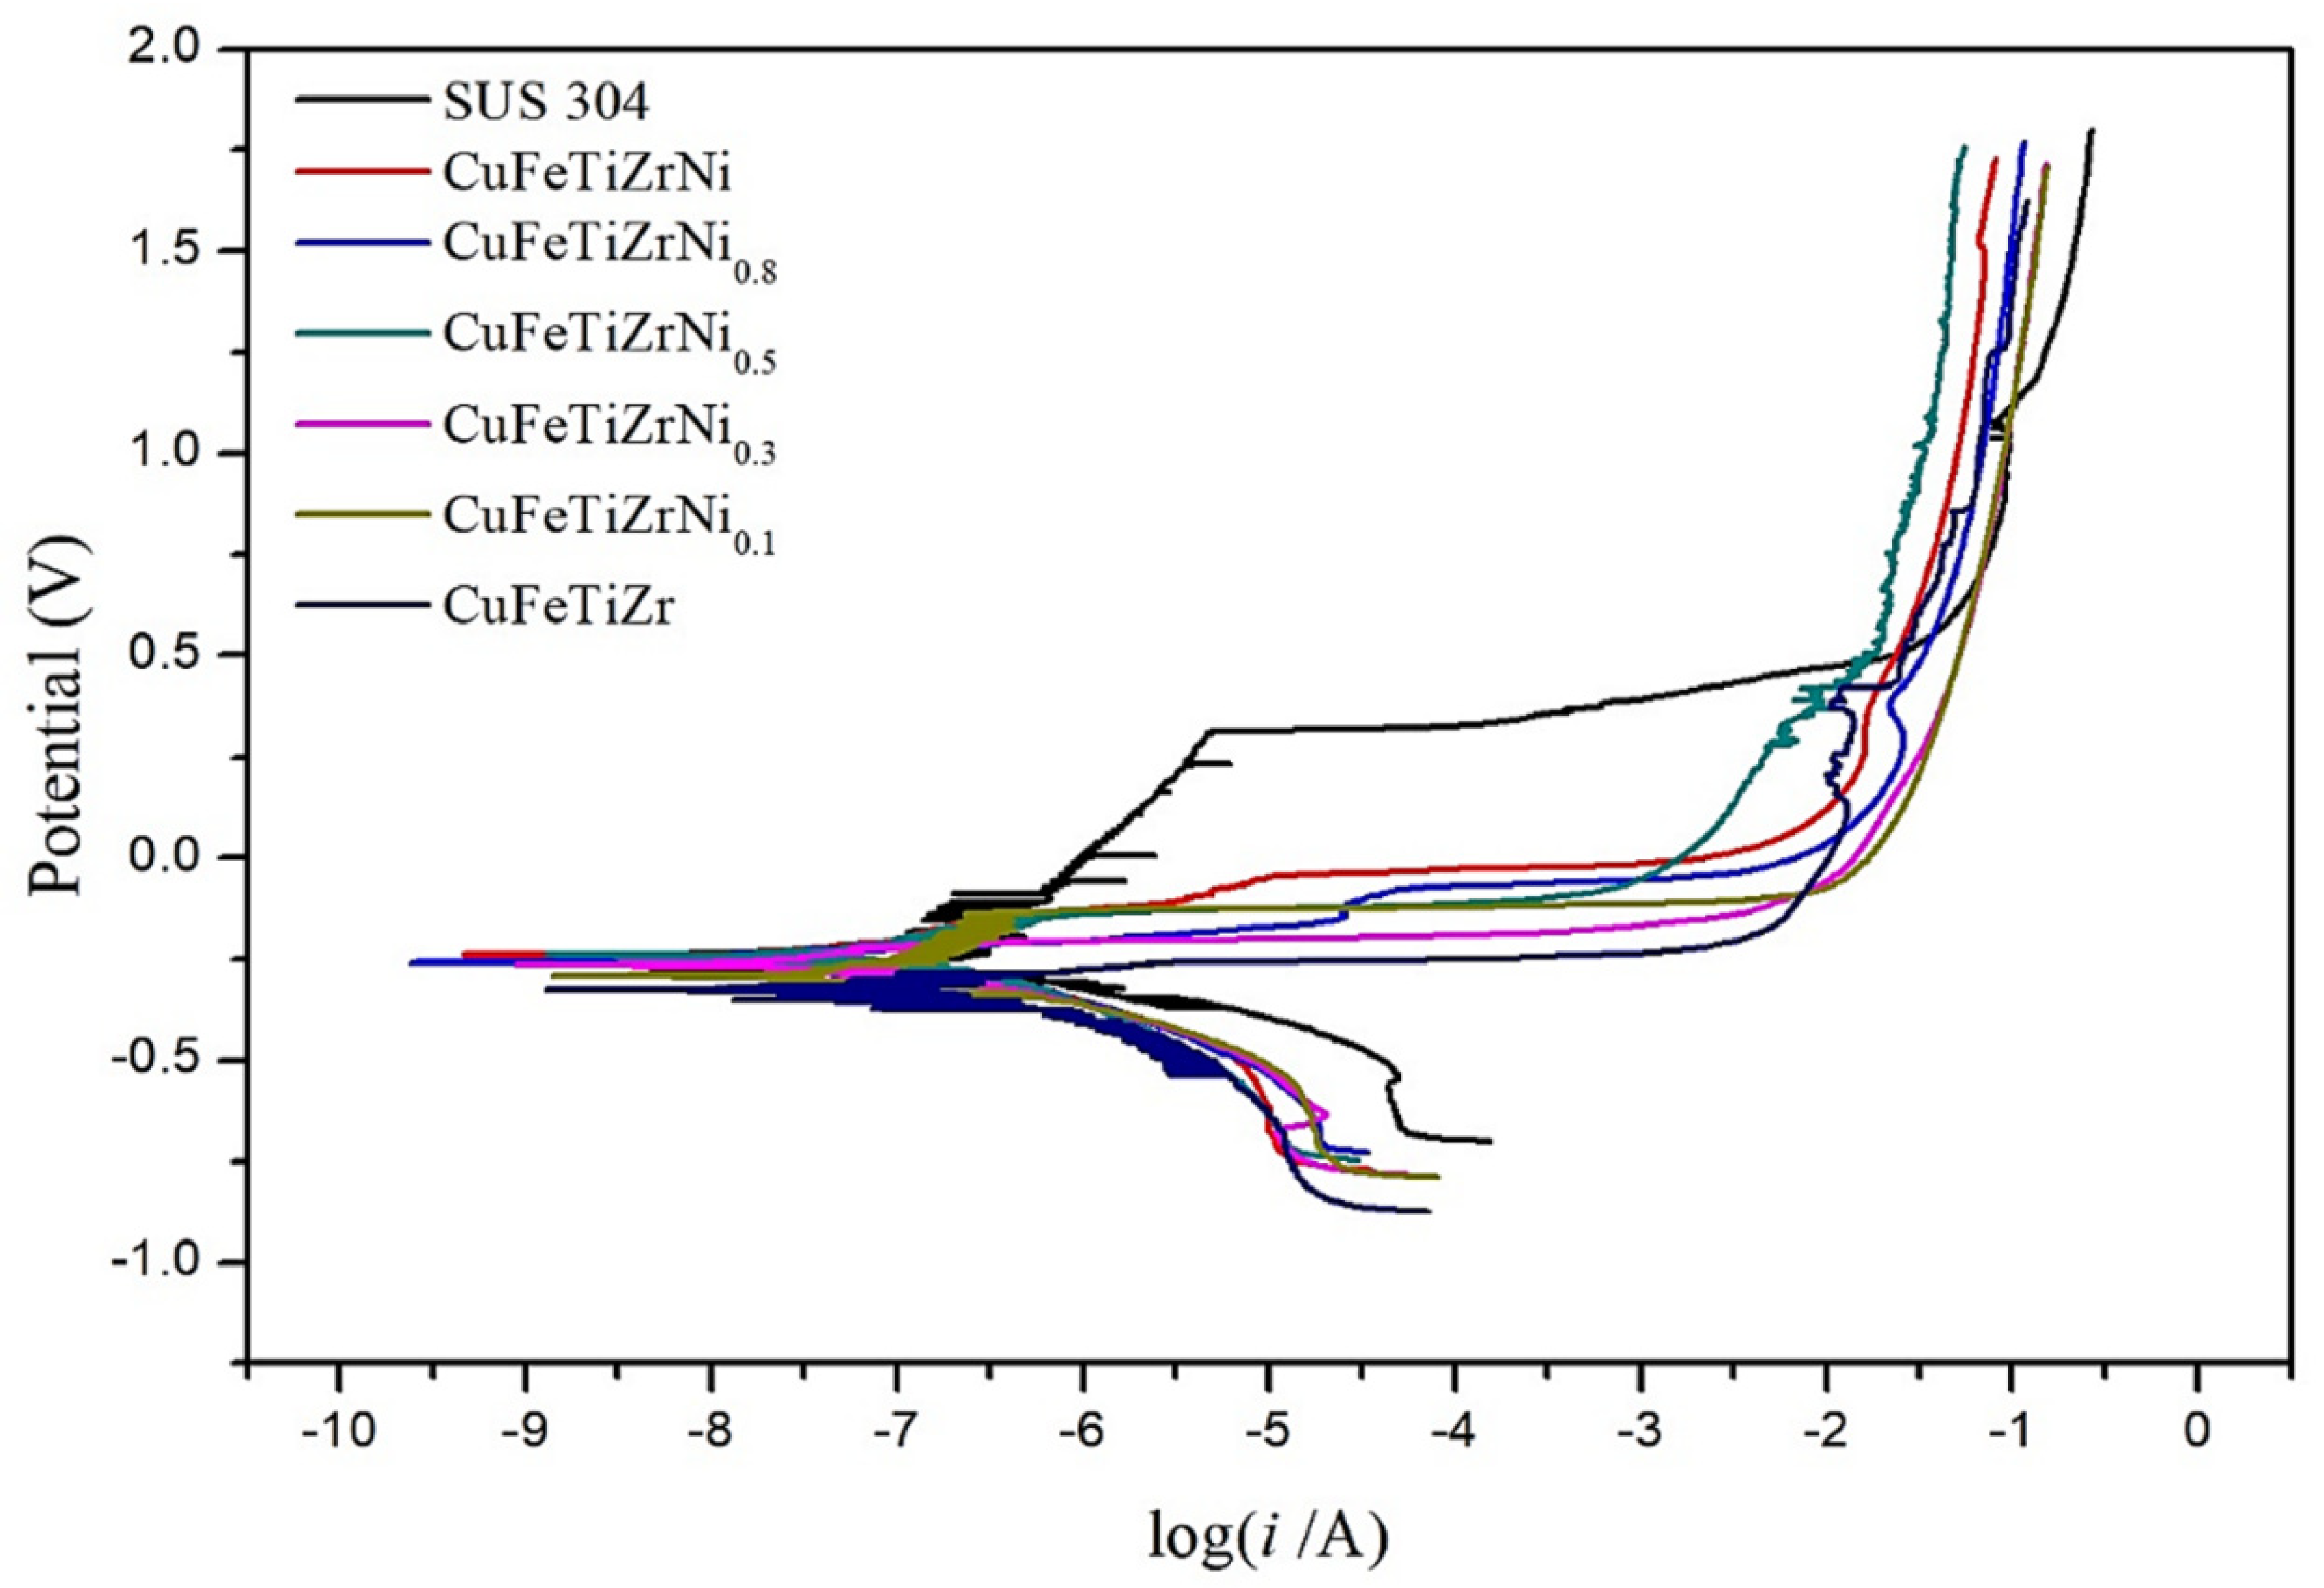
  • The corrosion resistance properties of the CuFeTiZrNi0.5, CuFeTiZrNi0.8, and CuFeTiZrNi1.0 alloys were superior to those of the SUS 304 and CoCrFeNi1.7Ti0.3 alloy systems in 3.5 wt.% NaCl solution. An increase in Ni content and the corresponding decrease in Cu content improved the corrosion potential and decreased the corrosion current density, indicating a gradual enhancement in corrosion resistance.
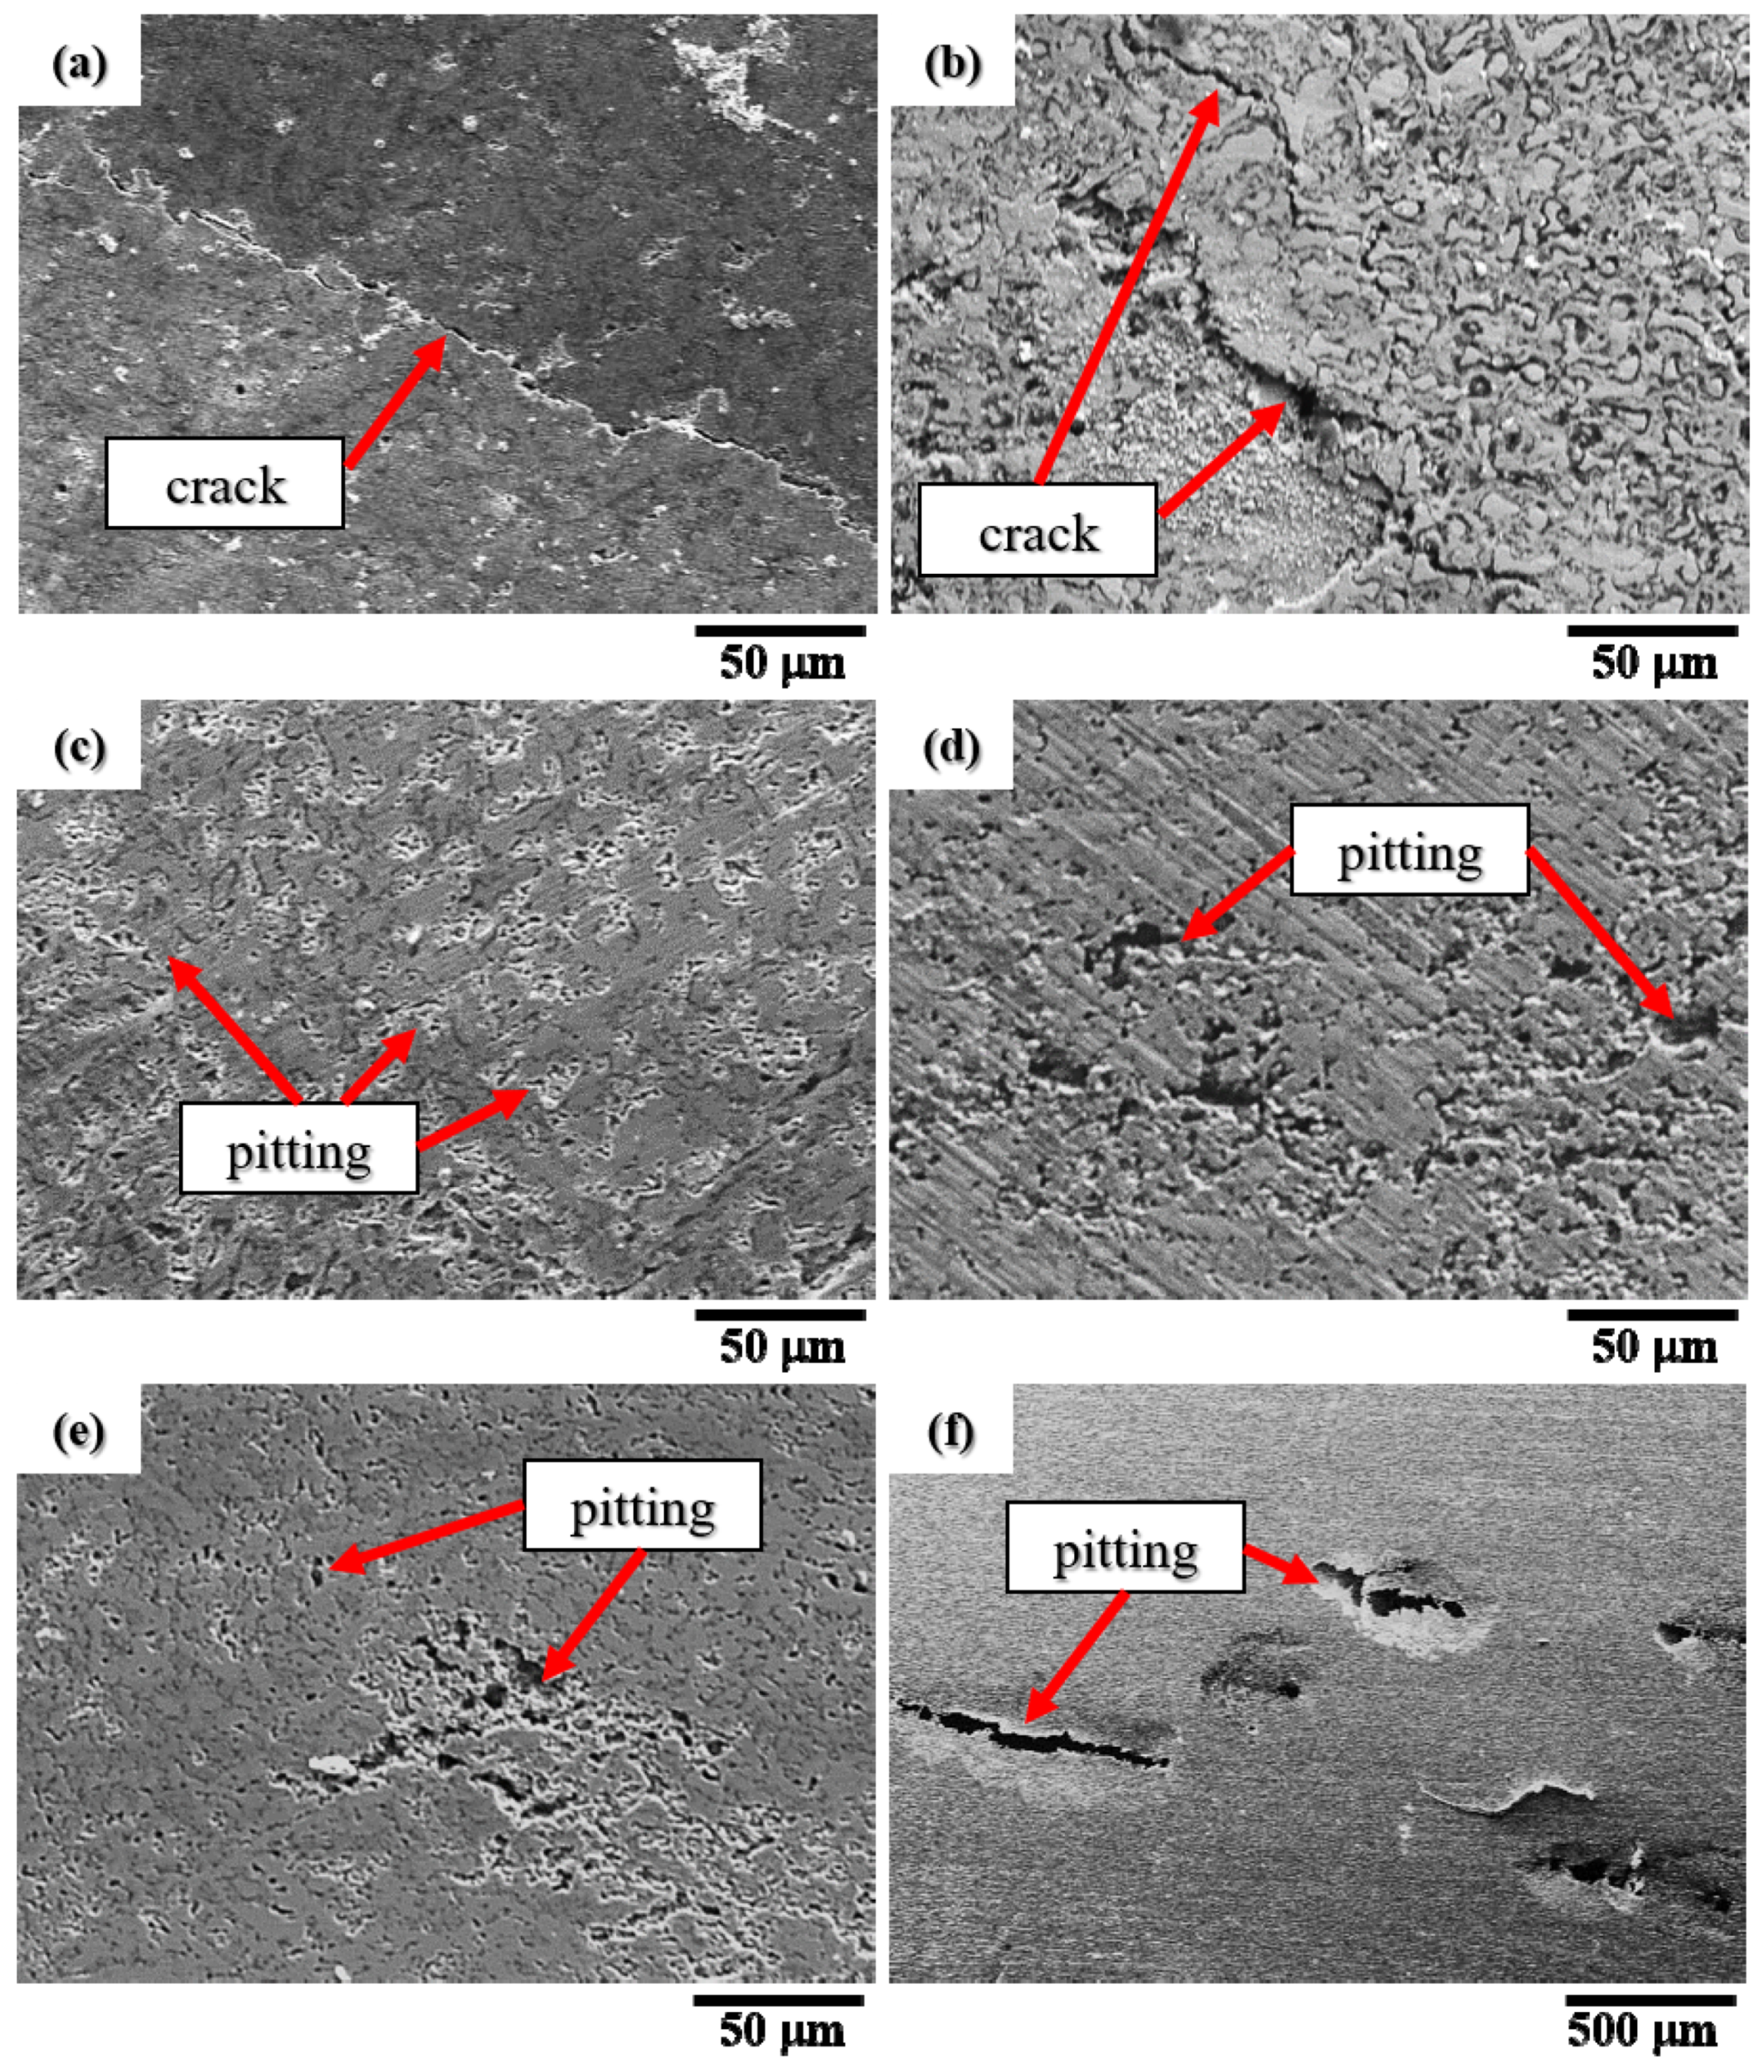
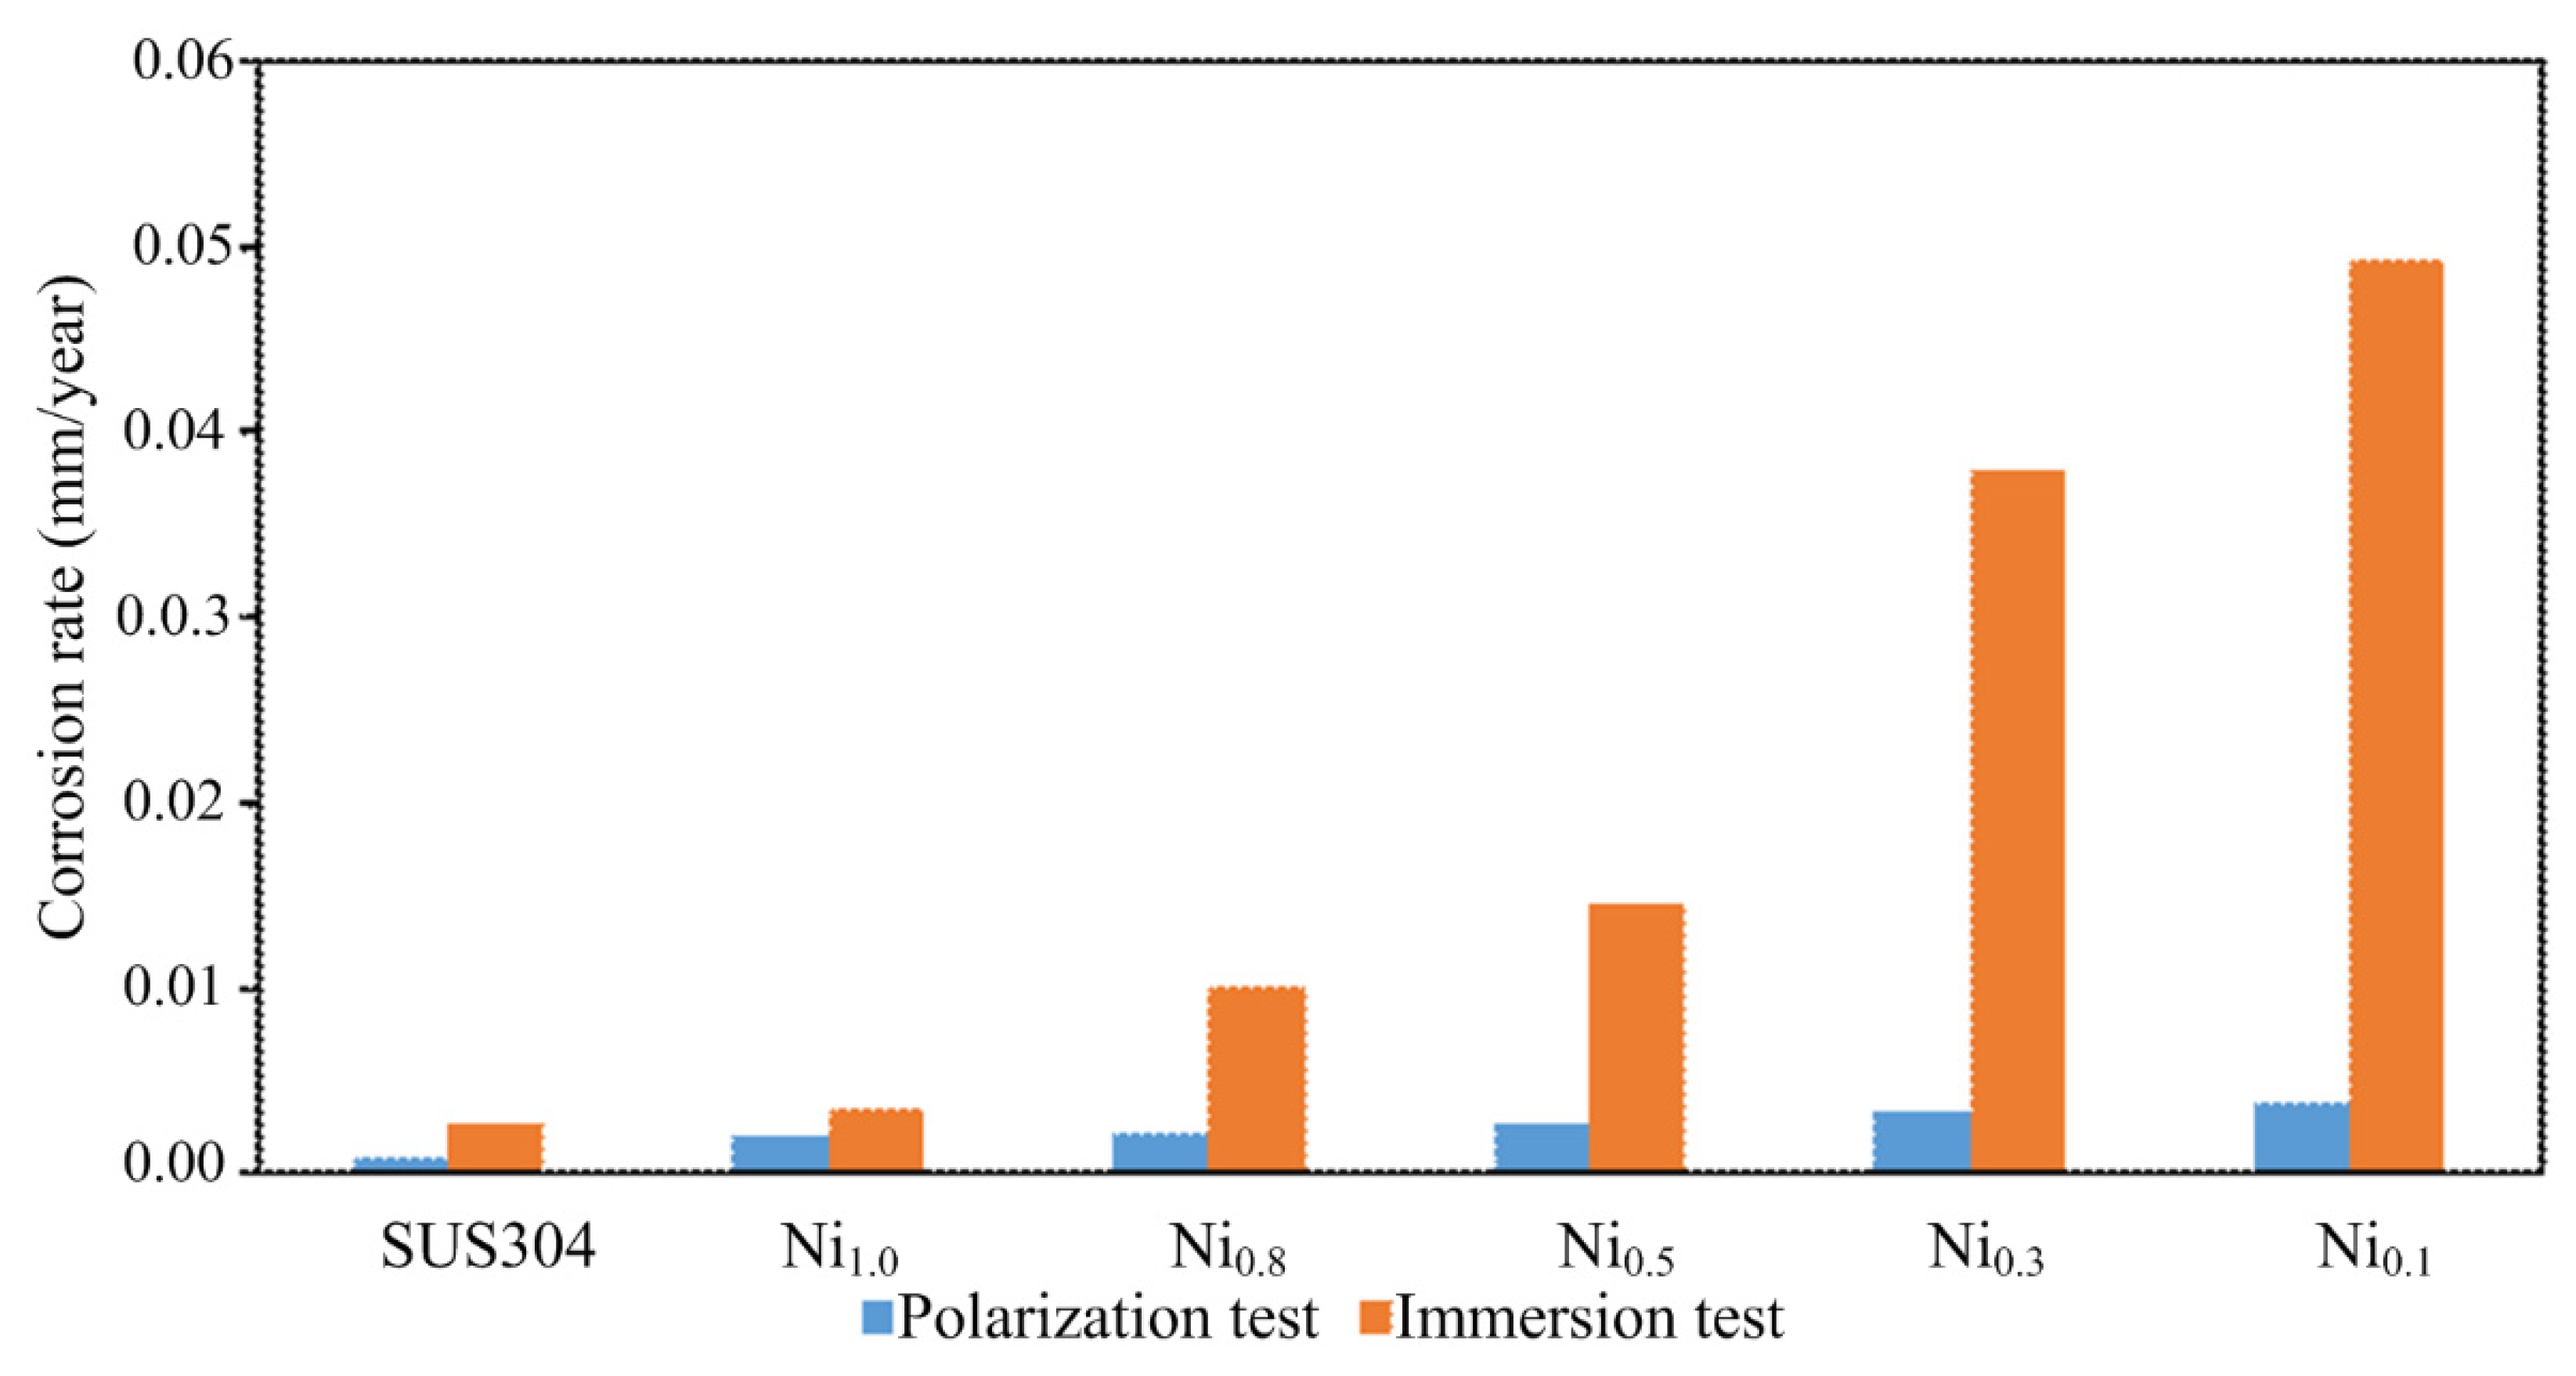
  • In the polarization test, stress corrosion creaking (SCC) was observed in the CuFeTiZrNi0.1–0.3 alloys, as well as pitting in the CuFeTiZrNi0.5–1.0 alloys. The corrosion rates in both the polarization and immersion tests decreased slightly with increasing Ni content. In the immersion test, the major type in all CuFeTiZrNix alloys was surface pitting.

Author Contributions

Conceptualization, Y.-W.Y. and S.I.; Data curation, W.Y., P.-C.K. and R.O.; Formal analysis, W.Y., P.-C.K. and S.-Y.C.; Software, R.O. and S.I.; Methodology, W.Y. and R.O.; Project administration, Y.-W.Y.; Resources, Y.-W.Y. and S.I.; Supervision, Y.-W.Y.; Writing–original draft, W.Y., P.-C.K. and S.-Y.C.; Writing–review & editing, A.D.L., A.S.P., S.I. and Y.-W.Y. All authors have read and agreed to the published version of the manuscript.

Funding

The authors acknowledge financial support from the National Taiwan University of Science and Technology—Kyushu Institute of Technology Joint Research Program (NTUST-Kyutech-108-03 & 109-02), the Ministry of Science and Technology, Taiwan (Grant No. MOST 108-2221-E-011-091 and MOST 109-2221-E-011-092), and the Applied Research Center for Thin-Film Metallic Glass from The Featured Areas Research Center Program within the framework of the Higher Education Sprout Project of the Ministry of Education (MOE) in Taiwan.

Acknowledgments

The authors are also grateful for the assistance of S. C. Laiw of the National Taiwan University of Science and Technology in operating the SEM-EDS.

Conflicts of Interest

The authors declare no conflict of interest.

References

  1. Yeh, J.W.; Chen, S.K.; Lin, S.J.; Gan, J.Y.; Chin, T.S.; Shun, T.T.; Tsau, C.H.; Chang, S.Y. Nanostructured high-entropy alloys with multiple principal elements: Novel alloy design concepts and outcomes. Adv. Eng. Mater. 2004, 6, 299–303. [Google Scholar] [CrossRef]
  2. Zhang, K.B.; Fu, Z.Y.; Zhang, J.Y.; Wang, W.M.; Wang, H.; Wang, Y.C.; Zhang, Q.J.; Shi, J. Microstructure and mechanical properties of CoCrFeNiTiAlx high-entropy alloys. Mater. Sci. Eng. A 2009, 508, 214–219. [Google Scholar] [CrossRef]
  3. Yeh, J.W.; Chen, Y.L.; Lin, S.J.; Chen, S.K. High-entropy alloys—A new era of exploitation. Mater. Sci. Forum 2007, 560, 1–9. [Google Scholar] [CrossRef]
  4. Sheikh, S.; Mao, H.; Guo, S. Predicting solid solubility in CoCrFeNiMx (M= 4d transition metal) high-entropy alloys. J. Appl. Phys. 2017, 121, 194903. [Google Scholar] [CrossRef] [Green Version]
  5. Hsu, C.-Y.; Sheu, T.-S.; Yeh, J.-W.; Chen, S.-K. Effect of iron content on wear behavior of AlCoCrFexMo0.5Ni high-entropy alloys. Wear 2010, 268, 653–659. [Google Scholar] [CrossRef]
  6. Jien-Wei, Y. Recent progress in high entropy alloys. Ann. Chim. Sci. Mat 2006, 31, 633–648. [Google Scholar]
  7. Tsai, M.-H. Three Strategies for the Design of Advanced High-Entropy Alloys. Entropy 2016, 18, 252. [Google Scholar] [CrossRef]
  8. Tsai, M.-H.; Fan, A.-C.; Wang, H.-A. Effect of atomic size difference on the type of major intermetallic phase in arc-melted CoCrFeNiX high-entropy alloys. J. Alloys Compd. 2017, 695, 1479–1487. [Google Scholar] [CrossRef]
  9. Yeh, J.-W.; Chang, S.-Y.; Hong, Y.-D.; Chen, S.-K.; Lin, S.-J. Anomalous decrease in X-ray diffraction intensities of Cu–Ni–Al–Co–Cr–Fe–Si alloy systems with multi-principal elements. Mater. Chem. Phys. 2007, 103, 41–46. [Google Scholar] [CrossRef]
  10. Tong, C.-J.; Chen, M.-R.; Yeh, J.-W.; Lin, S.-J.; Chen, S.-K.; Shun, T.-T.; Chang, S.-Y. Mechanical performance of the AlxCoCrCuFeNi high-entropy alloy system with multiprincipal elements. Metall. Mater. Trans. A 2005, 36, 1263–1271. [Google Scholar] [CrossRef]
  11. Gludovatz, B.; Hohenwarter, A.; Catoor, D.; Chang, E.H.; George, E.P.; Ritchie, R.O. A fracture-resistant high-entropy alloy for cryogenic applications. Science 2014, 345, 1153–1158. [Google Scholar] [CrossRef] [PubMed] [Green Version]
  12. Zhang, Y.; Zhou, Y.J.; Lin, J.P.; Chen, G.L.; Liaw, P.K. Solid-solution phase formation rules for multi-component alloys. Adv. Eng. Mater. 2008, 10, 534–538. [Google Scholar] [CrossRef]
  13. Ng, C.; Guo, S.; Luan, J.; Shi, S.; Liu, C.T. Entropy-driven phase stability and slow diffusion kinetics in an Al0.5CoCrCuFeNi high entropy alloy. Intermetallics 2012, 31, 165–172. [Google Scholar] [CrossRef]
  14. Tsai, M.-H.; Chang, K.-C.; Li, J.-H.; Tsai, R.-C.; Cheng, A.-H. A second criterion for sigma phase formation in high-entropy alloys. Mater. Res. Lett. 2016, 4, 90–95. [Google Scholar] [CrossRef]
  15. Jiang, H.; Han, K.; Qiao, D.; Lu, Y.; Cao, Z.; Li, T. Effects of Ta addition on the microstructures and mechanical properties of CoCrFeNi high entropy alloy. Mater. Chem. Phys. 2018, 210, 43–48. [Google Scholar] [CrossRef]
  16. Liu, W.H.; He, J.Y.; Huang, H.L.; Wang, H.; Lu, Z.P.; Liu, C.T. Effects of Nb additions on the microstructure and mechanical property of CoCrFeNi high-entropy alloys. Intermetallics 2015, 60, 1–8. [Google Scholar] [CrossRef]
  17. Salishchev, G.A.; Tikhonovsky, M.A.; Shaysultanov, D.G.; Stepanov, N.D.; Kuznetsov, A.V.; Kolodiy, I.V.; Tortika, A.S.; Senkov, O.N. Effect of Mn and V on structure and mechanical properties of high-entropy alloys based on CoCrFeNi system. J. Alloys Compd. 2014, 591, 11–21. [Google Scholar] [CrossRef]
  18. Wang, Z.; Guo, S.; Liu, C.T. Phase Selection in High-Entropy Alloys: From Nonequilibrium to Equilibrium. JOM 2014, 66, 1966–1972. [Google Scholar] [CrossRef]
  19. Tung, C.-C.; Yeh, J.-W.; Shun, T.-t.; Chen, S.-K.; Huang, Y.-S.; Chen, H.-C. On the elemental effect of AlCoCrCuFeNi high-entropy alloy system. Mater. Lett. 2007, 61, 1–5. [Google Scholar] [CrossRef]
  20. Chen, M.-R.; Lin, S.-J.; Yeh, J.-W.; Chen, S.-K.; Huang, Y.-S.; Tu, C.-P. Microstructure and properties of Al0.5CoCrCuFeNiTix (x = 0–2.0) high-entropy alloys. Mater. Trans. 2006, 47, 1395–1401. [Google Scholar] [CrossRef] [Green Version]
  21. Ye, Y.F.; Wang, Q.; Lu, J.; Liu, C.T.; Yang, Y. High-entropy alloy: Challenges and prospects. Mater. Today 2016, 19, 349–362. [Google Scholar] [CrossRef]
  22. Karpets, M.V.; Myslyvchenko, O.M.; Makarenko, O.S.; Gorban, V.F.; Krapivka, M.O.; Degula, A.I. Effect of nickel on the structure and phase composition of the VCrMnFeCoNixhigh-entropy alloy. J. Superhard Mater. 2015, 37, 182–188. [Google Scholar] [CrossRef]
  23. Chandan, A.K.; Kishore, K.; Hung, P.T.; Ghosh, M.; Chowdhury, S.G.; Kawasaki, M.; Gubicza, J. Effect of nickel addition on enhancing nano-structuring and suppressing TRIP effect in Fe40Mn40Co10Cr10 high entropy alloy during high-pressure torsion. Int. J. Plast. 2022, 150, 103193. [Google Scholar] [CrossRef]
  24. Miracle, D.B.; Senkov, O.N. A critical review of high entropy alloys and related concepts. Acta Mater. 2017, 122, 448–511. [Google Scholar] [CrossRef] [Green Version]
  25. López Ríos, M.; Socorro Perdomo, P.P.; Voiculescu, I.; Geanta, V.; Crăciun, V.; Boerasu, I.; Mirza Rosca, J.C. Effects of nickel content on the microstructure, microhardness and corrosion behavior of high-entropy AlCoCrFeNix alloys. Sci. Rep. 2020, 10, 21119. [Google Scholar] [CrossRef] [PubMed]
  26. Chen, Y.Y.; Duval, T.; Hung, U.D.; Yeh, J.W.; Shih, H.C. Microstructure and electrochemical properties of high entropy alloys—A comparison with type-304 stainless steel. Corros. Sci. 2005, 47, 2257–2279. [Google Scholar] [CrossRef]
  27. Tsai, M.-H.; Tsai, K.-Y.; Tsai, C.-W.; Lee, C.; Juan, C.-C.; Yeh, J.-W. Criterion for Sigma Phase Formation in Cr- and V-Containing High-Entropy Alloys. Mater. Res. Lett. 2013, 1, 207–212. [Google Scholar] [CrossRef] [Green Version]
  28. Yurchenko, N.; Stepanov, N.; Salishchev, G. Laves-phase formation criterion for high-entropy alloys. Mater. Sci. Technol. 2017, 33, 17–22. [Google Scholar] [CrossRef]
  29. ASTM E92–82; Standard Test Method for Vickers Hardness of Metallic Materials. ASTM International: West Conshohocken, PA, USA, 2003.
  30. Shi, Y.; Yang, B.; Xie, X.; Brechtl, J.; Dahmen, K.A.; Liaw, P.K. Corrosion of Al xCoCrFeNi high-entropy alloys: Al-content and potential scan-rate dependent pitting behavior. Corros. Sci. 2017, 119, 33–45. [Google Scholar] [CrossRef]
  31. ASTM G31-72; Standard Practice for Laboratory Immersion Corrosion Testing of Metals. ASTM: West Conshohocken, PA, USA, 2004.
  32. HP. Available online: http://kkr.issp.u-tokyo.ac.jp/jp/ (accessed on 1 April 2022).
  33. Liu, W.H.; Yang, T.; Liu, C.T. Precipitation hardening in CoCrFeNi-based high entropy alloys. Mater. Chem. Phys. 2018, 210, 2–11. [Google Scholar] [CrossRef]
  34. Guo, S.; Liu, C.T. Phase stability in high entropy alloys: Formation of solid-solution phase or amorphous phase. Prog. Nat. Sci. Mater. Int. 2011, 21, 433–446. [Google Scholar] [CrossRef] [Green Version]
  35. Kündig, A.A.; Ohnuma, M.; Ping, D.H.; Ohkubo, T.; Hono, K. In situ formed two-phase metallic glass with surface fractal microstructure. Acta Mater. 2004, 52, 2441–2448. [Google Scholar] [CrossRef]
  36. Dong, Y.; Lu, Y.; Kong, J.; Zhang, J.; Li, T. Microstructure and mechanical properties of multi-component AlCrFeNiMox high-entropy alloys. J. Alloys Compd. 2013, 573, 96–101. [Google Scholar] [CrossRef]
  37. Tsai, M.-H.; Yeh, J.-W. High-Entropy Alloys: A Critical Review. Mater. Res. Lett. 2014, 2, 107–123. [Google Scholar] [CrossRef]
  38. Hsieh, Y.C. The Studies on Microstructure and Properties of CoCrFeNixTi0.3 High-Entropy Alloys. Master’s Thesis, Feng Chia University, Taichung, Taiwan, 2015. [Google Scholar]
  39. Dong, Y.; Lu, Y.P.; Zhang, J.J.; Li, T.J. Microstructure and properties of multi-component AlxCoCrFeNiTi0.5 high-entropy alloys. Mater. Sci. Forum 2013, 745, 775–780. [Google Scholar] [CrossRef]
  40. Praveen, S.; Murty, B.S.; Kottada, R.S. Alloying behavior in multi-component AlCoCrCuFe and NiCoCrCuFe high entropy alloys. Mater. Sci. Eng. A 2012, 534, 83–89. [Google Scholar] [CrossRef]
  41. Zhang, M.; Zhang, L.; Fan, J.; Yu, P.; Li, G. Novel Co-free CrFeNiNb0.1Tix high-entropy alloys with ultra high hardness and strength. Mater. Sci. Eng. A. 2019, 764, 138212. [Google Scholar] [CrossRef]
  42. Chen, Y.C. Study on Microstructure, Hardness and Corrosion of CuZrTiFeCrx High Entropy Alloy. Master’s Thesis, National Taiwan University of Science and Technology, Taipei, Taiwan, 2018. [Google Scholar]
  43. Kunze, J.; Maurice, V.; Klein, L.H.; Strehblow, H.-H.; Marcus, P. In situ STM study of the effect of chlorides on the initial stages of anodic oxidation of Cu(111) in alkaline solutions. Electrochim. Acta 2003, 48, 1157–1167. [Google Scholar] [CrossRef]
  44. Chen, Y.Y.; Hong, U.T.; Shih, H.C.; Yeh, J.W.; Duval, T. Electrochemical kinetics of the high entropy alloys in aqueous environments—A comparison with type 304 stainless steel. Corros. Sci. 2005, 47, 2679–2699. [Google Scholar] [CrossRef]
  45. Azarian, N.S.; Ghasemi, H.M.; Monshi, M.R. Synergistic Erosion and Corrosion Behavior of AA5052 Aluminum Alloy in 3.5 wt% NaCl Solution Under Various Impingement Angles. J. Bio- Tribo-Corros. 2015, 1, 10. [Google Scholar] [CrossRef] [Green Version]
  46. Fontana, M.G.; Greene, N.D. Corrosion Engineering; McGraw-Hill: New York, NY, USA, 2018. [Google Scholar]
  47. Hsu, Y.-J.; Chiang, W.-C.; Wu, J.-K. Corrosion behavior of FeCoNiCrCux high-entropy alloys in 3.5% sodium chloride solution. Mater. Chem. Phys. 2005, 92, 112–117. [Google Scholar] [CrossRef]
Figure 1. BEI microstructures of the CuFeTiZrNix alloys with different nickel content(x): (a,b) x = 0.1, (c,d) x = 0.5, (e,f) x = 1.0 ((a,c,e) are at 2000× magnification and (b,d,f) are at 5000× magnification).
Materials 15 03098 g001
Figure 2. XRD pattern of the CuFeTiZrNi0.1 alloy.
Materials 15 03098 g002
Figure 3. XRD pattern of the CuFeTiZrNi0.5 alloy.
Materials 15 03098 g003
Figure 4. XRD pattern of the CuFeTiZrNi1.0 alloy.
Materials 15 03098 g004
Figure 5. The hardness (HV) values of the CuFeTiZrNix alloys, CoCrFeNi1.7Ti0.3 [34], and SUS 304.
Materials 15 03098 g005
Figure 6. The dependence on Ni content of (a) the formation energies and (b) the bulk modulus of the FCC and BCC phases.
Materials 15 03098 g006
Figure 7. The bulk modulus of the FCC, BCC, and C14 binary Laves phases in the CuFeTiZrNix alloy.
Materials 15 03098 g007
Figure 8. The polarization curves for the CuFeTiZrNix alloys, CuFeTiZr [36], and SUS304 in 3.5 wt.% NaCl solution.
Materials 15 03098 g008
Figure 9. SEI surface morphologies of the CuFeTiZrNix alloys after the polarization test in 3.5 wt.% NaCl solution: (a) x = 0.1, (b) x = 0.3, (c) x = 0.5, (d) x = 0.8, (e) x = 1.0, and (f) SUS 304.
Materials 15 03098 g009
Figure 10. BEI surface morphologies of the CuFeTiZrNix alloys after the polarization test in 3.5 wt.% NaCl solution: (a) x = 0.1, (b) x = 0.3, (c) x = 0.5, (d) x = 0.8, and (e) x = 1.0.
Materials 15 03098 g010
Figure 11. SEI surface morphologies of the CuFeTiZrNix alloys after the polarization test in 3.5 wt.% NaCl solution for 30 days: (a) x = 0.1, (b) x = 0.3, (c) x = 0.5, (d) x = 0.8, and (e) x = 1.0, and (f) SUS 304.
Materials 15 03098 g011
Figure 12. A comparison of the polarization and immersion test results of the CuFeTiZrNix alloys and SUS 304.
Materials 15 03098 g012
Table 1. The chemical composition of the CuFeTiZrNix alloys in terms of atomic percentage (x = 0.1, 0.3, 0.5, 0.8, and 1.0 in molar ratio).
AlloysStructurePhasePhase Composition (at.%)
CuFeNiTiZr
CuFeTiZrNi0.1Dendrite-ALaves_C1432.517.22.023.824.5
Dendrite-BLaves_C1438.014.64.020.223.2
Dendrite-CB2_BCC18.532.52.638.57.9
Interdendrite-DLaves_C1425.827.42.021.223.6
CuFeTiZrNi0.3Dendrite-ALaves_C1429.216.38.024.322.2
Dendrite-BLaves_C1433.016.28.520.721.6
Dendrite-CB2_BCC20.625.56.435.012.5
Interdendrite-DLaves_C1426.025.26.219.123.5
CuFeTiZrNi0.5Dendrite-AFCC43.44.314.09.528.8
Dendrite-BB2_BCC15.825.39.840.28.9
Interdendrite-CLaves_C1417.433.07.520.621.5
CuFeTiZrNi0.8Dendrite-AFCC35.23.123.110.827.8
Dendrite-BB2_BCC13.621.117.938.98.5
Dendrite-CCu51Zr1451.410.011.610.316.7
Interdendrite-DLaves_C1415.734.510.918.920.0
CuFeTiZrNi1.0Dendrite-AFCC31.03.028.312.625.1
Dendrite-BB2_BCC11.222.319.740.06.8
Dendrite-CCu51Zr1455.16.912.08.317.7
Interdendrite-DLaves_C1413.635.614.217.918.7
Table 2. ∆Hmix, ∆Smix, δ, VEC, and Ω values for the CuFeTiZrNix alloys.
Alloy∆Hmix 
(kJ/mol)
∆Smix 
(J/K mol)
δVECΩ
CuFeTiZrNi0.1−16.4712.2010.856.831.34
CuFeTiZrNi0.3−18.5112.8210.776.971.25
CuFeTiZrNi0.5−20.1413.1510.697.111.17
CuFeTiZrNi0.8−21.9813.3510.587.291.09
CuFeTiZrNi1.0−22.8813.3810.517.41.05
Table 3. The measured hardness values of the CuFeTiZrNix alloys and SUS 304.
AlloysHardness (HV)References
SUS 304207.5 ± 2.7This work
CoCrFeNi1.7Ti0.3318Hsieh [38]
CuFeTiZrNi0.1934.8 ± 17.0This work
CuFeTiZrNi0.3921.9 ± 11.5This work
CuFeTiZrNi0.5914.2 ± 7.7This work
CuFeTiZrNi0.8905.9 ± 14.8This work
CuFeTiZrNi1.0893.8 ± 17.1This work
Table 4. The electrochemical parameters of the CuFeTiZrNix alloys, CuFeTiZr, and SUS 304 in 3.5 wt.% NaCl solution.
Alloysicorr (A/cm2)Ecorr (V)References
CuFeTiZr2.04 × 10−7−0.328Chen [42]
SUS 3045.83 × 10−8−0.268This work
CoCrFeNi1.7Ti0.31.32 × 10−8−0.26Hsieh [38]
CuFeTiZrNi0.17.04 × 10−8−0.292This work
CuFeTiZrNi0.35.95 × 10−8−0.264This work
CuFeTiZrNi0.55.65 × 10−8−0.242This work
CuFeTiZrNi0.85.32 × 10−8−0.240This work
CuFeTiZrNi1.05.11 × 10−8−0.236This work
Table 5. The average corrosion rates (mm/year) of CuFeTiZrNix alloys and SUS 304 in 3.5 wt.% NaCl solution.
AlloysCorrosion Rate (mm/year)
Polarization TestImmersion Test
CuFeTiZrNi0.139.17 × 10−449.25 × 10⁻³
CuFeTiZrNi0.333.83 × 10−437.86 × 10⁻³
CuFeTiZrNi0.526.54 × 10−414.46 × 10⁻³
CuFeTiZrNi0.822.07 × 10−410.08 × 10⁻³
CuFeTiZrNi1.019.43 × 10−43.58 × 10⁻³
SUS 3048.03 × 10−42.74 × 10⁻³
Publisher’s Note: MDPI stays neutral with regard to jurisdictional claims in published maps and institutional affiliations.

