
Fatigue Crack Growth Analysis under Constant Amplitude Loading Using Finite Element Method


Abstract
:1. Introduction
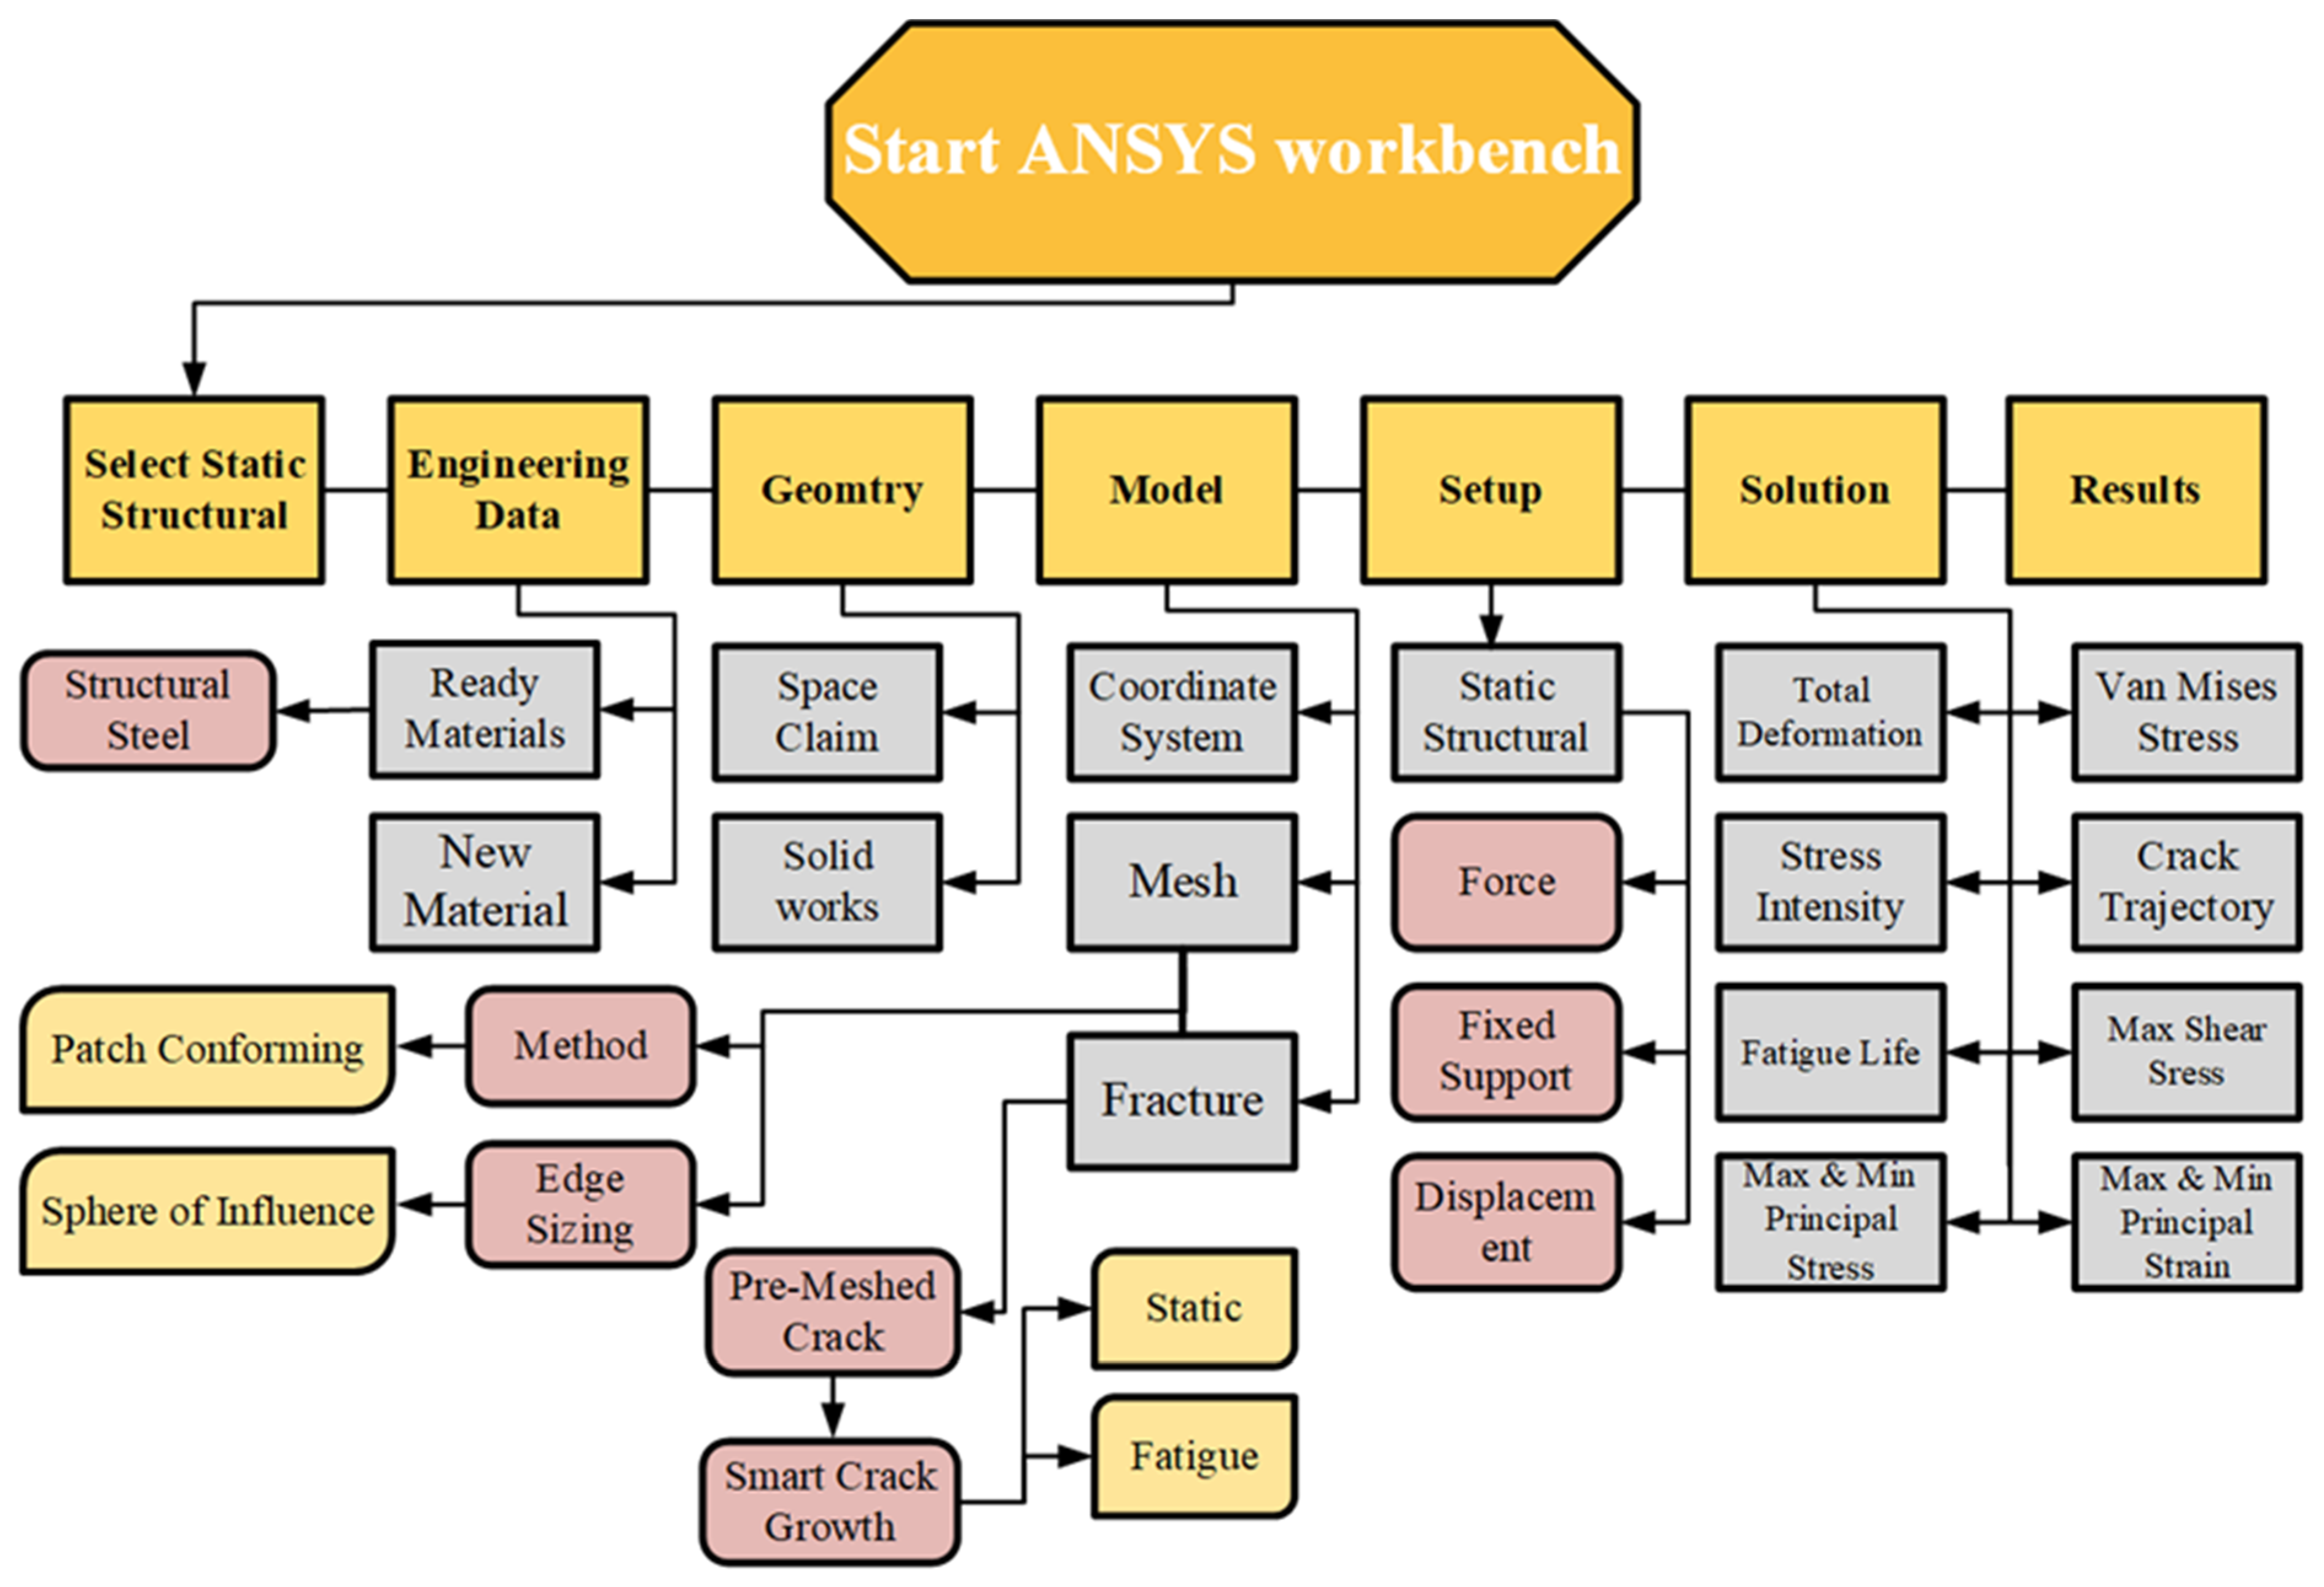
2. SMART Crack Growth Procedure
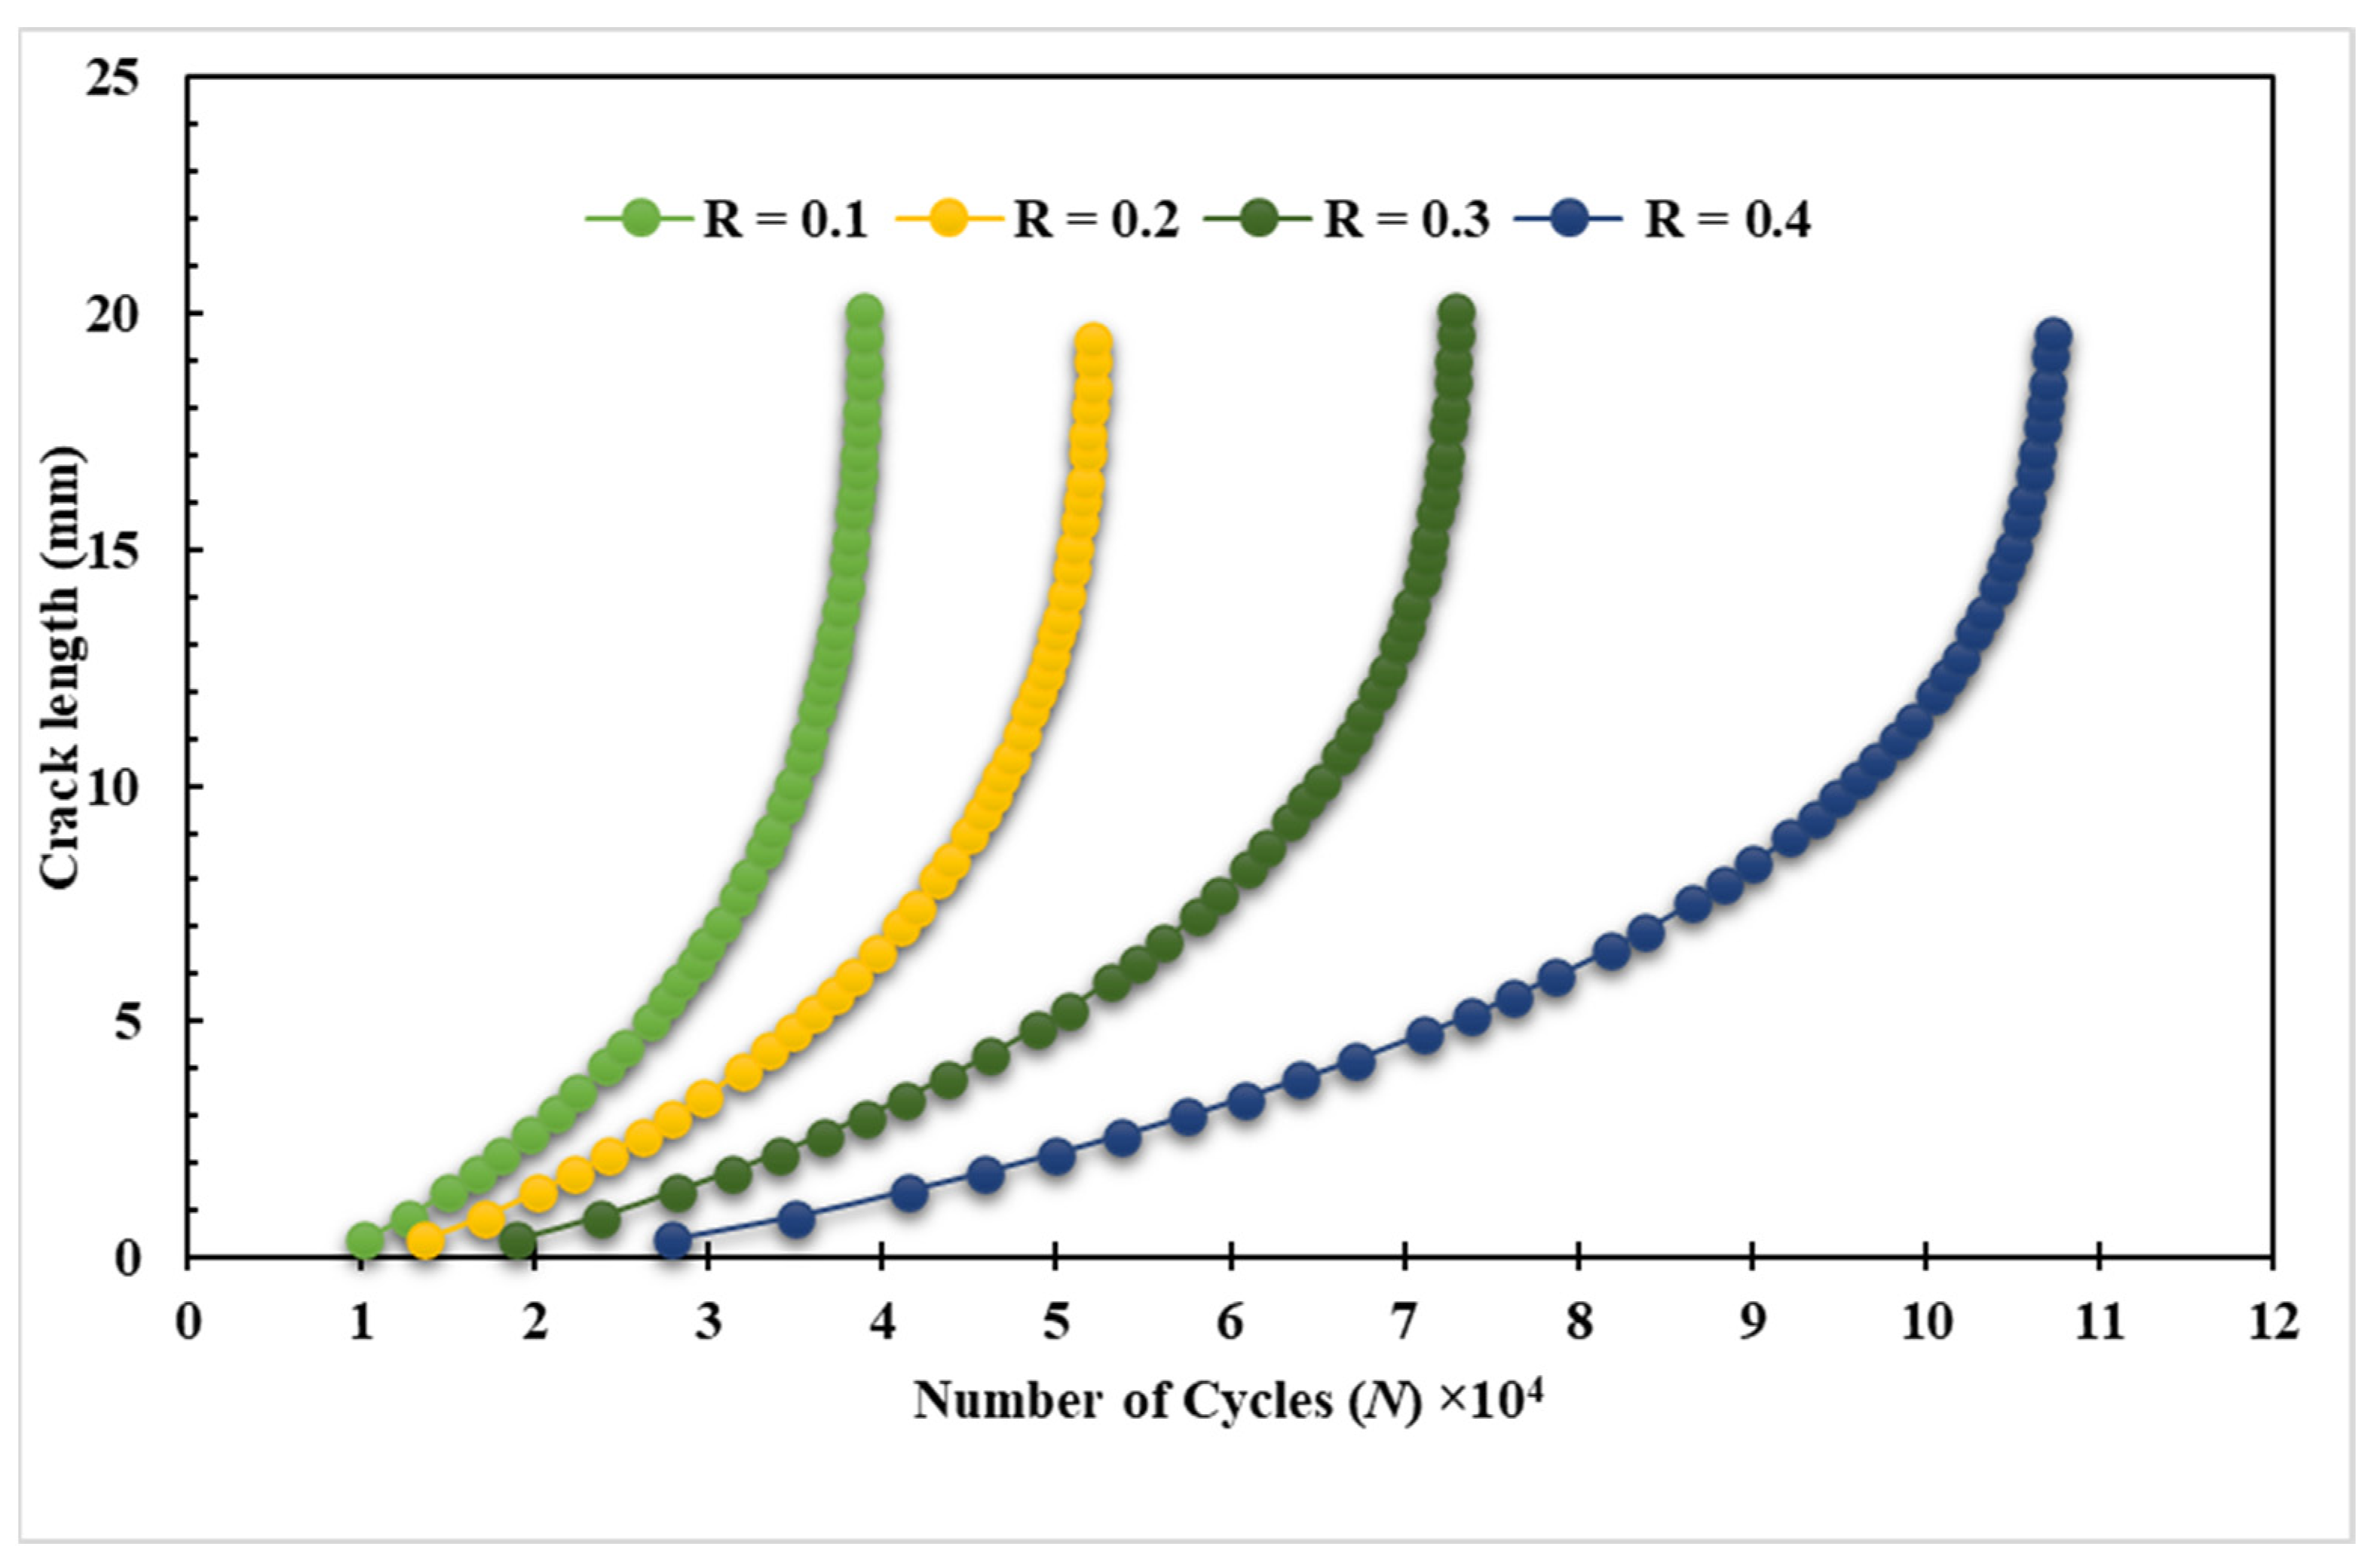
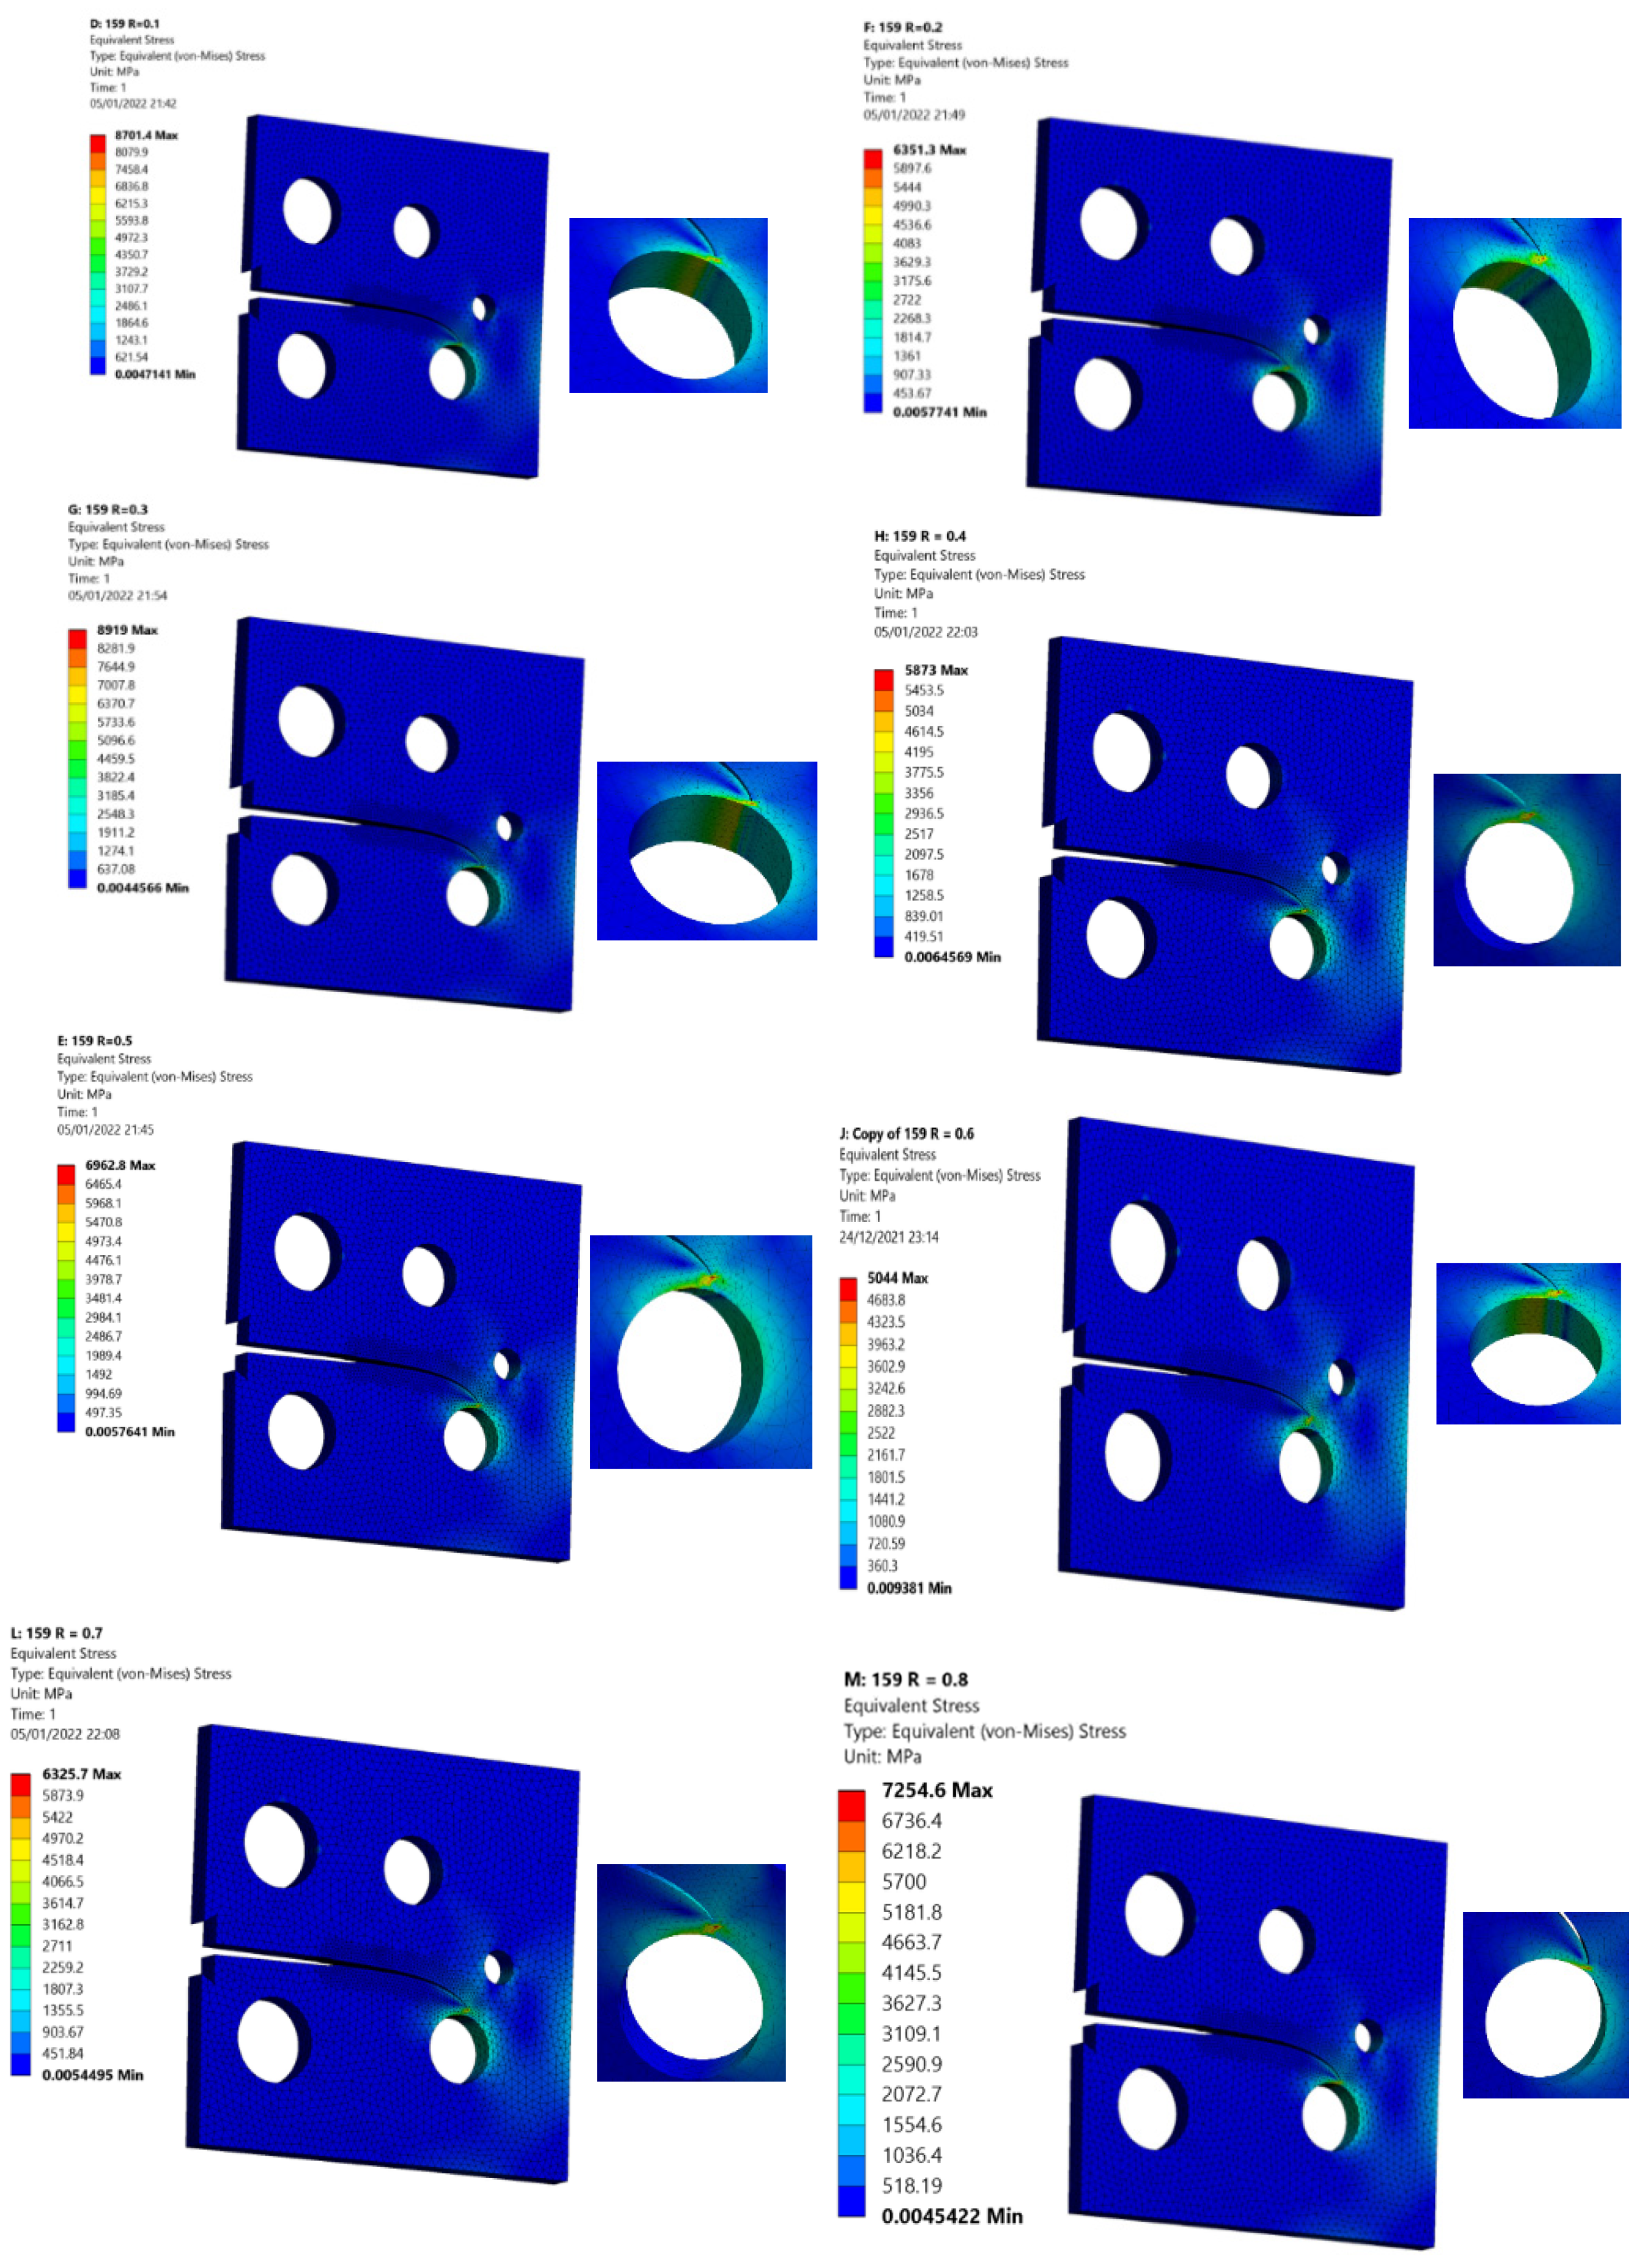
3. Results of Numerical Simulations
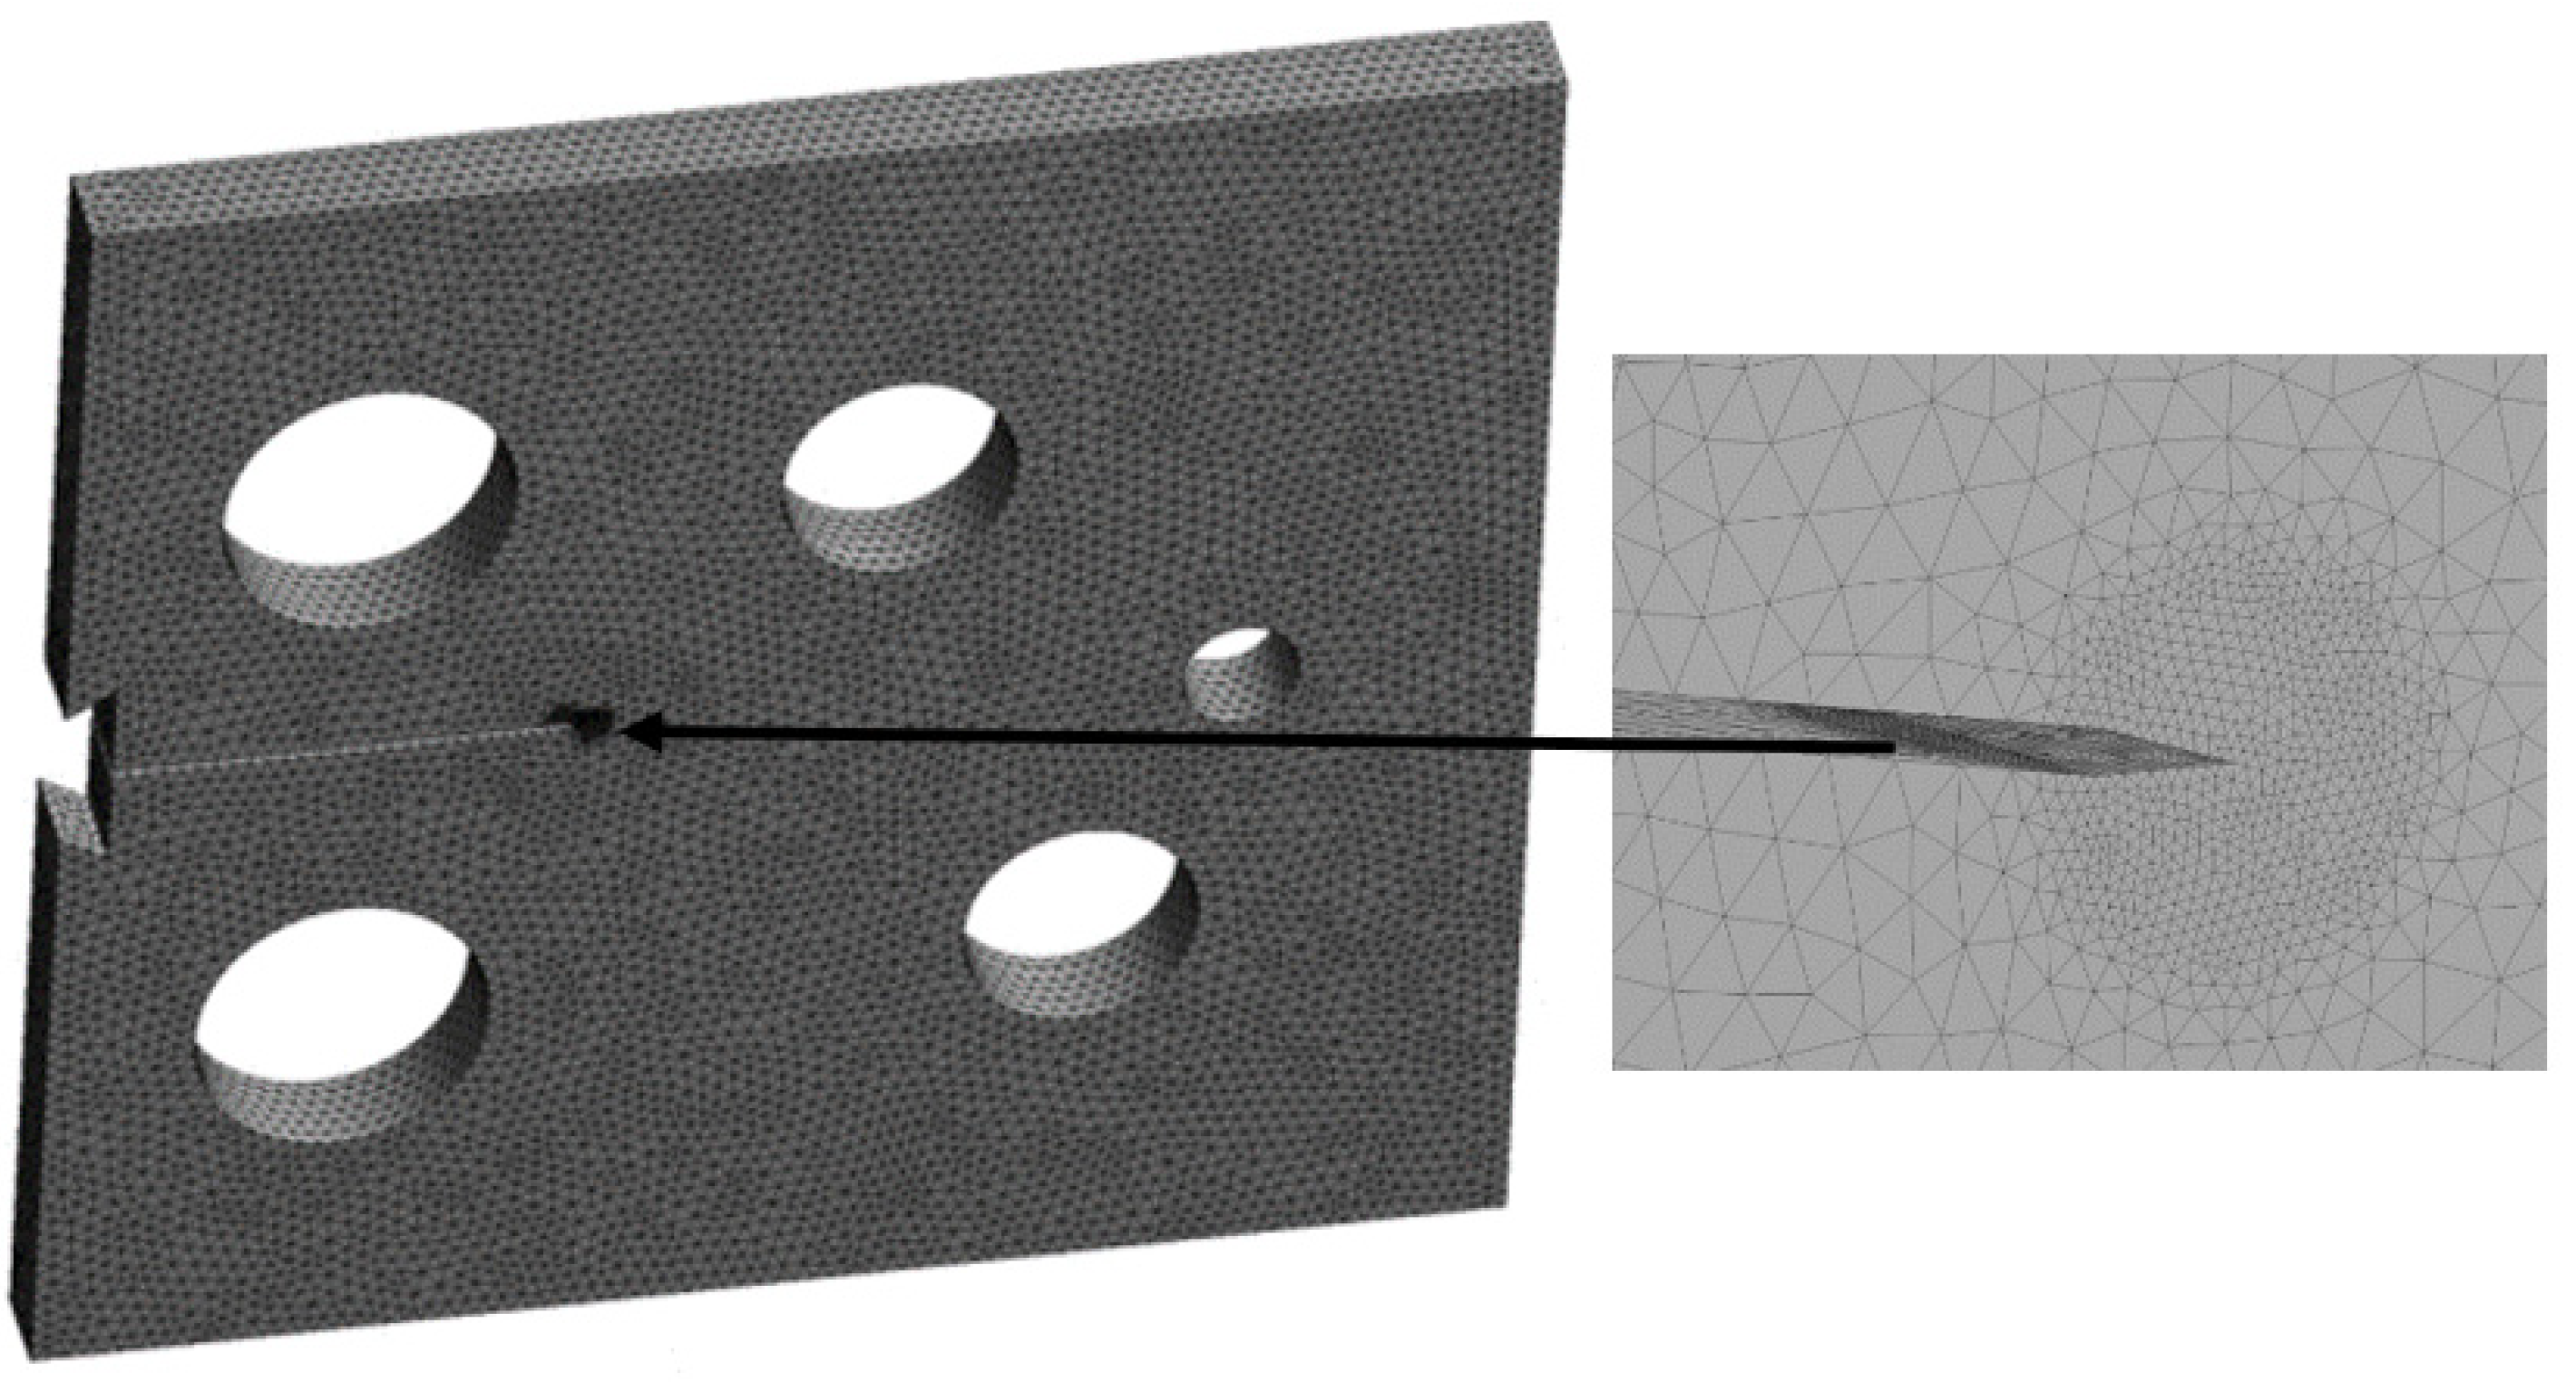
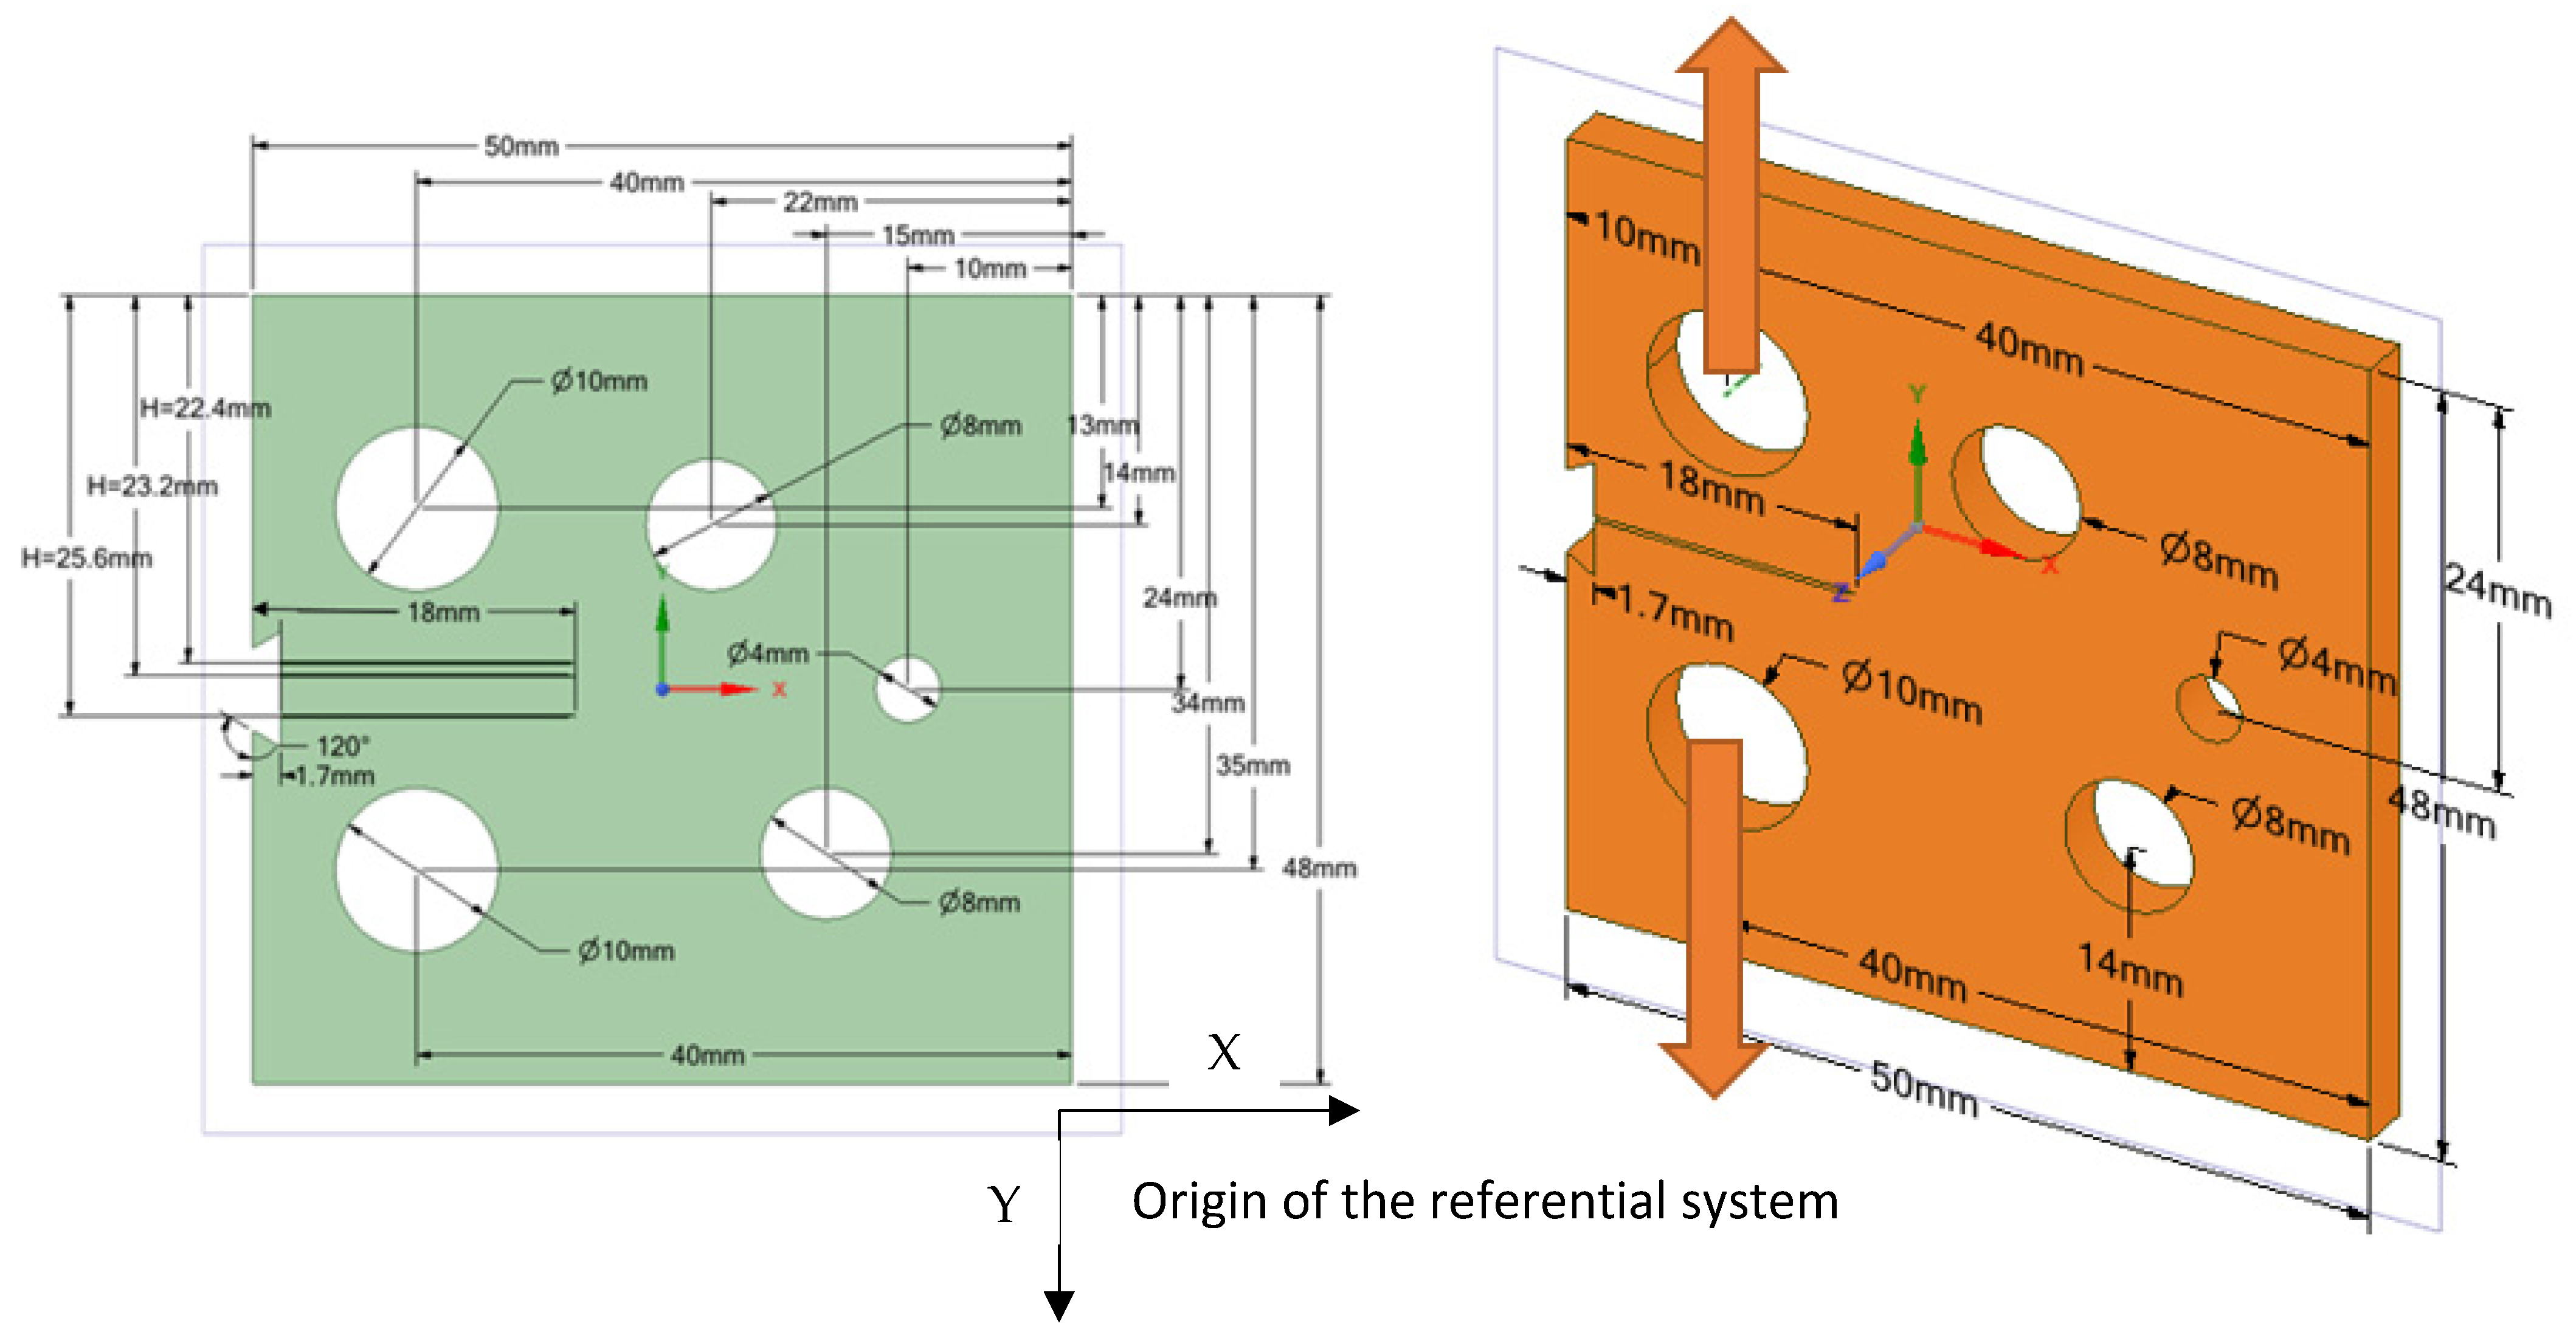
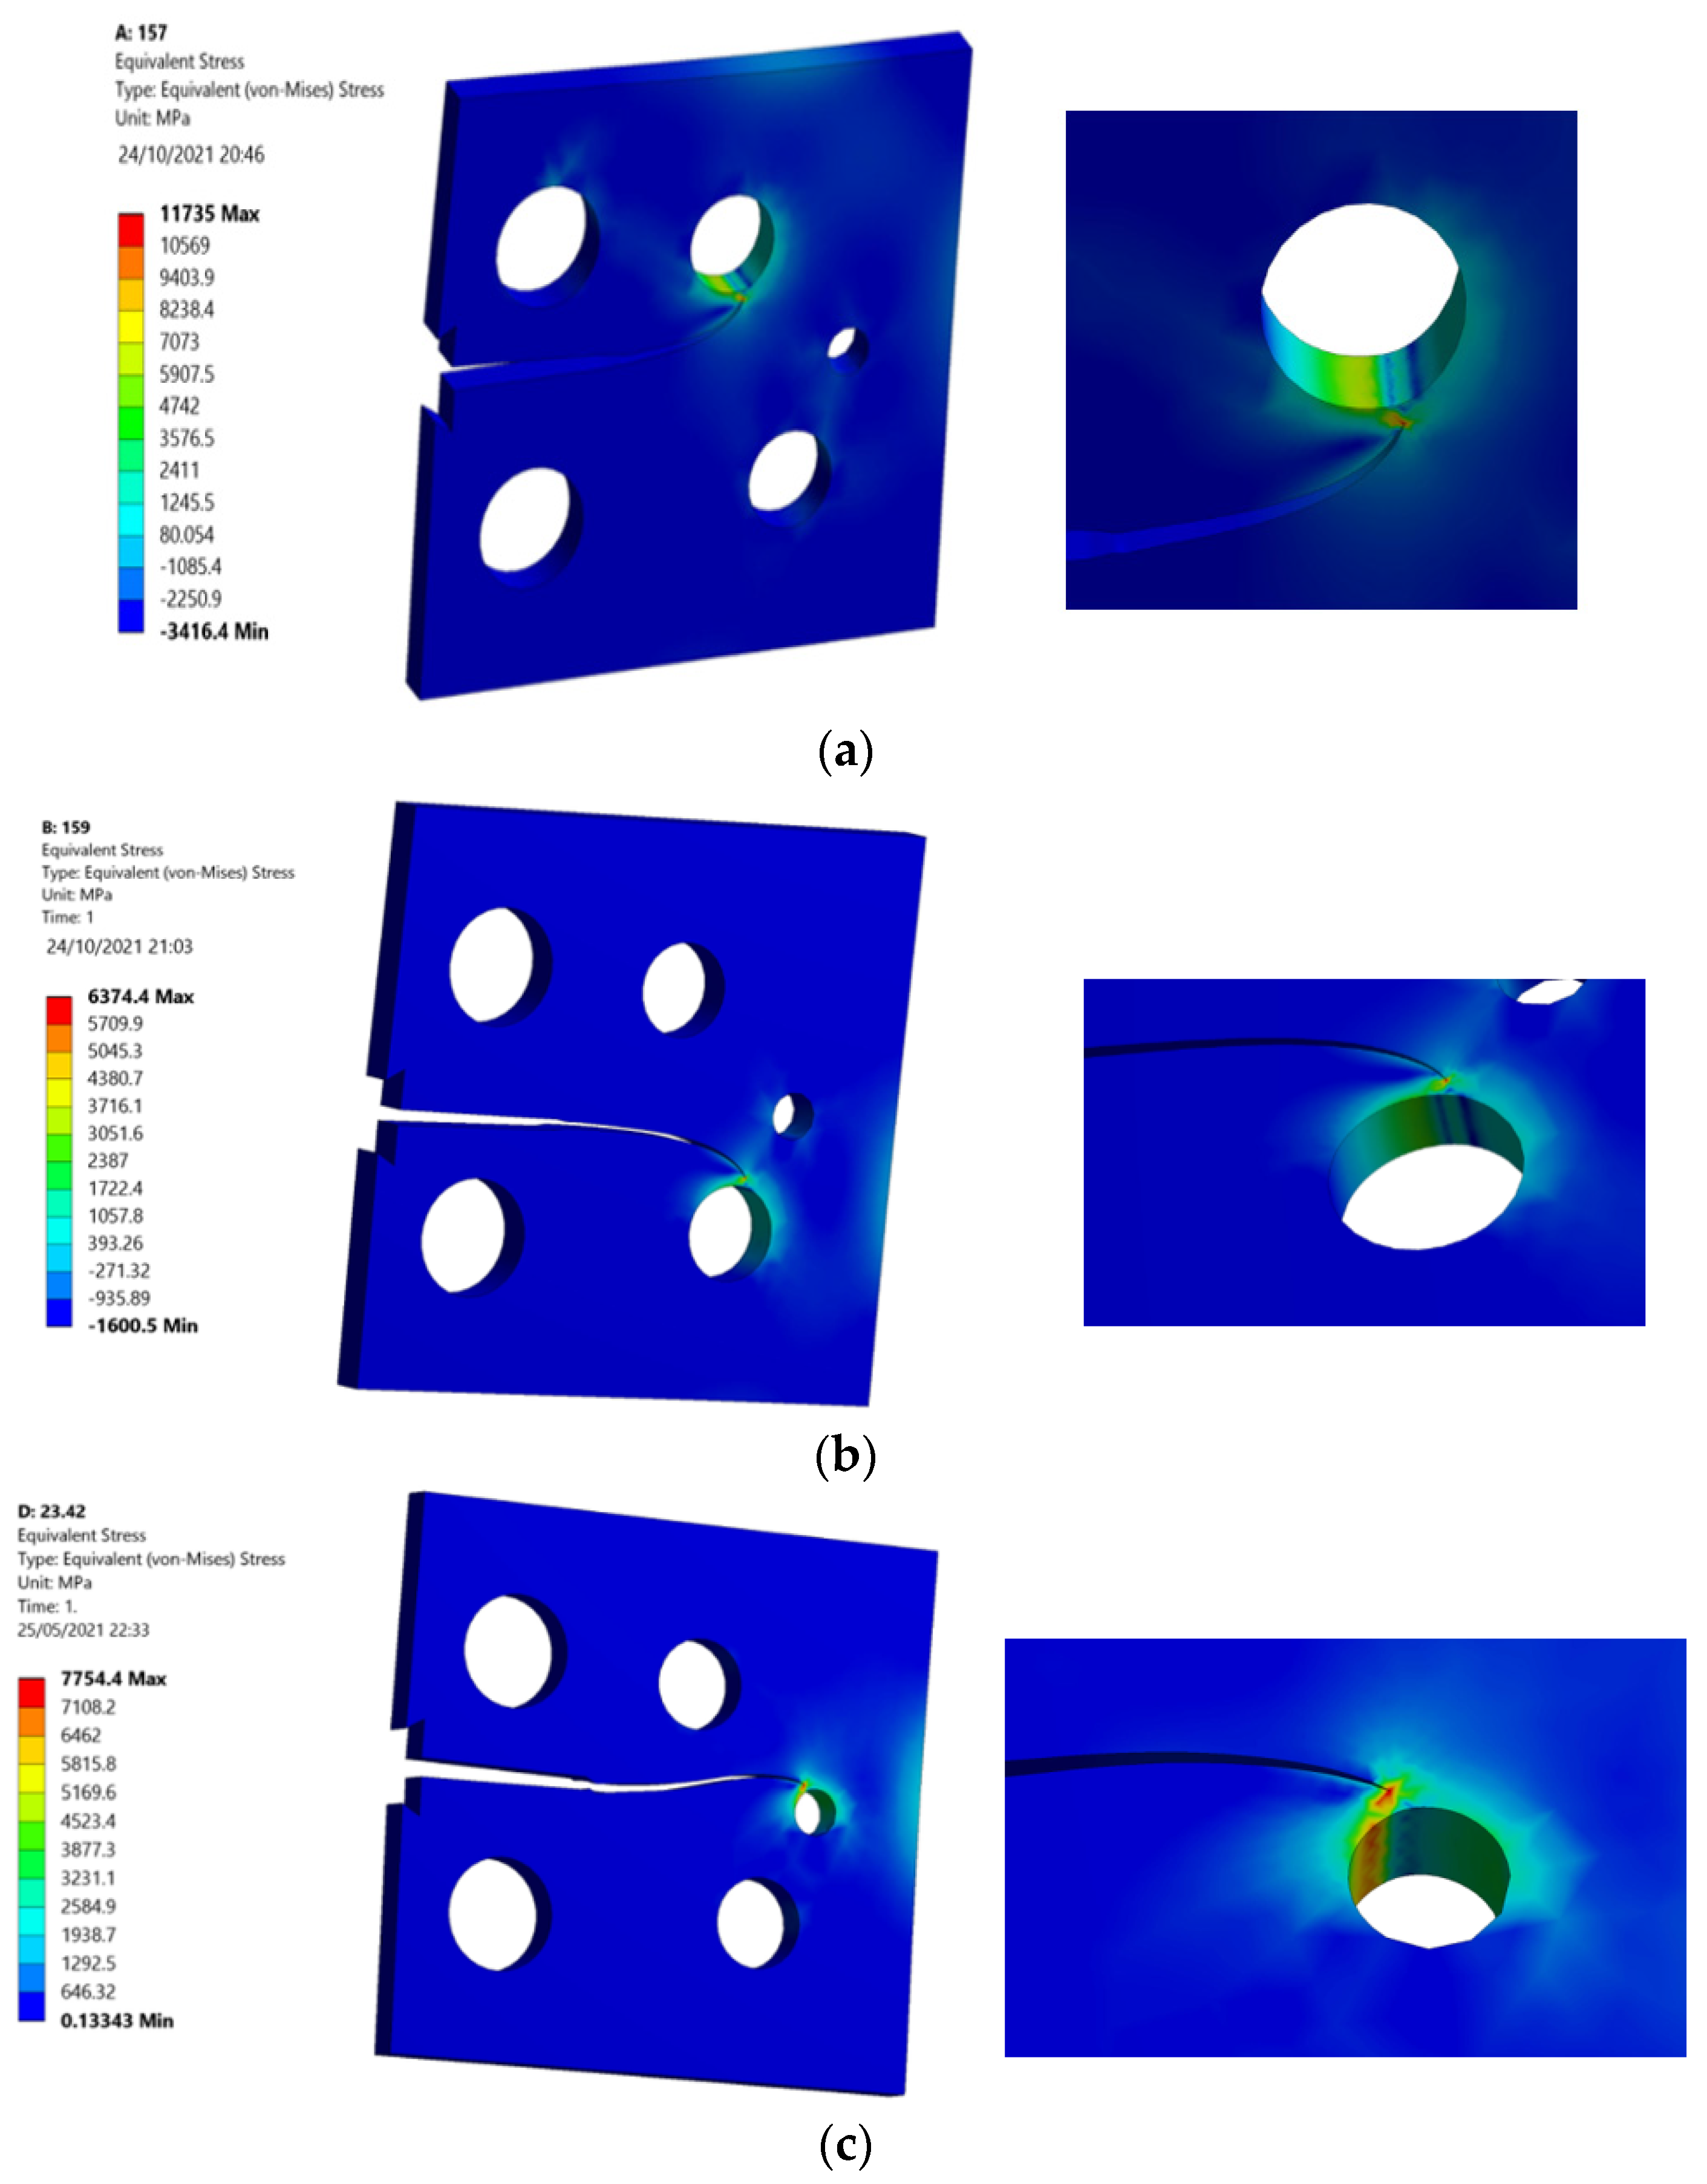
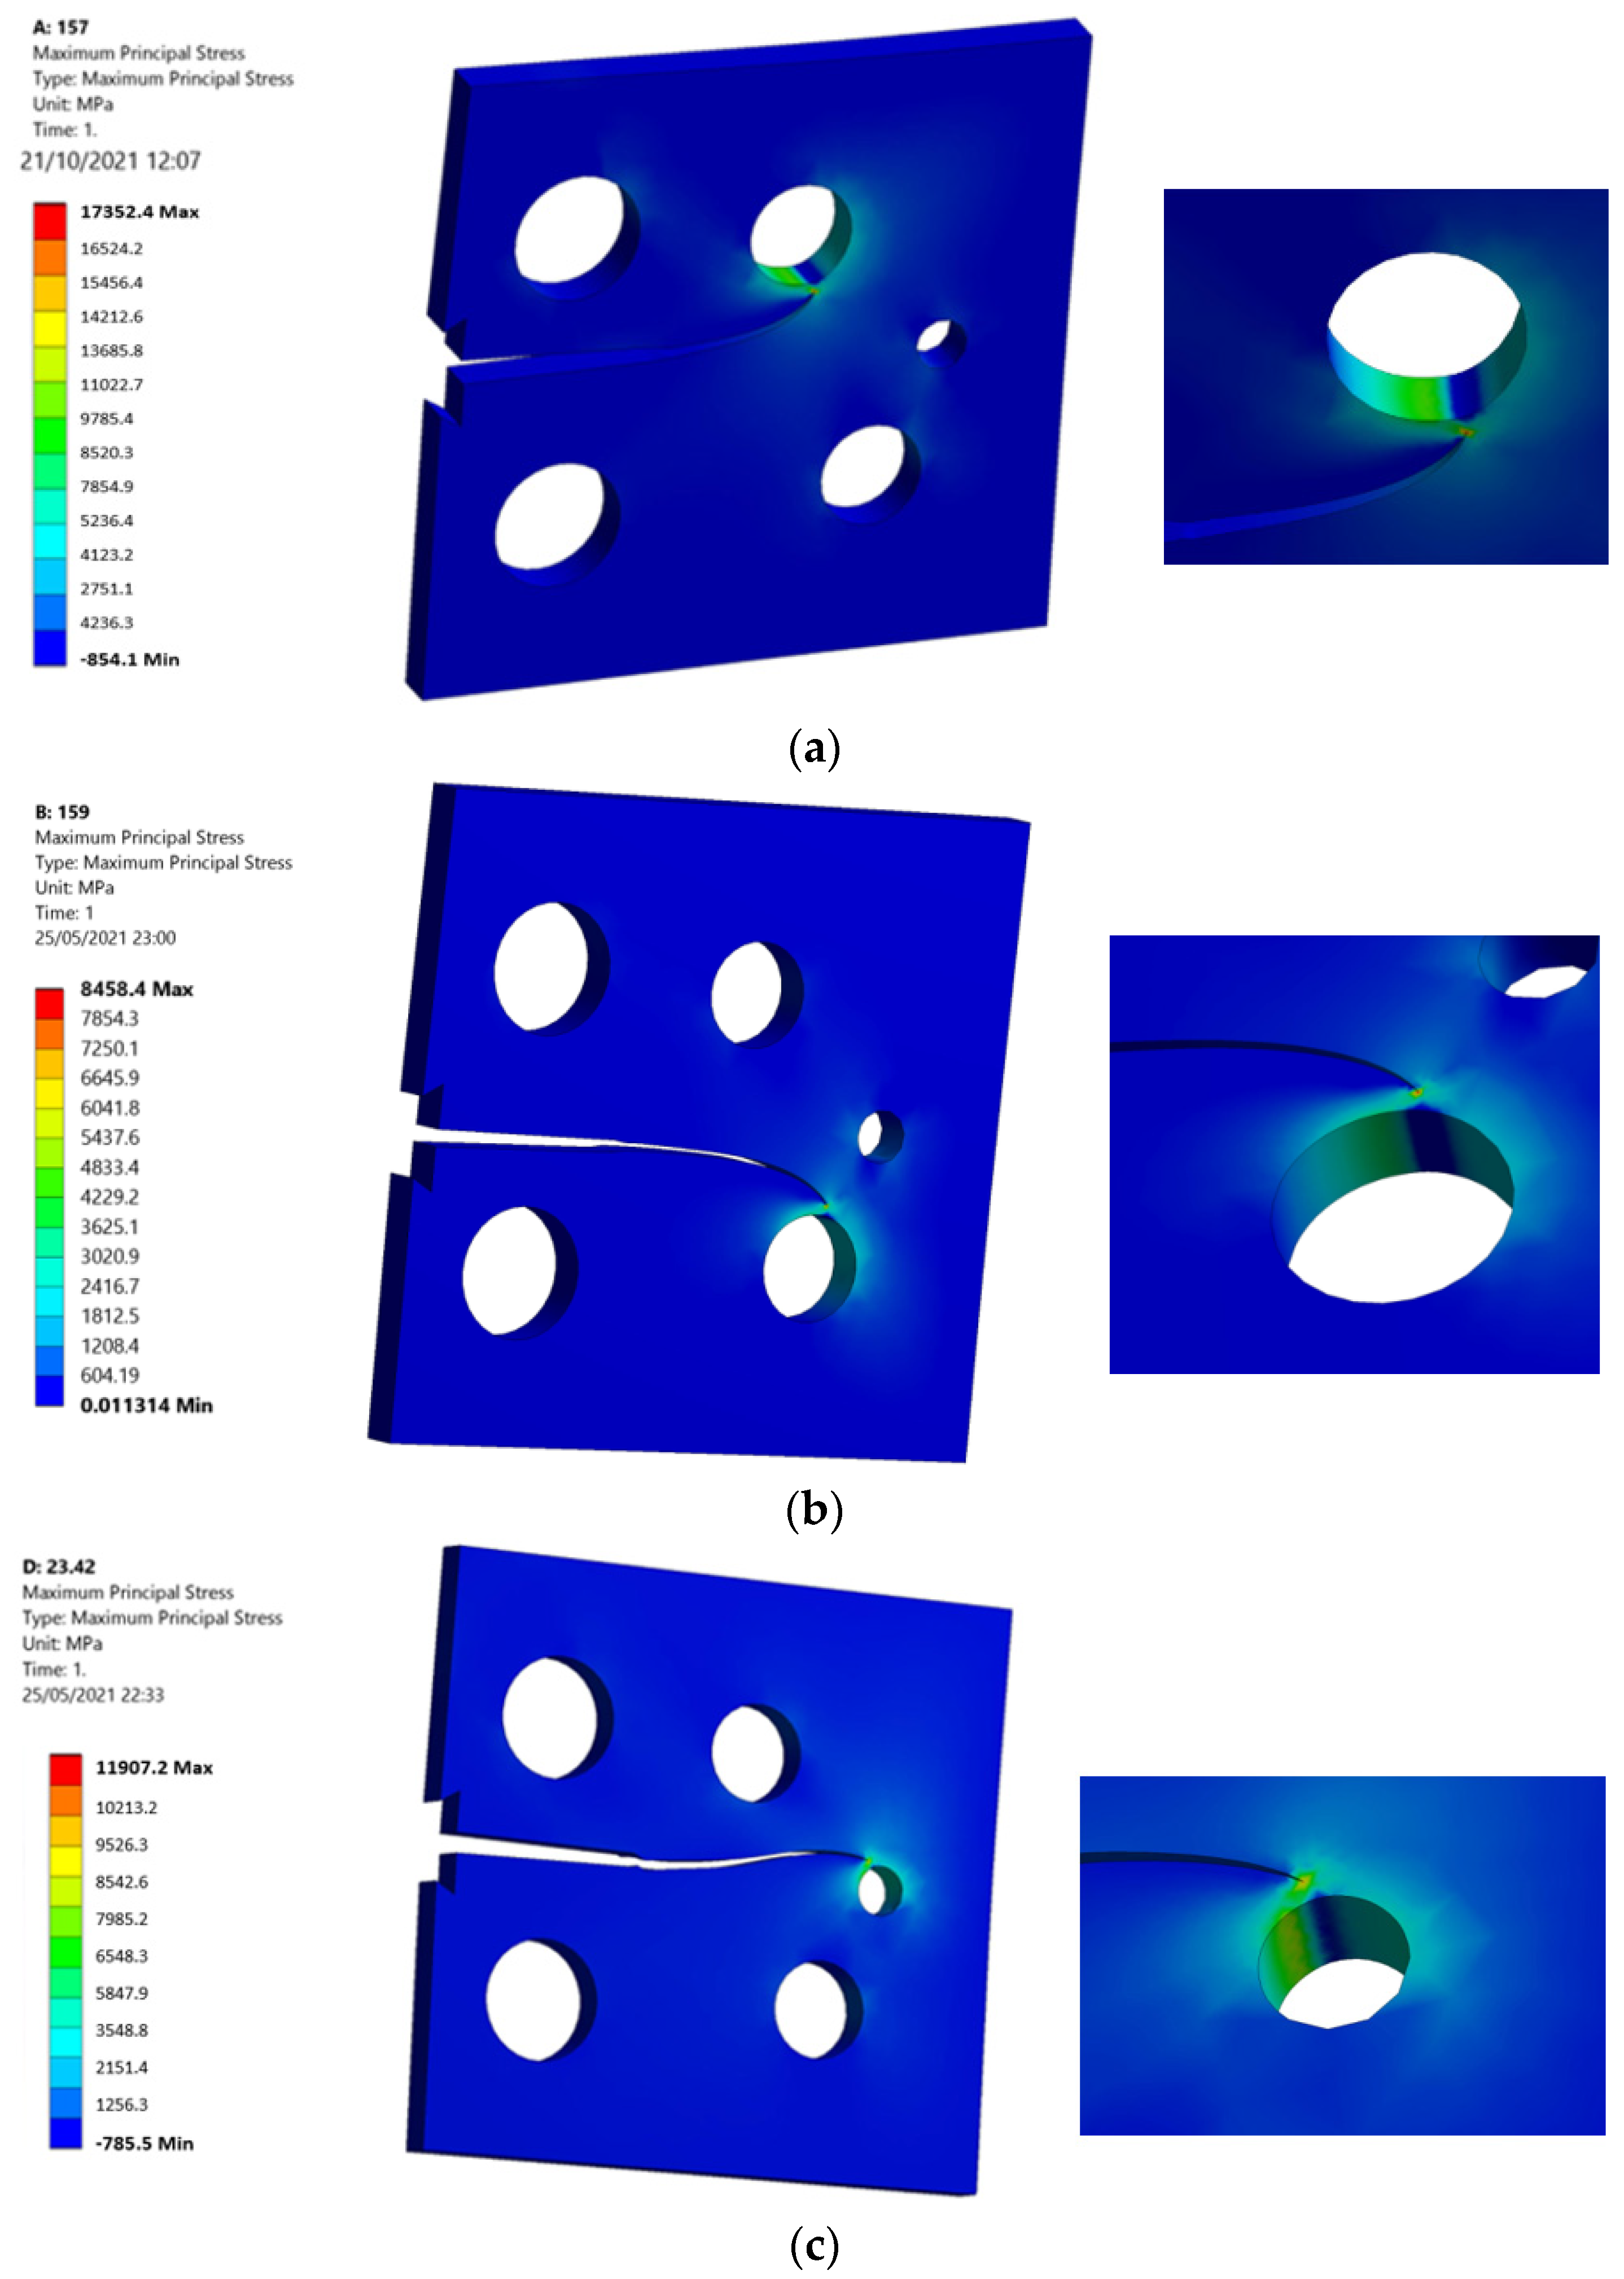
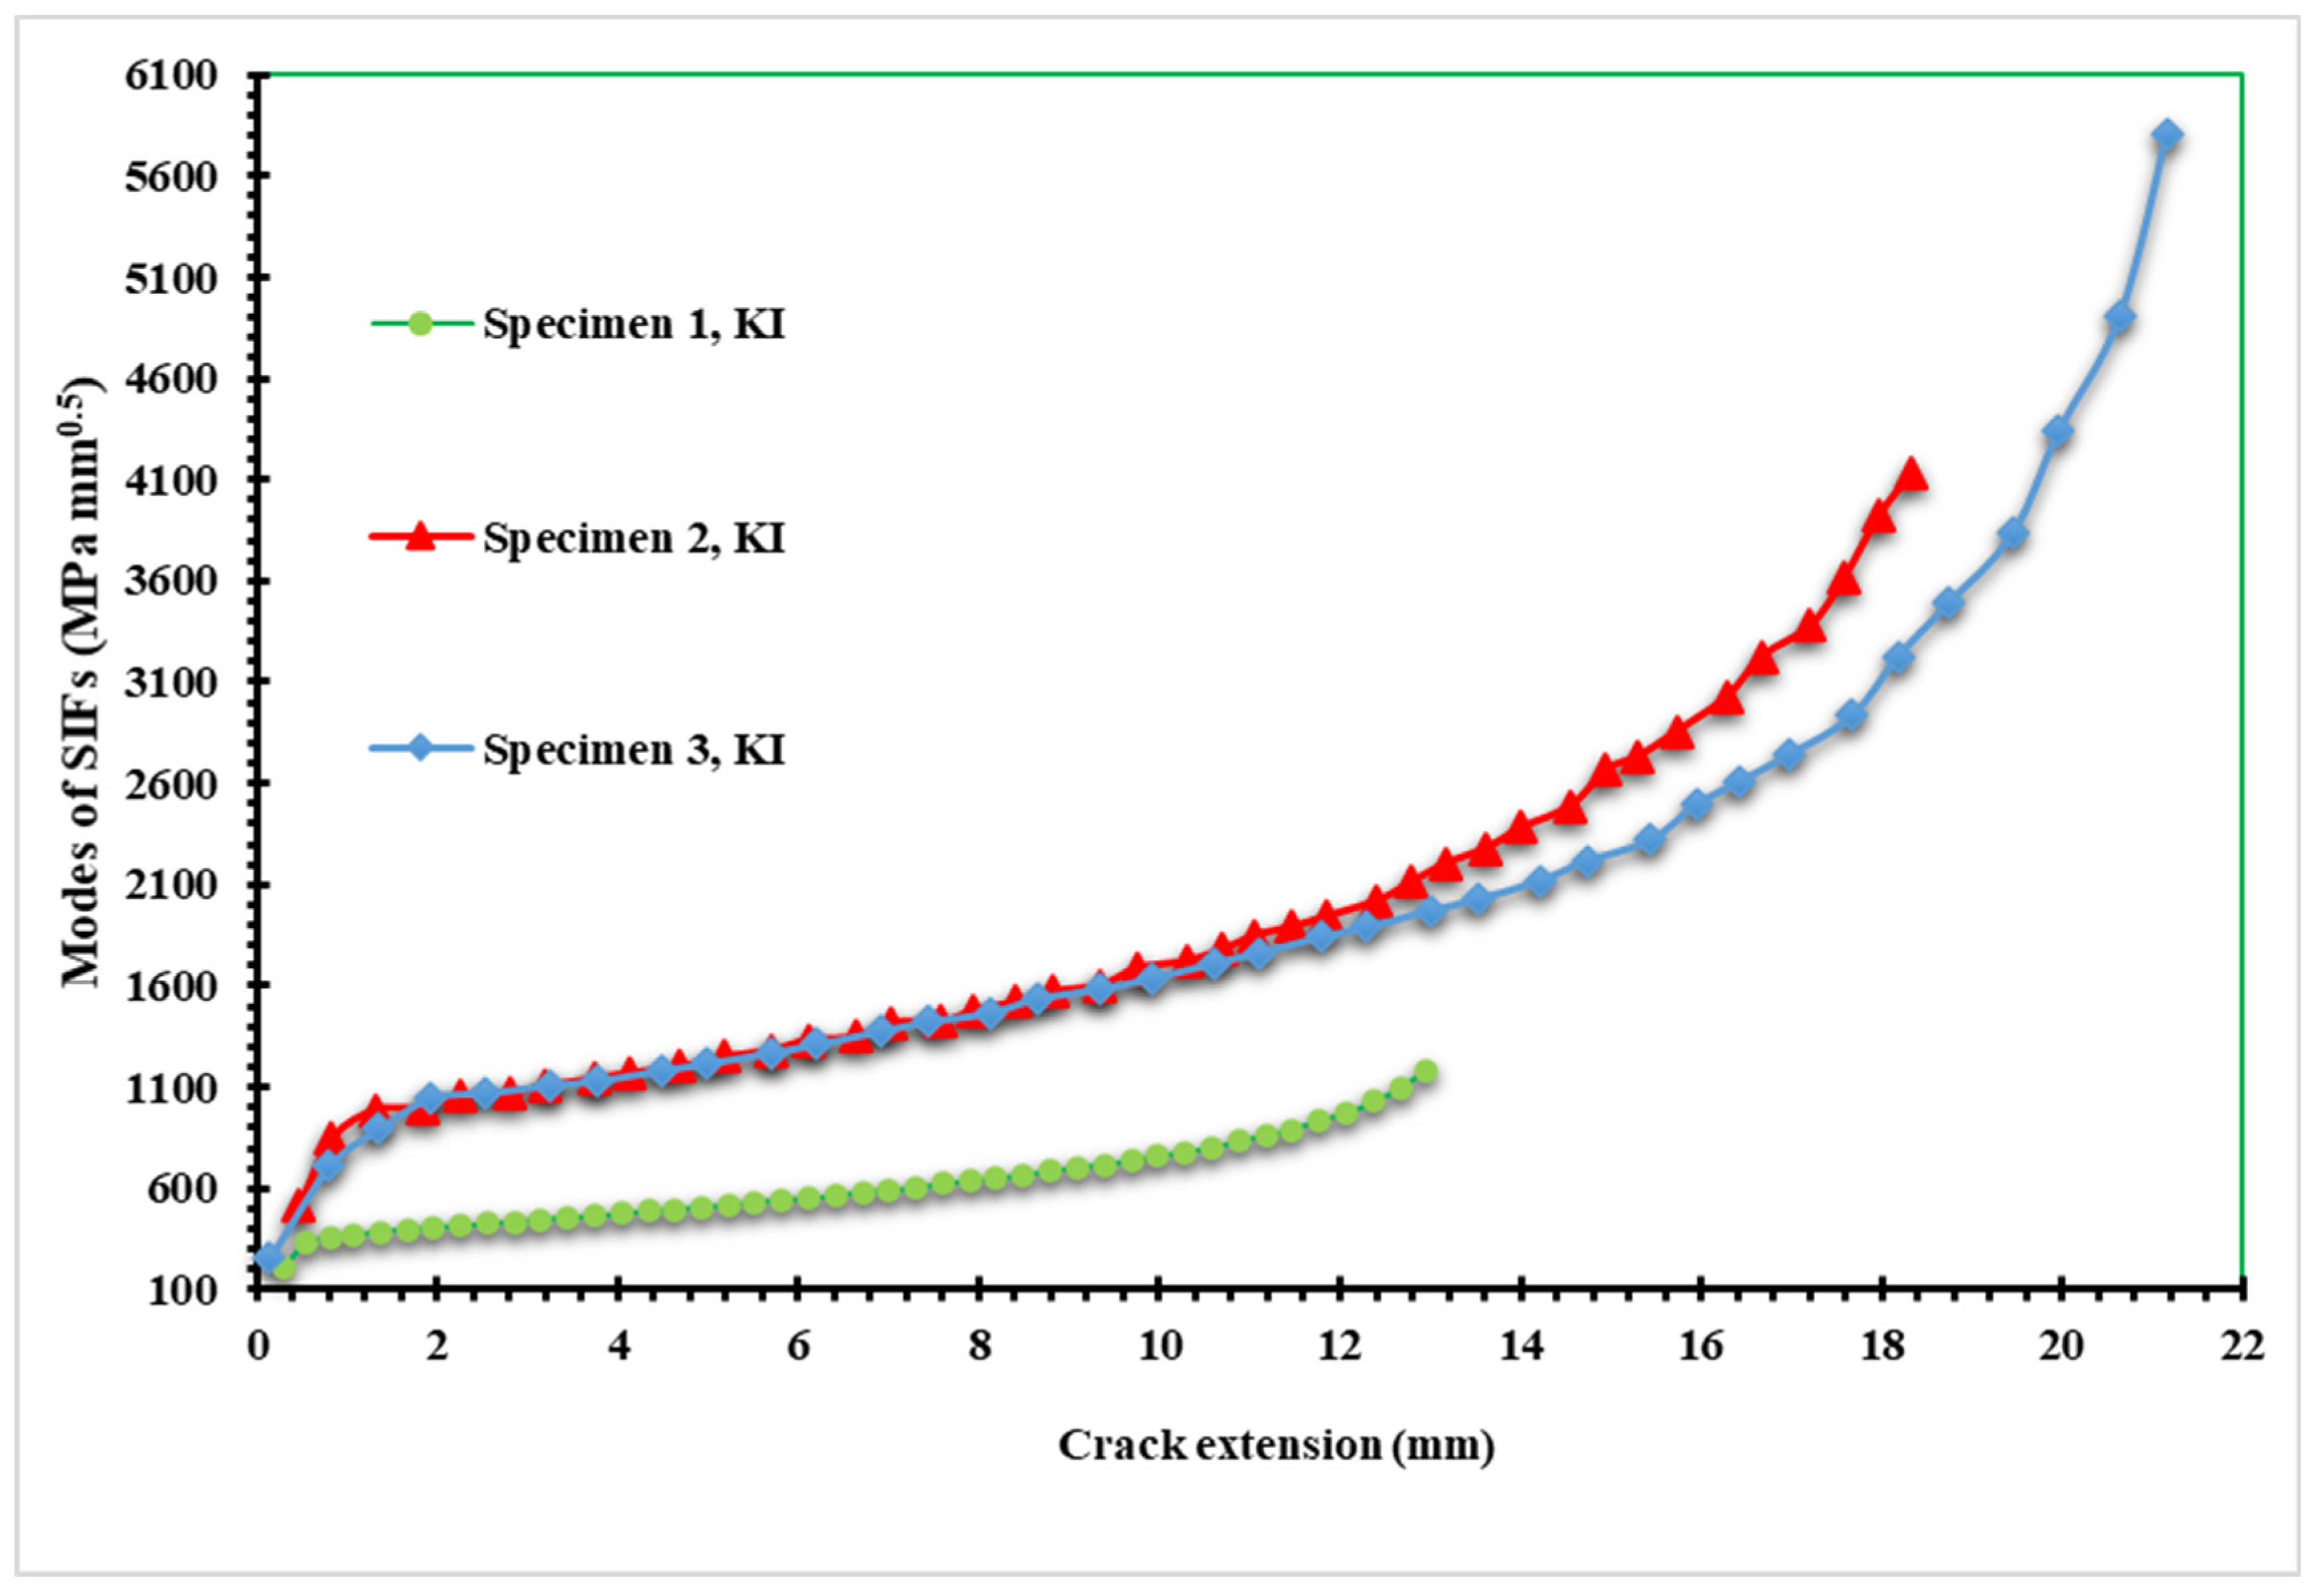
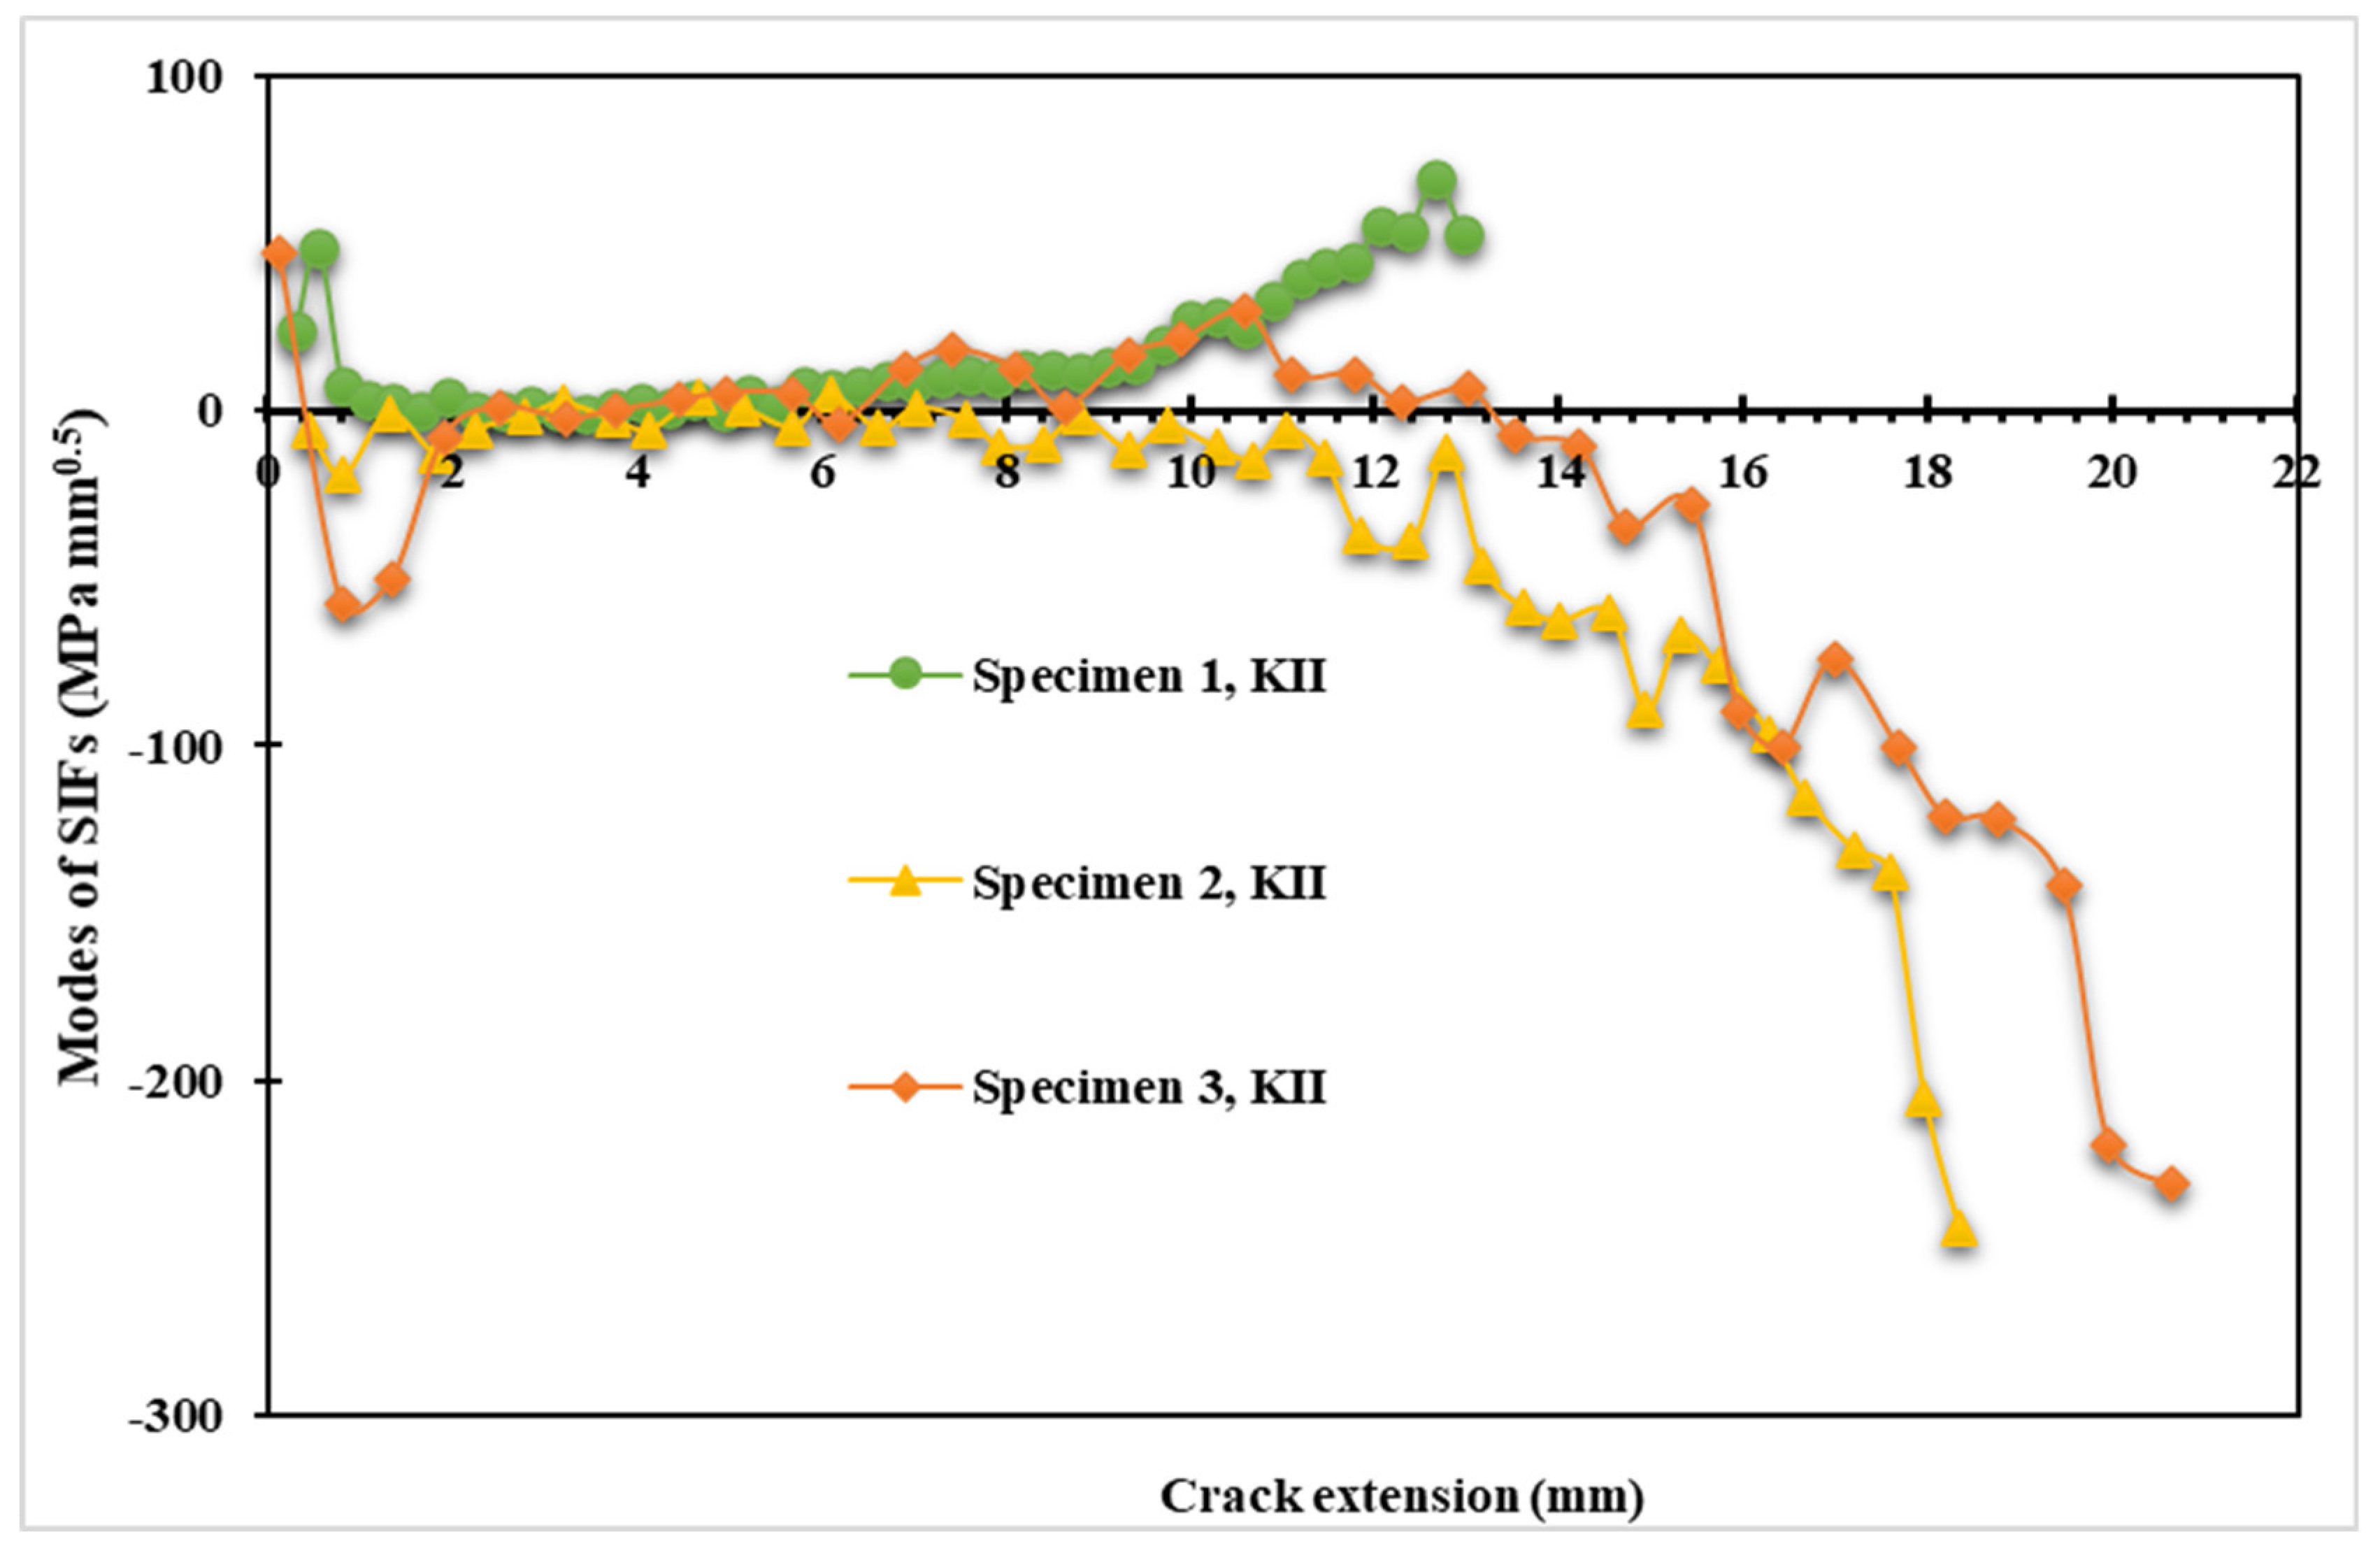
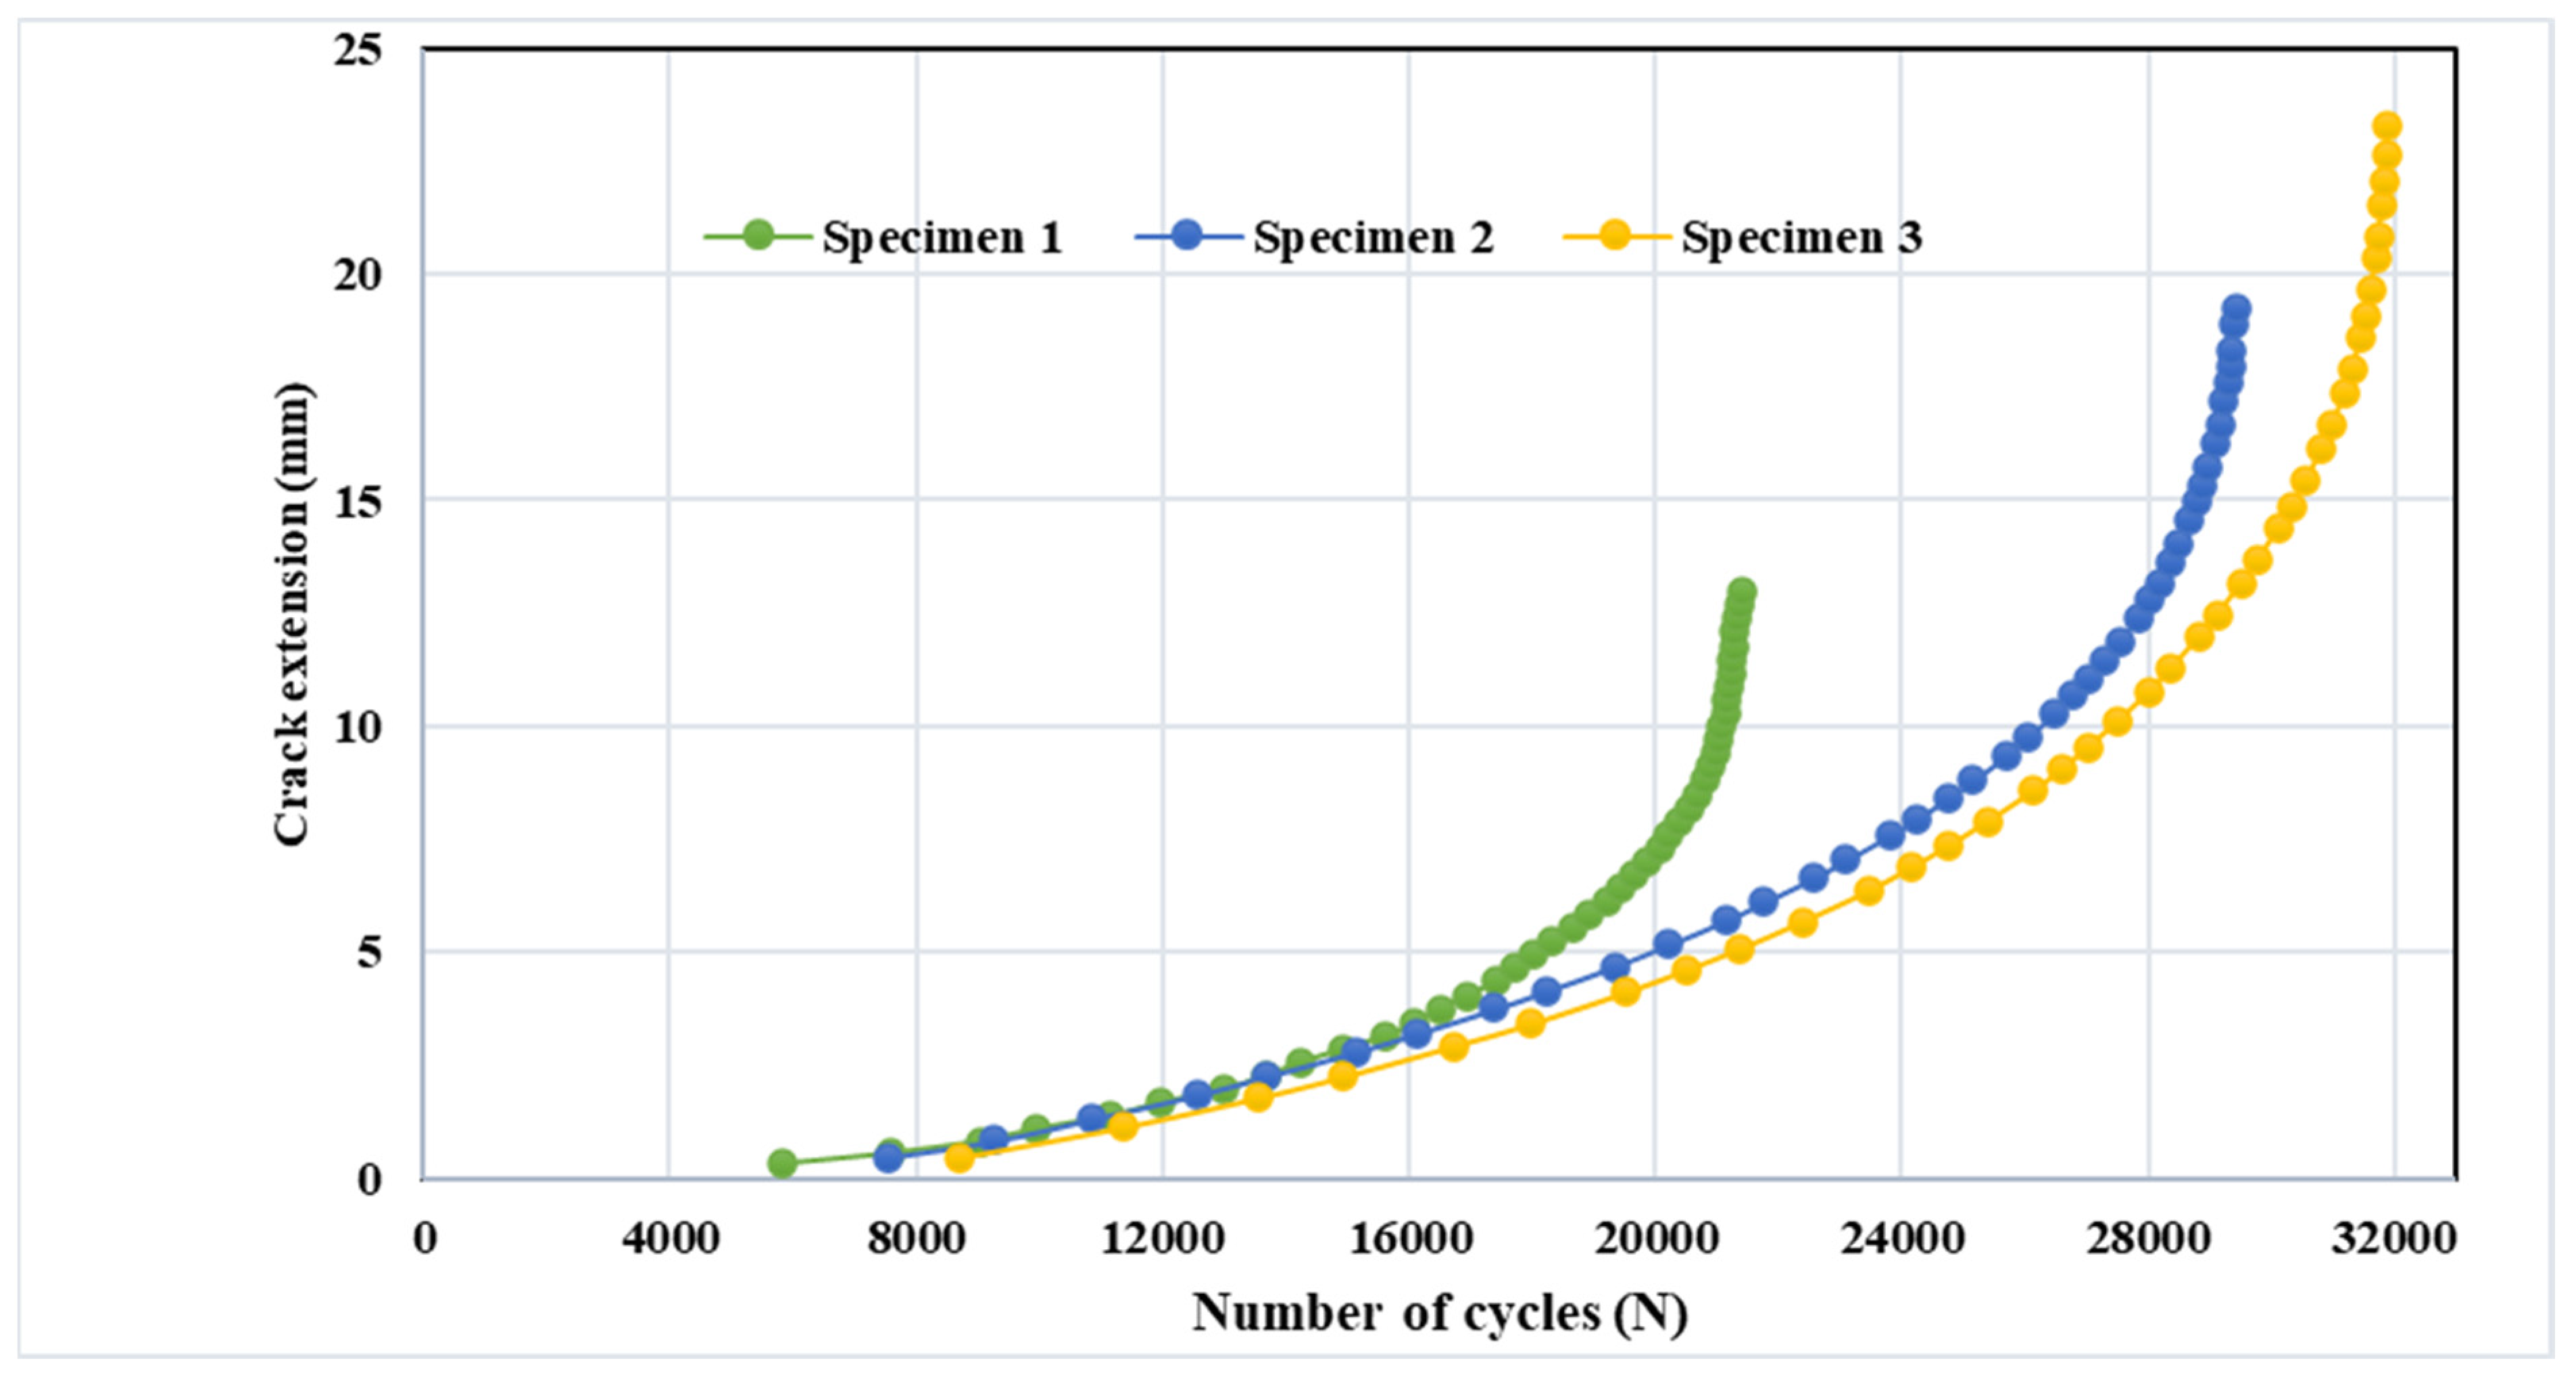
Modified Compact Tension with Different Pre-Crack Location
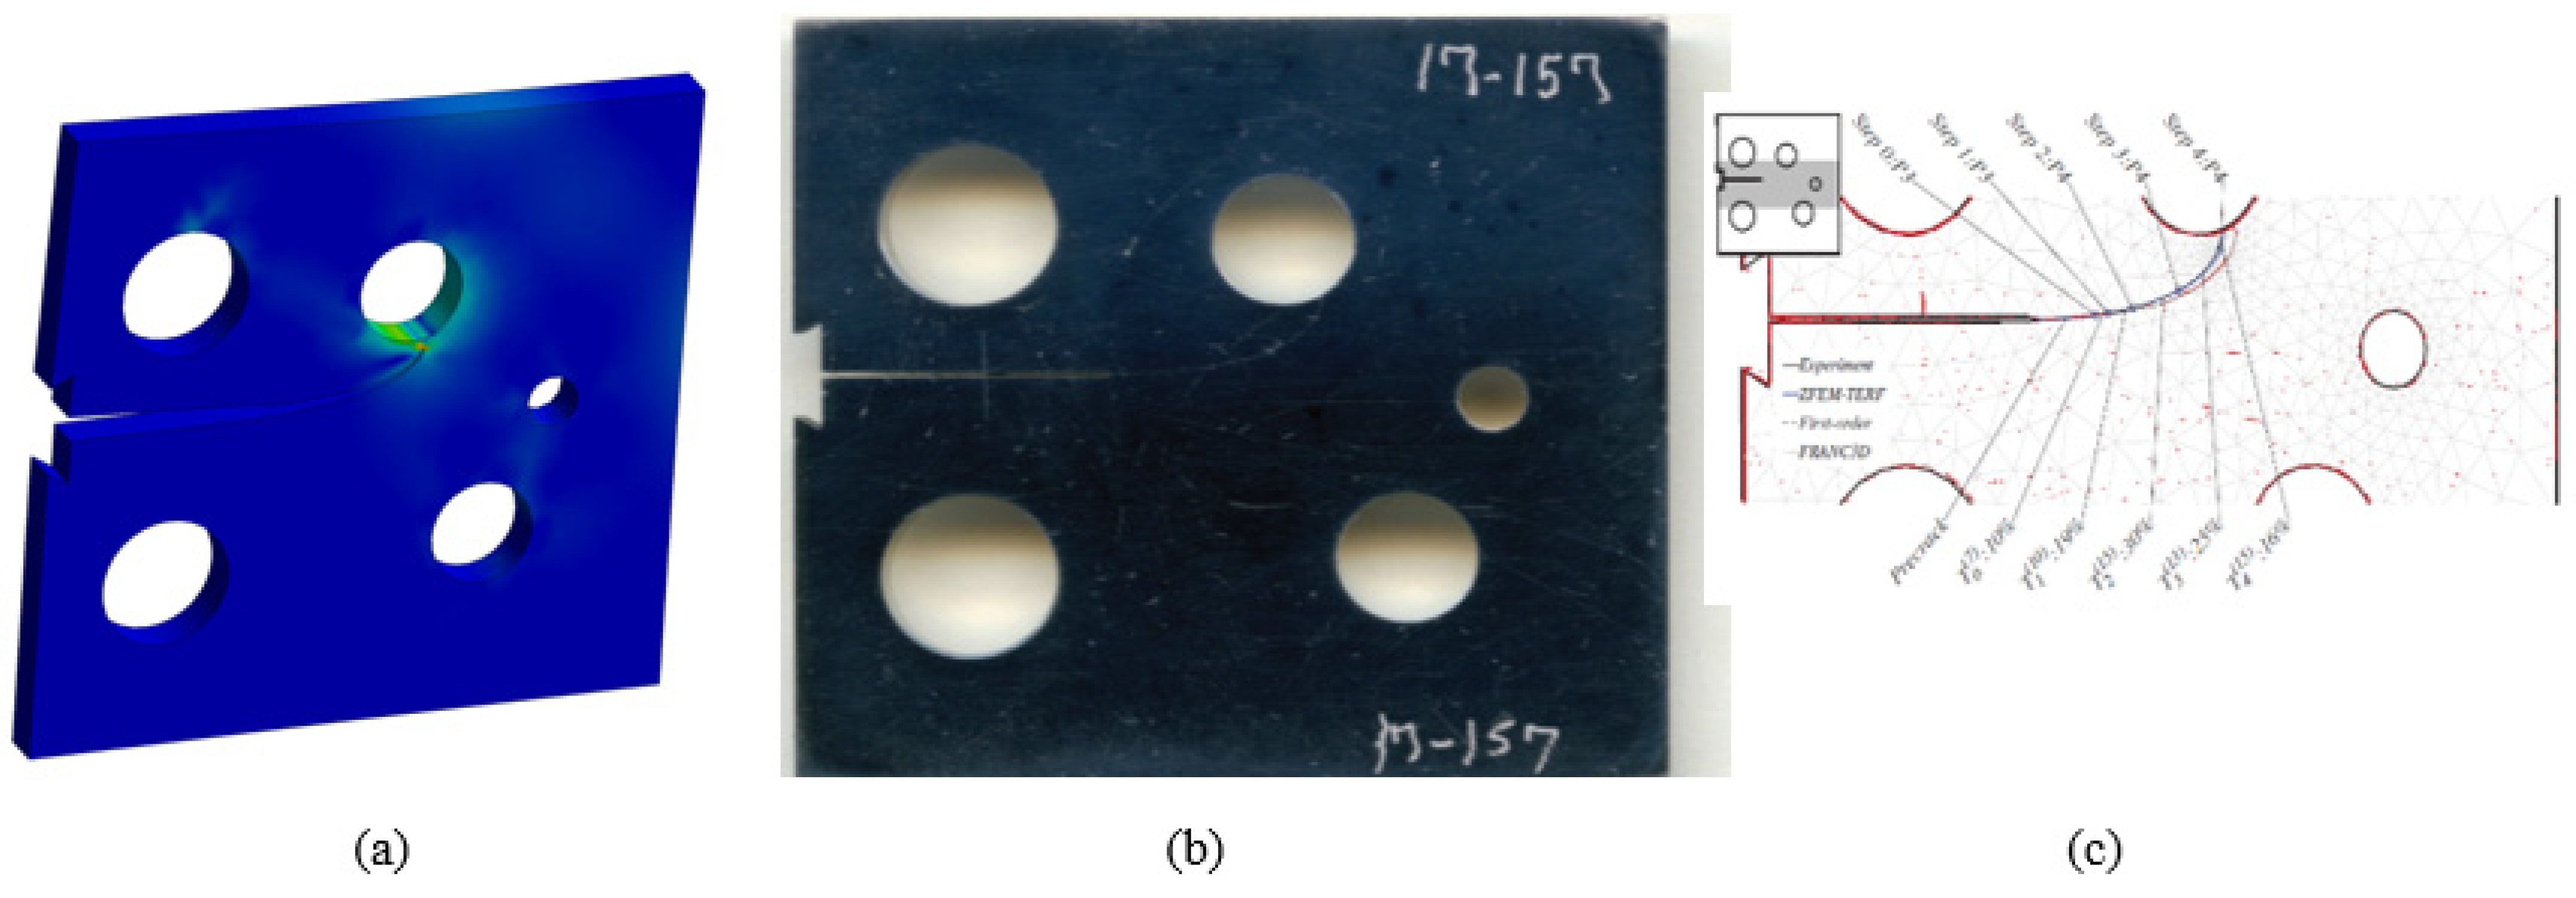
- Specimen 1
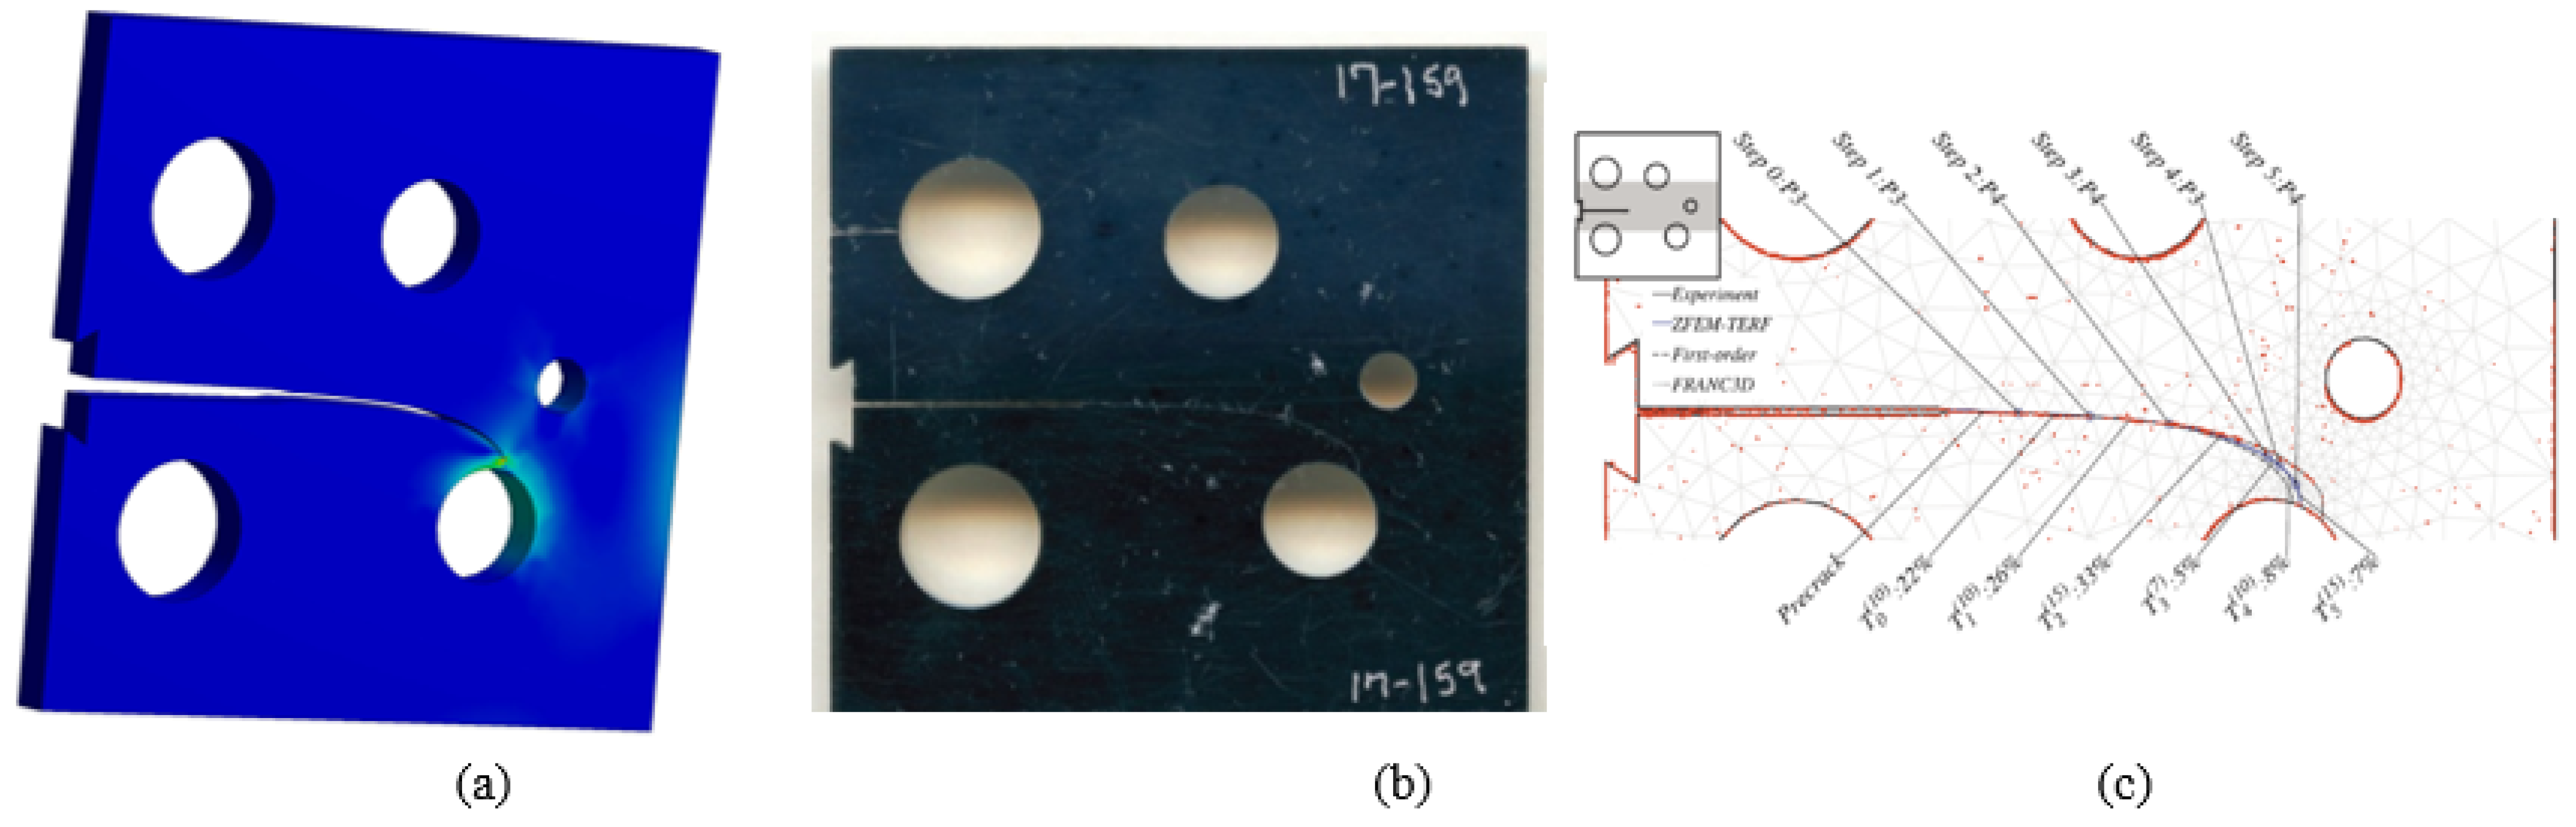
- Specimen 2
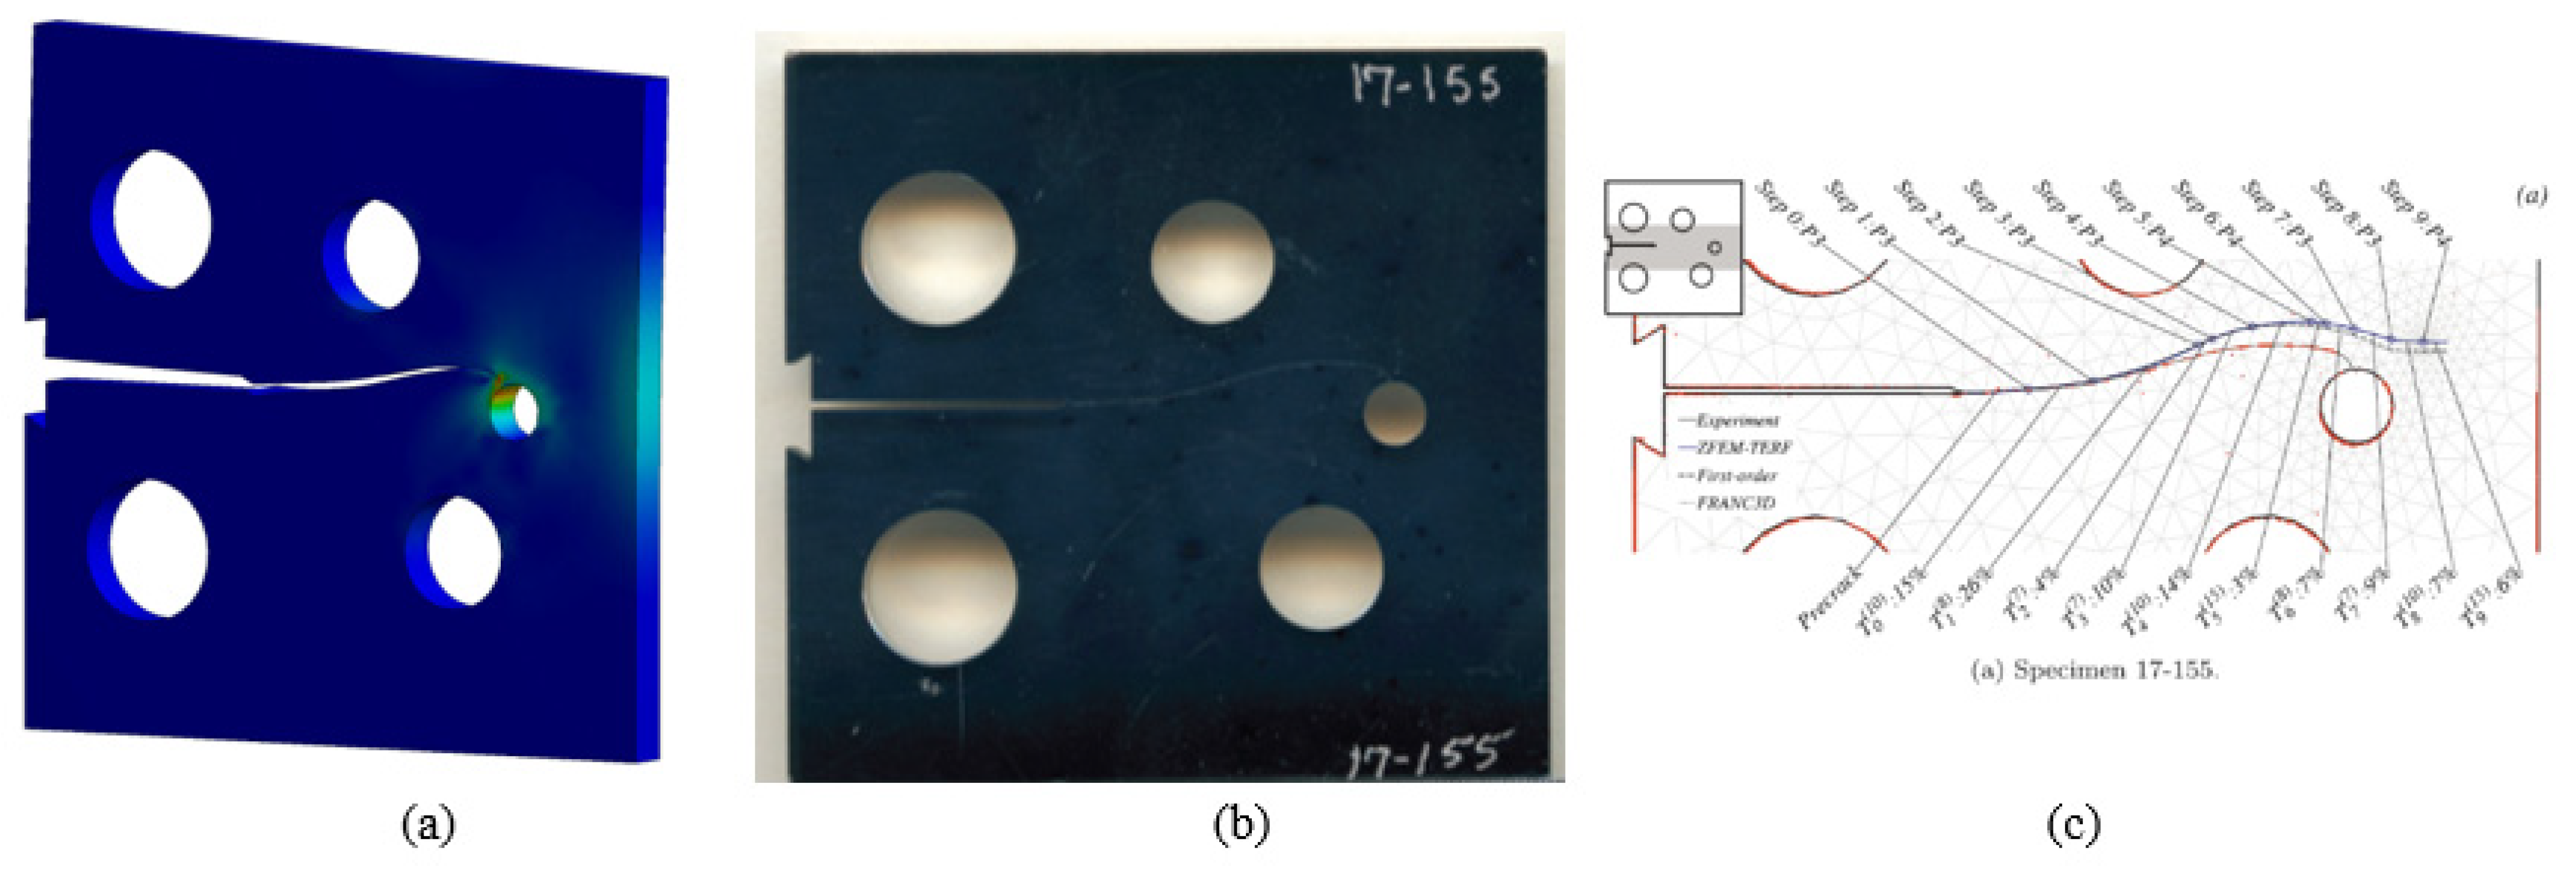
- Specimen 3
4. Conclusions
Funding
Institutional Review Board Statement
Informed Consent Statement
Data Availability Statement
Conflicts of Interest
References
- Gerber, W. Bestimmung der zulossigenin eisen construcionen. Z. Bayer Arch. Ing. Ver. 1874, 6, 101–110. [Google Scholar]
- Smith, K.N. A stress-strain function for the fatigue of metals. J. Mater. 1970, 5, 767–778. [Google Scholar]
- Socie, D.; Morrow, J. Review of contemporary approaches to fatigue damage analysis. In Risk and Failure Analysis for Improved Performance and Reliability; Springer: Berlin/Heidelberg, Germany, 1980; pp. 141–194. [Google Scholar]
- Manson, S.; Halford, G.R. Practical implementation of the double linear damage rule and damage curve approach for treating cumulative fatigue damage. Int. J. Fract. 1981, 17, 169–192. [Google Scholar] [CrossRef] [Green Version]
- Ince, A.; Glinka, G. A modification of Morrow and Smith–Watson–Topper mean stress correction models. Fatigue Fract. Eng. Mater. Struct. 2011, 34, 854–867. [Google Scholar] [CrossRef]
- Ince, A.; Glinka, G. A generalized fatigue damage parameter for multiaxial fatigue life prediction under proportional and non-proportional loadings. Int. J. Fatigue 2014, 62, 34–41. [Google Scholar] [CrossRef]
- Weertman, J. Theory of fatigue crack growth based on a BCS crack theory with work hardening. Int. J. Fract. 1973, 9, 125–131. [Google Scholar] [CrossRef]
- Mansor, N.; Abdullah, S.; Ariffin, A. Effect of loading sequences on fatigue crack growth and crack closure in API X65 steel. Mar. Struct. 2019, 65, 181–196. [Google Scholar] [CrossRef]
- Stewart, A.T. The influence of environment and stress ratio on fatigue crack growth at near threshold stress intensities in low-alloy steels. Eng. Fract. Mech. 1980, 13, 463–478. [Google Scholar] [CrossRef]
- Hudson, C.M. Effect of Stress Ratio on Fatigue-Crack Growth in 7075-T6 and 2024-T3 Aluminum-Alloy Specimens; National Aeronautics and Space Administration: Washington, DC, USA, 1969. [Google Scholar]
- Noroozi, A.; Glinka, G.; Lambert, S. A study of the stress ratio effects on fatigue crack growth using the unified two-parameter fatigue crack growth driving force. Int. J. Fatigue 2007, 29, 1616–1633. [Google Scholar] [CrossRef]
- Paris, P.C.; Tada, H.; Donald, J.K. Service load fatigue damage—A historical perspective. Int. J. Fatigue 1999, 21, S35–S46. [Google Scholar] [CrossRef]
- Pook, L.P. Linear Elastic Fracture Mechanics for Engineers: Theory and Applications; WIT Press: London, UK, 2000. [Google Scholar]
- Irwin, G.R. Analysis of stresses and strains near the end of a crack transversing a plate. Trans. ASME Ser. E J. Appl. Mech. 1957, 24, 361–364. [Google Scholar] [CrossRef]
- Bang, D.; Ince, A.; Noban, M. Modeling approach for a unified crack growth model in short and long fatigue crack regimes. Int. J. Fatigue 2019, 128, 105182. [Google Scholar] [CrossRef]
- Giannella, V.; Dhondt, G.; Kontermann, C.; Citarella, R. Combined static-cyclic multi-axial crack propagation in cruciform specimens. Int. J. Fatigue 2019, 123, 296–307. [Google Scholar] [CrossRef]
- Giannella, V.; Fellinger, J.; Perrella, M.; Citarella, R. Fatigue life assessment in lateral support element of a magnet for nuclear fusion experiment “Wendelstein 7-X”. Eng. Fract. Mech. 2017, 178, 243–257. [Google Scholar] [CrossRef] [Green Version]
- Anaei, M.M.; Khosravifard, A.; Bui, T. Analysis of fracture mechanics and fatigue crack growth in moderately thick plates using an efficient meshfree approach. Theor. Appl. Fract. Mech. 2021, 113, 102943. [Google Scholar] [CrossRef]
- Nejad, R.M.; Liu, Z.; Ma, W.; Berto, F. Reliability analysis of fatigue crack growth for rail steel under variable amplitude service loading conditions and wear. Int. J. Fatigue 2021, 152, 106450. [Google Scholar] [CrossRef]
- Huynh, H.D.; Nguyen, M.N.; Cusatis, G.; Tanaka, S.; Bui, T.Q. A polygonal XFEM with new numerical integration for linear elastic fracture mechanics. Eng. Fract. Mech. 2019, 213, 241–263. [Google Scholar] [CrossRef]
- Surendran, M.; Natarajan, S.; Palani, G.; Bordas, S.P. Linear smoothed extended finite element method for fatigue crack growth simulations. Eng. Fract. Mech. 2019, 206, 551–564. [Google Scholar] [CrossRef]
- Rozumek, D.; Marciniak, Z.; Lesiuk, G.; Correia, J. Mixed mode I/II/III fatigue crack growth in S355 steel. Procedia Struct. Integr. 2017, 5, 896–903. [Google Scholar] [CrossRef]
- Carter, B.; Wawrzynek, P.; Ingraffea, A. Automated 3-D crack growth simulation. Int. J. Numer. Methods Eng. 2000, 47, 229–253. [Google Scholar] [CrossRef]
- Abaqus User Manual; Version 6.14; Abacus: Providence, RI, USA, 2020.
- ANSYS. Academic Research Mechanical, Release 19.2, Help System. In Coupled Field Anal. Guide; ANSYS, Inc.: Canonsburg, PA, USA, 2020. [Google Scholar]
- Lee, H.-H. Finite Element Simulations with ANSYS Workbench 2021: Theory, Applications, Case Studies; SDC publications: Mission, KS, USA, 2021. [Google Scholar]
- Alshoaibi, A.M. Computational Simulation of 3D Fatigue Crack Growth under Mixed-Mode Loading. Appl. Sci. 2021, 11, 5953. [Google Scholar] [CrossRef]
- Alshoaibi, A.M.; Fageehi, Y.A. 3D modelling of fatigue crack growth and life predictions using ANSYS. Ain Shams Eng. J. 2022, 13, 101636. [Google Scholar] [CrossRef]
- Alshoaibi, A.M. Numerical Modeling of Crack Growth under Mixed-Mode Loading. Appl. Sci. 2021, 11, 2975. [Google Scholar] [CrossRef]
- Fageehi, Y.A.; Alshoaibi, A.M. Numerical Simulation of Mixed-Mode Fatigue Crack Growth for Compact Tension Shear Specimen. Adv. Mater. Sci. Eng. 2020, 2020, 1–14. [Google Scholar] [CrossRef] [Green Version]
- Hou, J.; Wescott, R.; Attia, M. Prediction of fatigue crack propagation lives of turbine discs with forging-induced initial cracks. Eng. Fract. Mech. 2014, 131, 406–418. [Google Scholar] [CrossRef]
- Jafari, A.; Broumand, P.; Vahab, M.; Khalili, N. An eXtended Finite Element Method Implementation in COMSOL Multiphysics: Solid Mechanics. Finite Elem. Anal. Des. 2022, 202, 103707. [Google Scholar] [CrossRef]
- Giannella, V.; Sepe, R.; De Michele, G.; Esposito, R. Deterministic fatigue crack-growth simulations for a railway axle by Dual Boundary Element Method. In IOP Conference Series: Materials Science and Engineering; IOP Publishing: Bristol, UK, 2021; p. 012080. [Google Scholar]
- Fajdiga, G.; Sraml, M. Fatigue crack initiation and propagation under cyclic contact loading. Eng. Fract. Mech. 2009, 76, 1320–1335. [Google Scholar] [CrossRef]
- Paris, P.; Erdogan, F. A critical analysis of crack propagation laws. J. Fluid. Eng. 1963, 85, 528–534. [Google Scholar] [CrossRef]
- Coffin, L. Cyclic deformation and fatigue of metals; Elsevier: Amsterdam, The Netherlands, 1963; pp. 257–272. [Google Scholar]
- Wöhler, A. Versuche zur Ermittlung der auf die Eisenbahnwagenachsen einwirkenden Kräfte und die Widerstandsfähigkeit der Wagen-Achsen. Z. Bauwes. 1860, 10, 583–614. [Google Scholar]
- Zakavi, B.; Kotousov, A.; Branco, R. An analytical-based approach for simulating fatigue crack growth in round bars. Int. J. Fract. 2021, 7, 1–12. [Google Scholar] [CrossRef]
- Zakavi, B.; Kotousov, A.; Khanna, A.; Branco, R. A new method for analysis of part-elliptical surface cracks in structures subjected to fatigue loading. Theor. Appl. Fract. Mech. 2019, 103, 102258. [Google Scholar] [CrossRef]
- Alshoaibi, A.M.; Fageehi, Y.A. Finite Element Simulation of a Crack Growth in the Presence of a Hole in the Vicinity of the Crack Trajectory. Materials 2022, 15, 363. [Google Scholar] [CrossRef]
- Wawrzynek, P.; Carter, B.; Banks-Sills, L. The M-Integral for Computing Stress Intensity Factors in Generally Anisotropic Materials; National Aeronautics and Space Administration, Marshall Space Flight Center: Huntsville, AL, USA, 2005. [Google Scholar]
- Citarella, R.; Giannella, V.; Lepore, M.; Dhondt, G. Dual boundary element method and finite element method for mixed-mode crack propagation simulations in a cracked hollow shaft. Fatigue Fract. Eng. Mater. Struct. 2018, 41, 84–98. [Google Scholar] [CrossRef]
- Dhondt, G.; Hackenberg, H.-P. Use of a rotation-invariant linear strain measure for linear elastic crack propagation calculations. Eng. Fract. Mech. 2021, 247, 107634. [Google Scholar] [CrossRef]
- Bjørheim, F. Practical comparison of crack meshing in ANSYS mechanical APDL 19.2. Master’s Thesis, University of Stavanger, Stavanger, Norway, 2019. [Google Scholar]
- Xiangqiao, Y.; Shanyi, D.; Zehua, Z. Mixed-mode fatigue crack growth prediction in biaxially stretched sheets. Eng. Fract. Mech. 1992, 43, 471–475. [Google Scholar] [CrossRef]
- Wagner, D. A finite element-based adaptive energy response function method for curvilinear progressive fracture. Ph.D. Thesis, The University of Texas at San Antonio, San Antonio, TX, USA, 2018. [Google Scholar]
- Wagner, D.; Garcia, M.J.; Montoya, A.; Millwater, H. A Finite Element-based Adaptive Energy Response Function Method for 2D Curvilinear Progressive Fracture. Int. J. Fatigue 2019, 127, 229–245. [Google Scholar] [CrossRef]


| Properties | Metric Units Value |
|---|---|
| Elasticity modulus, E | 211 GPa |
| Poisson’s ratio, υ | 0.3 |
| Yield strength, σy | 422 MPa |
| Ultimate strength, σu | 838 MPa |
| Fracture toughness, KIC | |
| Paris’ law coefficient, C | 1.02 × 10⁻¹¹ |
| Paris’ law exponent, m | 2.5 |
| Specimen Number | Crack Tip Position (mm) | ||
|---|---|---|---|
| (H) | (x) | (y) | |
| 1 | 22.4 | −32 | 25.6 |
| 2 | 25.6 | −32 | 22.4 |
| 3 | 23.2 | −32 | 24.8 |
Publisher’s Note: MDPI stays neutral with regard to jurisdictional claims in published maps and institutional affiliations. |
© 2022 by the author. Licensee MDPI, Basel, Switzerland. This article is an open access article distributed under the terms and conditions of the Creative Commons Attribution (CC BY) license (https://creativecommons.org/licenses/by/4.0/).
Share and Cite
Alshoaibi, A.M. Fatigue Crack Growth Analysis under Constant Amplitude Loading Using Finite Element Method. Materials 2022, 15, 2937. https://doi.org/10.3390/ma15082937
Alshoaibi AM. Fatigue Crack Growth Analysis under Constant Amplitude Loading Using Finite Element Method. Materials. 2022; 15(8):2937. https://doi.org/10.3390/ma15082937
Chicago/Turabian StyleAlshoaibi, Abdulnaser M. 2022. "Fatigue Crack Growth Analysis under Constant Amplitude Loading Using Finite Element Method" Materials 15, no. 8: 2937. https://doi.org/10.3390/ma15082937
APA StyleAlshoaibi, A. M. (2022). Fatigue Crack Growth Analysis under Constant Amplitude Loading Using Finite Element Method. Materials, 15(8), 2937. https://doi.org/10.3390/ma15082937