Article

Designing Carbon-Enriched Alumina Films Possessing Visible Light Absorption

by
Arunas Jagminas
*,
Vaclovas Klimas
,
Katsiaryna Chernyakova
and
Vitalija Jasulaitiene
State Research Institute Center for Physical Sciences and Technology, Sauletekio Ave. 3, 10257 Vilnius, Lithuania
*
Author to whom correspondence should be addressed.
Materials 2022, 15(7), 2700; https://doi.org/10.3390/ma15072700
Submission received: 4 March 2022 / Revised: 28 March 2022 / Accepted: 1 April 2022 / Published: 6 April 2022

Abstract

:
Aluminum anodization in an aqueous solution of formic acid and sodium vanadate leads to the formation of alumina/carbon composite films. This process was optimized by varying the concentrations of formic acid and sodium vanadate, the pH, and the processing time in constant-voltage (60–100 V) or constant-current mode. As estimated, in this electrolyte, the anodizing conditions played a critical role in forming thick, nanoporous anodic films with surprisingly high carbon content up to 17 at.%. The morphology and composition of these films were examined by scanning electron microscopy, ellipsometry, EDS mapping, and thermogravimetry coupled with mass spectrometry. For the analysis of incorporated carbon species, X-ray photoelectron and Auger spectroscopies were applied, indicating the presence of carbon in both the sp2 and the sp3 states. For these films, the Tauc plots derived from the experimental diffuse reflectance spectra revealed an unprecedentedly low bandgap (Eg) of 1.78 eV compared with the characteristic Eg values of alumina films formed in solutions of other carboxylic acids under conventional anodization conditions and visible-light absorption.

1. Introduction

The formation, structure, and properties of anodic aluminum oxide (AAO) films in aqueous solutions of sulfuric, oxalic, and o-phosphoric acids have been studied for decades. Aluminum anodization in sulfuric acid solution has a long history for the fabrication of protective coatings, whereas anodization processes in aqueous oxalic acid solution have been used since the 2000s, mainly for high-ordered porous alumina structure fabrication [1,2,3]. It is worth noting that, in these solutions, the content of entrapped oxalate anions inside the film framework at a typical bath voltage of 40–80 V is approximated at just 2 at.% [4]. Quite similar amounts of carbonaceous ions in different chemical states have also been determined in the alumina films formed by Al conventional anodization in tartaric, malonic, maleic, citric, and other carboxylic acid-containing solutions [5]. The content of entrapped electrolyte anions increased with the anodizing voltage value and decreased with the bath temperature [6,7]. To produce ordered anodic alumina with various morphologies, high-field anodization of Al has been proposed in oxalic [8,9,10], sulfuric [11,12], and phosphoric [13] acid solutions. For example, the growth of alumina films in a solution of 0.4 mol·L−1 tartaric acid at a high current density of 70 mA·cm−2 resulting in a steady-state anodizing voltage as high as 205 V was reported [14]. In this case, it was estimated that, in addition to water molecules and chemisorbed hydroxyl ions, several carbon-bearing species, namely, CO2, CO, COO, CO32−, and amorphous carbon, were entrapped with a total content of just 3.2 at.%. However, we demonstrated that, through the burning anodization of Al in the tartaric acid solution at critically high voltages, AAO films with an atypical nanotubed structure and entrapped carbon species content as high as 19.5 at.% can be designed [15]. A detailed study of these films by X-ray and Auger photoelectron spectroscopes indicated the entrapment of graphene oxide, resulting in a significant alumina bandgap value decrease to 2.37–1.63 eV depending on the bath concentration. In addition, these films were extremely hard and stable in acidic environments. However, due to especially high current density required for the creation of burning conditions, the formation of such films on large surfaces is problematic [15]. Furthermore, this process is hardly controllable due to an intense evolution of Joule heat from an electroconvection origin via oxidation/etching reactions at the AAOAl boundary [16] with chaos streaks [17].
In this study, to overcome this obstacle, we report a new method for the formation of a porous anodic aluminum (PAA) film heterostructure with carbon-containing species at a significantly lower anodization voltage and current density, and with a larger content of entrapped carbon species. This process allowed for the formation of thick, uniform, and colored alumina/carbon hybrid films on significantly larger surfaces compared with films formed previously in tartaric acid solution under burning conditions. We envisage that thick alumina films containing a high amount of entrapped carbonaceous species can be used for the absorption of microwaves and fabrication of invisible objects.

2. Materials and Methods

2.1. Materials

Deionized distilled water was used in the preparation of all solutions. Vanadic and formic acids were of analytical grade (Reachem Slovakia). Aluminum samples cut from high-purity (99.99 at.%, Goodfellow) foil with a thickness of 125 μm into specimens with a size of 17 × 17 mm2 were used. Prior to anodization, the specimens were etched in a solution of 1.5 mol·L−1 NaOH at 60 °C for 10 s, rinsed, desmutted in 1:1 H2O:HNO3 by sonication for 3 min, thoroughly rinsed again, and dried in an argon stream. The sample devoted to the ellipsometry test was electropolished in ethanol (EtOH) solution containing 1.5 mol·L−1 HClO4 (48%, Reachim, Moscow, Russia) and 120 mL·L−1 glycerol, thermostated at 3 ± 1 °C and 17 V for 90 s, and then rinsed with EtOH and water. Prior to anodization, this sample was etched in 0.24 mol·L−1 NaHCO3 at 80 °C for 1 min and then in 1 mol L−1 HNO3 solution for 30 s, rinsed in running and distilled water, and dried in N2 stream.

2.2. Anodization

For one-side anodization, a 250 mL Teflon cell was applied, featuring a circular window (area 0.785 cm2) at the bottom part for fixing the sample with a silicon ring. The aqueous solutions containing 0.2 to 1.0 mol·L−1 formic acid and 0.05 to 0.25 mol·L−1 NaVO3 were thermostated at 20 °C with a Lauda Alpha RA12 and gently mixed. A platinum sheet was used as the cathode, and Hg/Hg2SO4 in saturated K2SO4 solution was used as the reference electrode. Electrochemical investigations were conducted in a typical three-compartment electrochemical cell equipped with a Pt counter electrode, Hg/HgSO4/K2SO4(sat) reference electrode, and Al working electrode. The anodization was conducted at a constant potential up to 100 V. A ZAHNER-Elektrik GmbH&Co.KG (Kronach, Germany) Germany electrochemical workstation equipped with booster CVB 120 was used to control the potential and current generated. All potentials are presented on the SHE scale.

2.3. Characterization

The morphology and composition of the anodized samples were studied on both sides of the film and in their cross-section using an SEM FEI Helios Nanolab 650 equipped with a field-emission gun and EDX spectrometer (Eindhoven, The Netherlands). Cross-sections were obtained by brittle cracking of the film via bending of the sample over the blade of a knife. The thickness of thin films formed by anodic treatments in the formic and vanadic acids alone was determined by analyzing the corresponding ellipsometry plots, whereas the thickness of thicker films was determined by the SEM observations of their cross-sections. Prior to observations, the film surfaces were covered by sputtering of a thin Cr layer. Variations of Ψ and Δ parameters for nonporous alumina layers formed in the solutions of vanadate were determined in the region from 200 to 1700 nm wavelengths by spectroscopic ellipsometry. Bruggeman’s effective medium approximation was applied to calculate the parameters of these films using Complete EASE software. XPS measurements were performed to determine the chemical states of carbon, aluminum, vanadium, and oxygen and the surface composition of heterostructured films. XP spectra were acquired on an ESCALAB MKII (Thermo VG Scientific, East Grinstead, UK) spectrometer. All spectra were calibrated using the C1s peak at 284.6 eV and analyzed using a nonlinear Shirley-type background. Recording and fitting of the spectra and calculation of the elemental composition were performed using Avantage software (5.918) provided by Thermo VG Scientific.
The diffuse reflectance of the films was studied using a Shimadzu UV-VIS-NIR Spectrophotometer UV-3600 equipped with an integrating sphere in the range 200–1500 nm. Light absorbance and optical bandgaps were calculated using the Kubelka–Munk and Tauc functions, respectively.
To determine the content of carbon entrapped in the anodic film bulk, thermogravimetry (TG) analysis coupled with mass spectrometry (MS) of evolved CO2 and CO gases was applied. The simultaneous thermal analysis apparatus STA Pt 1600 (Linseis, Selb, Germany) was used for this together with the mass spectrometer MS Thermostar GDS 320 (Linseis/Pfeiffer, Asslar, Germany). For the investigation, 10–12 mg specimens were loaded in Al2O3 crucibles and then subsequently heated in an argon (Ar 6.0) and synthetic air (Ar 6.0–75; O2 5.0–25 cm3·min−1) atmosphere up to 1000 °C at a heating rate of 10 °C·min−1. The data were collected and fitted by the software ‘Evaluation’ and ‘Quadera’ provided with the equipment.

3. Results and Discussion

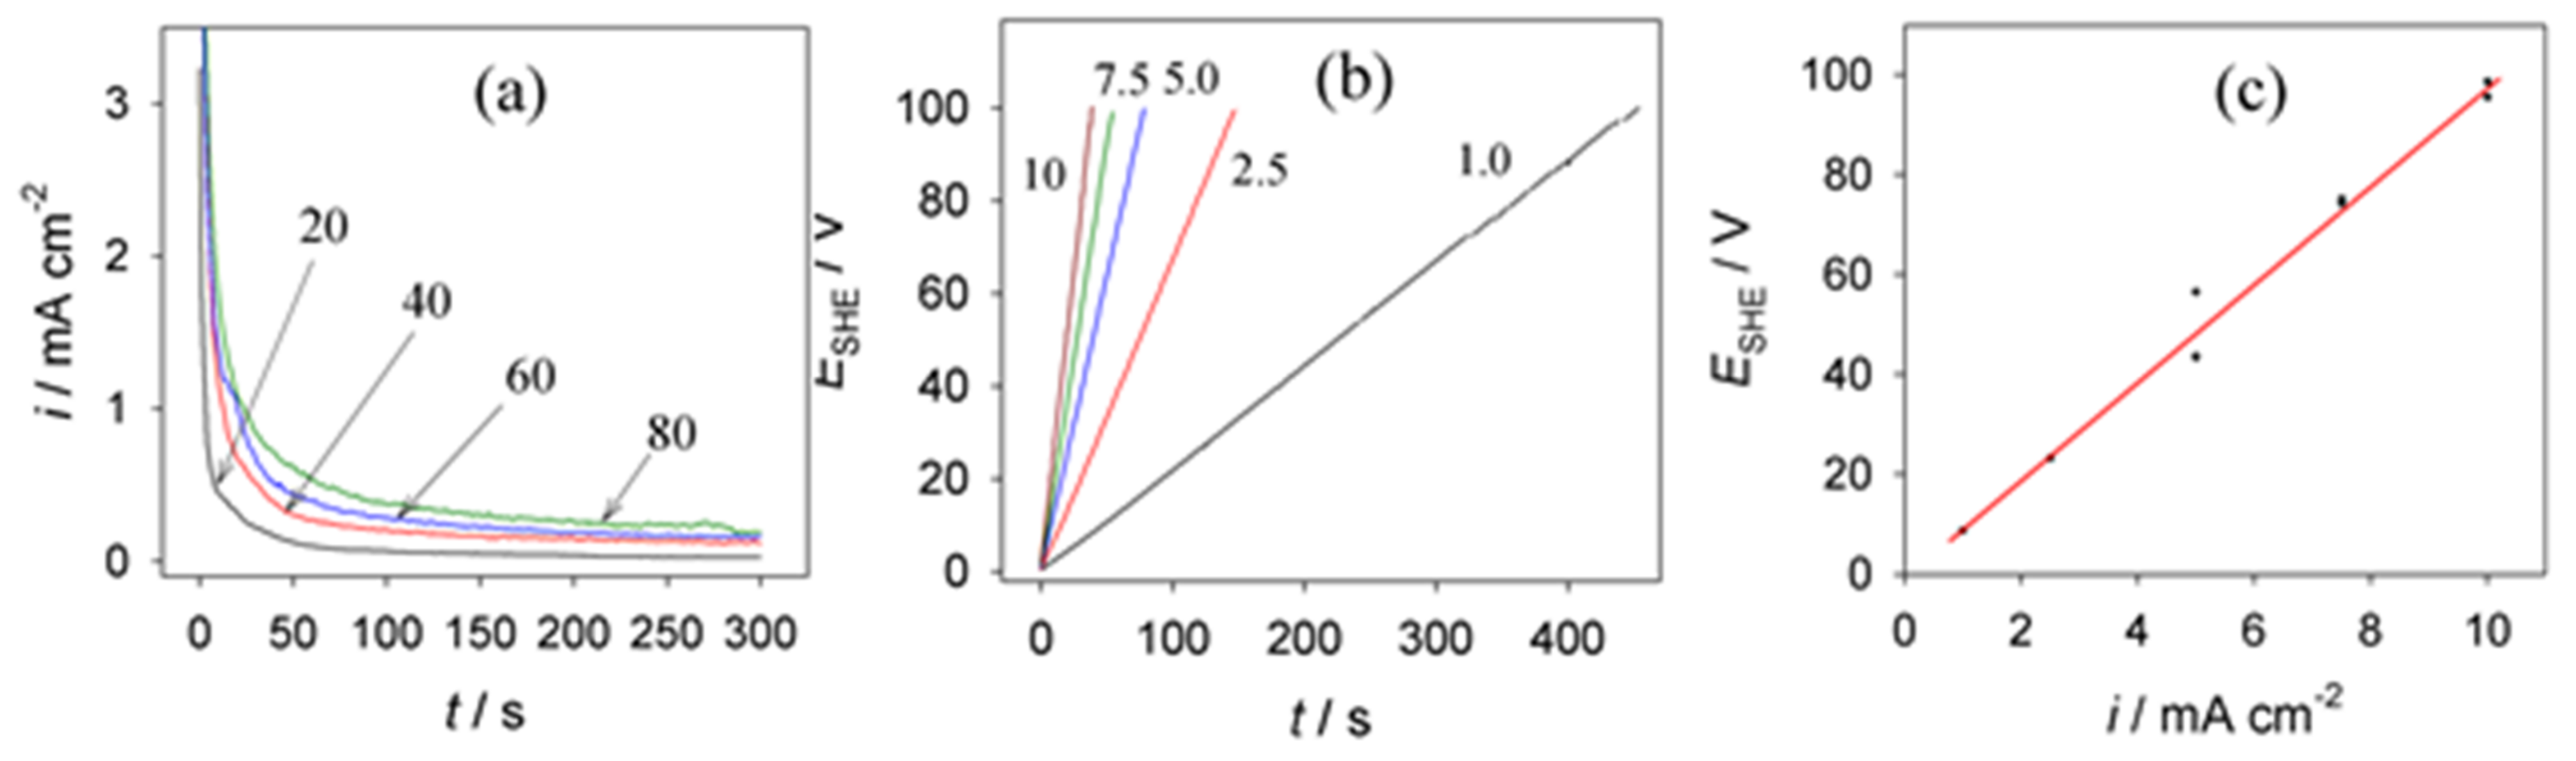
3.1. Anodic Behavior of Aluminum in the Vanadate Solutions

Although vanadic acid (HVO3) and vanadate solutions are well known as corrosion inhibitors of Al and its alloys [18,19], the anodic behavior of Al in these solutions remains unclear. Despite several reports, detailed studies are scarce. We suspect that, due to a low solubility of vanadic acid, neutral and slightly acidic aqueous solutions might be a prerequisite in constructing their electrolytes for Al anodization. It is worth noting that, in acidic solutions, vanadic acid transforms to a meta state, which further tends to polymerize into di-, tetra-, and decavanadic acids depending on the pH value [20]. The current transience, ia(t), (Figure 1a) as well as anodic potential–time, Ea(t), plots (Figure 1b) recorded for Al anodized in pure 0.2 mol·L−1 sodium vanadate solution verified the formation of a barrier-layer film [21]. The thickness of this layer (δb) determined by ellipsometry was about 116–121 nm. In the case of Ea = 80 V, the anodic oxidation rate was 1.45–1.5 nm·V−1, which is close to the 1.4 nm·V−1 rate characteristic of barrier-layer alumina film formation. We also determined that, for a given anodization time, Ea(t) plots were linear (Figure 1c) with the slope varying to some extent with the pH of the solution applied. For example, if the pH increased from 7.1 to 8.4, the slope of the Ea(i) plots decreased from 0.257 + 0.0005ia−1 to 0.221 + 0.003 ia−1. We determined that a linear growth of alumina film at a constant current density proceeded up to 178–185 V. With further processing, the breakdown of the film began to cause a drop in Ea to 163–167 V along with oscillations.

3.2. Anodic Behavior of Aluminum in HCOOH Solutions

It has been reported that anodic films thicker than 100 nm cannot be formed on the Al surface in monobasic acid solutions, such as HCl and HNO3 [22]. However, opposite information can be found in the available literature about the anodic behavior of Al in aqueous solutions of formic acid. According to Tajima [22], anodic treatment of Al in HCOOH solution resulted mainly in pitting-like surface etching followed by the formation of a thin oxide film. It has also been reported that, in diluted and low-temperature solutions, local corrosion and pitting of the aluminum surface prevail, whereas, at relatively high temperatures and concentrations, porous oxide layers with an irregular structure within a wide range of anodic voltages can be formed [23,24]. Moreover, Pashchanka and Schneider [25] reported that, in room-temperature solutions, porous alumina with a clear tendency to hexagonal order was formed at 18–30 V. In this study, we also investigated the anodic behavior of aluminum in aqueous formate solutions. From these investigations, several conclusions were drawn: (i) a sudden increase in potential toward the maximum value at the onset of galvanostatic anodization is characteristic of pH within the 1.8–8.4 range; (ii) with further processing at a constant ia, Ea decreased to a similar value independent of the electrolyte pH. For example, at ia, = 5 mA cm−2 and pH = 1.8, Ea stabilized at 24–20 V; (iii) similar behavior was estimated in the slightly alkaline solutions, revealing a rapid Ea stabilization at some lower voltages, e.g., 20–21 V, whereas, in the slightly acidic solutions, the Ea vs. t plots varied significantly, not stabilizing for several minutes; (iv) anodization at a steady-state potential for hours resulted in the formation of porous anodic films with sub-micrometer thickness.

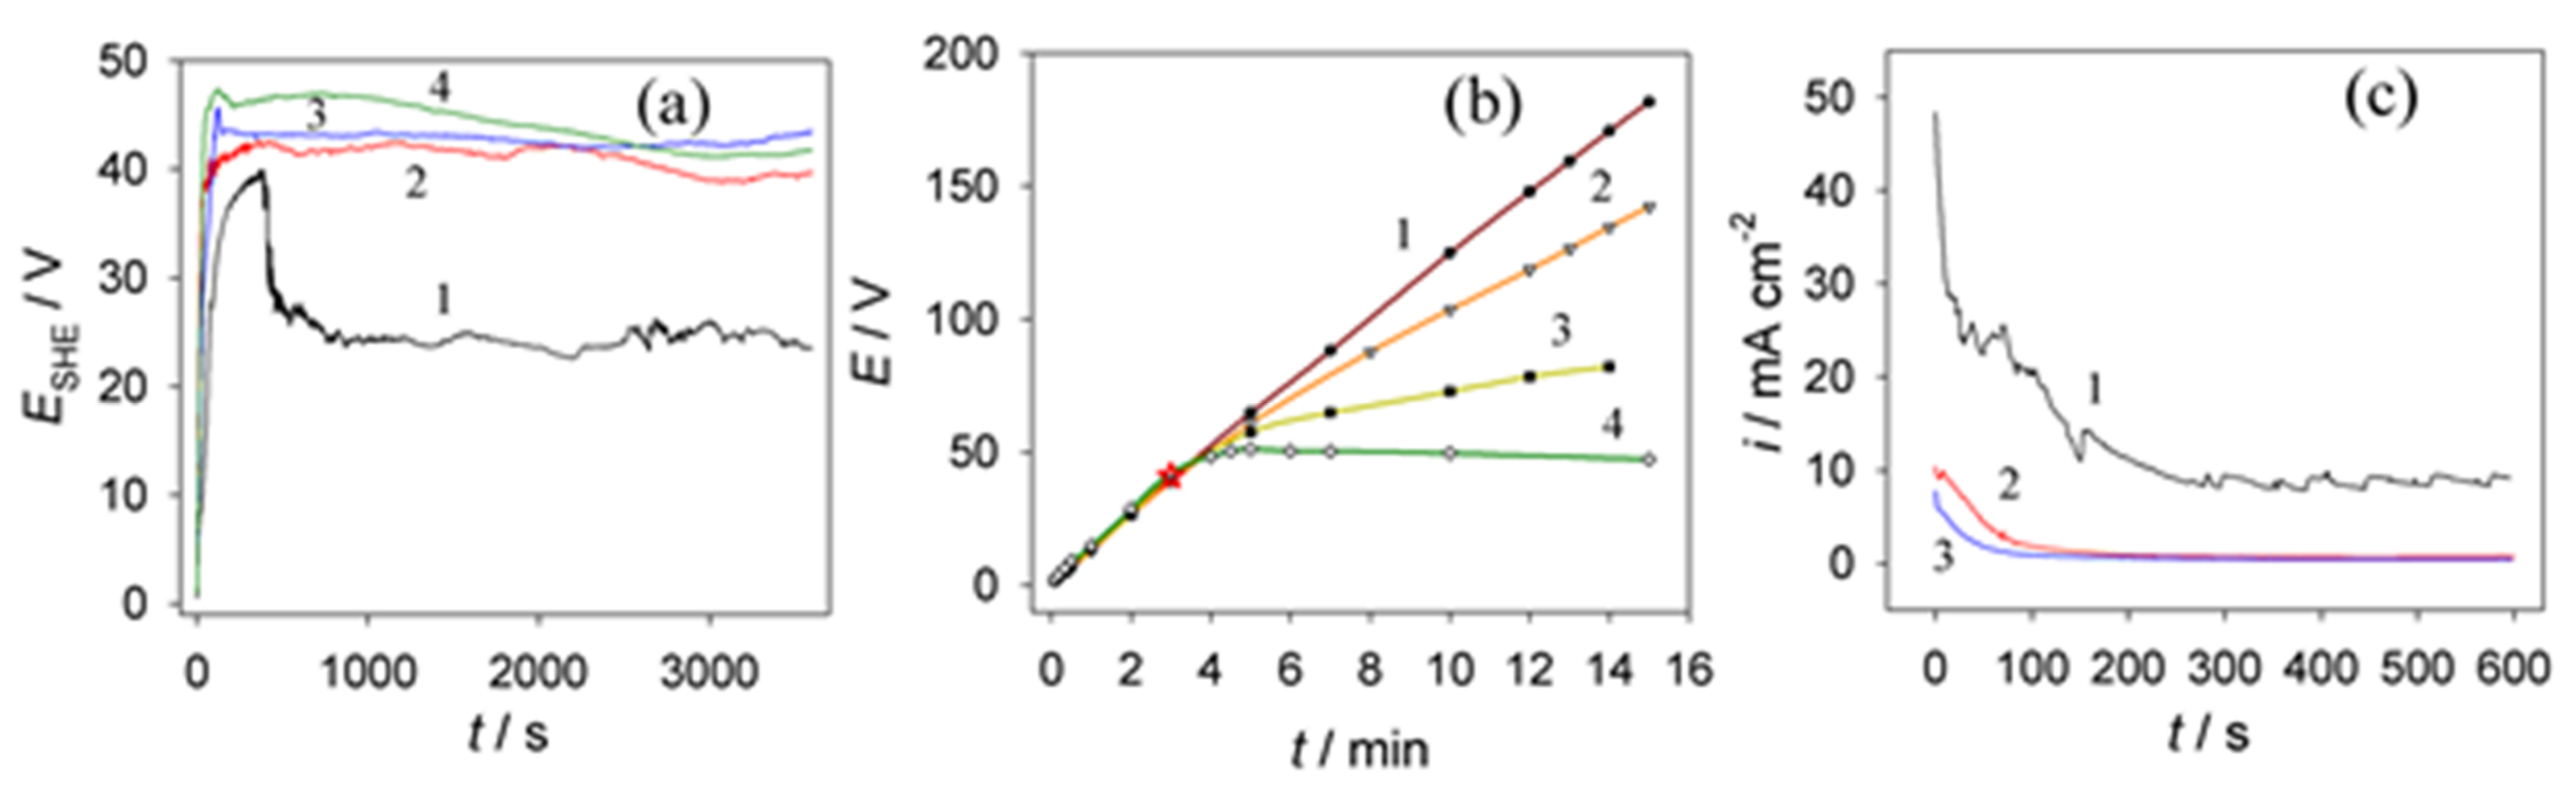
3.3. Anodic Behavior of Aluminum in NaVO3–HCOOH–HCOONa Solution
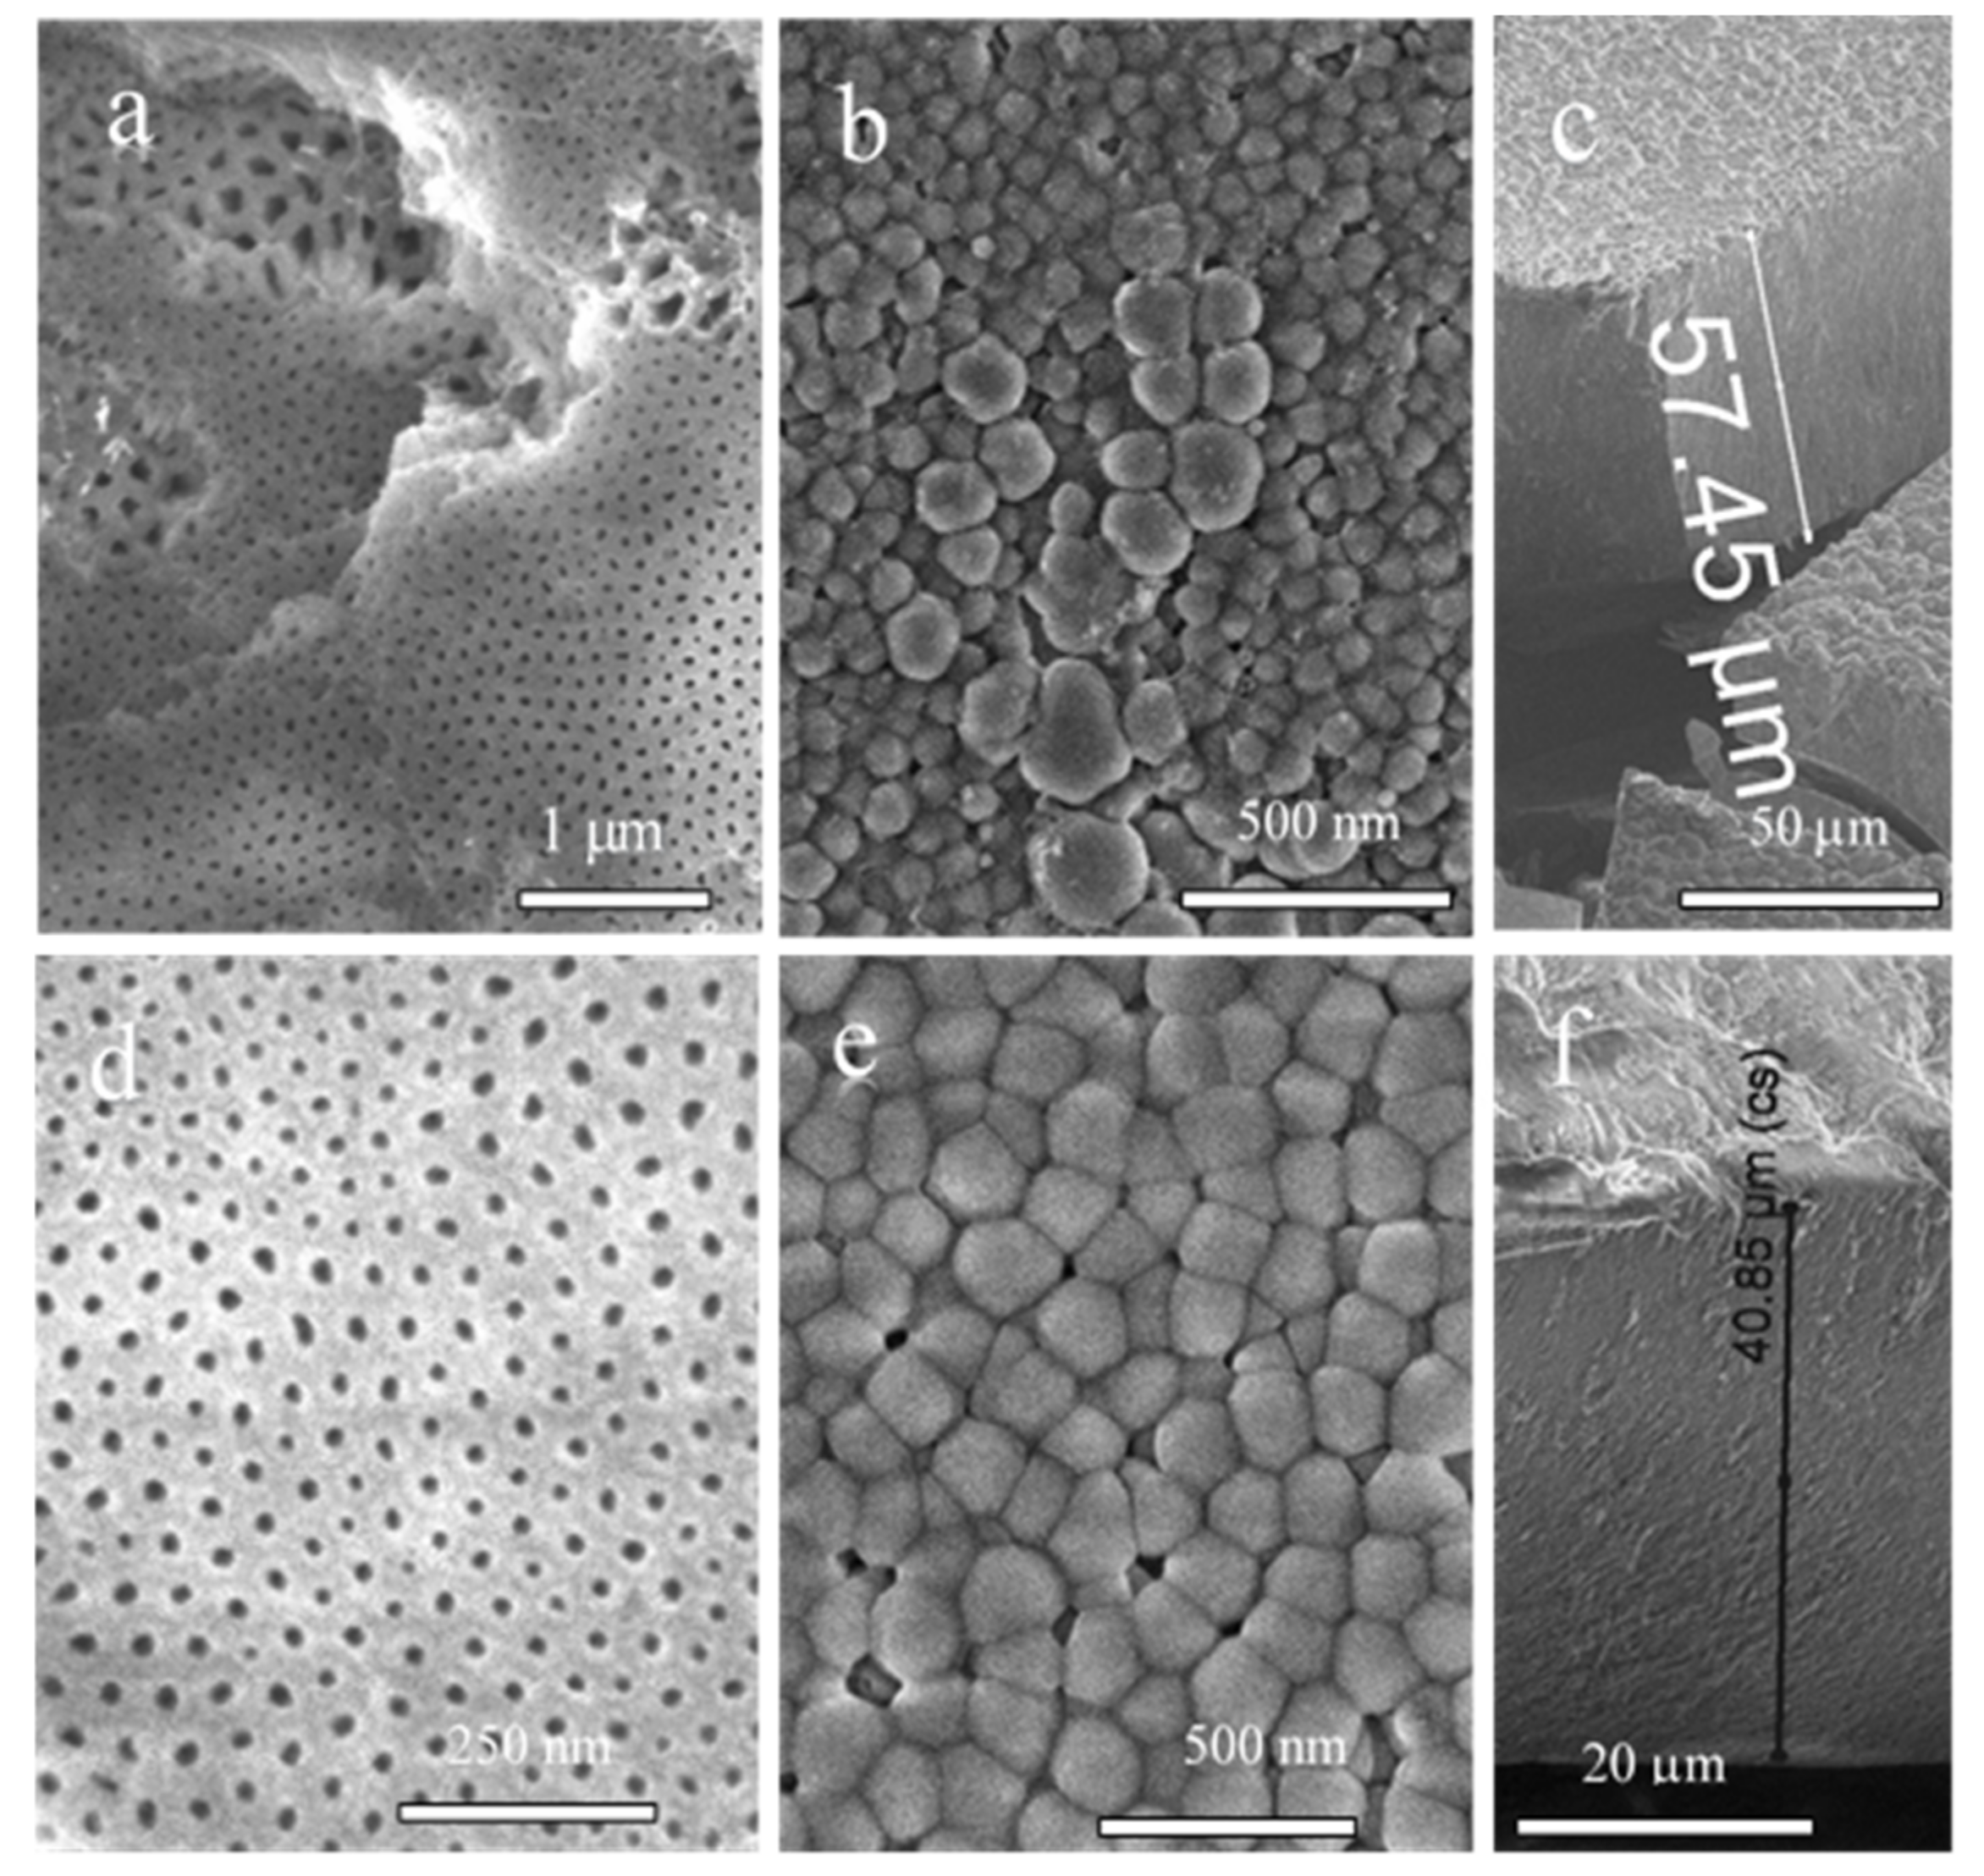
To optimize Al anodization in this composite solution, we investigated a number of process variations. It was established that the addition of just 0.01 mol·L−1 sodium vanadate to sodium formate solution resulted in an increase in steady-state anodizing potential from 24–25 V to 40–42 V (Figure 2a). A further increase in NaVO3 concentration to 0.2 mol·L−1 was not so effective (Figure 2a, plots 3 and 4) compared to 0.01 mol·L−1 addition. Figure 2b displays the Ea(t) plots recorded in a solution of 0.25 mol·L−1 NaVO3 without (1) and with various NaCO2H contents at a constant current density of 0.5 mA·cm−2. According to these plots, the concentration of formate is crucial for the anodic behavior of Al under galvanostatic conditions; with an increase in the formate concentration, the growth of the film after barrier-layer formation (star in Figure 2b) proceeded with a decreasing rate of potential. In the case of potentiostatic anodization (Figure 2c), an increase in vanadate concentration to 0.05 mol·L−1 resulted in a sudden decrease in current density during first 100 s to steady-state growth without any current fluctuations characteristic of pure formate solutions. Lastly, it was determined that an increase in the content of sodium vanadate in the mixed electrolyte of formic acid/sodium formate always resulted in an increase in alumina formation Ea and a decrease in the ia, while a decrease in the pH of electrolyte led to film formation at a lower potential.

3.4. Films

It was established that a key parameter influencing the formation of PAA film on the Al surface in the mixed electrolyte was the pH. Slightly colored films could be formed within the pH range of 2.5–5.6 starting from Ea = 23 V. However, the as-formed films, even after 3–4 h of Al anodization at this voltage, remained nonuniformly colored in light tones. Films colored in khaki and black spots started to form at 35–38 V. Uniform and deep-colored finishing of the Al surface could be obtained within a wide range of anodizing voltages, e.g., at 40–180 V using 0.2–0.25 NaVO3 and 0.5–1.0 mol·L−1 HCOOH solution with pH from 2.5 to 3.0. For example, at 20 °C and 80 V, deep-colored films with a highly uniform thickness of ~40 μm were formed after 1 h of anodization. These films dissolved in NaOH forming a brownish solution. We suspect that the color of the solution cannot be ascribed to the presence of V5+ (colorless) or V4+ (blue) compounds [26].
The structure of PAA films formed after 60 min in the optimized composite solution (0.2 mol·L−1 NaVO3 + 0.8 mol·L−1 HCOOH; pH 2.6) was further studied for three values of Ea, namely, 60, 80, and 100 V. Both sides of the films and their cross-sections were inspected. Figure 3 displays the SEM images of films obtained by the prolonged anodization of Al at 60 and 80 V. From these images, the dense packaging of honeycomb-shaped cells can be verified. The size and uniformity of cells at the metal–film interface varied significantly. The uniformity and ordering of cells seemed to be poor for all tested Ea modes. In addition, in the case of thinner films formed after several minutes, groups of obviously larger cells randomly distributed and uneven in size can be seen (Figure 3a). More detailed inspection of the areas with larger cells on both film sides revealed the formation of 2–3-fold wider pores in these areas and twofold greater film morphology after prolonged Al anodization (Figure 3b). The formation of films consisting of uneven and larger cells with wide pores at the Al–film interface and a continuous thick upper layer with threefold thinner pores can be observed after specimen bending and layer cleavage (Figure 3b). We found, however, that if anodization was initiated during the first 2–5 min at a lower voltage of 30–40 V, a further stepwise increase in Ua to 60–100 V caused the formation of single-layered alumina films with quite uniform pores across all film thicknesses, which were not cleaved upon specimen bending (Figure 3d,e). It is also worth noting that the thickness of PAA film in these solutions surprisingly depended on the increase in anodization potential value with the decrease in Ea from 100 to 60 V (Figure 3c,f). According to Pashchanka [25], the electroconvection-based mechanism underlying the growth of such films, known as ion exchange, can be attributed to nonstoichiometric amphoteric amorphous alumina formation in an acidic environment, resulting in nonuniform distribution of impurity-related elements inside the pore walls [27,28].

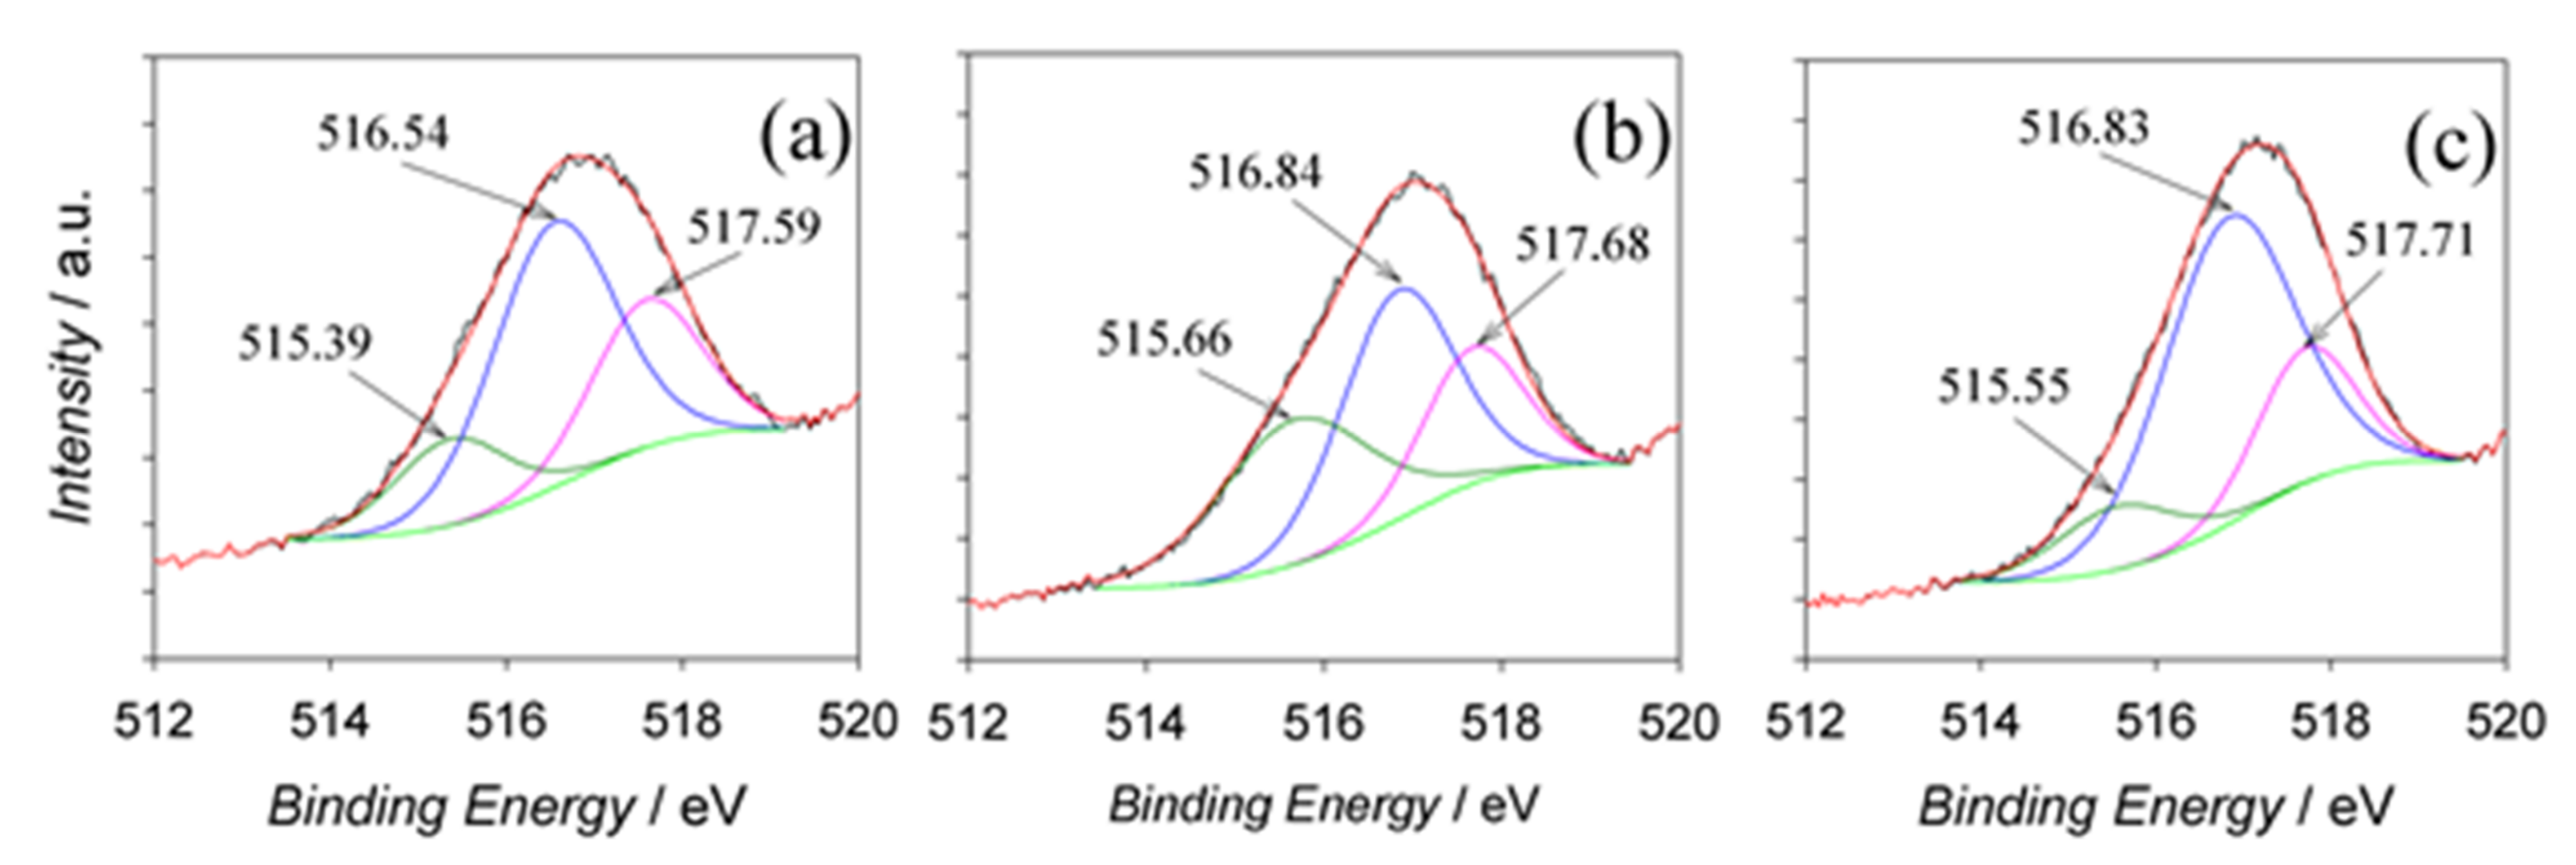
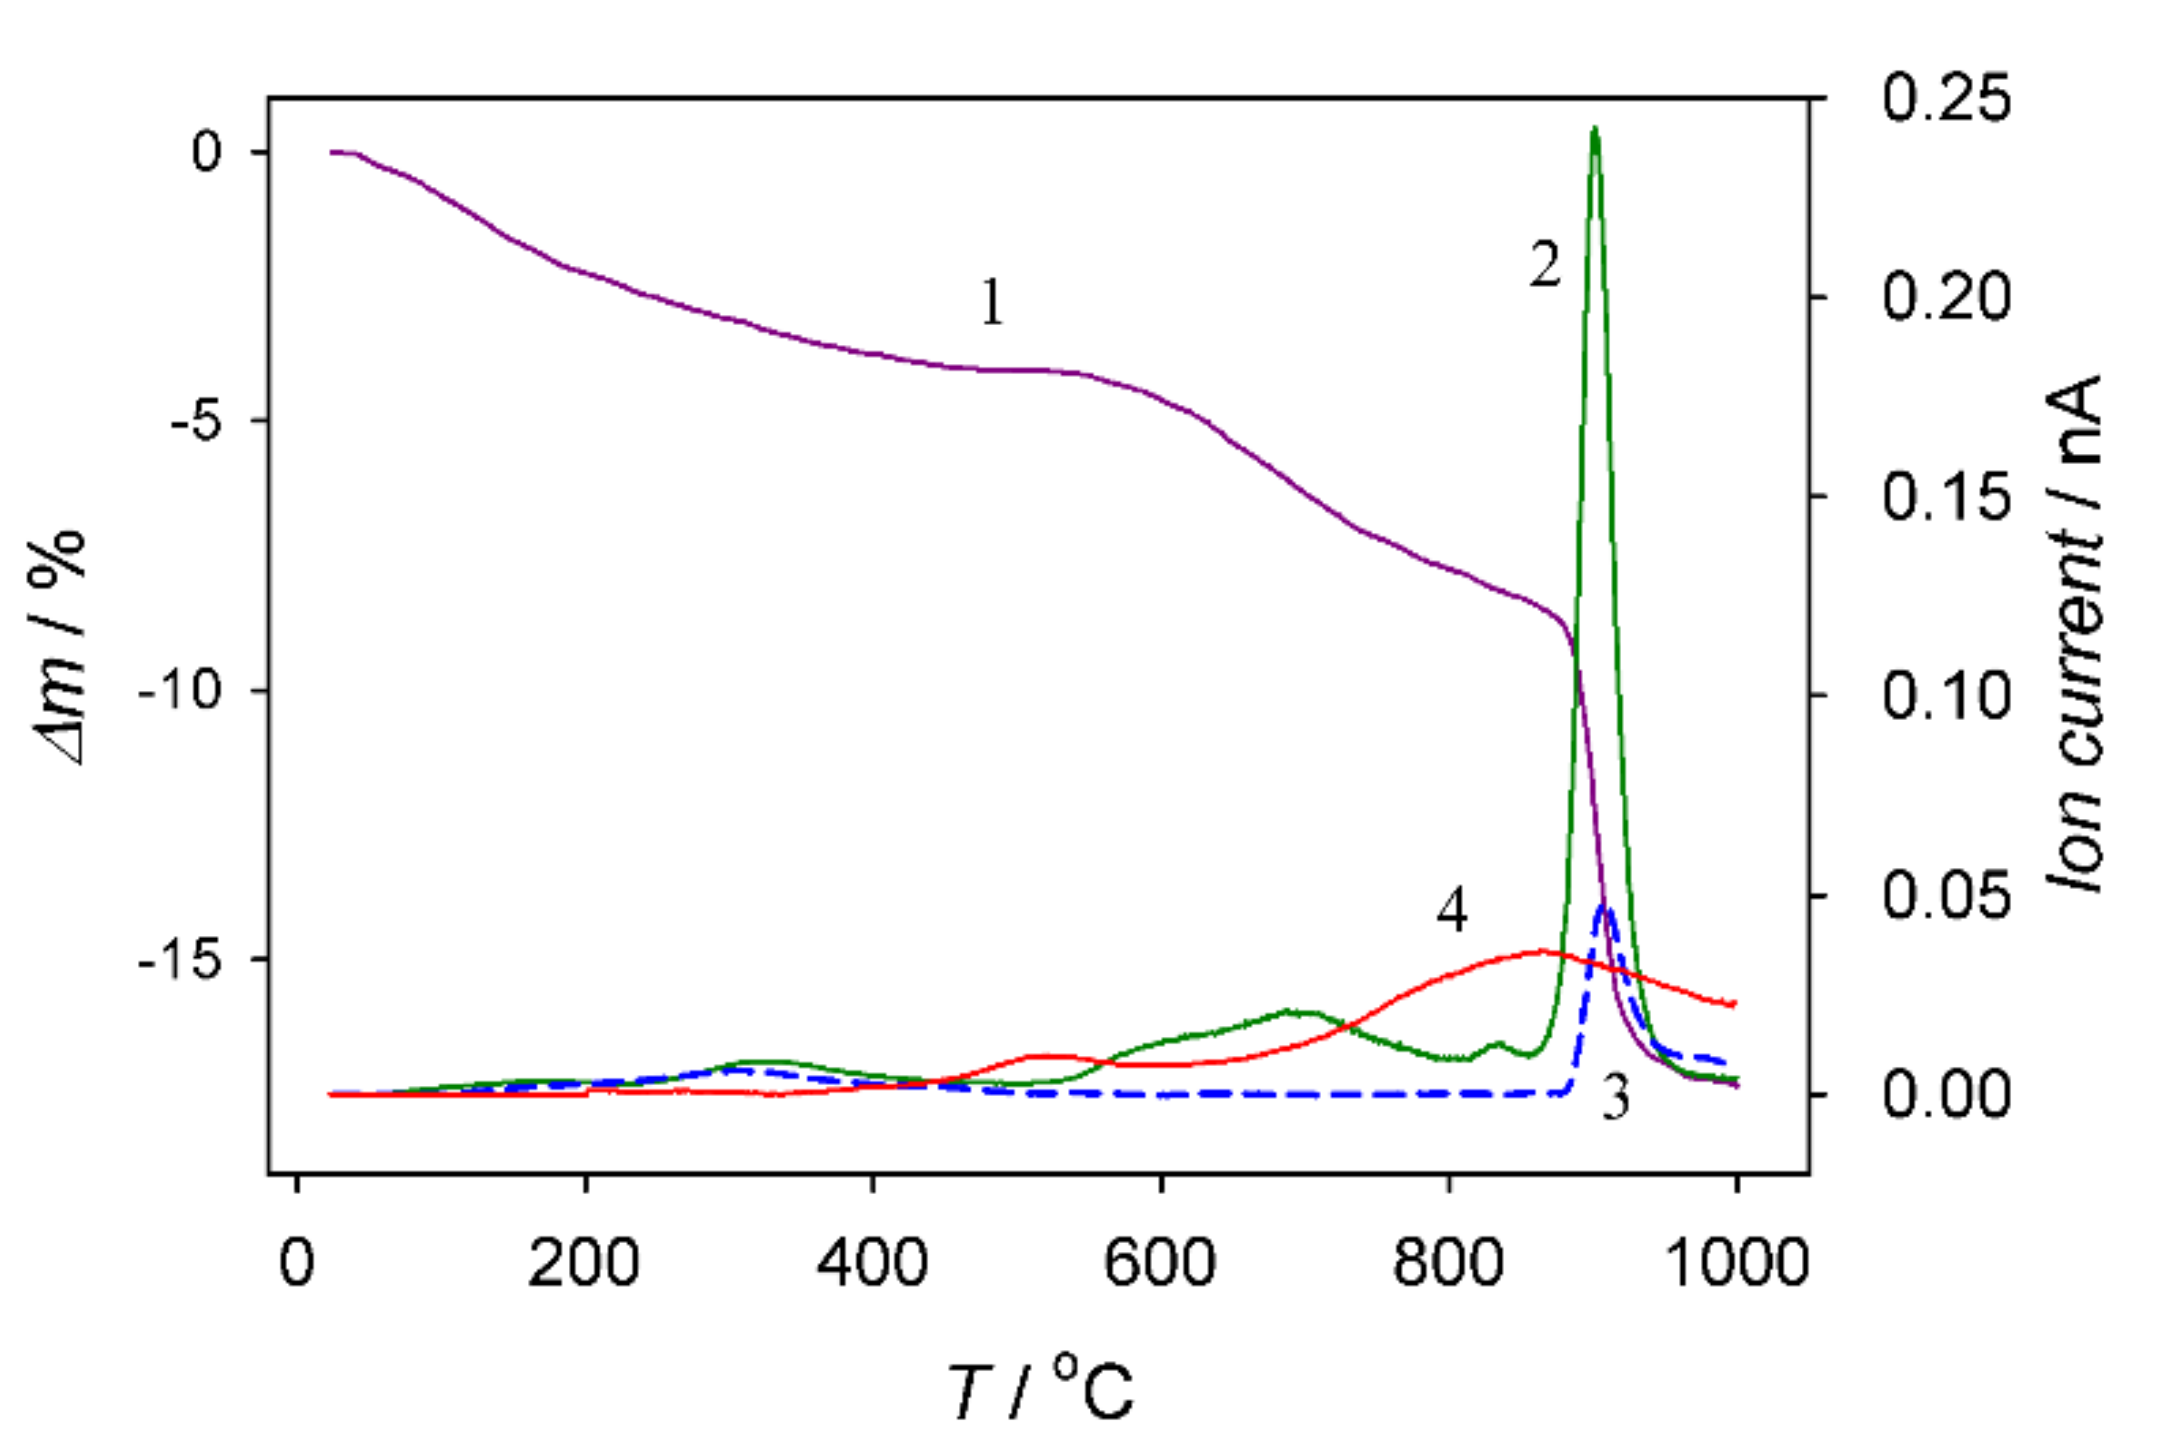
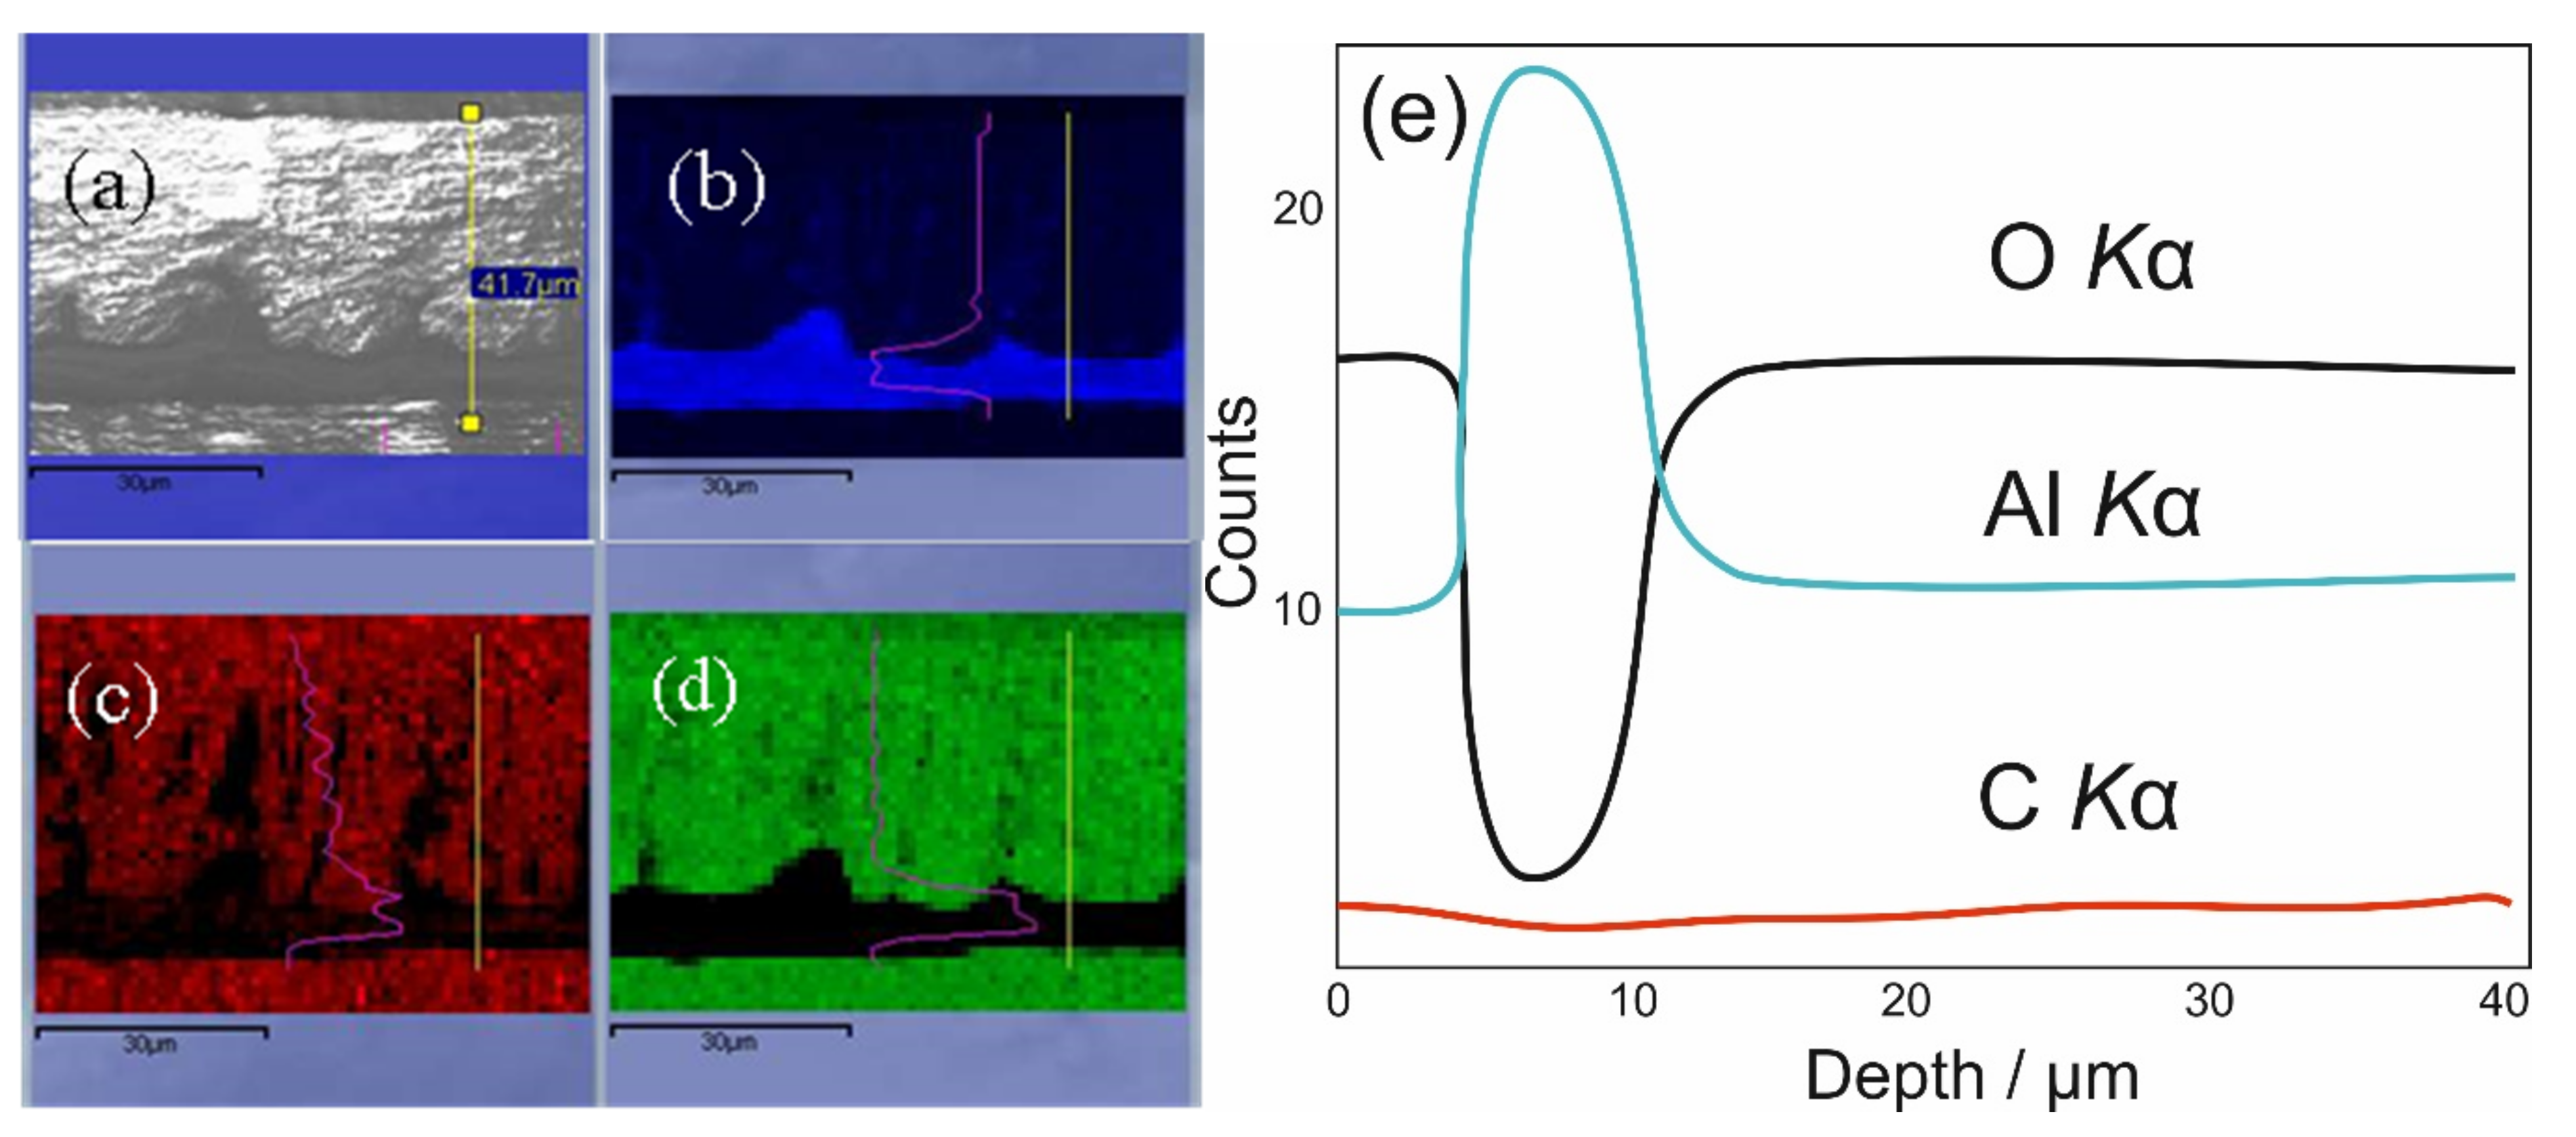
3.5. The Composition of Films

Chemical analysis using XPS indicated the presence of Al, O, V, and C elements. The quantification of XPS peaks of Al samples anodized in the optimized solution (0.2 mol·L−1 NaVO3 + 0.8 mol·L−1 HCOOH; pH 2.67) at 60, 80, and 100 V for 60 min is presented in Table 1. According to these data, quite similar contents of elements were determined regardless of the Ea value. The content of encased oxygen was 11–12% higher than that required for Al2O3 and VO3 stoichiometry, implying the inclusion of water molecules, as well as OH and HCOO anions. The content of entrapped vanadium was low, 2.48 ± 0.22 at.%, insignificantly increasing with Ea value. Furthermore, a surprisingly high amount of entrapped carbon, ca. 17 at.%, regardless of Ea, was detected for all specimens. The observed phenomenon contradicted the well-known rule for incorporating electrolyte anions inside the outer layer of porous alumina films postulating that the content of incorporated electrolyte anions should increase with anodizing voltage and decrease with increasing electrolyte temperature [29]. Of note, such a high content of carbonaceous species was observed on the surface of alumina films formed in tartaric acid solution at the critical voltages and extremely high current densities causing burning [15]. The three peaks (Figure 4) with binding energies (BEs) of 515.39–515.66, 516.54–516.84, and 517.59–517.71 eV were attributable to V3+, V4+, and V5+ states, respectively [30].
Quantification of their peak areas (see Table 1) revealed the dominant presence of vanadium in the +4 oxidation state, whereas the content of entrapped V5+ species decreased with Ea (Table 2).
Deconvoluted O1s spectra were found to be described by three counterparts with BE peaks within 530.30–530.35, 531.56–531.61, and 532.73–532.90 eV ranges, corresponding well to the BEs of oxygen in oxides, hydroxides, and carbohydrates, respectively [31]. For all specimens, the XPS spectra of C1s were deconvoluted into four counterparts (Figure 5) attributable to C–C, C–OH, C–O, and carboxylic O=C–O bonds with BEs of 284.49–284.60 eV, 285.68–286.03 eV, 286.72–287.13 eV, and 289.01–289.12 eV, respectively [32,33]. From the quantification of peak areas, most carbonaceous species could be ascribed to C–C bonds, while the smallest fraction of entrapped carbon was characteristic of C–O bonded species. Quantitative analysis data are presented in Table 3.
Furthermore, the D parameter calculated from the differentiated dC/dE versus kinetic energy plots for various Ea samples on the surface was equal to 12.8–14.0 eV, implying a diamond-like carbon nature [33]. This was further confirmed by the carbon KVV spectra acquired with a low-energy electron beam (3 keV) showing D = 20.4 eV. According to [32,33,34], the shift in D parameter between X-ray and electron beam-induced Auger spectra represents the fingerprint of graphene. It is worth noting that, from the C1s deconvoluted areas, the content of carbon entrapped inside the anodic film in the graphene state was the highest among all carbonaceous species regardless of Ea value.
To determine the average content of carbon entrapped inside the anodic film formed in a solution containing 0.8 mol·L−1 HCOOH and 0.2 mol·L−1 NaVO3 (pH 2.7) at 80 V for 1 h, the probe of this film with a thickness of ~42 μm was analyzed further by thermogravimetry analysis coupled with mass spectrometry up to 1000 °C. To determine the content of remaining carbon after the TG test in argon, we burned this probe in a synthetic air atmosphere by heating to 1000 °C. The results obtained are shown in Figure 6. According to this plot, the average amount of carbon in the film was approximated at 7.7 at.%, and it was removed from the film in the form of CO2 and CO gases at about 900 °C. Furthermore, 94.8% of all carbon evolved during heating in an argon atmosphere. A relatively uniform distribution of carbon species in the film bulk was also elucidated by EDS mapping of carbon element in the film cross-section, evidencing the formation of a hybrid alumina–carbon material (Figure 7c,e).
The large content of entrapped carbonaceous species in the anodic alumina films grown at 60–100 V was established for the first time. It appears that these species are inserted into the alumina cell bulk during film growth in a similar way to that seen for structural ions in other electrolytes, coloring the film from grayish to black with an increase in anodization time and film thickness. The main carbon source might be COO ions, supplied through the barrier layer during anodization to the Al–oxide interface together with OH/O2– ions. From the large content of carbon entrapped in the thin alumina films (5.8 at.%) formed in the formate solutions, it follows that formate ions were transported easily through the alumina barrier layer and reacted with Al3+ species at the Al–oxide interface.
These formate ions are lighter compared to the twofold larger oxalate ones in the solution of oxalic acid. Contaminations extracted from the XPS C1s peak deconvolution showed that the main source of entrapped carbon is the graphite C–C bond. The inserted HCOO ions accounted for just one-fourth of the total carbon. However, the exact decomposition mechanism of formate ions and the insertion pathway of carbonaceous species require further investigation. These questions will be addressed in future work.

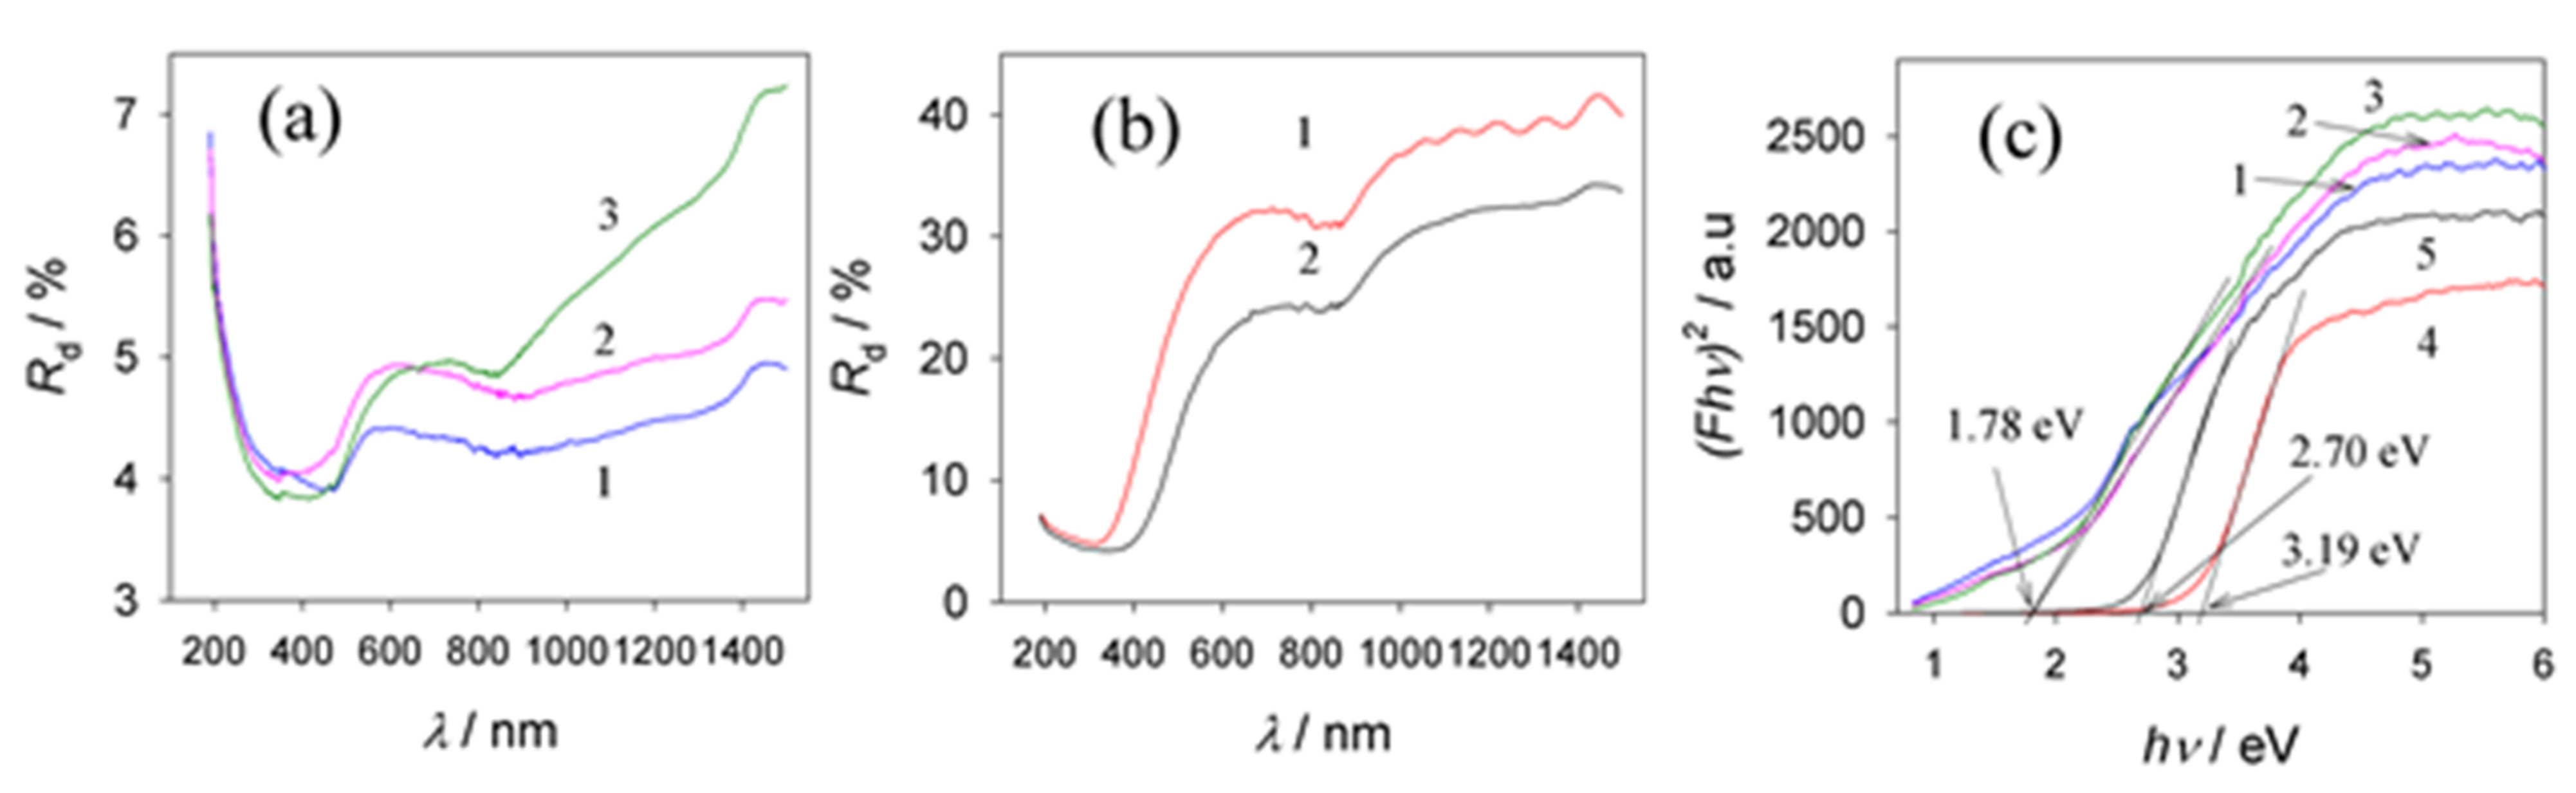
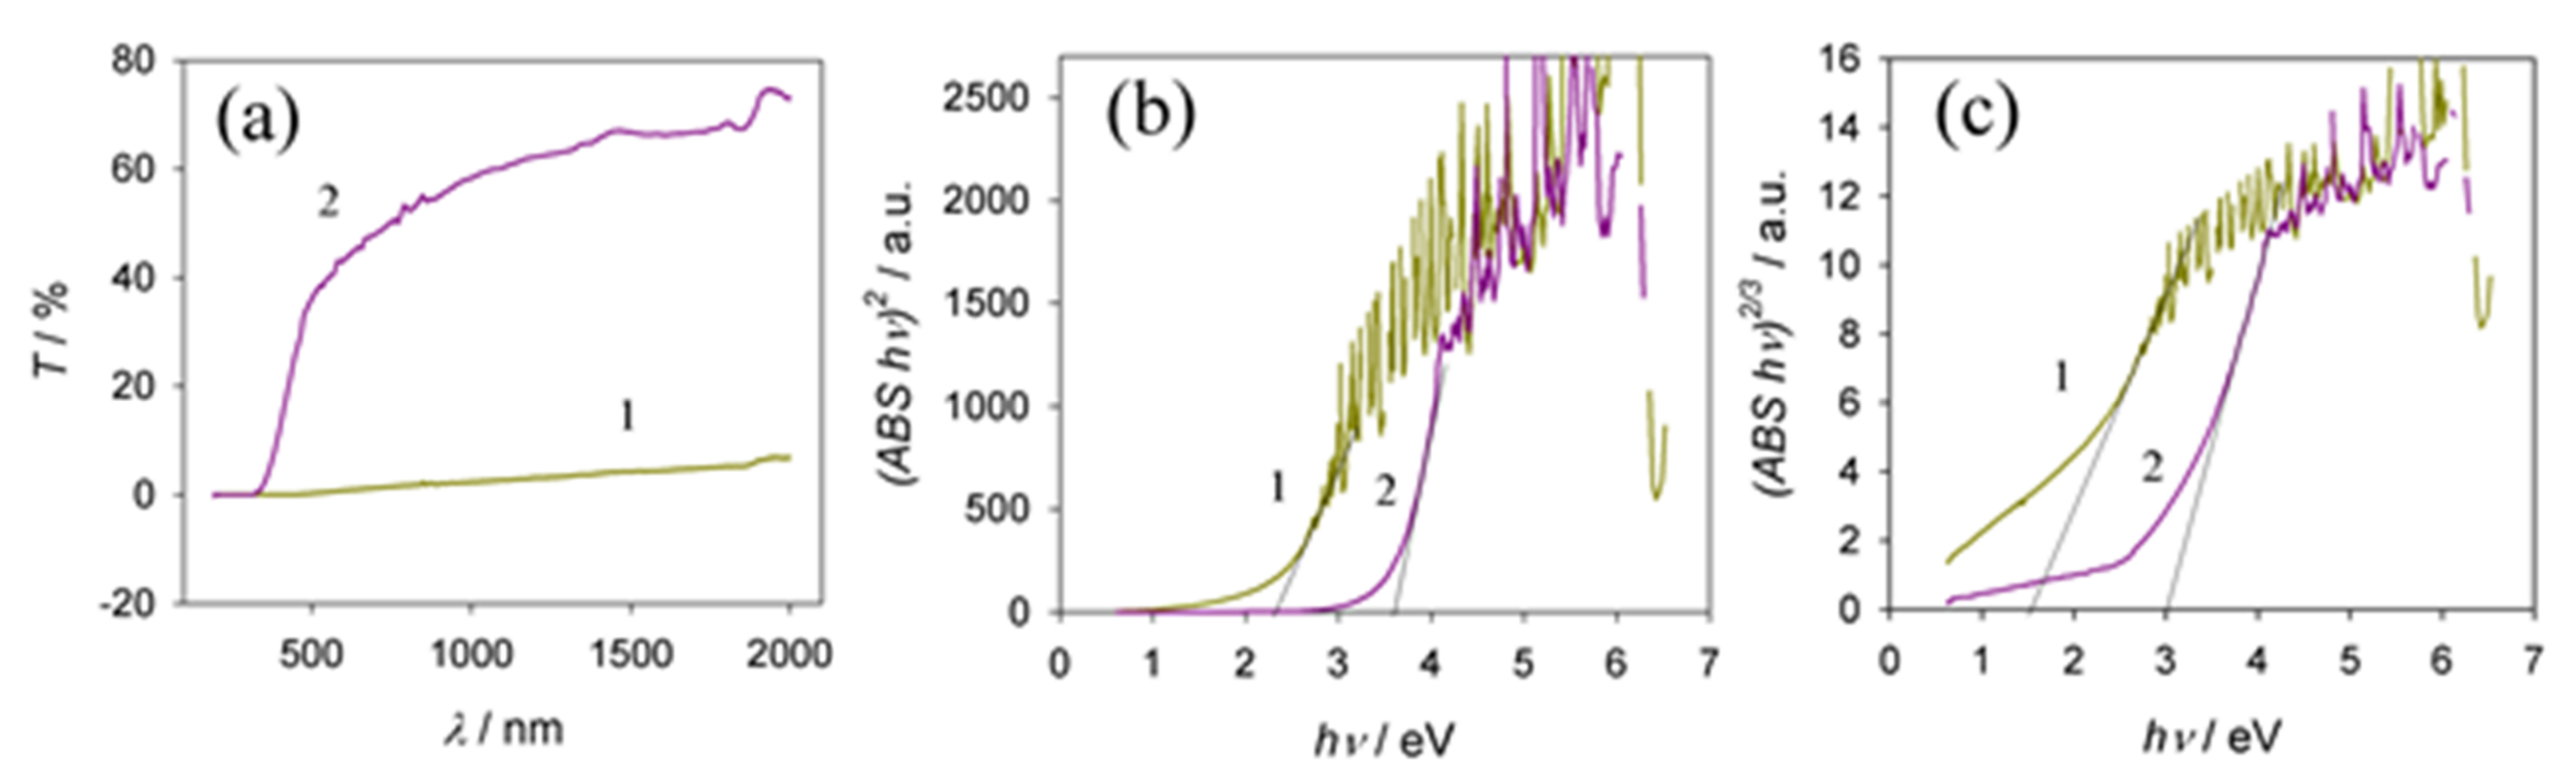
3.6. Optical Properties

The anodic oxides of Al obtained in sulfuric and phosphoric acid solutions are transparent and colorless, while those grown in oxalic, citric, and tartaric acid solutions are slightly yellow, greenish gray, and gray, respectively [35]. The optical bandgap energy (Eg) of conventional Al oxides allows direct transitions from 5.40 eV to 5.75 eV [36]. The Eg of anodic Al oxides ranges from 1.6 eV [15] to 4.3 eV [37]. Furthermore, the Eg value of oxalic acid anodic films slightly increases with anodizing voltage but remains constant with an increase in film thickness and porosity [38]. As reported in [37,39], photoluminescence investigations indicated the presence of F and F+ centers in oxalic and sulfuric alumina films, which could be attributed to oxygen vacancy-related defect centers. The diffuse reflection spectra and the corresponding Tauc plots of alumina films formed in the optimized vanadate–formate solutions were found to be dependent on the anodization time (Figure 8). Moreover, the films formed at Ea values from 60 to 100 V for the same time, e.g., 1 h, possess a similar Eg value of about 1.78 eV, regardless of the Ea value, which is in the far-visible region (Figure 8c, plots 1 to 3). Significantly, this band value is lower than that reported for porous alumina films formed in sulfuric, oxalic, or carboxylic acid solutions under conventional conditions [37]. However, in the case of thinner films, obtained, for example, during 2 and 5 min anodization at a stable potential of 80 V, their light absorption edge was approximated at 3.19 and 2.70 eV (Figure 8c, 4 and 5 plots), respectively, implying the potential to control the Eg value and absorption properties of these films as a function of anodization time.
Our electrolyte contained an organic acid (HCOOH) and vanadate. Therefore, it is reasonable to suggest that entrapped vanadium species could influence the optical properties of these hybrid films. According to previous reports [40,41], the bandgap energies of vanadium oxides O2p–V3d were equal to 2.0–2.6 eV. Therefore, the calculated Eg values in the range 3.05–3.20 eV would not affect the absorption of films formed in our electrolyte after 2 min with shorter processing, whereas the entrapment of vanadium oxides in thicker films with Eg = 2.98–3.1 eV could have been a factor. Another factor capable of distorting the true Eg value of our films according to the diffuse reflectance spectral analysis via the Tauc approach is the Al layer remaining under the film capable of absorbing 1.5 eV energy [42]. To avoid this, we anodized 25 μm thick Al foil and analyzed the obtained transmission spectra before and after film calcination at 950 °C for 2 h (Figure 9). It is worth noting that the calculated Eg value for this and the Al substrate film grown at 80 V for 1 h showed quite a similar Eg value of 1.78 eV for the direct forbidden transition. However, the calcination of aluminum oxide/carbon hybrid material in air increased Eg by 1.2–1.35 eV (see Figure 9).

4. Conclusions

The anodic behavior of aluminum in aqueous solutions of formic and/or vanadic acid electrolytes was studied. A complete change in anodic behavior of Al from the intense and uneven surface oxidation/etching in HCOOH and barrier-type film formation in HVO3 to the formation of a thick and nanoporous film in the mixed solution was observed. The optimal composition of the solution and anodization conditions were established on the basis of the ia(t) transience and the corresponding film morphology. These investigations revealed the incorporation of a low content of vanadium species in the V5+, V4+, and V3+ states and large amounts of carbonaceous species into the oxide framework, ca. up to 17 at.%, regardless of anodizing potential value within the 60 to 100 V range. This, in turn, led to the formation of a black anodic film with an atypically low bandgap value of 1.78 eV and the capability to absorb visible light. The XPS and Auger electron spectroscopy investigations indicated the inclusion of carbonaceous species in two different C–C bond hybridization states. The D parameter calculated from the differentiated dC/dE versus kinetic energy plots for various Ea samples on their surface side was determined to be approximately 12.8–14.0 eV, implying a diamond-like carbon nature. In contrast, the carbon Auger KVV spectra acquired with a low-energy electron beam (3 keV) revealed D = 20.4 eV, indicative of the presence of graphene. However, additional experiments are required to precisely establish the ratio of entrapped sp2/sp3 carbon species with the BE range 284.49–284.6 eV, characteristic of C1s diamond and graphitic states using synchrotron radiation. The cost-effective and straightforward method reported herein for alumina/carbon composite film formation with a surprisingly low bandgap opens new horizons for their application as microwave absorbers and materials for invisible devices.

Author Contributions

A.J., supervision, conceptualization, and writing—original draft; V.K., methodology, investigation, data curation, software, and validation; K.C., investigation and writing—review and editing; V.J., investigation and visualization. All authors have read and agreed to the published version of the manuscript.

Funding

This research received no external funding.

Institutional Review Board Statement

Not applicable.

Informed Consent Statement

Informed consent was obtained from all subjects involved in the study.

Data Availability Statement

Not applicable.

Acknowledgments

The authors are sincerely grateful to Arnas Naujokaitis for SEM and EDS observations and to Alfonsas Rėza for help with ellipsometry experiments.

Conflicts of Interest

The authors declare no conflict of interest.

References

  1. Ono, S.; Saito, M.; Asoh, H. Self-Ordering of Anodic Porous Alumina Formed in Organic Acid Electrolytes. Electrochim. Acta 2005, 51, 827–833. [Google Scholar] [CrossRef]
  2. Masuda, H.; Fukuda, K. Ordered metal nanohole arrays made by a two-step replication of honeycomb structures of anodic alumina. Science 1995, 268, 1466–1468. [Google Scholar] [CrossRef] [PubMed]
  3. Sulka, G.D. Highly Ordered Anodic Porous Alumina Formation by Self-Organized Anodizing. In Nanostructured Materials in Electrochemistry; Effekhari, A., Ed.; Willey-VCH: Weinheim, Germany, 2008; pp. 1–116. [Google Scholar]
  4. Thompson, G.E. Porous anodic alumina: Fabrication, characterization and applications. Thin Solid Films 1997, 297, 192–198. [Google Scholar] [CrossRef]
  5. Mardilovich, P.P.; Govyadinov, A.N.; Mukhurov, N.I. Thermo treatment of anodic alumina membranes. J. Membr. Sci. 1995, 98, 131–142. [Google Scholar] [CrossRef]
  6. O’Sullivan, J.P.; Wood, G.C. The morphology and mechanism of formation of porous anodic films on aluminium. Proc. R. Soc. Lond. Ser. A 1970, 317, 511–534. [Google Scholar]
  7. Nielsch, K.; Choi, J.; Schwirn, K.; Wehrspohn, R.B.; Gosele, U. Self-ordering Regimes of Porous Alumina:  The 10 Porosity Rule. Nano Lett. 2002, 2, 677–681. [Google Scholar] [CrossRef]
  8. Lee, W.; Ji, R.; Gosele, U.; Nielsch, K. Fast fabrication of long-range ordered porous alumina membranes by hard anodization. Nat. Mater. 2006, 5, 741–747. [Google Scholar] [CrossRef]
  9. Cheng, C.; Ngan, A.H.W. Fast fabrication of self-ordered anodic porous alumina on oriented aluminum grains by high acid concentration and high temperature anodization. Nanotechnology 2013, 24, 215602. [Google Scholar] [CrossRef]
  10. Norek, M.; Stępniovski, W.J.; Siemiaszko, D. Effect of ethylene glycol on morphology of anodic alumina prepared in hard anodization. J. Electroanal. Chem. 2016, 762, 20–28. [Google Scholar] [CrossRef]
  11. Schwirn, K.; Lee, W.; Hillebrand, R.; Steinhart, M.; Nielsch, K.; Gösele, U. Self-ordering anodic aluminum oxide formed by H2SO4 hard anodization. ACS Nano 2008, 2, 302–310. [Google Scholar] [CrossRef]
  12. Li, Y.; Ling, Z.Y.; Chen, S.S.; Wang, J.C. Fabrication of novel porous anodic alumina membranes by two-step hard anodization. Nanotechnology 2008, 19, 225604. [Google Scholar] [CrossRef] [PubMed]
  13. Li, Y.; Zheng, M.; Ma, L.; Shen, W. Fabrication of highly ordered nanoporous alumina films by stable high-field anodization. Nanotechnology 2006, 17, 5101. [Google Scholar] [CrossRef]
  14. Chernyakova, K.; Karpicz, R.; Zavadski, S.; Poklonskaya, O.; Jagminas, A.; Vrublevsky, I. Structures and fluorescence characterization of anodic alumina/carbon composite formed in tartaric acid solution. J. Lumin. 2017, 182, 233–239. [Google Scholar] [CrossRef]
  15. Jagminas, A.; Kaciulis, S.; Klimas, V.; Rėza, A.; Mickevicius, S.; Soltani, P. Fabrication of Graphene-Alumina Heterostructured Films with Nanotube Morphology. J. Phys. Chem. C 2016, 120, 9490–9497. [Google Scholar] [CrossRef]
  16. Pashchanka, M.; Schneider, J.J. Evidence for electrohydrodynamic convection as a source of spontaneous self-ordering in porous anodic alumina films. Phys. Chem. Chem. Phys. 2016, 18, 6946–6953. [Google Scholar] [CrossRef] [Green Version]
  17. Paschanka, M. Multilevel self-organization on anodized aluminium: Discovering hierarchical honeycomb structures from nanometre to sub-millimetre scale. Phys. Chem. Chem. Phys. 2020, 22, 15867–15875. [Google Scholar] [CrossRef]
  18. Ralston, K.D.; Chrisanti, S.; Young, T.L.; Buchheita, R.G. Corrosion Inhibition of Aluminum Alloy 2024-T3 by Aqueous Vanadium Species. J. Electrochem. Soc. 2008, 155, C350–C359. [Google Scholar] [CrossRef]
  19. Liu, S.; Thompson, G.E.; Skeldon, P. Vanadate post-treatments of anodised aluminium and AA 2024 T3 alloy for corrosion protection. Trans. Inst. Met. Finish. 2018, 96, 137–144. [Google Scholar] [CrossRef] [Green Version]
  20. Lemerle, J.; Nejem, L.; Lefebvre, J. Condensation process in polyvanadic acid solutions. J. Inorg. Nucl. Chem. 1980, 42, 17. [Google Scholar] [CrossRef]
  21. Ifezue, D. Certified reference materials for quantification of vanadate species in anodic alumina Rf-GDOES depth profiles. J. Anal. At. Spectrom. 2013, 28, 1311–1319. [Google Scholar] [CrossRef]
  22. Tajima, S. Luminescence, breakdown and colouring of anodic oxide films on aluminium. Electrochim. Acta 1977, 22, 995. [Google Scholar] [CrossRef]
  23. Fukushima, T.; Fukuda, Y.; Ito, G.; Sato, Y. Anodic Oxidation and Local Corrosion of Aluminum in Mono-carboxylic Acids. J. Met. Finish. Soc. Jpn. 1970, 21, 319. [Google Scholar] [CrossRef]
  24. Noguchi, H.; Yoshimura, C. Effect of Fluoride on Anodization of Aluminum in Mono-Carboxylic Acid Baths. J. Met. Finish. Soc. Jpn. 1987, 38, 133. [Google Scholar] [CrossRef]
  25. Pashchanka, M.; Schneider, J.J. Origin of self-organisation in porous anodic alumina films derived from analogy with Rayleigh–Bénard convection cells. J. Mater. Chem. 2011, 21, 18761. [Google Scholar] [CrossRef]
  26. Moshfegh, A.Z.; Ignatiev, A. Formation and characterization of thin film vanadium oxides: Auger electron spectroscopy, X-ray photoelectron spectroscopy, X-ray diffraction, scanning electron microscopy, and optical reflectance studies. Thin Solid Films 1991, 198, 251–268. [Google Scholar] [CrossRef]
  27. Aerts, T.; De Graeve, I.; Terryn, H. Study of initiation and development of local burning phenomena during anodizing of aluminium under controlled conversion. Electrochim. Acta 2008, 54, 270. [Google Scholar] [CrossRef]
  28. Lee, W.; Park, S.J. Porous Anodic Aluminum Oxide: Anodization and Templated Synthesis of Functional Nanostructures. Chem. Rev. 2014, 114, 7487–7555. [Google Scholar] [CrossRef]
  29. Wood, G.C.; Skeldon, P.; Thompson, G.E.; Shimizu, K. A Model for the Incorporation of Electrolyte Species into Anodic Alumina. J. Electrochem. Soc. 1996, 143, 74–83. [Google Scholar] [CrossRef]
  30. Silversmit, G.; Depla, D.; Poelman, H.; Marin, G.B.; De Gryse, R. Determination of V2p XPS binding energies for different vanadium oxidation states (V5+ to V0+)’. J. Electron Spectrosc. Relat. Phenom. 2004, 135, 167. [Google Scholar] [CrossRef]
  31. Biesinger, M.C.; Lau, L.W.M.; Gerson, A.R.; Smart, R.S.C. Resolving Surface Chemical States in XPS Analysis of First Row Transition Metals, Oxides and Hydroxides: Sc, Ti, V., Cu and Zn. Appl. Surf. Sci. 2010, 257, 887. [Google Scholar] [CrossRef]
  32. Kaciulis, S. Spectroscopy of Carbon: From Diamond to Nitride Films. Surf. Interface Anal. 2012, 44, 1155–1161. [Google Scholar] [CrossRef]
  33. Mezzi, A.; Kaciulis, S. Surface Investigations of Carbon Films: From Diamond to Graphite. Surf. Interface Anal. 2010, 42, 1082–1084. [Google Scholar] [CrossRef]
  34. Mizokawa, Y.; Miyasato, T.; Nakamura, S.; Geib, K.M.; Wilmsen, C.W. Comparison of the CKLL first-derivative auger spectra from XPS and AES using diamond, graphite, SiC and diamond-like-carbon films. Surf. Sci. 1987, 182, 431–438. [Google Scholar] [CrossRef]
  35. Chu, S.Z.; Wada, K.; Inoue, S.; Isogai, M.; Katsuta, Y.; Yasumori, A. Large-Scale Fabrication of Ordered Nanoporous Alumina Films with Arbitrary Pore Intervals by Critical-Potential Anodization. J. Electrochem. Soc. 2006, 153, B384–B391. [Google Scholar] [CrossRef]
  36. Shamala, K.S.; Murthy, L.C.S.; Narasimha Rao, K. Studies on optical and dielectric properties of Al2O3 thin films prepared by electron beam evaporation and spray pyrolysis method. Mater. Sci. Eng. B 2004, 106, 269–274. [Google Scholar] [CrossRef] [Green Version]
  37. Reddy, P.R.; Ajith, K.M.; Udayashankar, N.K. Optical and mechanical studies on freestanding amorphous anodic porous alumina formed in oxalic and sulphuric acid. Appl. Phys. A 2018, 124, 765. [Google Scholar] [CrossRef]
  38. Wang, J.; Wang, C.W.; Li, Y.; Liu, W.M. Optical constants of anodic aluminum oxide films formed in oxalic acid solution. Thin Solid Films 2008, 516, 7689–7694. [Google Scholar] [CrossRef]
  39. Yan, H.; Lemmens, P.; Wulferding, D.; Shi, J.; Becker, K.D.; Lin, C.; Lak, A.; Schilling, M. Tailoring defect structure and optical absorption of porous anodic aluminum oxide membranes. Mat. Chem. Phys. 2012, 135, 206–211. [Google Scholar] [CrossRef]
  40. Ramana, C.V.; Smith, R.J.; Hussain, O.M.; Chusuei, C.C.; Julien, C.M. Correlation between growth conditions, microstructure, and optical properties in pulsed-laser-deposited V2O5 thin films. Chem. Mater. 2005, 17, 1213–1219. [Google Scholar] [CrossRef]
  41. Bullot, J.; Cordier, P.; Gallais, O.; Gauthier, M.; Babonneau, F. Thin layers deposited from V2O5 gels: II. An optical absorption study. J. Non-Cryst. Solids 1984, 68, 135–146. [Google Scholar] [CrossRef]
  42. Rakić, A.D. Algorithm for the determination of intrinsic optical constants of metal films: Application to aluminum. Appl. Opt. 1995, 34, 4755–4767. [Google Scholar] [CrossRef] [PubMed]
Figure 1. Variations in current transience (a) and Al anodizing voltage (b) with processing time at the indicated voltage (a) and current density (b) values in 0.2 mol·L−1 NaVO3, pH 7.1. (c) Typical voltage–current plot for 0.2 mol·L−1 NaVO3 slightly alkaline (pH 8.4) solution.
Materials 15 02700 g001
Figure 2. (a) Ea vs. t plots for 1.0 mol·L−1 formic acid solution containing 0 (1), 0.01 (2), 0.05 (3), and 0.2 mol·L−1 NaVO3 at a pH 2.6, 20 °C, and ia = 5 mA·cm−1. (b) Same as (a) at a current density of 0.5 mA·cm−2 in a solution containing 0.25 mol·L−1 NaVO3 without (1) and with 0.1 (2) or 1.0 mol·L−1 (3,4) NaCO2H at 20 °C; pH 8.4 (1–3) and 2.7 (4). (c) ia(t) plots in 1.0 mol·L−1 CO2H2 + NaCO2H solution showing the influence of adding (1) 0, (2) 0.05, and (3) 0.2 mol·L−1 NaVO3; pH 2.6, 20 °C, Ea = 37 V.
Materials 15 02700 g002
Figure 3. Top-side (a,d), back-side (b,e), and cross-sectional (c,f) SEM images of anodic film formed from Al anodization in a solution containing 0.8 mol·L−1 HCOOH and 0.2 mol·L−1 NaVO3 (pH 2.7; 20 °C) at 60 V (ac) and 80 V (df) for 1 h.
Materials 15 02700 g003
Figure 4. Deconvoluted V2p3/2 XPS spectra of vanadium species entrapped inside the films fabricated by Al anodization in a solution containing 0.2 mol·L−1 NaVO3 and 0.8 mol·L−1 HCOOH (pH 2.5) at Ea values of (a) 60, (b) 80, and (c) 100 V for 60 min.
Materials 15 02700 g004
Figure 5. Deconvoluted C1s XPS spectra of carbonaceous species entrapped inside the films fabricated by Al anodization at Ea values of 60 (a), 80 (b), and 100 (c) V for 60 min.
Materials 15 02700 g005
Figure 6. Variation of TG curve (1) and ionic currents of CO2 (2) and CO species (3) during calcination of ~42 μm thick aluminum anodic film in an argon atmosphere up to 1000 °C and then in synthetic air up to 1000 °C for the burning of remaining carbon to CO2 (plot 4, × 10). The anodic film was formed at 80 V for 1 h as in Figure 3.
Materials 15 02700 g006
Figure 7. Cross-sectional image of AAO/carbon composite film (a) and EDS mapping of aluminum (b), carbon (c), and oxygen (d) elements. (e) Cross-sectional distribution curves of oxygen, aluminum, and carbon elements in the film formed as in Figure 3 at 80 V.
Materials 15 02700 g007
Figure 8. Diffuse reflectance spectra (a) and corresponding Tauc plots for possible direct transitions (c) in the composite films fabricated by Al anodization in a solution containing 0.2 mol·L−1 NaVO3 and 0.8 mol·L−1 HCOOH (pH 2.67) at bath voltages of 60 (1), 80 V (2), and 100 V (3) for 1 h. (b) As in (a) for Al anodization at 80 V for 2 (1) and 5 (2) min. (c) Tauc plots for possible direct transitions in the composite films fabricated by Al anodization in the same solution at bath voltages of 60 (1), 80 (2), and 100 V (3) for 1 h, and at 80 V for 2 (4) and 5 min (5).
Materials 15 02700 g008
Figure 9. The transmission spectra (a) and calculated Tauc dependencies for direct (b) and direct forbidden transitions (c) in aluminum oxide samples obtained by Al anodization in 0.2 mol·L−1 NaVO3 + 0.8 mol·L−1 HCOOH electrolyte (pH = 2.6) at 80 V before (1) and after calcination at 950 °C for 2 h (2).
Materials 15 02700 g009
Table 1. XPS data for anodic films fabricated by Al anodization in a solution containing 0.2 mol·L−1 NaVO3 and 0.8 mol·L−1 HCOOH (pH 2.5) at the indicated bath voltages, Ea, for 60 min.
Ea, VNamePeak BEFWHM eVArea (P) CPS.eVAtomic %QSF
60V2p516.742.5225,1502.2616.330
O1s531.663.17267,78553.5112.850
C1s284.732.2830,88517.0811.000
-Al2p74.242.0428,75027.1610.574
80V2p516.892.5729,0802.4516.330
-O1s531.613.19281,96552.8012.850
-C1s284.592.1933,00517.1111.000
-Al2p74.192.0931,22527.6410.574
100V2p517.042.3429,3542.7116.330
-O1s531.703.20261,95153.7512.850
-C1s284.672.1930,49017.3111.000
-Al2p74.272.0327,04026.2310.574
Table 2. The relative proportions of vanadium species according to V2p3/2 spectrograms of the films fabricated as in Table 1.
Anodizing Voltage, VV3+V4+V5+
600.1660.5550.278
800.3530.4230.224
1000.1210.6630.215
Table 3. The relative proportions of carbon species according to C1s spectrograms of the films fabricated as in Table 1.
Anodizing Voltage, V284.49–284.60 eV
(C–C, C–H)
285.68–286.03 eV
(C–OH)
286.72–287.13 eV
(C–O)
289.01–289.12 eV
(C–OOH)
600.5720.1460.0190.263
800.5890.0700.0900.253
1000.5390.1490.0770.235
Publisher’s Note: MDPI stays neutral with regard to jurisdictional claims in published maps and institutional affiliations.

