Article

Eu-Doped Pyrochlore Crystal Nano-Powders as Fluorescent Solid for Fingerprint Visualization and for Anti-Counterfeiting Applications

1
Laboratory of Inorganic Chemistry, Faculty of Sciences of Sfax, Sfax University, Sfax 3018, Tunisia
2
Laboratory of Dielectric and Photonic Materials, Faculty of Sciences of Sfax, Sfax University, Sfax 3018, Tunisia
3
Dipartimento di Fisica, Università di Pisa, Largo B. Pontecorvo 3, I-56127 Pisa, Italy
4
Istituto Nanoscienze CNR, Piazza San Silvestro 12, I-56127 Pisa, Italy
5
Istituto Nazionale di Fisica Nucleare-Sezione di Pisa, Largo B. Pontecorvo 3, I-56127 Pisa, Italy
*
Author to whom correspondence should be addressed.
Materials 2022, 15(7), 2423; https://doi.org/10.3390/ma15072423
Submission received: 16 February 2022 / Revised: 12 March 2022 / Accepted: 22 March 2022 / Published: 25 March 2022
(This article belongs to the Section Advanced Nanomaterials and Nanotechnology)

Abstract

:
Undoped Y2Sn2O7 and Eu3+ doped Y2Sn2O7 samples with doping concentrations 7%, 8%, 9%, and 10% are successfully synthesized by the co-precipitation method. A complete structural, morphological, and spectroscopic characterization is carried out. XRD measurements reveal that samples crystallize in the pure single pyrochlore phase and Eu3+ ions occupy sites with D3d symmetry. After mechanical grinding, the average crystallite size is less than 100 nm for all compositions. Optical characterization shows emission from the 5D0 level towards the lower lying 7F0,1,2,3,4 levels. The CIE color coordinates of all the pyrochlore phosphors are very close to those of the ideal red light. For the visualization of latent fingerprints, different surfaces are tested, including difficult ones (wood and ceramic), with excellent results. All three levels of fingerprint ridge patterns are visualized: core (Level 1), bifurcation and termination (Level 2), and sweat pores (Level 3). Moreover, our nano-powders are used to prepare a stable fluorescent ink.

1. Introduction

Fingerprints are valuable information in forensic science because they provide unique and immutable features for human identification [1]. However, at crime scenes fingerprints are not apparent to the naked eye. For this reason, they are called latent fingerprints (LFPs) and need to be made sufficiently visible with specific techniques [2] like single-metal deposition methods [3], fuming, and powder-dusting techniques [4,5,6]. The details that form the ridge pattern are called loops, arches, and whorls and are organized in different levels. While it is easy to detect the first and the second level ridge details, the third level is quite difficult to be identified, especially on some difficult surfaces like wood and ceramic, and this makes the pattern recognition more difficult and time consuming [7,8,9,10]. Moreover, traditional methods for developing fingerprints have some drawbacks, especially low detection efficiency and high toxicity and very few of them permit the visualization of the third level, i.e., sweat pores.
Among the various methods, power dusting is one of the most used thanks to its extreme simplicity and effectiveness [11]. In this case, the use of fluorescent nanoparticles greatly increases the types of surfaces from which a LFP can be detected and the level of details that can be identified. For this reason, the quest for new materials that can enable the efficient visualization of LFPs is still lively. For example, quantum dots have been proposed as fluorescent powders [12]. They show a good contrast, high selectivity, and sensitivity, but they have relatively high toxicity levels. Organic nanophosphors have some advantages in detecting the LFPs, like long luminescence lifetime, narrow emission, and large Stokes shifts [13]; however, they develop weak prints under ultraviolet light or laser light. Rare earth upconversion fluorescent nanomaterials show bright visible emission under infrared pumping and low toxicity values, but the upconversion efficiency is usually low.
Down-converting rare earth doped nanoparticles overcome this limitation. Among the Lanthanide family Europium (Eu3+), Terbium (Tb3+), Erbium (Er3+), Dysprosium (Dy3+), Ytterbium (Yb3+), and Praseodymium (Pr3+) ions have been identified as the most effective down-converting materials that convert ultraviolet light to visible emission and have been proposed for fingerprint visualization. Moreover, pyrochlore nanoparticles, having the chemical compositions of A2B2O7 [14] doped with lanthanide ions, are one of the most promising powder materials to enhance the development of the LFPs due to their high fluorescence capability, chemical stability, and ease of production in nanometric size [15,16]. These crystal nano-powders are expected to work particularly well on raw surfaces such as household woodwork and multi-colored non-porous items where traditional methods are not so efficient. Among the rare earth ions, Europium in Y2Sn2O7 can generate intense red emission under UV excitation [17,18,19] and has already been proposed as an excellent phosphor for while light LED emission [20], display devices [21], and radioluminescence detection [22]. In this work we analyzed the possibility of using Eu-doped pyrochlores for fingerprint detection as well as for the production of luminescent inks.

2. Materials and Methods

2.1. Synthesis of Phosphor Samples

Undoped Y2Sn2O7 and Eu3+ doped Y2Sn2O7 samples with doping concentrations of 7%, 8%, 9%, and 10% were successfully synthesized by co-precipitation method [17] using Yttrium oxide (99.99%), Europium (III) oxide (99.99%), Tin (II) chloride dihydrate (99.99%), ethylene glycol, and chloridric acid purchased from Merck KGaA (Darmstadt, Germany). Stoichiometric amounts of SnCl2.2H2O, Eu2O3, and Y2O3 were dissolved in 1 M HCl solution and stirred for 2 h. Then, 40 mL of ethylene glycol was added and the solution was slowly heated up to 100 °C. Afterwards, 2 g of urea was added and the solution was stirred 2 h at 150 °C. After being cooled to room temperature, the precipitate was collected by centrifugation at 2500 rpm for 15 min, washed two times with acetone, and dried at room temperature. The samples thus prepared were finally calcined at 900 and 1300 °C in air at a heating rate of 10 °C per minute for 5 h. The undoped Y2Sn2O7 nanoparticles were synthesized by similar method taking only the yttrium and tin precursor.

2.2. Ball Milling

As-grown samples were ground using FRITSCH (Idar-Oberstein, Germany) Planetary Ball Milling. Samples were put in a zirconium jar with zirconium balls. Samples were ground at 500 rpm speed for 60 min including 5 min for resting.

2.3. Characterization

The phase structure of the samples was analyzed using a Panalytical Pro X’Pert MPD (40 kV, 30 mA) diffractometer (Malvern Panalytical, Malvern, United Kingdom) with a Cu Kα (λ = 1.5406 and 1.5444 Å) radiation at room temperature in the range of 10°–70° with a step size of 2θ = 0.02. The crystallographic phases were identified by comparison with the X-ray patterns of the JCPDS database. The crystallographic parameters were refined using the Rietveld-fit program FullProf [23]. The average crystallite size was calculated from the diffraction line width, based on Scherrer’s equation:
D = K λ β cos θ
where D is the crystallite size for the (hkl) plane, λ indicates the wavelength of the incident X-rays, and β is the corrected full width at half maximum in radians. Angle θ is the diffraction angle for the (hkl) plane. The error on calculated XRD crystallite size is 0.4 nm.
The hydrodynamic diameter of the powder was measured with the Dynamic Light Scattering technique (DLS) with a Zetasizer Nano series (Malvern Panalytical, Malvern, United Kingdom). Just before the measurement, the powder was dispersed into deionized water and sonicated to separate aggregates of nanoparticles. The sizing was produced in a glass cuvette with round aperture at room temperature. The average particle size was calculated from the autocorrelation function of the intensity of scattered light from the nanoparticles by Malvern Zetasizer nano software.
The morphology of the samples was observed by high resolution field emission scanning electron microscopy performed with a FEI (Hillsboro, Oregon, USA) Quanta 450 FEG system operating in low vacuum.
Photoluminescence (PL) spectra were measured at room temperature under diode laser pumping at 450 nm as an excitation source. Detection was accomplished using a compact spectrometer (AvaSpec-ULS2048L-SPU2, Avantes, Apeldoorn, The Netherlands) equipped with a 600 line/mm holographic grating and a 10 μm slit working in the 390–900 nm range with a resolution of 0.4 nm. All the spectra were corrected for the spectral response of the system using a halogen lamp as blackbody source.

3. Results

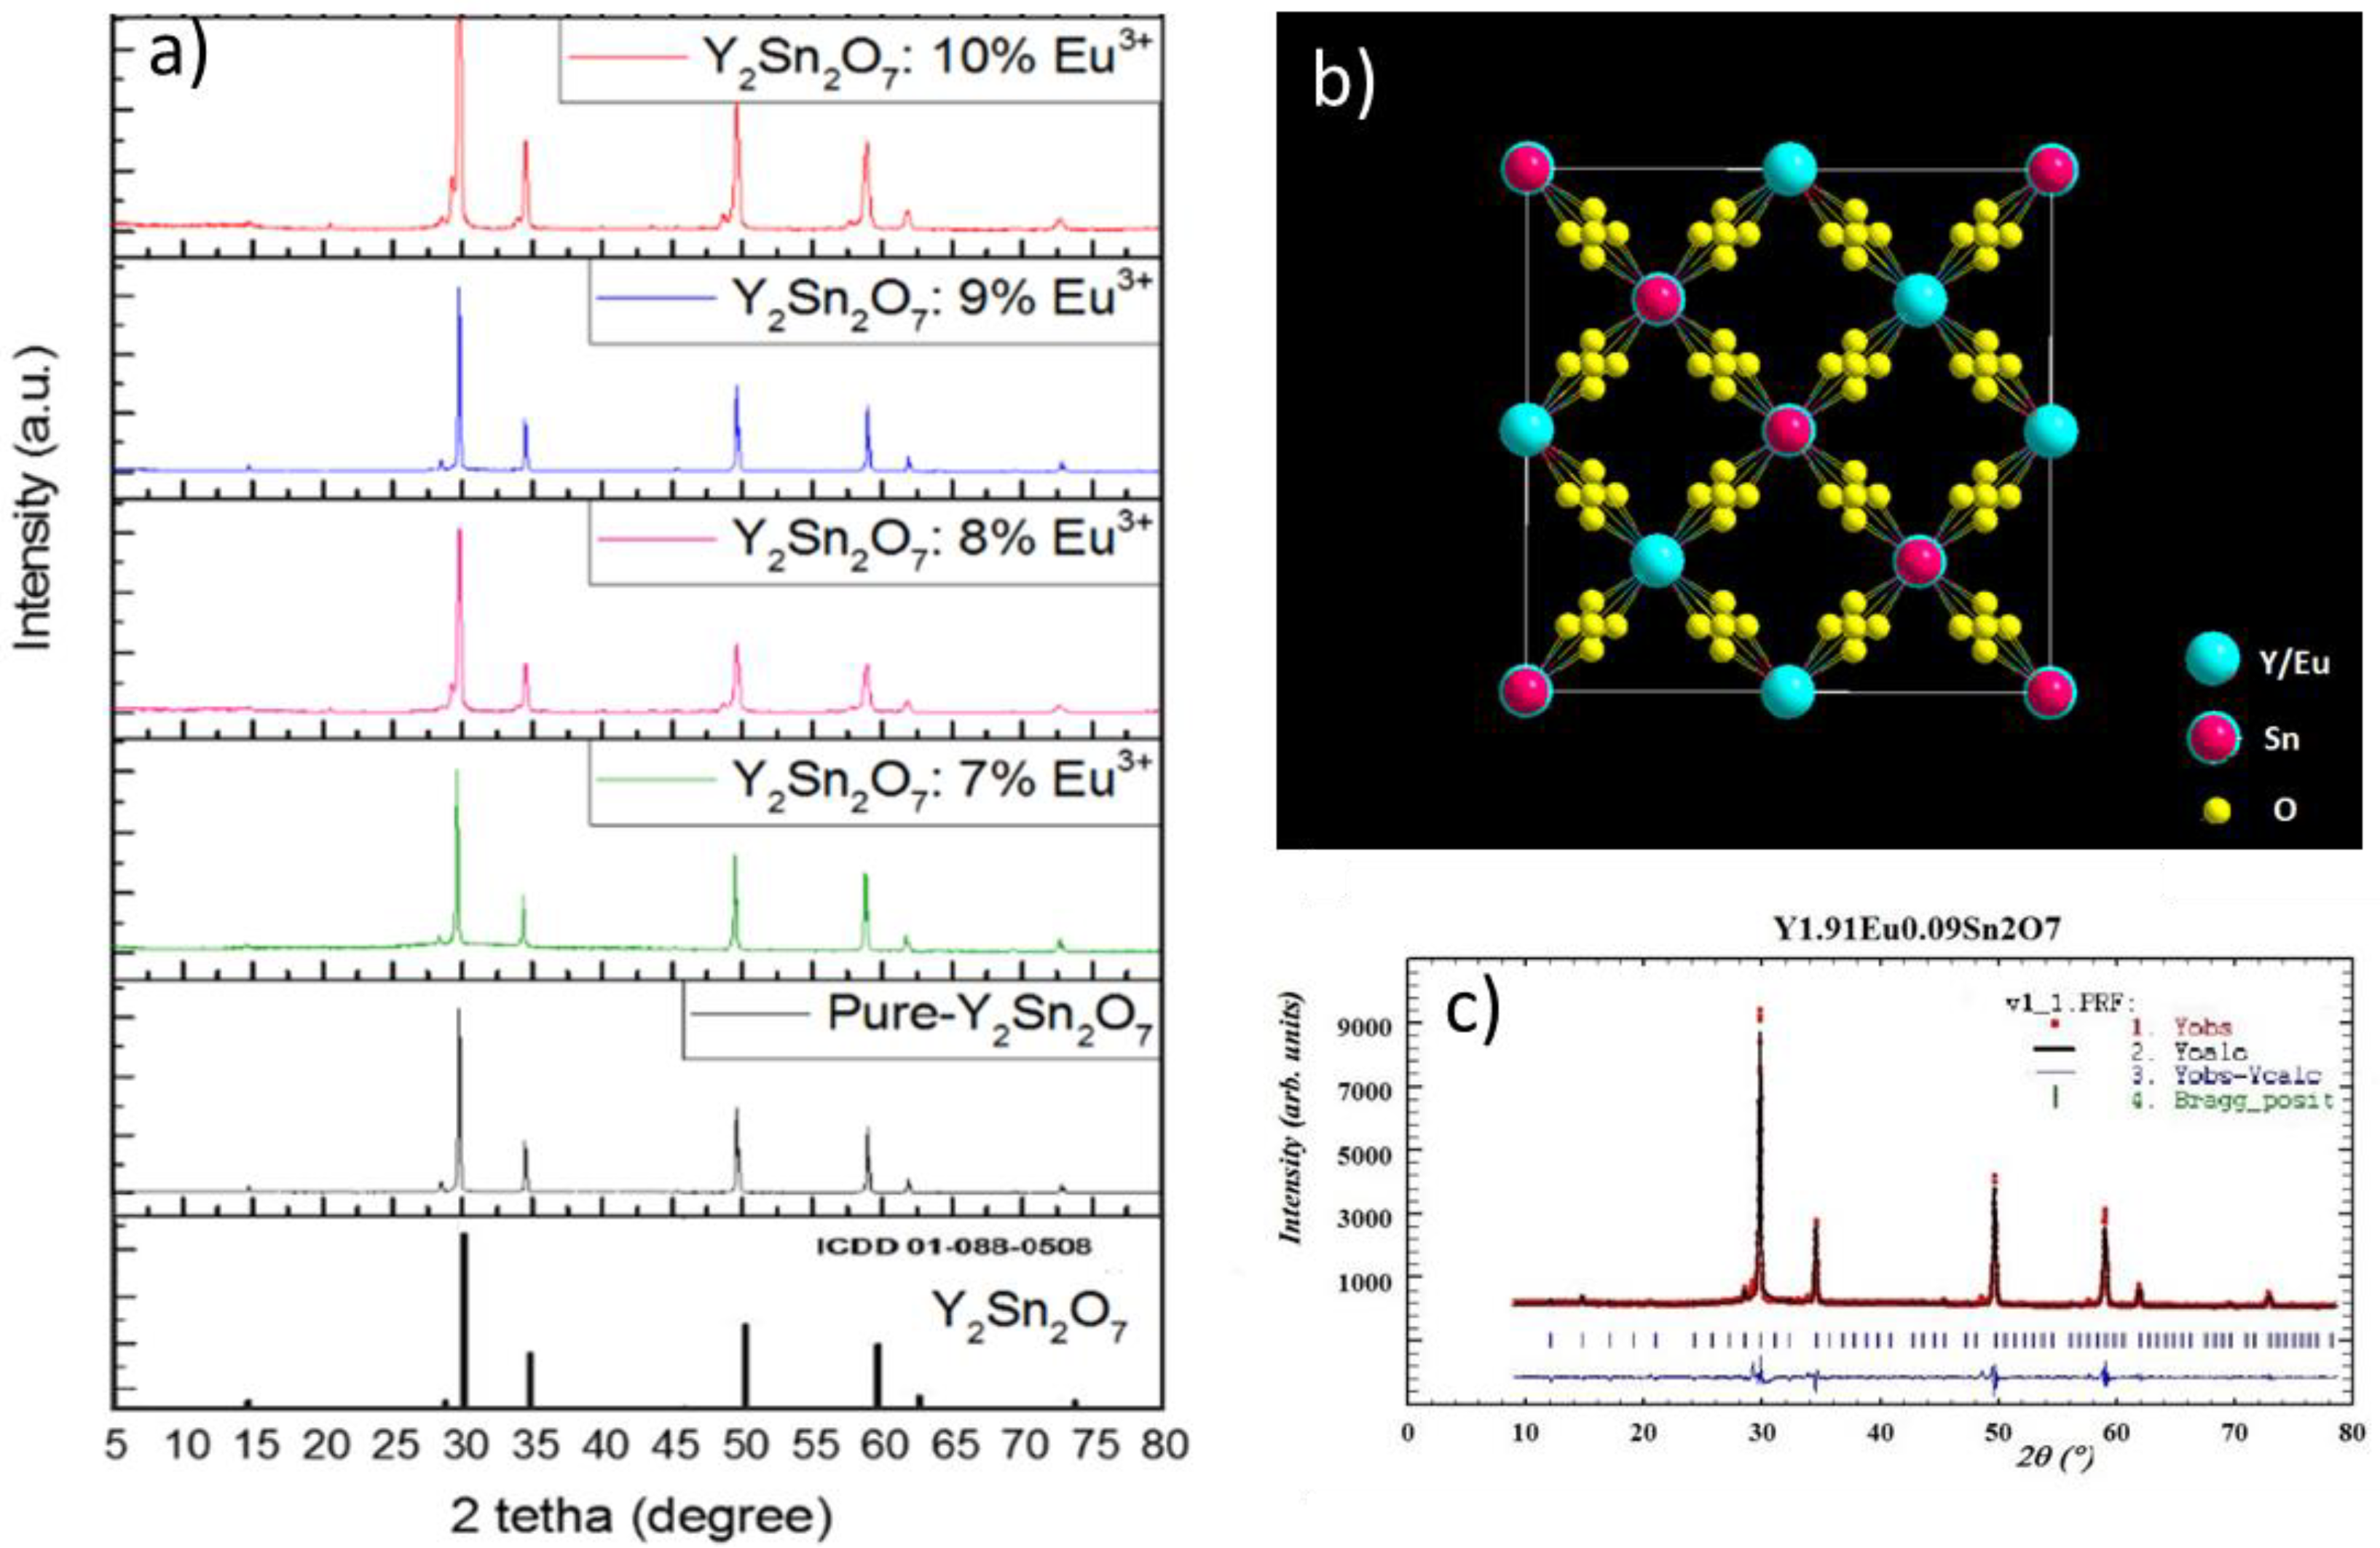
3.1. Structure of the Prepared Samples

The powder XRD patterns at room temperature of the undoped and doped Y2Sn2O7 samples are depicted in Figure 1a.
Y2Sn2O7 compounds can crystalize in the three different types of crystalline structures, pyrochlore, defect-fluorite, and monoclinic, that can be easily differentiated by XRD analysis [24]. In our case, diffraction peaks are in accordance with the Joint Committee on Powder Diffraction Standards (JCPDS) card No. 01-088-0508, as depicted in Figure 1a. According to these results, Y2Sn2O7 crystallized in pure single pyrochlore phase, and the crystal structure belongs to the cubic crystal system with the Fd-3m space group [21,24,25,26,27]. Moreover, no additional peaks of unreacted SnCl2·2H2O, Eu2O3, and Y2O3 were observed in the XRD-data, indicating that the reaction among the raw materials was complete. The incorporation of Eu3+ ions did not modify the XRD-pattern and this, together with the good fitting results, demonstrates that doping with Eu3+ does not affect the crystalline structure of the phosphor (Figure 1b). This is not unexpected because the ionic radius of the Eu3+ ions (r = 0.95 Å) is similar to that of Y3+ ions (r = 0.92 Å); therefore, Eu3+ ions can be effectively incorporated into the Y2Sn2O7 host lattice, replacing Y3+ ions without distorting the crystal structure.
The cell parameters and the atomic coordinates obtained from a least-square fitting procedure are shown in Table 1. Figure 1c shows an example of the result of the fitting procedure.
The occupancy probability of Y and Eu atoms present in Site A and the Sn atoms present in Site B was refined in such a way that the total occupancy of each site was equal to 1.0000. Five unique crystallographic positions are available in the Wyckoff notation: Y and Eu are disturbed at 16d (1/2, 1/2, 1/2) Wyckoff sites. Sn occupies a single position at 16c (0, 0, 0) Wyckoff sites and there are two positions possible for O at 48f (O) and 8b (O’), while 8a sites are vacant [21]. O’ are in an undisturbed position (3/8, 3/8, 3/8) with respect to the fluorite structure and are tetrahedrally coordinated by Y/Eu cations (Figure 1b). In contrast, O (3/8, 1/8, 1/8) are displaced toward the neighboring vacant 8a sites and are bonded to Y/Eu and Sn. The Y/Eu cations occupy an axially compressed scalenohedron coordinated by six O’ and two O atoms. The cubic crystal structure of the new compound is constructed. The second layer is constructed of one oxygen followed by one Sn atom. The Y and Eu atoms in Site A are coordinated by eight oxygen atoms while the Sn atoms in Site B show a six-fold coordination in which the oxygen atoms occupy the corners of a regular octahedron. The valence values of both cations localized in Site B were calculated from six B-O bond lengths in BO6 octahedra, according to Nigham’s work [27]. The two bond-valence with both atoms present in Site B is reported in Table 1.
From the Scherrer equation, we calculated the average crystallite size before mechanical grinding. Results are depicted in Table 2 and compared with the average crystallite size obtained with the DLS technique. The average crystallite size of the samples before grinding was found to be in between 311 and 384 nm with XRD and between 387 and 503 nm with DLS. In all cases, the DLS size is slightly larger than that measured with XRD. This is expected since DLS measures the hydrodynamic diameter that can be slightly larger than the physical dimension of the particle and that can be affected by possible aggregation of the particles.

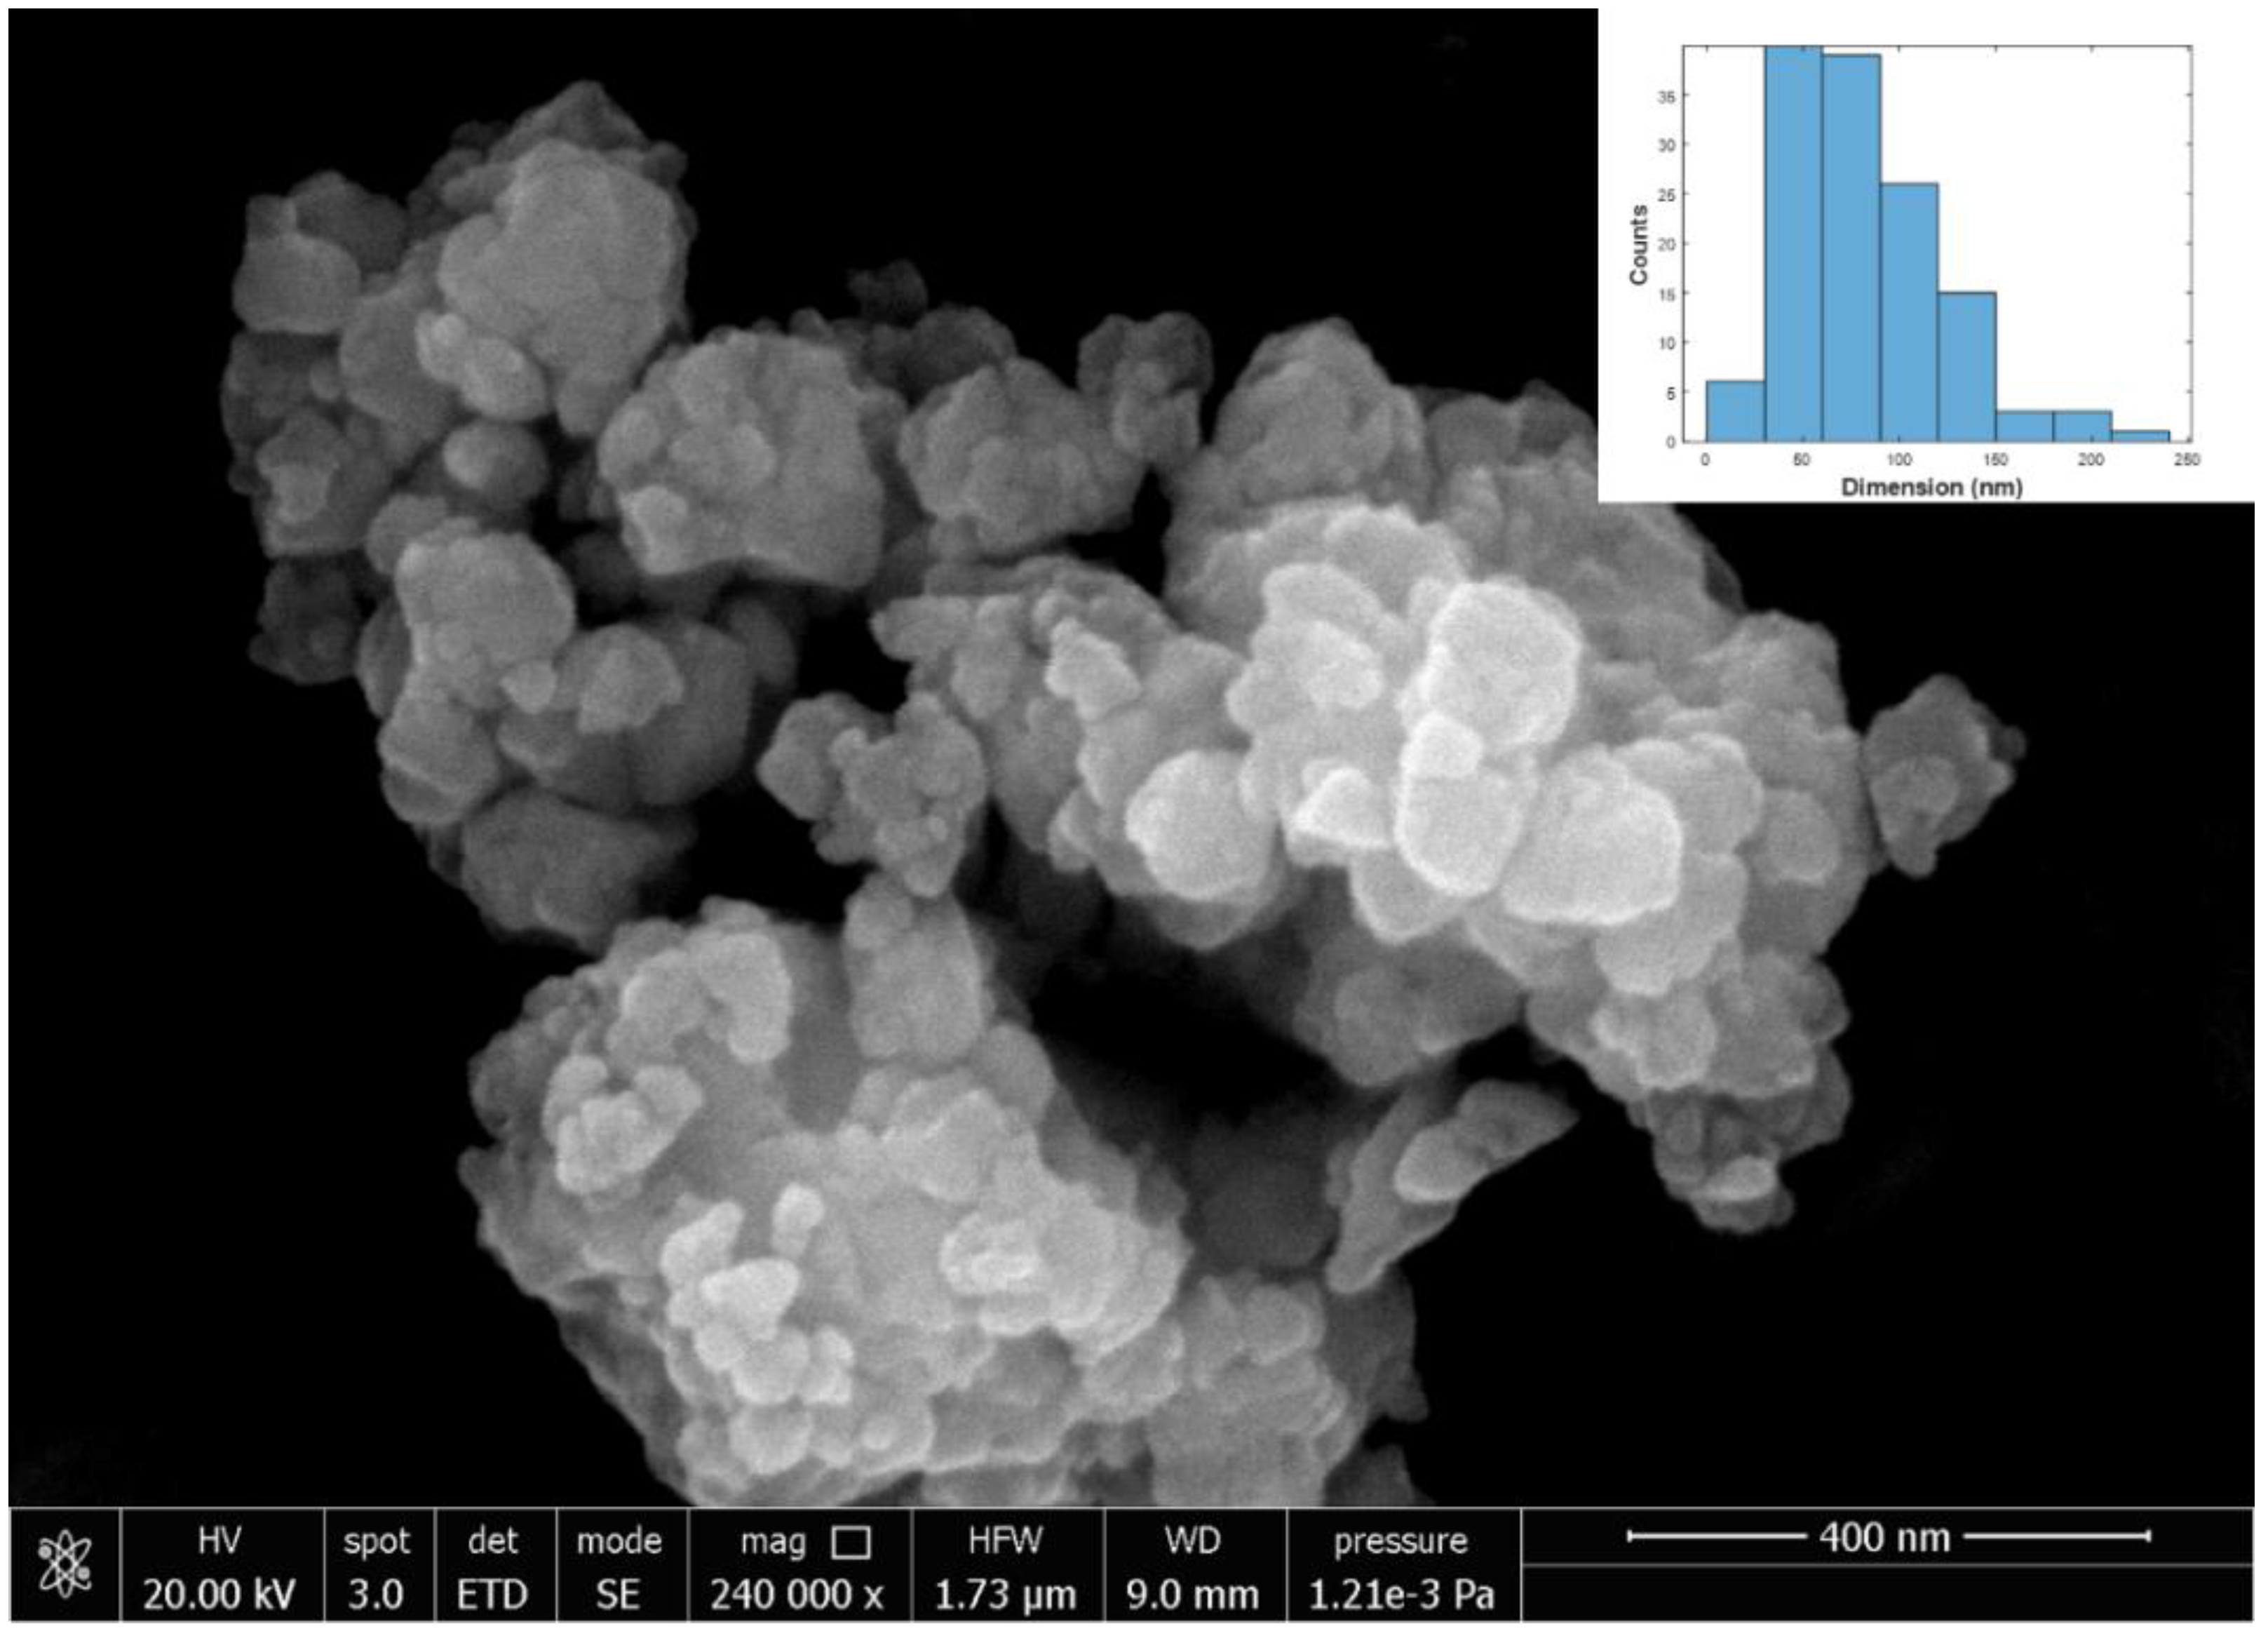
3.2. SEM Characterization

SEM analysis was performed on the samples after grinding. A representative SEM image of the ground Y2Sn2O7:10%Eu sample is shown in Figure 2 together with the corresponding histogram. The formation of very small particles with diameters below 100 nm can be clearly seen. We performed a statistical analysis on the visible particles. Table 3 shows the average mean diameter and standard deviation obtained from the image analysis of the SEM images of the various compositions after grinding. In all cases, the analysis was performed on more than 100 particles and the average diameter obtained was below 100 nm.

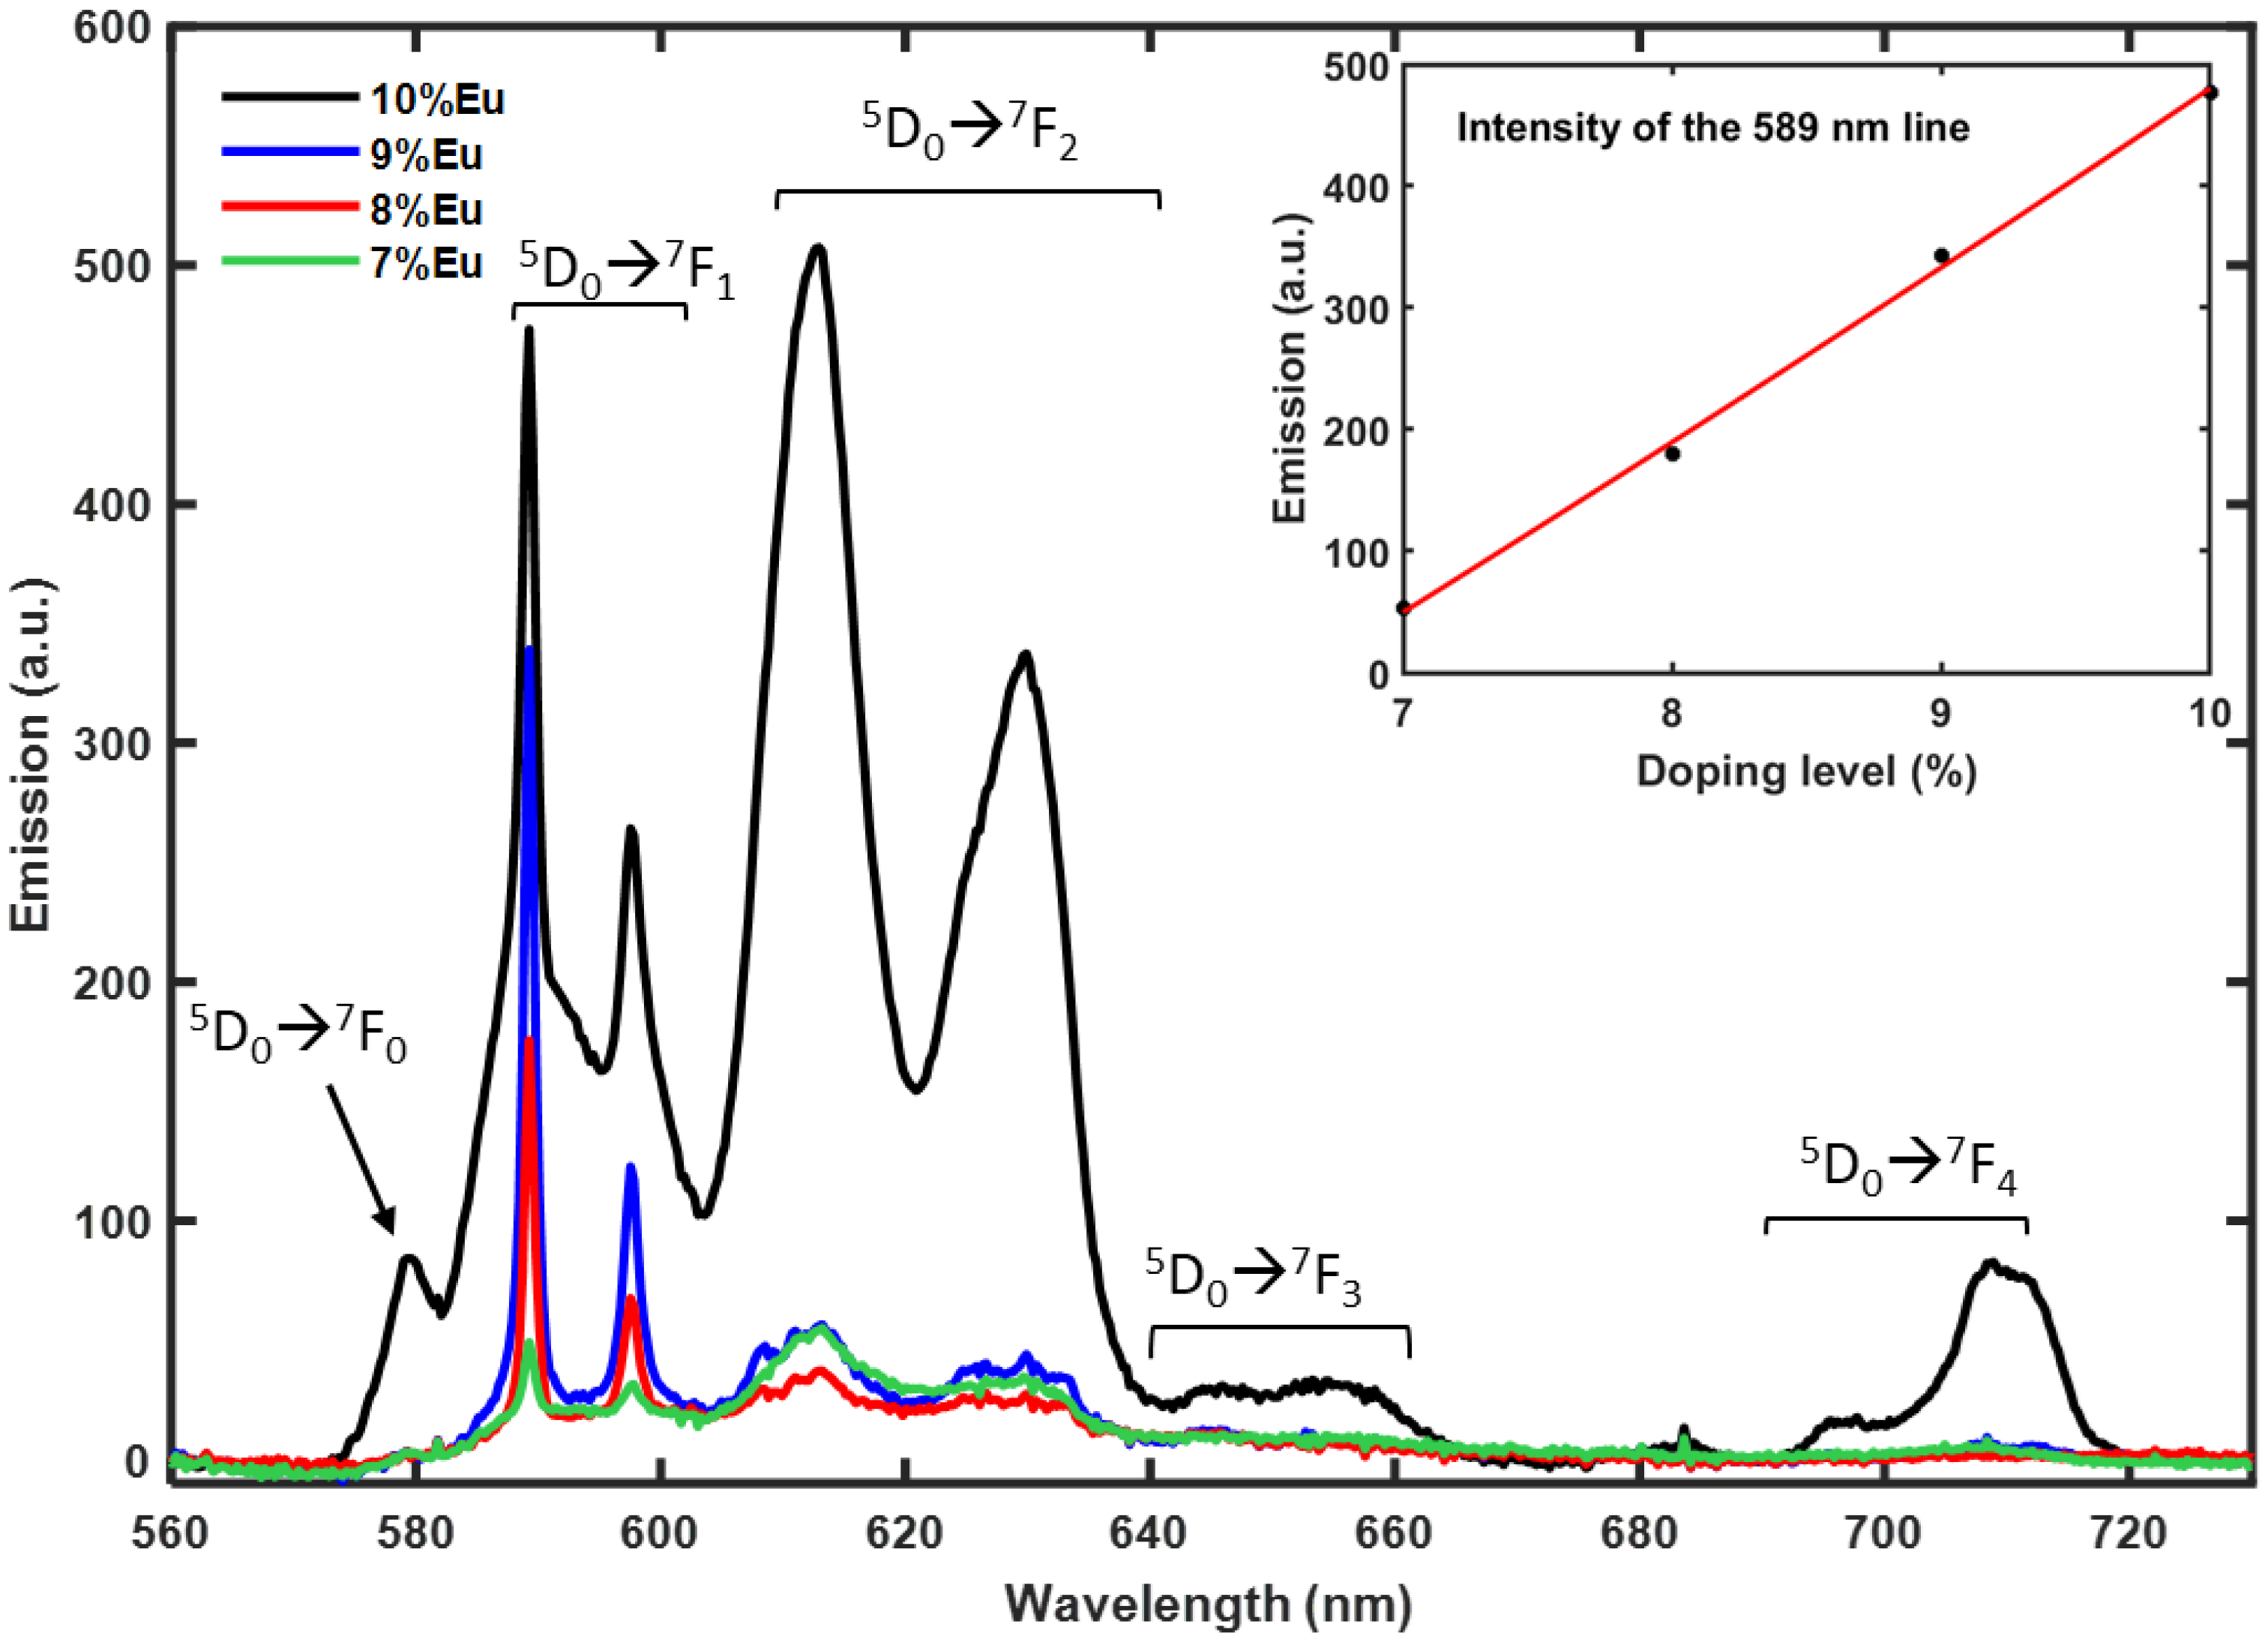
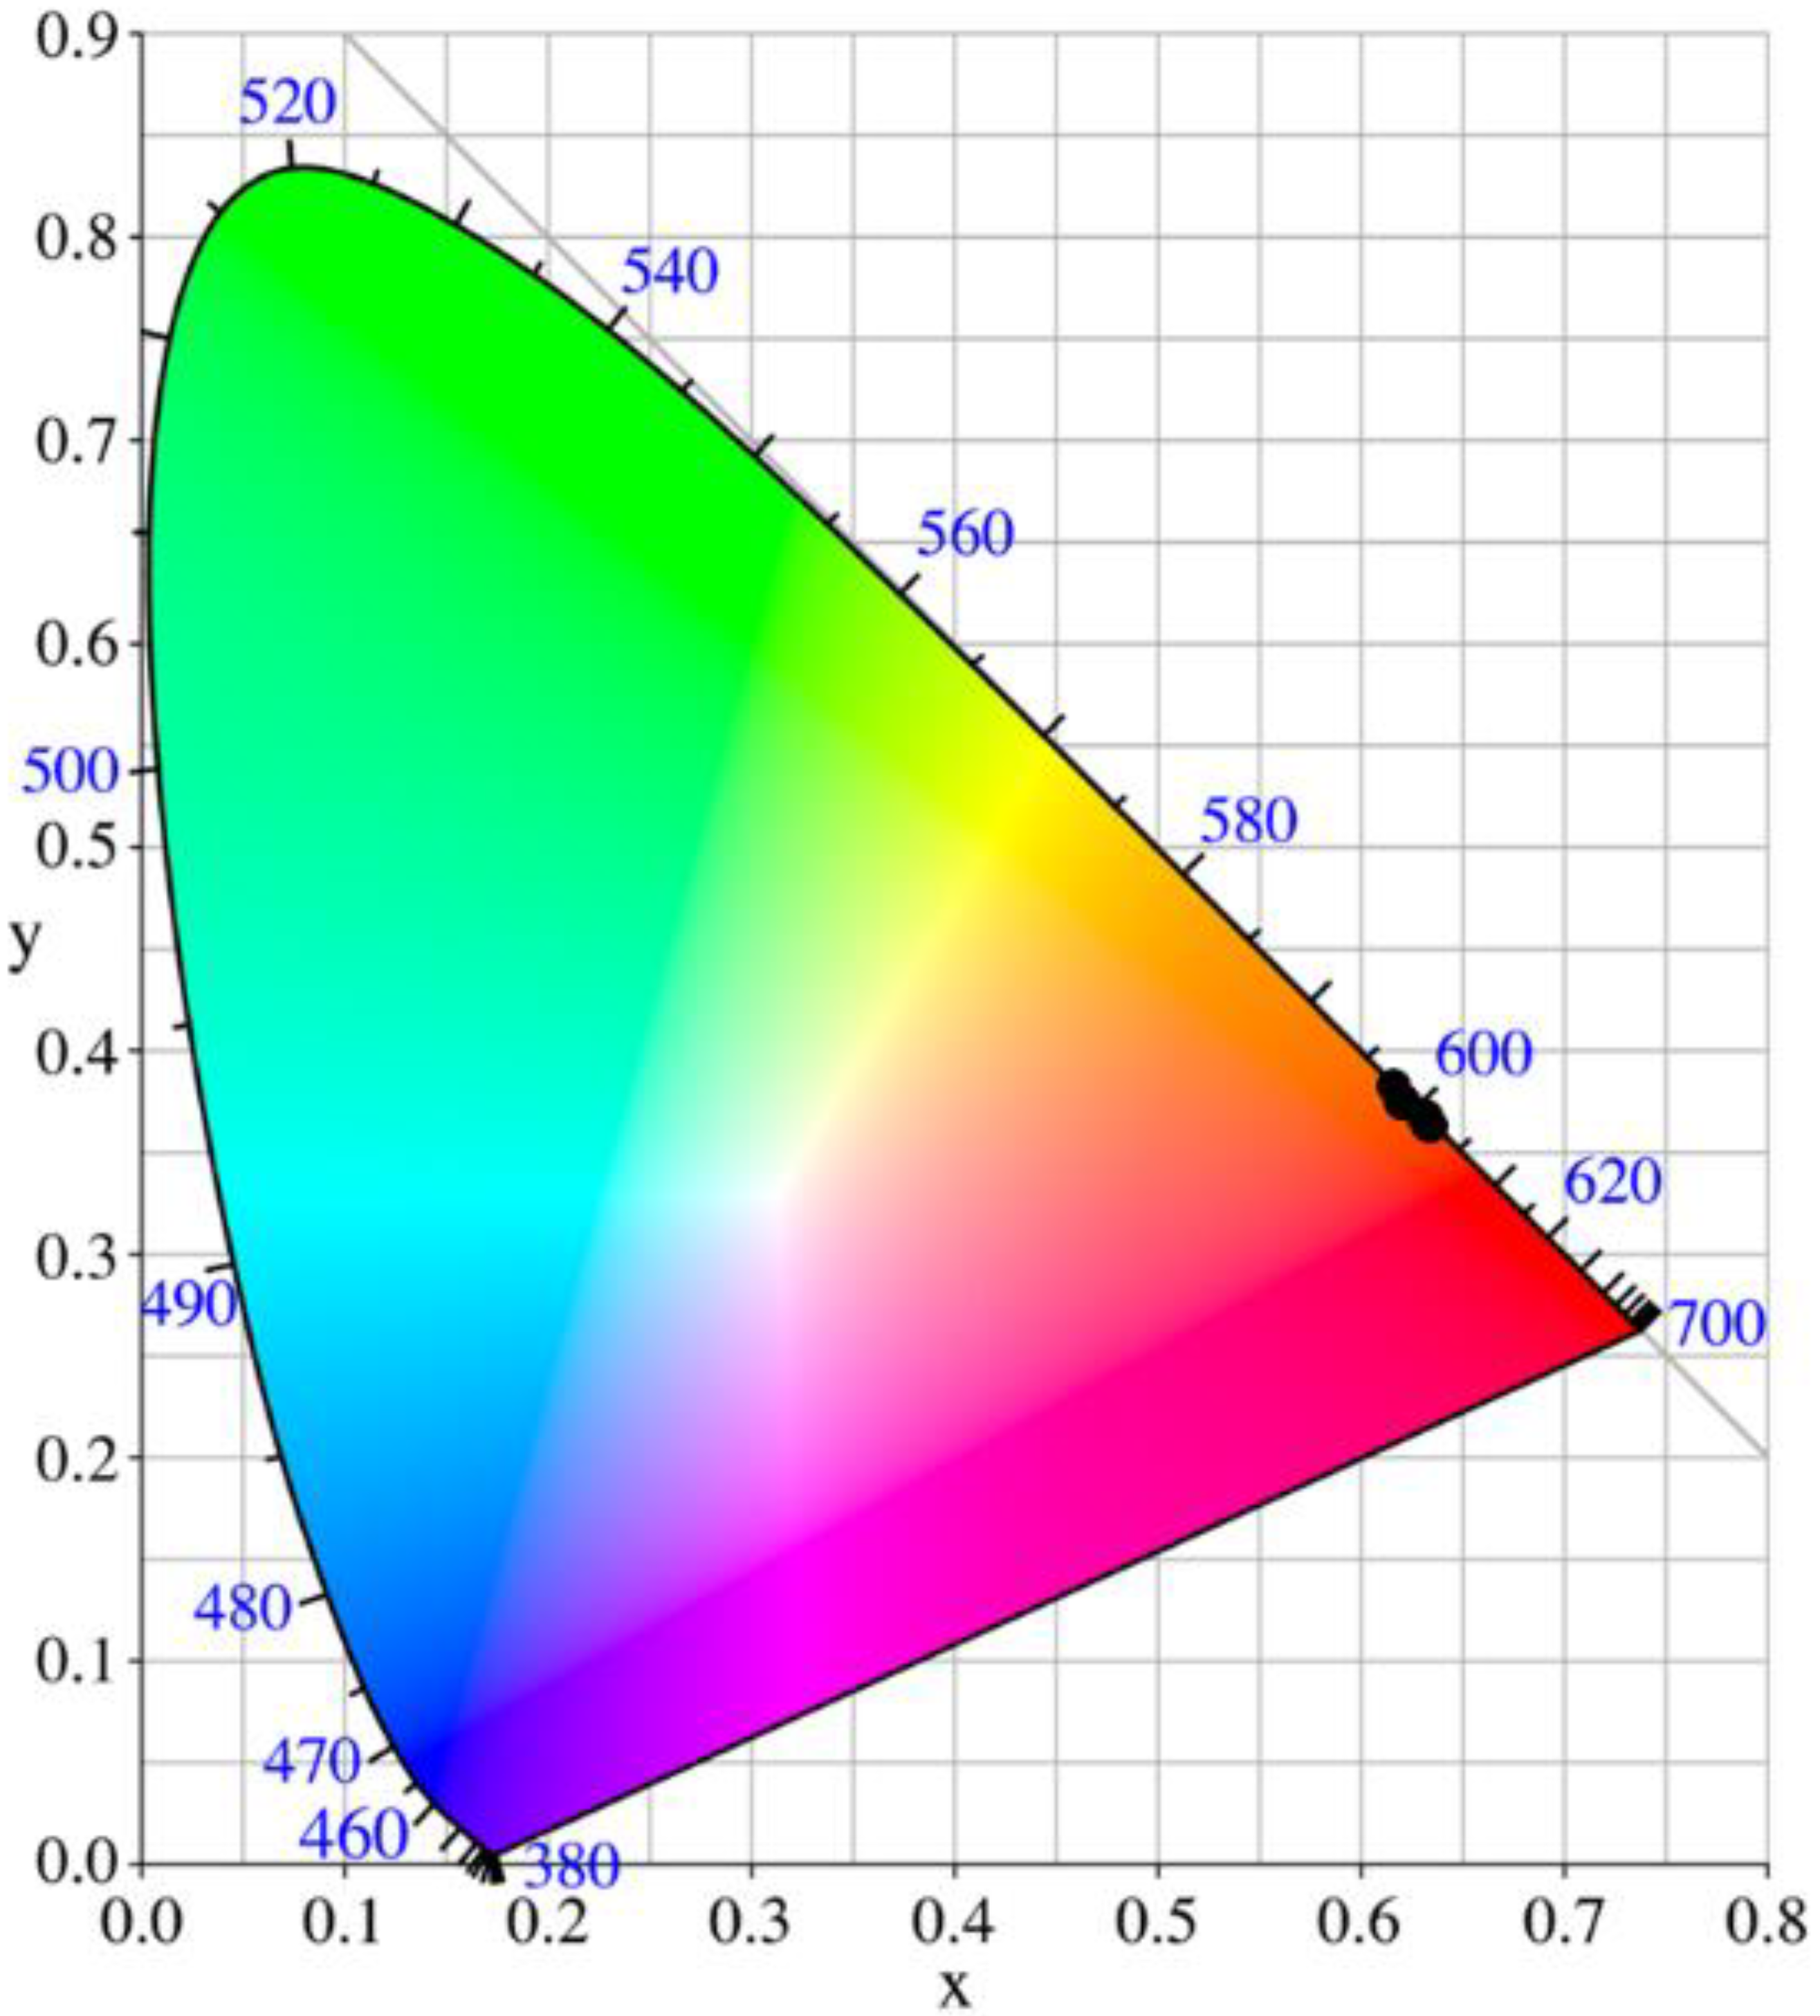
3.3. Optical Characterization

Figure 3 presents the typical room temperature photoluminescence (PL) spectra of Y2Sn2O7:x%Eu (x = 7, 8, 9, 10) nanophosphors together with the transition assignment. The measured emission spectra are in good agreement with the literature [17,19,21,28,29]. The Eu3+ emission comes from several transitions.
All emission channels start from the 5D0 level towards the lower lying 7F0,1,2,3,4 levels. Starting from high energy the first transition is the 5D0 🡢 7F0. Since both levels involved are non-degenerate, it can only give rise to one emission line, but transitions from J = 0 to J = 0 are strictly forbidden in the standard Judd-Ofelt theory. Nevertheless, the occurrence of this transition is a well-known example of the breakdown of the selection rules of the Judd–Ofelt theory due to J-mixing or to mixing of low-lying charge-transfer states into the wavefunctions of the 4f6 configuration [30], and it is usually weak in intensity. In our case it is only visible at the highest-doping level, namely 10%Eu with the appearance of a weak peak at 579 nm. The 5D0 🡢 7F1 can show up to three emission lines because the multiplicity of the 7F1 level is three, but the D3d point symmetry of the Eu site in pyrochlore structure can only split this level into two components, one of which is doubly degenerate. In fact, we only observed two emission lines at 589.3 nm and 597.5 nm. Moreover, this transition is magnetic dipole in nature, and this means that it is particularly insensible to changes of the environment. For this reason, the intensity of this transition is often considered to be constant and can be used to calibrate the intensity of Eu3+ luminescence spectra. We used this line as a probe for the luminescence behavior as a function of the doping level. The result is shown in the inset of Figure 3; the trend is linear and no hints of concentration quenching or other nonlinear energy transfer processes are visible up to the 10% Eu doping level. The 5D0 🡢 7F2 transition is a so-called “hypersensitive transition”, which means that its intensity is strongly influenced by the local symmetry of the Eu3+ ion and the nature of the ligands and this is also the reason why emission lines are broader that in the other transitions. In our case, the 10%Eu doped sample shows a very intense emission from this transition, while it is much weaker at lower doping levels. It is composed by two intense broad bands centered at 612.7 nm and 629.6 nm, one of which is probably a doublet since in D3d symmetry the 7F2 multiplet is split into three energy levels. The 5D0 🡢 7F3 can give rise to up to five lines in D3d symmetry, but this is forbidden according to the Judd–Ofelt theory; therefore, it usually produces a very weak emission, as in our case. This band extends from 640 nm to 660 nm and appears as a broad band with some small features. Finally, the 5D0 🡢 7F4 transition extends from 690 nm to 720 nm and is evident only in the 10%Eu doped sample while it is extremely weak at lower doping levels, like the 5D0 🡢 7F4 transition. This is not unexpected, because, although not formally considered hypersensitive, this transition is strongly influenced by the symmetry and chemical environment of the Eu3+ ions [30].
Color coordinates of the phosphors were calculated using The Commission Internationale de l’Eclairage (CIE) 1931 color chromaticity diagram. Figure 4 represents the CIE diagram of Y2Sn2O7:x%Eu (x = 7, 8, 9, 10) nanophosphors. The CIE color coordinates of all the pyrochlore phosphors lie in the range (0.64 ± 0.02, 0.36 ± 0.02), which is very close to that of the ideal red light (0.67, 0.33) [31,32].

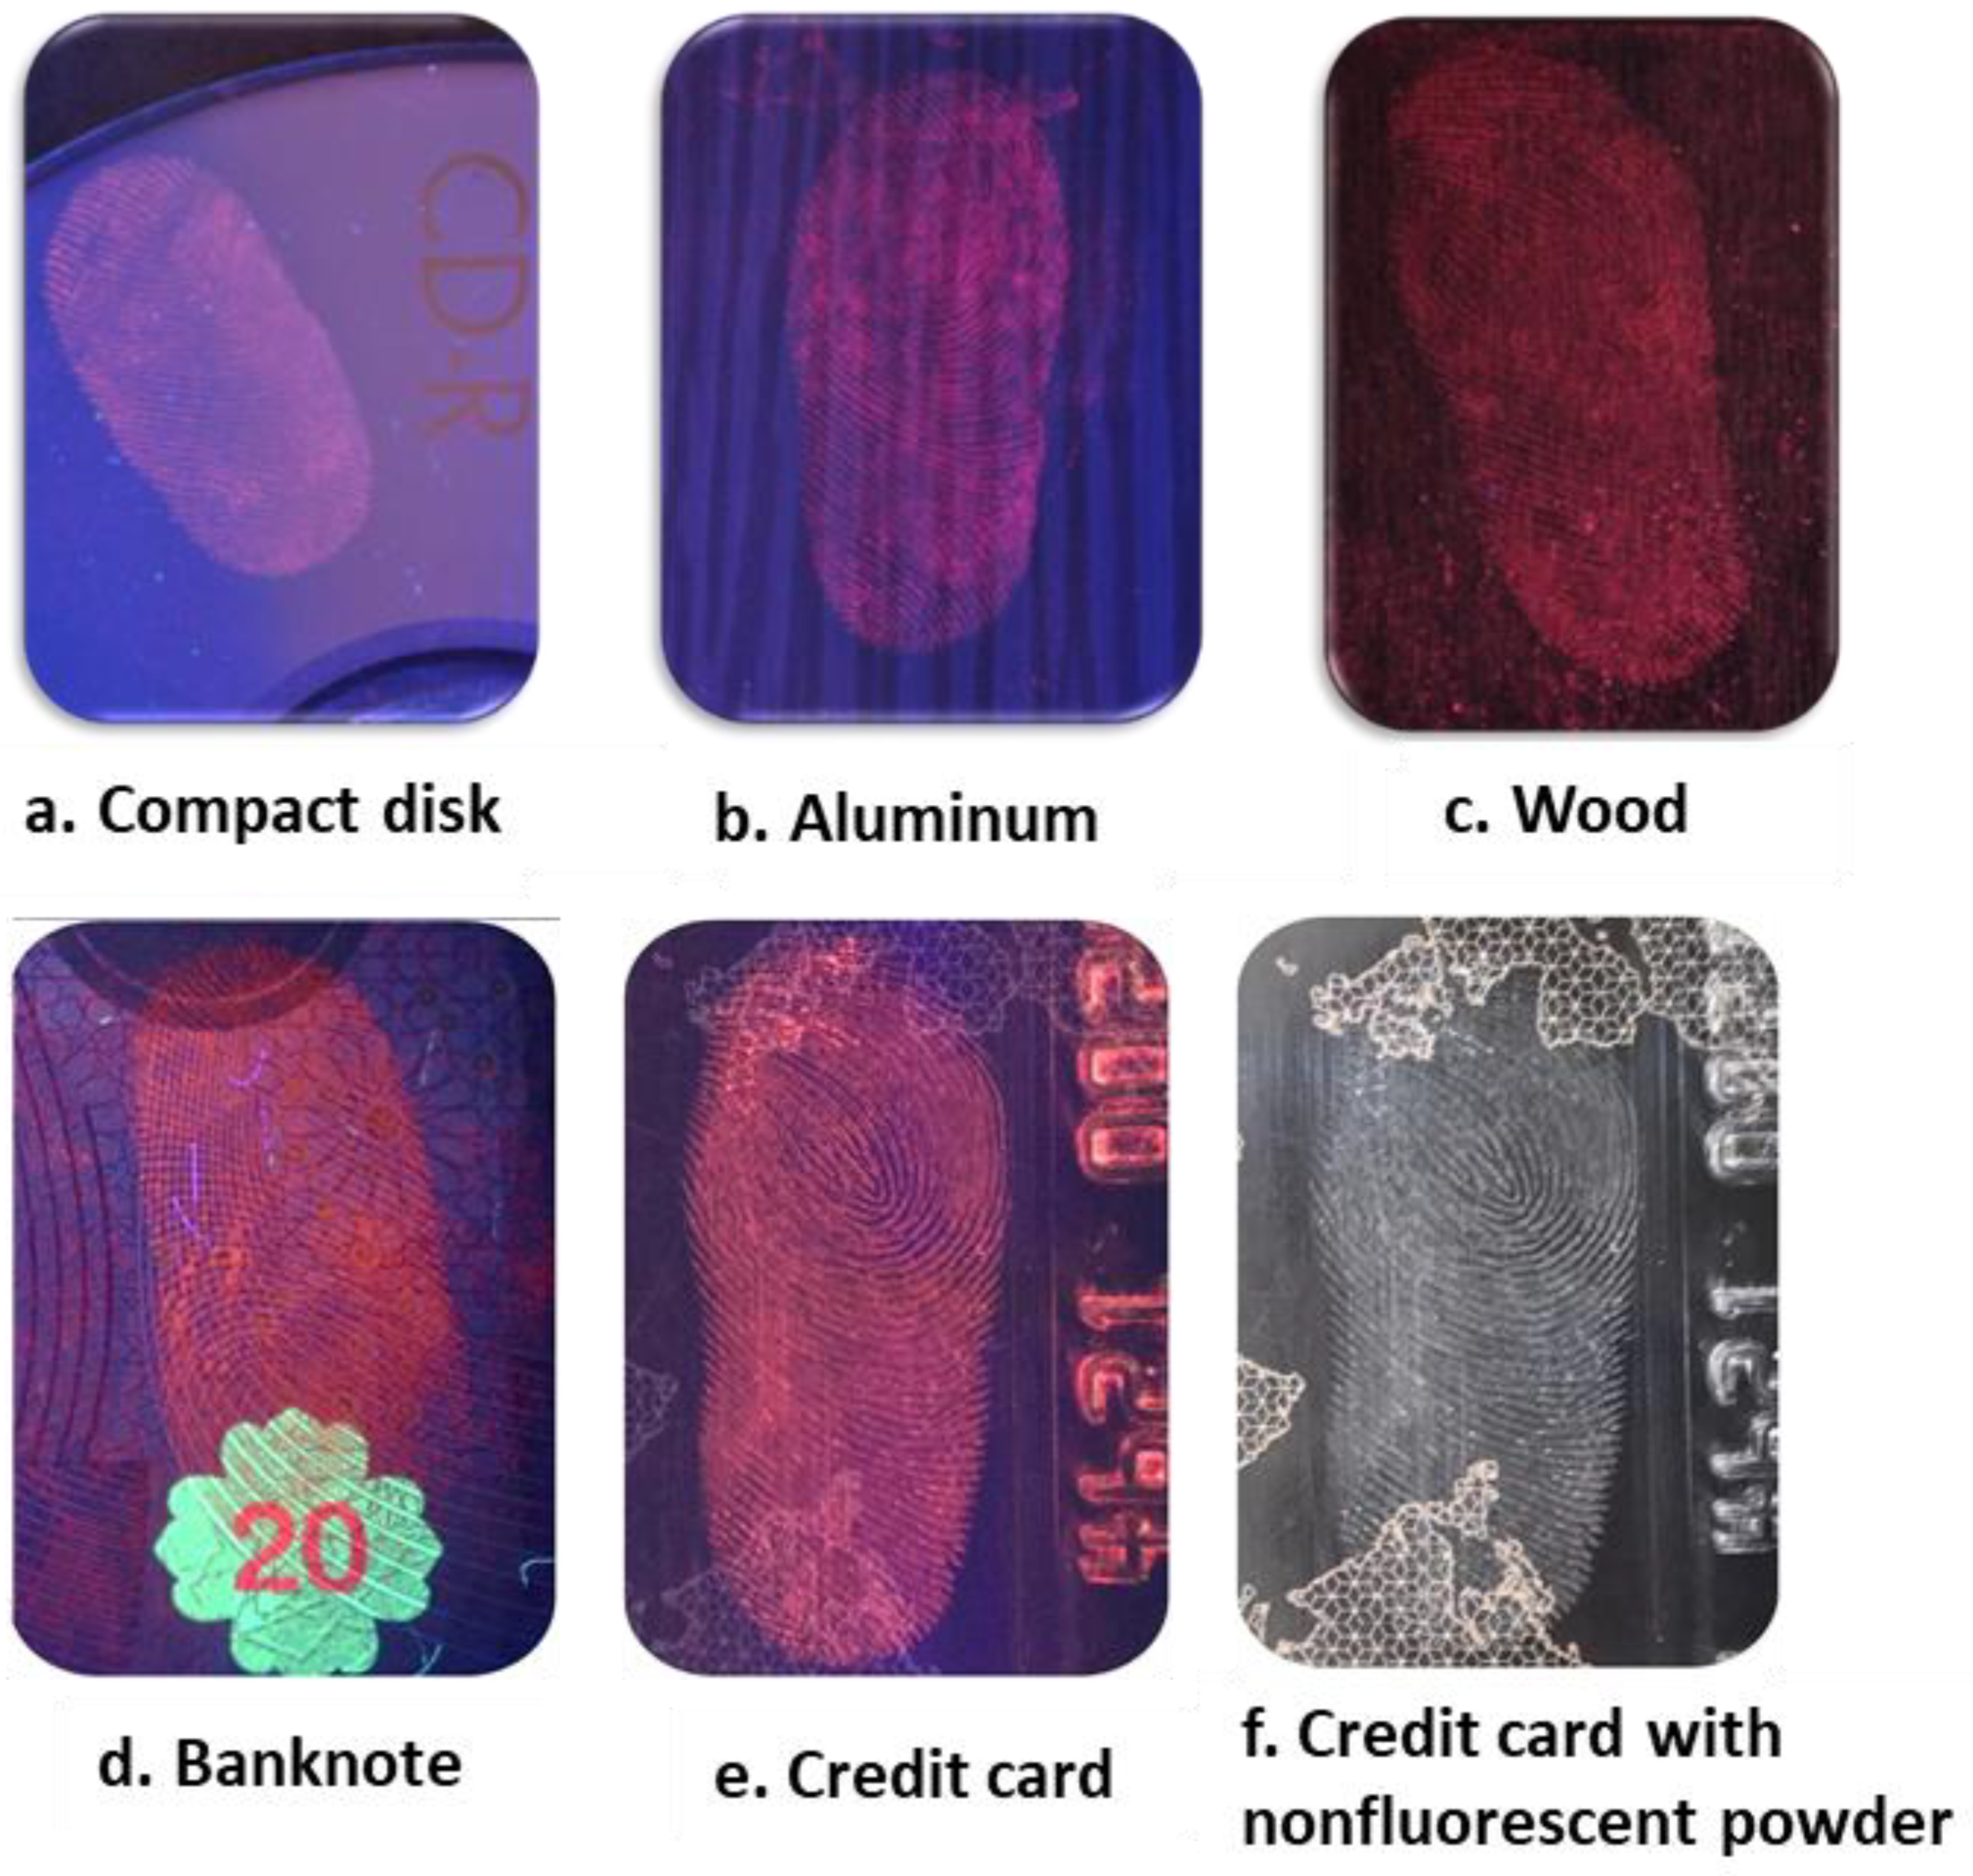
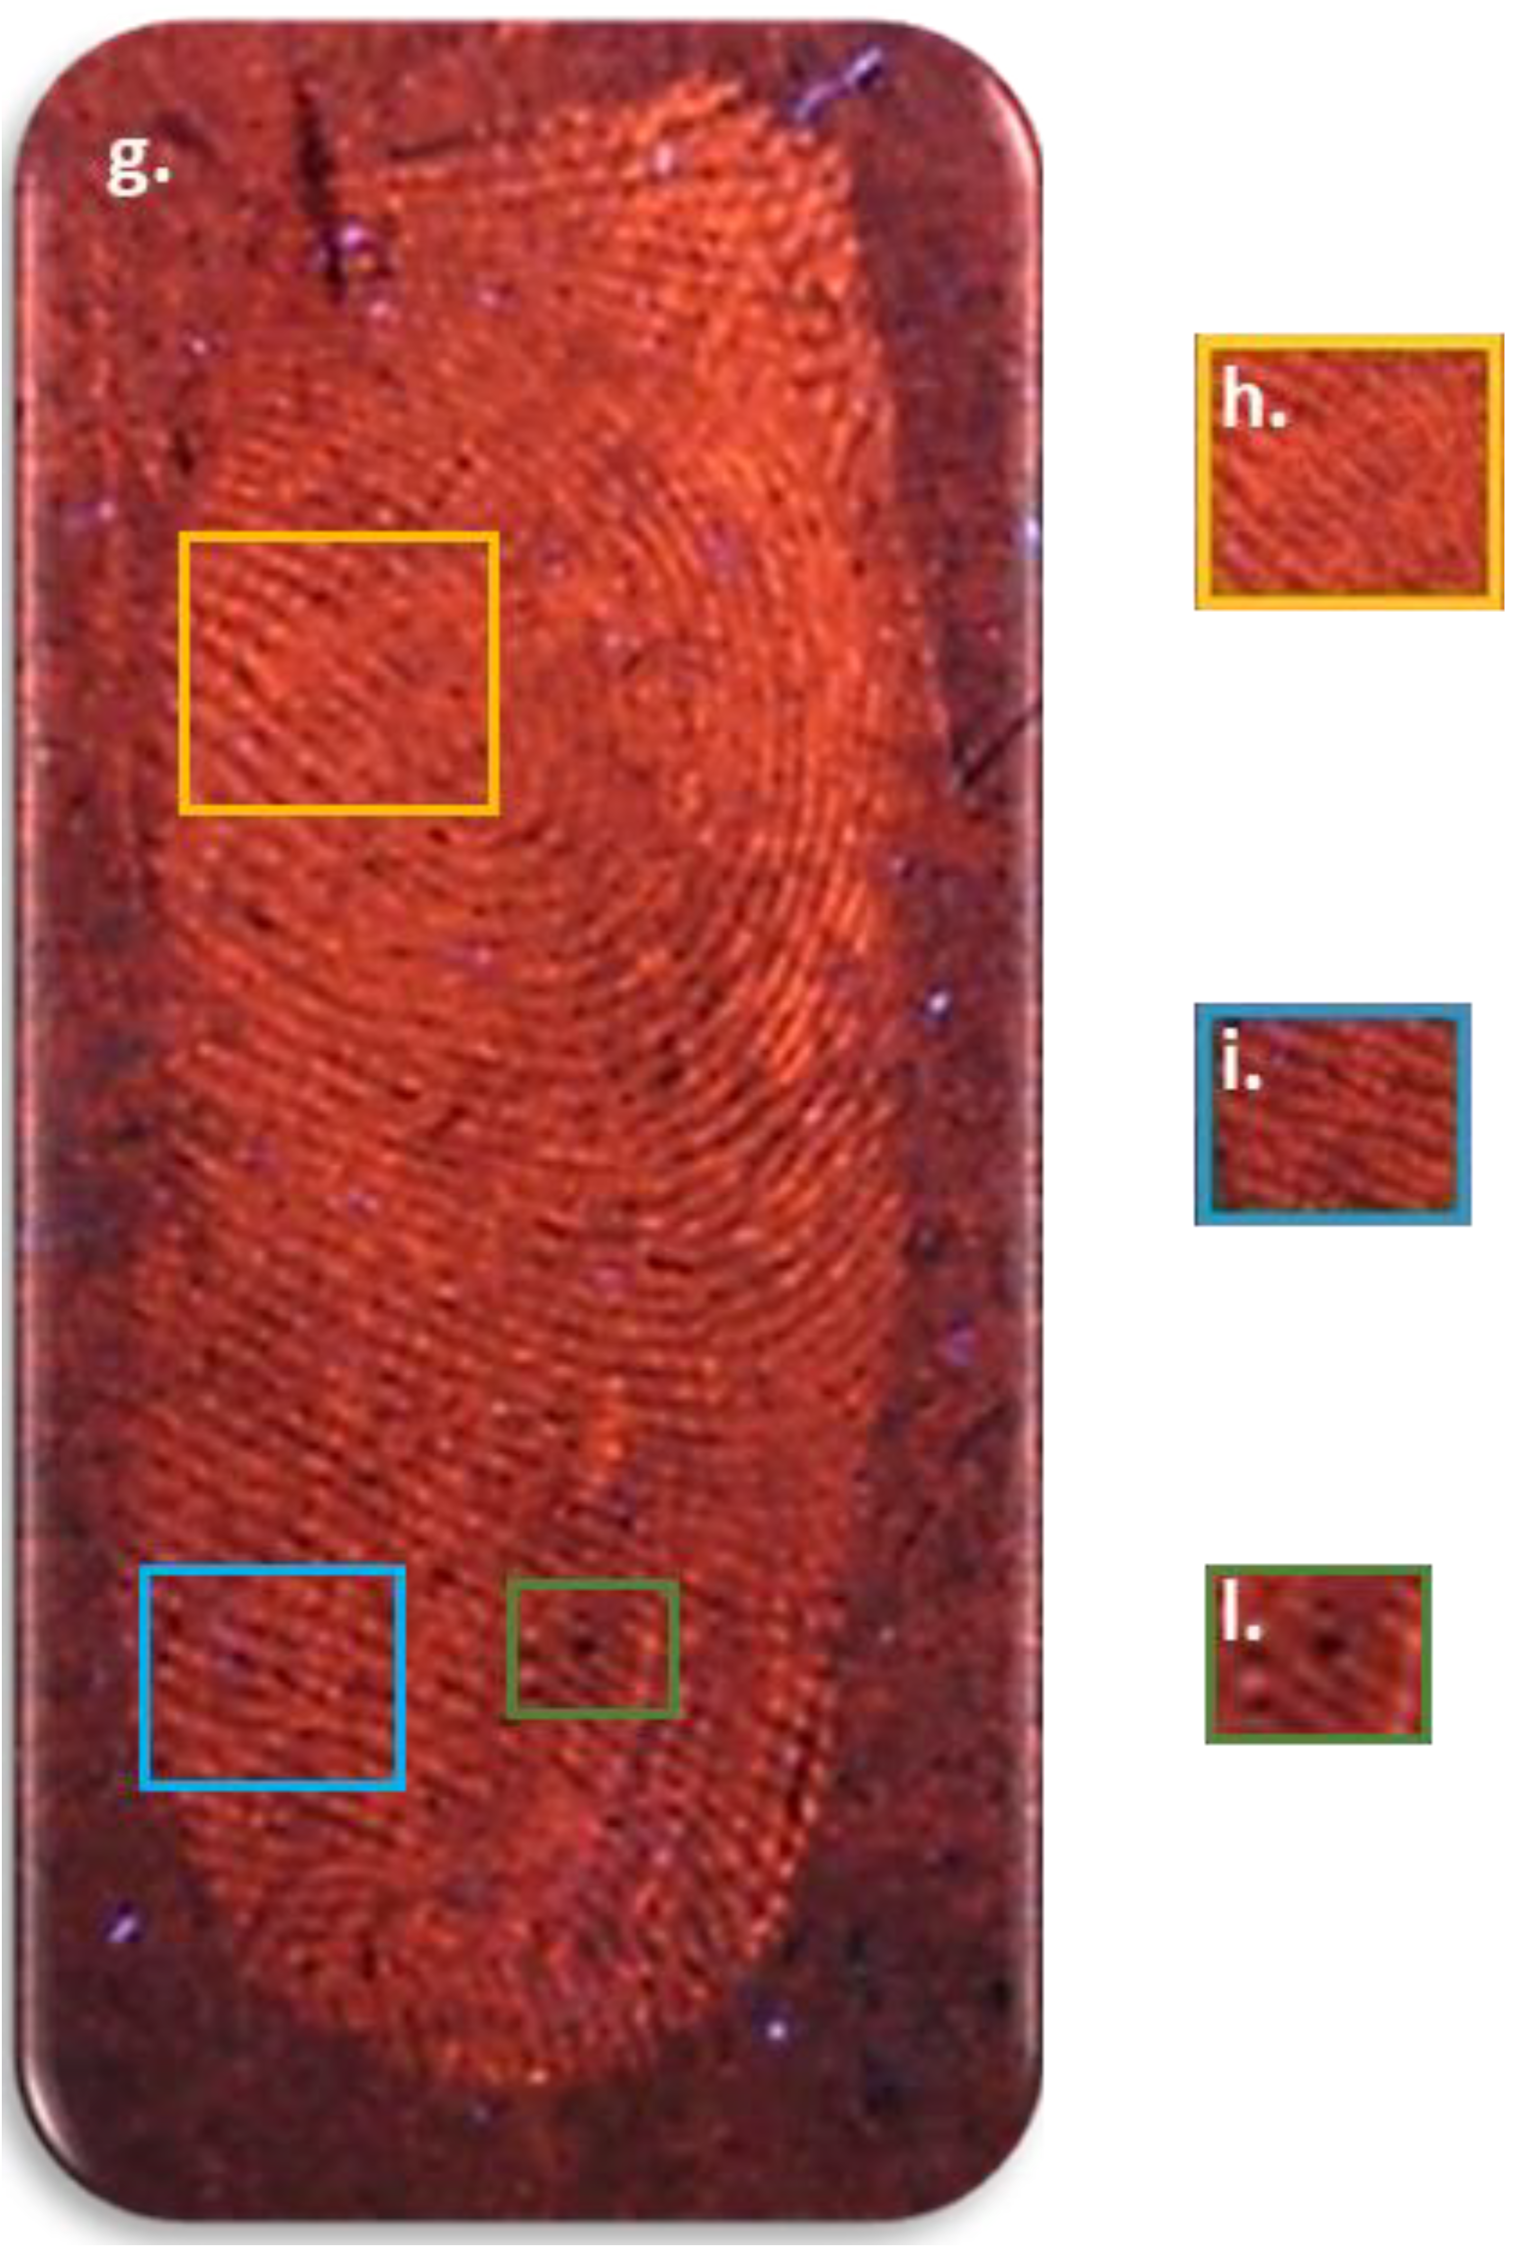
3.4. Visualization of Latent Fingerprints

In order to test our nanophosphors as LFP development agents, we selected different kinds of surfaces, including porous and non-porous, such as a compact disk, aluminum foil, wood, and ceramic, as shown in Figure 5. After washing and cleaning the donor hands, the fingerprint donor pressed their finger on the different surfaces. Afterwards, the Eu3+ doped Y2Sn2O7 nano-powders were stained smoothly over the full area of the LFPs using a feature brush. Then, the excess powder was removed by brushing. Figure 5 shows the fingerprint images developed under a UV lamp at 256 nm, onto a CD, aluminum foil, wood, a banknote, and a credit card. A clear visualization of LFPs was observed on all surfaces; in fact, thanks to the small size of the nanophosphors, the fingerprint ridges are very clear. The finer details of the fingerprints such as the pores were successfully developed, especially on wood and ceramic surfaces, thanks to the shiny red color emitted by these nano-powders. Moreover, Figure 5 also presents a comparison between the fingerprint development on a credit card with luminescent and nonluminescent powder. It can be seen that the nonluminescent powder under ambient light cannot effectively develop the fingerprint pattern on some of the card details, while the whole pattern is clearly visualized under UV illumination.
Figure 5 also shows the enlarged fingerprint pictures developed on wood under UV light. The figure clearly shows that all three levels of fingerprint ridge patterns are visualized: core (Level 1), bifurcation and termination (Level 2), and sweat pores (Level 3). In fact, Level 1 details provide general morphological information such as orientation field, ridge pattern, and fingerprint ridge flow. Level 2 details give information about pattern agreement of the ridges of individual fingerprints. Level 3 details are defined as fingerprint ridge dimensional features, including sweat pores, curvature, and dots [33].
Since the ridges were clearly observed, our new fluorescent samples showed clear patterns with high brightness and contrast to the naked eye on top of the wood, which is considered as a difficult surface. In fact, the red color can be clearly distinguished between brightness of ridges and darkness of furrows.

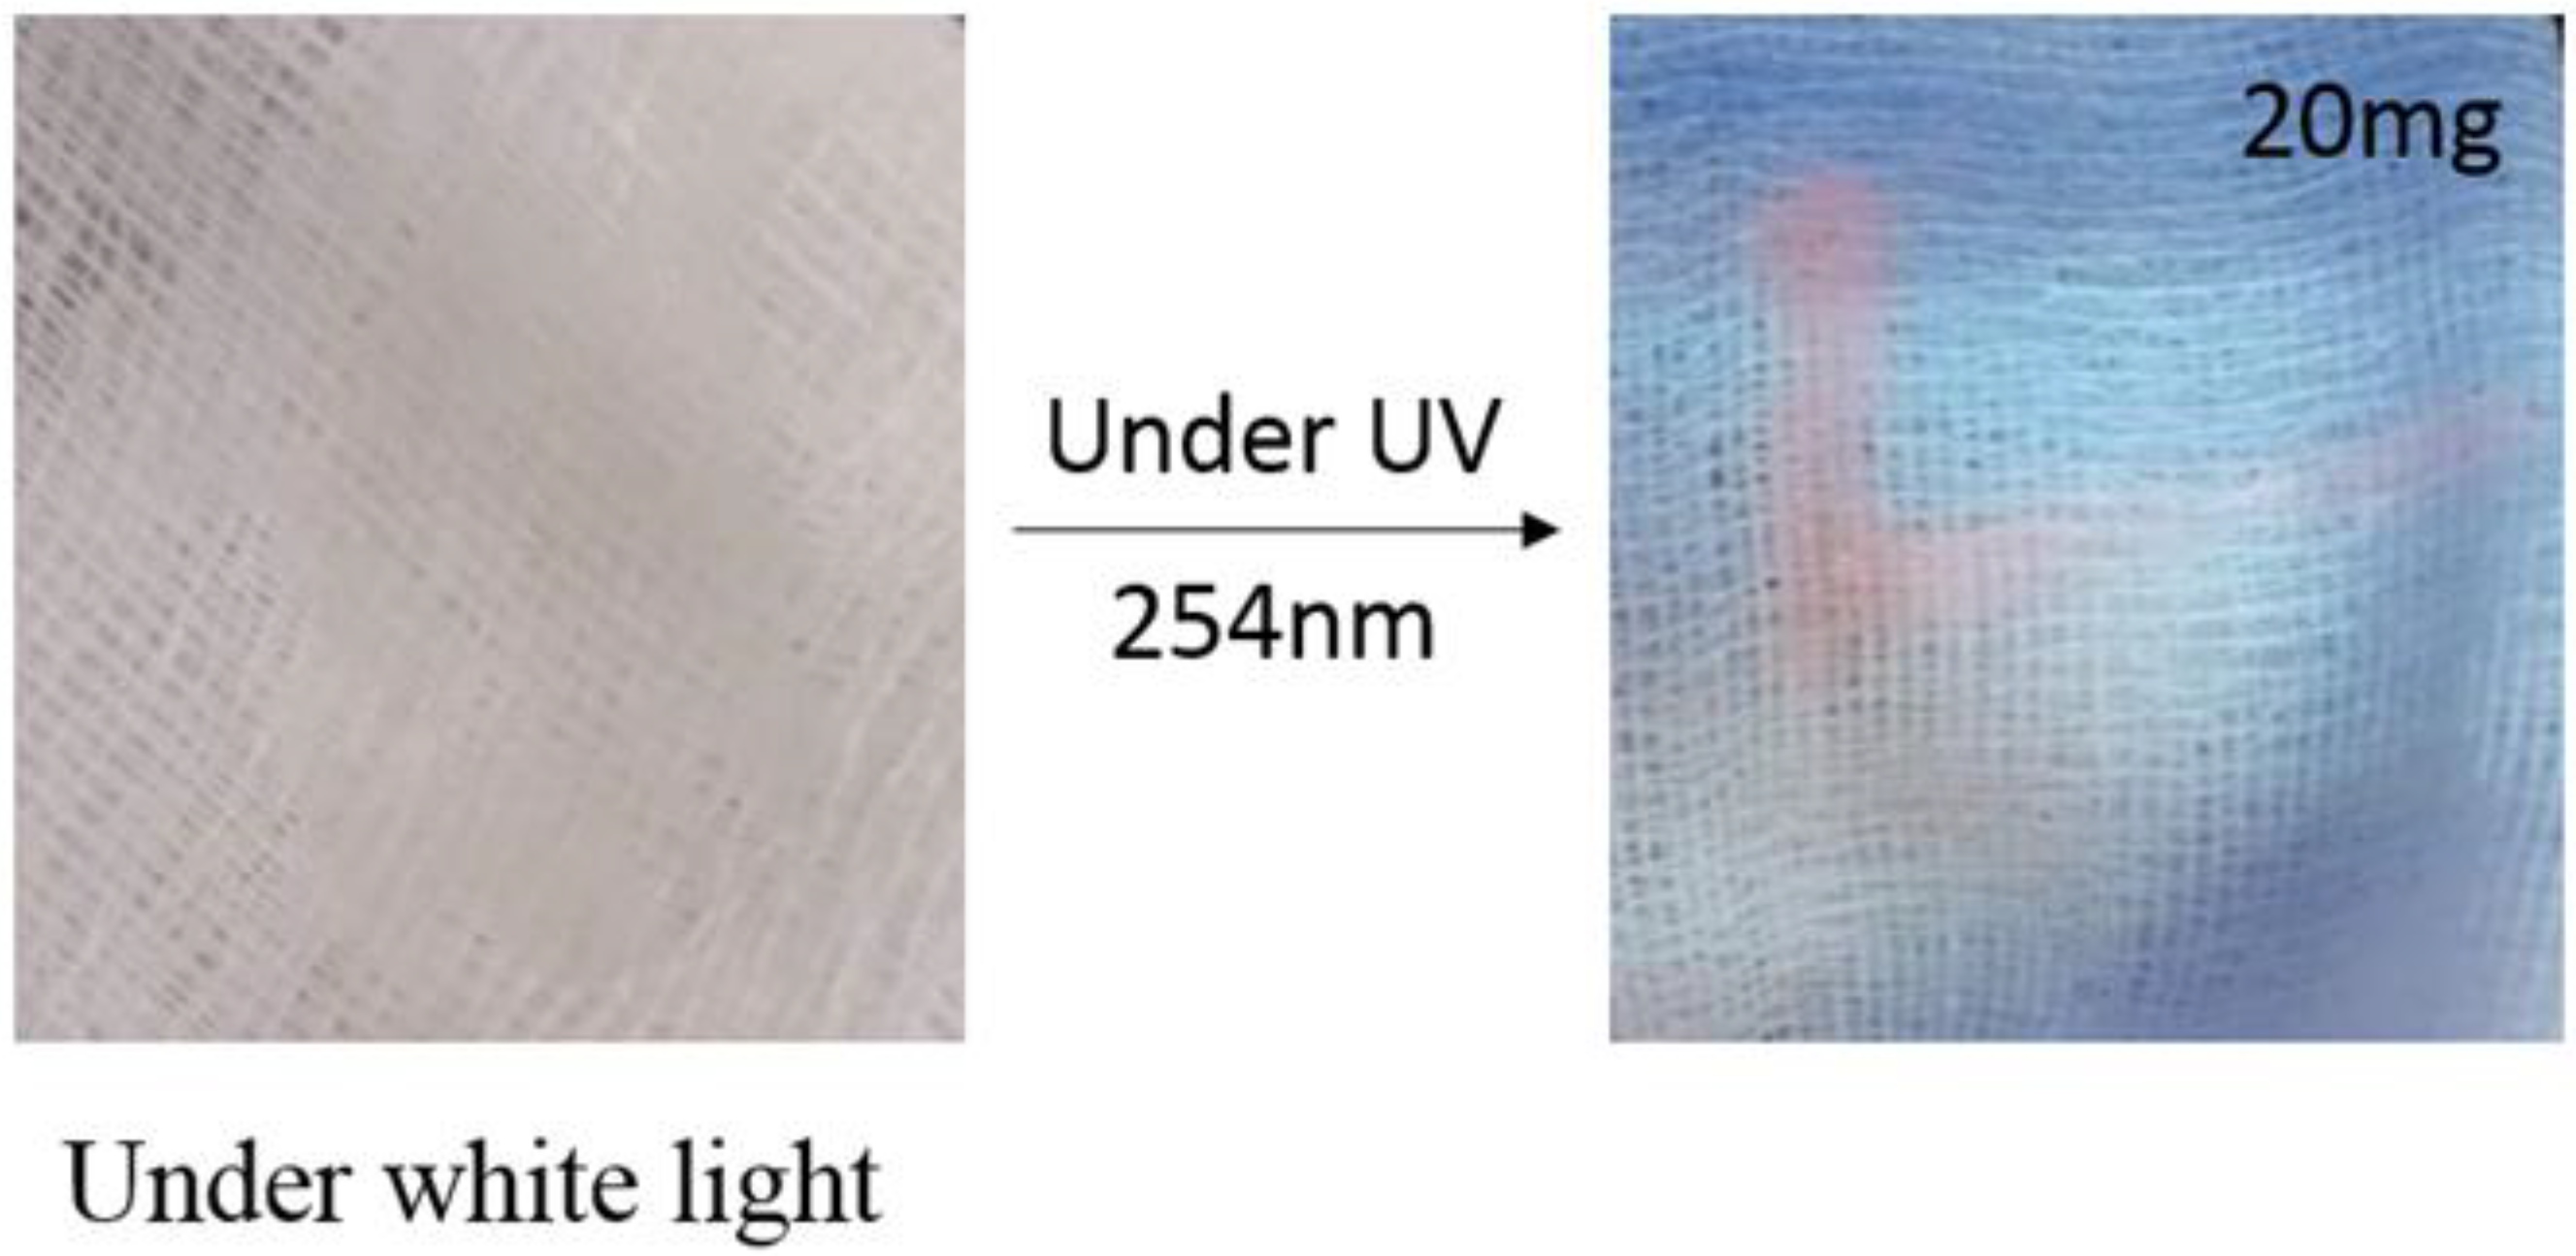
3.5. Application of Luminescent Ink for Detection of Counterfeiting

In recent years, much attention has been devoted to performing fluorescent inks using nanomaterials. However, as far as we know, no serious attempts have been reported to synthesize these transparent and stable Y2Sn2O7: Eu3+ colloids for use as fluorescent ink, but the synthesis of stable and transparent luminescent NP colloids in an aqueous medium is a challenging task [34,35,36]. We prepared a luminescent aqueous ink for anti-counterfeiting applications.
In our work, we adapted an encapsulation method in order to produce a transparent and stable Y2Sn2O7: Eu3+ colloidal solution from the nano-powders. Initially, 3 g of poly(vinyl alcohol) PVA was dissolved in de-ionized water followed by agitation at 90 °C for half an hour. Then, we added different amounts (10, 20, and 40 mg) of our nano-powders into the previous solution followed by vigorous stirring at room temperature for around 20 min. Finally, we kept the solution under sonification for about 15 min followed by centrifugation to produce highly transparent (>80% in the visible region) luminescent ink. Under ambient conditions, our ink remained stable for about one week without any precipitation. The ink was transparent under visible light but became pink-red in color under UV irradiation. Figure 6 shows the letter L written with the florescent ink on tissue. Under ambient light the ink is invisible, but it becomes visible under UV irradiation, with increasing visibility at increasing amount of nano-powder dispersed.

4. Conclusions

In this work, Eu:Y2Sn2O7 nanophosphors were successfully synthesized via the co-precipitation method followed by a further grinding treatment. XRD confirmed the cubic single phase pyrochlore structure of the phosphors. After mechanical grinding, all the samples showed an average dimension of less than 100 nm. Bright red light is emitted by the nanophosphors after UV illumination. This led to an efficient visualization of LFPs on different surfaces like a compact disk, aluminum foil, wood, and ceramic. Moreover, we prepared a stable luminescent ink for anti-counterfeiting applications. We believe these findings can be useful both in forensic science and in anti-counterfeiting applications.

Author Contributions

Conceptualization, L.B., R.M. and M.A.; Data curation, I.B., A.T. and M.A.; Funding acquisition, R.M.; Investigation, L.B. and A.T.; Methodology, L.B., I.B., A.T. and R.M.; Project administration, I.B.; Resources, A.T. and R.M.; Software, M.A.; Supervision, A.T., R.M. and M.A.; Validation, L.B. and I.B.; Writing—original draft, L.B.; Writing—review and editing, A.T. All authors have read and agreed to the published version of the manuscript.

Funding

This work was funded by the Tunisian Ministry of Higher Education and Scientific Research MHESR through the project “PBMLT” and the project PAQ Collabora T2-C3 “KIDAEM”.

Informed Consent Statement

Informed consent was obtained from all subjects involved in the study.

Data Availability Statement

The data presented in this study are available on request from the corresponding author.

Acknowledgments

The authors wish to thank Daniele Terreni for help in analyzing SEM images and Firas Krichen for help in testing the ink analysis. We thank CISUP for the access to the FEI QUANTA 450 ESEM-FEG laboratory facility.

Conflicts of Interest

The authors declare no conflict of interest.

References

  1. Prasad, V.; Lukose, S.; Agarwal, P.; Prasad, L. Role of Nanomaterials for Forensic Investigation and Latent Fingerprinting—A Review. J. Forensic Sci. 2019, 65, 26–36. [Google Scholar] [CrossRef] [PubMed] [Green Version]
  2. Singla, N.; Kaur, M.; Sofat, S. Automated Latent Fingerprint Identification System: A Review. Forensic Sci. Int. 2020, 309, 110187. [Google Scholar] [CrossRef] [PubMed]
  3. Kolhatkar, G.; Parisien, C.; Ruediger, A.; Muehlethaler, C. Latent Fingermark Imaging by Single-Metal Deposition of Gold Nanoparticles and Surface Enhanced Raman Spectroscopy. Front. Chem. 2019, 7, 440. [Google Scholar] [CrossRef] [PubMed] [Green Version]
  4. Gouiaa, M.; Bennour, I.; Rzouga Haddada, L.; Toncelli, A.; Xu, J.; Mbarek, A.; Moscardini, A.; Essoukri Ben Amara, N.; Maalej, R. Spectroscopic Characterization of Er,Yb:Y2Ti2O7 Phosphor for Latent Fingerprint Detection. Phys. B Condens. Matter 2020, 582, 412009. [Google Scholar] [CrossRef]
  5. Prabakaran, E.; Pillay, K. Synthesis and Characterization of Fluorescent N-CDs/ZnONPs Nanocomposite for Latent Fingerprint Detection by Using Powder Brushing Method. Arab. J. Chem. 2020, 13, 3817–3835. [Google Scholar] [CrossRef]
  6. Marappa, B.; Rudresha, M.S.; Basavaraj, R.B.; Darshan, G.P.; Prasad, B.D.; Sharma, S.C.; Sivakumari, S.; Amudha, P.; Nagabhushana, H. EGCG Assisted Y2O3:Eu3+ Nanopowders with 3D Micro-Architecture Assemblies Useful for Latent Finger Print Recognition and Anti-Counterfeiting Applications. Sens. Actuators B Chem. 2018, 264, 426–439. [Google Scholar] [CrossRef]
  7. Park, J.Y.; Chung, J.W.; Yang, H.K. Versatile Fluorescent Gd2MoO6:Eu3+ Nanophosphor for Latent Fingerprints and Anti-Counterfeiting Applications. Ceram. Int. 2019, 45, 11591–11599. [Google Scholar] [CrossRef]
  8. Venkatachalaiah, K.N.; Nagabhushana, H.; Darshan, G.P.; Basavaraj, R.B.; Prasad, B.D. Novel and Highly Efficient Red Luminescent Sensor Based SiO2@Y2O3:Eu3+, M+ (M+ = Li, Na, K) Composite Core–Shell Fluorescent Markers for Latent Fingerprint Recognition, Security Ink and Solid State Lightning Applications. Sens. Actuators B Chem. 2017, 251, 310–325. [Google Scholar] [CrossRef]
  9. Darshan, G.P.; Premkumar, H.B.; Nagabhushana, H.; Sharma, S.C.; Daruka Prasad, B.; Prashantha, S.C.; Basavaraj, R.B. Superstructures of Doped Yttrium Aluminates for Luminescent and Advanced Forensic Investigations. J. Alloys Compd. 2016, 686, 577–587. [Google Scholar] [CrossRef]
  10. Darshan, G.P.; Premkumar, H.B.; Nagabhushana, H.; Sharma, S.C.; Prashanth, S.C.; Prasad, B.D. Effective Fingerprint Recognition Technique Using Doped Yttrium Aluminate Nano Phosphor Material. J. Colloid Interface Sci. 2016, 464, 206–218. [Google Scholar] [CrossRef]
  11. Sodhi, G.S.; Kaur, J. Powder Method for Detecting Latent Fingerprints: A Review. Forensic Sci. Int. 2001, 120, 172–176. [Google Scholar] [CrossRef]
  12. Shahbazi, S.; Boseley, R.; Grant, B.; Chen, D.; Becker, T.; Adegoke, O.; Nic Daéid, N.; Jia, G.; Lewis, S.W. Luminescence Detection of Latent Fingermarks on Non-Porous Surfaces with Heavy-Metal-Free Quantum Dots. Forensic Chem. 2020, 18, 100222. [Google Scholar] [CrossRef]
  13. Sodhi, G.S.; Kaur, J.; Garg, R.K. Fingerprint Powder Formulations Based on Organic, Fluorescent Dyes. J. Forensic Identif. 2004, 54, 4–8. [Google Scholar]
  14. Subramanian, M.A.; Aravamudan, G.; Subba Rao, G.V. Oxide Pyrochlores—A Review. Prog. Solid State Chem. 1983, 15, 55–143. [Google Scholar] [CrossRef]
  15. Wang, Z.; Zhou, G.; Jiang, D.; Wang, S. Recent Development of A2B2O7 System Transparent Ceramics. J. Adv. Ceram. 2018, 7, 289–306. [Google Scholar] [CrossRef] [Green Version]
  16. Cheng, H.; Wang, L.; Lu, Z. A General Aqueous Sol–Gel Route to Ln2Sn2O7 Nanocrystals. Nanotechnology 2008, 19, 025706. [Google Scholar] [CrossRef]
  17. Sharma, V.; Nigam, S.; Sudarsan, V.; Vatsa, R.K. High Temperature Stabilization of Y2Sn2O7:Eu Luminescent Nanoparticles—A Facile Synthesis. J. Lumin. 2016, 179, 248–253. [Google Scholar] [CrossRef]
  18. Trujillano, R.; Rives, V.; Douma, M.; Chtoun, E.H. Microwave Hydrothermal Synthesis of A2Sn2O7 (A=Eu or Y). Ceram. Int. 2015, 41, 2266–2270. [Google Scholar] [CrossRef]
  19. Lu, Z.; Wang, J.; Tang, Y.; Li, Y. Synthesis and Photoluminescence of Eu3+-Doped Y2Sn2O7 Nanocrystals. J. Solid State Chem. 2004, 177, 3075–3079. [Google Scholar] [CrossRef]
  20. Dai, P.; Zhang, X.; Zhou, M.; Li, X.; Yang, J.; Sun, P.; Xu, C.; Liu, Y. Thermally Stable Pyrochlore Y2Ti2O7: Eu3+ Orange-Red Emitting Phosphors. J. Am. Ceram. Soc. 2012, 95, 658–662. [Google Scholar] [CrossRef]
  21. Nigam, S.; Sudarsan, V.; Vatsa, R.K. Effect of Annealing Temperature on the Structural and Photoluminescence Properties of Y2Sn2O7:Eu Nanoparticles. Eur. J. Inorg. Chem. 2013, 2013, 357–363. [Google Scholar] [CrossRef]
  22. Ege, A.; Ayvacikli, M.; Dinçer, O.; Satılmış, S.U. Spectral Emission of Rare Earth (Tb, Eu, Dy) Doped Y2Sn2O7 Phosphors. J. Lumin. 2013, 143, 653–656. [Google Scholar] [CrossRef]
  23. Rodríguez-Carvajal, J. Recent Advances in Magnetic Structure Determination by Neutron Powder Diffraction. Phys. B Condens. Matter 1993, 192, 55–69. [Google Scholar] [CrossRef]
  24. Papan, J.; Jovanović, D.; Sekulić, M.; Glais, E.; Dramićanin, M.D. Photoluminescence Properties and Thermal Stability of RE2-XEuxSn2O7 (RE = Y3+, Gd3+, Lu3+) Red Nanophosphors: An Experimental and Theoretical Study. Powder Technol. 2019, 346, 150–159. [Google Scholar] [CrossRef]
  25. Fu, Z.; Gong, W.; Li, H.; Wu, Q.; Li, W.; Yang, H.K.; Jeong, J.H. Synthesis and Spectral Properties of Nanocrystalline Eu3+-Doped Pyrochlore Oxide M2Sn2O7 (M = Gd and Y). Curr. Appl. Phys. 2011, 11, 933–938. [Google Scholar] [CrossRef]
  26. Peng, H.; Xu, J.; Tian, J.; Liu, Y.; He, Y.; Tan, J.; Xu, X.; Liu, W.; Zhang, N.; Wang, X. Mesoporous Y2Sn2O7 Pyrochlore with Exposed (111) Facets: An Active and Stable Catalyst for CO Oxidation. RSC Adv. 2016, 6, 71791–71799. [Google Scholar] [CrossRef]
  27. Nigam, S.; Sudarsan, V.; Majumder, C.; Vatsa, R.K. Structural Differences Existing in Bulk and Nanoparticles of Y2Sn2O7: Investigated by Experimental and Theoretical Methods. J. Solid State Chem. 2013, 200, 202–208. [Google Scholar] [CrossRef]
  28. Fujihara, S.; Tokumo, K. Multiband Orange-Red Luminescence of Eu3+ Ions Based on the Pyrochlore-Structured Host Crystal. Chem. Mater. 2005, 17, 5587–5593. [Google Scholar] [CrossRef]
  29. Mrázek, J.; Surýnek, M.; Bakardjieva, S.; Buršík, J.; Proboštová, J.; Kašík, I. Luminescence Properties of Nanocrystalline Europium Titanate Eu2Ti2O7. J. Alloys Compd. 2015, 645, 57–63. [Google Scholar] [CrossRef]
  30. Binnemans, K. Interpretation of Europium(III) Spectra. Coord. Chem. Rev. 2015, 295, 1–45. [Google Scholar] [CrossRef] [Green Version]
  31. Andres, J.; Chauvin, A.-S. Colorimetry of Luminescent Lanthanide Complexes. Molecules 2020, 25, 4022. [Google Scholar] [CrossRef] [PubMed]
  32. Devi, R.; Dalal, M.; Bala, M.; Khatkar, S.P.; Taxak, V.B.; Boora, P. Synthesis, Photoluminescence Features with Intramolecular Energy Transfer and Judd–Ofelt Analysis of Highly Efficient Europium(III) Complexes. J. Mater. Sci. Mater. Electron. 2016, 27, 12506–12516. [Google Scholar] [CrossRef]
  33. Azman, A.R.; Mahat, N.A.; Wahab, R.A.; Ahmad, W.A.; Huri, M.A.M.; Hamzah, H.H. Relevant Visualization Technologies for Latent Fingerprints on Wet Objects and Its Challenges: A Review. Egypt. J. Forensic Sci. 2019, 9, 23. [Google Scholar] [CrossRef] [Green Version]
  34. Gupta, B.K.; Haranath, D.; Saini, S.; Singh, V.; Shanker, V. Synthesis and characterization of ultra-fine Y2O3:Eu3+ nanophosphors for luminescent security ink applications. Nanotechnology 2010, 21, 055607. [Google Scholar] [CrossRef] [PubMed]
  35. Trinh, C.D.; Hau, P.T.P.; Dang, T.M.D.; Dang, C.M. Sonochemical Synthesis and Properties of YVO4:Eu3+ Nanocrystals for Luminescent Security Ink Applications. J. Chem. 2019, 2019, 5749702. [Google Scholar] [CrossRef] [Green Version]
  36. Attia, M.; Elsaadany, S.A.; Ahmed, K.A.; El-Molla, M.M.; Abdel-Mottaleb, M.S.A. Inkjet Printable Luminescent Eu3+-TiO2 Doped in Sol Gel Matrix for Paper Tagging. J. Fluoresc. 2015, 25, 119–125. [Google Scholar] [CrossRef]
Figure 1. (a) Powder XRD patterns of the undoped and doped Y2Sn2O7 samples compared to the JCPDS card for pure pyrochlore structure. (b) Crystal structure of doped Y2Sn2O7. (c) Fitting results on one of the spectra.
Materials 15 02423 g001
Figure 2. SEM image of 10%Eu: Y2Sn2O7 nanoparticles.
Materials 15 02423 g002
Figure 3. PL intensity of the various compositions under 450 nm excitation.
Materials 15 02423 g003
Figure 4. CIE coordinates of the emission of our samples. All samples are located in the red region.
Materials 15 02423 g004
Figure 5. Developed fingerprint images obtained with Eu:Y2Sn2O7 on different surfaces: (a) compact disc, (b) aluminum foil, (c) wood, (d) banknote, (e) credit card, (f) credit card with nonluminescent powder. (g) Enlargement of (c) with the three levels of fingerprint ridge patterns visualized: (h) core (Level 1); (i) bifurcation and termination (Level 2); (l) sweat pores (Level 3).
Materials 15 02423 g005aMaterials 15 02423 g005b
Figure 6. Demonstration of the visibility of our luminescent ink.
Materials 15 02423 g006
Table 1. Atomic coordinates and site occupancy fraction for Y2Sn2O7:9%Eu.
AtomSiteSymmetryXYZ
Y/Eu16dD3d0.50.50.5
Sn16cD3d000
O48fC2v0.3370.1250.125
O’8bTd0.3750.3750.375
Table 2. Average crystallite size.
CompositionCrystallite Size from XRD (nm)Crystallite Size from DLS (nm)
Y2Sn2O7:7%Eu384.5405
Y2Sn2O7:8%Eu311.6487
Y2Sn2O7:9%Eu360.5503
Y2Sn2O7:10%Eu326.5387
Table 3. Measured length of the samples.
SampleSize (nm)Standard Deviation (nm)
Y2Sn2O75631
Y2Sn2O7:7%Eu9957
Y2Sn2O7:8%Eu5734
Y2Sn2O7:9%Eu7050
Y2Sn2O7:10%Eu8239
Publisher’s Note: MDPI stays neutral with regard to jurisdictional claims in published maps and institutional affiliations.

