Article

Application of Machine Learning Approaches to Predict the Strength Property of Geopolymer Concrete

1
School of Civil Engineering, Wuhan University, Wuhan 430072, China
2
School of Civil Engineering and Architecture, Henan University, Kaifeng 475000, China
*
Author to whom correspondence should be addressed.
Materials 2022, 15(7), 2400; https://doi.org/10.3390/ma15072400
Submission received: 1 March 2022 / Revised: 16 March 2022 / Accepted: 21 March 2022 / Published: 24 March 2022

Abstract

:
Geopolymer concrete (GPC) based on fly ash (FA) is being studied as a possible alternative solution with a lower environmental impact than Portland cement mixtures. However, the accuracy of the strength prediction still needs to be improved. This study was based on the investigation of various types of machine learning (ML) approaches to predict the compressive strength (C-S) of GPC. The support vector machine (SVM), multilayer perceptron (MLP), and XGBoost (XGB) techniques have been employed to check the difference between the experimental and predicted results of the C-S for the GPC. The coefficient of determination (R2) was used to measure how accurate the results were, which usually ranged from 0 to 1. The results show that the XGB was a more accurate model, indicating an R2 value of 0.98, as opposed to SVM (0.91) and MLP (0.88). The statistical checks and k-fold cross-validation (CV) also confirm the high precision level of the XGB model. The lesser values of the errors for the XGB approach, such as mean absolute error (MAE), mean square error (MSE), and root mean square error (RMSE), were noted as 1.49 MPa, 3.16 MPa, and 1.78 MPa, respectively. These lesser values of the errors also indicate the high precision of the XGB model. Moreover, the sensitivity analysis was also conducted to evaluate the parameter’s contribution towards the anticipation of C-S of GPC. The use of ML techniques for the prediction of material properties will not only reduce the effort of experimental work in the laboratory but also minimize the cast and time for the researchers.

1. Introduction

Geopolymer is generally considered the third generation of cement, following gypsum cement and regular Portland cement (OPC) [1,2,3]. It has emerged as a significant construction material on a global scale [4,5,6,7]. Geopolymers are also known as amorphous alkali aluminosilicates and alkali-activated cement [8,9,10,11,12,13]. By activating aluminosilicates, such as rice husk ash (RHA), metakaolin (MK), slag (SG), and fly ash (FA) with an alkaline solution, geopolymer concrete can be created. As a result, the effectiveness of GPC production normally relies on activators and the type of aluminosilicates available [14,15,16,17,18,19].
Geopolymer is a type of inorganic polymer. In comparison to other natural zeolitic materials, it is amorphous rather than crystalline [20,21,22,23,24,25,26]. Polymerization involves a very rapid reaction between silica (Si) and alumina (Al) in an alkaline environment, which results in the formation of a three-dimensional polymeric chain of Si-O-Al-O links. In contrast to OPC or pozzolanic cement, geopolymer achieves compressive strength by the polycondensation of alumina, silica, and a high alkali concentration [27,28,29,30]. By contrast, a geopolymer including OPC forms calcium silicate hydrates (C-S-H), polycondensation of silica and alumina, and a high alkali content to achieve compressive strength. GPC can be prepared from anything which has amorphous Al and Si. Minerals obtained from natural resources or by-products from industries can be used as these materials. The hydration products of FA/MK were discovered to be sodium aluminosilicate hydrate gels. Meanwhile, calcium silicate gels of hydrate are the products of hydration for SG activation [8].
MK-based GP is superior to hydrates due to its more lasting characteristics [7,31,32,33,34,35]. Despite its advantages, it resulted in serious rheological issues due to the increased water demand. Meanwhile, geopolymers based on FA demonstrated increased durability [7,28,36,37,38]. On the other side, a polymer-based on SG has stronger initial strength and acid resistance [7,39,40,41,42]. Numerous research has been conducted to evaluate the geopolymer concrete performance. These impacts include those of the C-S-H range, chemicals, and type of curing. Yip et al. [23] discovered aluminosilicate gel (N-A-S-H) and C-S-H in MK/SG-based geopolymer pastes. This is comparable to a rich calcium FA-based geopolymer reported by Somna et al. [43], which is activated primarily with sodium hydroxide (NaOH). The N-A-S-H and C-S-H components of concrete paste contribute to its strength. In other words, GP pastes’ strength strongly relies on the alkalinity of the utilized activators. Additionally, it was also noted that temperature plays a vital role in the effect on the activation of aluminosilicates. At a temperature of about 27 °C (lower), the activation process in FA/SG blends is in control of SG activation, but at the temperature of about 60 °C (high), both SG and FA are activated.
SG, on the other hand, contributes to the strength of pastes due to its compact microstructure [44,45,46]. The formation of C-S-H and C-A-S-H causes the solidification of FA/SG-based GP. C-S-H, N-A-S-H, and C-A-S-H are created after hardening. Furthermore, the formation of hydration gels is influenced by calcium ions and pH. According to Prinya et al. [47], in FA-based GP, an acidic environment causes the development of N-A-S-H gel. Calcium ion concentrations are higher in class geopolymers that contain C. Increased C-S may occur as a result of FA [48]. The higher potassium oxide concentration of H.CWA aided the strength growth [49] and self-activation of the geopolymer with no need for an activator [50]. Additionally, the use of secondary cementitious materials and fibers (both natural and artificial) in geopolymer concrete has shown effective performance [51,52,53,54,55,56]. However, Figure 1 shows a schematic illustration of the GP concrete manufacturing process.
In the meantime, the rapid surge towards the use of various ML techniques for the prediction of numerous properties of materials plays a vital role for researchers in the field of engineering [57,58,59,60,61,62,63,64]. Especially the prediction of mechanical properties of different types of concrete, as concrete is a material that requires experimental efforts, time, and cost to achieve the desired strength [7,60,62,65,66,67,68,69,70,71]. The various types of software and codding are being developed to generate the different types of ML algorithms, such as AdaBoost, bagging, decision tree, MLP, GEP, and ANN. Bayar et al. [72] predicted the various crack propagation of concrete material and investigated that the use of employed ML approaches predicted the crack propagation effectively. Seung et al. [73] used the ANN approach for the anticipation of the concrete’s strength. The type of pattern system was generated for ANN, which can learn the cylinder test results. They demonstrate that I-Pre-Cons (Intelligent Prediction system of Concrete Strength), when combined with ANN, is extremely effective at predicting the C-S growth of concrete. Nguyen-Sy et al. [74] used the extreme gradient boosting approach for predicting the C-S of concrete. They explained that the XGB approach is more resilient and has higher precision than the ANN and SVM techniques and other machine learning methods currently available in the literature.
This research describes the comparative study of various ML algorithms for predicting the C-S of GPC. The objectives of the study are as follows:
  • To investigate the combined effect of ensemble and individual ML algorithms for predicting the strength property of concrete.
  • To evaluate the more precious ML algorithm for predicting the compressive strength of concrete.
  • To minimize the experimental efforts, cost, and time with the application of employed ML approaches.

2. Research Strategy

The concrete material was prepared and used in the study with the nine parameters (coarse aggregate, FA, fine aggregate, sodium hydroxide, Na2SiO3, silicon dioxide, Na2O, NaOH molarity, and curing time) to obtain the C-S, as described in the literature [75,76,77,78,79,80,81,82,83,84]. A total of 151 data points has been collected from the mentioned literature for running the selected models. The said retrieved data were arranged as per the requirement of the anaconda navigator software. The spyder (4.1.4) from the same software was investigated for running the models using python codding for each model. The nine columns were arranged as input parameters, while a single column was used as output (C-S) variable in an excel sheet for modeling purposes. The XGBoost, SVM, and MLP algorithms were used for the prediction of required output (C-S). The predicted result of C-S was then obtained in the form of an R2 value, which normally varies from 0 to 1. The higher value of R2 is the reflection of better results with high precision of the selected model [85,86,87]. Table 1 contains a descriptive statistical analysis of all input parameters. All attributes are expressed in kilograms, except for the age in days, which is specified in the table. Moreover, the histograms in Figure 2 indicate the relative frequency distribution of each variable.

3. Machine Learning Algorithms

The two different types of ML approaches were selected for this study; one is individual type (MLP), while another is ensemble ML techniques (XGBoost and SVM) to evaluate and recommend the better model for the prediction of the required outcome.

3.1. Multilayer Perceptron Regressor (MLP)

MLPs are normally the feedforward neural network. Networks containing numerous layers of a perceptron are known as multilayer perceptrons (MLPs) (with threshold activation). Vanilla neural networks are multiple perceptrons with only one hidden layer. An MLP has three levels of nodes: input, hiding, and outputs. Each node, with the exception of the input nodes, is a neuron with a nonlinear activation function. Backpropagation is an MLP supervised learning approach. MLPs have more layers and nonlinear activation than linear perceptrons. It can split data that are not linearly separable. If each neuron in an MLP has a linear type activation function, then linear algebra confirms that the number of layers may be minimized to a two-layer input and output model. MLP neurons use a non-aligned activation function to replicate action potentials or firing frequency of genuine neurons.

3.2. Support Vector Machine (SVM)

SVMs are controlled learning models that analyze data for allocation and regression. SVMs are among the most popular and resilient anticipation approaches since they are founded on statistical learning frameworks. The SVM technique for training generates a type of model that allows fresh specify to one of two categories, transforming it to a non-probabilistic binary linear classifier. SVM assigns training instances to places in space to maximize the distance between two groups. Then new examples are summarized into the same space and categorized according to their gap. SVMs may also conduct the fast nonlinear type of classification employing the kernel trick, which involves essentially mapping inputs into high-dimensional feature spaces. Unlabeled data make supervised learning unfeasible hence an unsupervised learning technique is necessary to uncover natural clustering and then by mapping fresh data for these groups. The SV clustering algorithm uses the same statistics as the support vector machines approach to identify unlabeled data.

3.3. XGBoost Algorithm

XGBoost is an ensemble ML approach and is based on DTs and used a GB framework. ANNs normally outperform all other techniques or frameworks in anticipating problems, including non-structured data (pictures, text, etc.). For minimum-to-normal-sized tabular data, DT-based algorithms are now rated best-in-class. XGB parallelizes the action of sequential tree construction because the loops employed to produce base learners are compatible; the outer loop specifies the leaf nodes of a selected tree; however, another loop (inner) investigates the features. This process of loops prohibits correlations because the loop (outer) cannot be taken to start until the inner loop is completed (the more arithmetically expensive of the two). Due to this, the pattern of loops is regulated to enhance the run time by initialization through a global scan of all occurrences and sorting via aligned threads. This trend increases algorithmic speed by remunerating for any parallelization overheads elaborated during the investigation. This algorithm was developed in order to produce the best possible use of the resources related to hardware that was available. This is performed via cache awareness, with each thread assigning internal buffers for holding gradient statistics. Additional innovations, such as ‘out-of-core’ computation, maximize available disc space while managing large data-frames that are too large to fit in memory.

4. Result and Discussions

4.1. MLP Model Outcome

Figure 3 depicts the analysis explanation of the actual and predicted findings for the C-S of GPC for the MLP model. The MLP model gives outcomes with a reasonable degree of correctness and a minor difference between the actual and projected values. The R2 score of 0.88 suggests that the MLP model’s result is at reasonably high accuracy for predicting outcomes. Figure 4 shows the dispersion of the values obtained from the experimental approach (targets), anticipated results, and error results for the model (MLP). The high, minimum, and average values of the error’s scattering for the dataset were reported as 13.91 MPa, 0.19 MPa, and 3.48 MPa, respectively. However, it was also noted that the set shows 20.96% of the data between 0 to 1 MPa, 30.64% between 1 MPa and 3 MPa, while 48.38 percent the data was above 3 MPa.

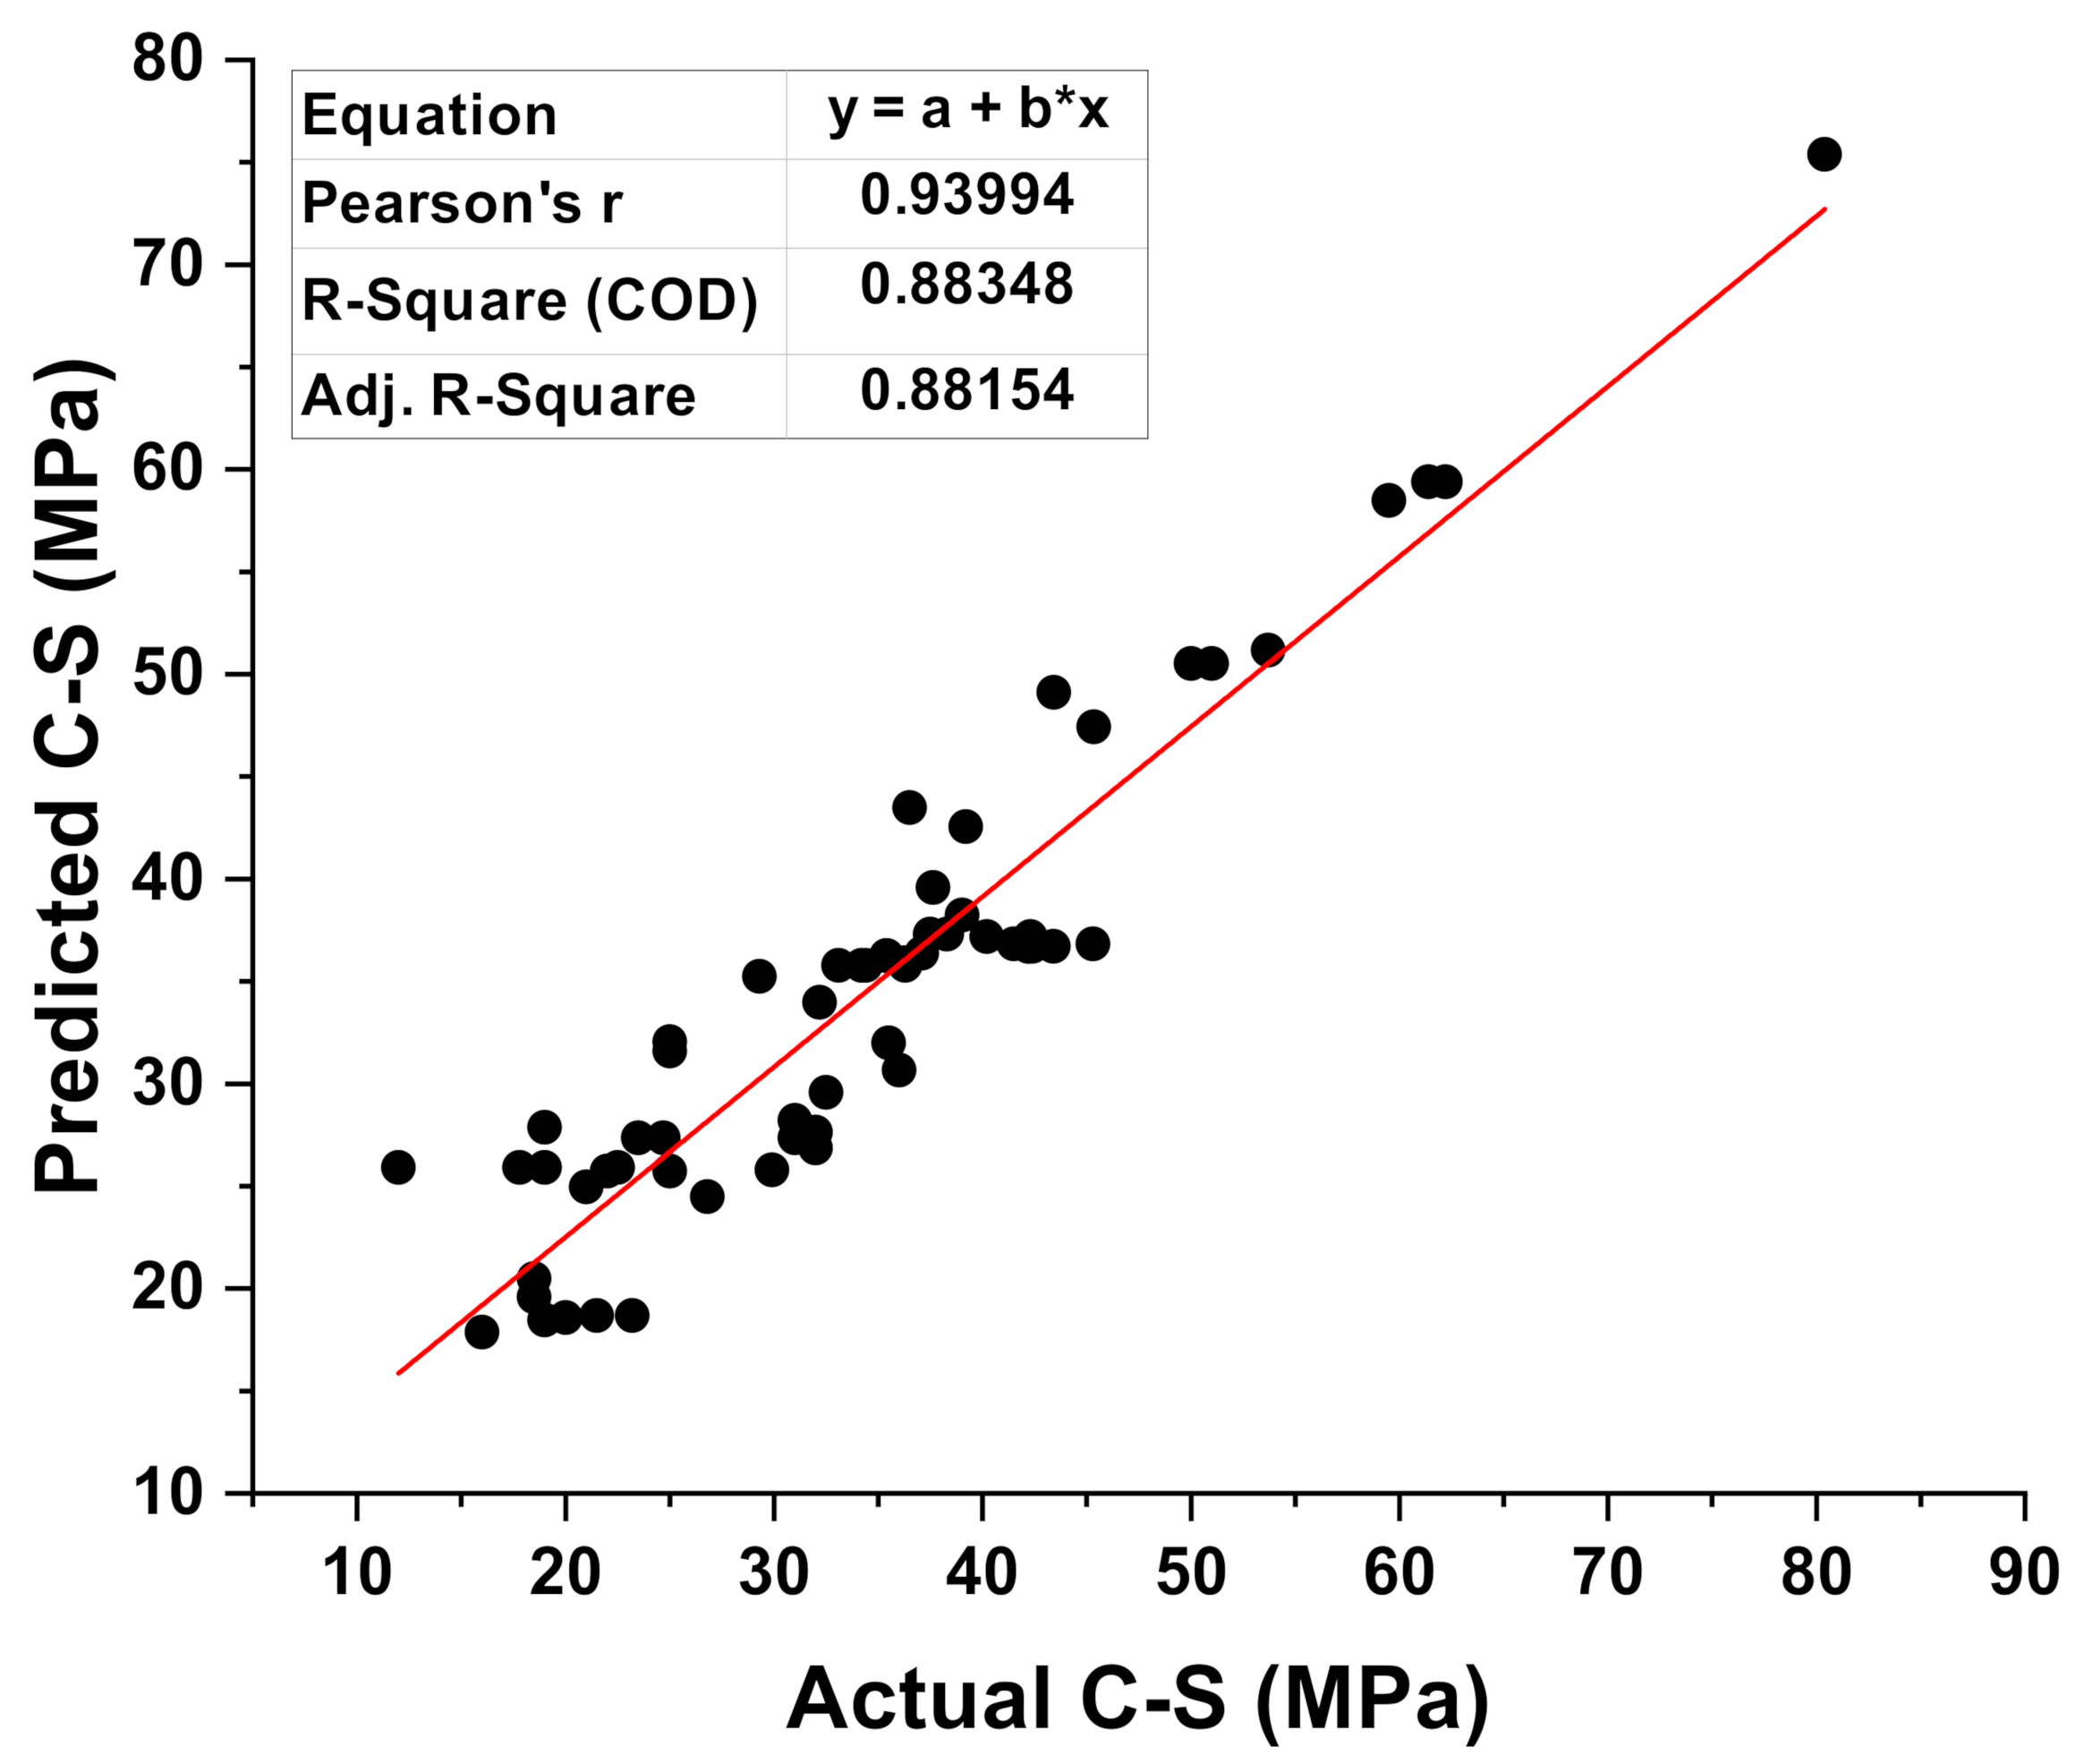
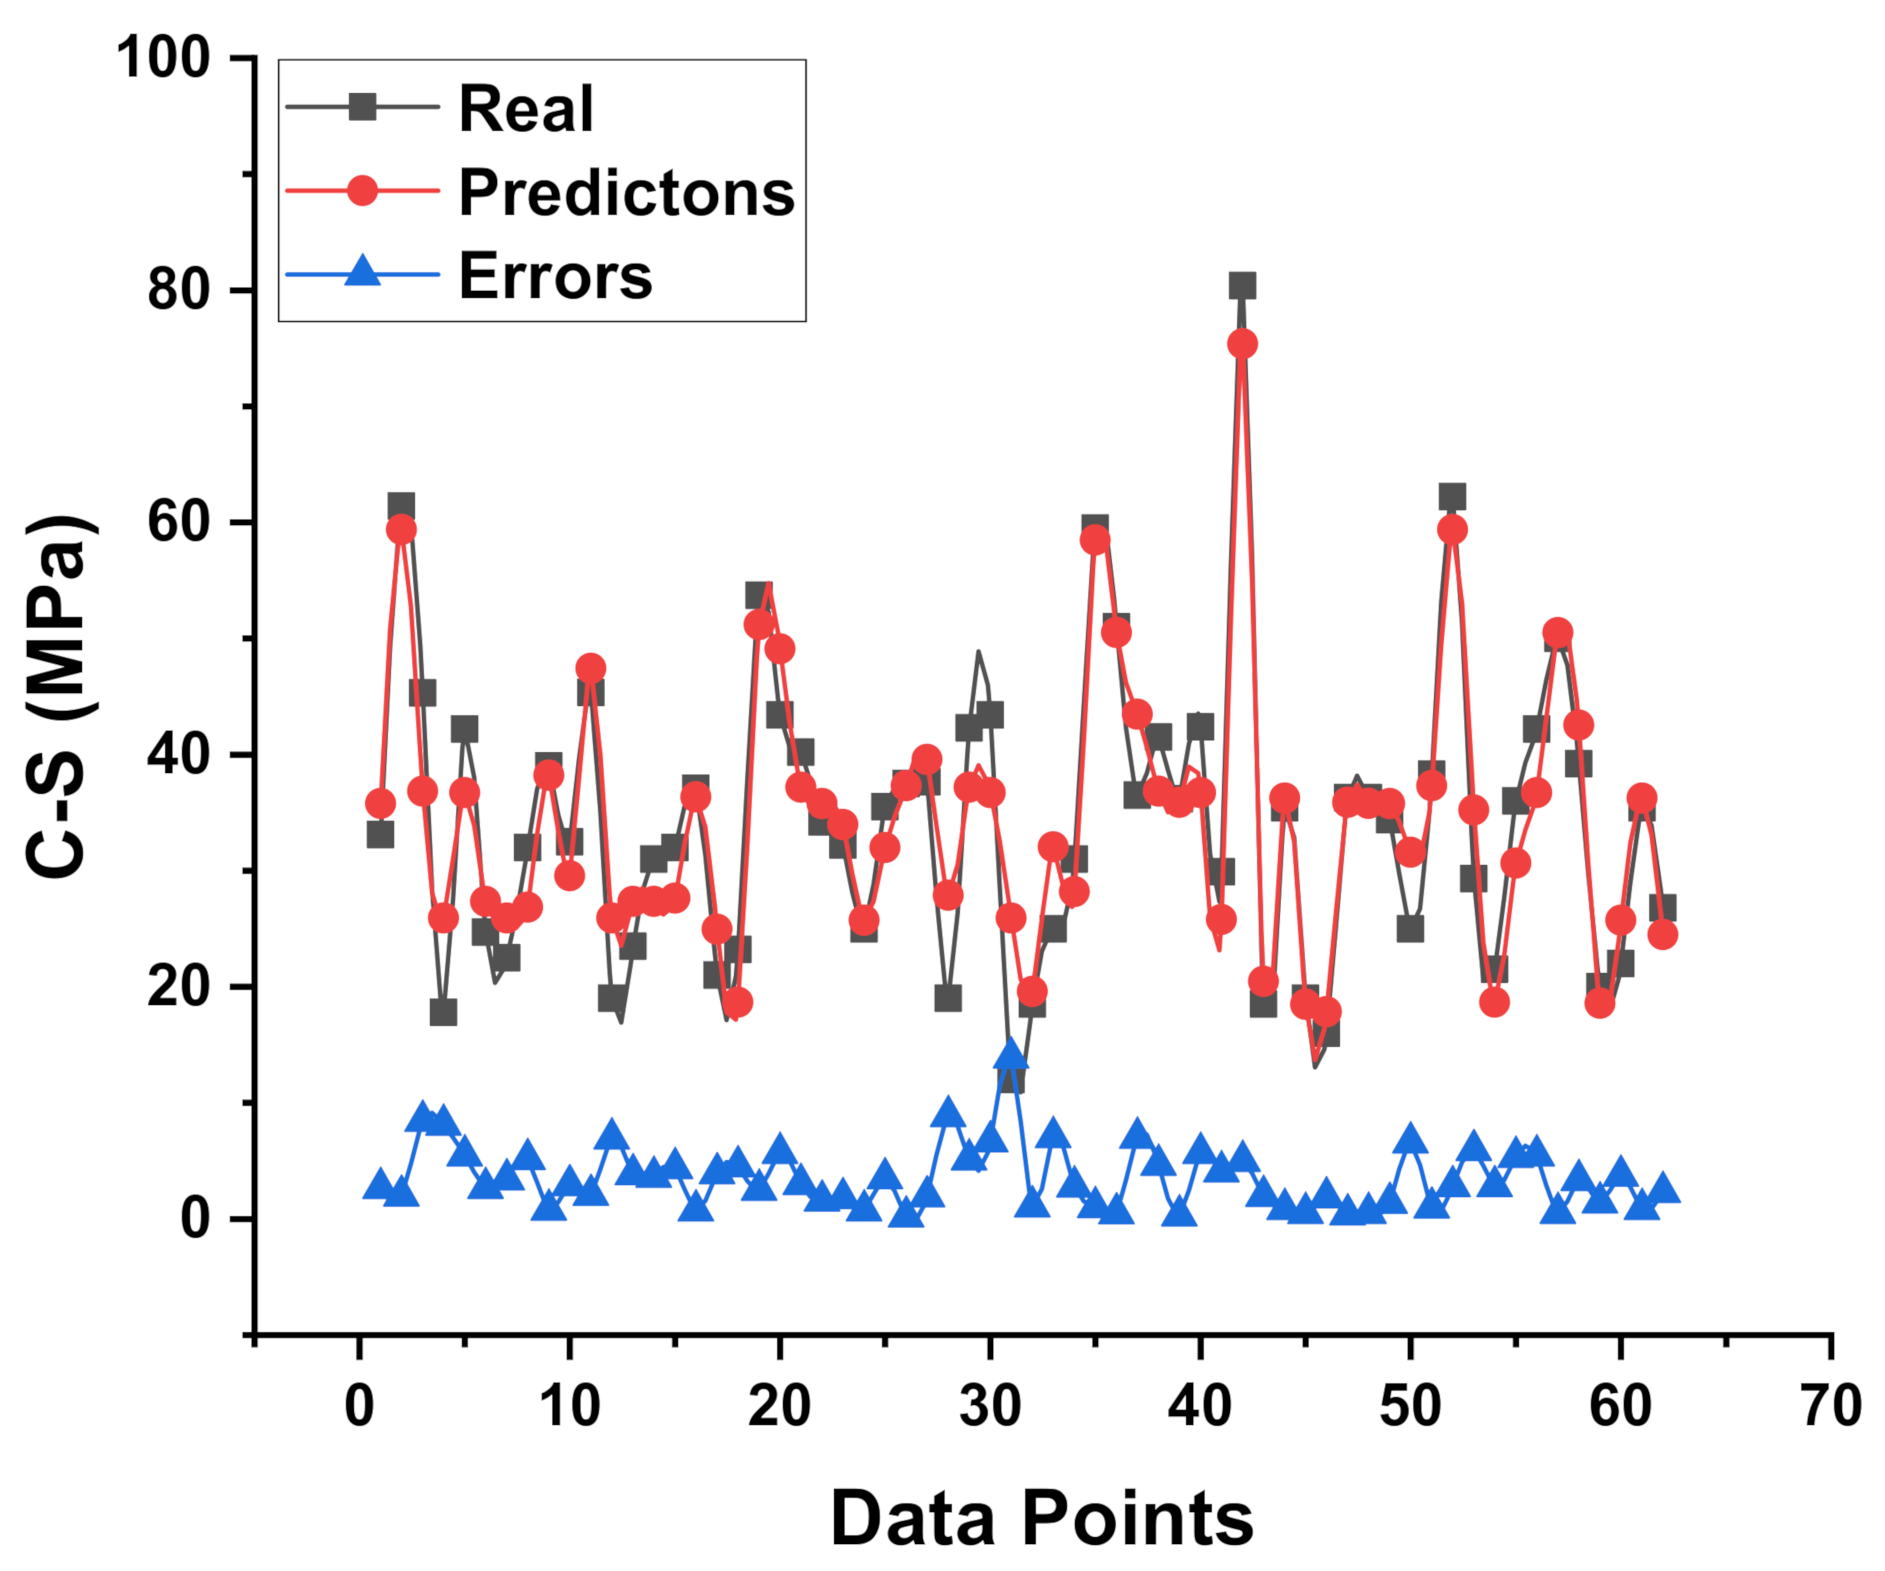
4.2. SVM Model Outcome

Figure 5 and Figure 6 compare the actual and expected outputs of the SVM model. Figure 5 gives the information of the correlation between results (experimental) and predictions from the SVM model, indicating the R2 value of 0.91. This result of SVM is the reflection of more accuracy as opposed to MLP model output. The spread in the form of colored dots of experimental values (real), predicted outcomes from the SVM model, and difference values between these are depicted in Figure 6. In addition, the lower, maximum, and average values of the errors for the set were noted as 0.025 MPa, 5.0 MPa, and 1.49 MPa, respectively. Moreover, 32.2% of the data was lying between 0 and 1 MPa, 59.67% data was reported among the 1 MPa and 3 MPa, while only 8.064% data was lying above 3 MPa.

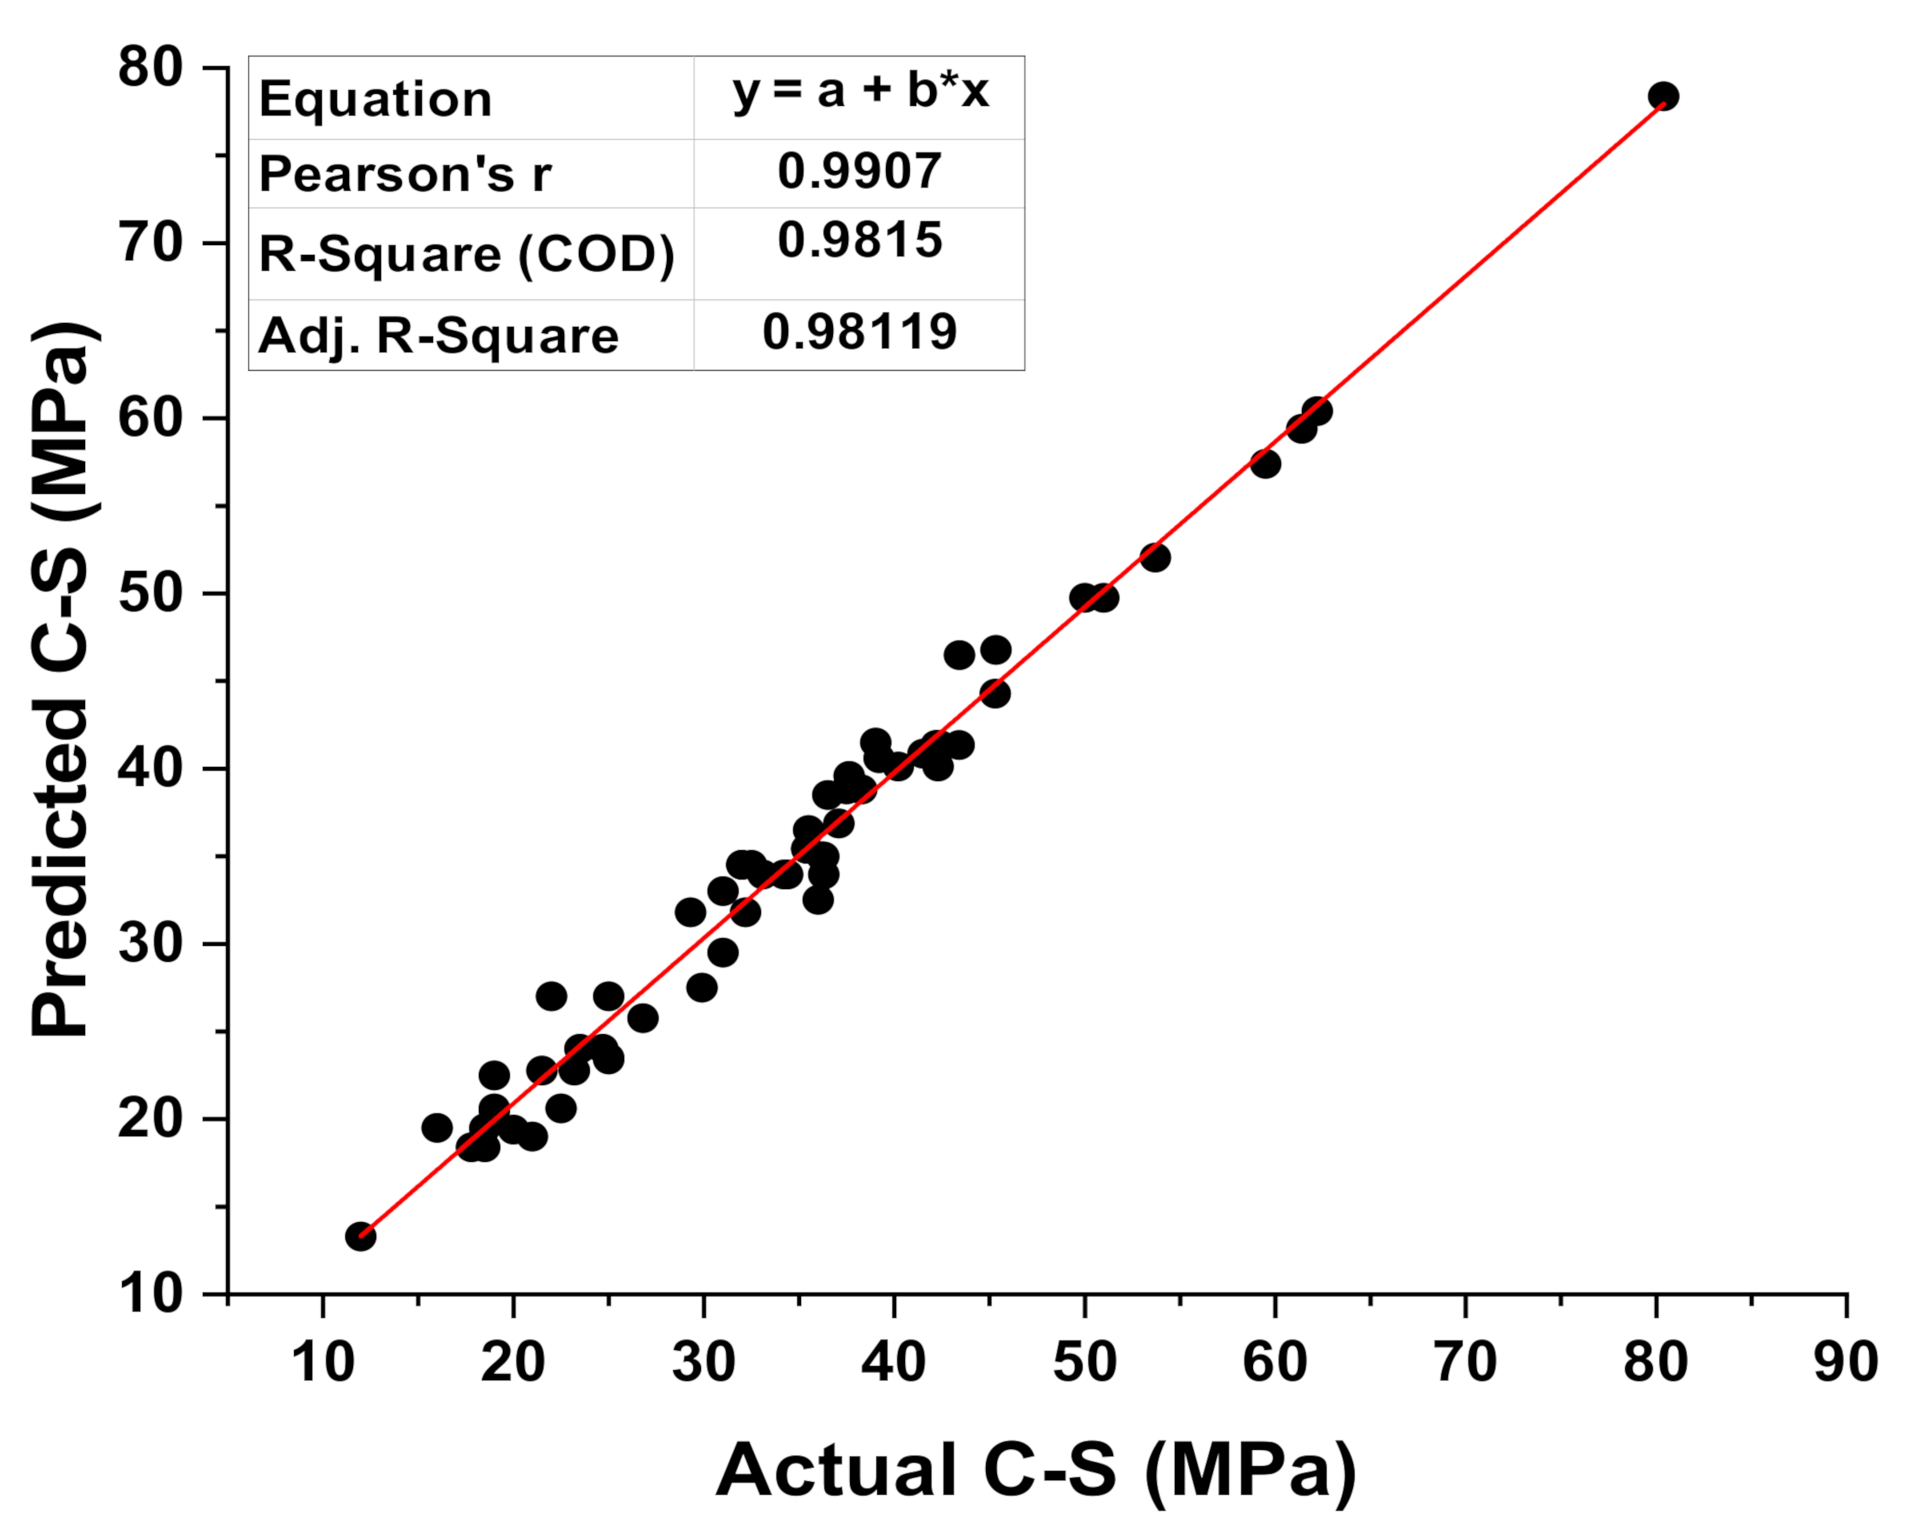
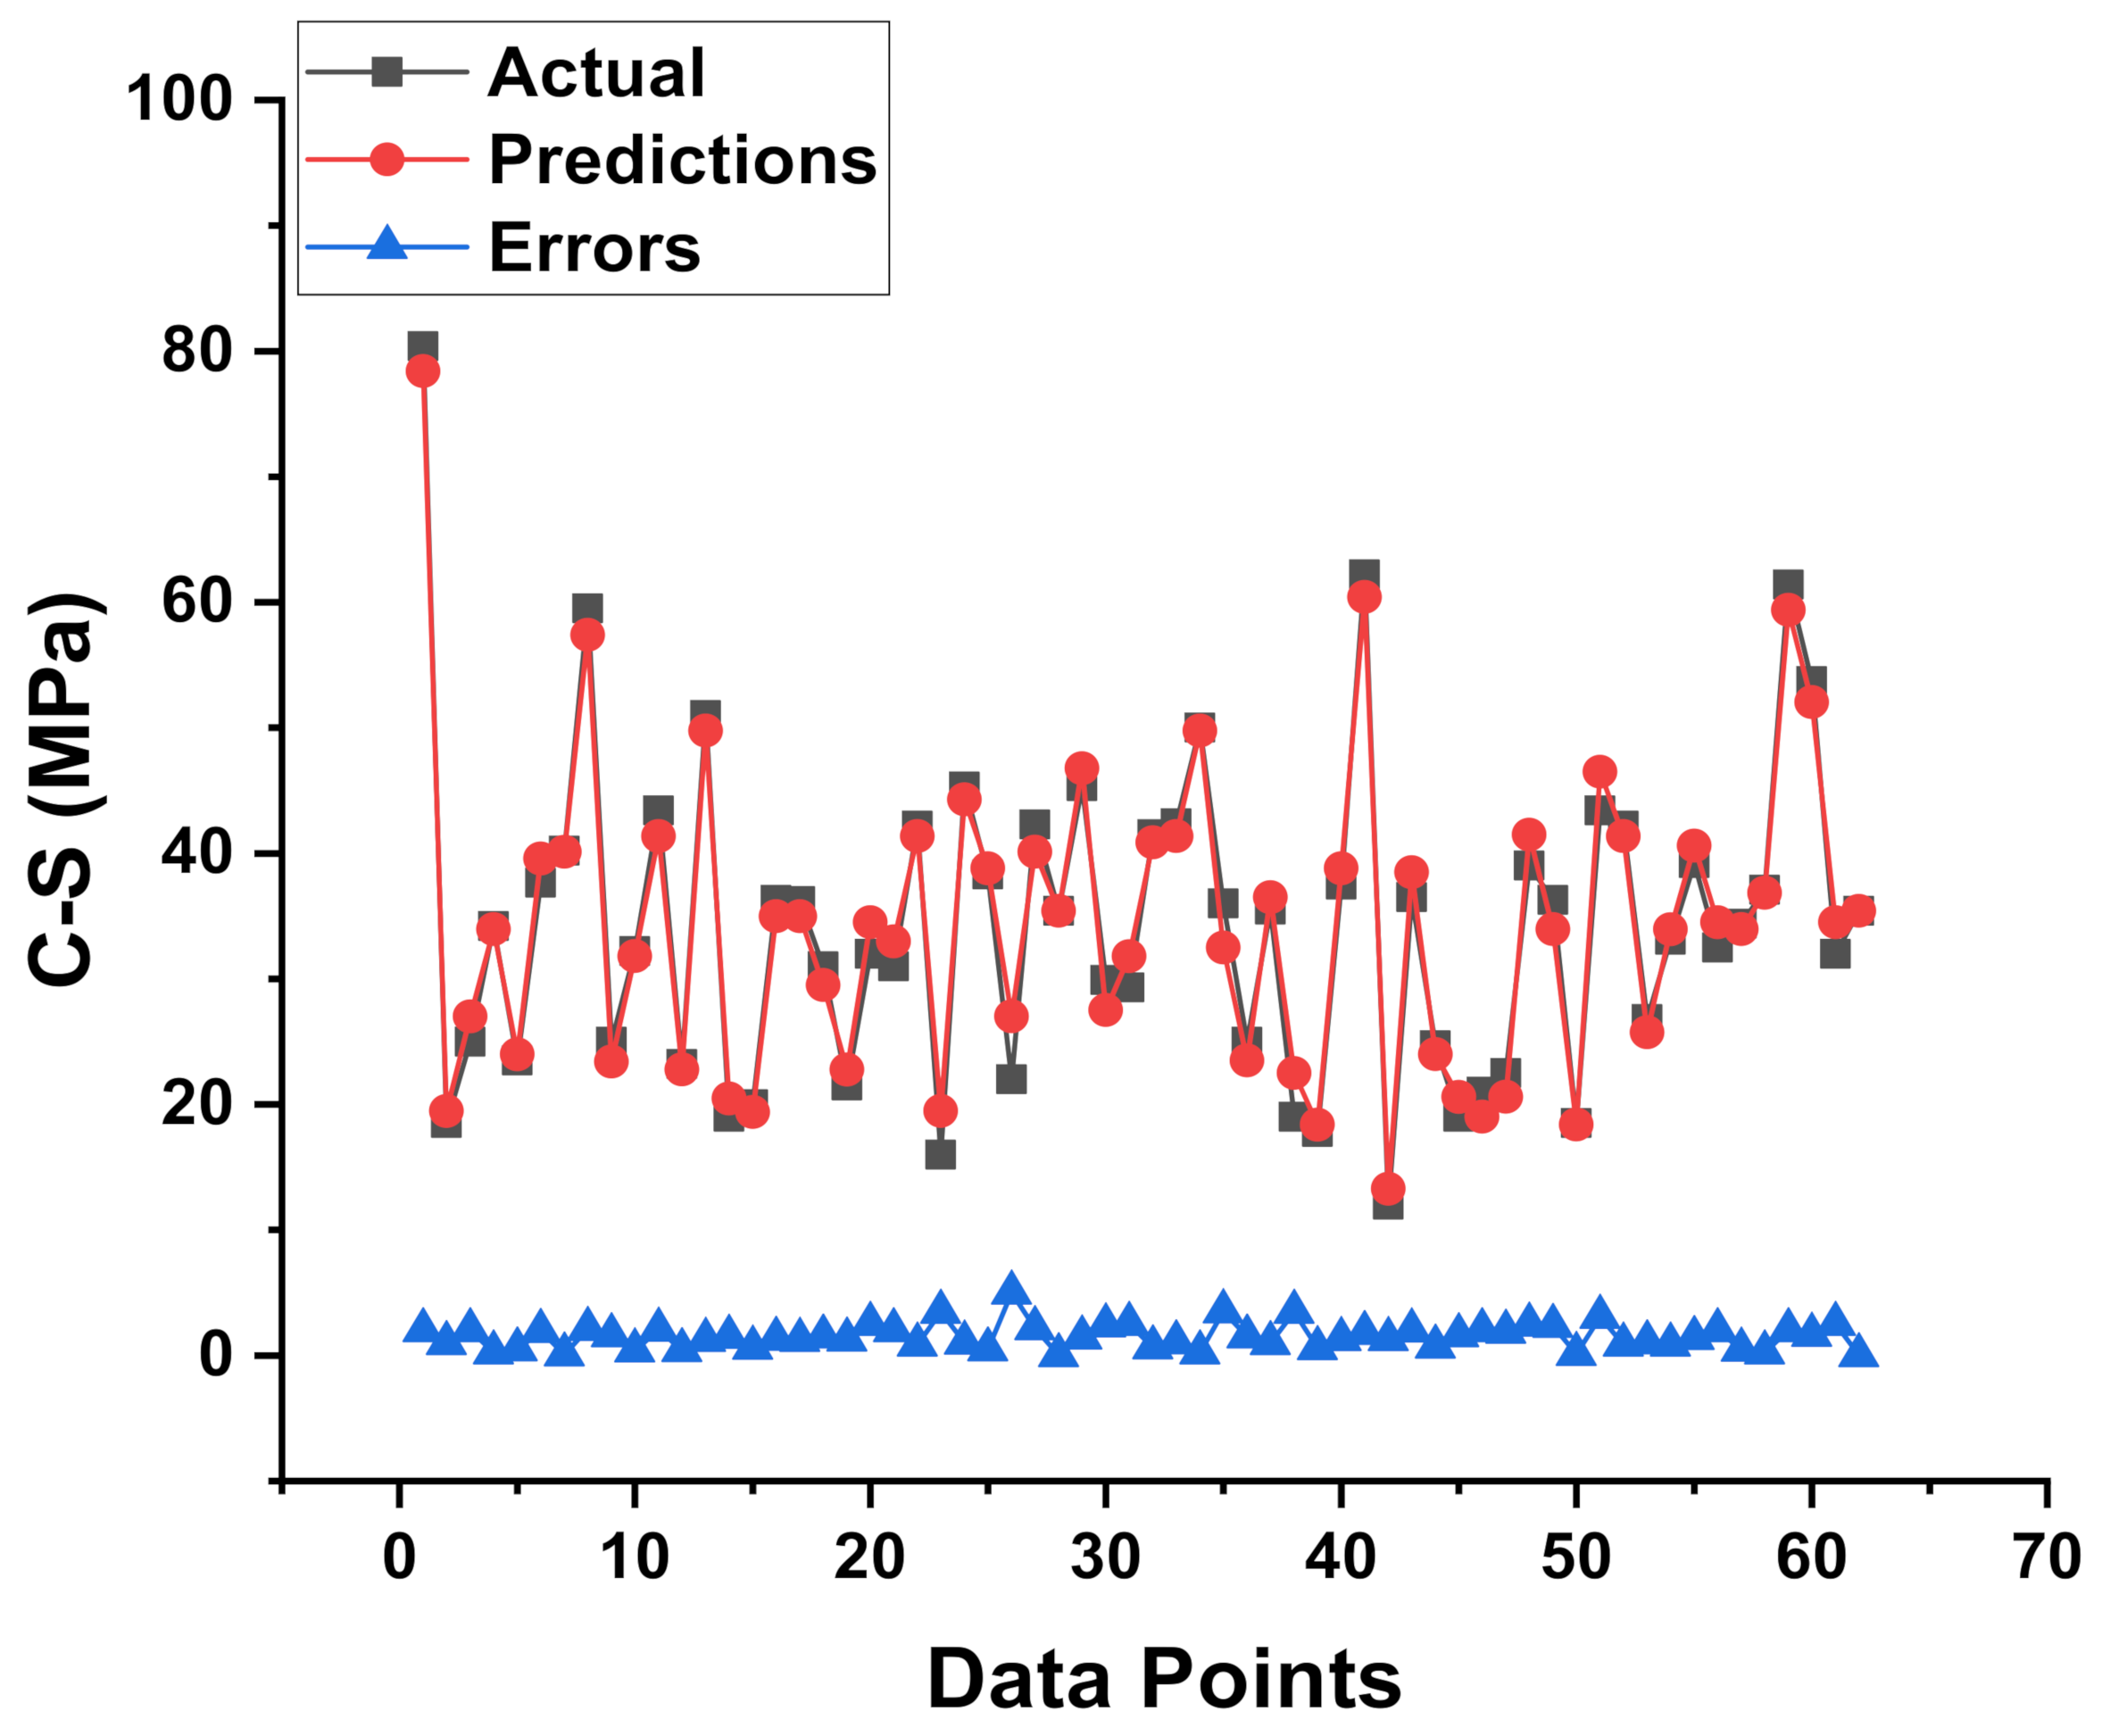
4.3. XGBoost Model Outcome

Figure 7 illustrated the connection between the results of C-S from the various mixes through experimental work and anticipated C-S results obtained from the XGB model (predicted). This model gives an R2 value of 0.98, showing that it was more accurate at predicting outcomes than the MLP and SVM models. The dispersal of the colored dots for the results obtained from the various mixes during the experimental approach results generated from the XGB model (predicted), and the difference of these two results is shown in Figure 8. It was also reported that the distribution of the errors gives the maximum, lowest, and average results for the selected set as 11.37 MPa, 0.005 MPa, and 2.77 MPa, respectively. In the meantime, 24.19% of the data was noted between 0 and 1 MPa, 45.16% of data was lying between 1 MPa and 3 MPa, and 30.64% of the data was noted above 3 MPa.

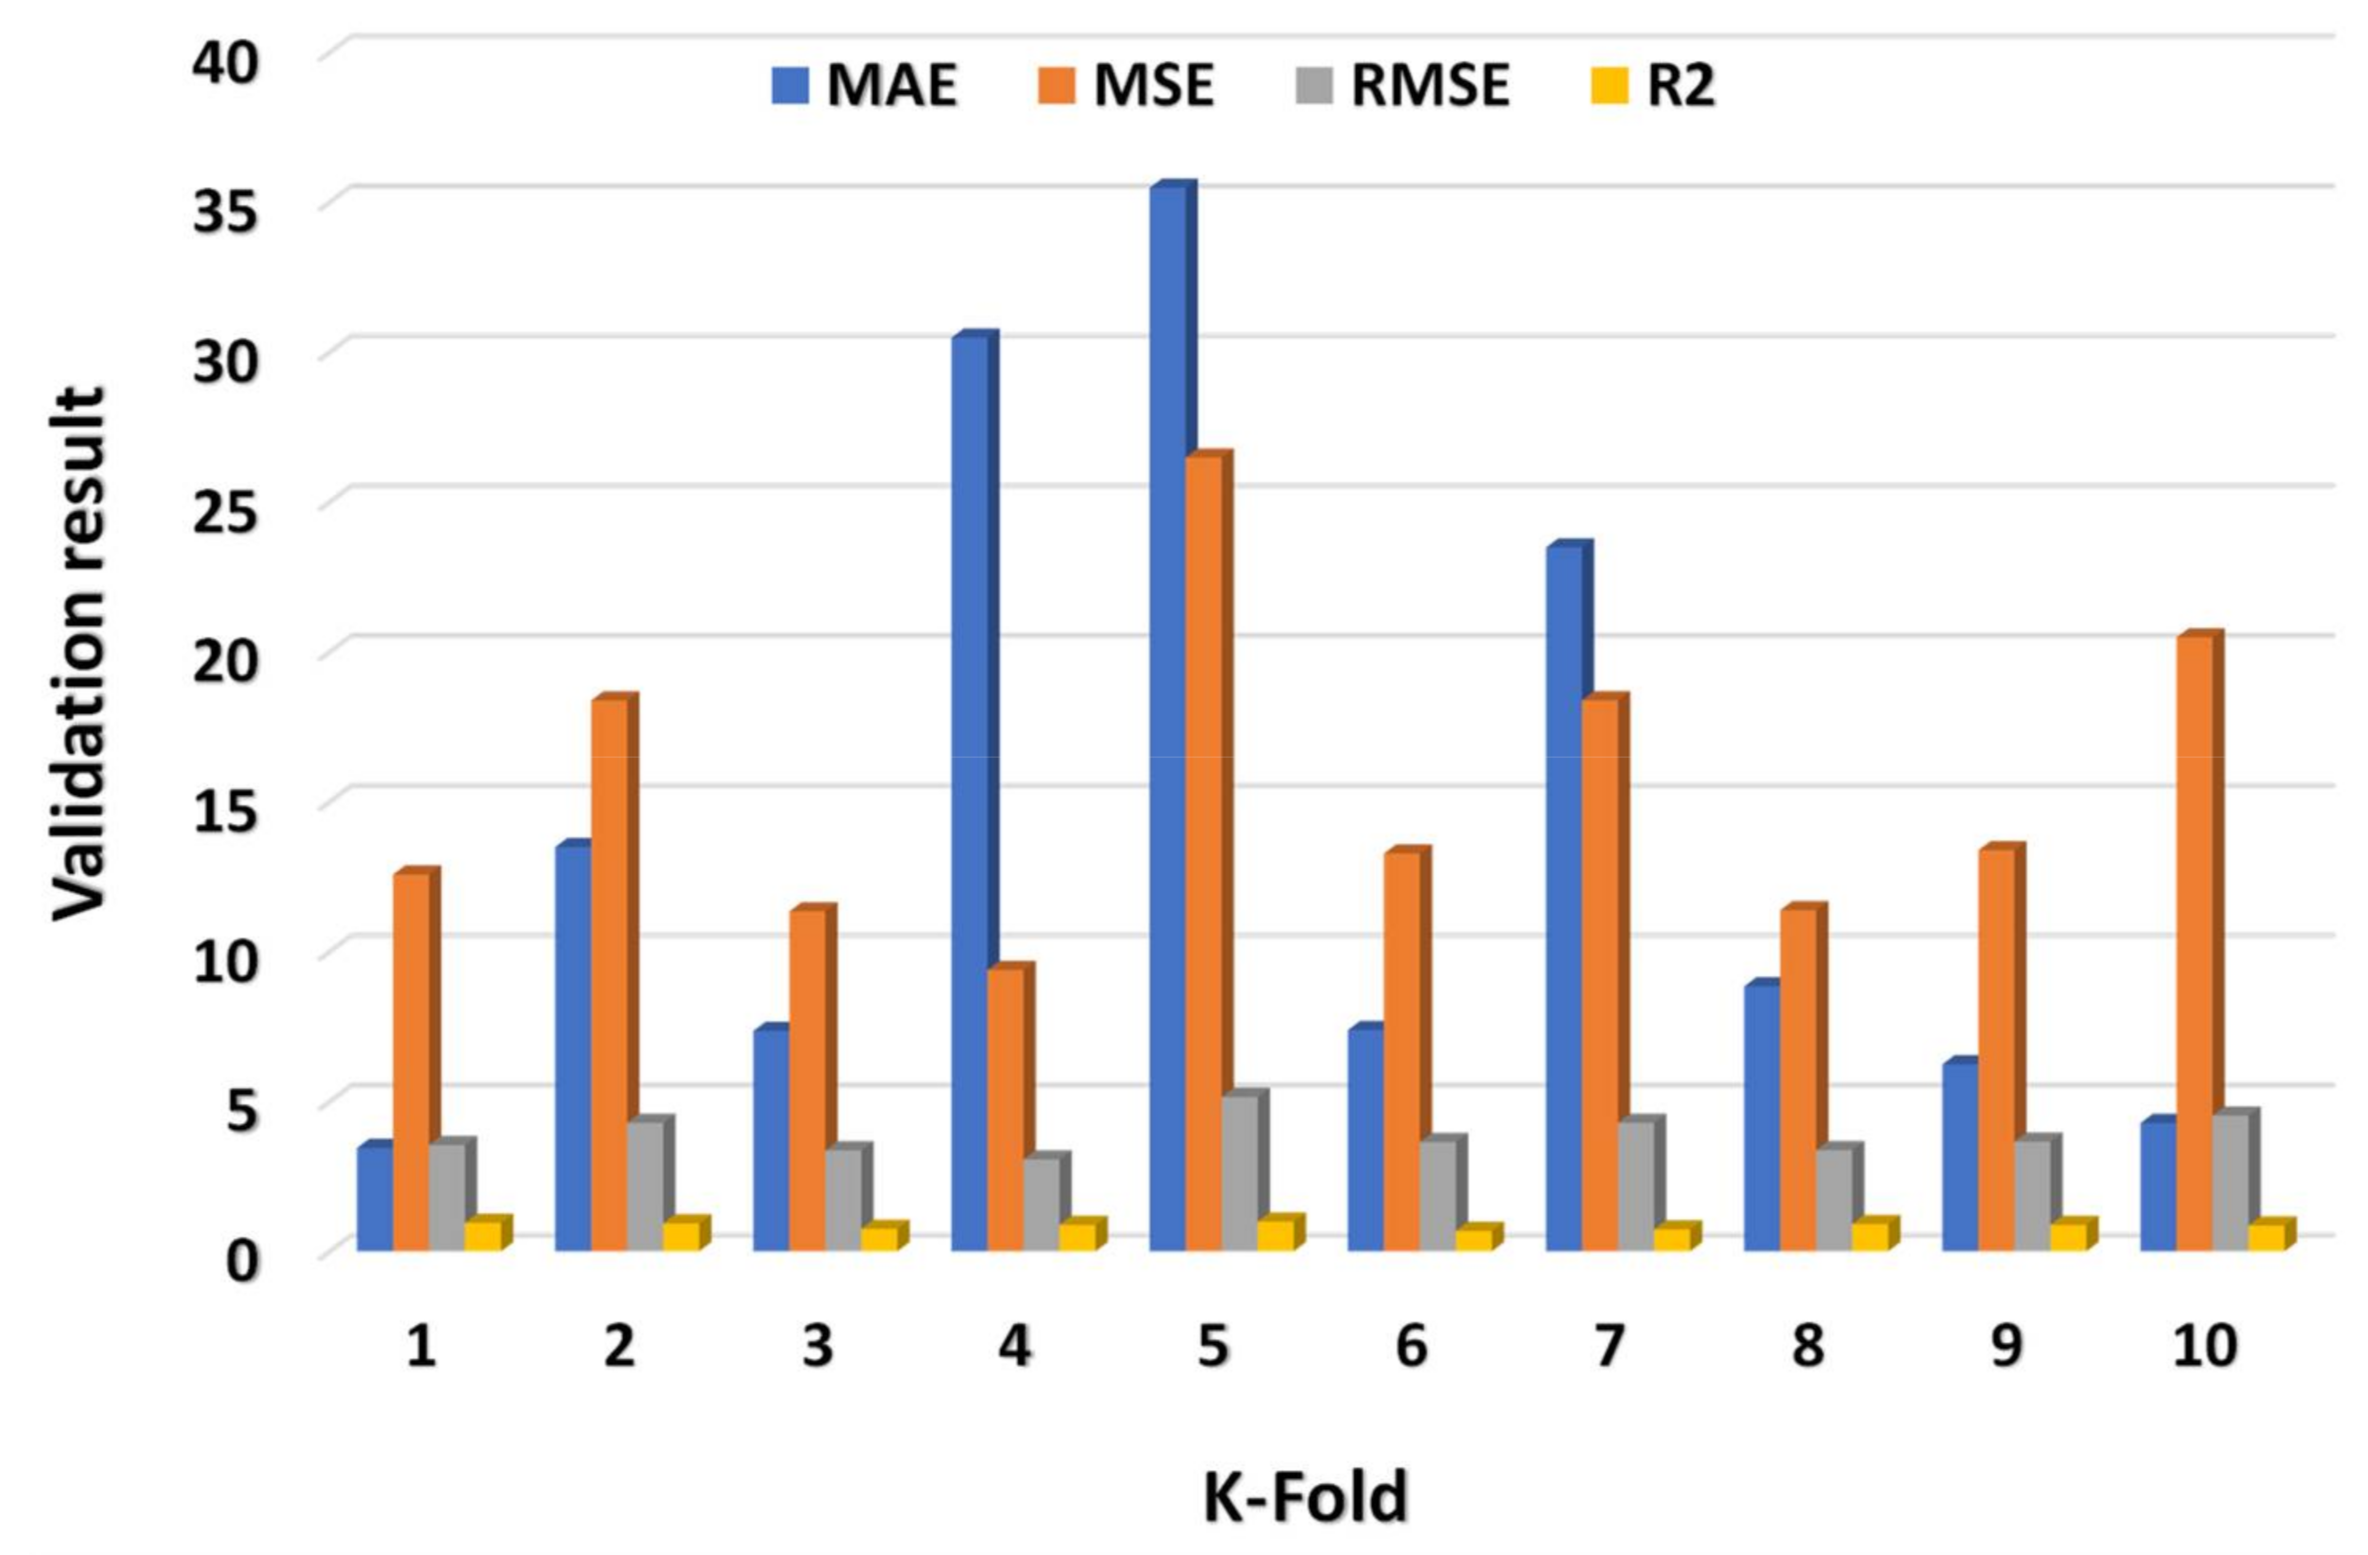
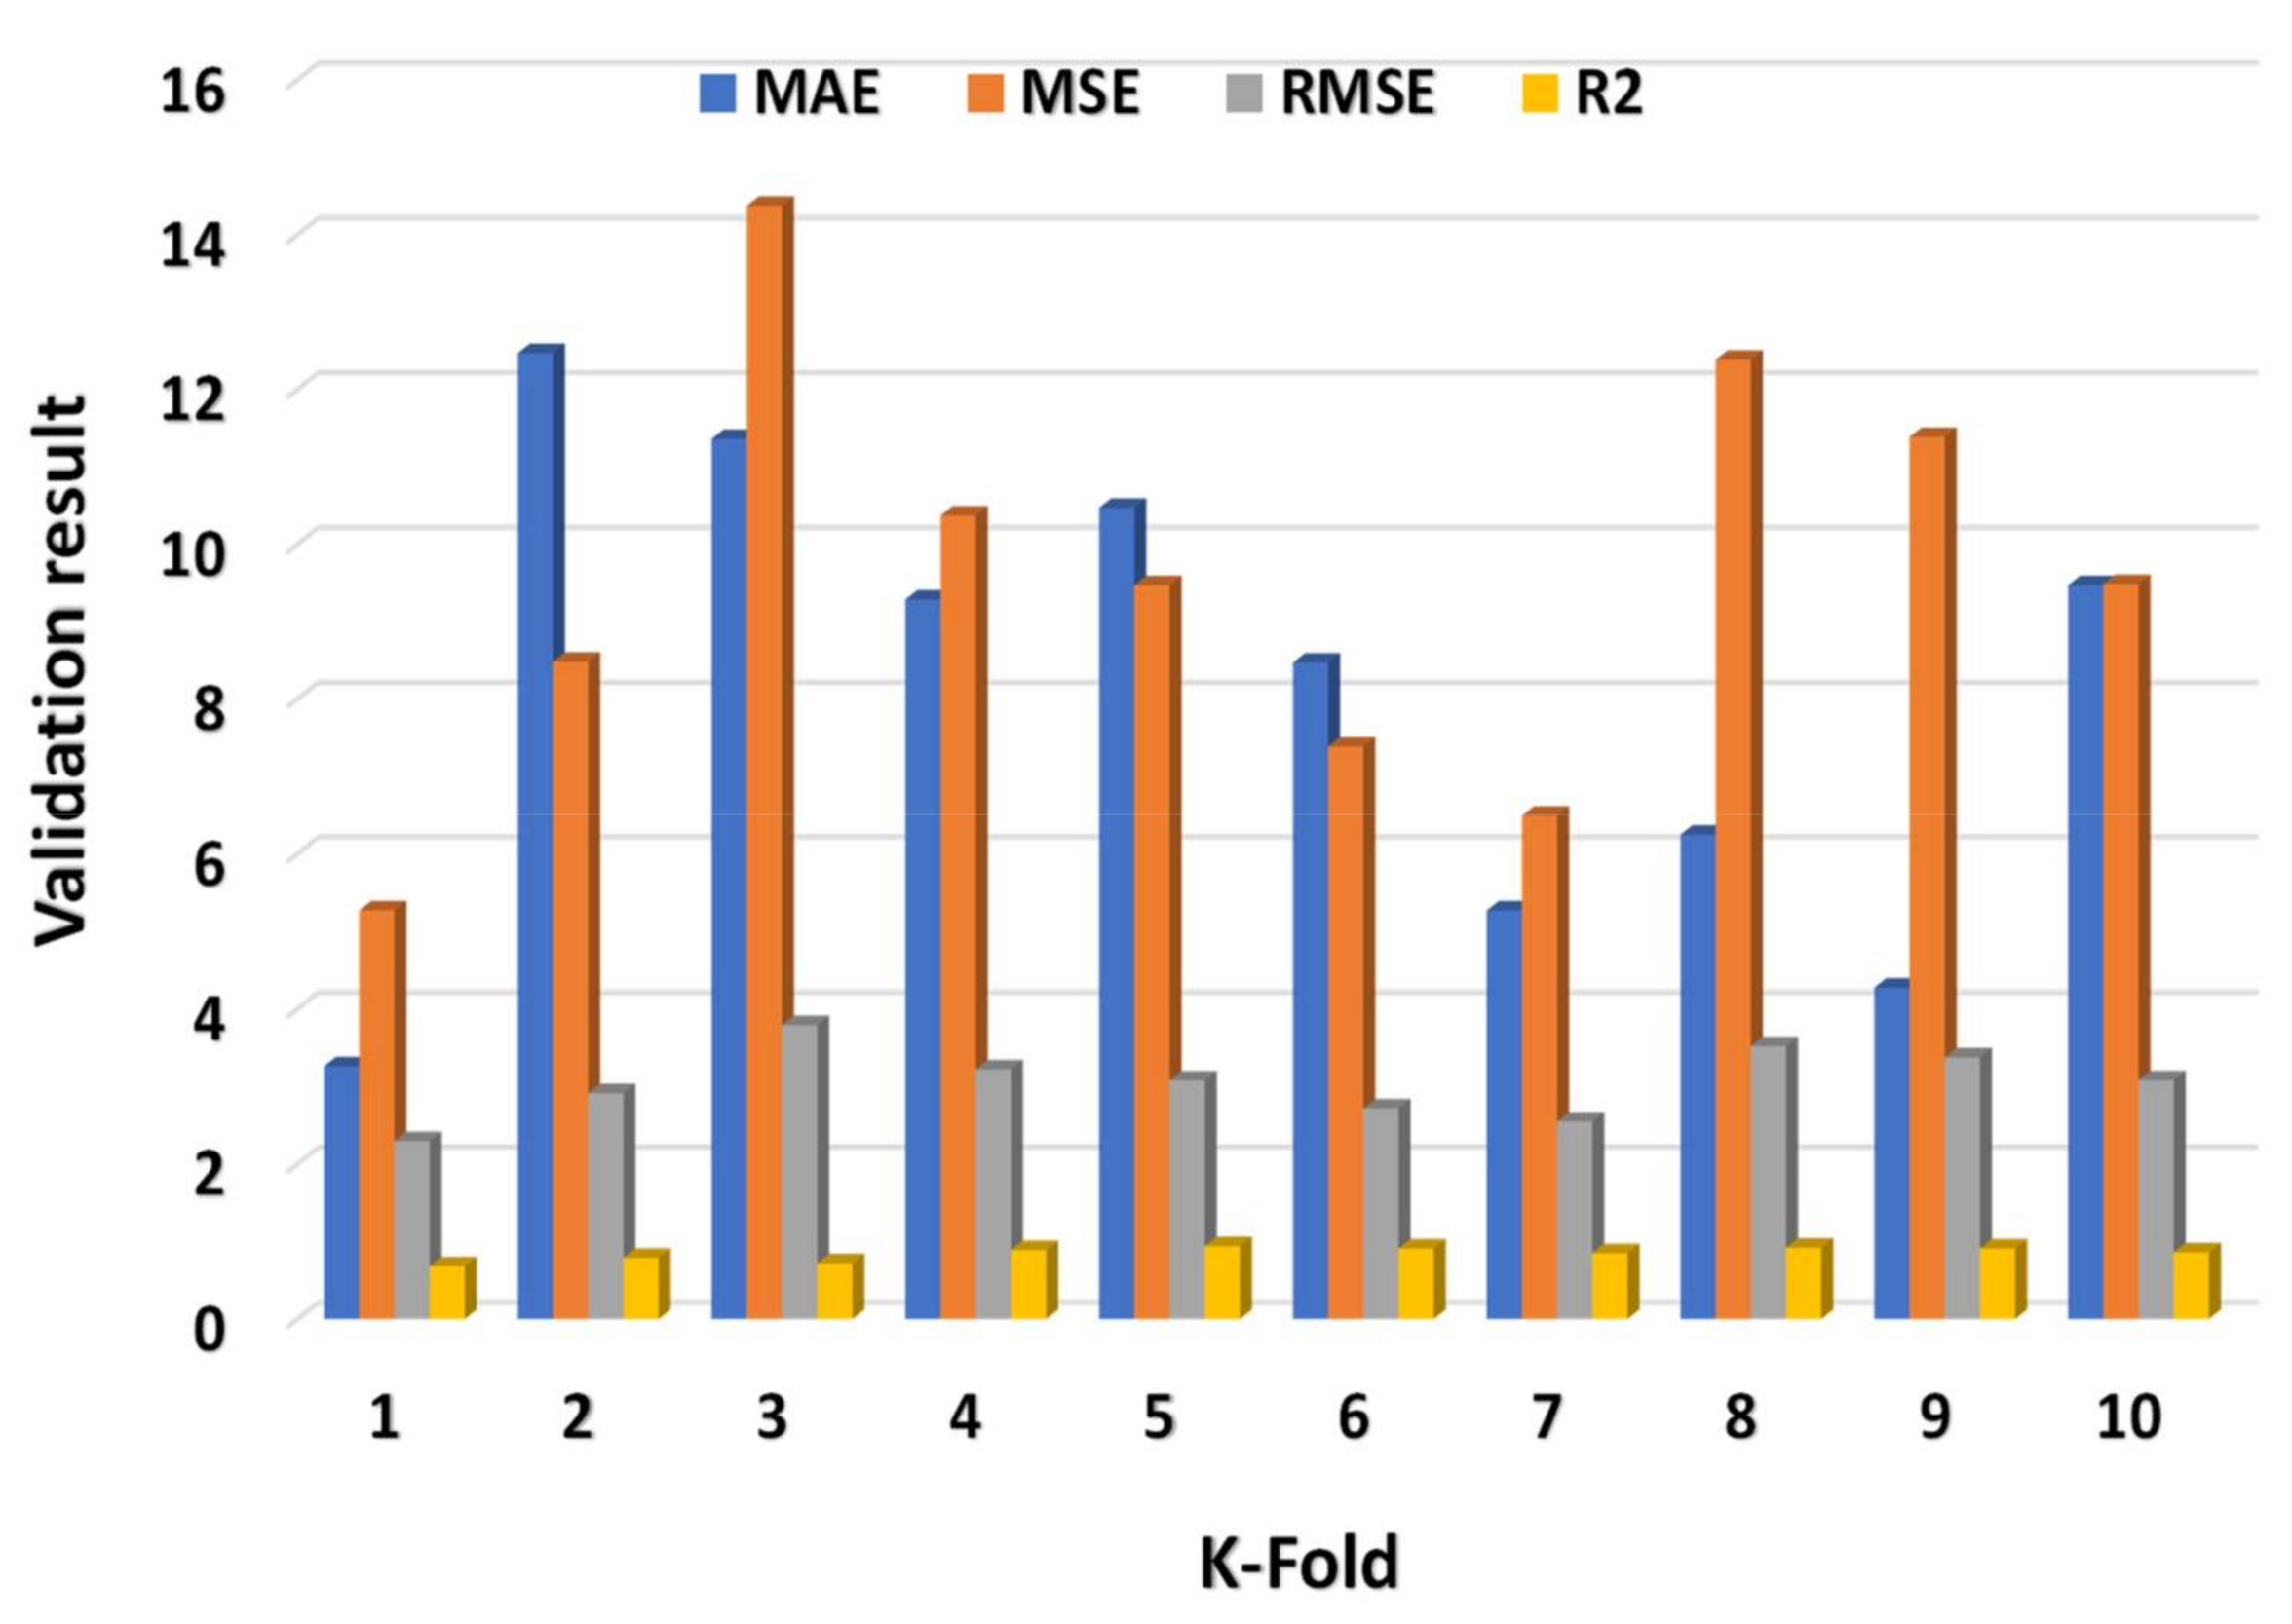
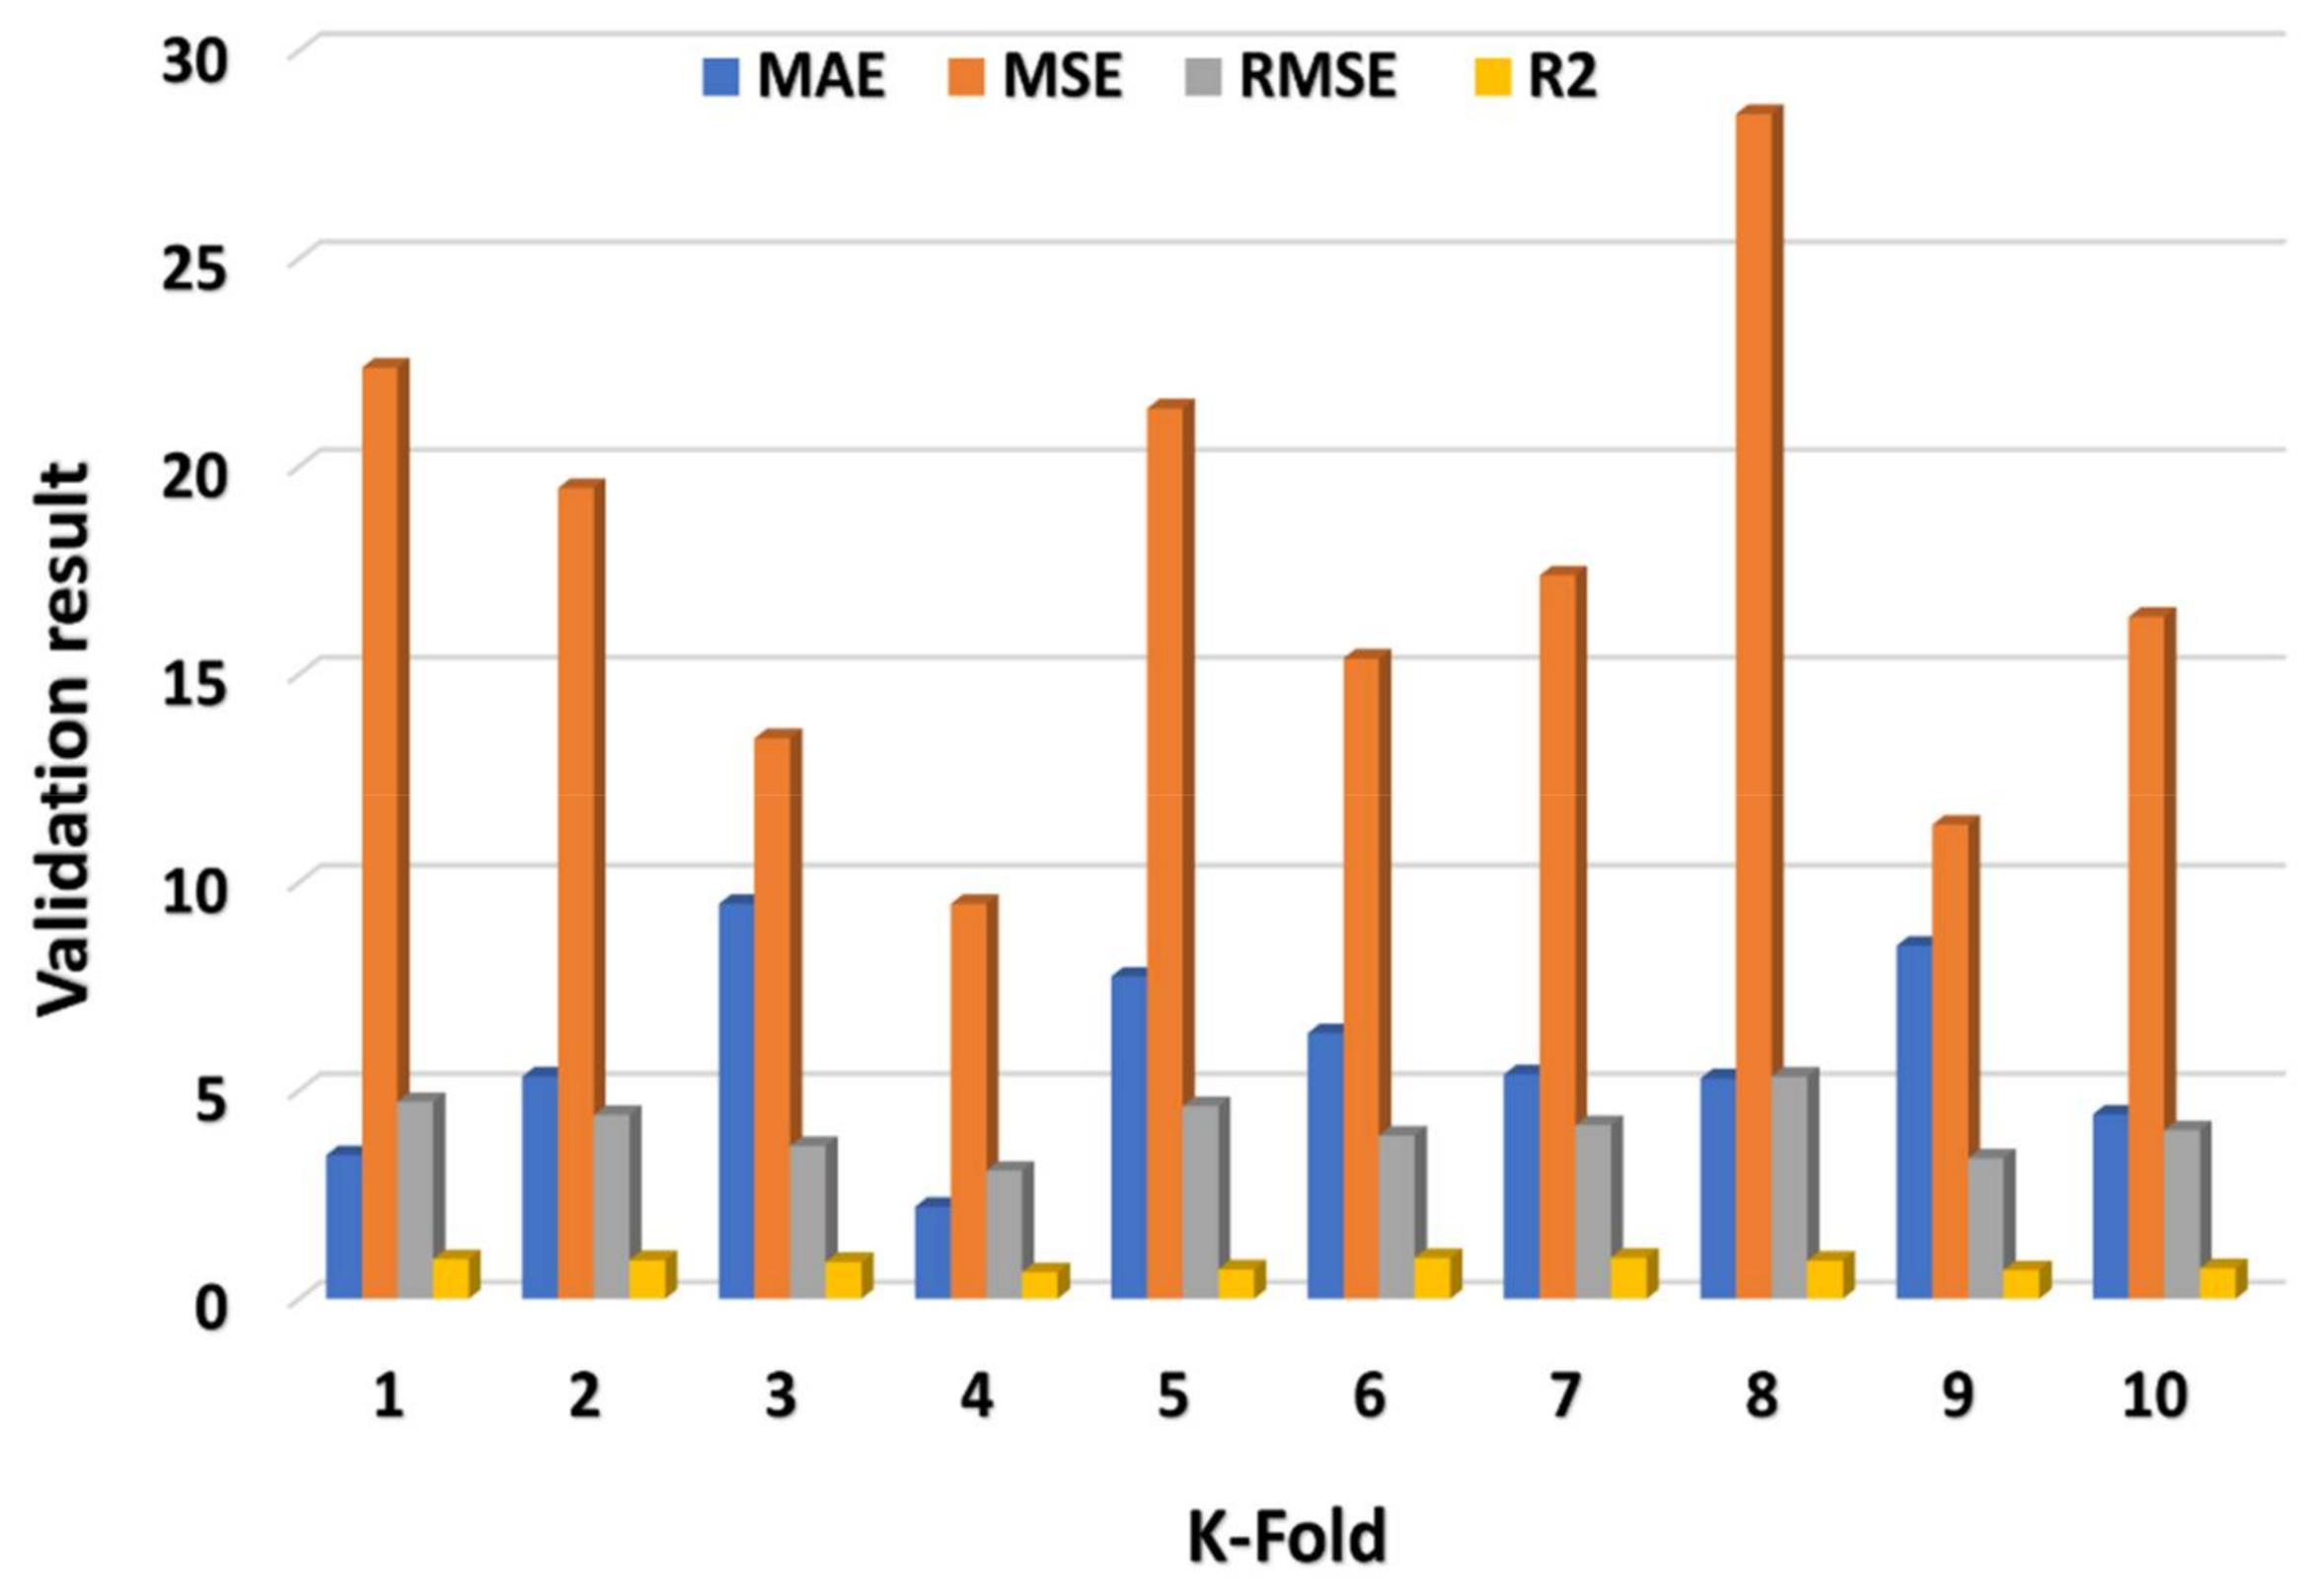
5. K-Fold Cross-Validation (CV) Approach

K-fold CV is a widely used strategy among data scientists. It is a data partitioning approach that enables the efficient use of datasets in order to construct a more extended model. The primary goal of any type of machine learning is to create a more generic model capable of performing well on unknown data. While it is possible to develop a flawless model with 100 percent accuracy or zero error on training data, it may fail to generalize unobserved data. As a result, it is an inadequate model. It produces overfitting of the training data. Machine learning is all about generalization, which means that the performance of a model may be determined only using data points that were not utilized during the training process. Therefore, the data are frequently split into a training and a test set. With k-fold cross-validation, the data splitting procedure may be performed more effectively.
The dataset is subdivided into k subsets, and the holdout approach was used for each subset k times. At every stage of time, single k subsets were used as the test set, while the other k-1 subsets comprised the training. The error average for all trails (k) is then evaluated. The importance of this trend is that it is less important than how the data are separated. Data points normally show his appearance only one time in a test set, while it shows k-1 time his appearance in the training set. The increase in the k showed a decrease in the variance of the resulting estimate. The drawback of this process is that the training algorithm should run k times from scratch, which implies that doing an evaluation requires k times as much work. A variation on this strategy is to split the data randomly into a test and training set k times. The advantage of this approach is that you can separately determine the size of each test set and the number of trials to average. In addition, the statistical measure for the ML approaches is illustrated in Table 2.
Statistical analysis was used to evaluate the models’ predictive ability in co-occurrence with the following Equations (1)–(3).
RMSE   =   i   =   1 n   e x i     m o i 2 n
MAE   =   i   =   1 n e x i m o i n
R   =   i   =   1 n e x i e x ¯ i m o i m o ¯ i i   =   1 n e x i e x ¯ i 2 i   =   1 n m o i     m o ¯ i 2
where, e x i , m o i , e x ¯ i ,   m o ¯ i ,   and n are the actual, predicted, mean actual, mean predicted values, and the number of samples, respectively.
The MAE, R2, MSE, and RMSE values were utilized to assess CV, and their dispersal for MLP, SVM, and XGB model’s outcome are shown in Figure 9, Figure 10 and Figure 11, respectively. The XGB algorithm showed the minimum error and came up with a high R2 value, indicating it is the most effective predictive approach. As illustrated in Figure 11, the highest, minimum, and average R2 values for the MLP model were 0.99, 0.68, and 0.86, respectively. The highest, lower, and average R2 results for the SVM model were 0.94, 0.68, and 0.85, respectively, as shown in Figure 9. In contrast, the XGB model’s greatest, lowest, and average R2 values were 0.99, 0.64, and 0.84, respectively, as illustrated in Figure 11. Additionally, the MAE, MSE, and RMSE maximum values for the MLP model were 35.48 MPa, 26.48 MPa, and 5.15 MPa, respectively (Figure 9), whereas the SVM model’s MAE, MSE, and RMSE maximum values were 12.47 MPa, 14.37 MPa, and 3.79 MPa, respectively (Figure 10). The MAE, MSE, and RMSE values for the XGB model, on the other hand, were 9.48 MPa, 28.48 MPa, and 5.34 MPa, respectively. This also validated the XGB model’s high precision in predicting the C-S of GPC.

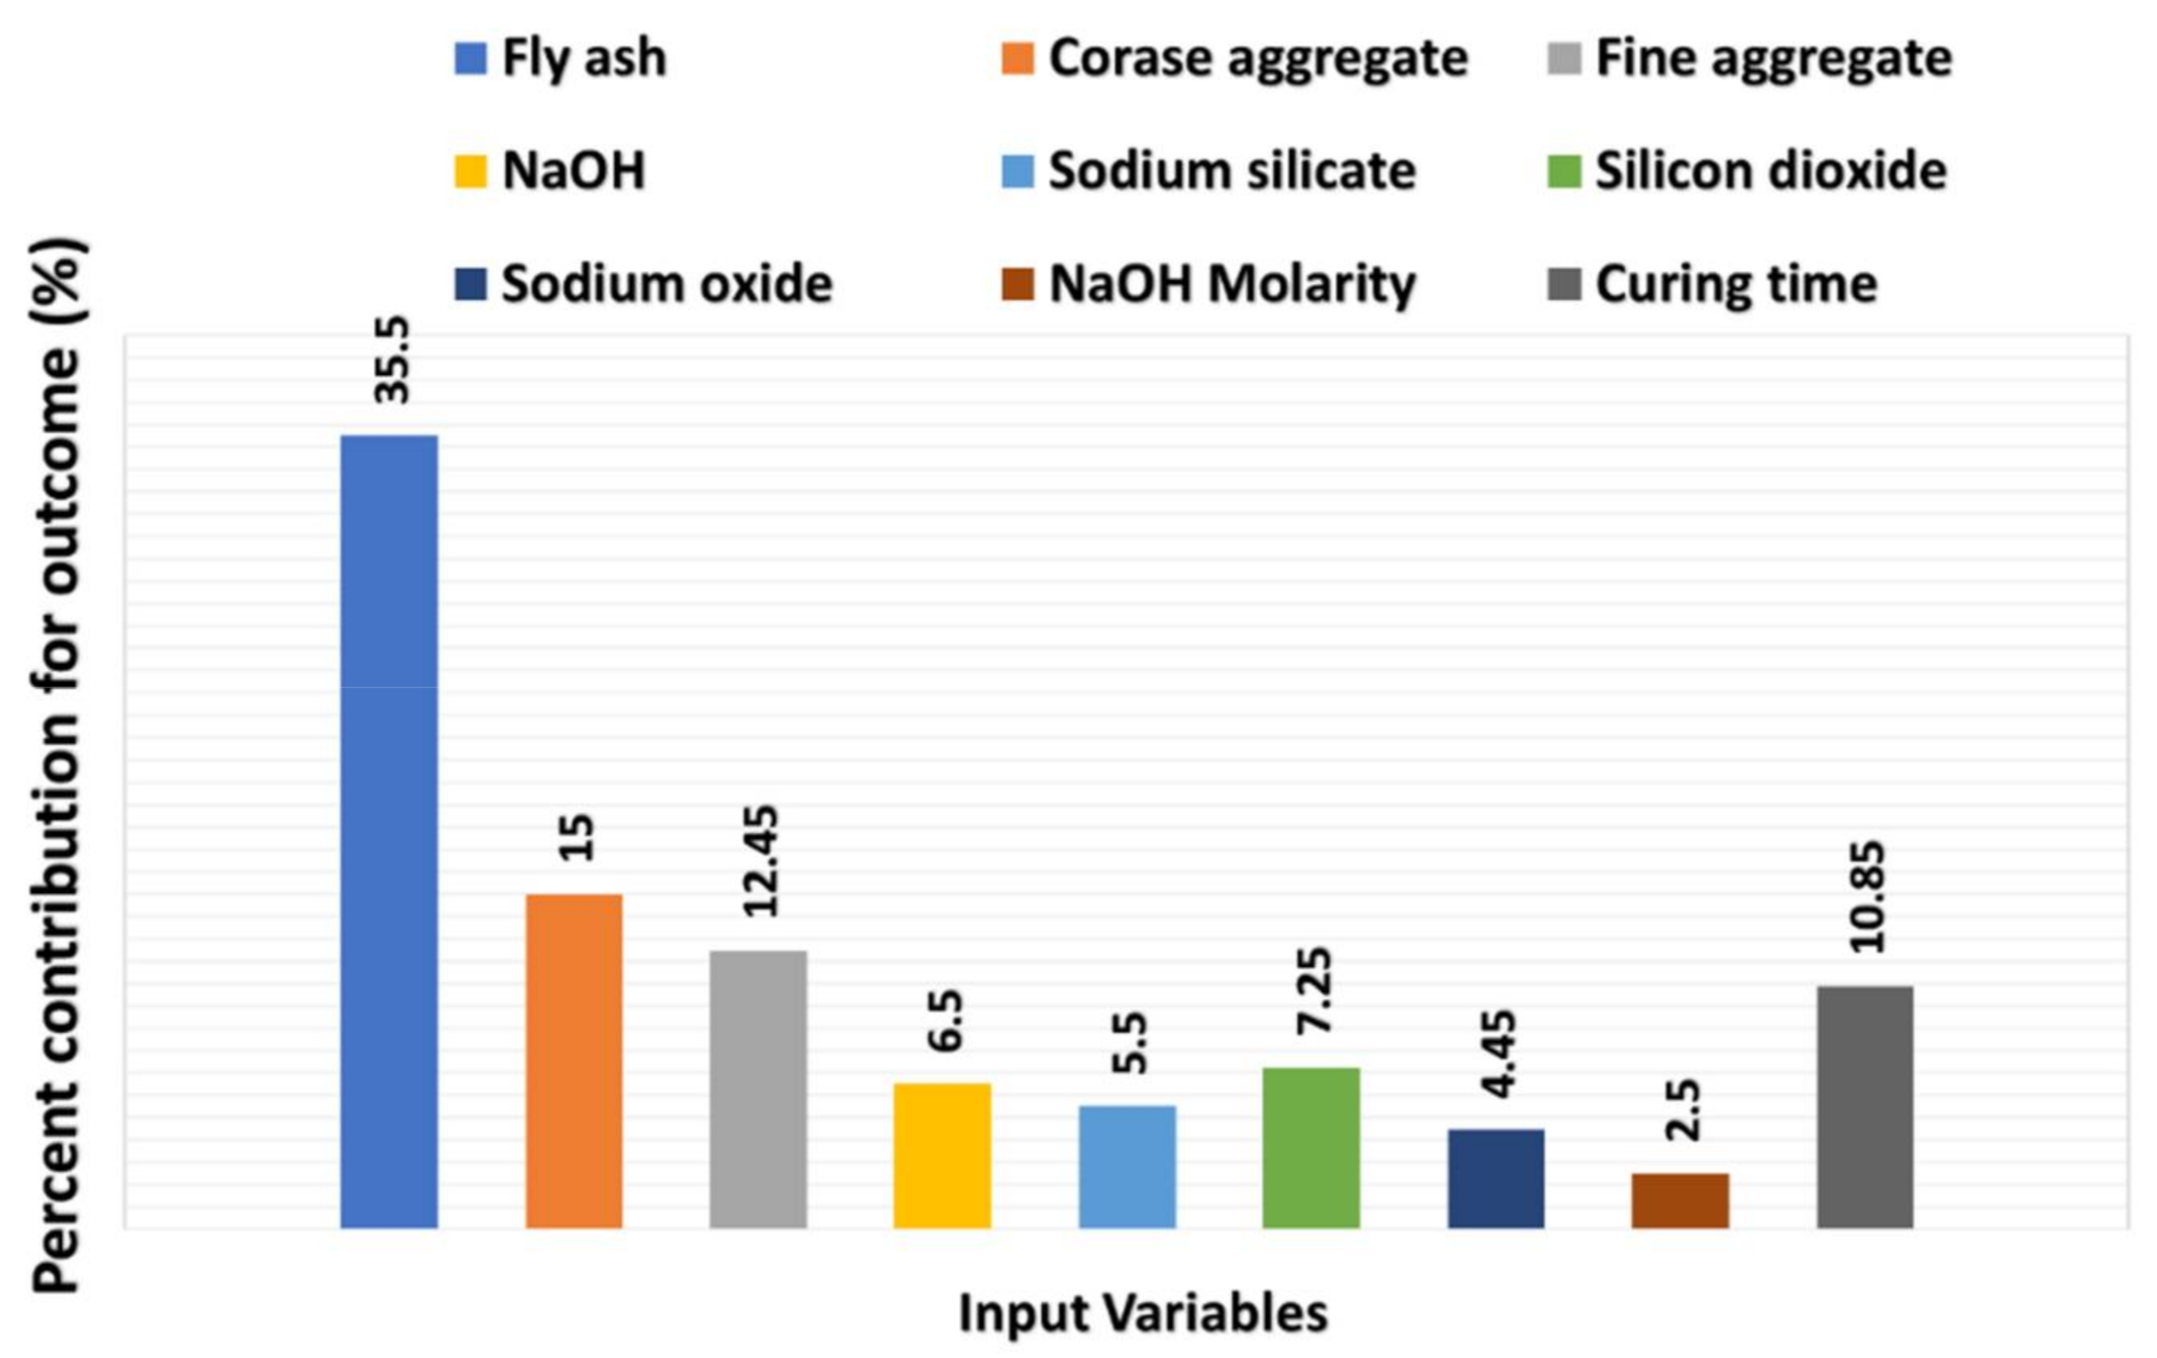
6. Sensitivity Analysis

The purpose of this analysis is to ascertain the effect of input parameters on GPC C-S anticipating. The variables (input) have a substantial influence on the predicted results [62]. The impact of each parameter on the C-S predicting is shown in Figure 12. The results indicated that FA contributed the most (35.5 percent), followed by coarse aggregate (15 percent) and fine aggregate (12.45 percent). The remaining variables, on the other hand, come up with significantly less to the prediction of GPC C-S, with molarity accounting for 2.5 percent, Na2SiO3 accounting for 5.5 percent, curing time accounting for 10.85 percent, NaOH accounting for 6.5 percent, SiO2 accounting for 7.25 percent, and Na2O accounting for 4.45 percent. Sensitivity analyses produce results that are proportional to the input variables and total dataset employed to construct the model. Nevertheless, the ML algorithm detects the influence of every setting. With the variation in the proportion of mixes and the inclusion of new parameters, these analyses generate inconsistent results. The participation of variables in the model’s results was calculated using the following Equations (4) and (5).
N i   =   f m a x x i     f m i n x i
S i   =   N i j     i n N j

7. Discussion

The motive of this research was to demonstrate the utility of both individual and ensemble ML algorithms for estimating the C-S of GPC, a geopolymer binder that was designed to be used in the concrete manufacturing process in place of cement. The objective was to create a type of material that is environmentally friendly and cement-free. This work predicted the C-S of GPC with MLP, SVM, and XGB ML algorithms. The number of input parameters has a significant effect on the required outcome as reported in the literature [88]. The number of input variables can be enhanced by incorporating the other environmental effects, such as temperature and humidity. The XGB model’s output showed high accuracy, with an R2 value of 0.98, opposed to 0.91 for the SVM technique and 0.88 for the MLP approach. The high accuracy of the XGB model has also been reported in the literature [89,90]. In contrast, the performance was examined of the MLP, SVM, and XGB models using analysis (statistical) and the k-fold CV technique. The minimum result of the errors (RMSE, MAE, MSE) is also the confirmation of a more accurate model. However, evaluating and recommending the ideal ML regressor for anticipating results across a variety of fields is challenging, as the parameters and dataset play a vital role in the model’s accuracy. Moreover, ensemble ML algorithms frequently make use of the weak learner by producing sub-models for training on data and optimizing for the highest R2 value. Additionally, research depicts that the XGB technique shows higher accuracy than other ML techniques. Moreover, additional analysis (sensitivity) was done to investigate the effect of parameters on the projected C-S of GPC. The result of the selected models may be influenced by the model parameters and selected dataset. This analysis identifies which of the nine parameters (input) has the greatest influence on the predicted output. The python coding can also be arranged to evaluate or predict any type of output based on the provided input parameters.

8. Conclusions

This research describes the application of different ML approaches on the data of GP concrete retrieved from the literature. A total of 3 types of ML techniques were investigated on the 146 data points. The MLP, SVM, and XGB ML algorithms were used on the same data to predict the C-S of GP concrete. The below-mentioned conclusions can be drawn from the research:
  • The XGB model performs effectively and preciously towards the prediction of C-S of GP concrete;
  • The R2 result of XGB equals 0.98 and is a reflection of its high-level performance as opposed to the R2 value of SVM (0.92) and MLP (0.88);
  • The statistical analysis and K-fold CV approach also confirm the accurate prediction of the XGB model;
  • The lower values of the statistical results in the form of errors, such as MAE, MSE, and RMSE, also give a reflection of the high precision of the XGB model for anticipating the C-S of GP concrete;
  • The sensitivity analysis shows that the maximum contributing input parameter was fly ash crossing 35% towards the prediction of C-S of GP concrete.
Moreover, the recommended ML approach is the XGB, which shows effective results towards the anticipation of C-S of concrete. The precision level of the selected algorithms can also be enhanced by increasing the dataset and input parameters. The other statistical checks, such as singular spectrum analysis (SPA), with the inclusion of other statistical metrics, such as normalized root-mean-square error (NRMSE), coefficient of variation (COV), overall index (OI), efficiency coefficient (EC), mean relative error (MRE), and residual mass coefficient (RMC), can also be applied to cross-verify the obtained results from the selected models [91]. The other ML approaches, such as ANN, Adaboost, and bagging regressor, can also be investigated to check the accuracy level for the prediction of required outcomes.

Author Contributions

R.C.: conceptualization, software, writing original draft. Z.F.: funding acquisition, data curation, writing, reviewing, and editing. M.J.: methodology, validation, writing, reviewing, and editing. Y.S.: resources, visualization; formal analysis, writing, reviewing, and editing. All authors have read and agreed to the published version of the manuscript.

Funding

This research received no external funding.

Institutional Review Board Statement

Not applicable.

Informed Consent Statement

Not applicable.

Data Availability Statement

Not applicable.

Acknowledgments

We thank the School of Civil Engineering and Architecture, Henan University for providing partial data support.

Conflicts of Interest

The authors declare no conflict of interest.

References

  1. Provis, J.L.; Bernal, S.A. Geopolymers and related alkali-activated materials. Annu. Rev. Mater. Res. 2014, 44, 299–327. [Google Scholar]
  2. Yang, H.; Liu, L.; Yang, W.; Liu, H.; Ahmad, W.; Ahmad, A.; Aslam, F.; Joyklad, P. A comprehensive overview of geopolymer composites: A bibliometric analysis and literature review. Case Stud. Constr. Mater. 2022, 16, e00830. [Google Scholar]
  3. Ren, B.; Zhao, Y.; Bai, H.; Kang, S.; Zhang, T.; Song, S. Eco-friendly geopolymer prepared from solid wastes: A critical review. Chemosphere 2020, 267, 128900. [Google Scholar] [PubMed]
  4. Podolsky, Z.; Liu, J.; Dinh, H.; Doh, J.H.; Guerrieri, M.; Fragomeni, S. State of the Art on the Application of Waste Materials in Geopolymer Concrete. Case Stud. Constr. Mater. 2021, 15, e00637. [Google Scholar]
  5. Mohajerani, A.; Suter, D.; Jeffrey-Bailey, T.; Song, T.; Arulrajah, A.; Horpibulsuk, S.; Law, D. Recycling waste materials in geopolymer concrete. Clean Technol. Environ. Policy 2019, 21, 493–515. [Google Scholar]
  6. Farooq, F.; Jin, X.; Javed, M.F.; Akbar, A.; Shah, M.I.; Aslam, F.; Alyousef, R. Geopolymer concrete as sustainable material: A state of the art review. Constr. Build. Mater. 2021, 306, 124762. [Google Scholar]
  7. Li, L.; Khan, M.; Bai, C.; Shi, K. Uniaxial Tensile Behavior, Flexural Properties, Empirical Calculation and Microstructure of Multi-Scale Fiber Reinforced Cement-Based Material at Elevated Temperature. Materials 2021, 14, 1827. [Google Scholar]
  8. Singh, B.; Ishwarya, G.; Gupta, M.; Bhattacharyya, S.J.C. Geopolymer concrete: A review of some recent developments. Constr. Build. Mater. 2015, 85, 78–90. [Google Scholar]
  9. Abdeldjalil, M.; Yousfi, S. Identification of sands of dune and concretes using a granular model—Case of arid region. Case Stud. Constr. Mater. 2020, 13, e00458. [Google Scholar]
  10. Bouron, S.; Hammoum, F.; Ruat, H.; Métais, P.; Lesueur, D. Improving the durability of asphalt mixtures with hydrated lime: Field results from highway A84. Case Stud. Constr. Mater. 2021, 14, e00551. [Google Scholar]
  11. Amaral, L.F.; Delaqua, G.C.G.; Nicolite, M.; Marvila, M.T.; de Azevedo, A.R.G.; Alexandre, J.; Vieira, C.M.F.; Monteiro, S.N. Eco-friendly mortars with addition of ornamental stone waste-A mathematical model approach for granulometric optimization. J. Clean. Prod. 2020, 248, 119283. [Google Scholar]
  12. Marvila, M.T.; Azevedo, A.R.G.; Alexandre, J.; Vieira, C.M.F.; Zanelato, E.B.; Delaqua, G.C.G.; Xavier, G.C.; Monteiro, S.N. Study of the compressive strength of mortars as a function of material composition, workability, and specimen geometry. Model. Simul. Eng. 2020, 2020, 1676190. [Google Scholar]
  13. Macedo, A.; Zanelato, E.; Manhães, A.; Azevedo, A.; Marvila, M.; Alexandre, J.; Monteiro, S.; Petrucci, L. Influence of construction and demolition waste incorporation in concrete. In Advances in Powder and Ceramic Materials Science; Springer: Cham, Switzerland, 2020; pp. 109–117. [Google Scholar]
  14. Duxson, P.; Fernández-Jiménez, A.; Provis, J.L.; Lukey, G.C.; Palomo, A.; van Deventer, J.S. Geopolymer technology: The current state of the art. J. Mater. Sci. 2007, 42, 2917–2933. [Google Scholar]
  15. Refaie, F.A.-Z.; Abbas, R.; Fouad, F.H. Sustainable construction system with Egyptian metakaolin based geopolymer concrete sandwich panels. Case Stud. Constr. Mater. 2020, 13, e00436. [Google Scholar]
  16. Saini, G.; Vattipalli, U. Assessing properties of alkali activated GGBS based self-compacting geopolymer concrete using nano-silica. Case Stud. Constr. Mater. 2020, 12, e00352. [Google Scholar]
  17. Upshaw, M.; Cai, C.S. Feasibility study of MK-based geopolymer binder for RAC applications: Effects of silica fume and added CaO on compressive strength of mortar samples. Case Stud. Constr. Mater. 2021, 14, e00500. [Google Scholar]
  18. Bakharev, T. Geopolymeric materials prepared using Class F fly ash and elevated temperature curing. Cem. Concr. Res. 2005, 35, 1224–1232. [Google Scholar]
  19. Xiao, R.; Jiang, X.; Wang, Y.; He, Q.; Huang, B. Experimental and Thermodynamic Study of Alkali-Activated Waste Glass and Calcium Sulfoaluminate Cement Blends: Shrinkage, Efflorescence Potential, and Phase Assemblages. J. Mater. Civ. Eng. 2021, 33, 04021312. [Google Scholar]
  20. Palomo, A.; Grutzeck, M.; Blanco, M.J.C. Alkali-activated fly ashes: A cement for the future. Cem. Concr. Res. 1999, 29, 1323–1329. [Google Scholar]
  21. Sultan, M.E.; Abo-El-Enein, S.A.; Sayed, A.Z.; El-Sokkary, T.M.; Hammad, H.A. Incorporation of cement bypass flue dust in fly ash and blast furnace slag-based geopolymer. Case Stud. Constr. Mater. 2018, 8, 315–322. [Google Scholar]
  22. Chindaprasirt, P.; Chareerat, T.; Sirivivatnanon, V. Workability and strength of coarse high calcium fly ash geopolymer. Cem. Concr. Compos. 2007, 29, 224–229. [Google Scholar]
  23. Yip, C.K.; Lukey, G.C.; van Deventer, J.S.J. The coexistence of geopolymeric gel and calcium silicate hydrate at the early stage of alkaline activation. Cem. Concr. Res. 2005, 35, 1688–1697. [Google Scholar]
  24. Jiang, X.; Xiao, R.; Bai, Y.; Huang, B.; Ma, Y. Influence of waste glass powder as a supplementary cementitious material (SCM) on physical and mechanical properties of cement paste under high temperatures. J. Clean. Prod. 2022, 340, 130778. [Google Scholar]
  25. Wang, Y.; Xiao, R.; Hu, W.; Jiang, X.; Zhang, X.; Huang, B. Effect of granulated phosphorus slag on physical, mechanical and microstructural characteristics of Class F fly ash based geopolymer. Constr. Build. Mater. 2021, 291, 123287. [Google Scholar]
  26. Xiao, R.; Zhang, Y.; Jiang, X.; Polaczyk, P.; Ma, Y.; Huang, B. Alkali-activated slag supplemented with waste glass powder: Laboratory characterization, thermodynamic modelling and sustainability analysis. J. Clean. Prod. 2021, 286, 125554. [Google Scholar]
  27. Davidovits, J. Geopolymers: Inorganic polymeric new materials. J. Therm. Anal. Calorim. 1991, 37, 1633–1656. [Google Scholar]
  28. Gunasekara, C.; Law, D.W.; Setunge, S. Long term permeation properties of different fly ash geopolymer concretes. Constr. Build. Mater. 2016, 124, 352–362. [Google Scholar]
  29. Jindal, B.B. Investigations on the properties of geopolymer mortar and concrete with mineral admixtures: A review. Constr. Build. Mater. 2019, 227, 116644. [Google Scholar]
  30. Nguyen, K.T.; Nguyen, Q.D.; Le, T.A.; Shin, J.; Lee, K. Analyzing the compressive strength of green fly ash based geopolymer concrete using experiment and machine learning approaches. Constr. Build. Mater. 2020, 247, 118581. [Google Scholar]
  31. Da Rocha, T.S.; Dias, D.P.; França, F.C.C.; de Guerra, R.R.S.; de Oliveira, L.R.D.C. Metakaolin-based geopolymer mortars with different alkaline activators (Na+ and K+). Constr. Build. Mater. 2018, 178, 453–461. [Google Scholar]
  32. Tchakouté, H.K.; Rüscher, C.H.; Kong, S.; Kamseu, E.; Leonelli, C. Geopolymer binders from metakaolin using sodium waterglass from waste glass and rice husk ash as alternative activators: A comparative study. Constr. Build. Mater. 2016, 114, 276–289. [Google Scholar]
  33. Almutairi, A.L.; Tayeh, B.A.; Adesina, A.; Isleem, H.F.; Zeyad, A.M. Potential applications of geopolymer concrete in construction: A review. Case Stud. Constr. Mater. 2021, 15, e00733. [Google Scholar]
  34. De Azevedo, A.R.G.; Teixeira Marvila, M.; de Oliveira, L.B.; Macario Ferreira, W.; Colorado, H.; Rainho Teixeira, S.; Mauricio Fontes Vieira, C. Circular economy and durability in geopolymers ceramics pieces obtained from glass polishing waste. Int. J. Appl. Ceram. Technol. 2021, 18, 1891–1900. [Google Scholar]
  35. Cao, M.; Xie, C.; Li, L.; Khan, M. Effect of different PVA and steel fiber length and content on mechanical properties of CaCO3 whisker reinforced cementitious composites. Mater. Constr. 2019, 69, e200. [Google Scholar]
  36. Pasupathy, K.; Berndt, M.; Castel, A.; Sanjayan, J.; Pathmanathan, R. Carbonation of a blended slag-fly ash geopolymer concrete in field conditions after 8 years. Constr. Build. Mater. 2016, 125, 661–669. [Google Scholar]
  37. Shill, S.K.; Al-Deen, S.; Ashraf, M.; Hutchison, W. Resistance of fly ash based geopolymer mortar to both chemicals and high thermal cycles simultaneously. Constr. Build. Mater. 2020, 239, 117886. [Google Scholar]
  38. Arshad, S.; Sharif, M.B.; Irfan-ul-Hassan, M.; Khan, M.; Zhang, J.-L. Efficiency of supplementary cementitious materials and natural fiber on mechanical performance of concrete. Arab. J. Sci. Eng. 2020, 45, 8577–8589. [Google Scholar]
  39. Hanjitsuwan, S.; Hunpratub, S.; Thongbai, P.; Maensiri, S.; Sata, V.; Chindaprasirt, P.J.C.; Composites, C. Effects of NaOH concentrations on physical and electrical properties of high calcium fly ash geopolymer paste. Cem. Concr. Compos. 2014, 45, 9–14. [Google Scholar]
  40. Elsheikh, A.H.; Panchal, H.; Shanmugan, S.; Muthuramalingam, T.; El-Kassas, A.M.; Ramesh, B. Recent progresses in wood-plastic composites: Pre-processing treatments, manufacturing techniques, recyclability and eco-friendly assessment. Clean. Eng. Technol. 2022, 8, 100450. [Google Scholar]
  41. Moustafa, E.B.; Hammad, A.H.; Elsheikh, A.H. A new optimized artificial neural network model to predict thermal efficiency and water yield of tubular solar still. Case Stud. Therm. Eng. 2022, 30, 101750. [Google Scholar]
  42. Elsheikh, A.H.; Shanmugan, S.; Sathyamurthy, R.; Thakur, A.K.; Issa, M.; Panchal, H.; Muthuramalingam, T.; Kumar, R.; Sharifpur, M. Low-cost bilayered structure for improving the performance of solar stills: Performance/cost analysis and water yield prediction using machine learning. Sustain. Energy Technol. Assess. 2022, 49, 101783. [Google Scholar]
  43. Somna, K.; Jaturapitakkul, C.; Kajitvichyanukul, P.; Chindaprasirt, P.J.F. NaOH-activated ground fly ash geopolymer cured at ambient temperature. Fuel 2011, 90, 2118–2124. [Google Scholar]
  44. Kumar, S.; Kumar, R.; Mehrotra, S.P. Influence of granulated blast furnace slag on the reaction, structure and properties of fly ash based geopolymer. J. Mater. Sci. 2010, 45, 607–615. [Google Scholar]
  45. Khan, M.; Cao, M.; Hussain, A.; Chu, S.H. Effect of silica-fume content on performance of CaCO3 whisker and basalt fiber at matrix interface in cement-based composites. Constr. Build. Mater. 2021, 300, 124046. [Google Scholar]
  46. Ahmad, W.; Farooq, S.H.; Usman, M.; Khan, M.; Ahmad, A.; Aslam, F.; Yousef, R.A.; Abduljabbar, H.A.; Sufian, M. Effect of coconut fiber length and content on properties of high strength concrete. Materials 2020, 13, 1075. [Google Scholar]
  47. Chindaprasirt, P.; de Silva, P.; Sagoe-Crentsil, K.; Hanjitsuwan, S. Effect of SiO2 and Al2O3 on the setting and hardening of high calcium fly ash-based geopolymer systems. J. Mater. Sci. 2012, 47, 4876–4883. [Google Scholar]
  48. Guo, X.; Shi, H.; Dick, W.A.J.C.; Composites, C. Compressive strength and microstructural characteristics of class C fly ash geopolymer. Cem. Concr. Compos. 2010, 32, 142–147. [Google Scholar]
  49. Samsudin, M.H.; Ban, C.C. Optimization on the hybridization ratio of ground granulated blast furnace slag and high calcium wood ash (GGBS–HCWA) for the fabrication of geopolymer mortar. Adv. Environ. Biol. 2015, 9, 22–25. [Google Scholar]
  50. Ban, C.C.; Ken, P.W.; Ramli, M. Mechanical and durability performance of novel self-activating geopolymer mortars. Procedia Eng. 2017, 171, 564–571. [Google Scholar]
  51. Khan, M.; Cao, M.; Xie, C.; Ali, M. Efficiency of basalt fiber length and content on mechanical and microstructural properties of hybrid fiber concrete. Fatigue Fract. Eng. Mater. Struct. 2021, 44, 2135–2152. [Google Scholar]
  52. Xie, C.; Cao, M.; Khan, M.; Yin, H.; Guan, J. Review on different testing methods and factors affecting fracture properties of fiber reinforced cementitious composites. Constr. Build. Mater. 2021, 273, 121766. [Google Scholar]
  53. Cao, M.; Mao, Y.; Khan, M.; Si, W.; Shen, S. Different testing methods for assessing the synthetic fiber distribution in cement-based composites. Constr. Build. Mater. 2018, 184, 128–142. [Google Scholar]
  54. Khan, M.; Cao, M.; Xie, C.; Ali, M. Hybrid fiber concrete with different basalt fiber length and content. Struct. Concr. 2021, 23, 346–364. [Google Scholar]
  55. Cao, M.; Khan, M.; Ahmed, S. Effectiveness of Calcium Carbonate Whisker in Cementitious Composites. Period. Polytechnica. Civ. Eng. 2020, 64, 265. [Google Scholar]
  56. Ahmad, W.; Ahmad, A.; Ostrowski, K.A.; Aslam, F.; Joyklad, P.; Zajdel, P. Sustainable approach of using sugarcane bagasse ash in cement-based composites: A systematic review. Case Stud. Constr. Mater. 2021, 15, e00698. [Google Scholar]
  57. Shah, M.I.; Memon, S.A.; Niazi, M.S.K.; Amin, M.N.; Aslam, F.; Javed, M.F. Machine Learning-Based Modeling with Optimization Algorithm for Predicting Mechanical Properties of Sustainable Concrete. Adv. Civ. Eng. 2021, 2021, 6682283. [Google Scholar]
  58. Dutta, S.; Samui, P.; Kim, D. Comparison of machine learning techniques to predict compressive strength of concrete. Comput. Concr. 2018, 21, 463–470. [Google Scholar]
  59. Chaabene, W.B.; Flah, M.; Nehdi, M.L. Machine learning prediction of mechanical properties of concrete: Critical review. Constr. Build. Mater. 2020, 260, 119889. [Google Scholar]
  60. Ahmad, A.; Farooq, F.; Ostrowski, K.A.; Śliwa-Wieczorek, K.; Czarnecki, S. Application of Novel Machine Learning Techniques for Predicting the Surface Chloride Concentration in Concrete Containing Waste Material. Materials 2021, 14, 2297. [Google Scholar]
  61. Ahmad, W.; Ahmad, A.; Ostrowski, K.A.; Aslam, F.; Joyklad, P.; Zajdel, P. Application of Advanced Machine Learning Approaches to Predict the Compressive Strength of Concrete Containing Supplementary Cementitious Materials. Materials 2021, 14, 5762. [Google Scholar]
  62. Ahmad, A.; Ostrowski, K.A.; Maślak, M.; Farooq, F.; Mehmood, I.; Nafees, A. Comparative study of supervised machine learning algorithms for predicting the compressive strength of concrete at high temperature. Materials 2021, 14, 4222. [Google Scholar] [PubMed]
  63. Song, H.; Ahmad, A.; Farooq, F.; Ostrowski, K.A.; Maślak, M.; Czarnecki, S.; Aslam, F. Predicting the compressive strength of concrete with fly ash admixture using machine learning algorithms. Constr. Build. Mater. 2021, 308, 125021. [Google Scholar]
  64. Song, Y.; Zhao, J.; Ostrowski, K.A.; Javed, M.F.; Ahmad, A.; Khan, M.I.; Aslam, F.; Kinasz, R. Prediction of Compressive Strength of Fly-Ash-Based Concrete Using Ensemble and Non-Ensemble Supervised Machine-Learning Approaches. Appl. Sci. 2022, 12, 361. [Google Scholar]
  65. Ahmad, A.; Ahmad, W.; Aslam, F.; Joyklad, P. Compressive strength prediction of fly ash-based geopolymer concrete via advanced machine learning techniques. Case Stud. Constr. Mater. 2021, 16, e00840. [Google Scholar]
  66. Ahmad, A.; Chaiyasarn, K.; Farooq, F.; Ahmad, W.; Suparp, S.; Aslam, F. Compressive strength prediction via gene expression programming (GEP) and artificial neural network (ANN) for concrete containing RCA. Buildings 2021, 11, 324. [Google Scholar]
  67. Sufian, M.; Ullah, S.; Ostrowski, K.A.; Ahmad, A.; Zia, A.; Śliwa-Wieczorek, K.; Siddiq, M.; Awan, A.A. An Experimental and Empirical Study on the Use of Waste Marble Powder in Construction Material. Materials 2021, 14, 3829. [Google Scholar]
  68. Xu, Y.; Ahmad, W.; Ahmad, A.; Ostrowski, K.A.; Dudek, M.; Aslam, F.; Joyklad, P. Computation of High-Performance Concrete Compressive Strength Using Standalone and Ensembled Machine Learning Techniques. Materials 2021, 14, 7034. [Google Scholar]
  69. Elsheikh, A.H.; Elaziz, M.A.; Vendan, A. Modeling ultrasonic welding of polymers using an optimized artificial intelligence model using a gradient-based optimizer. Weld. World 2022, 66, 27–44. [Google Scholar]
  70. Elsheikh, A.H.; Shehabeldeen, T.A.; Zhou, J.; Showaib, E.; Elaziz, M.A. Prediction of laser cutting parameters for polymethylmethacrylate sheets using random vector functional link network integrated with equilibrium optimizer. J. Intell. Manuf. 2021, 32, 1377–1388. [Google Scholar]
  71. Elsheikh, A.H.; Sharshir, S.W.; Elaziz, M.A.; Kabeel, A.E.; Guilan, W.; Haiou, Z. Modeling of solar energy systems using artificial neural network: A comprehensive review. Sol. Energy 2019, 180, 622–639. [Google Scholar]
  72. Bayar, G.; Bilir, T. A novel study for the estimation of crack propagation in concrete using machine learning algorithms. Constr. Build. Mater. 2019, 215, 670–685. [Google Scholar]
  73. Lee, S.C. Prediction of concrete strength using artificial neural networks. Eng. Struct. 2003, 25, 849–857. [Google Scholar]
  74. Nguyen-Sy, T.; Wakim, J.; To, Q.-D.; Vu, M.-N.; Nguyen, T.-D.; Nguyen, T.-T. Predicting the compressive strength of concrete from its compositions and age using the extreme gradient boosting method. Constr. Build. Mater. 2020, 260, 119757. [Google Scholar]
  75. Gunasekara, C.; Atzarakis, P.; Lokuge, W.; Law, D.W.; Setunge, S.J.P. Novel analytical method for mix design and performance prediction of high calcium fly ash geopolymer concrete. Polymers 2021, 13, 900. [Google Scholar]
  76. Kupwade-Patil, K.; Allouche, E.N. Impact of alkali silica reaction on fly ash-based geopolymer concrete. J. Mater. Civ. Eng. 2013, 25, 131–139. [Google Scholar]
  77. Kusbiantoro, A.; Nuruddin, M.F.; Shafiq, N.; Qazi, S.A. The effect of microwave incinerated rice husk ash on the compressive and bond strength of fly ash based geopolymer concrete. Constr. Build. Mater. 2012, 36, 695–703. [Google Scholar]
  78. Pane, I.; Imran, I.; Budiono, B. Compressive strength of fly ash-based geopolymer concrete with a variable of sodium hydroxide (NaOH) solution molarity. In MATEC Web of Conferences; EDP Sciences: Les Ulis, France, 2018; p. 01004. [Google Scholar]
  79. Embong, R.; Kusbiantoro, A.; Shafiq, N.; Nuruddin, M.F. Strength and microstructural properties of fly ash based geopolymer concrete containing high-calcium and water-absorptive aggregate. J. Clean. Prod. 2016, 112, 816–822. [Google Scholar]
  80. Mehta, A.; Siddique, R. Sulfuric acid resistance of fly ash based geopolymer concrete. Constr. Build. Mater. 2017, 146, 136–143. [Google Scholar]
  81. Lavanya, G.; Jegan, J. Engineering, Durability study on high calcium fly ash based geopolymer concrete. Adv. Mater. Sci. Eng. 2015, 2015, 731056. [Google Scholar]
  82. Nazari, A.; Torgal, F.P. Predicting compressive strength of different geopolymers by artificial neural networks. Ceram. Int. 2013, 39, 2247–2257. [Google Scholar]
  83. Mishra, A.; Choudhary, D.; Jain, N.; Kumar, M.; Sharda, N.; Dutt, D. Effect of concentration of alkaline liquid and curing time on strength and water absorption of geopolymer concrete. ARPN J. Eng. Appl. Sci. 2008, 3, 14–18. [Google Scholar]
  84. Rattanasak, U.; Chindaprasirt, P. Influence of NaOH solution on the synthesis of fly ash geopolymer. Miner. Eng. 2009, 22, 1073–1078. [Google Scholar]
  85. Ahmad, A.; Ahmad, W.; Chaiyasarn, K.; Ostrowski, K.A.; Aslam, F.; Zajdel, P.; Joyklad, P. Prediction of geopolymer concrete compressive strength using novel machine learning algorithms. Polymers 2021, 13, 3389. [Google Scholar] [PubMed]
  86. Shang, M.; Li, H.; Ahmad, A.; Ahmad, W.; Ostrowski, K.A.; Aslam, F.; Joyklad, P.; Majka, T.M. Predicting the Mechanical Properties of RCA-Based Concrete Using Supervised Machine Learning Algorithms. Materials 2022, 15, 647. [Google Scholar]
  87. Song, H.; Ahmad, A.; Ostrowski, K.A.; Dudek, M. Analyzing the compressive strength of ceramic waste-based concrete using experiment and artificial neural network (ANN) approach. Materials 2021, 14, 4518. [Google Scholar]
  88. Pelalak, R.; Nakhjiri, A.T.; Marjani, A.; Rezakazemi, M.; Shirazian, S. Influence of machine learning membership functions and degree of membership function on each input parameter for simulation of reactors. Sci. Rep. 2021, 11, 1891. [Google Scholar]
  89. Dong, W.; Huang, Y.; Lehane, B.; Ma, G. XGBoost algorithm-based prediction of concrete electrical resistivity for structural health monitoring. Autom. Constr. 2020, 114, 103155. [Google Scholar]
  90. Duan, J.; Asteris, P.G.; Nguyen, H.; Bui, X.-N.; Moayedi, H. A novel artificial intelligence technique to predict compressive strength of recycled aggregate concrete using ICA-XGBoost model. Eng. Comput. 2021, 37, 3329–3346. [Google Scholar]
  91. Elsheikh, A.H.; Saba, A.I.; Panchal, H.; Shanmugan, S.; Alsaleh, N.A.; Ahmadein, M. Artificial Intelligence for Forecasting the Prevalence of COVID-19 Pandemic: An Overview. Healthcare 2021, 9, 1614. [Google Scholar]
Figure 1. Manufacturing procedure of the geopolymer concrete (Wang, Q., et al. 2022).
Materials 15 02400 g001
Figure 2. Input parameter’s relative frequency distribution.
Materials 15 02400 g002
Figure 3. Correspondence between the experimental and predicted result of the MLP model.
Materials 15 02400 g003
Figure 4. Experimental and predicted dispersal of the results along with the scattering of their errors for the MLP model.
Materials 15 02400 g004
Figure 5. Correspondence among the experimental and predicted results of SVM model.
Materials 15 02400 g005
Figure 6. Experimental and predicted dispersal of the results along with the scattering of their errors for the SVM model.
Materials 15 02400 g006
Figure 7. Correspondence among the experimental and predicted result of XGB model.
Materials 15 02400 g007
Figure 8. Experimental and predicted dispersal of the results along with the scattering of their errors for the XGB model.
Materials 15 02400 g008
Figure 9. MLP model’s statistical explanation of CV analysis.
Materials 15 02400 g009
Figure 10. SVM model’s statistical explanation of CV analysis.
Materials 15 02400 g010
Figure 11. XGB model’s statistical explanation of CV analysis.
Materials 15 02400 g011
Figure 12. Contribution level in percentage towards the predicted outcome.
Materials 15 02400 g012
Table 1. Descriptive statistics of the input variables.
ParametersFly AshCAFANaOHNa2SiO3SiO2 Na2OMolarityCT
Mean of variables465.791060.99598.9394.26167.8730.1213.1611.6528.13
Variable’s median494.001091.00600.0095.00138.0030.0012.0012.0024.00
Variable’s mode550.00838.00600.0095.00239.0030.0012.008.0024.00
Standard Deviation86.54210.1365.6138.0557.611.201.672.9817.01
Standard Error6.9716.935.293.074.640.100.130.241.37
Input ranges300.00846.00291.00157.00136.006.007.2012.0069.00
Lowest values300.00838.00459.0041.00103.0028.709.008.003.00
Highest values600.001684.00750.00198.00239.0034.7016.2020.0072.00
Table 2. Statistical measures of the employed models.
ML ApproachesMAE (MPa)MSE (MPa)RMSE (MPa)
MLP3.4819.09694.37
XGB1.493.16841.78
SVM2.7714.59243.82
Publisher’s Note: MDPI stays neutral with regard to jurisdictional claims in published maps and institutional affiliations.

