
The Effect of Stray Current on Calcium Leaching of Cement-Based Materials


Abstract
:1. Introduction
2. Experimental
2.1. Raw Materials
2.2. Mix Ratio
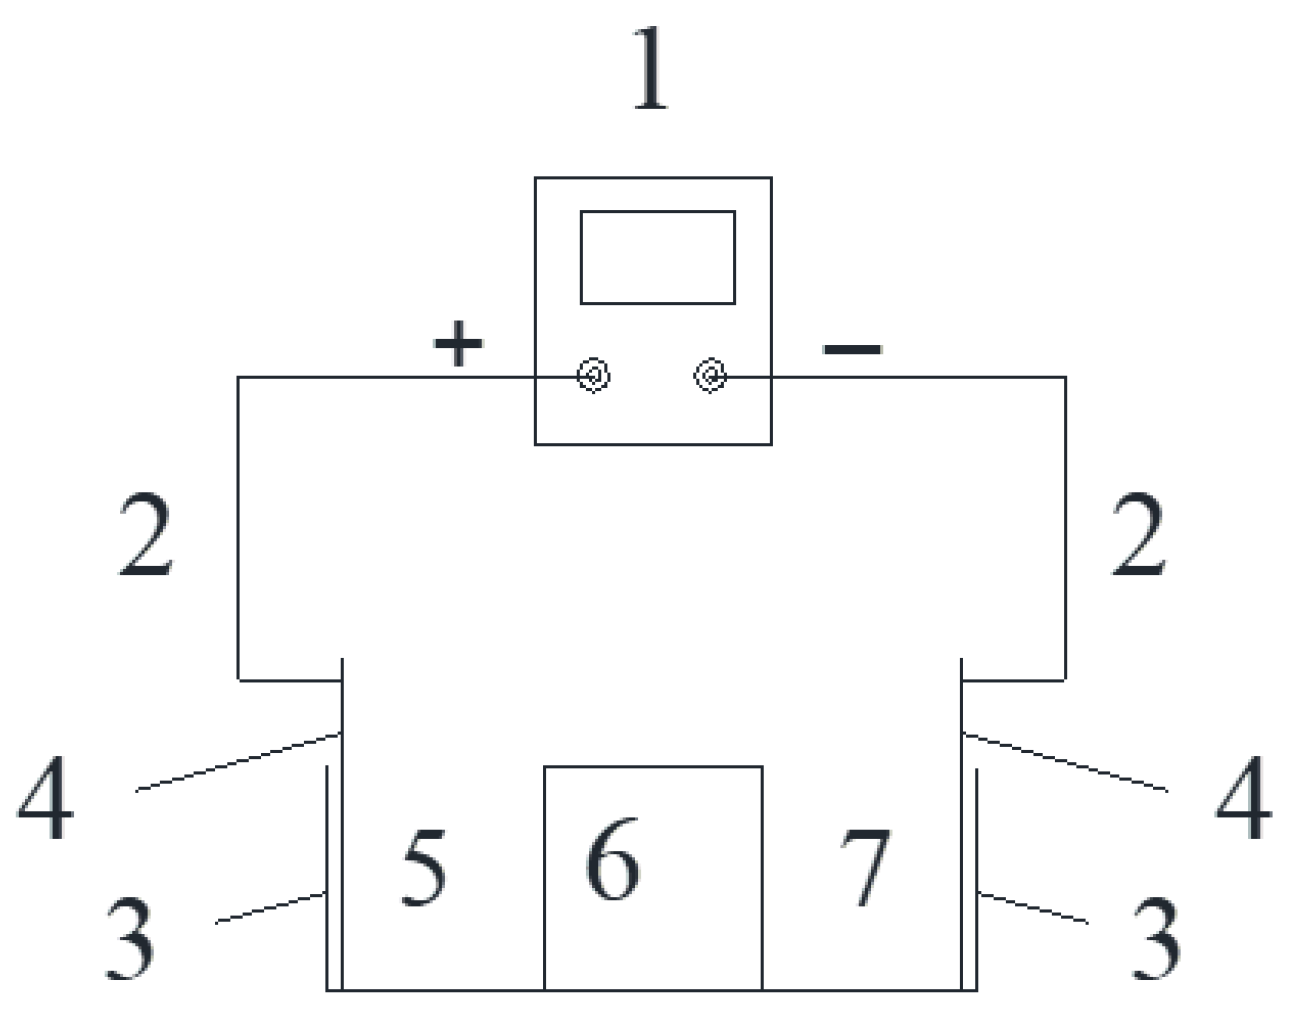
2.3. Test Design
3. Results and Discussion
3.1. Effect of Stray Current on the Corrosion of Cement-Based Materials
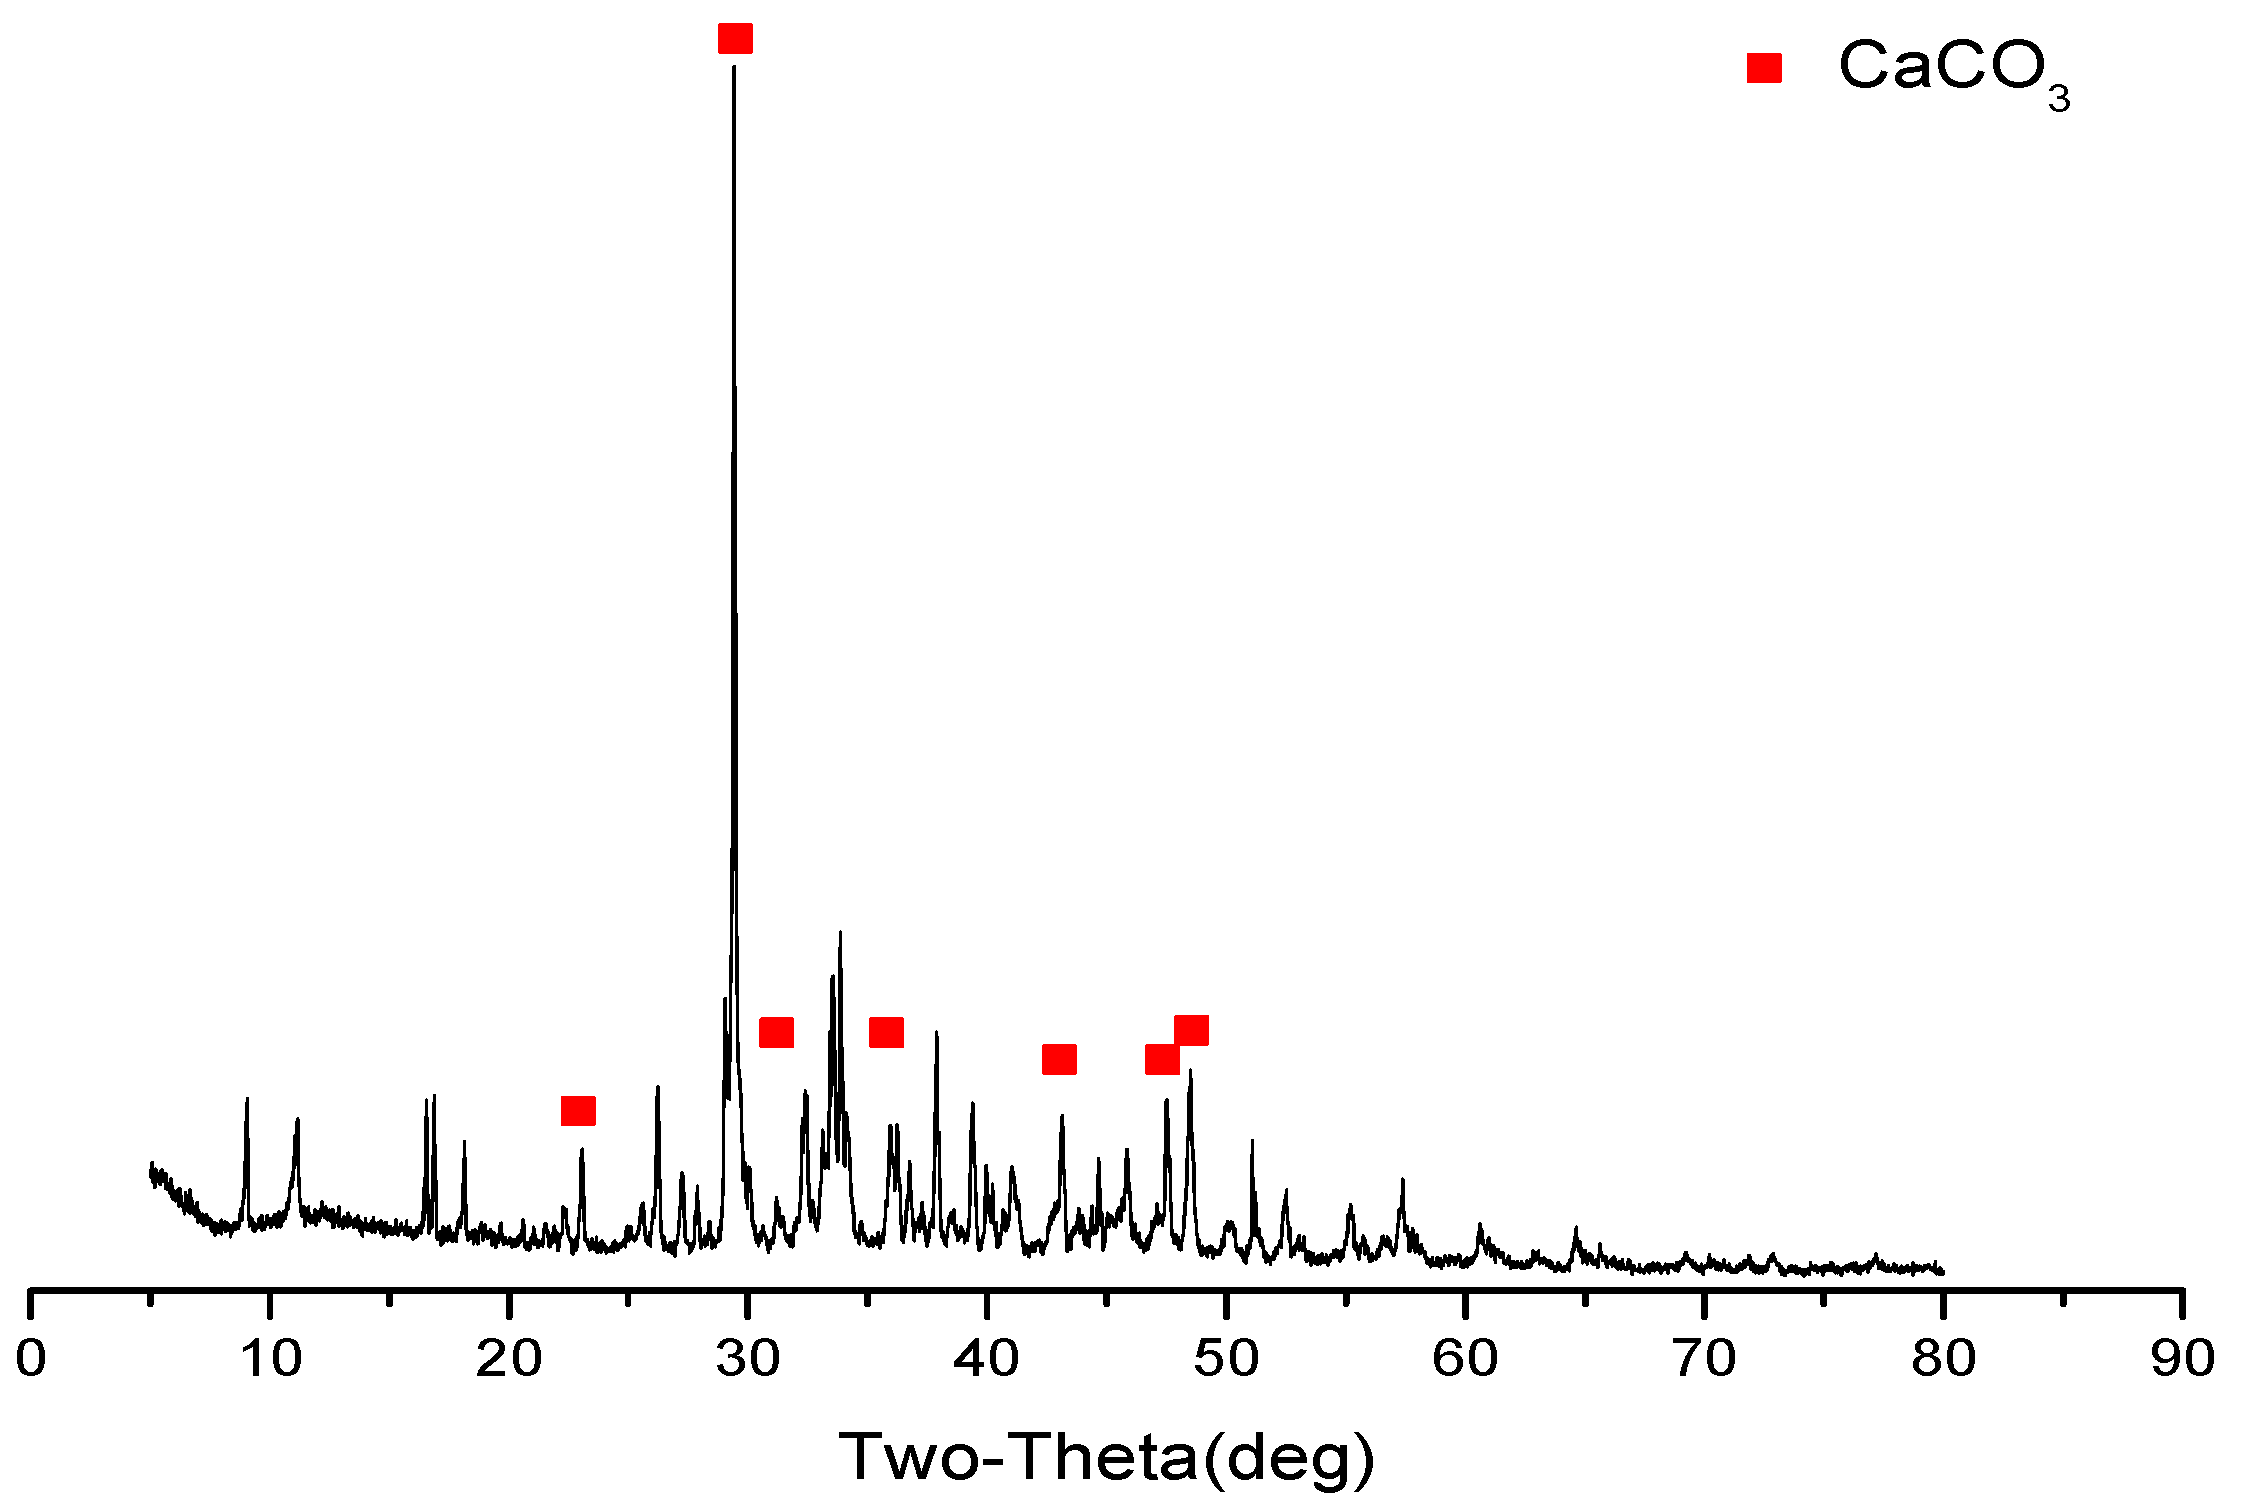
3.1.1. Cathode Side Leachables
3.1.2. Compressive Strength
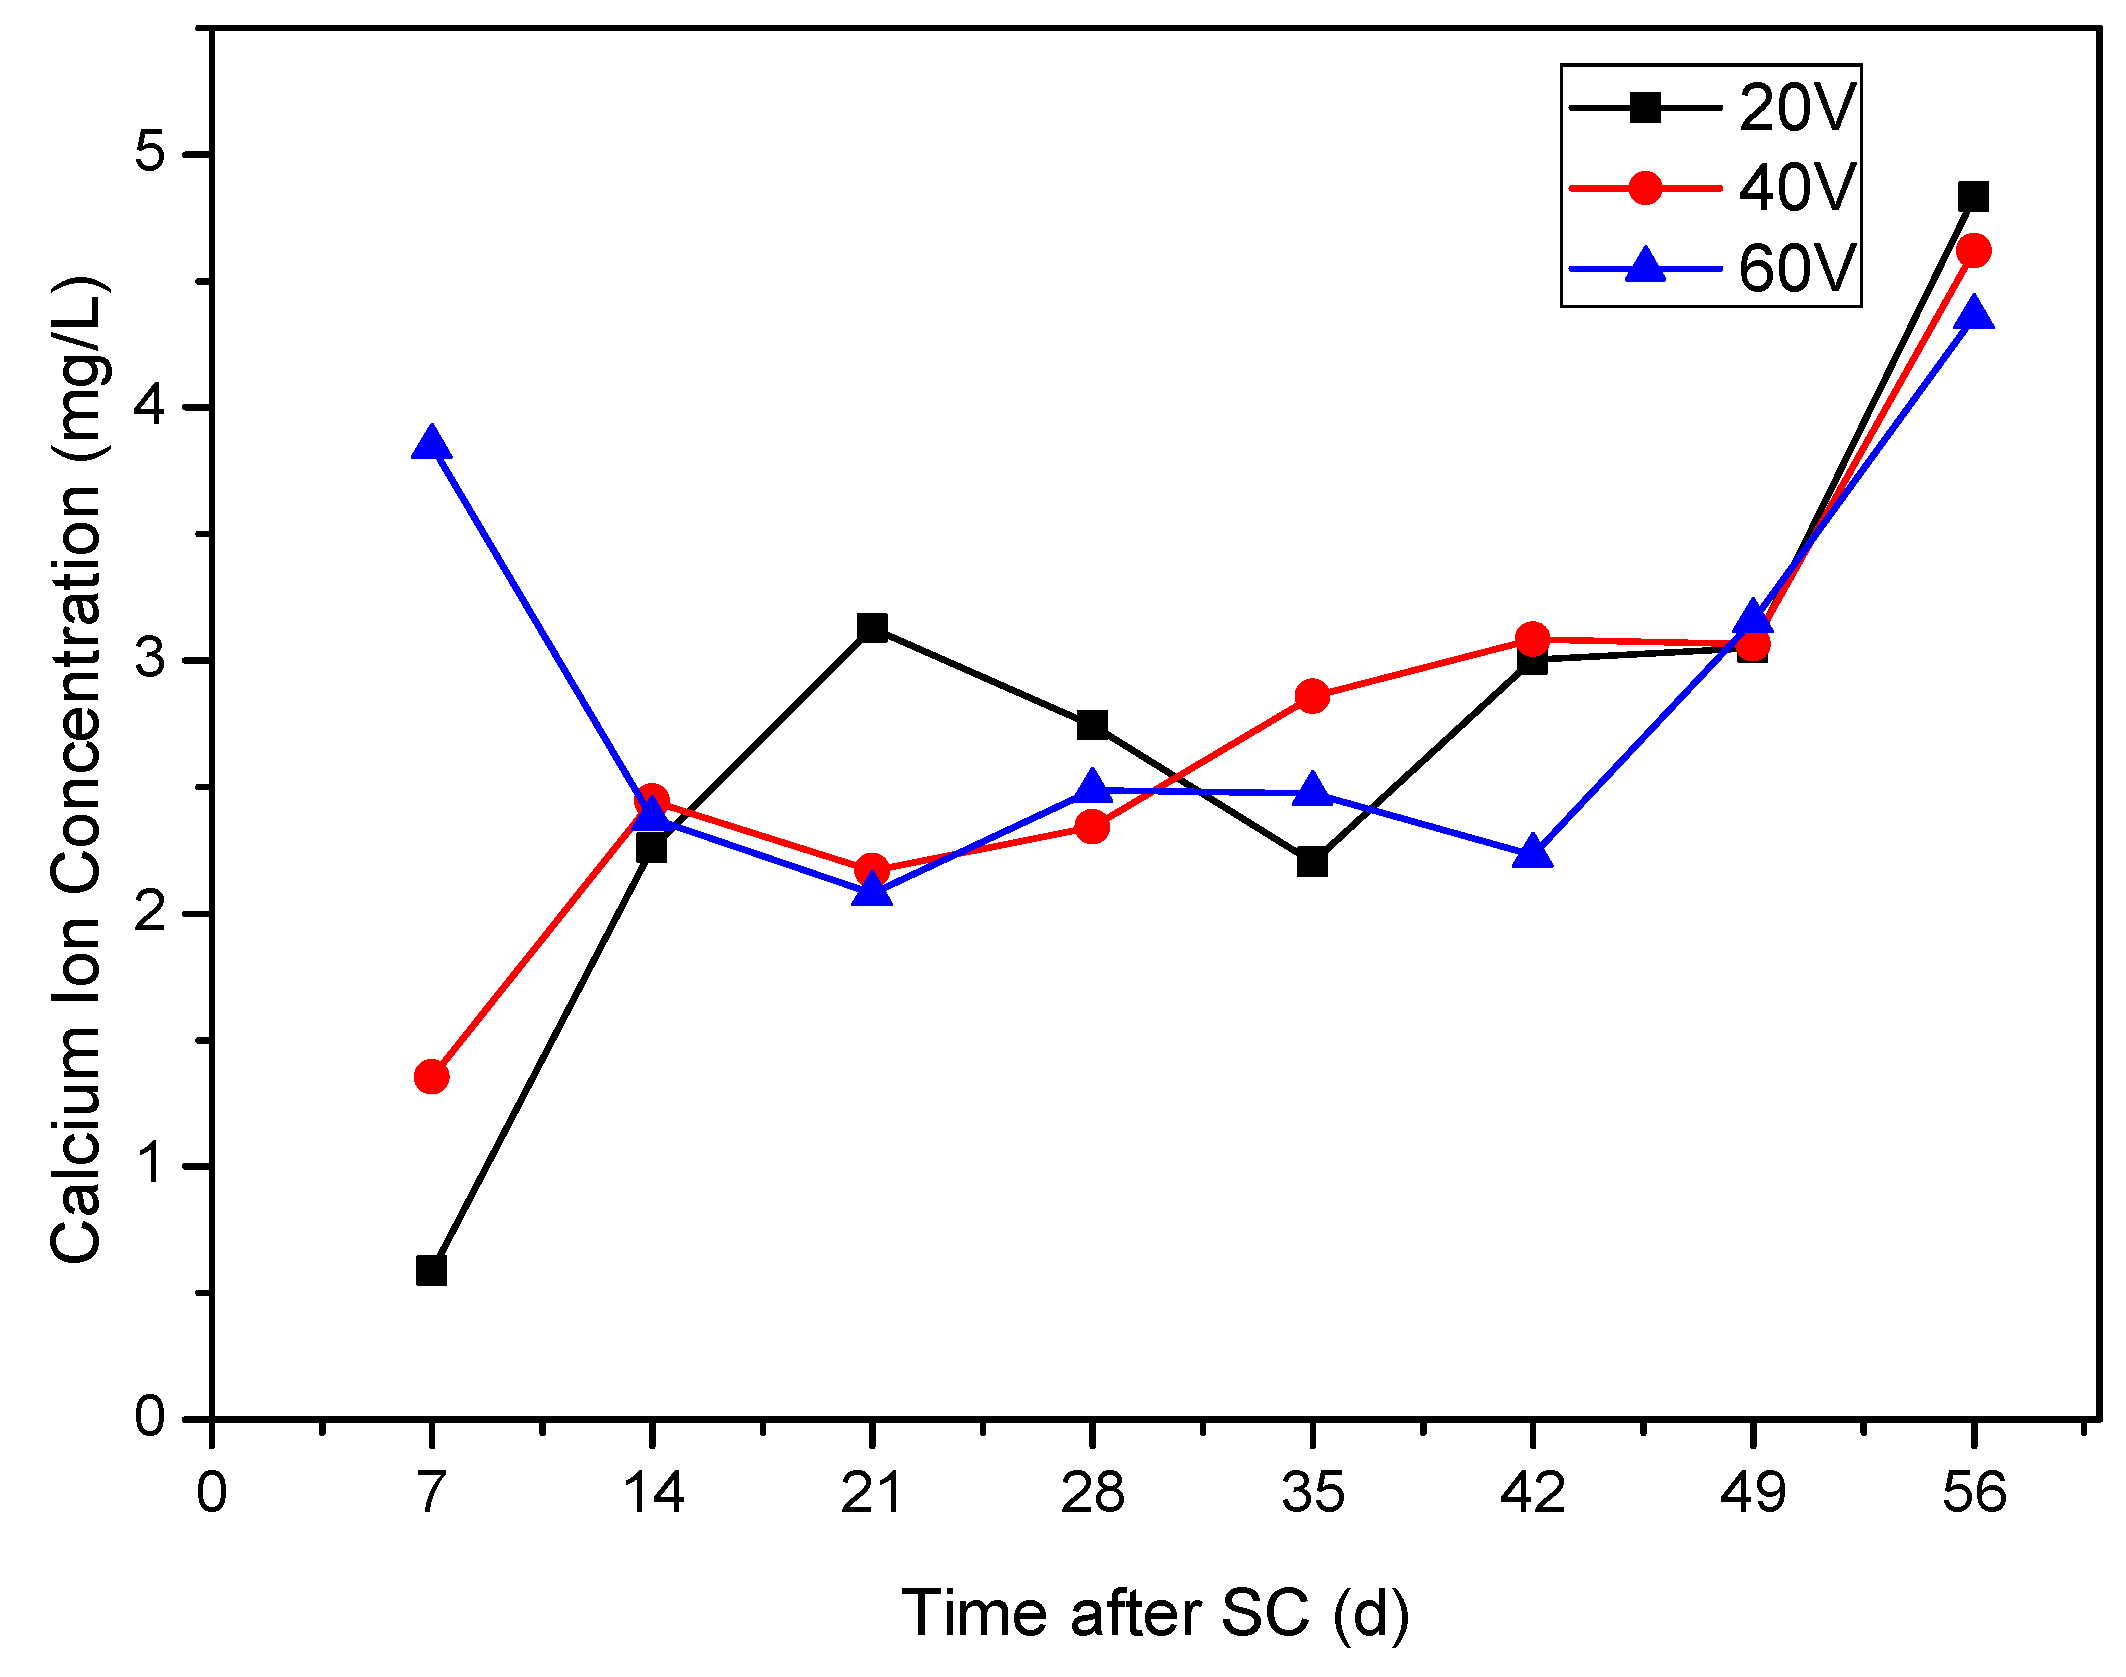
3.1.3. Ca2+ Concentration in the Cathode Side Solution
3.2. Effect of Different Water-Binder Ratios on the Corrosion of Cement-Based Materials under Stray Current
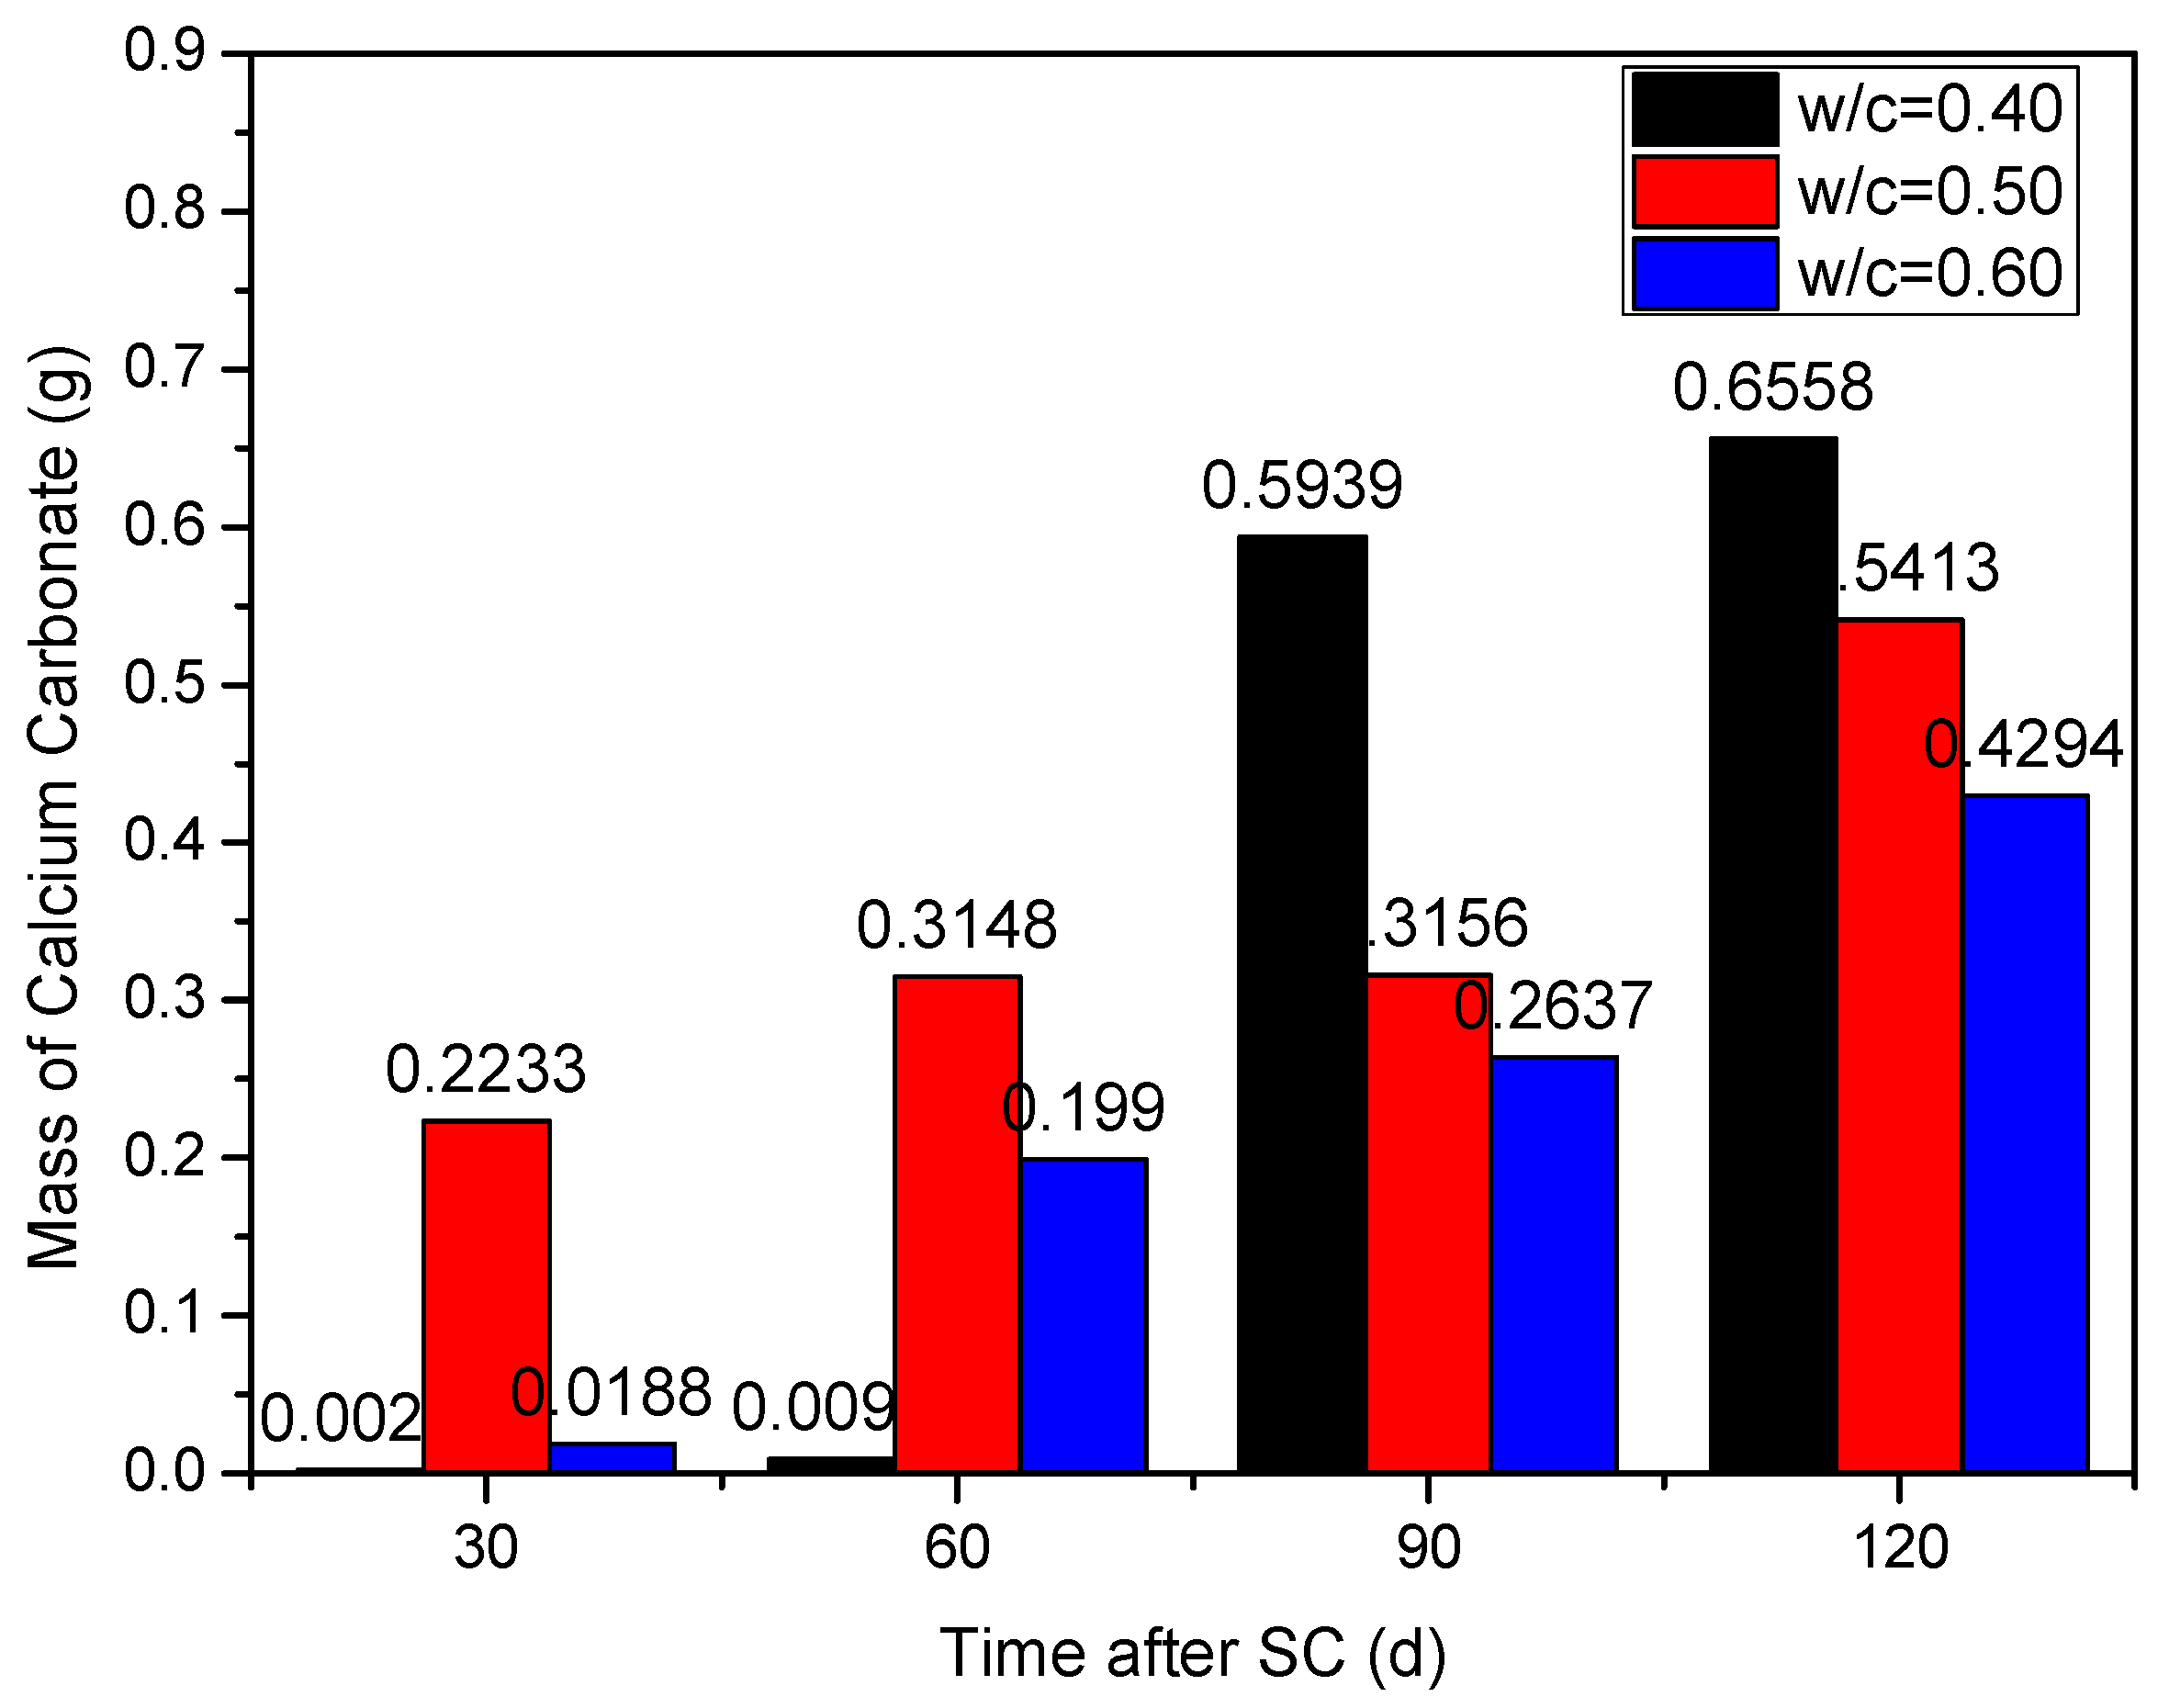
3.2.1. Cathode Side Leachables
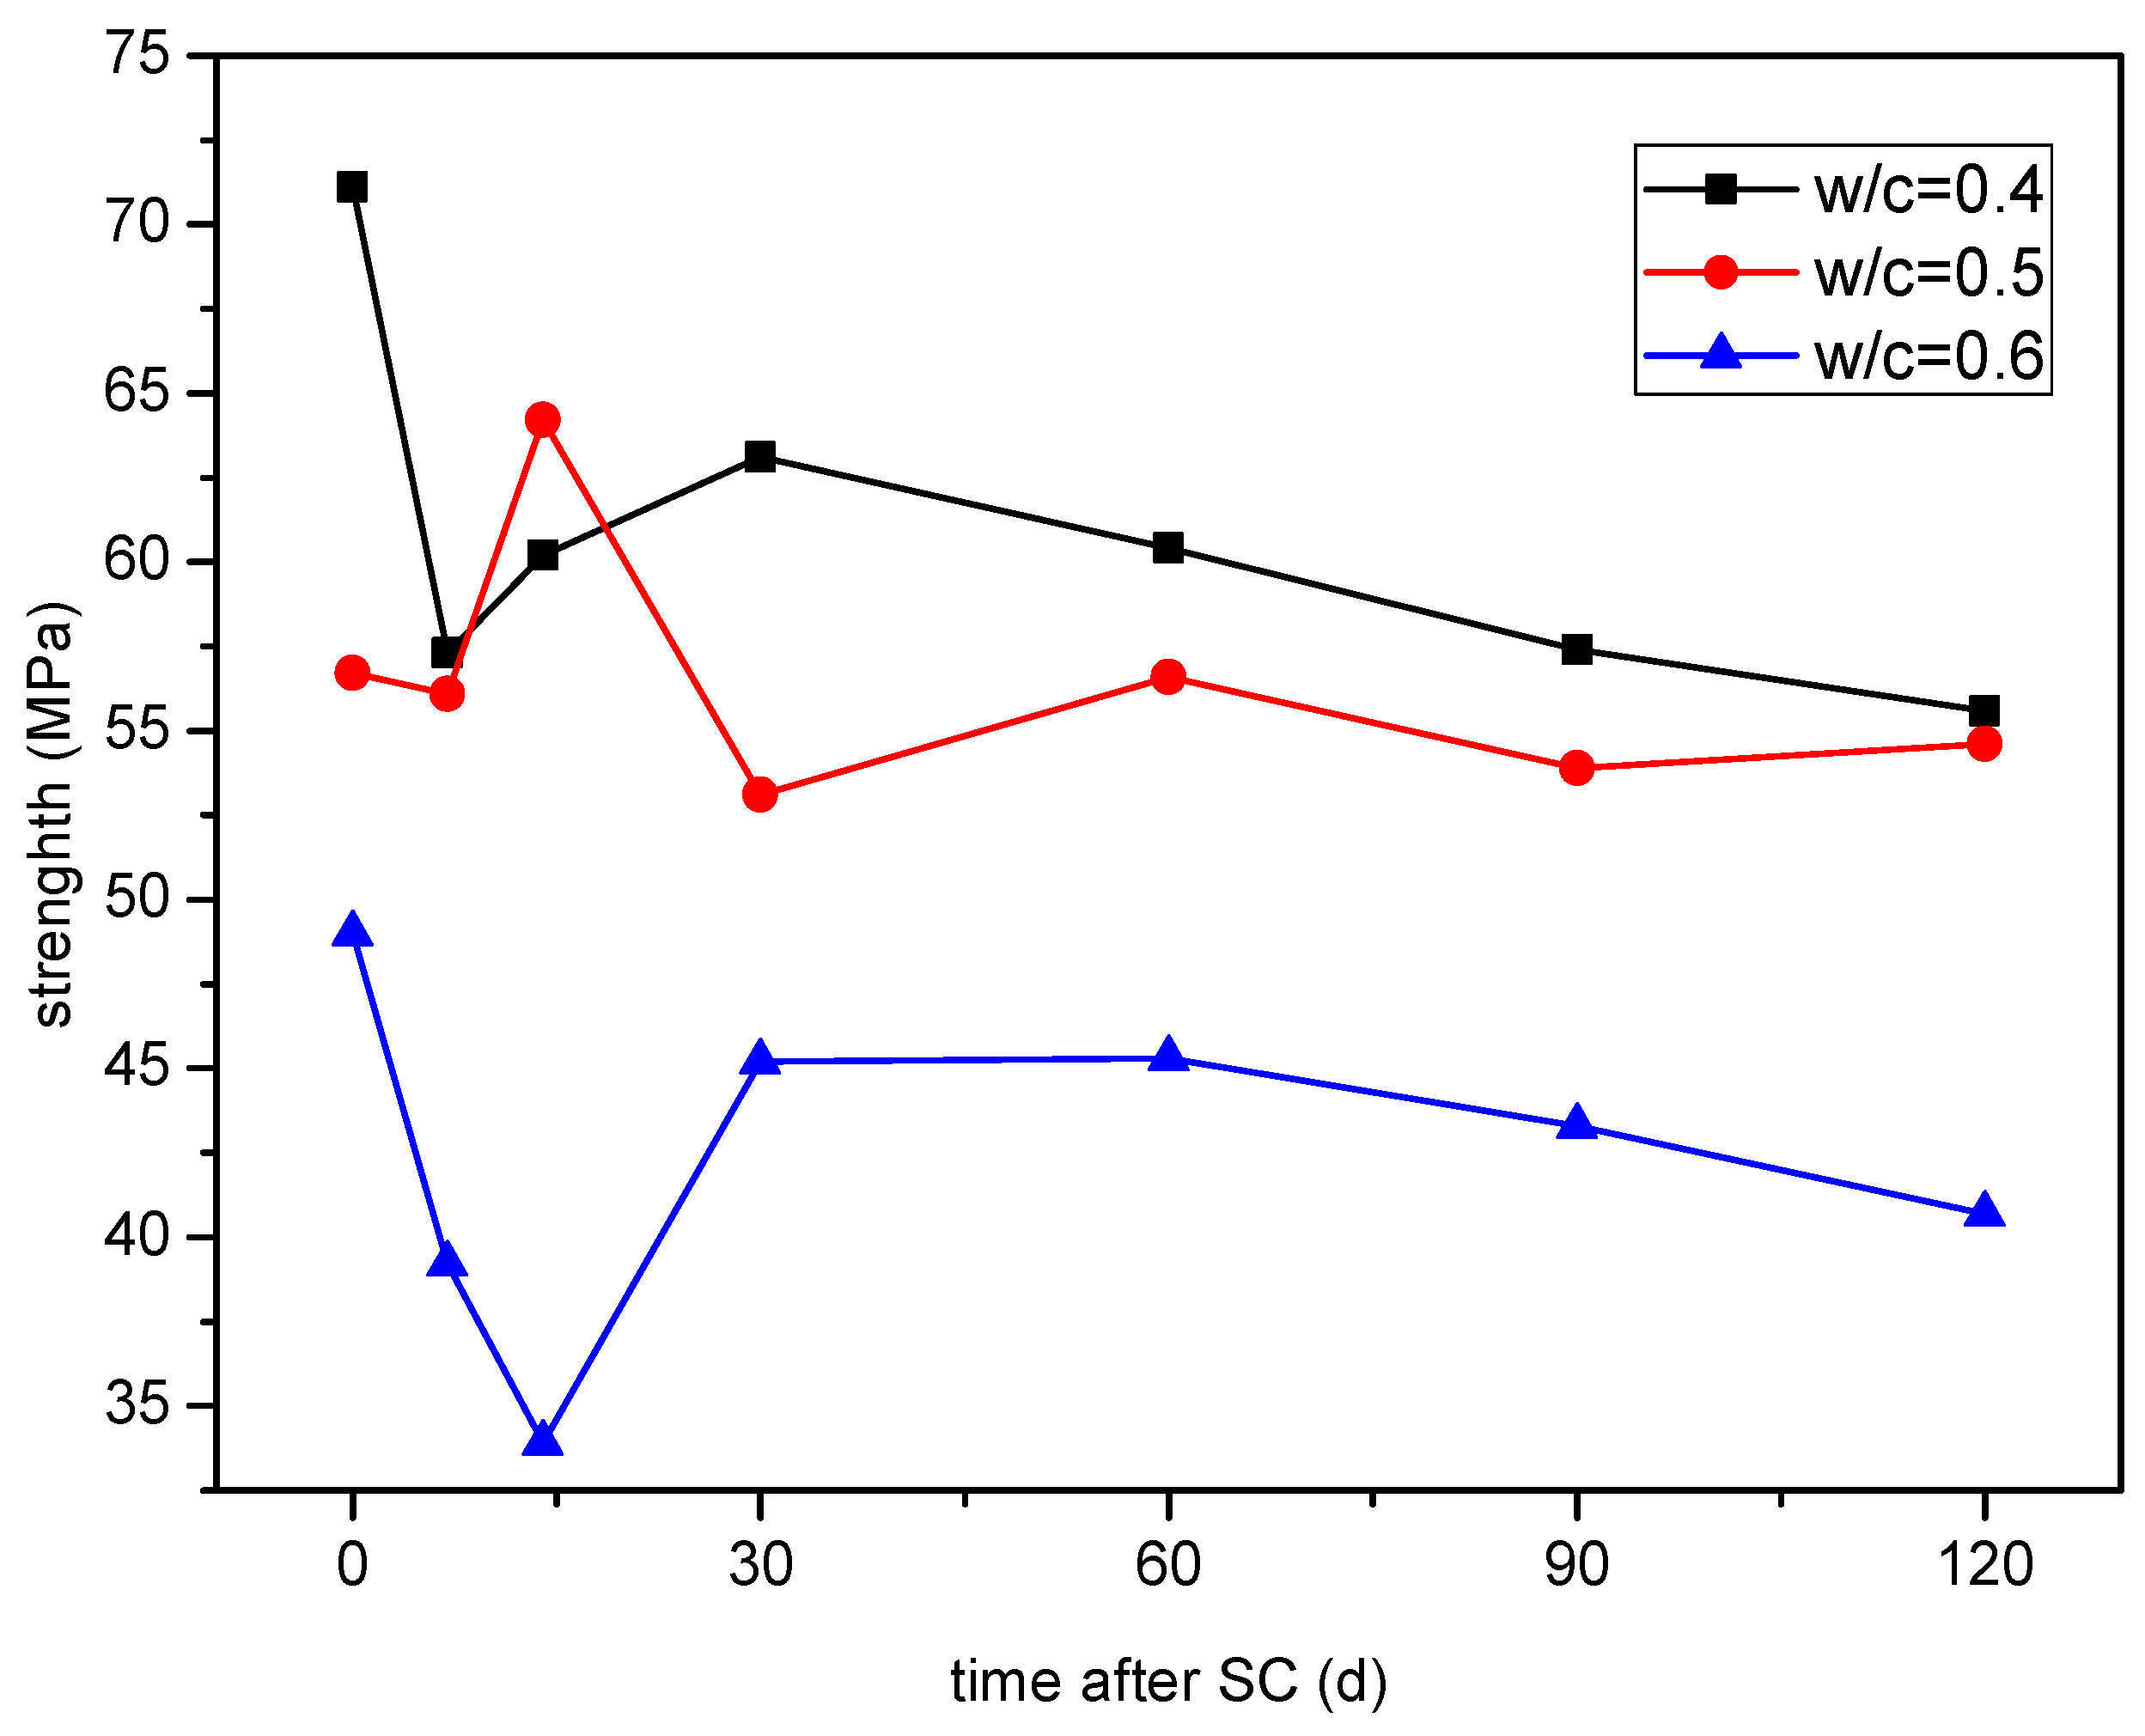
3.2.2. Compressive Strength
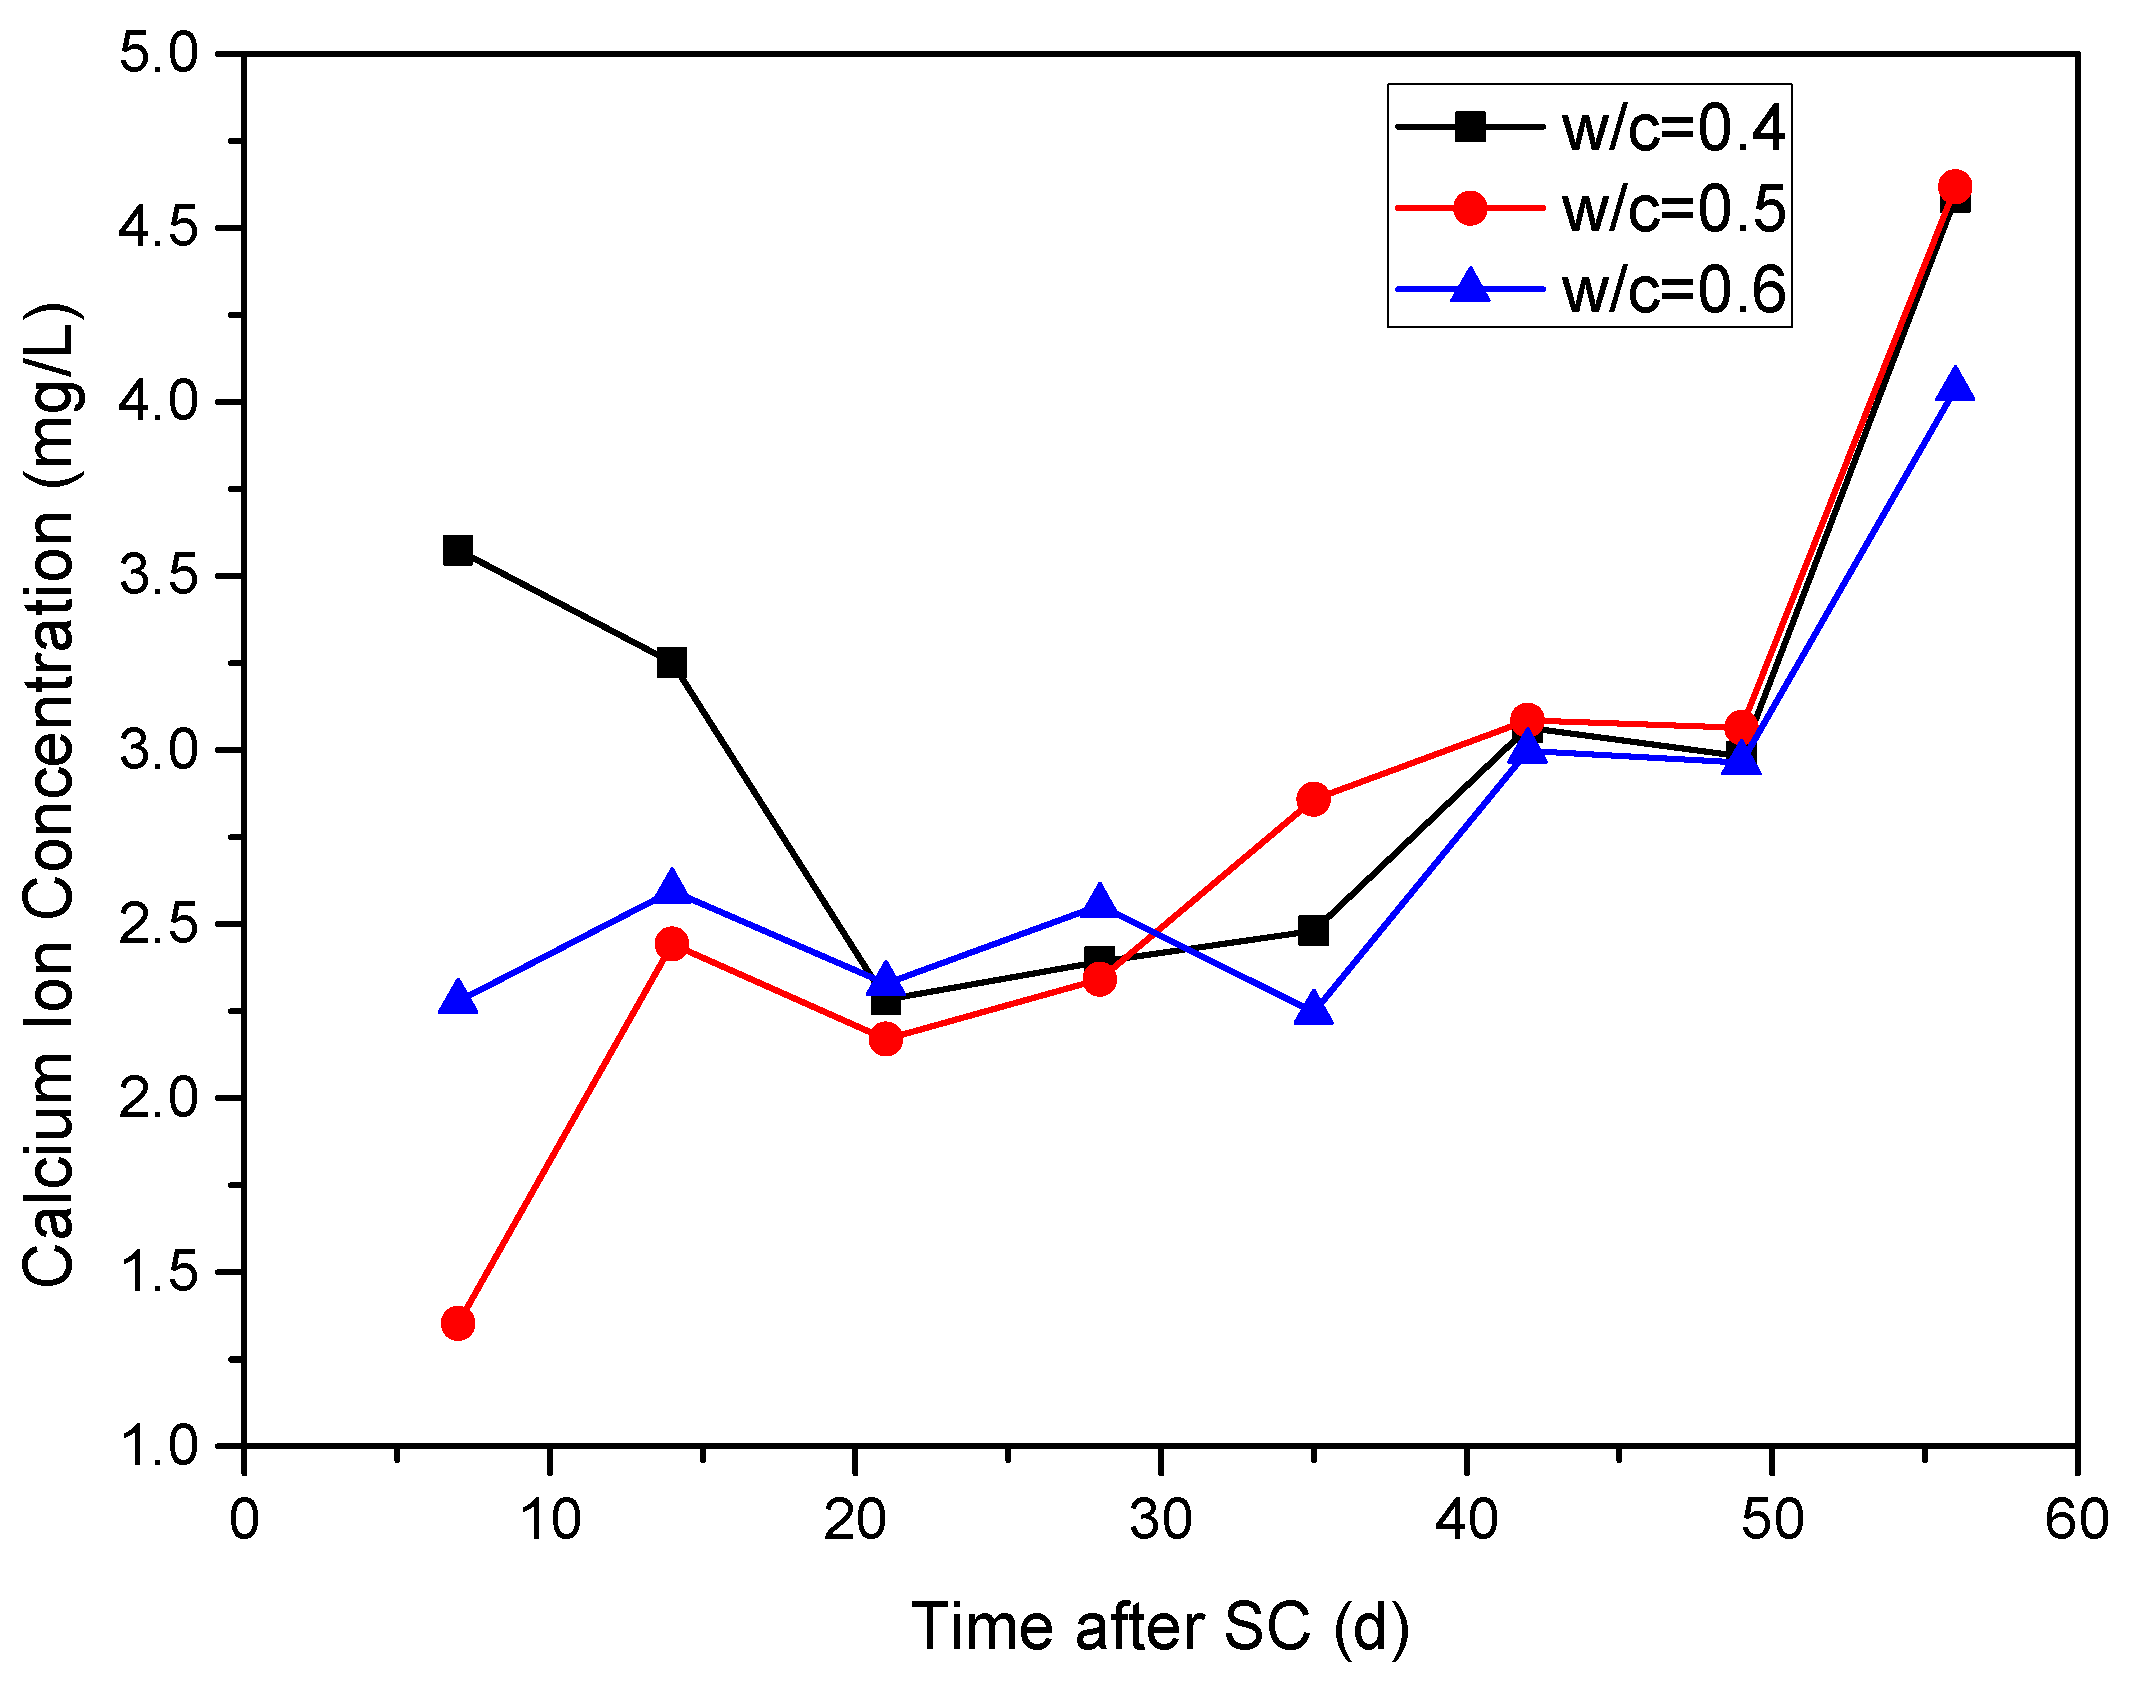
3.2.3. Ca2+ Concentration in the Cathode Side Solution
3.3. Effect of Fly Ash on the Corrosion of Cement-Based Materials under Stray Current
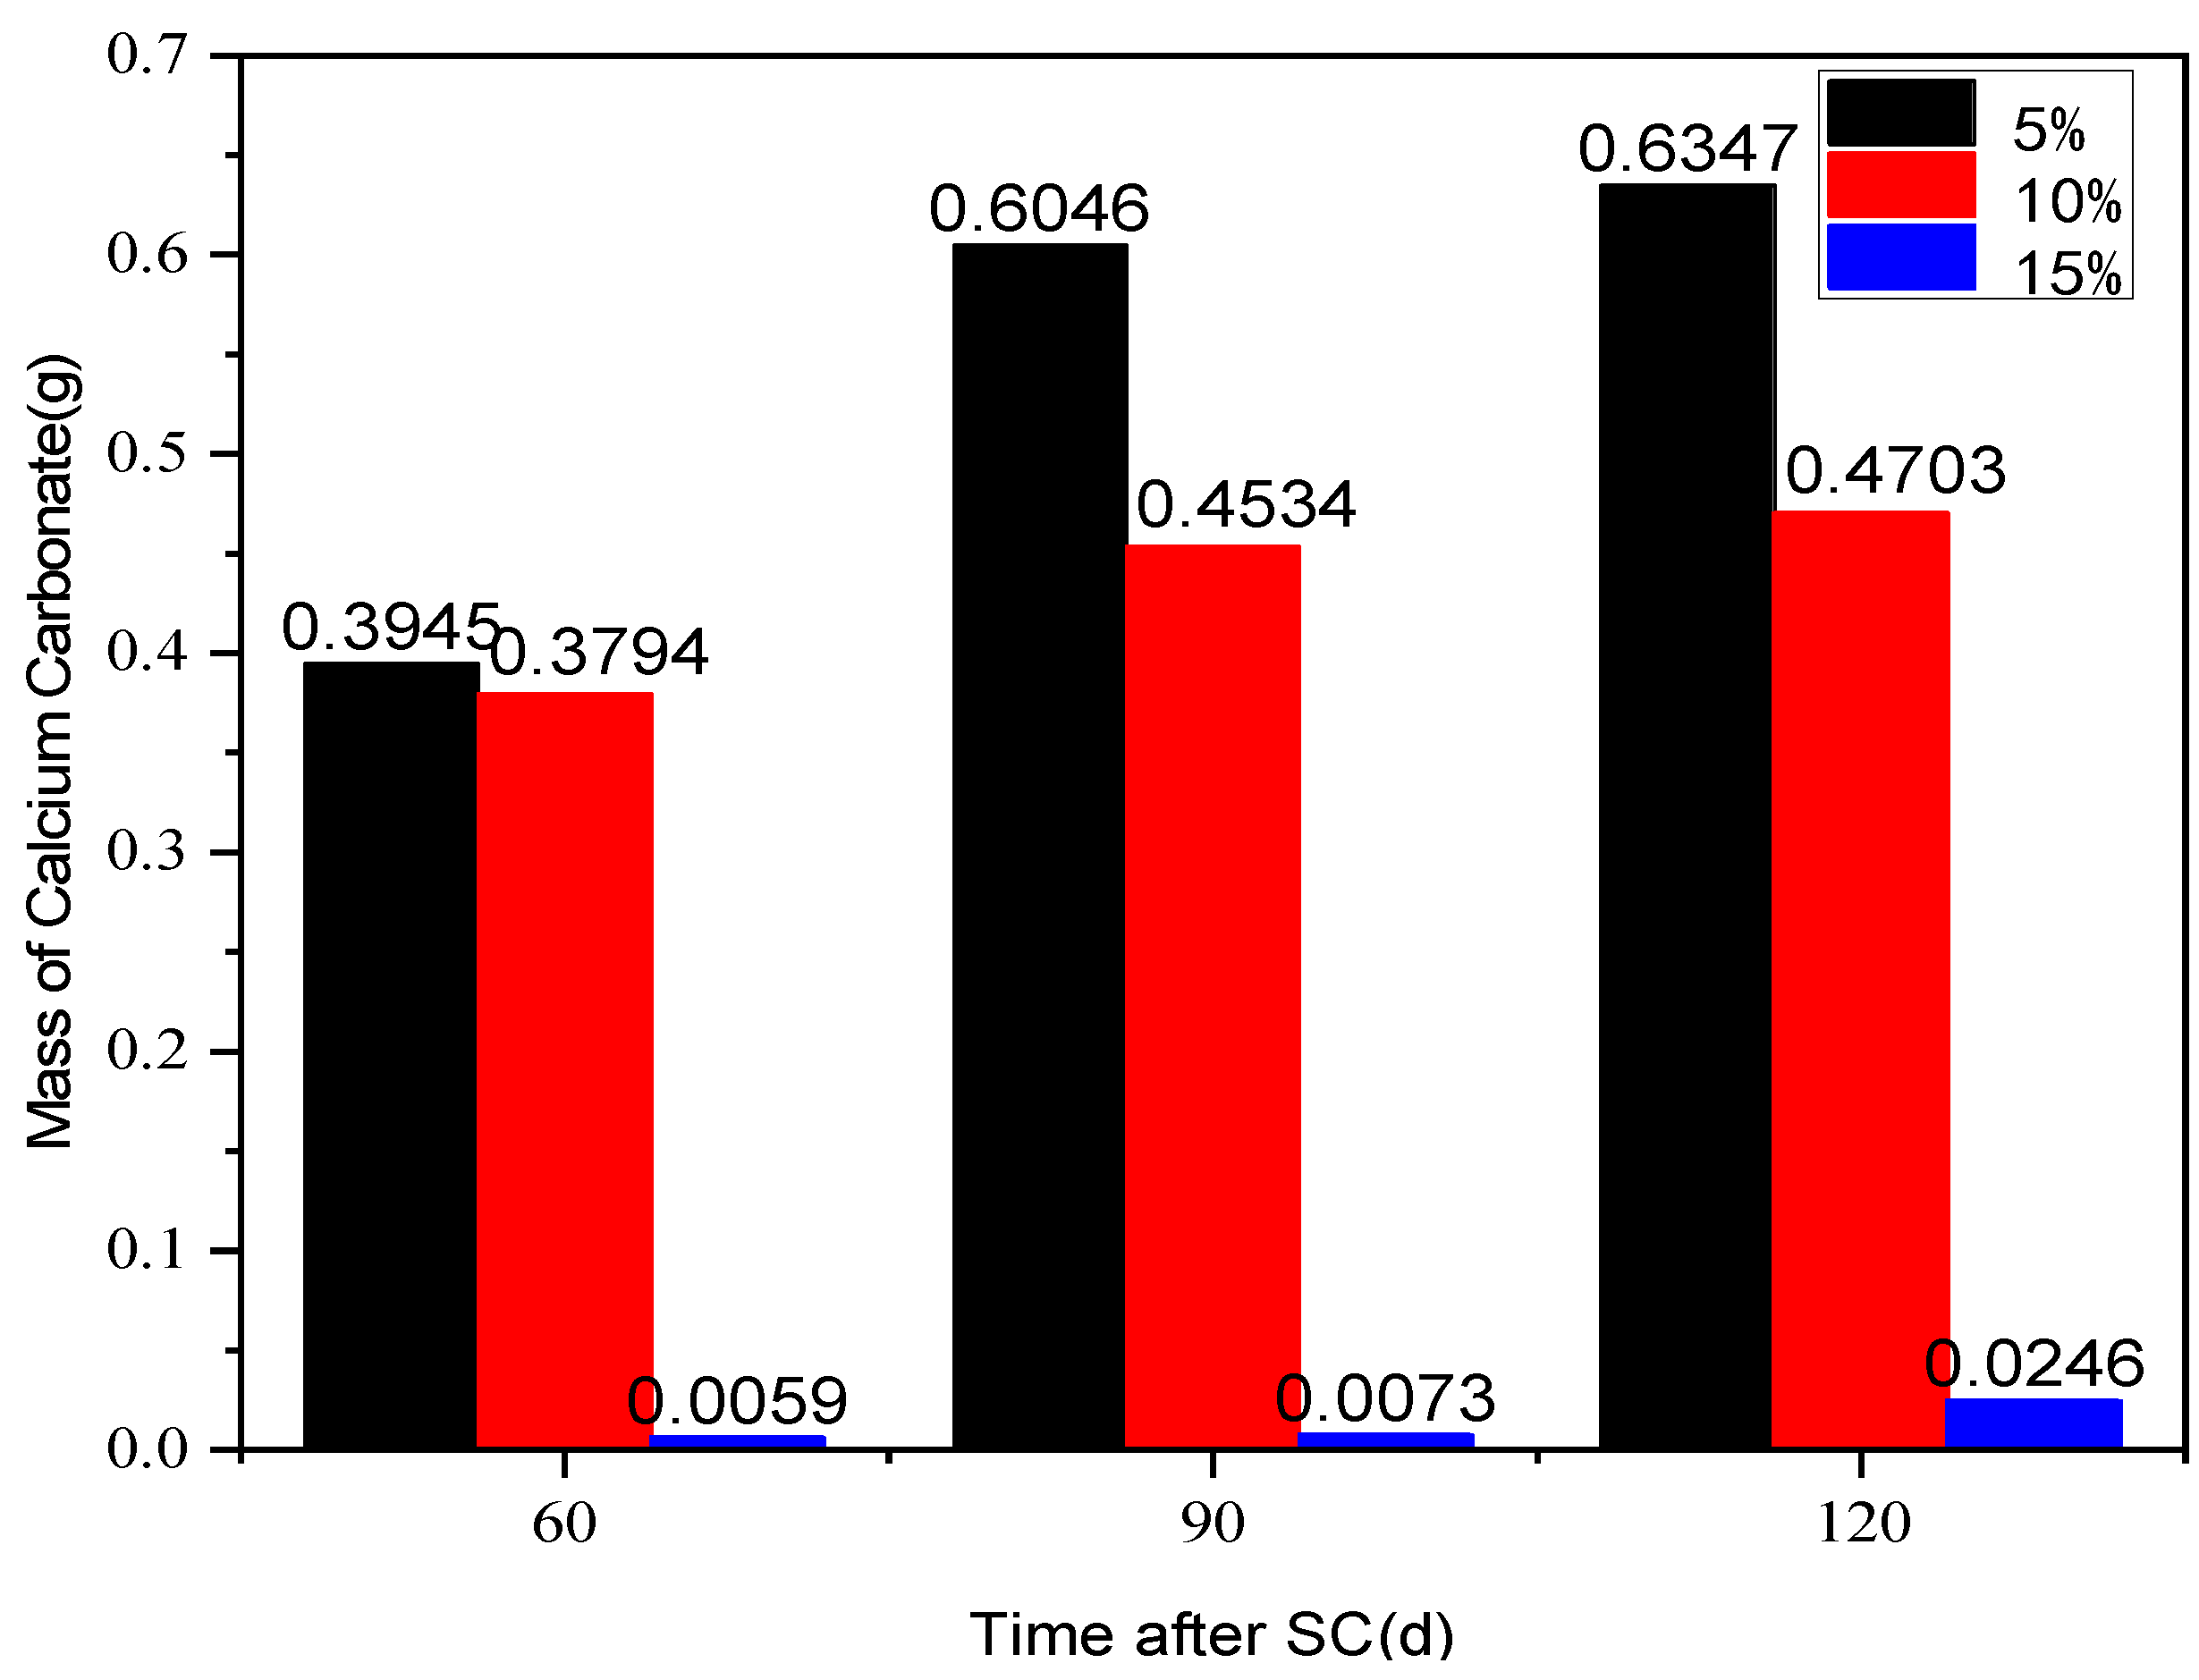
3.3.1. Cathode Side Leachables
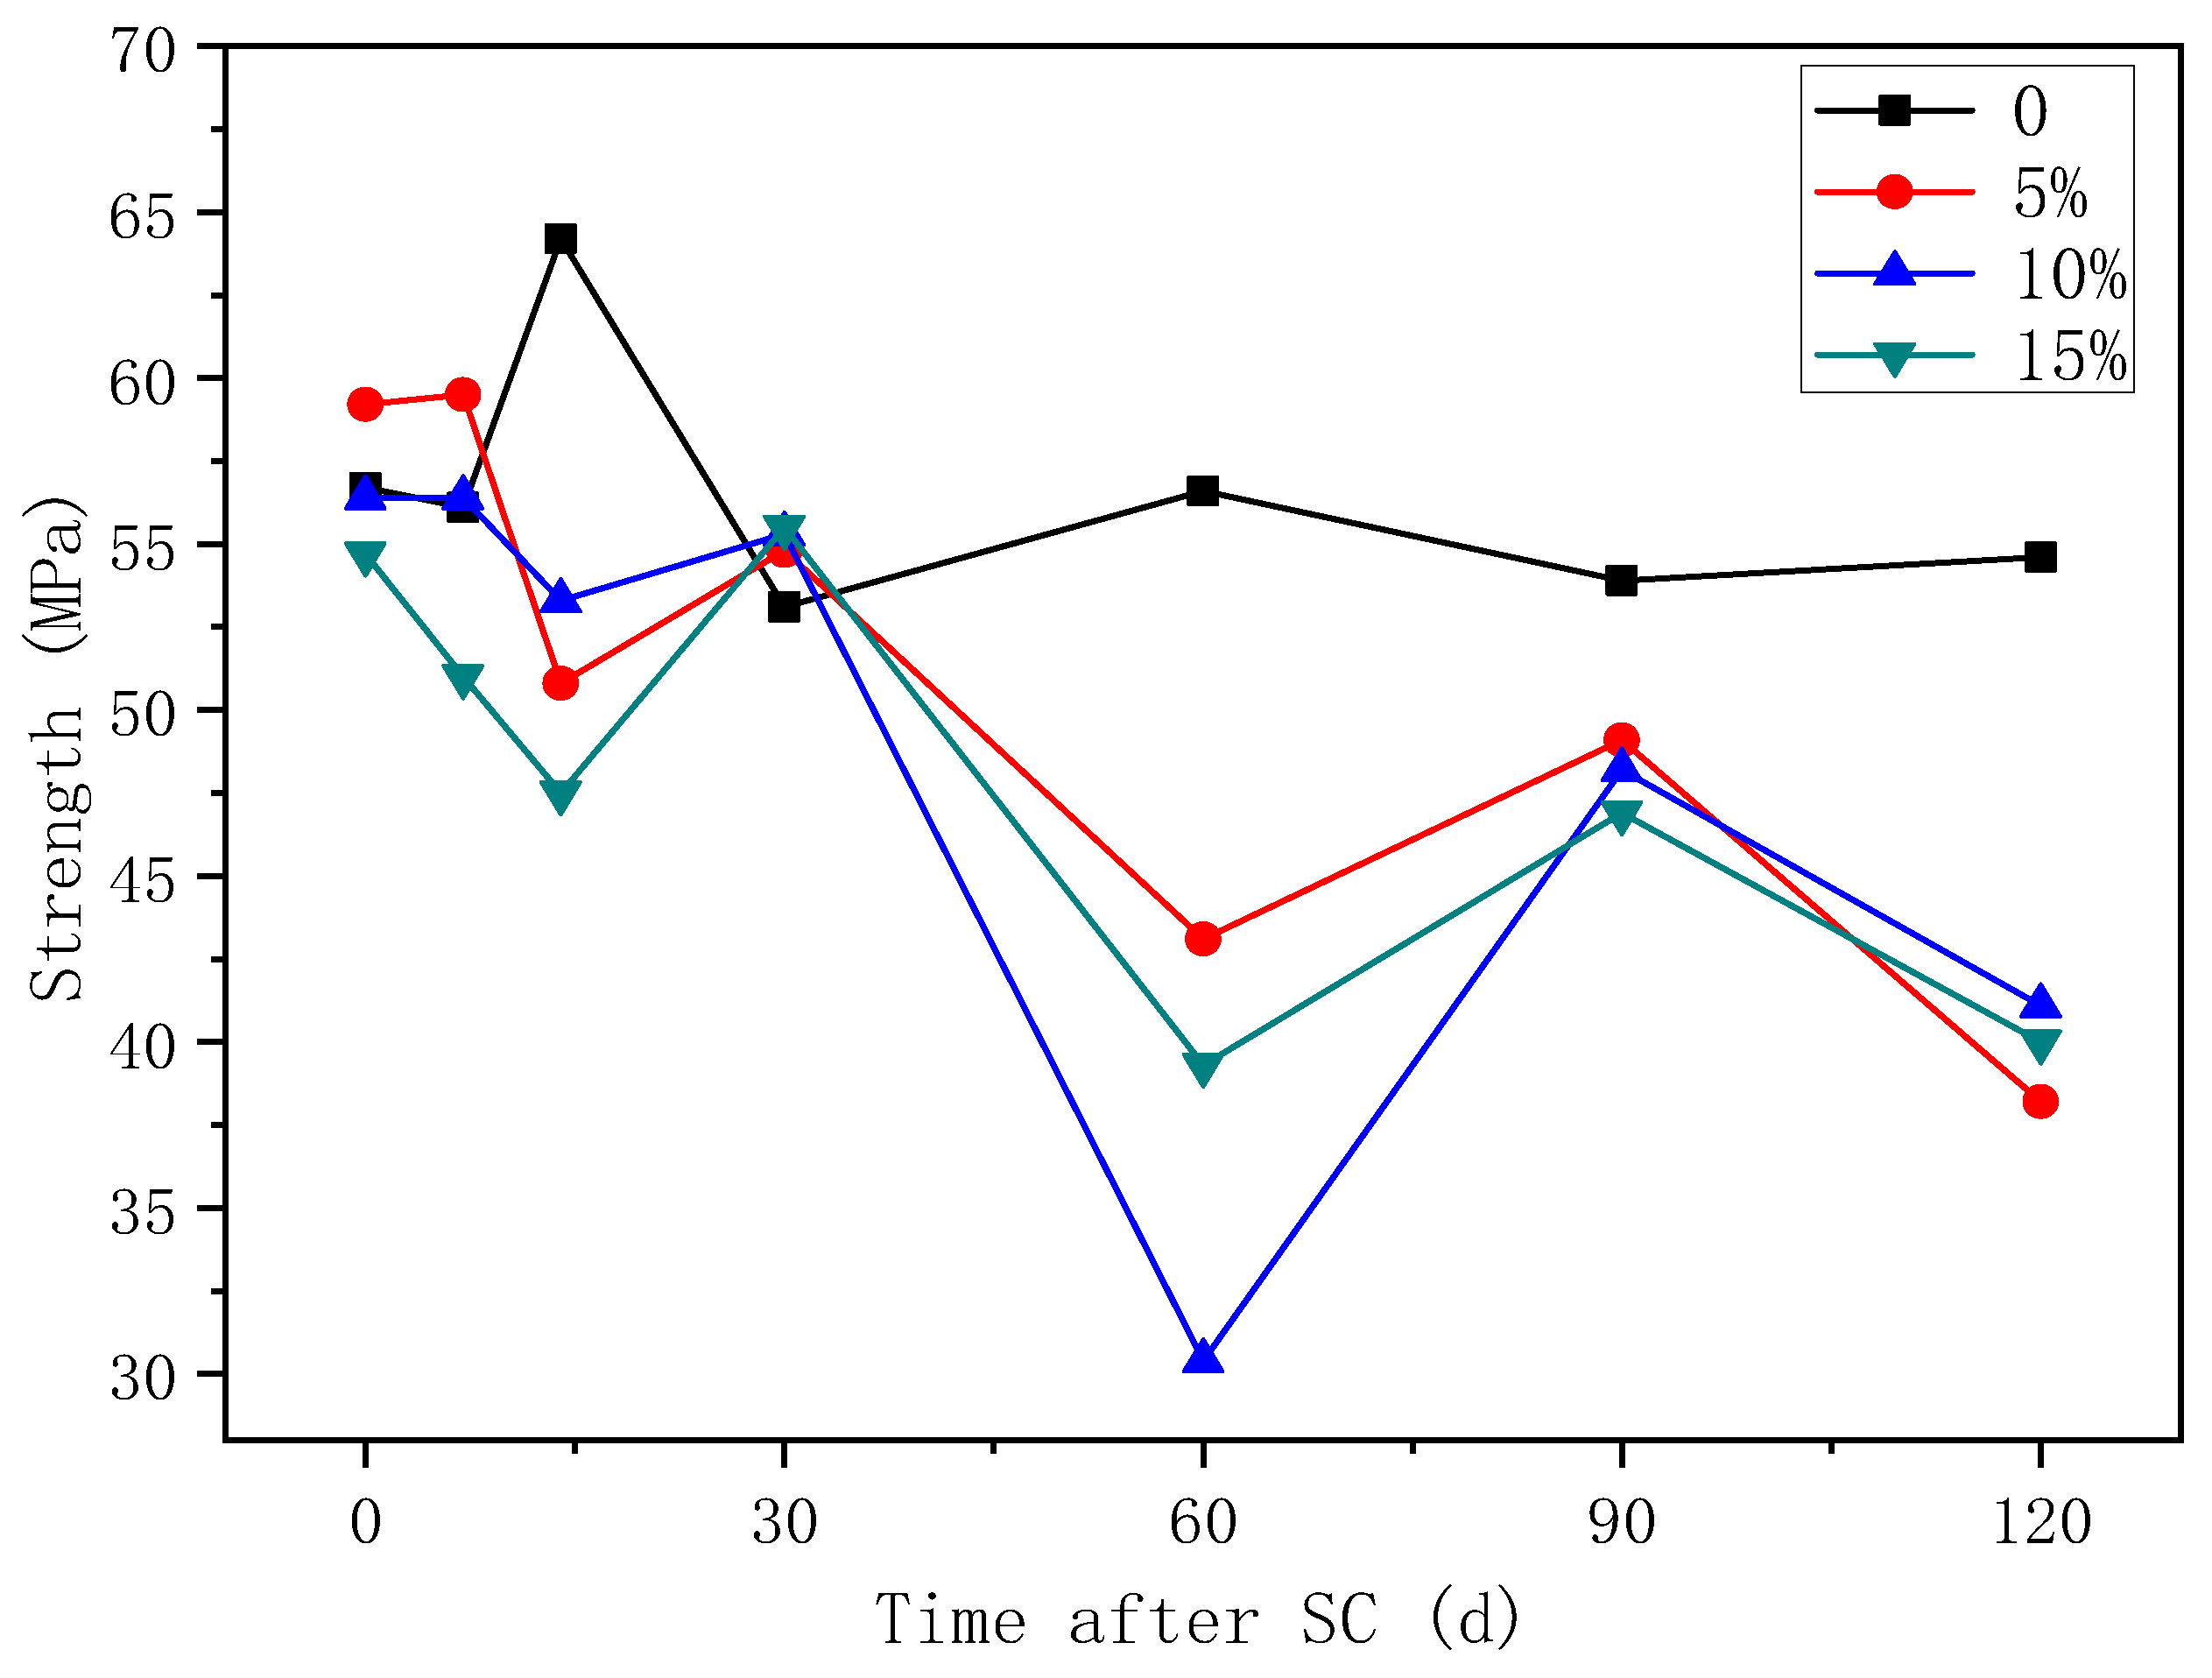
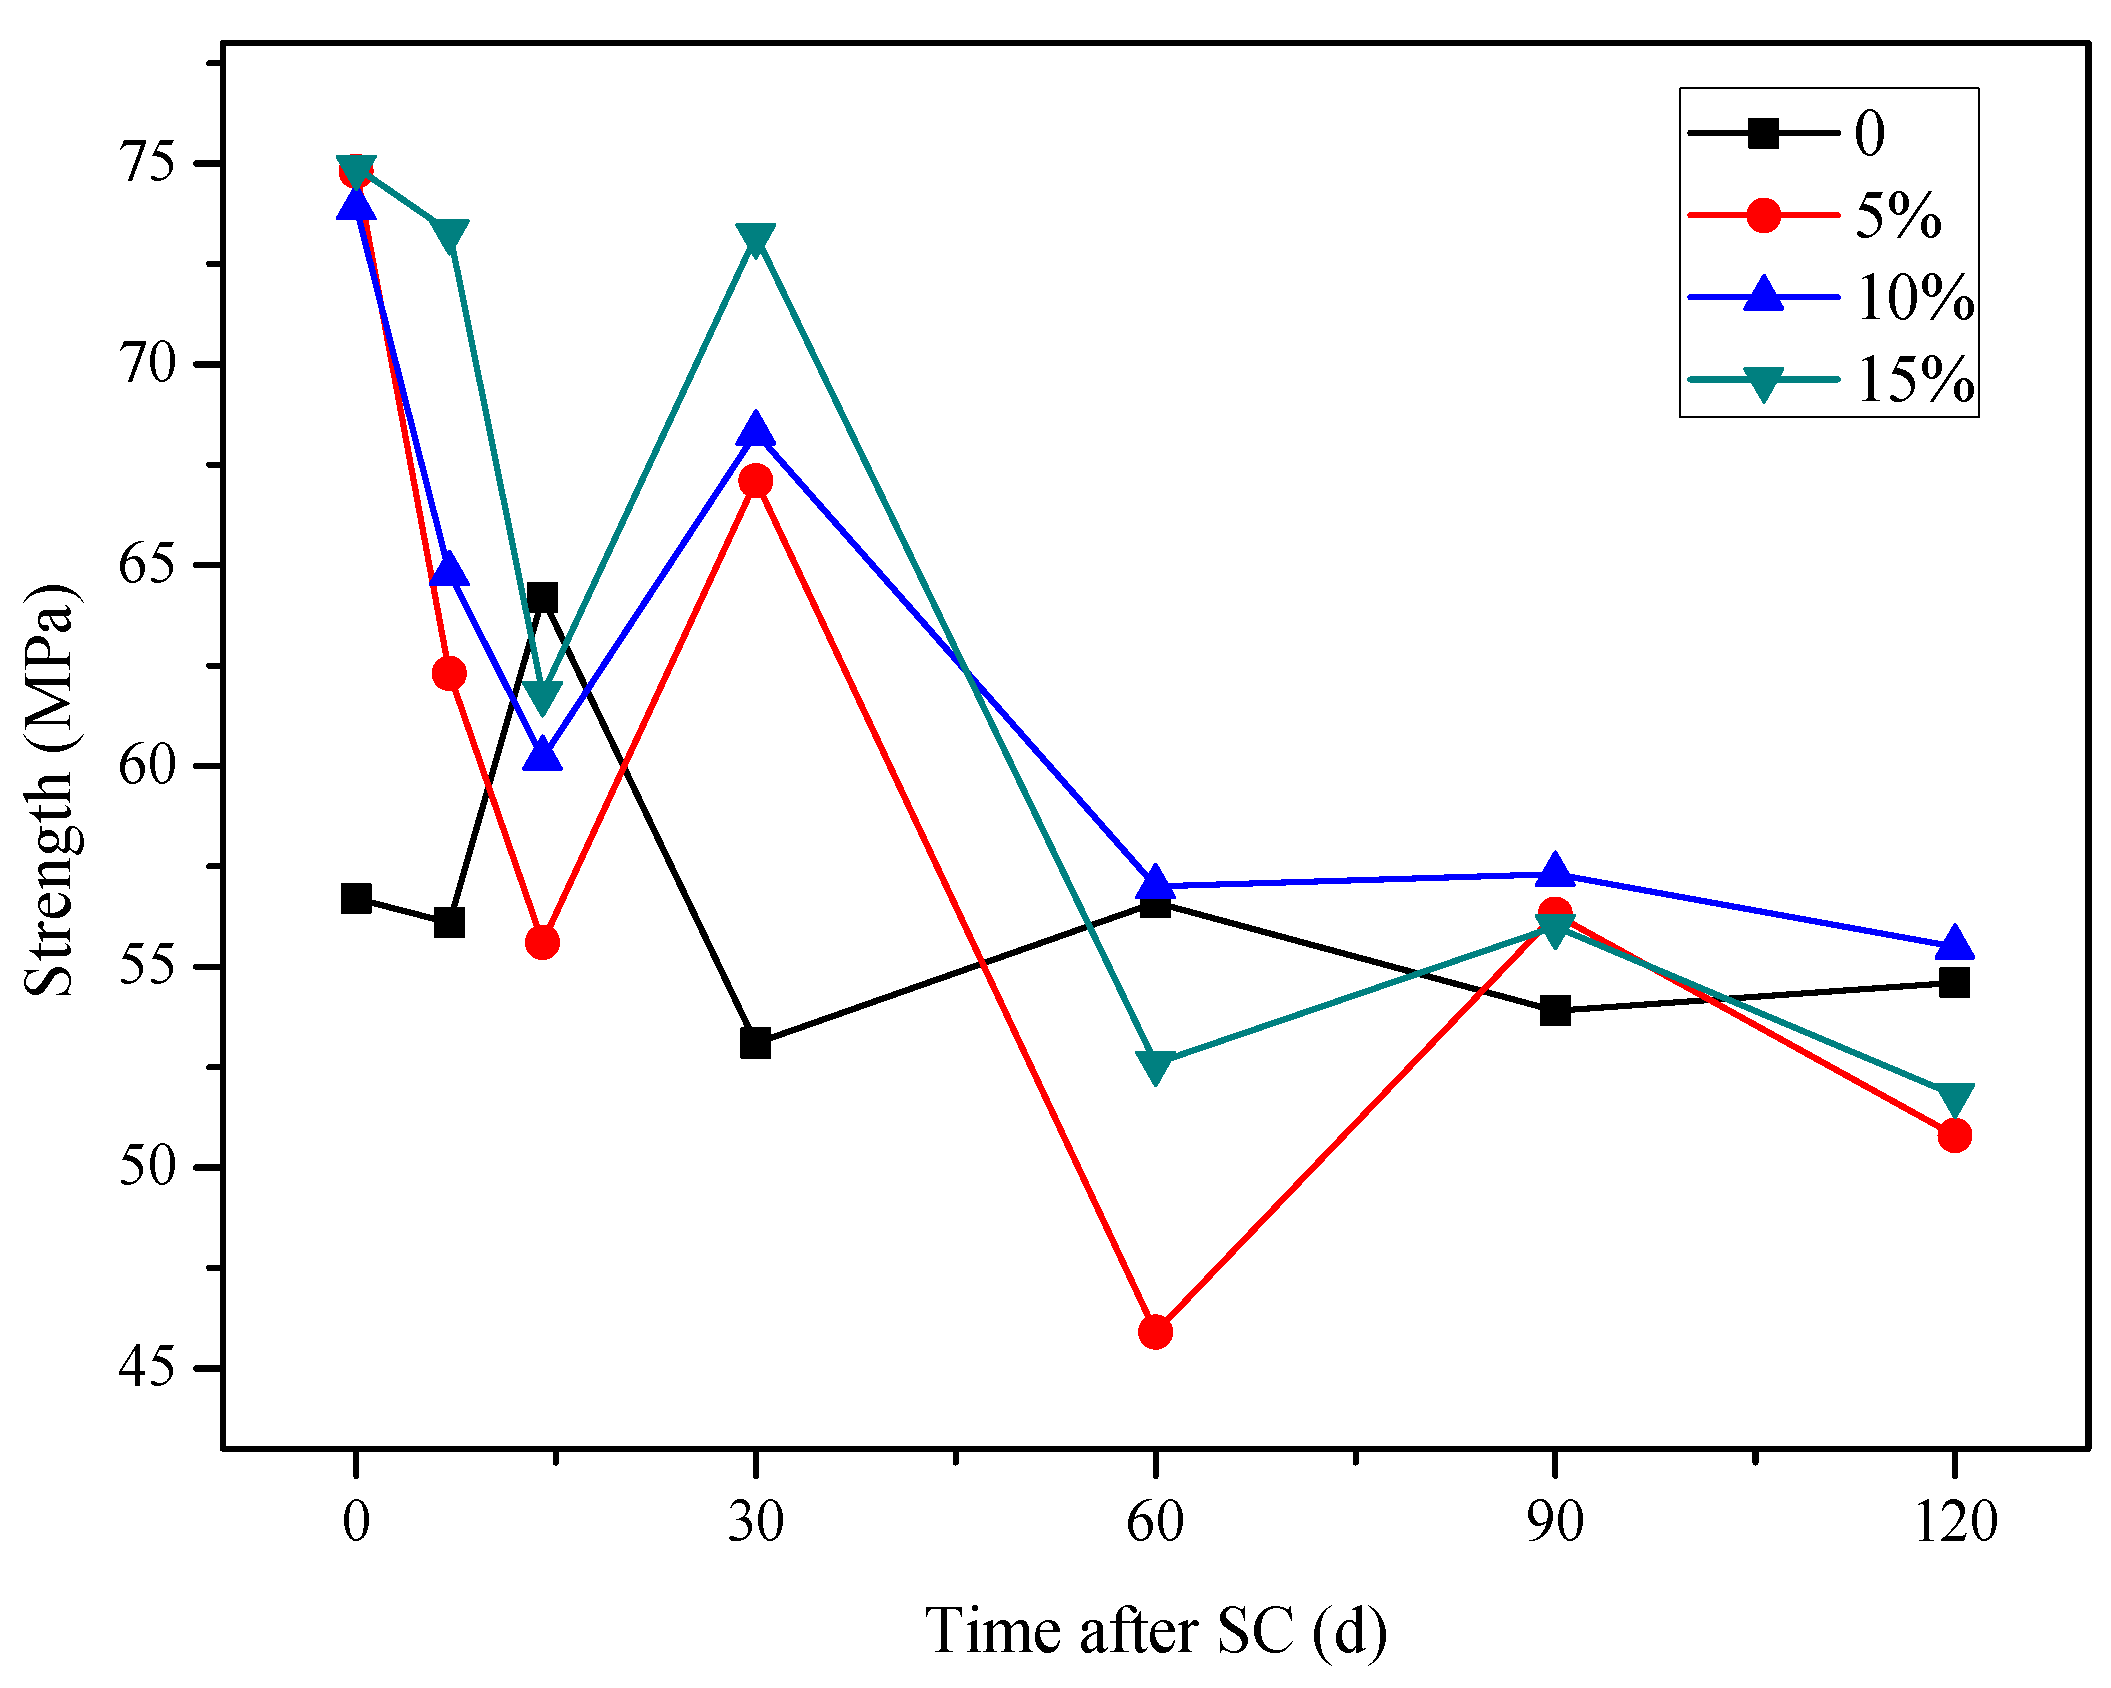
3.3.2. Compressive Strength
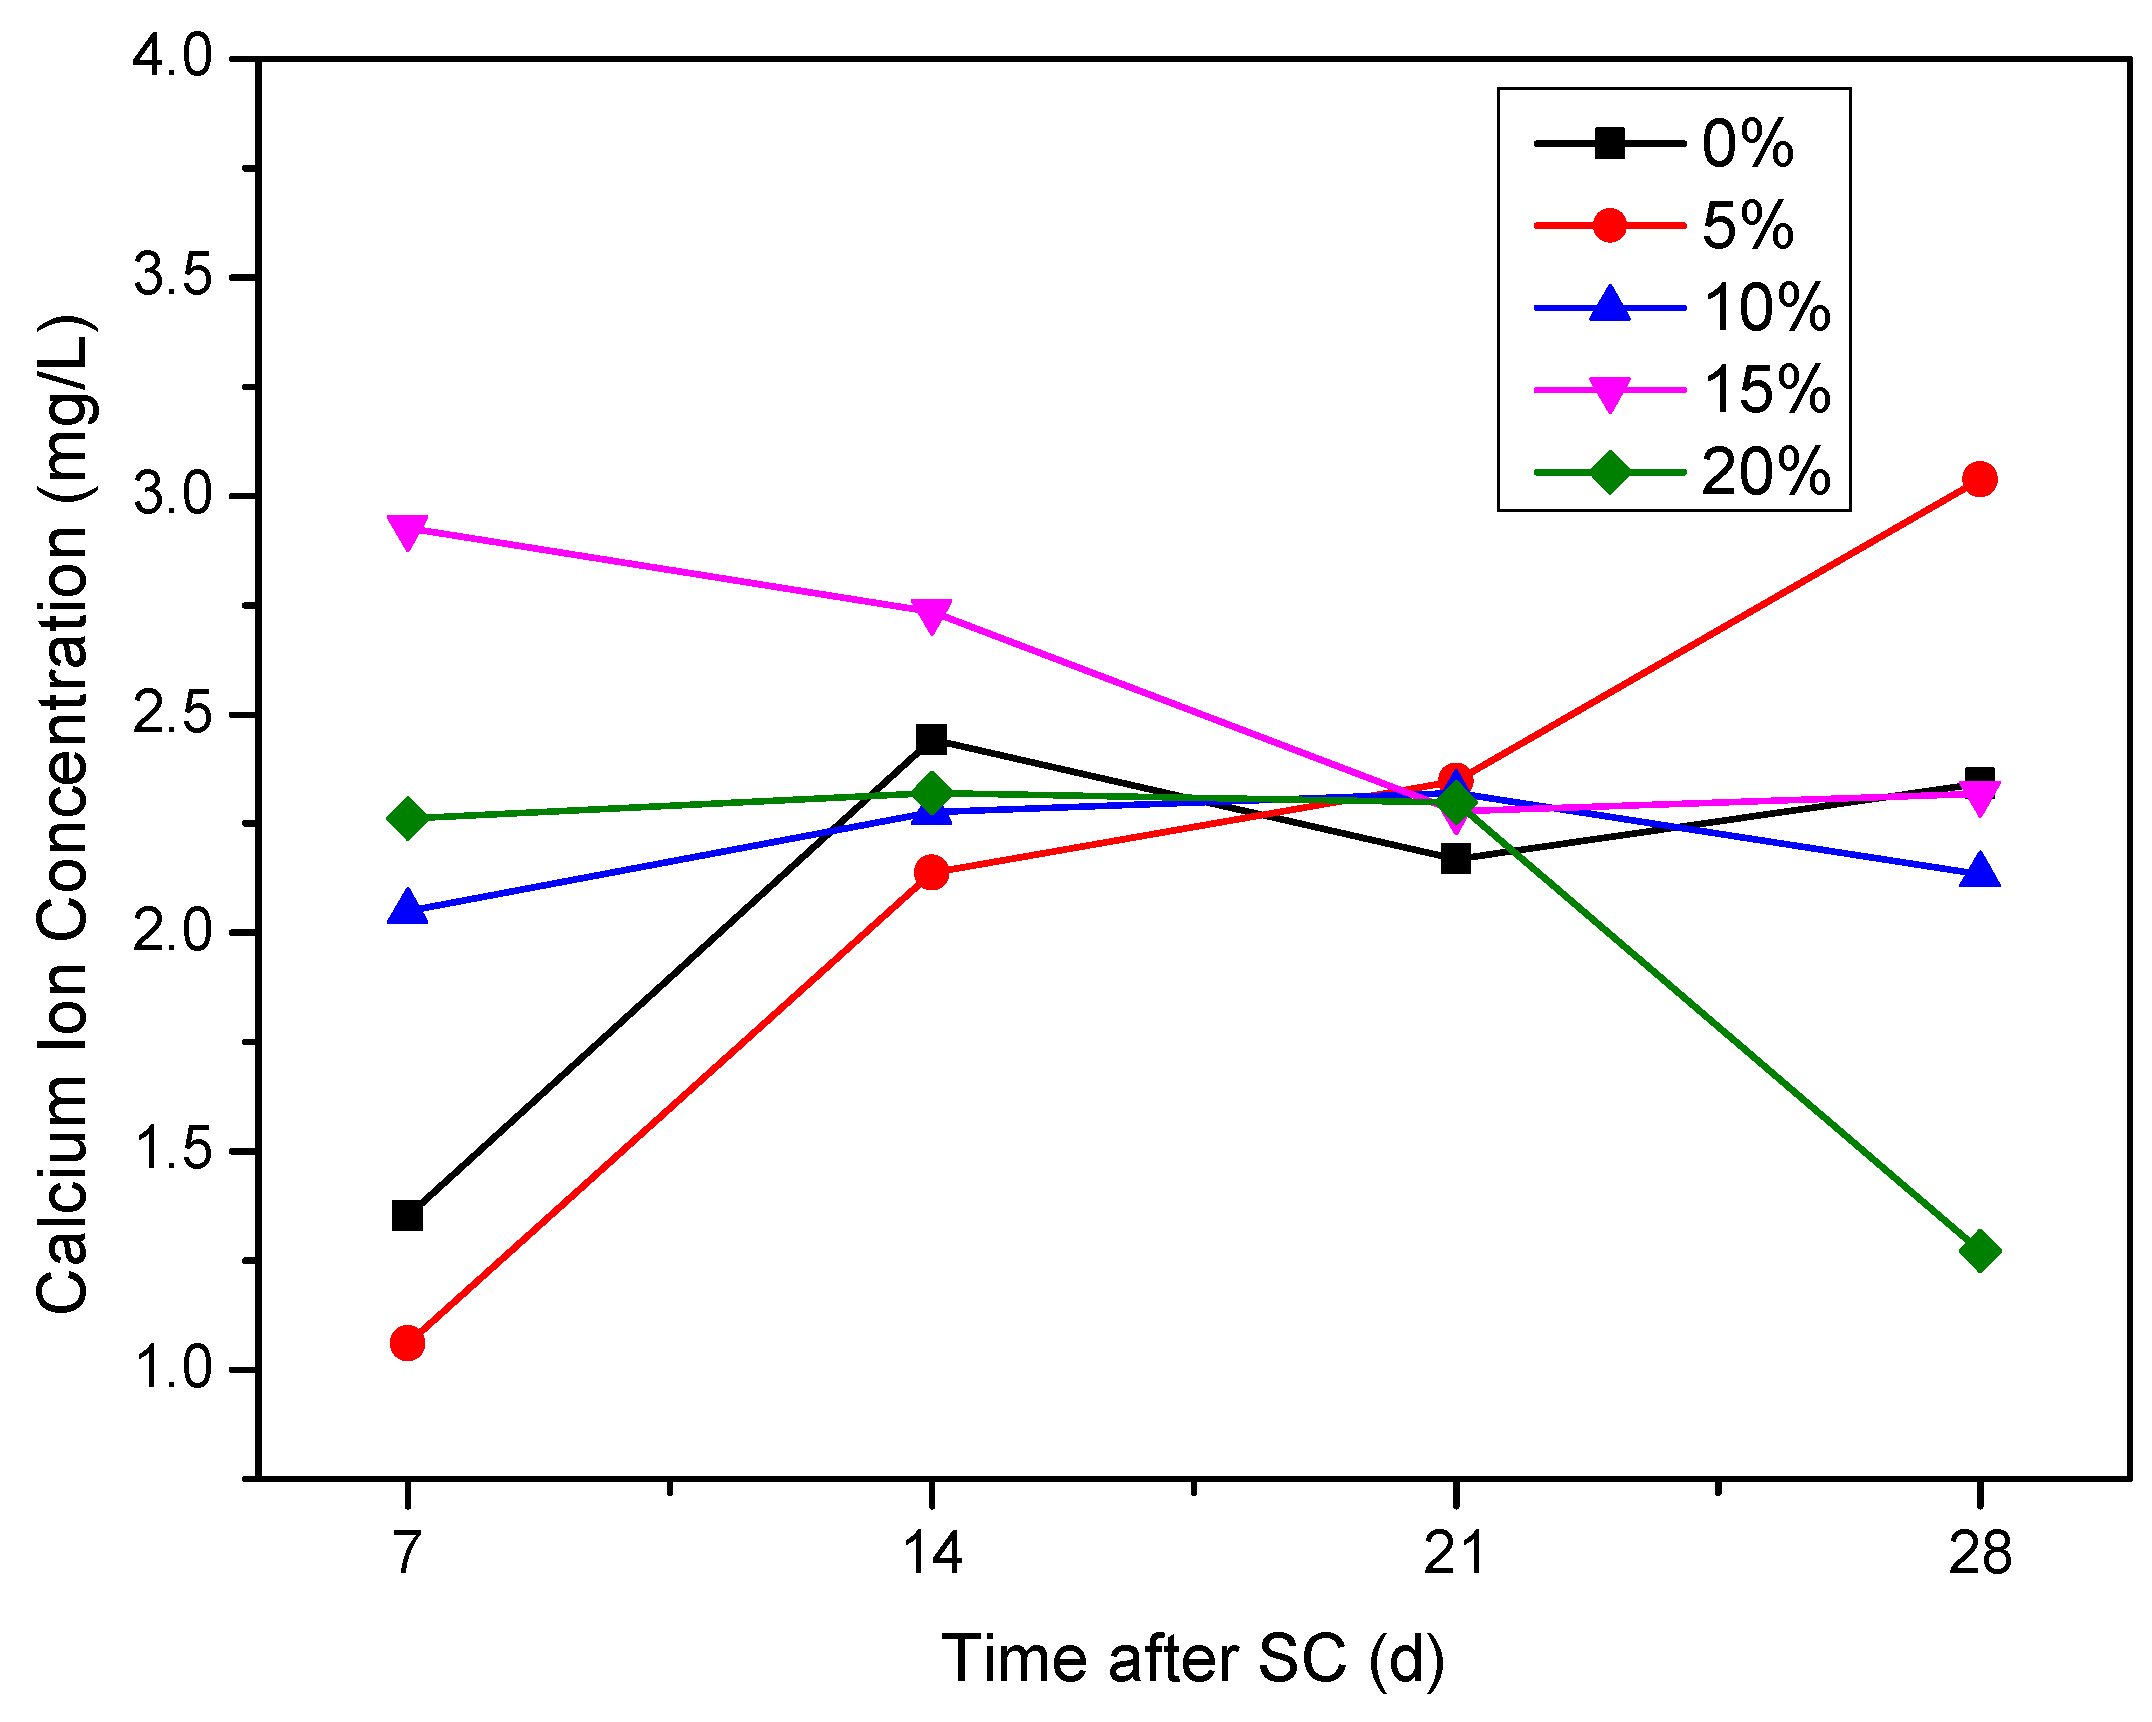
3.3.3. Ca2+ Concentration in the Cathode Side Solution
3.4. Effect of Silica Fume on the Corrosion of Cement-Based Materials under Stray Current
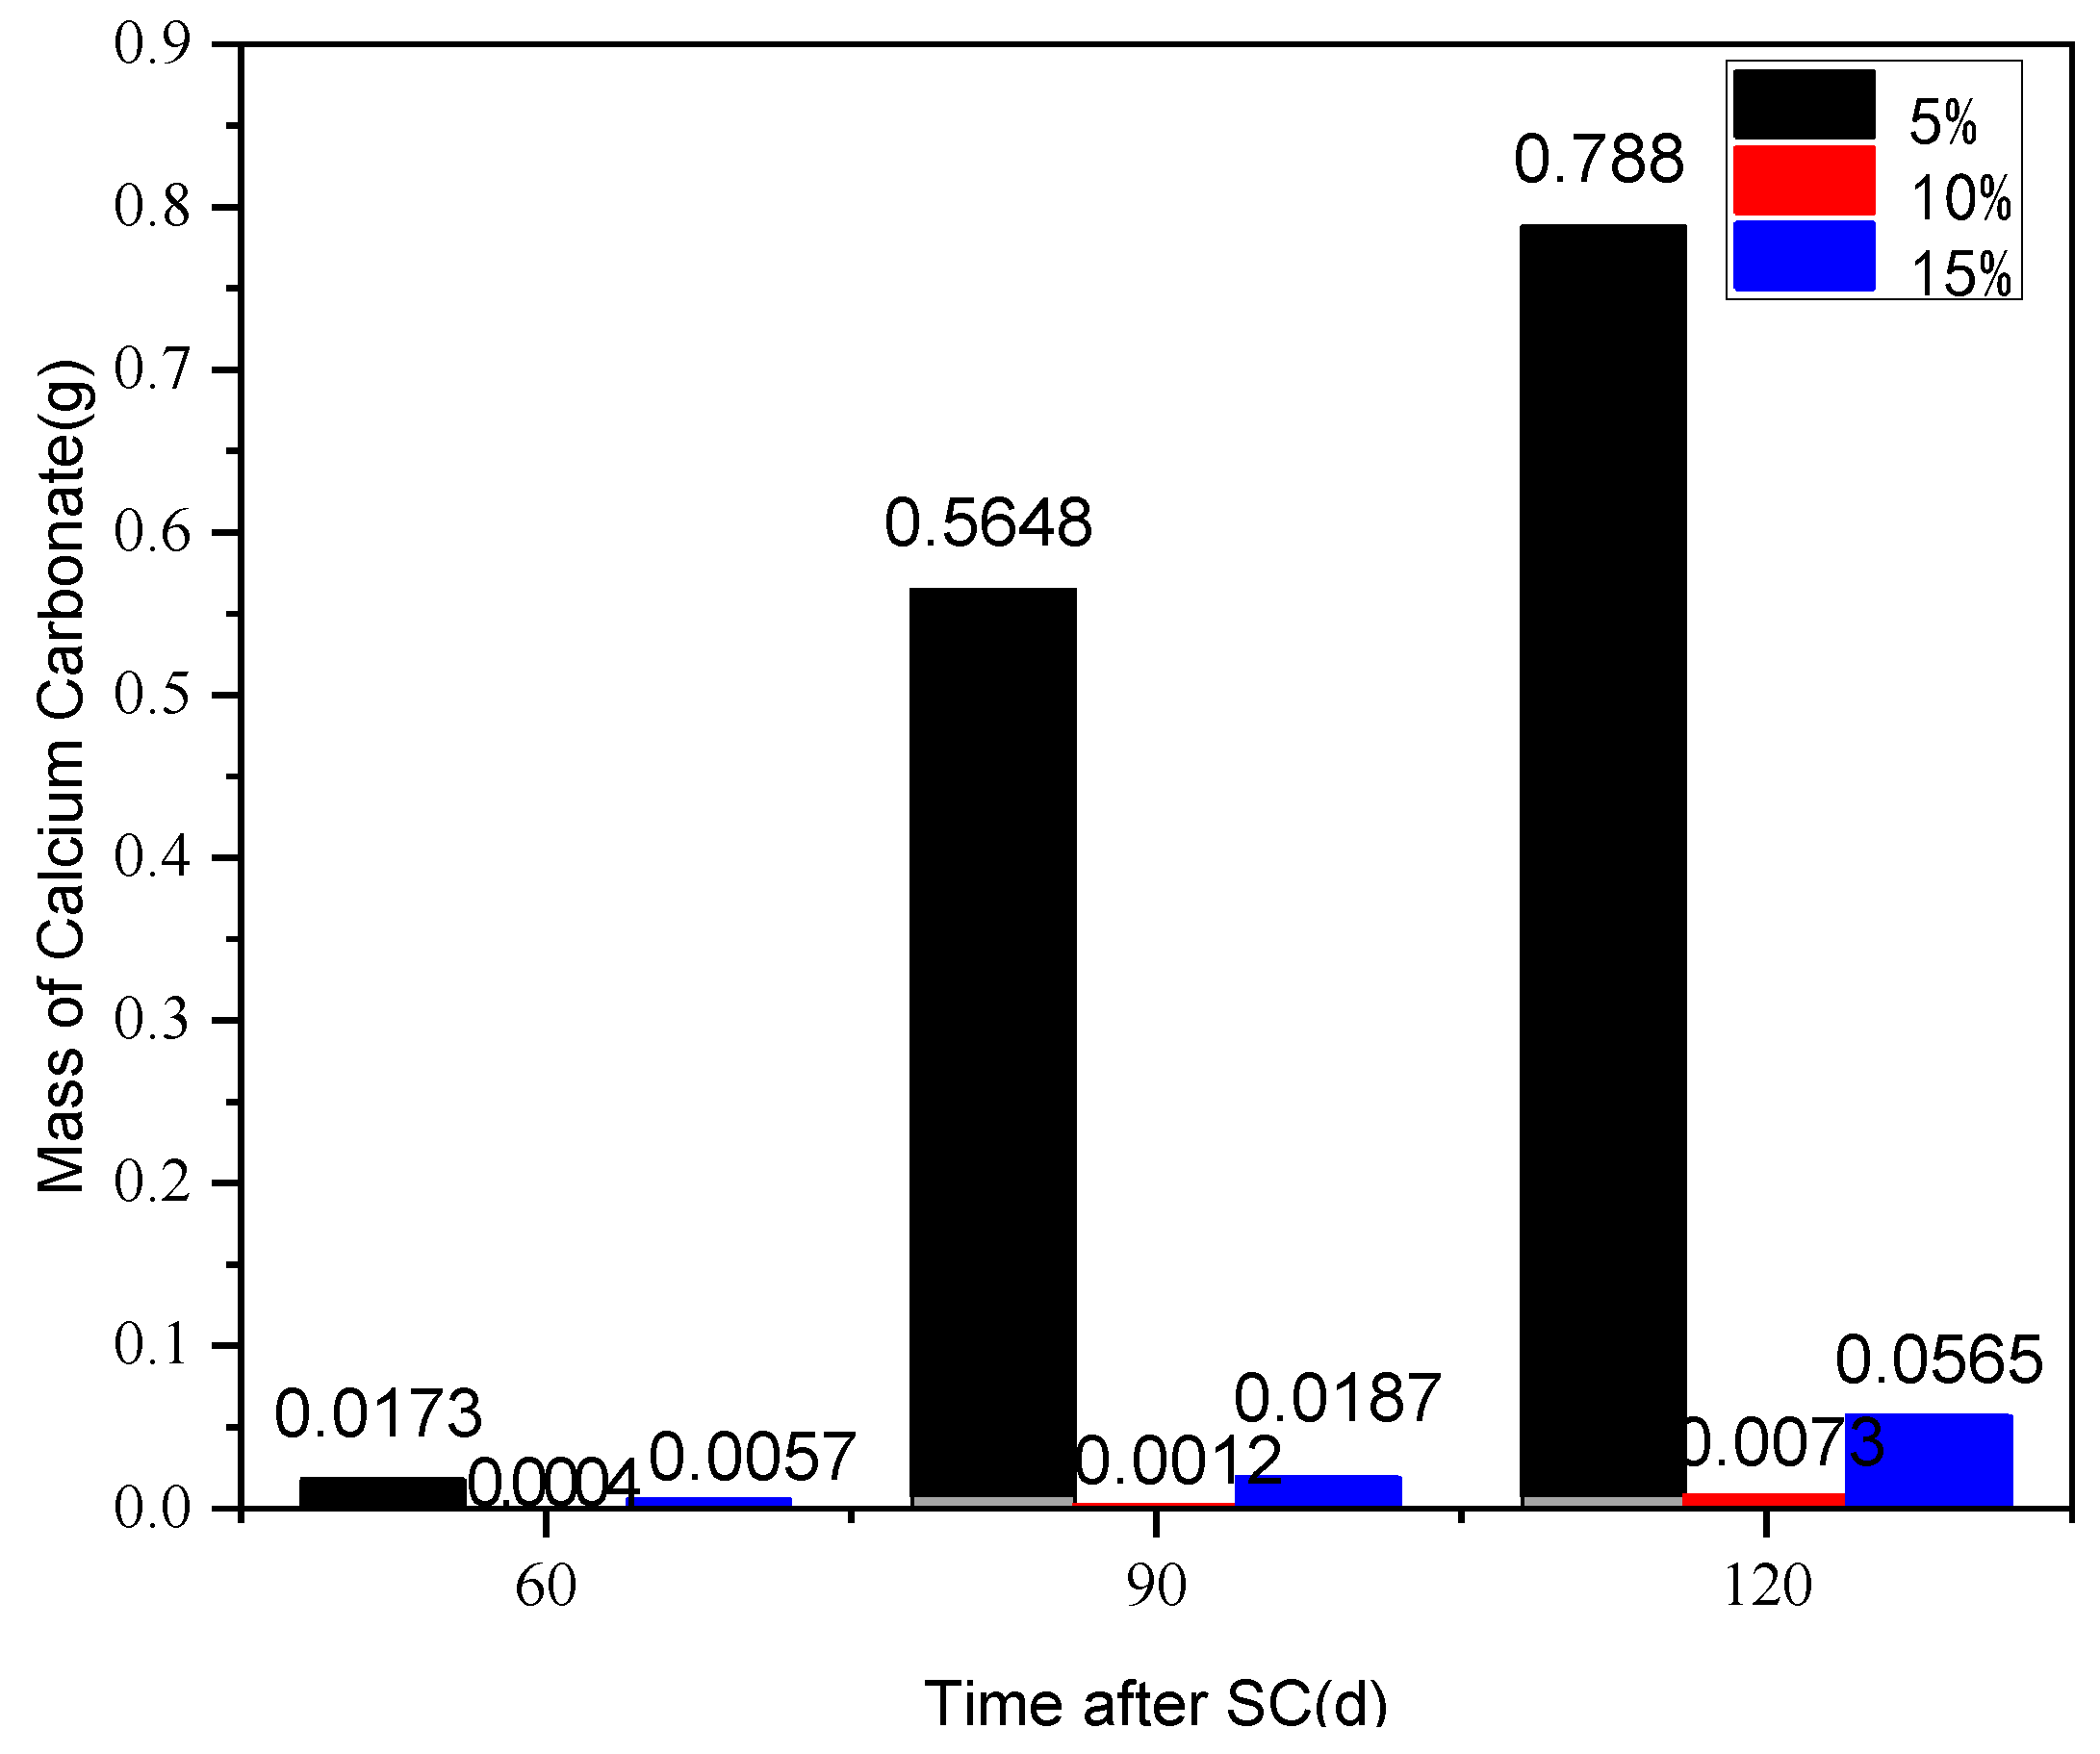
3.4.1. Cathode Side Leachables
3.4.2. Compressive Strength
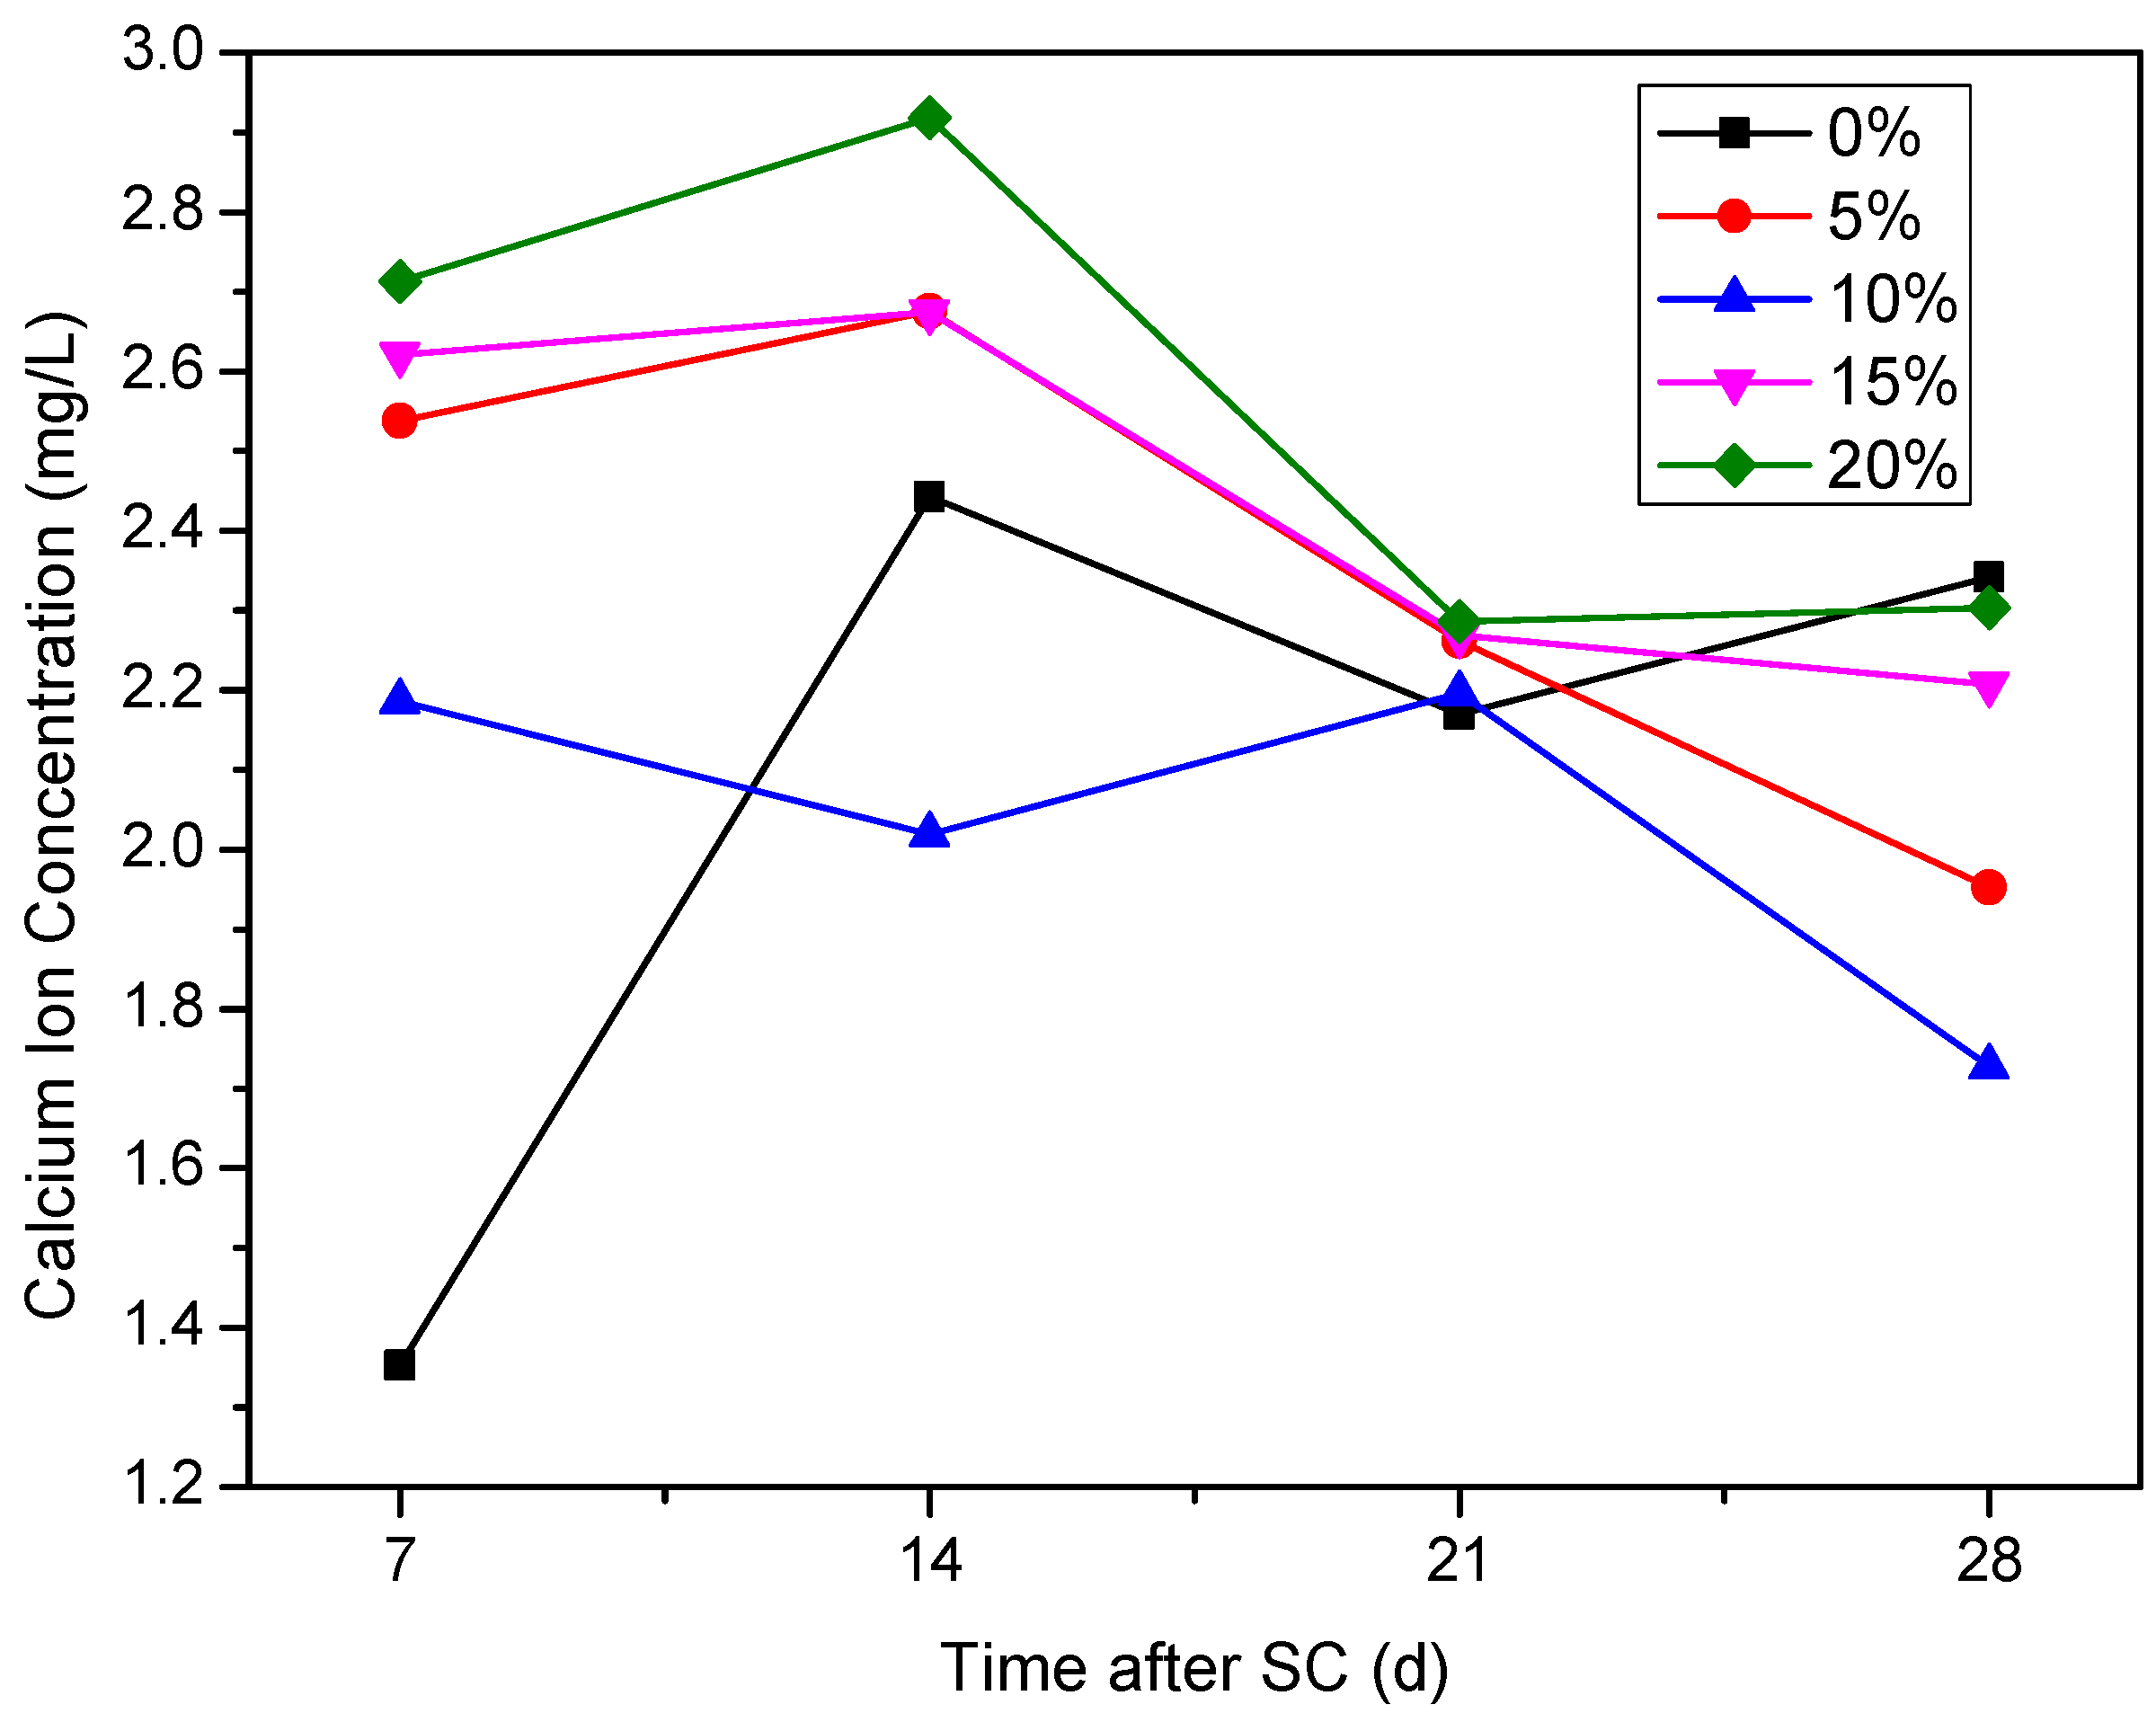
3.4.3. Ca2+ Concentration in the Cathode Side Solution
4. Conclusions
- (1)
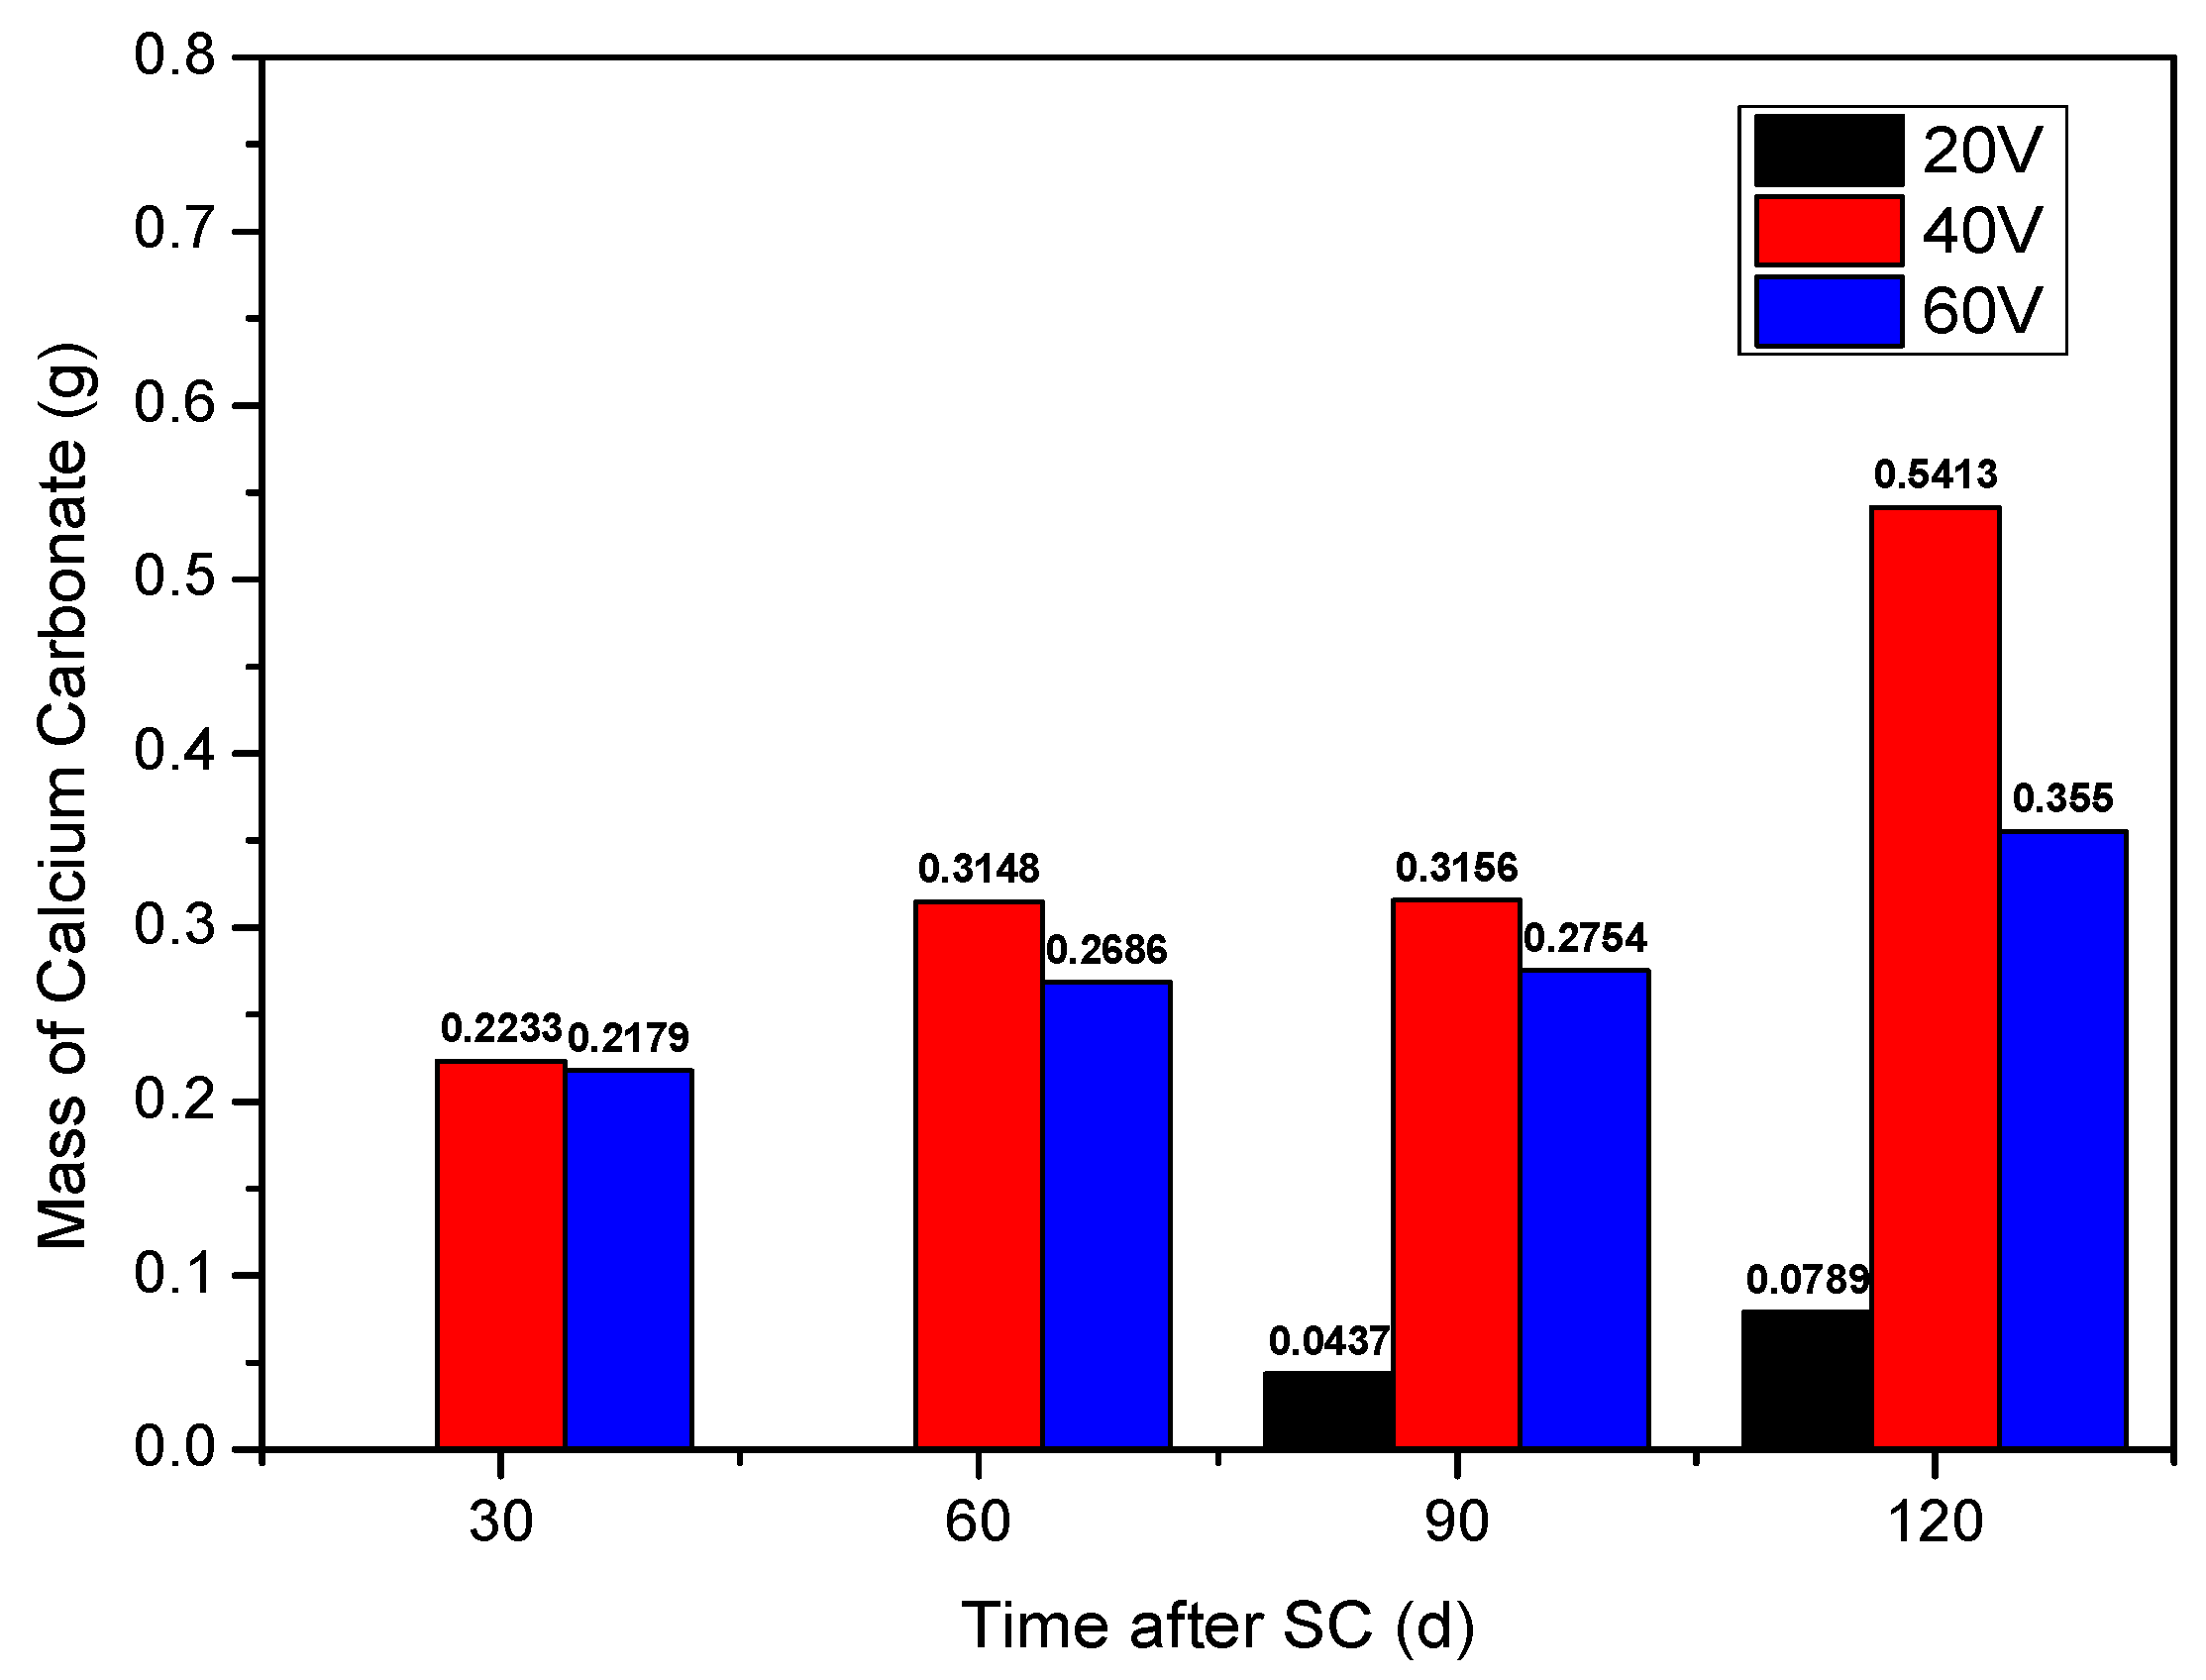
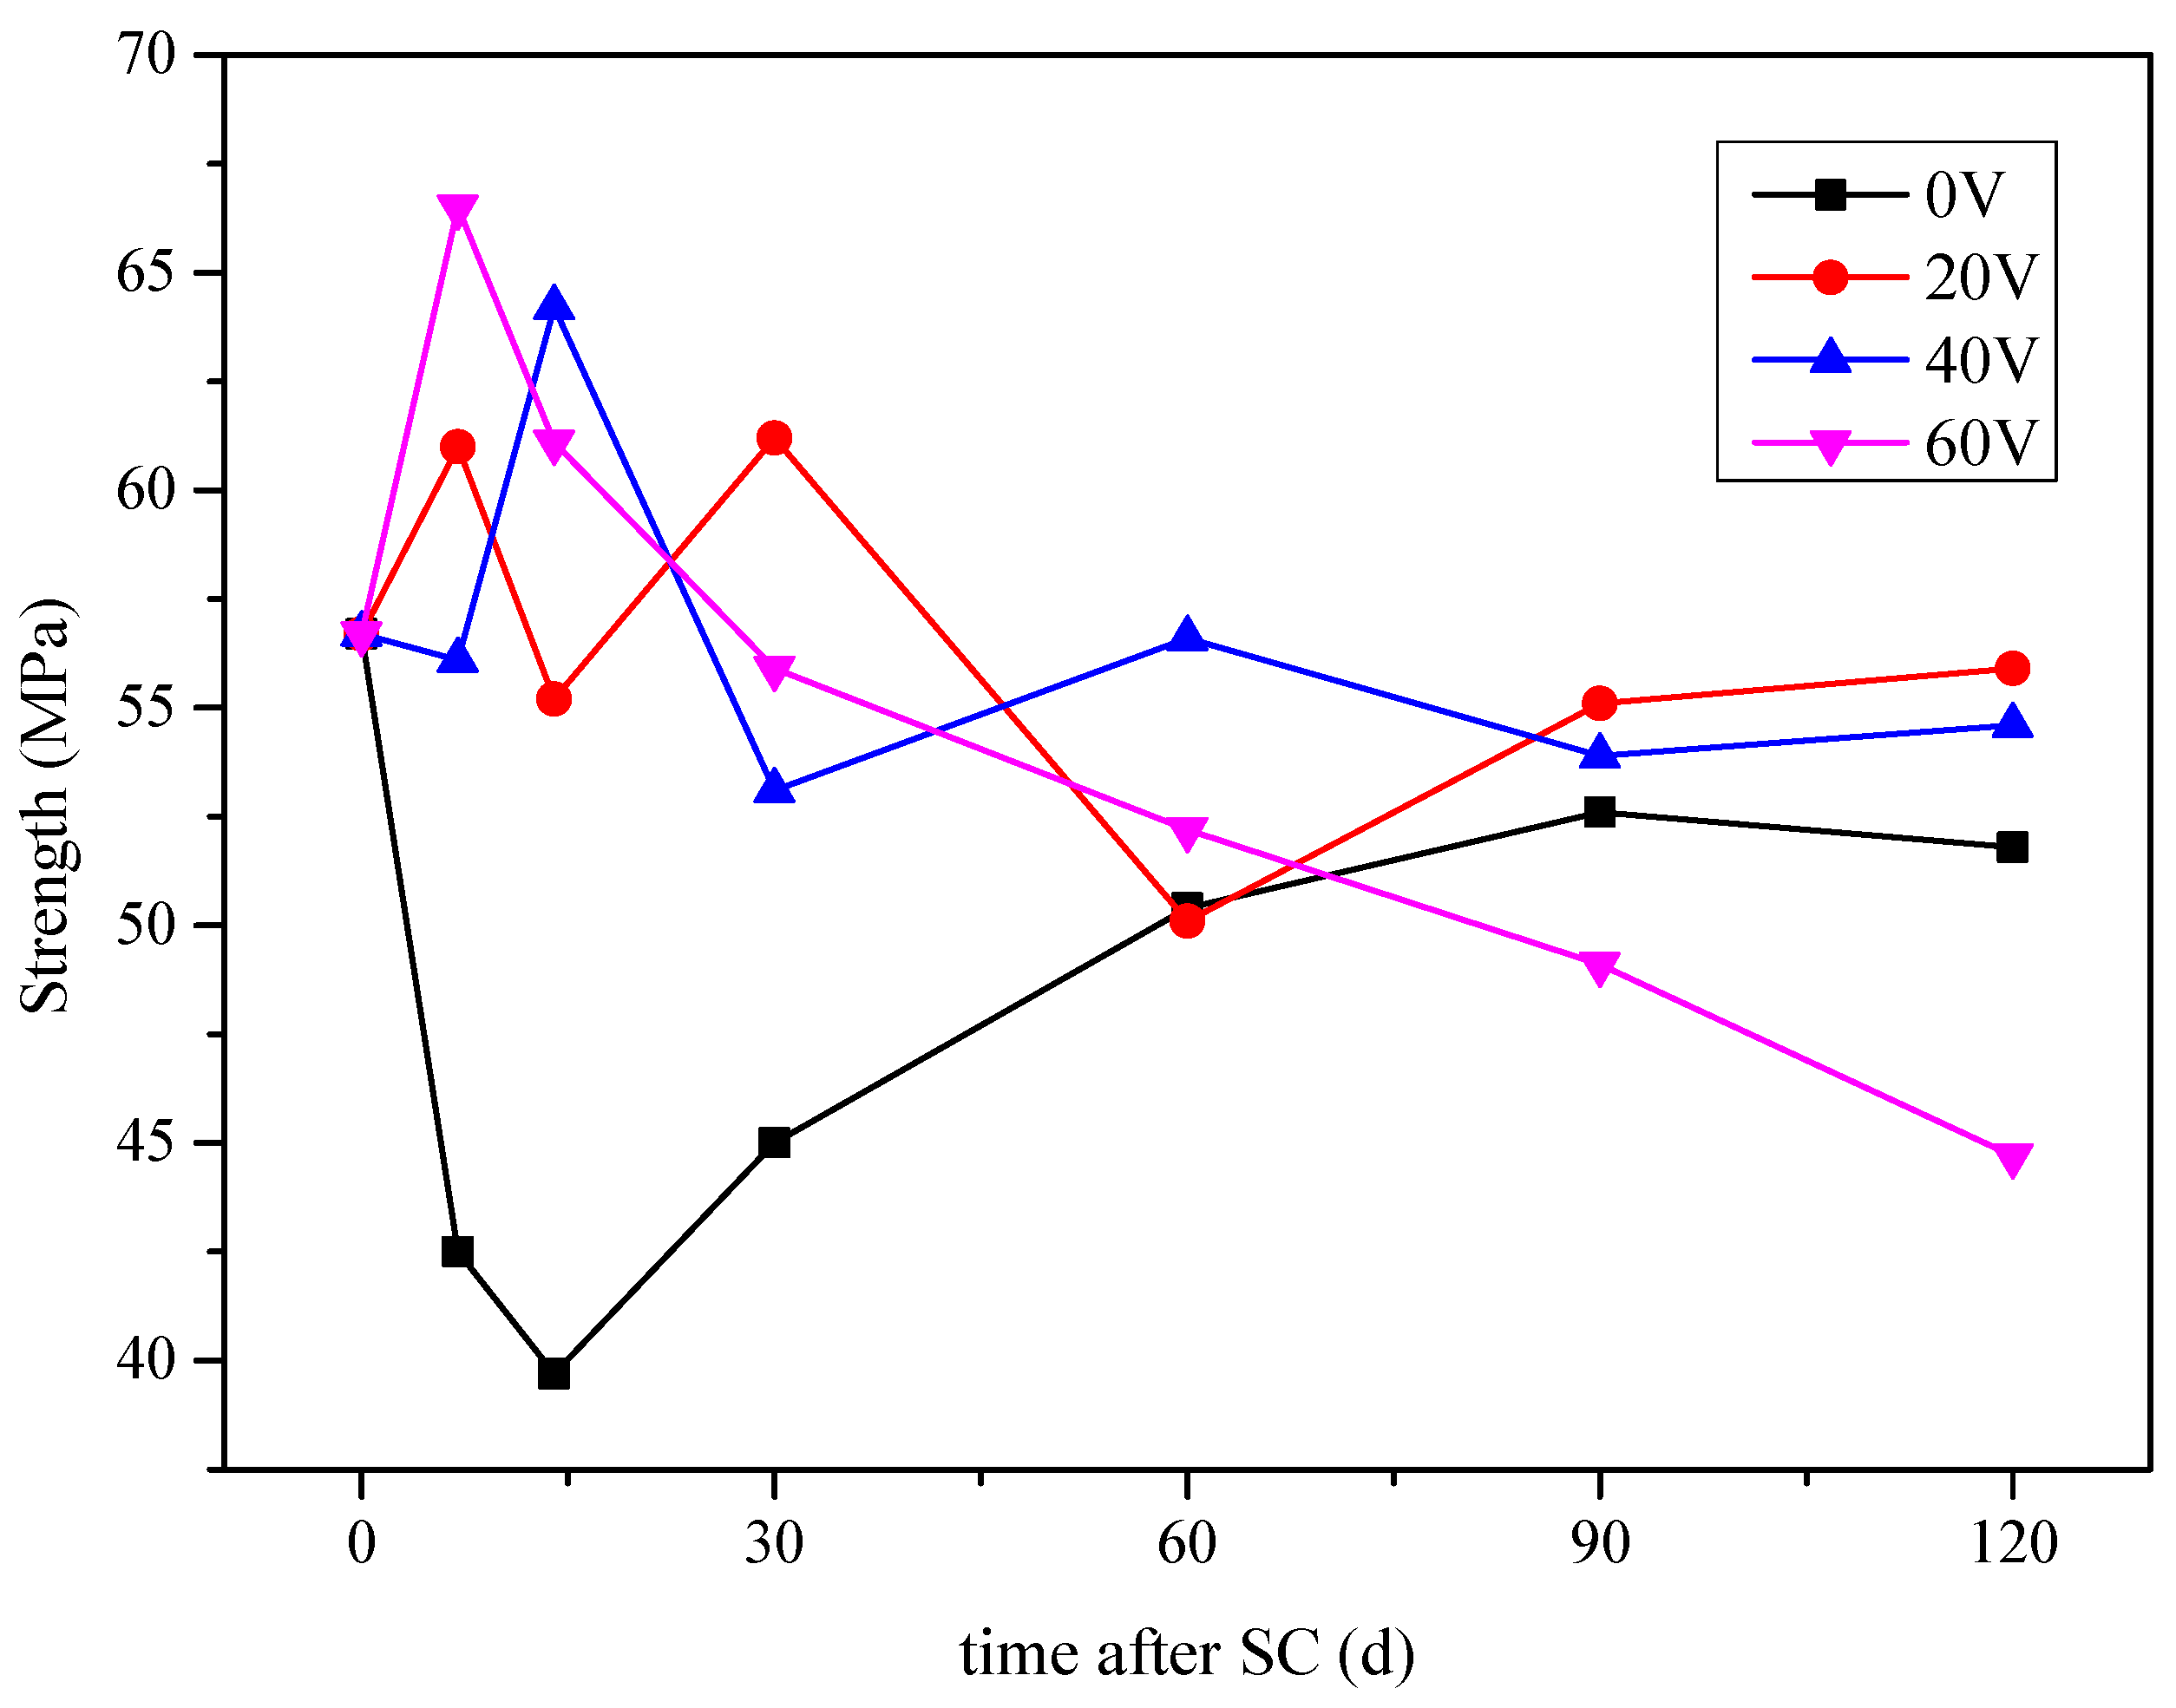
- As the stray current energisation duration increases, the mass of cathode side leachables increase and compressive strength of cement-based materials decreases overall. The mass of cathode side leachables varies with voltage as 20 < 60 < 40 V. When the voltage is 60 V, the compressive strength of cement-based materials decreases the most, which is 13.7% lower than that of specimens corroded under 0 V.
- (2)
- At 120 d of stray current, the strength of the specimen with a water-binder ratio of 0.50 decreases the least, by only 3.7%; the mass of cathode side leachables (CaCO3) of the specimen with a water-binder ratio of 0.40 is the highest, and that with a water-binder ratio of 0.60 is the lowest, which is 34.52% lower than that of 0.40. Additionally, the Ca2+ concentration in the cathodic side solution of the cement-based materials with a water-binder ratio of 0.60 is generally the lowest, in comparison.
- (3)
- The mass of cathode side leachables decrease significantly with the increase in fly ash content. When the content of fly ash is 15%, the mass is the lowest. In stray current environments, the compressive strength of the fly ash-doped, cement-based materials decreases more than that of the un-doped materials. At 120 d of stray current, the cement-base materials with 15% fly ash content show the smallest reduction in strength. At 28 d of stray current, the Ca2+ concentrations of the fly ash-doped, cement-based materials are all lower than that of the un-doped materials, and the lowest concentration is found at 10% fly ash content.
- (4)
- When the content of silica fume is 10%, the mass of cathode side leachables of the cement-based materials is the least. At 120 d of stray current, the compressive strength of the cement-based materials with 10% silica fume content shows the least decrease, 24.9%, compared with the initial strength before the test. Therefore, in terms of the cathode side leachables and compressive strength, the specimen with 10% silica fume content possesses the best anti-corrosion effect under stray current. At 28 d of stray current, the Ca2+ concentration in the cathode side solution of cement-based materials with 20% silica fume content is the lowest.
Author Contributions
Funding
Institutional Review Board Statement
Informed Consent Statement
Data Availability Statement
Conflicts of Interest
References
- Zhan, P. Research of the Influence of Metro Stray Current Corrosion on Reinforced Concrete Structures and Protection. Master’s Thesis, Beijing Jiaotong University, Beijing China, 2009. [Google Scholar]
- Lin, J.; Tang, H.; Yu, H.X. Protection of Stray Current Corrosion in Metro. J. Build. Mater. 2002, 5, 72–76. [Google Scholar]
- Deng, Z.Z.; Yang, H.Q.; Li, X.; Zhang, J.F. Research progress and review on corrosion and degradation of cement—Based materials. Yangtze River 2016, 47, 101–105. [Google Scholar]
- Zhang, M.; Yu, J.F.; Zhang, Y.; Zhan, Y.Z.; Tang, C.M. Influence of Low Intensity DC Stray Current on Corrosion Behavior of Q235 Steel in Atmosphere Containing SO2. Mater. Prot. 2015, 48, 18–21. [Google Scholar]
- Zhou, J.H.; Zhan, W.; Li, L.; Xu, Q.; Yu, Y.M. Experimental study on the effect of stray currents on the mechanical properties of concrete with different cementitious systems and rebar corrosion. IOP Conf. Ser. Earth Environ. Sci. 2019, 304, 052080. [Google Scholar] [CrossRef]
- Tang, K.; Wilkinson, S. Corrosion resistance of electrified railway tunnels made of steel fibre reinforced concrete. Constr. Build. Mater. 2020, 230, 11706. [Google Scholar] [CrossRef]
- Bertolini, L.; Carsana, M.; Pedeferri, P. Corrosion behaviour of steel in concrete in the presence of stray current. Corros. Sci. 2007, 49, 1056–1068. [Google Scholar] [CrossRef]
- Bartoloperez, P.; Peña, J.L.; Salas, F.H.; Wheat, H.G.; Hernández-Duque, G. Corrosion of Reinforced Steel Bars Embedded in Concrete: A Study of Electrochemical and Surface Analysis. Corros. Rev. 2020, 18, 255–266. [Google Scholar] [CrossRef]
- Kangkang, T. Stray current induced corrosion of steel fibre reinforced concrete. Cem. Concr. Res. 2017, 100, 445–456. [Google Scholar]
- Tang, Y. Reducing the risk of reinforcement corrosion in concrete structures and stray current prevention in metro line. In Proceedings of the 2nd International Conference on Risk Analysis and Crisis Response, Beijing, China, 19–21 October 2009; The Department of Geotechnical Engineering of Tongji University Key Laboratory of Geotechnical and Underground Engineering of Ministry of Education, Tongji University: Beijing, China, 2009. [Google Scholar]
- Hong, N.F. The destructive effect of DC stray current on reinforced concrete. Corros. Prot. 1983, 5, 25–29. [Google Scholar]
- Zhou, X.J.; Gao, B.; Guo, J.G. Study on mechanism of concrete failure induced by steel corrosion under externally applied direct current. J. SouthWest Jiaotong Univ. 2001, 9, 25–34. [Google Scholar]
- Rao, B.N.; Muthulingam, S. Non-uniform corrosion states of rebar in concrete under chloride environment. Corros. Sci. J. Environ. Degrad. Mater. Its Control 2015, 93, 267–282. [Google Scholar]
- Chen, M.; Wang, K.; Wu, Q.S.; Qin, Z. An Experimental Corrosion Investigation of Coupling Chloride Ions with Stray Current for Reinforced Concrete. Appl. Mech. Mater. 2012, 166–169, 1987–1993. [Google Scholar] [CrossRef]
- Chen, M.C.; Wang, K.; Wu, Q.S.; Qin, Z. Experimental Investigation on Corrosion of Reinforced Concrete due to Coupled Stray Currents and Chloride Ions. J. China Railw. Soc. 2013, 35, 112–117. [Google Scholar]
- Xu, G.; Fei, H.F.; Wang, Y.M.; Wang, Q. Research on corrosion characteristics of stainless steel bar in stray current and chloride ion coexisted environment. Adv. Mater. Res. 2011, 261–263, 56–60. [Google Scholar] [CrossRef]
- Ding, Q.; Geng, J.; Hu, S. The effect of stray current on the process and threshold concentration of chloride ion causing steel bar corrosion. In Proceedings of the 1st International Conference on Microstructure Related Durability of Cementitious Composites, Nanjing, China, 13–15 October 2008. [Google Scholar]


| SiO2 | Al2O3 | Fe2O3 | CaO | MgO | SO3 | Na2Oeq | f-CaO | C3S | C3S | C3A | C4AF |
|---|---|---|---|---|---|---|---|---|---|---|---|
| 22.35 | 4.61 | 3.62 | 65.74 | 2.08 | 0.32 | 0.512 | 0.94 | 56.93 | 21.15 | 6.10 | 11.00 |
| SiO2 | Al2O3 | Fe2O3 | CaO | MgO | SO3 | Na2Oeq | f-CaO | Loss | Cl |
|---|---|---|---|---|---|---|---|---|---|
| 22.89 | 4.51 | 3.51 | 62.85 | 2.18 | 2.42 | 0.55 | 0.86 | 0.98 | 0.014 |
| Finesse | Density | Specific Surface Area | Standard Consistency | Stability | Setting Time (min) | |
|---|---|---|---|---|---|---|
| 0.08/% | (g/cm3) | m2/kg | % | /mm | Initial setting | Final setting |
| 0.9 | 3.15 | 340 | 25.4 | 0.1 | 193 | 249 |
| SiO2 | Al2O3 | Fe2O3 | CaO | K2O | TiO2 | MgO | SO3 | Na2O |
|---|---|---|---|---|---|---|---|---|
| 55.2252 | 22.3812 | 9.1400 | 4.9349 | 3.0482 | 1.5964 | 1.2314 | 0.9995 | 0.4260 |
| MgO | SiO2 | CaO | Fe2O3 | Na2O | K2O | Al2O3 |
|---|---|---|---|---|---|---|
| 0.8 | 96.3 | 0.7 | 0.1 | 0.1 | 1.2 | 0.2 |
| No. | W/B | Water/g | Cement/g | Sand/g | Fly Ash | Silica Fume | ||
|---|---|---|---|---|---|---|---|---|
| Mass/g | Content | Mass/g | Content | |||||
| 1 | 0.40 | 180 | 450 | 1350 | 0 | 0% | 0 | 0% |
| 2 | 0.50 | 225 | 450 | 1350 | 0 | 0 | ||
| 3 | 0.60 | 270 | 450 | 1350 | 0 | 0 | ||
| 4 | 0.50 | 225 | 427.5 | 1350 | 22.5 | 5% | 0 | 0% |
| 5 | 0.50 | 225 | 405 | 1350 | 45 | 10% | 0 | |
| 6 | 0.50 | 225 | 382.5 | 1350 | 67.5 | 15% | 0 | |
| 7 | 0.50 | 225 | 427.5 | 1350 | 0 | 0% | 22.5 | 5% |
| 8 | 0.50 | 225 | 405 | 1350 | 0 | 45 | 10% | |
| 9 | 0.50 | 225 | 382.5 | 1350 | 0 | 67.5 | 15% | |
Publisher’s Note: MDPI stays neutral with regard to jurisdictional claims in published maps and institutional affiliations. |
© 2022 by the authors. Licensee MDPI, Basel, Switzerland. This article is an open access article distributed under the terms and conditions of the Creative Commons Attribution (CC BY) license (https://creativecommons.org/licenses/by/4.0/).
Share and Cite
Liu, F.; Zou, Y.; Wang, B.; Yuan, X. The Effect of Stray Current on Calcium Leaching of Cement-Based Materials. Materials 2022, 15, 2279. https://doi.org/10.3390/ma15062279
Liu F, Zou Y, Wang B, Yuan X. The Effect of Stray Current on Calcium Leaching of Cement-Based Materials. Materials. 2022; 15(6):2279. https://doi.org/10.3390/ma15062279
Chicago/Turabian StyleLiu, Fang, Yuanrui Zou, Baomin Wang, and Xiaosa Yuan. 2022. "The Effect of Stray Current on Calcium Leaching of Cement-Based Materials" Materials 15, no. 6: 2279. https://doi.org/10.3390/ma15062279
APA StyleLiu, F., Zou, Y., Wang, B., & Yuan, X. (2022). The Effect of Stray Current on Calcium Leaching of Cement-Based Materials. Materials, 15(6), 2279. https://doi.org/10.3390/ma15062279