
Preparation and Strength Formation Mechanism of Calcined Oyster Shell, Red Mud, Slag, and Iron Tailing Composite Cemented Paste Backfill

Abstract
:1. Introduction
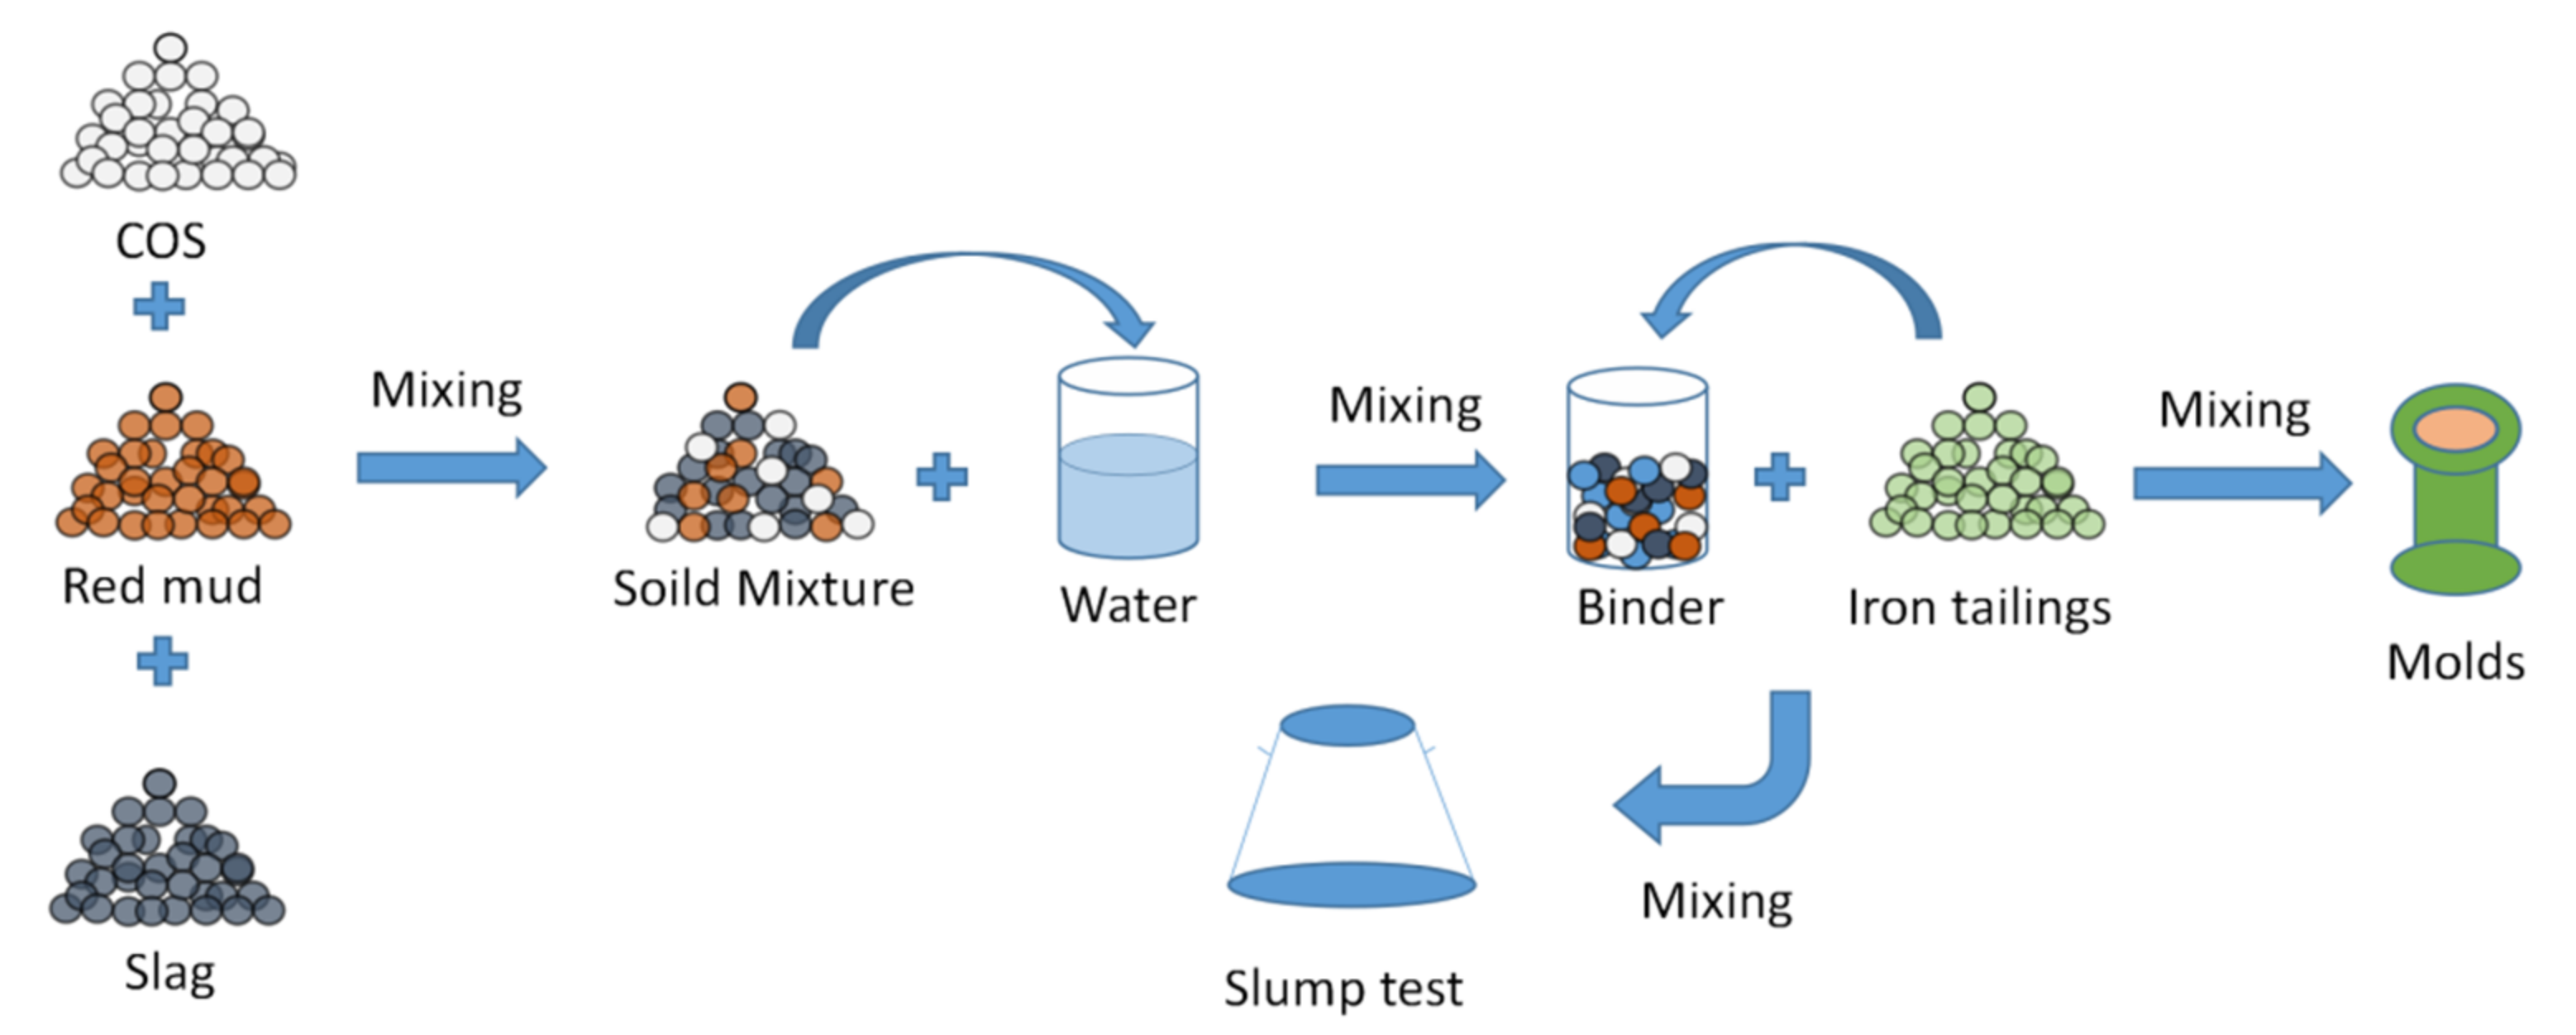
2. Materials and methods
2.1. Materials
- (1)
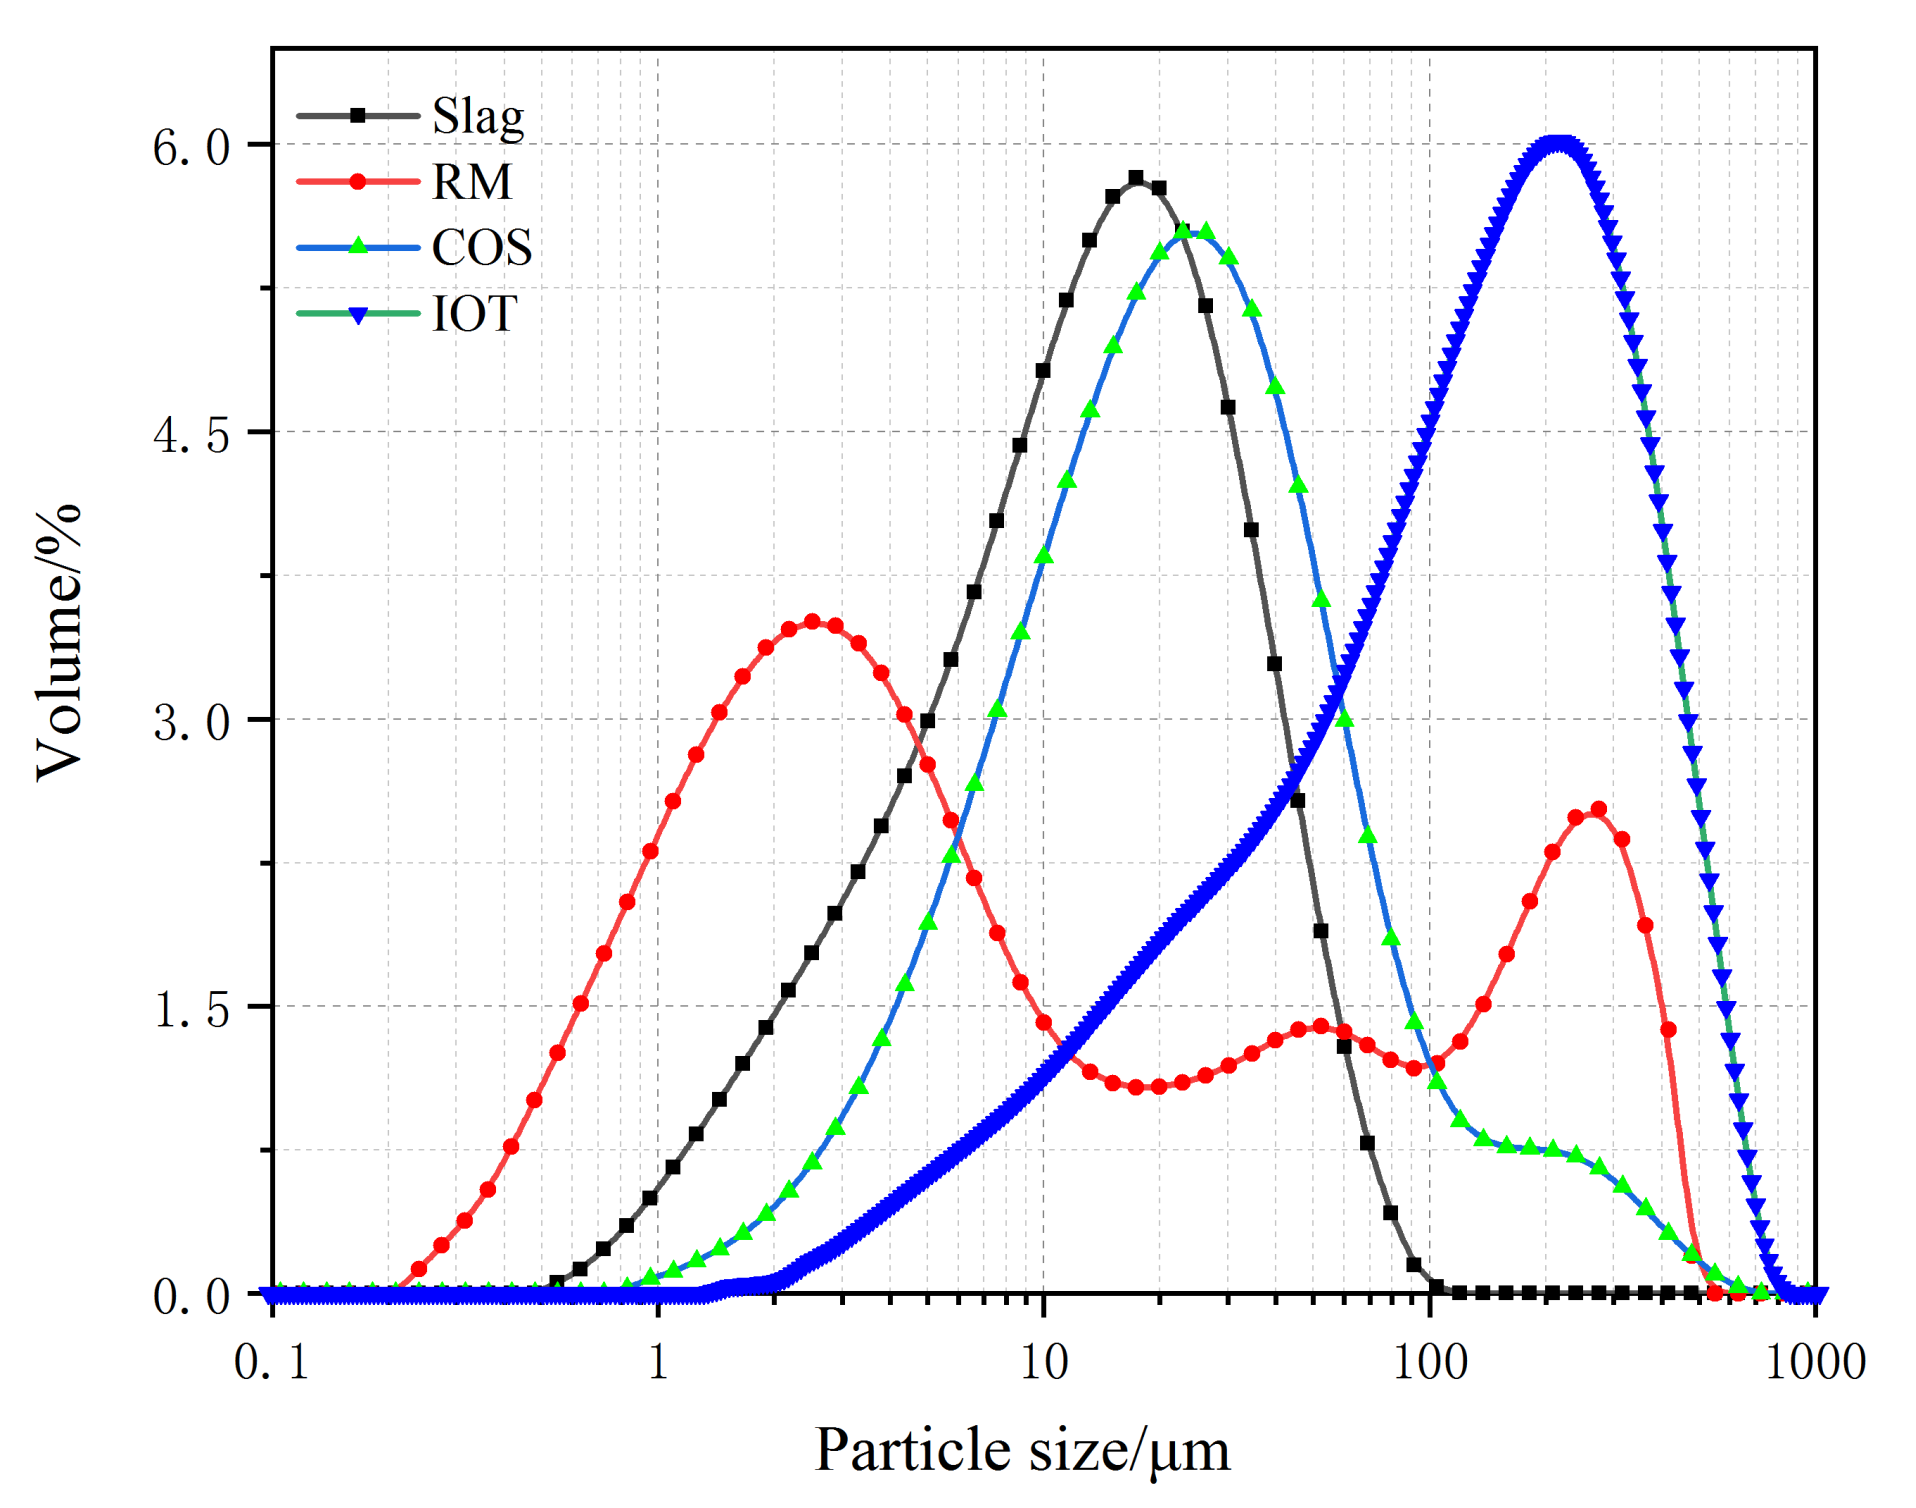
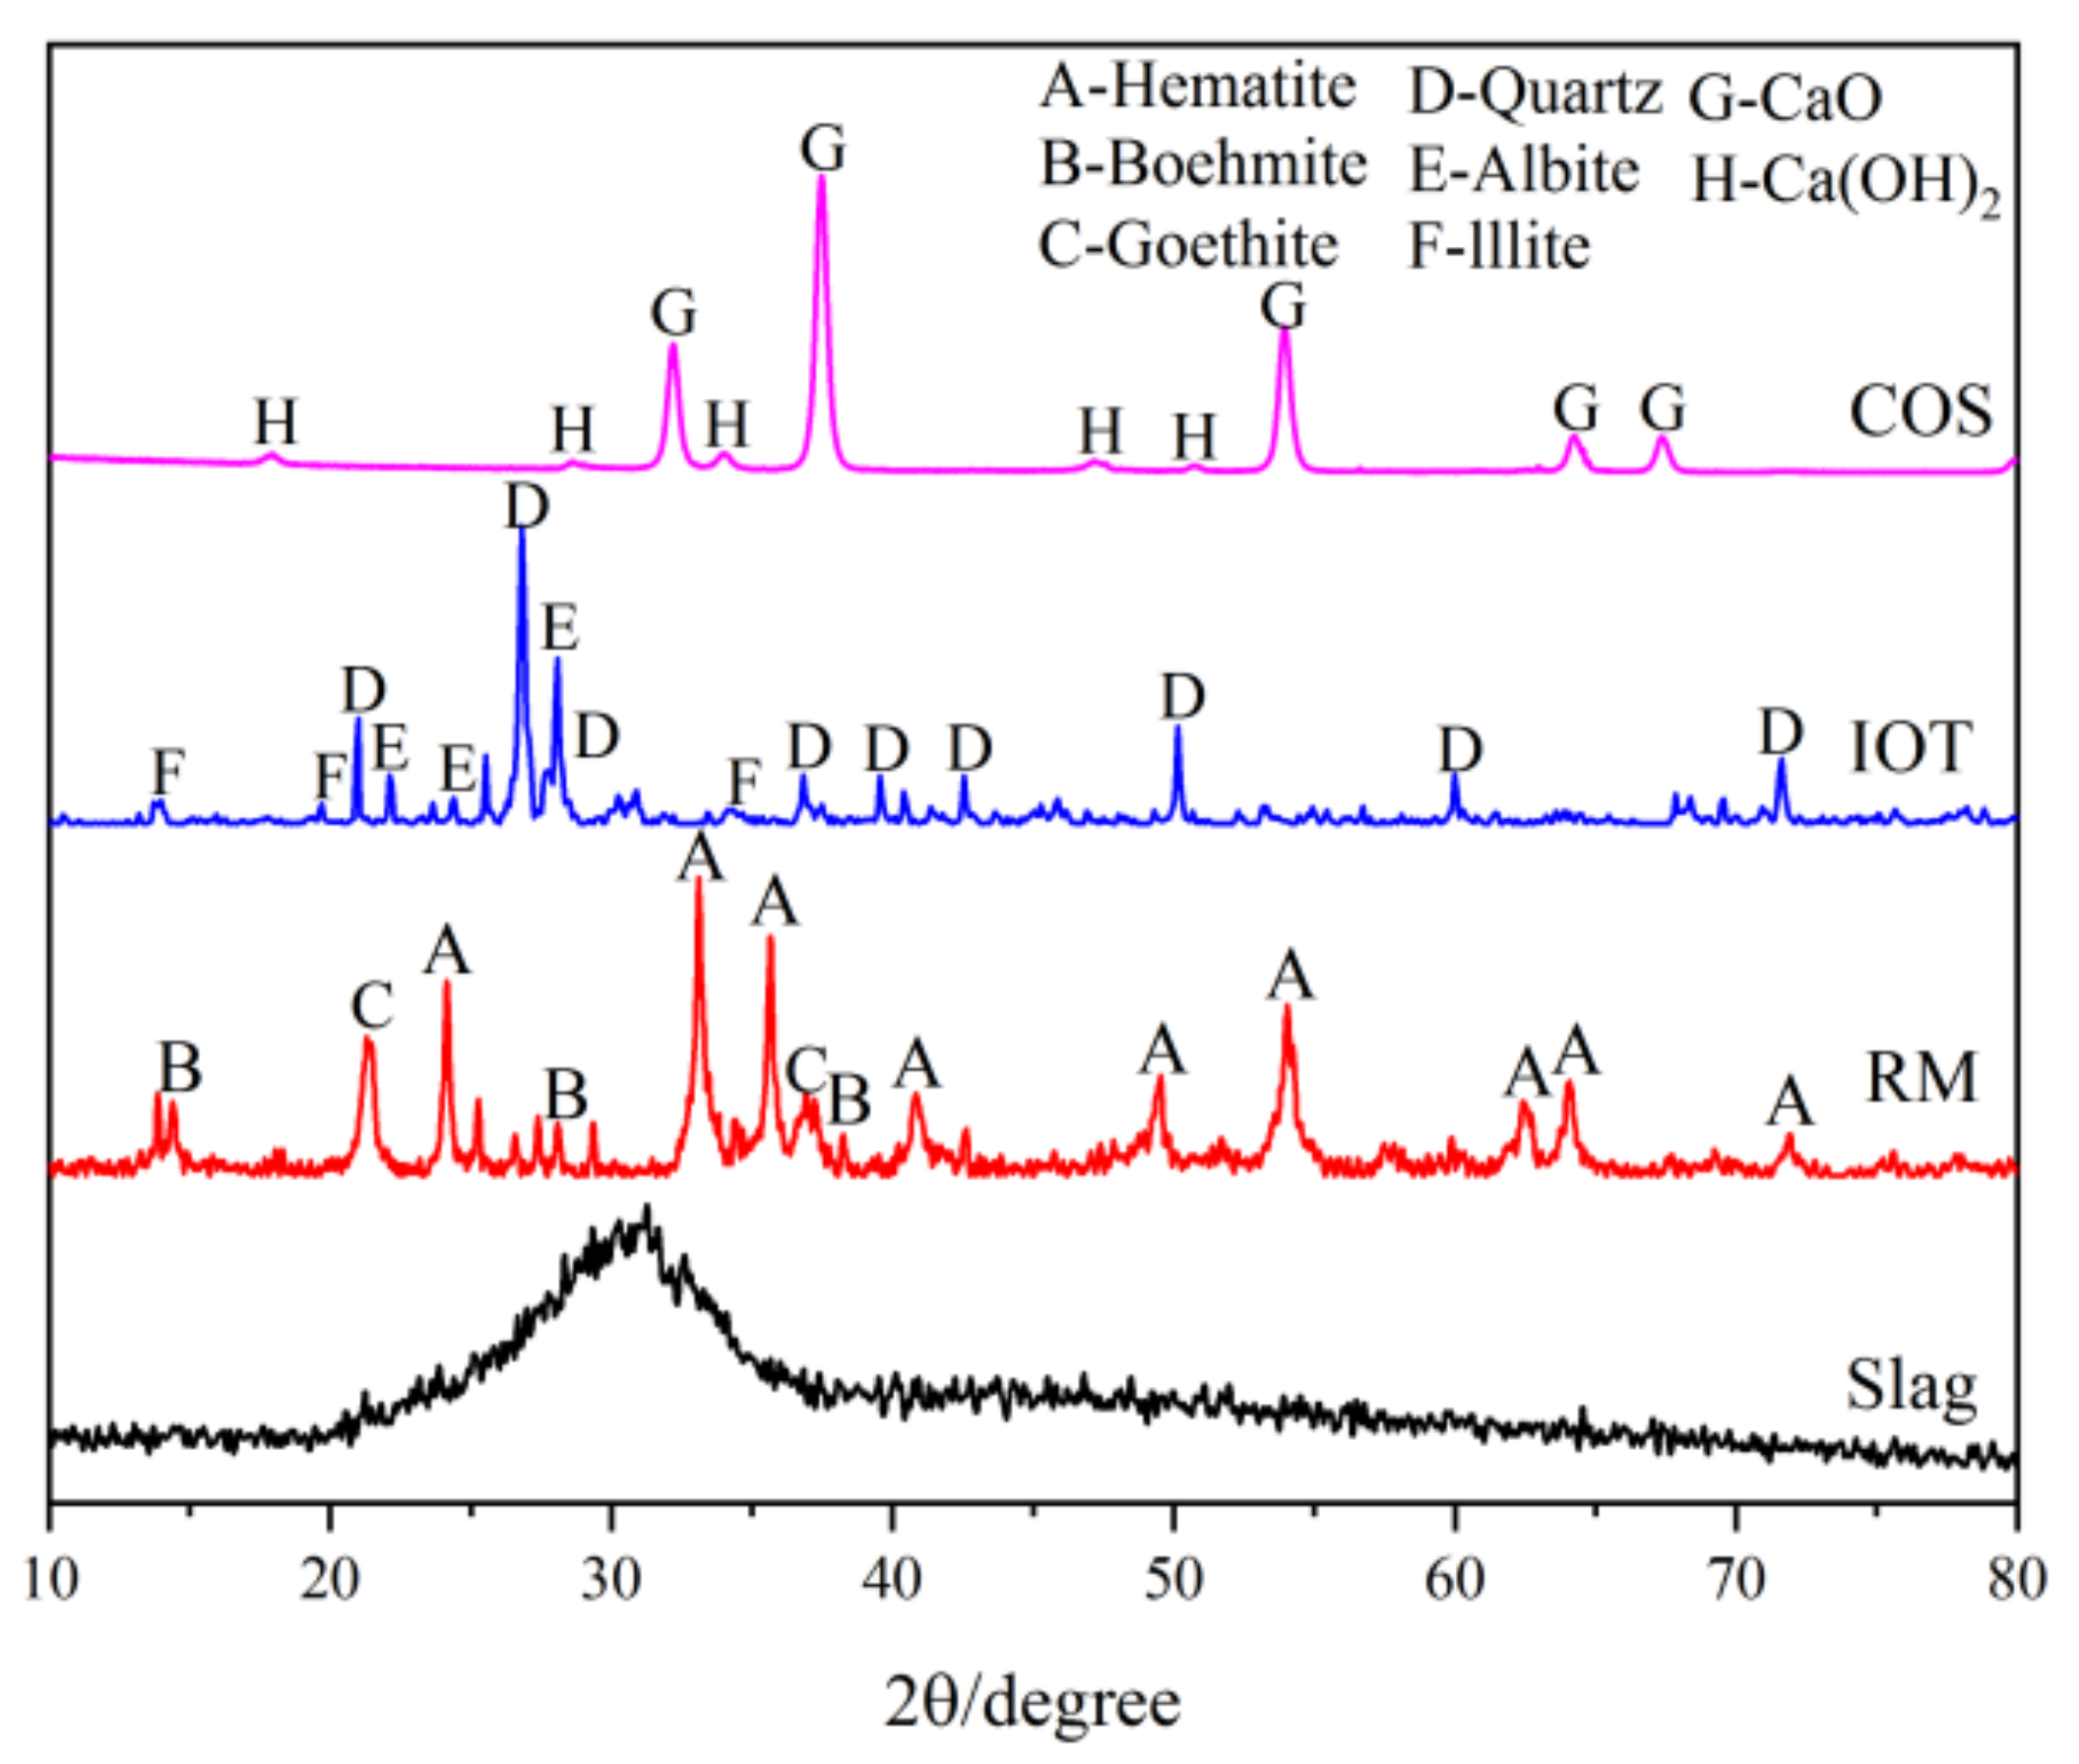
- IOT: The IOT were obtained from the Baoshan Iron Mine Concentrator (Anshan, China), and dried at 100 °C for 24 h. Table 1 shows the oxide composition analyses (XRF) test results of IOT. Figure 1 shows the particle size curve of IOT. Figure 2 shows the mineral composition of IOT. The specific gravity is 1.79 g/cm3.
- (2)
- COS: The oyster shells were taken from the Bohai Sea, Jinzhou City, Liaoning Province, China. The surface attachments were cleaned with a brush, soaked in clean water for 7 days to remove the surface salt, and calcined at 1000 °C for 3 h [6]. Table 1 shows the XRF test results of COS. Figure 1 shows the particle size curve of COS. Figure 2 shows the mineral composition of COS. The specific gravity is 2.25 g/cm3.
- (3)
- Slag: The slag is S95 slag produced by Kangjing New Material Technology Co., Ltd. (Jinan, China). Table 1 shows the XRF test results of slag. Figure 1 shows the particle size curve of slag. Figure 2 shows the mineral composition of slag. The slag is mainly amorphous, indicating that the slag was highly active during the polymerization reaction [22]. The specific gravity is 2.91 g/cm3.
- (4)
- RM: The RM was taken from the Alumina Factory, Binzhou, China. The RM was dried at 100 °C for 24 h and then mechanically pulverized to ensure uniformity. Table 1 shows the XRF test results of RM. Figure 1 shows the particle size curve of RM. Figure 2 shows the mineral composition of RM. The specific gravity is 2.72 g/cm3.
- (5)
- Mixing water: Tap water.
2.2. Mix Design
2.3. Experimental Methods
3. Results
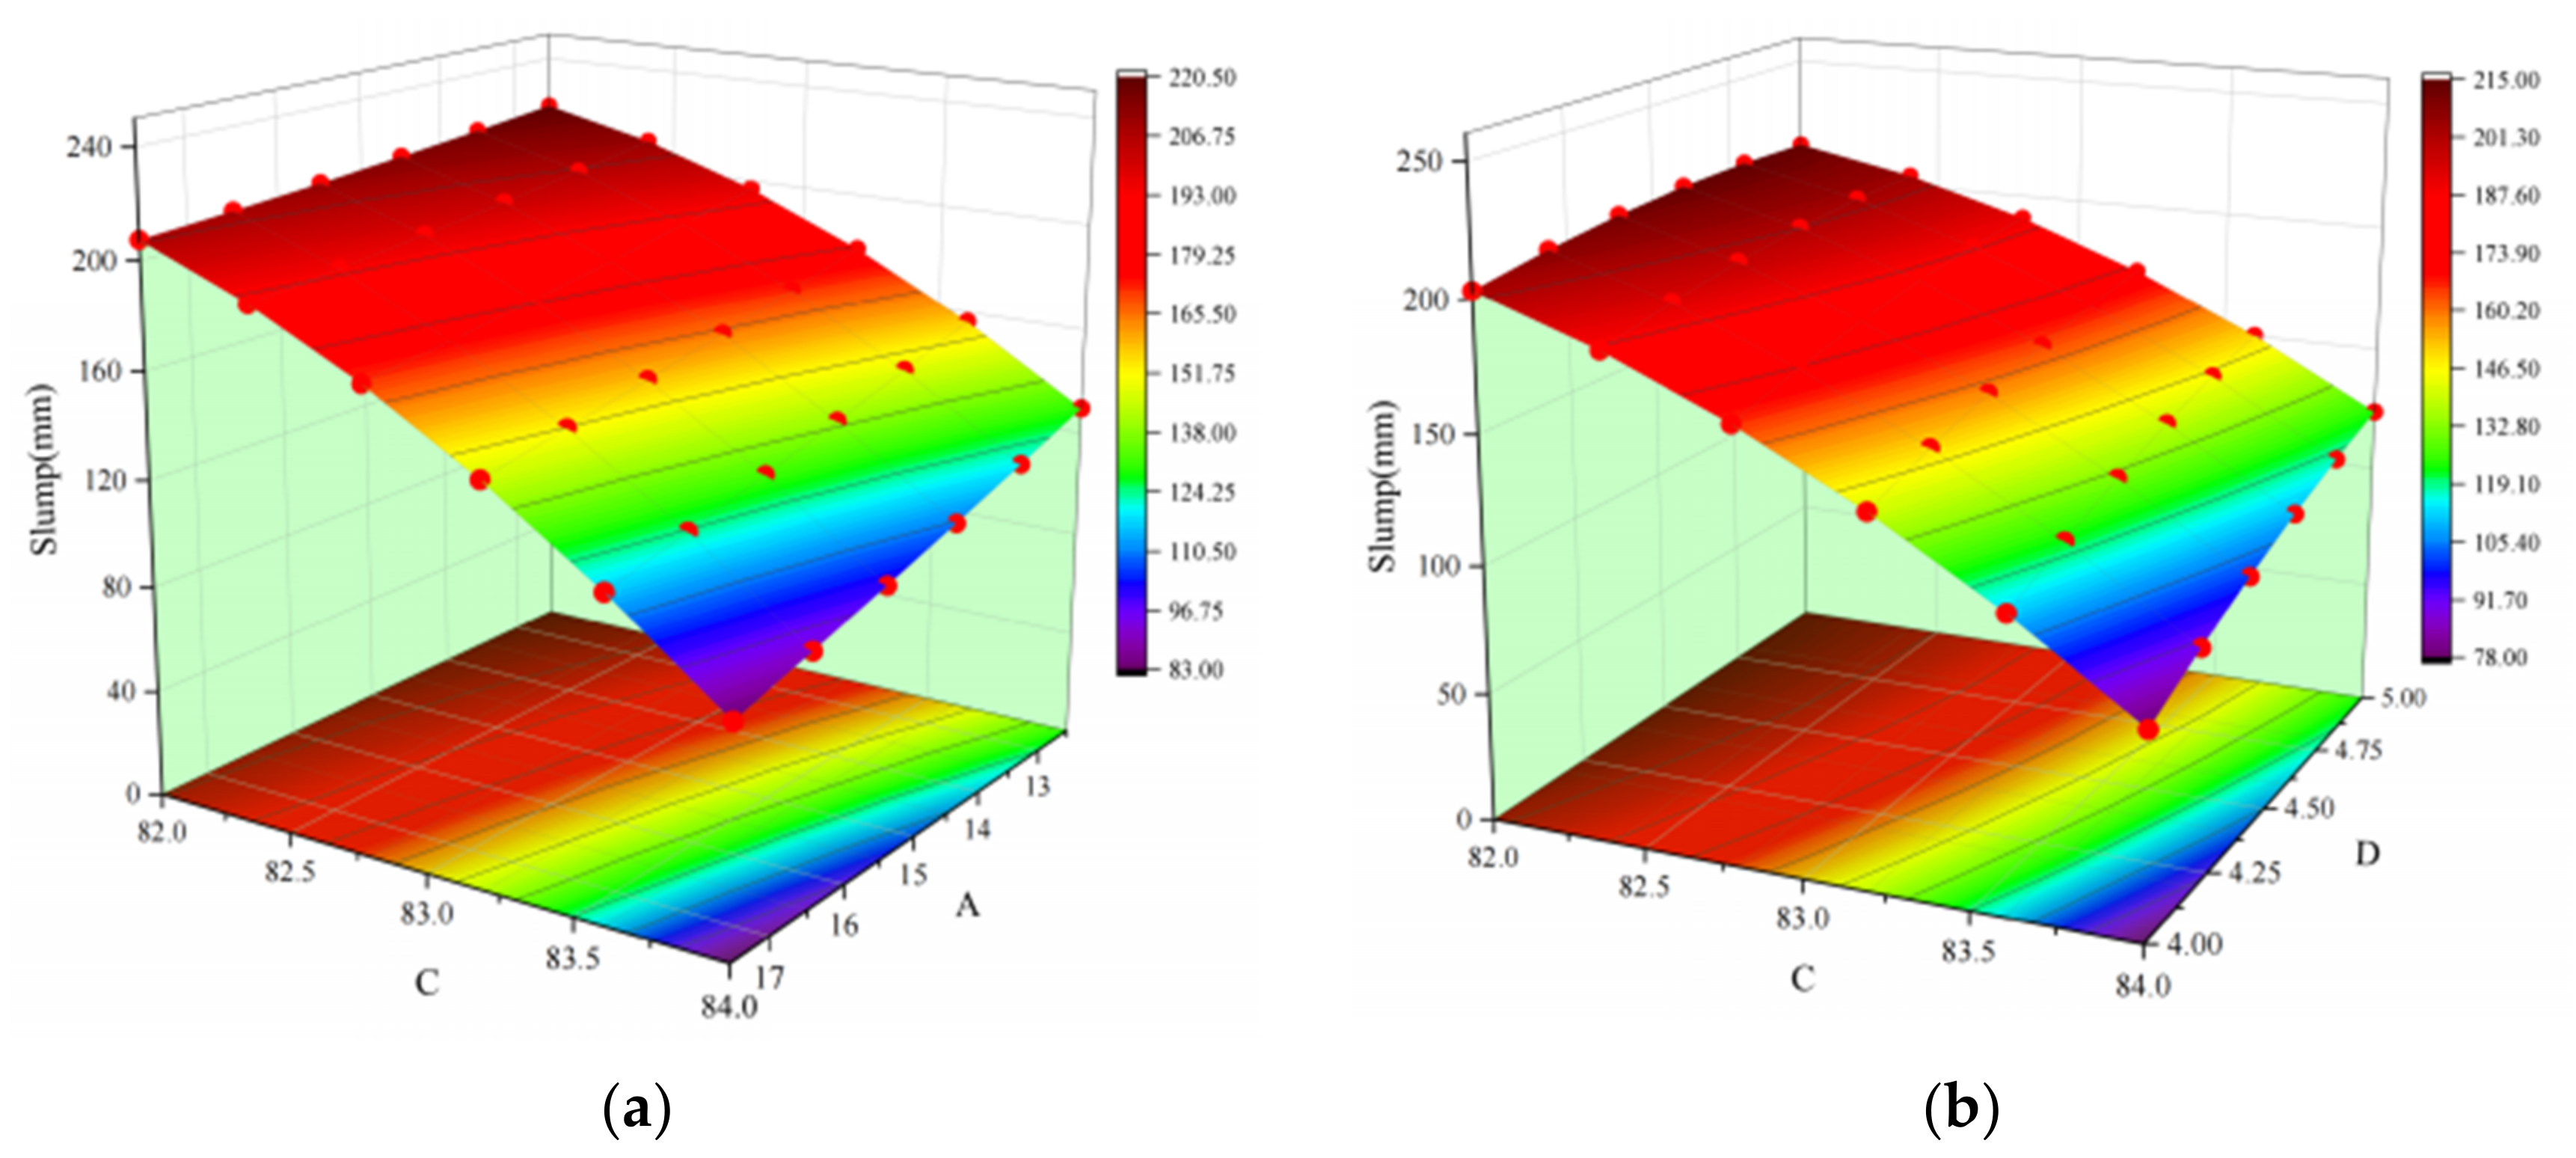
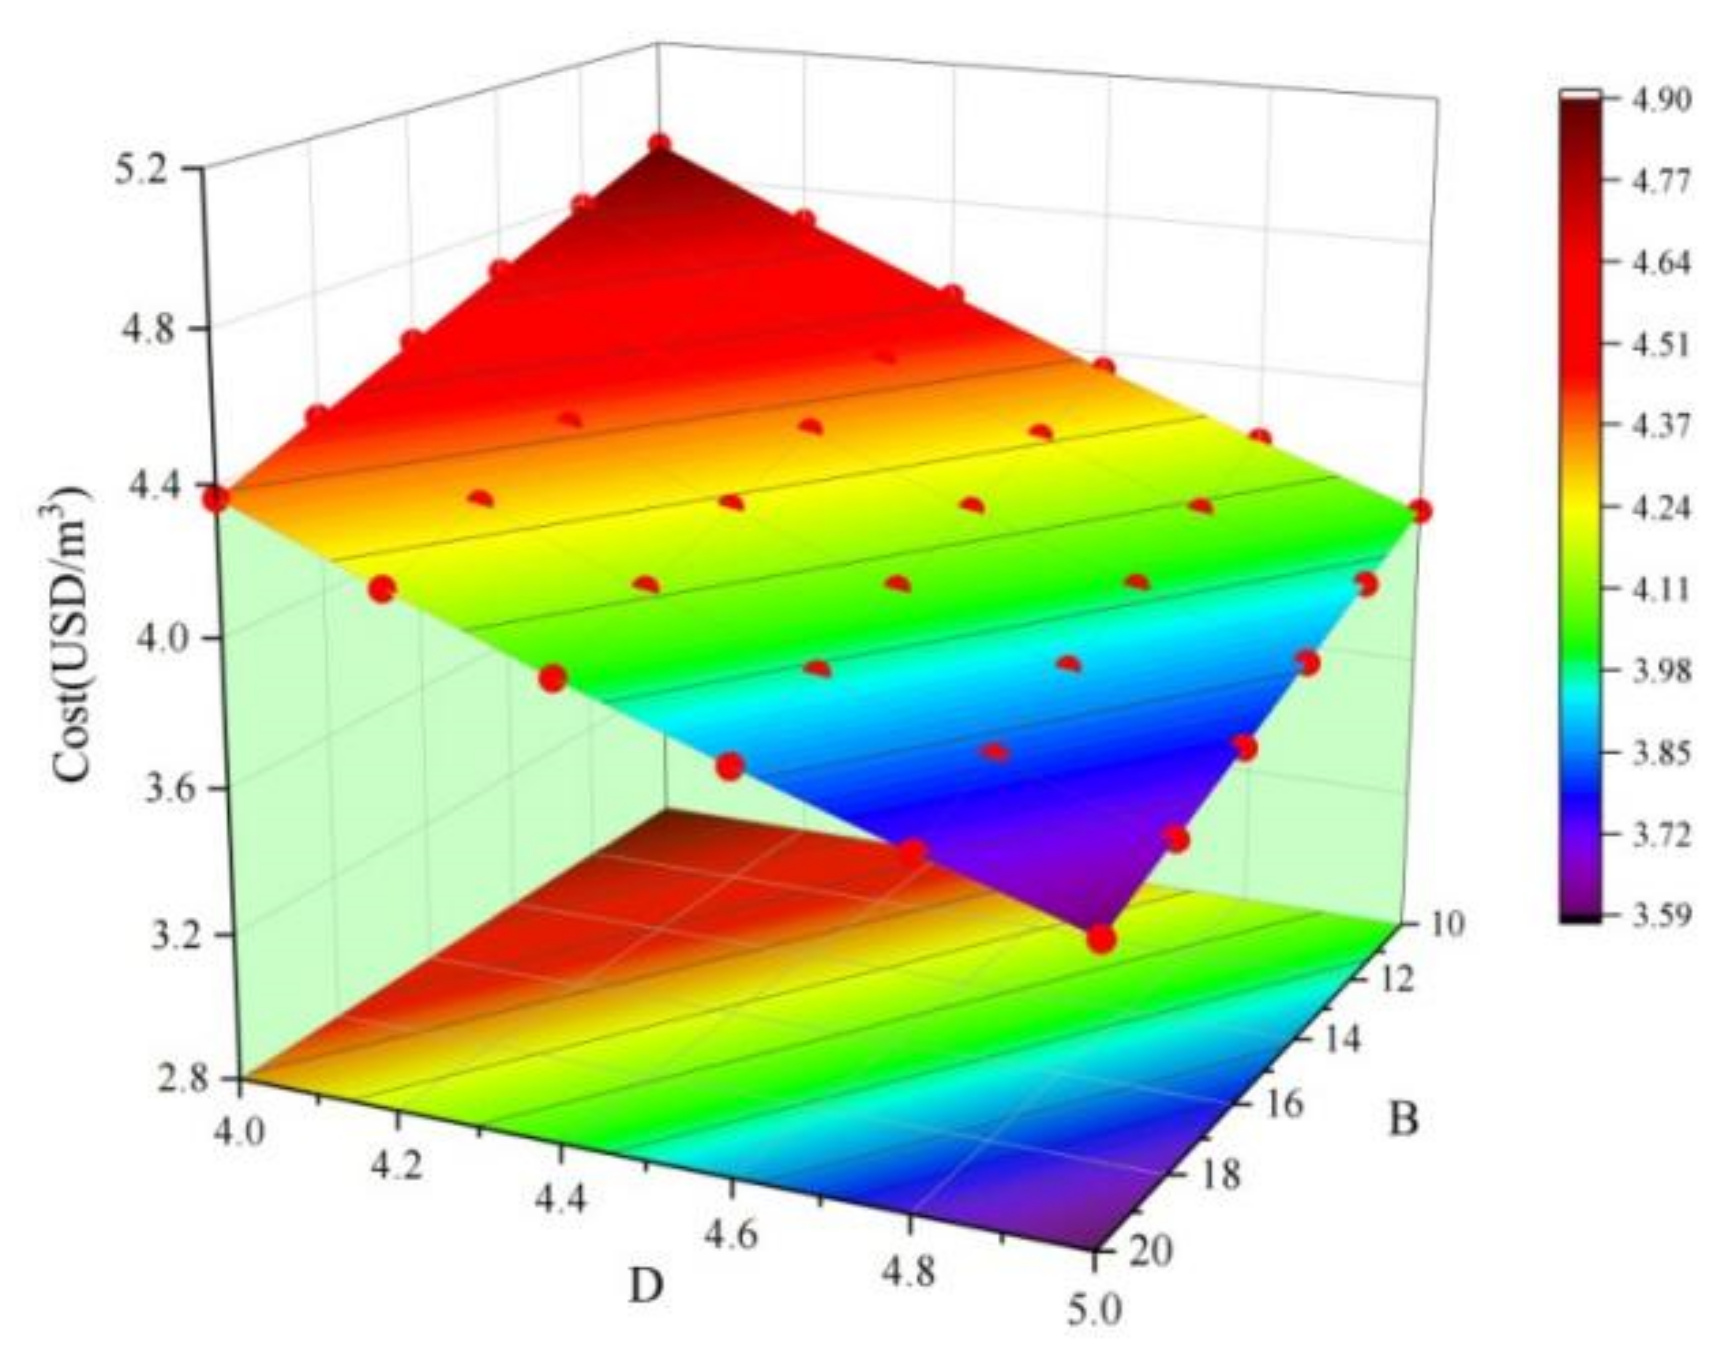
3.1. CCD Method Test Results
+0.09AD + 0.03BC − 0.01BD + 0.43CD − 0.03A2 − 1.79 × 10− 4B2 − 0.94C2 − D2
+1.45AD + 1.11BC + 2.13BD + 17.38CD − 0.24A2 − 0.16B2 − 14.47 C2 − 16.38D2
−6.25 × 10⁻⁴ BC + 8.25 × 10⁻³ BD − 3.75 × 10⁻³ CD − 2.5 × 10⁻⁴ A2 − 6.25 × 10⁻⁵ B2 − 1.56 × 10⁻³ C2 + 0.12D2
3.2. Analysis of Variance
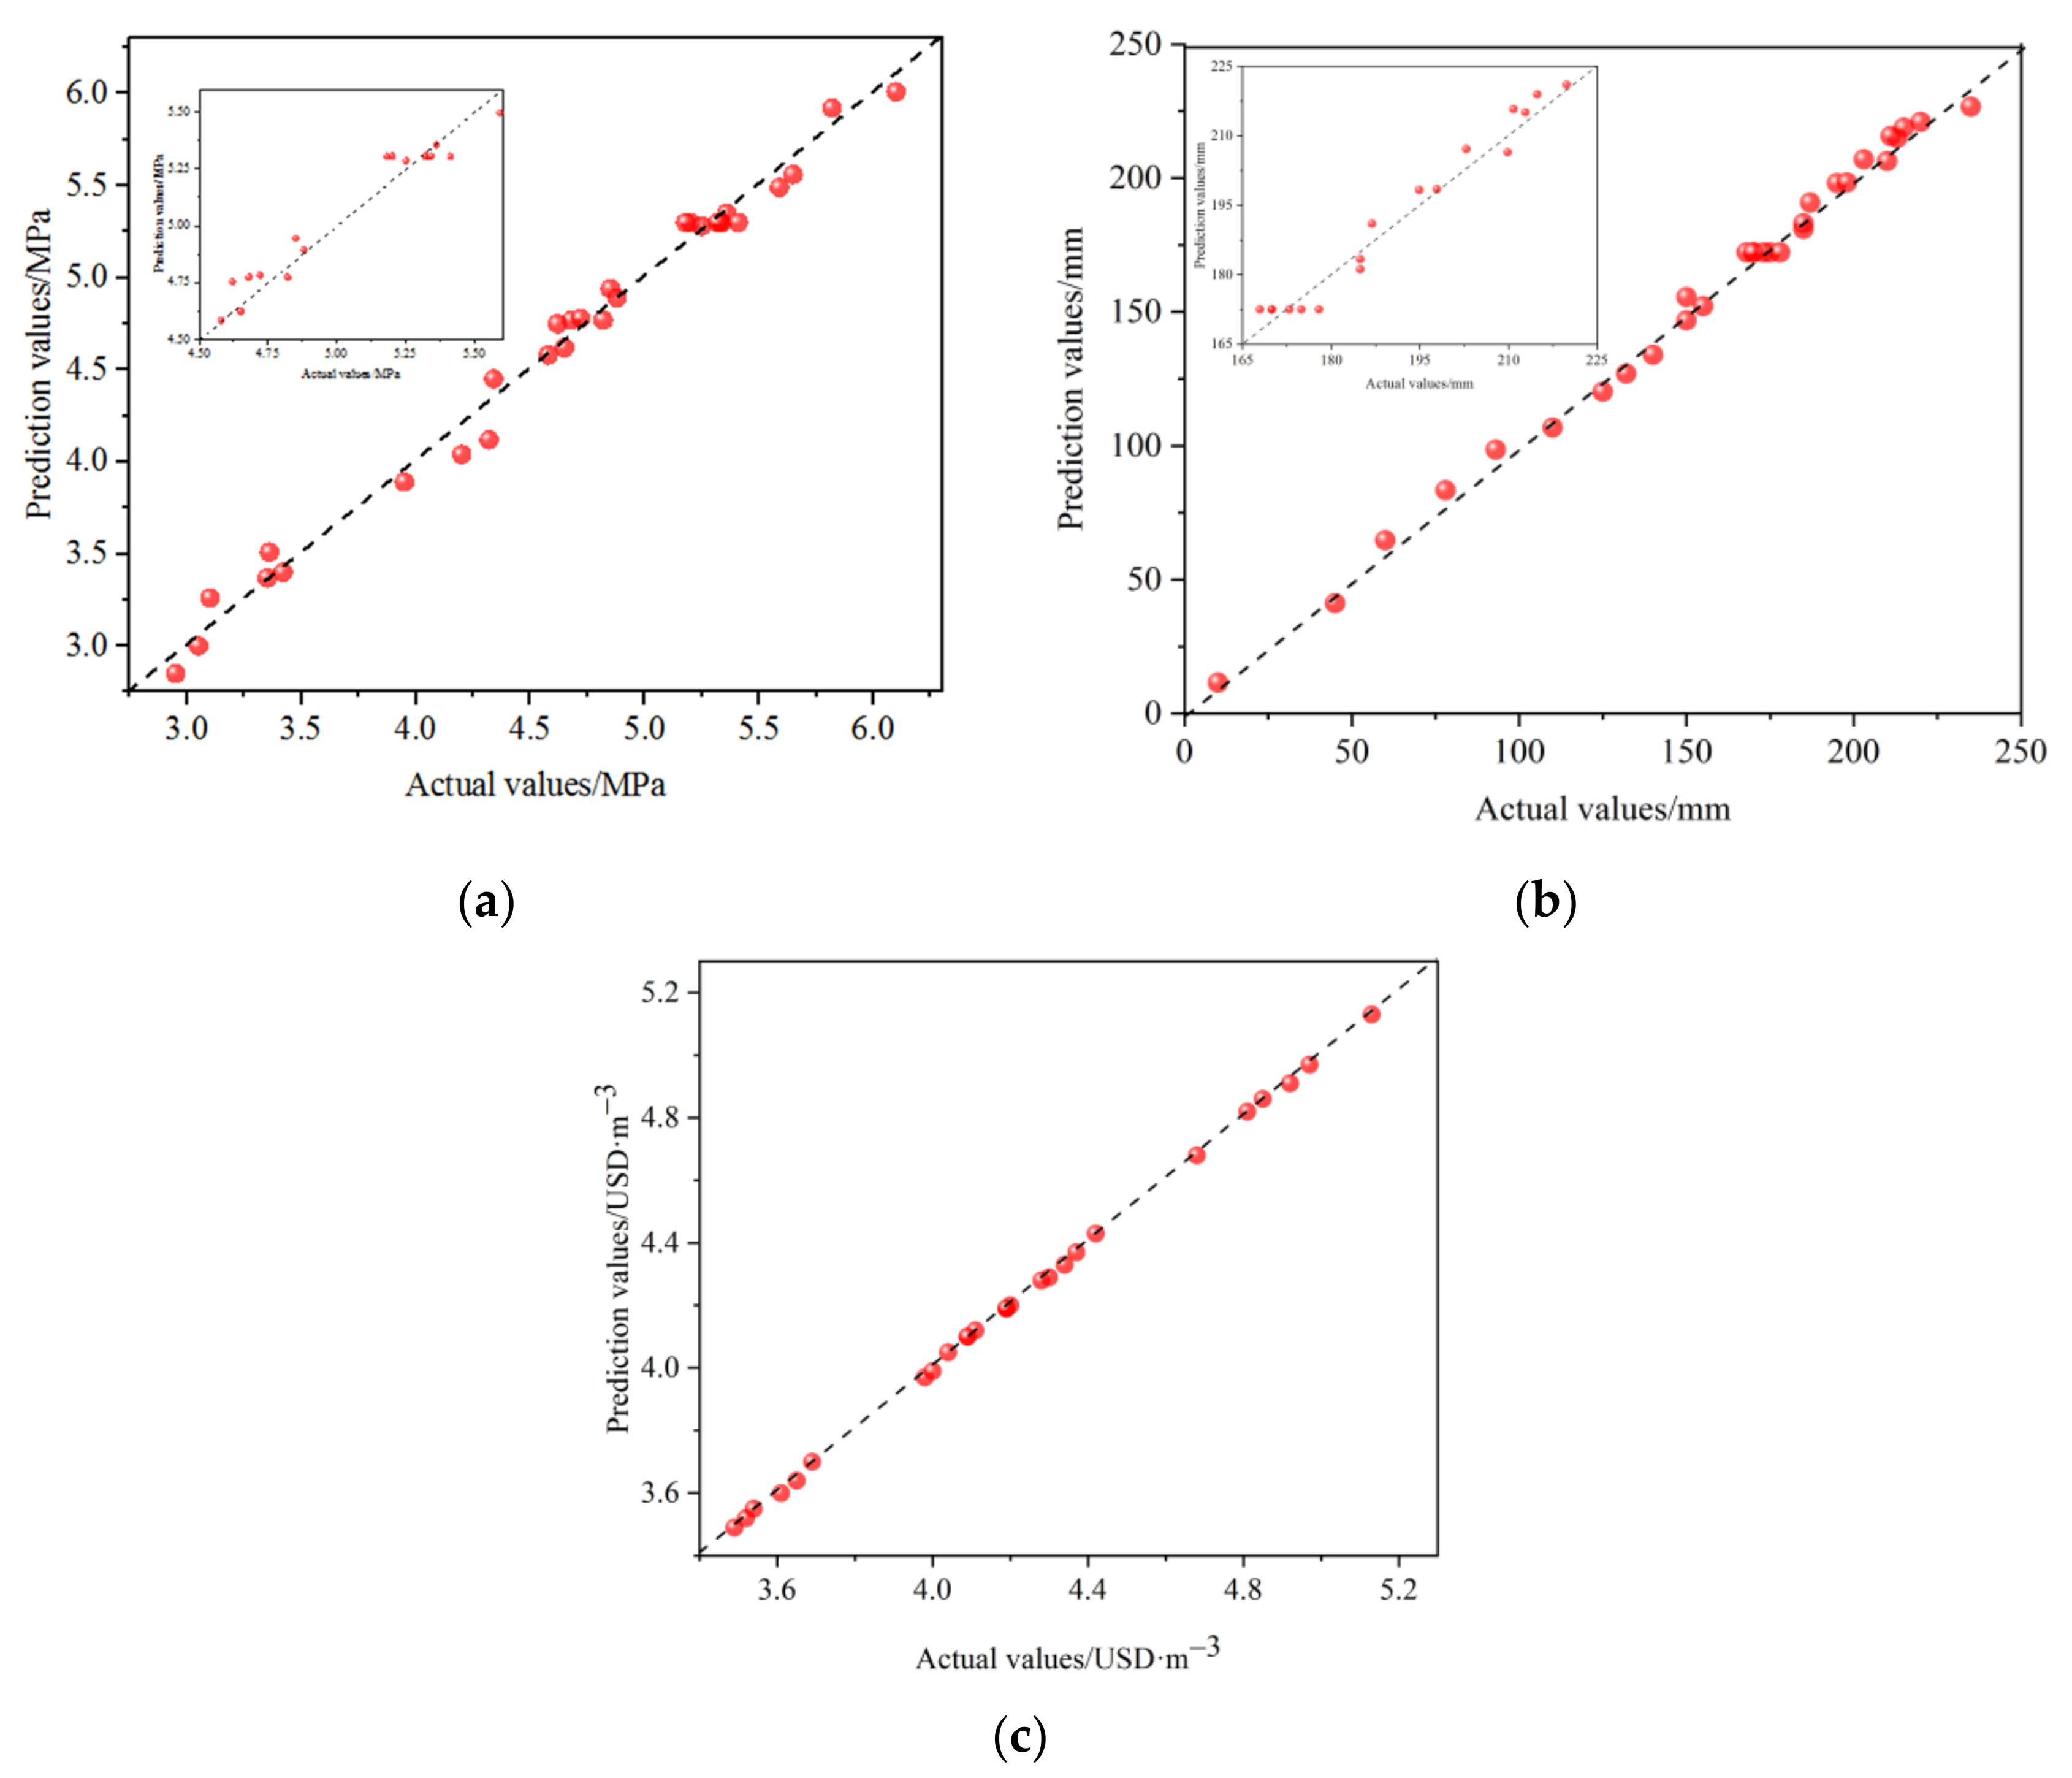
3.3. Quantum Genetic Algorithm Multi-Objective Optimization
- (1)
- Initialize the population of chromosomes, defined by [28]:where represents the dimension element of . The values of and represent the probability of each Q-bit appearing in a 0 or 1 state.
- (2)
- Calculate the fitness value according to Equation (4) and assign . Through all independently observed Q-bits, search for the chromosome that satisfies the highest fitness. The optimal individual can be gradually observed and then retained. Then, quantum crossover and mutation operations are carried out through Equation (7) to produce excellent individuals [28]:where and are the dimension elements of the two selected chromosomes, and , respectively.
- (3)
- Quantum gate update: The update process is as shown in Equation (8) [28]:where is the rotation angle applied to , is the step factor, is the symbolic function, and represents the th bit of the th niche center where belongs. The updated chromosomes are then evaluated and compared with the parents, and only the best individuals are retained.
- (4)
- If the algorithm reaches the pre-defined maximum number of iterations (in this study, ), the algorithm stops the search; otherwise, the algorithm returns to step (2) to continue the search.
3.4. Microscopic Analysis
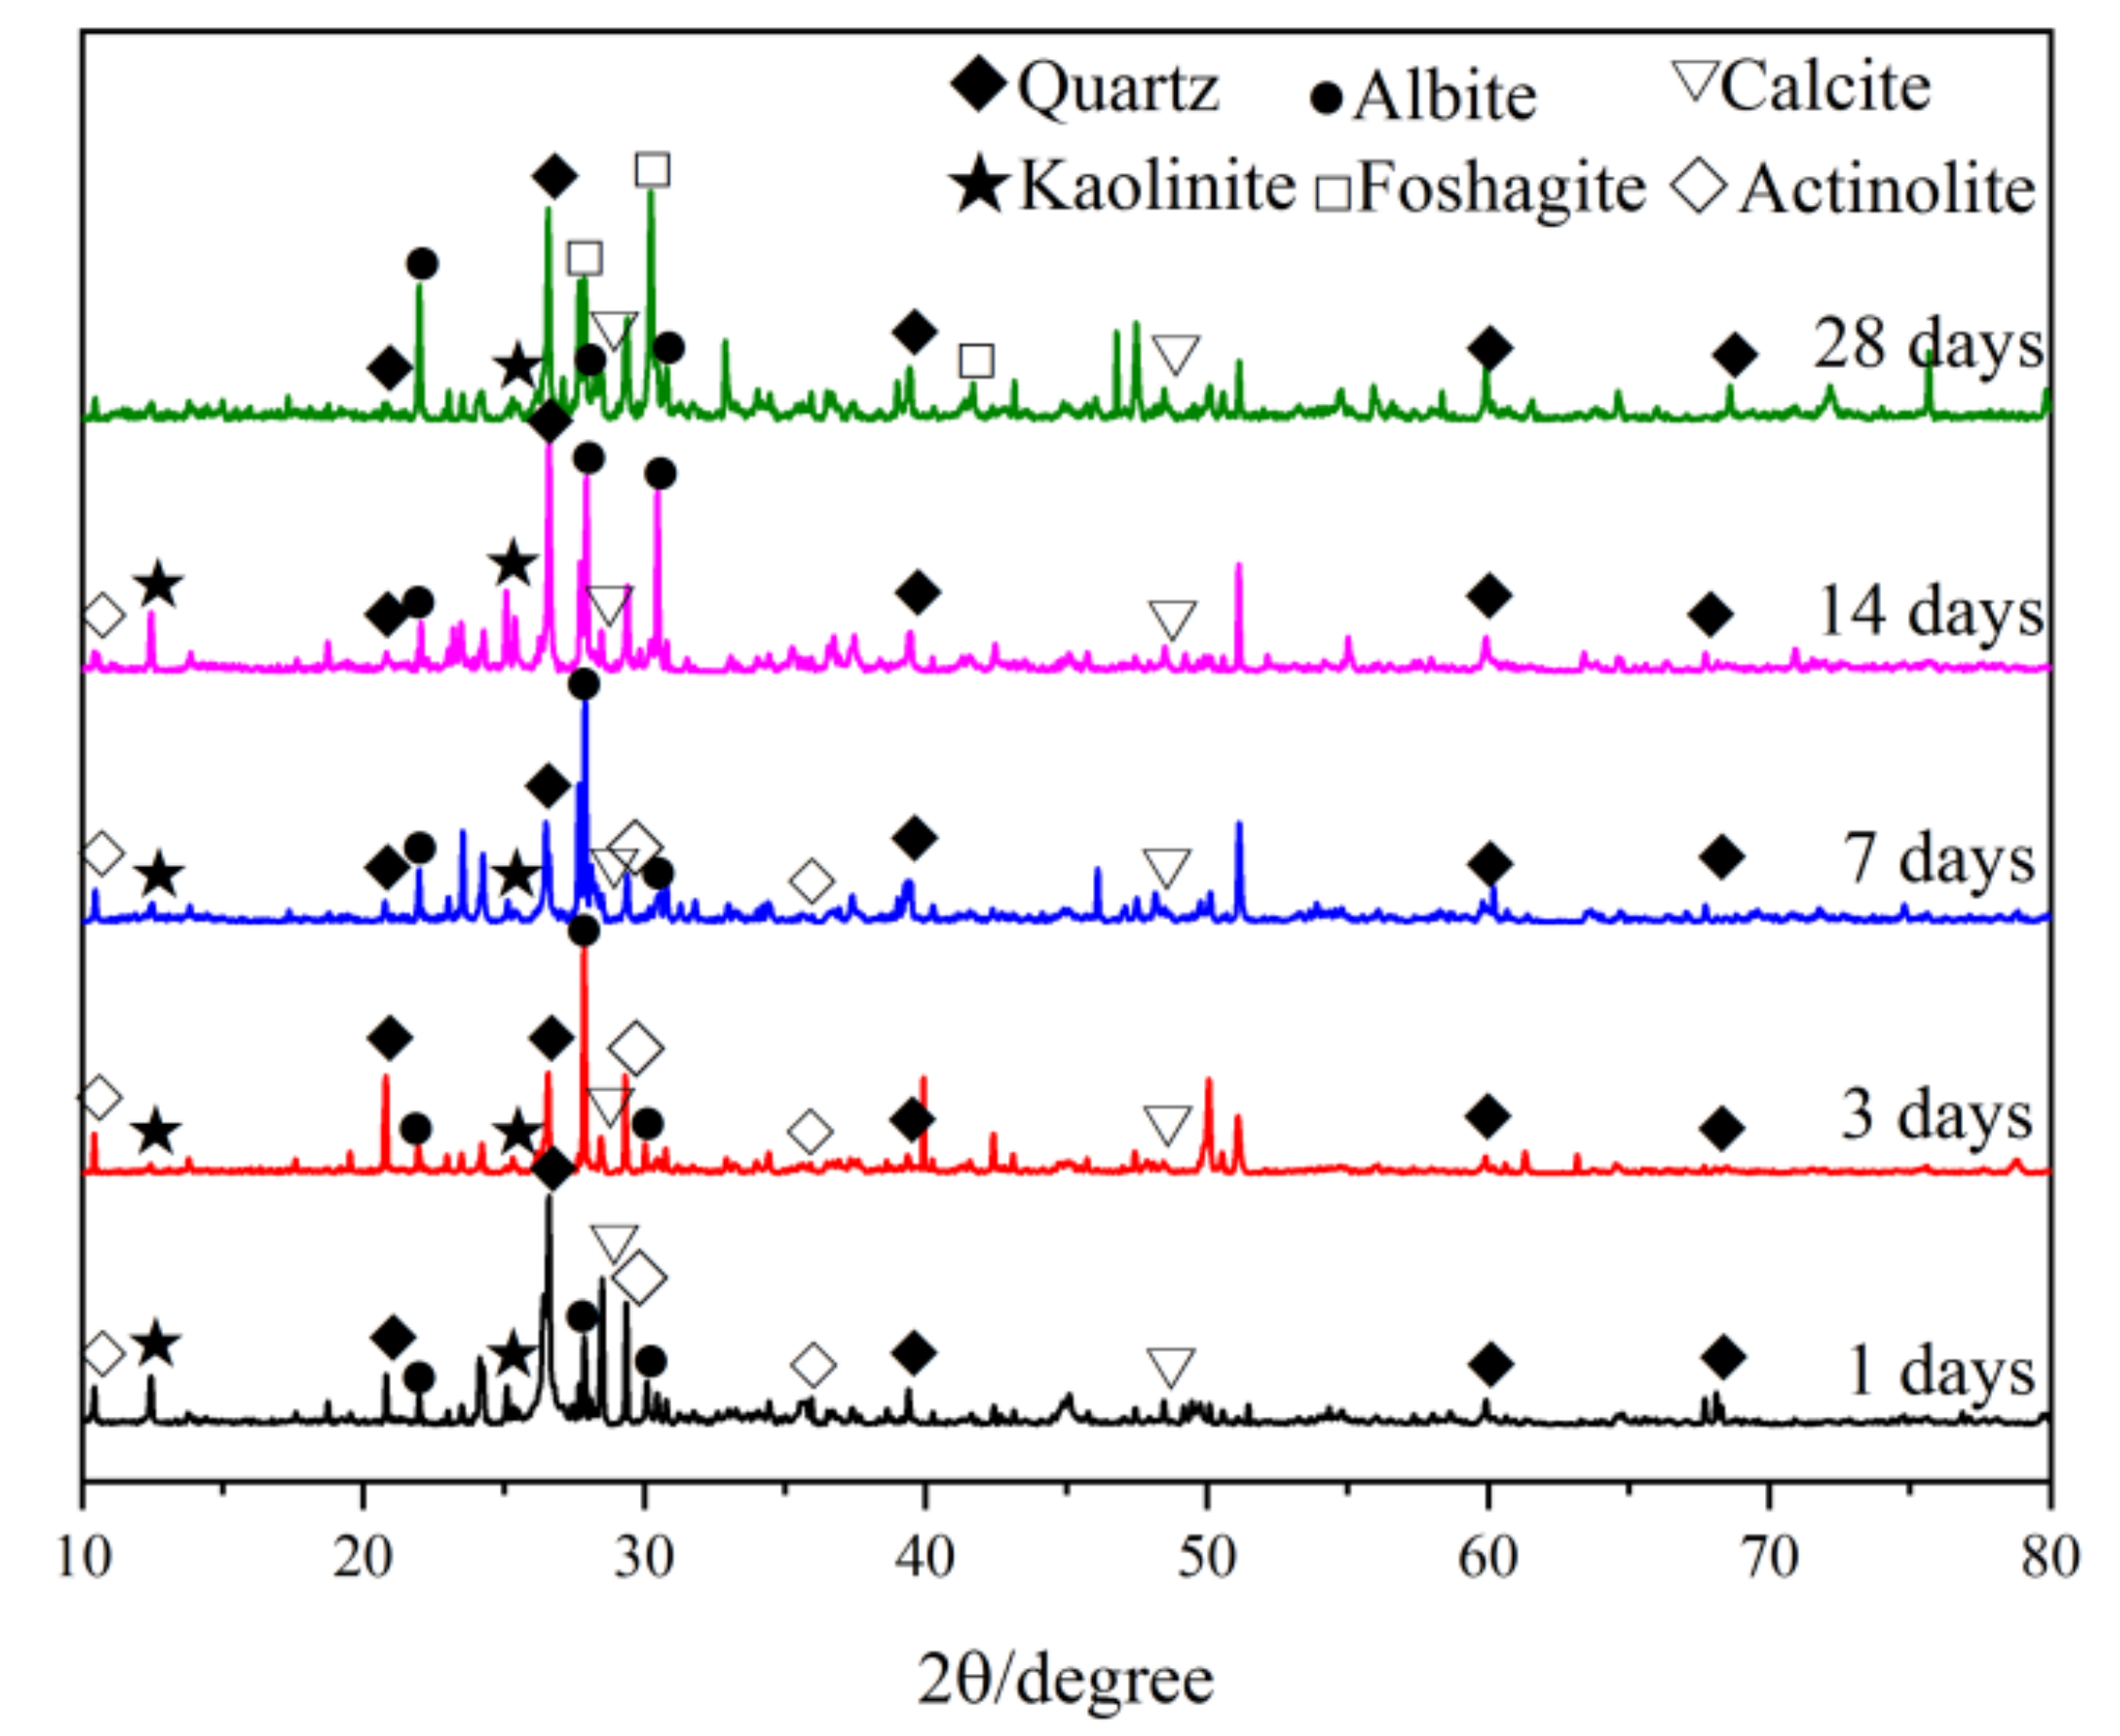
3.4.1. XRD
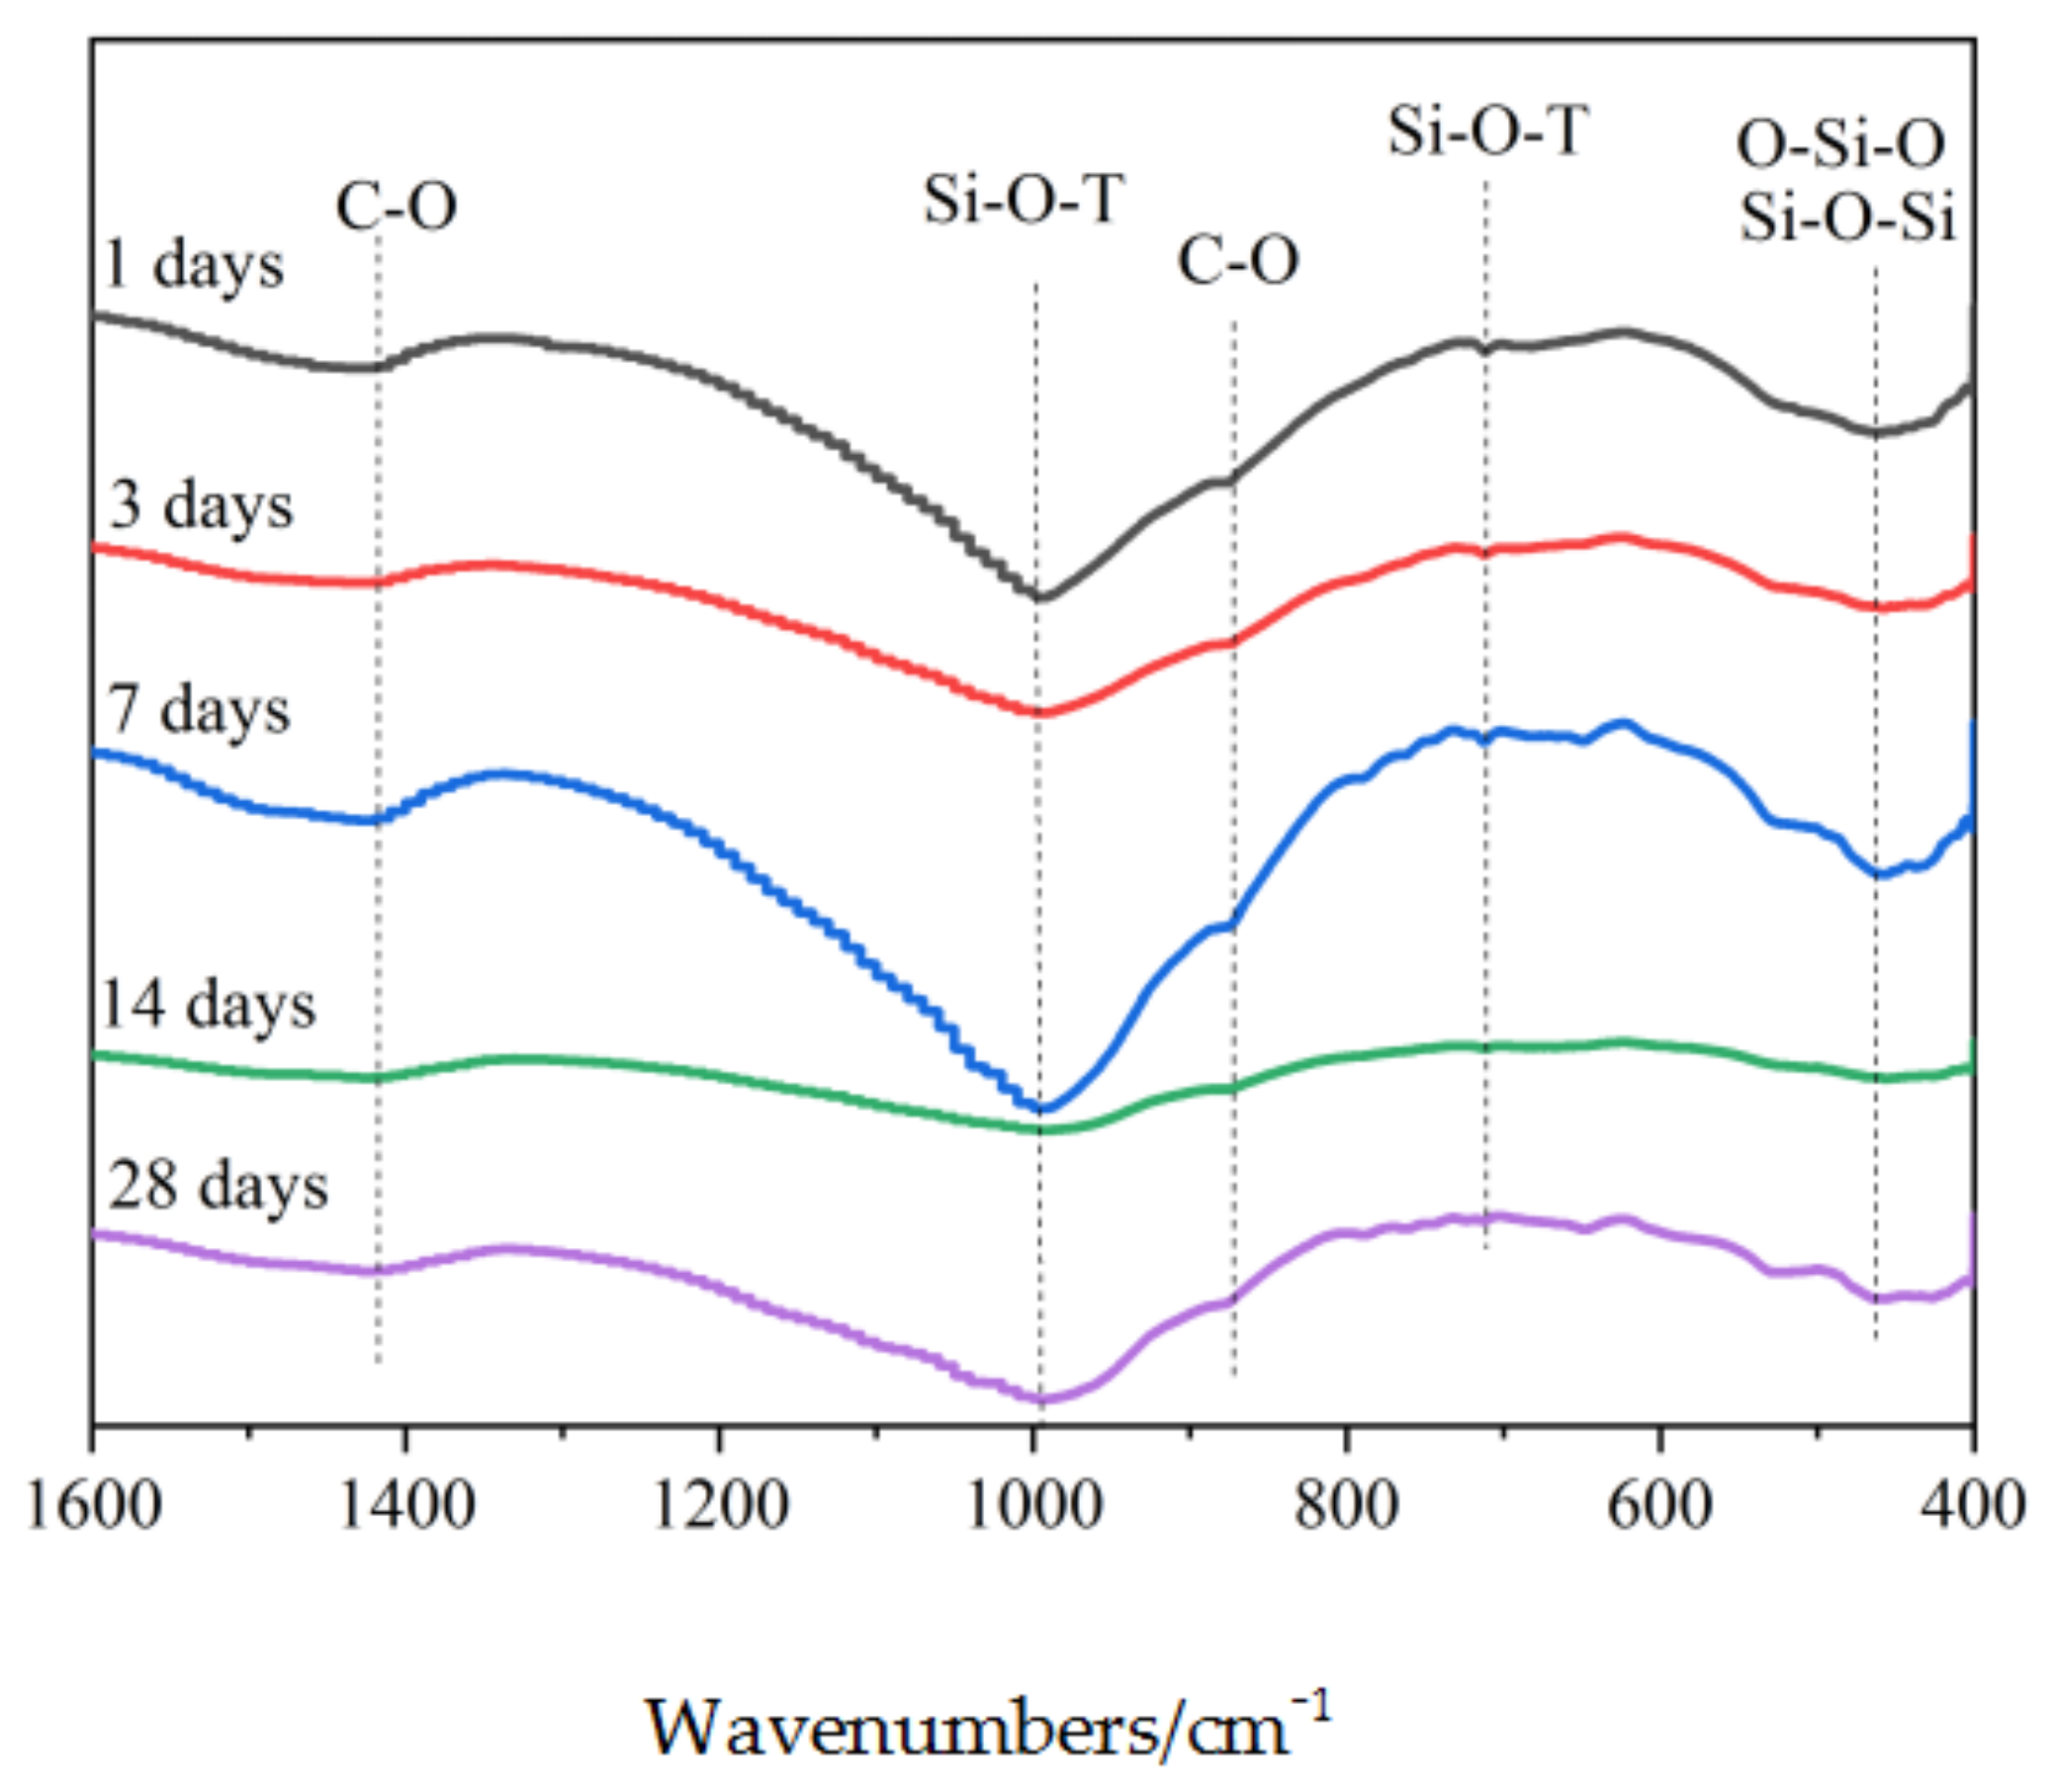
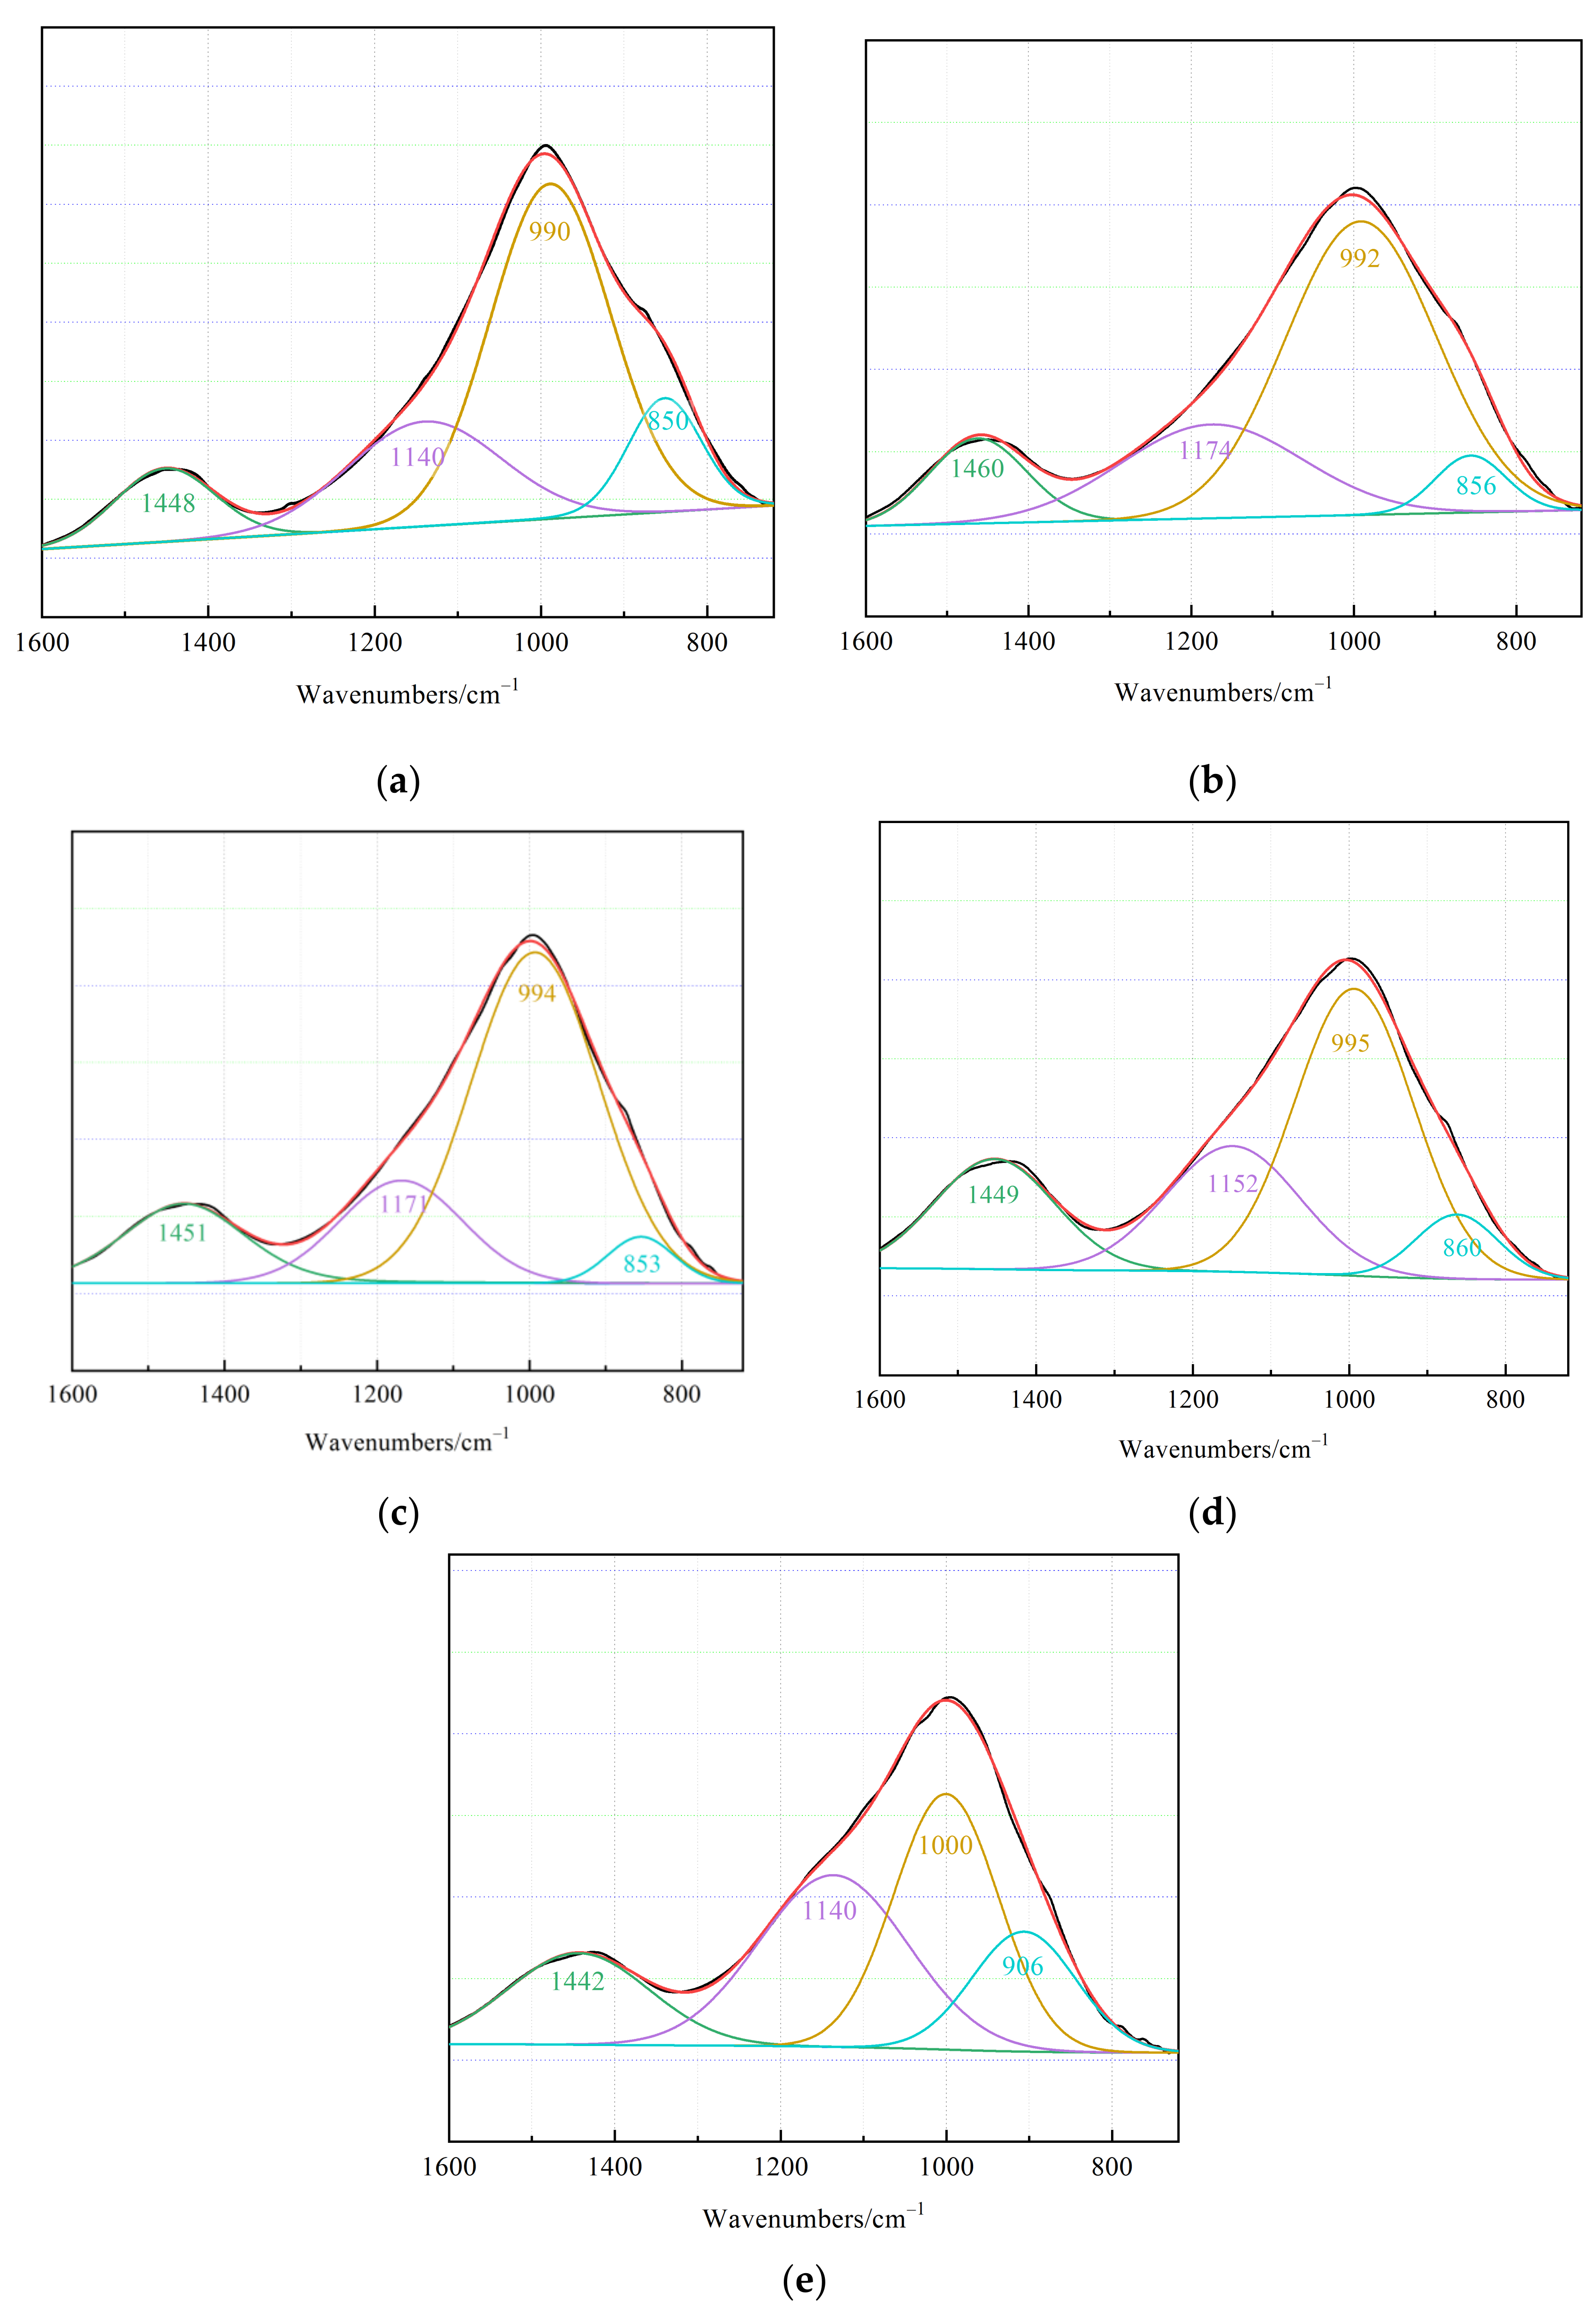
3.4.2. FTIR
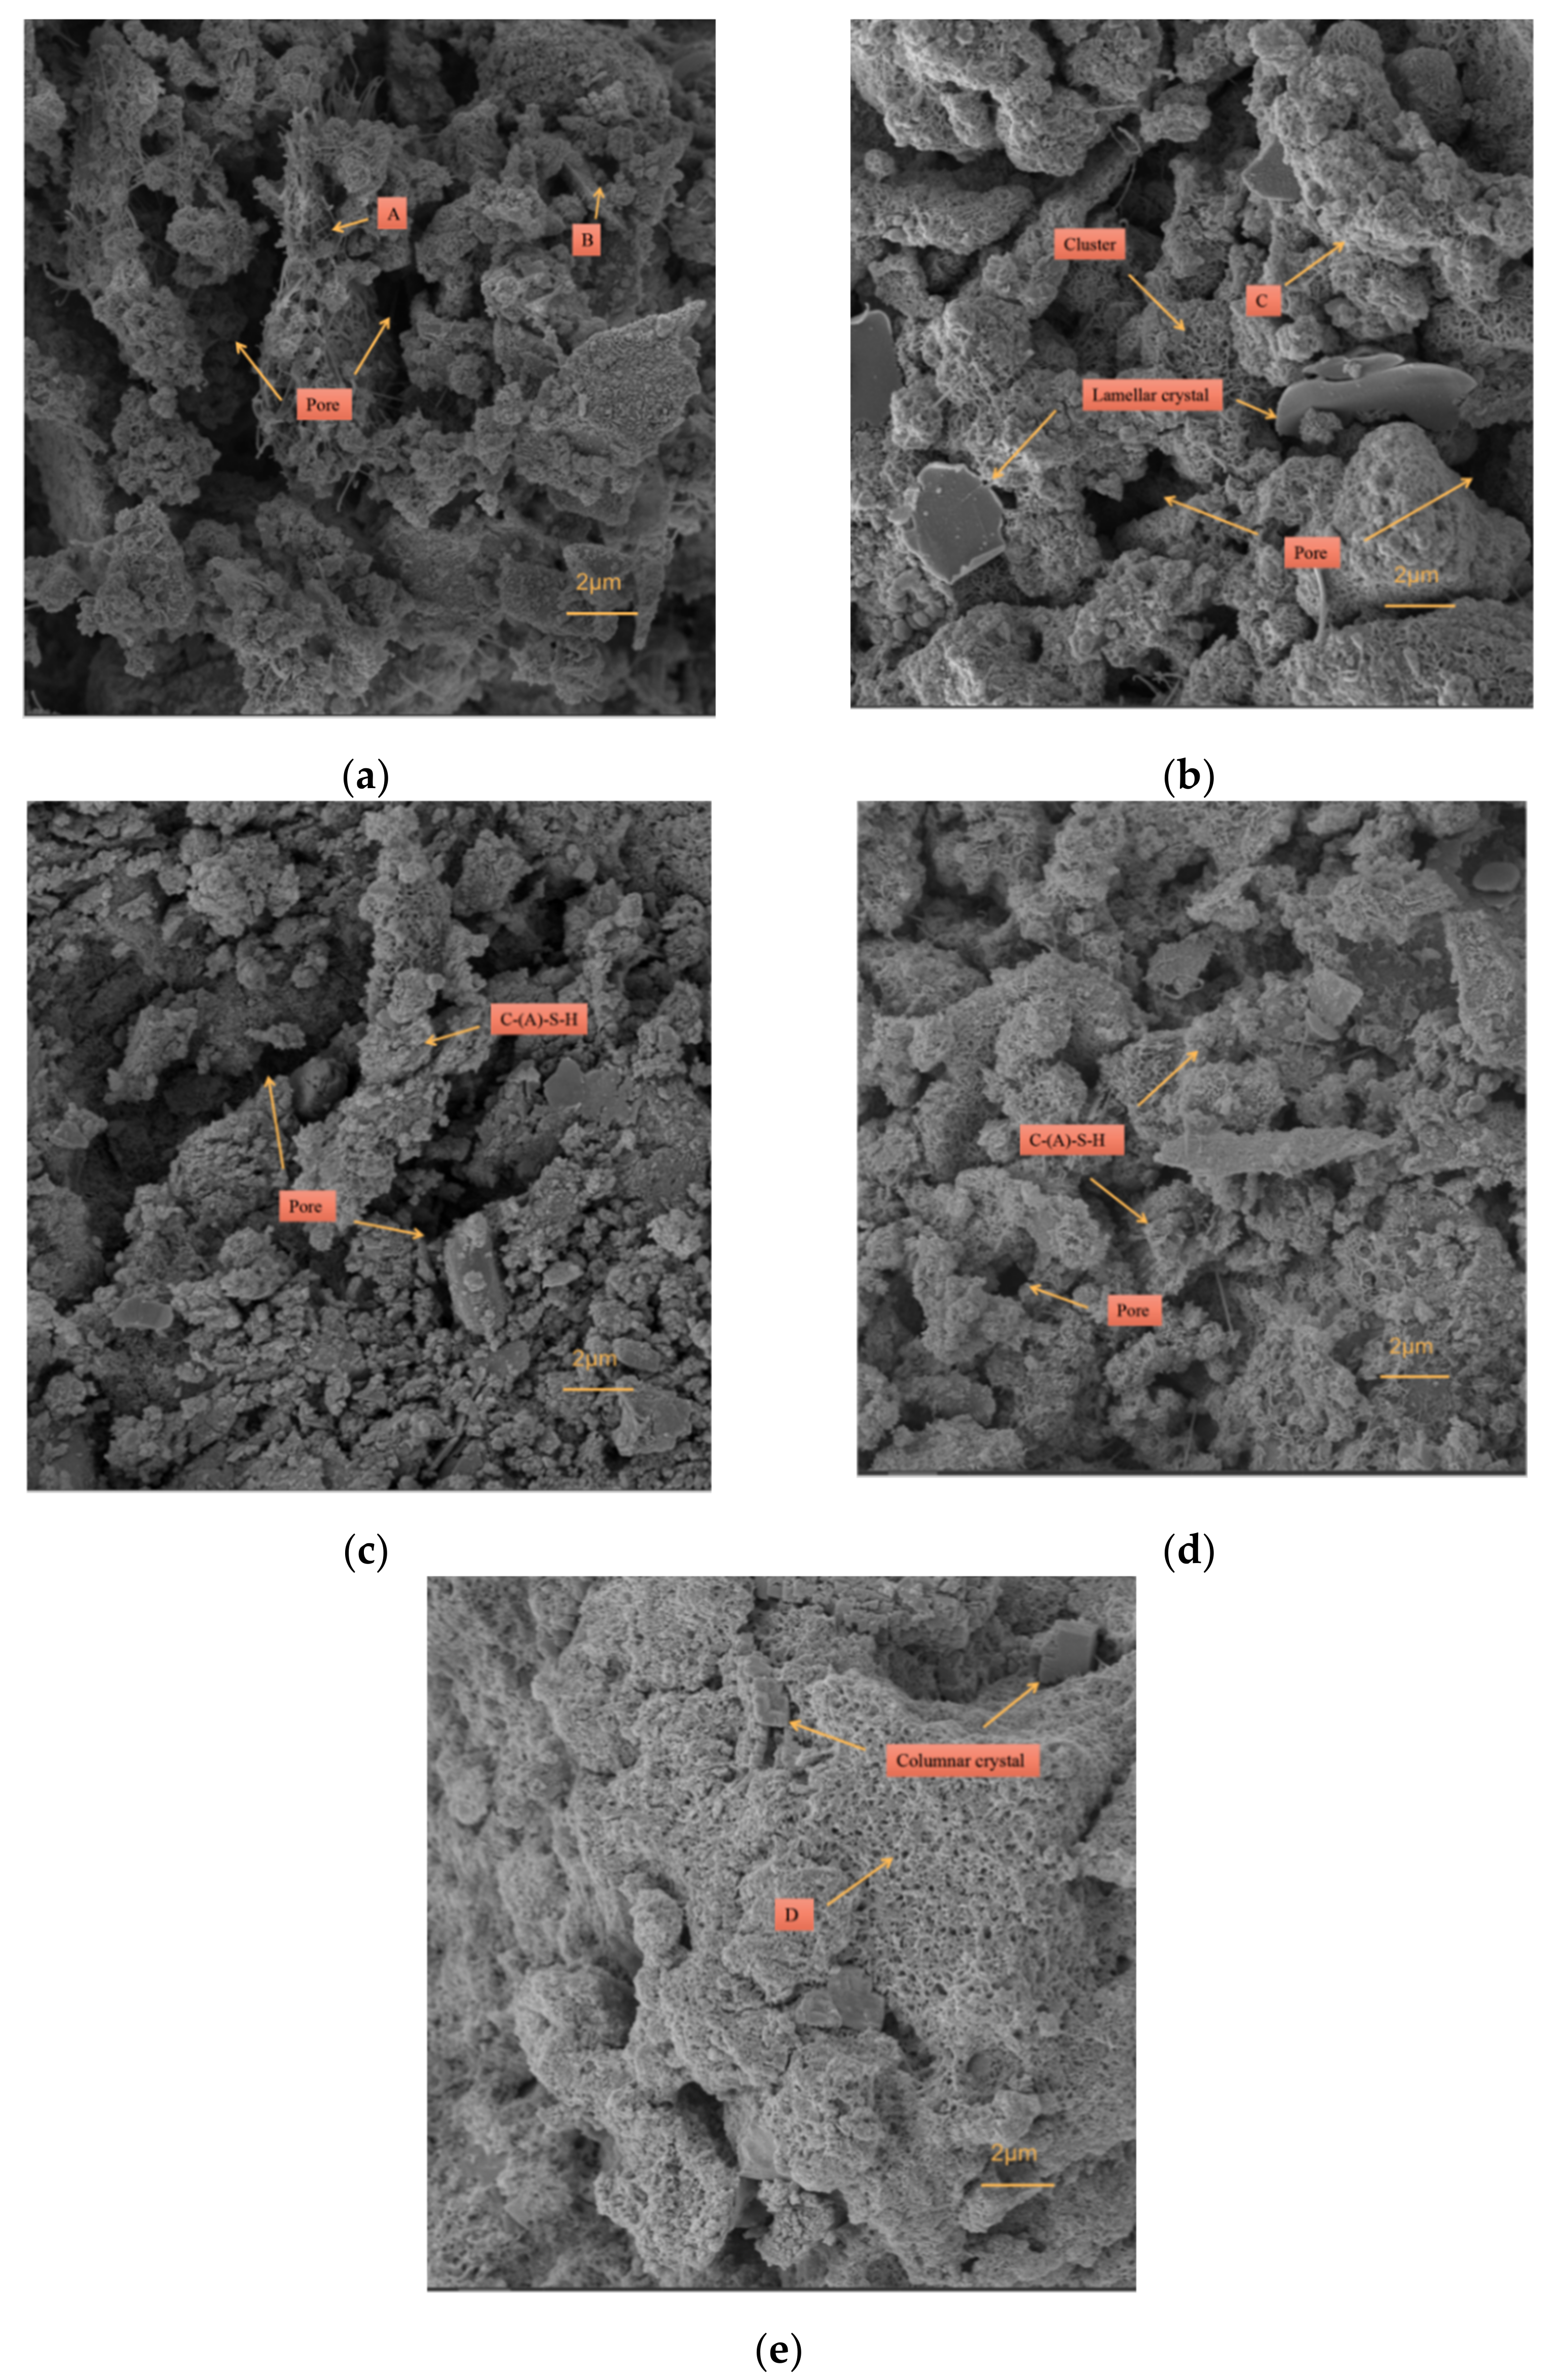
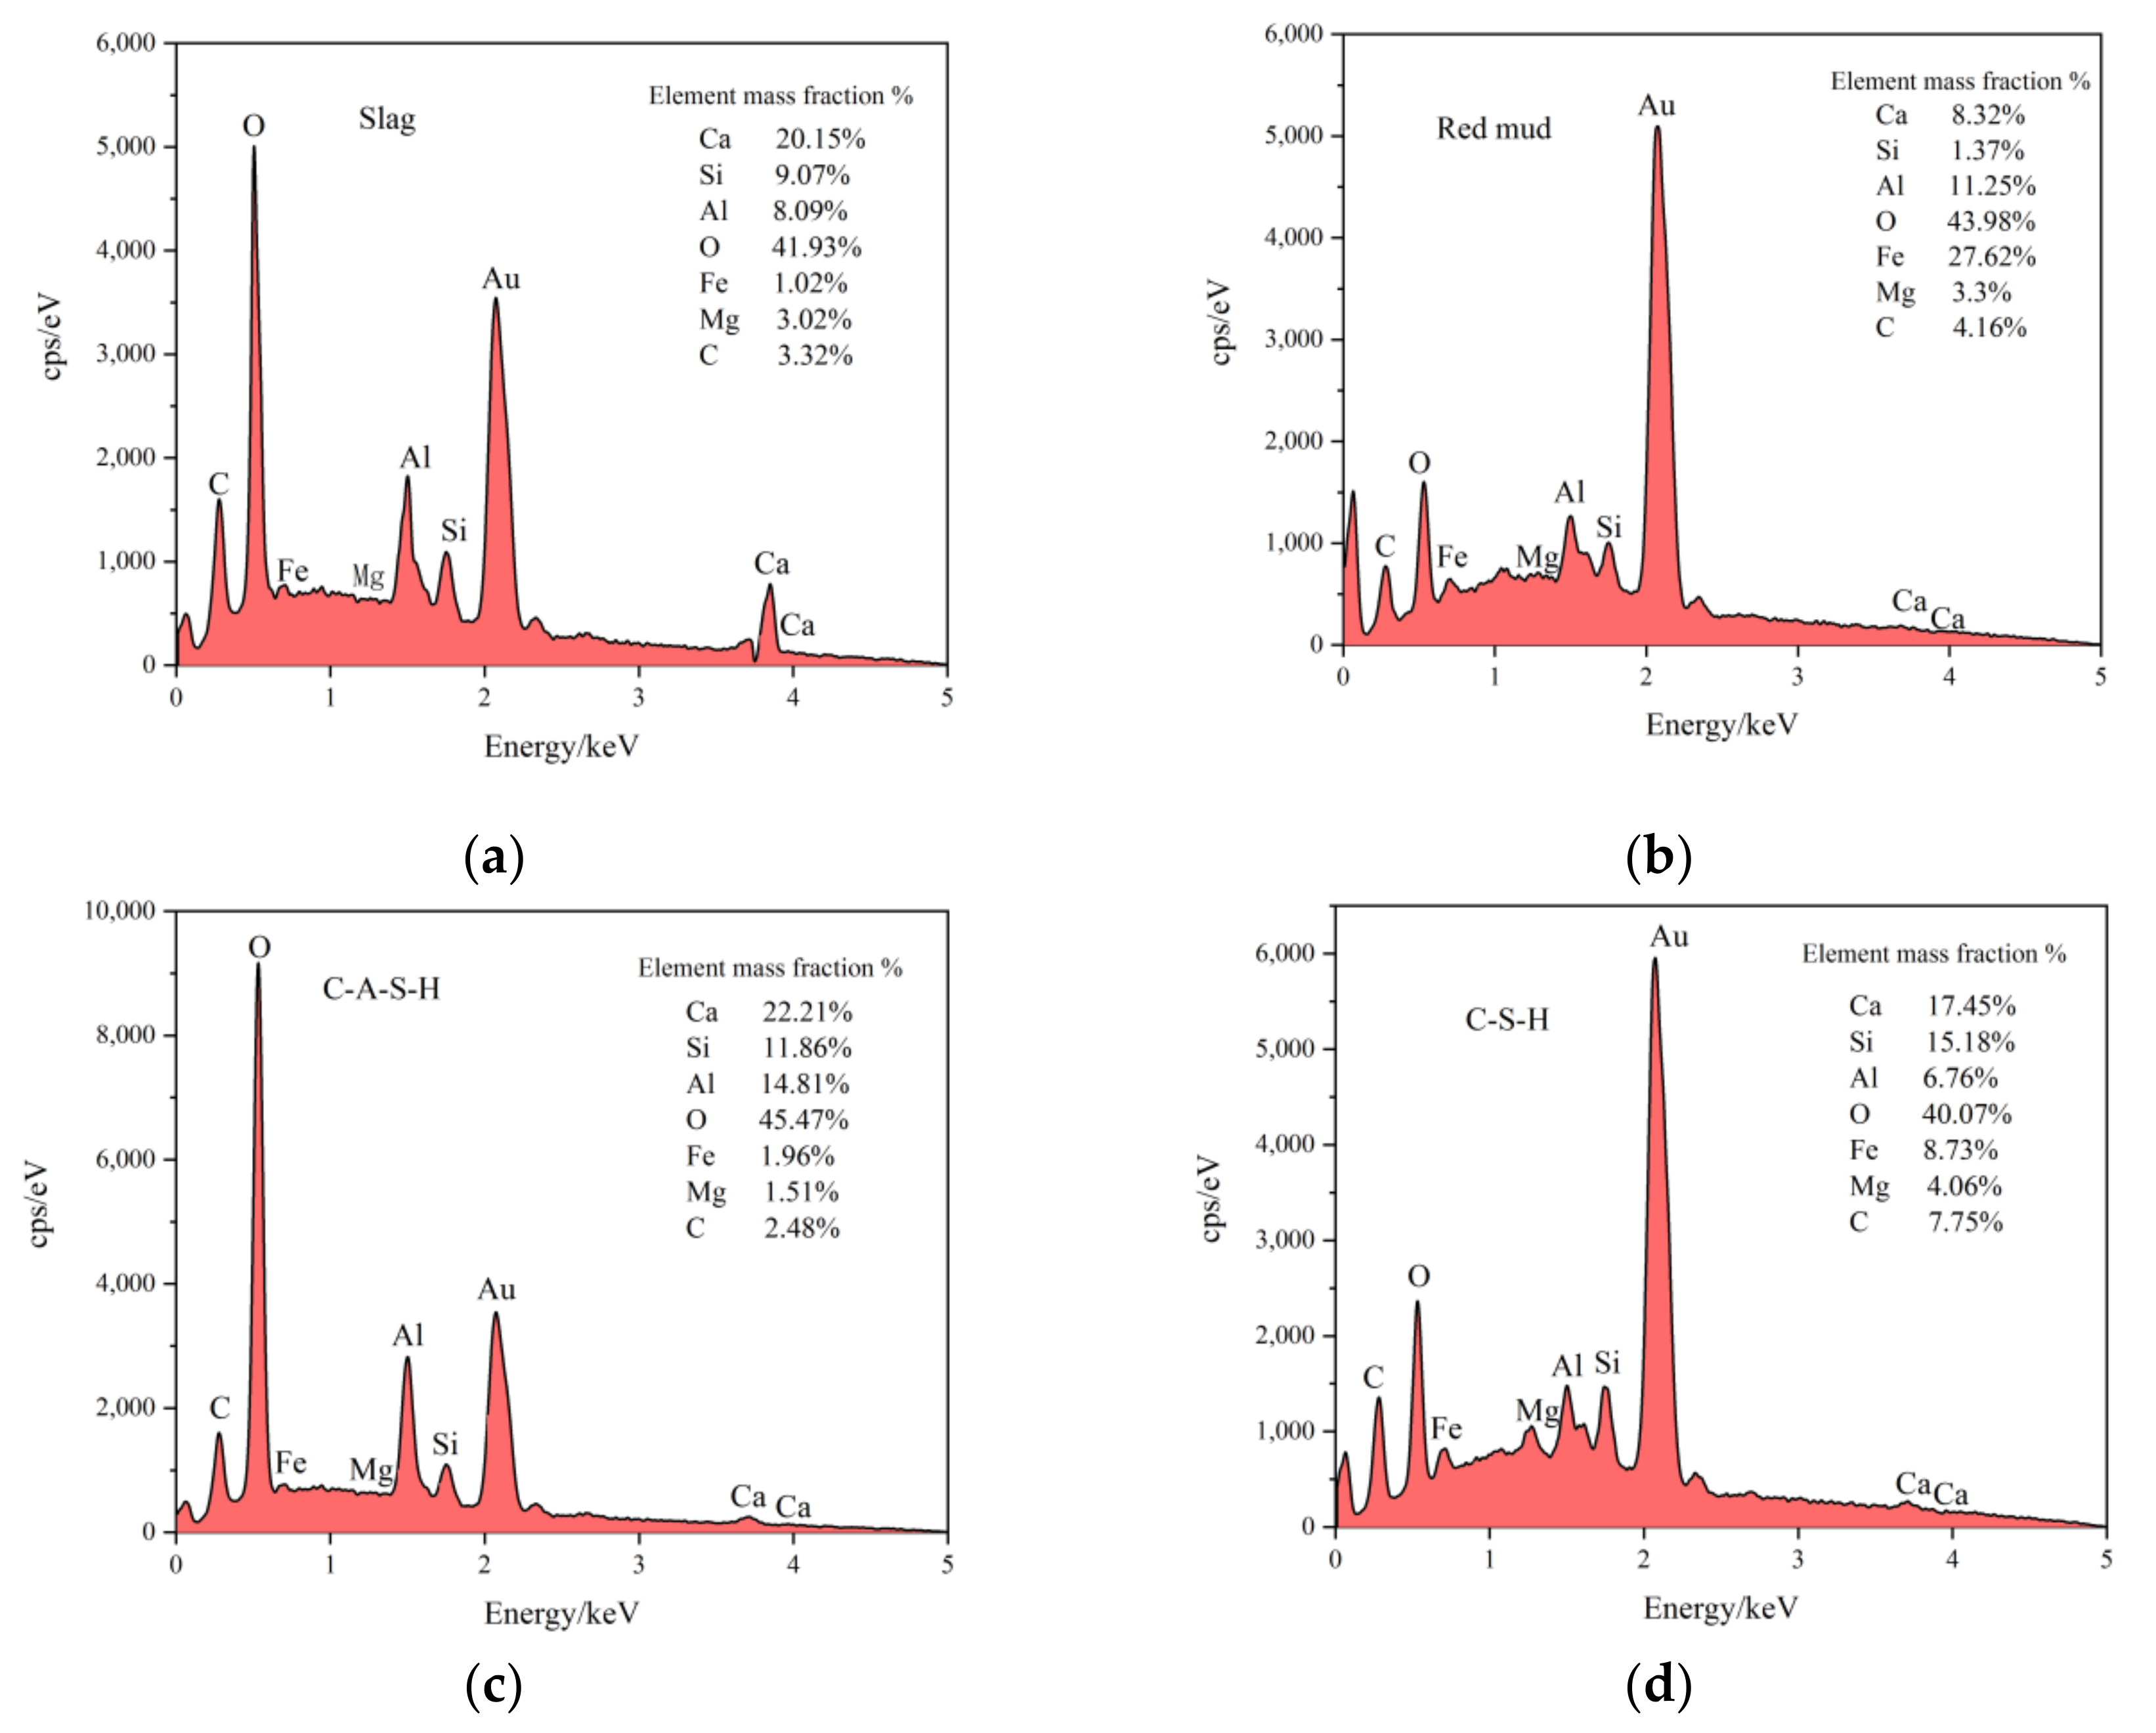
3.4.3. SEM-EDS
4. Conclusions
- (1)
- In this study, a new type of red mud, COS, slag, and tailing composite cemented paste backfill was developed. When the COS content is 16.87%, the RM substitution rate is 17.50%, the solid mass is 82.24%, and the aggregate–binder ratio was 4.37, which represents the optimal mix ratio.
- (2)
- With an increase in curing age, the quartz in the IOT and the hematite goethite in RM gradually dissolved and participated in the polymerization reaction, and the quartz content increased at an age of 14 days. The appearance of foshagite at an age of 28 days indicated the transformation of aluminosilicate crystals to a more stable state.
- (3)
- The higher degree of C–S–H polymerization observed at 1 d of age was caused by the insufficient dissolution of silicate substances. With an increase in curing age, the degree of polymerization of C–S–H in the amorphous gel gradually increased, and the degree of polymerization of C–A–S–H gradually decreased.
- (4)
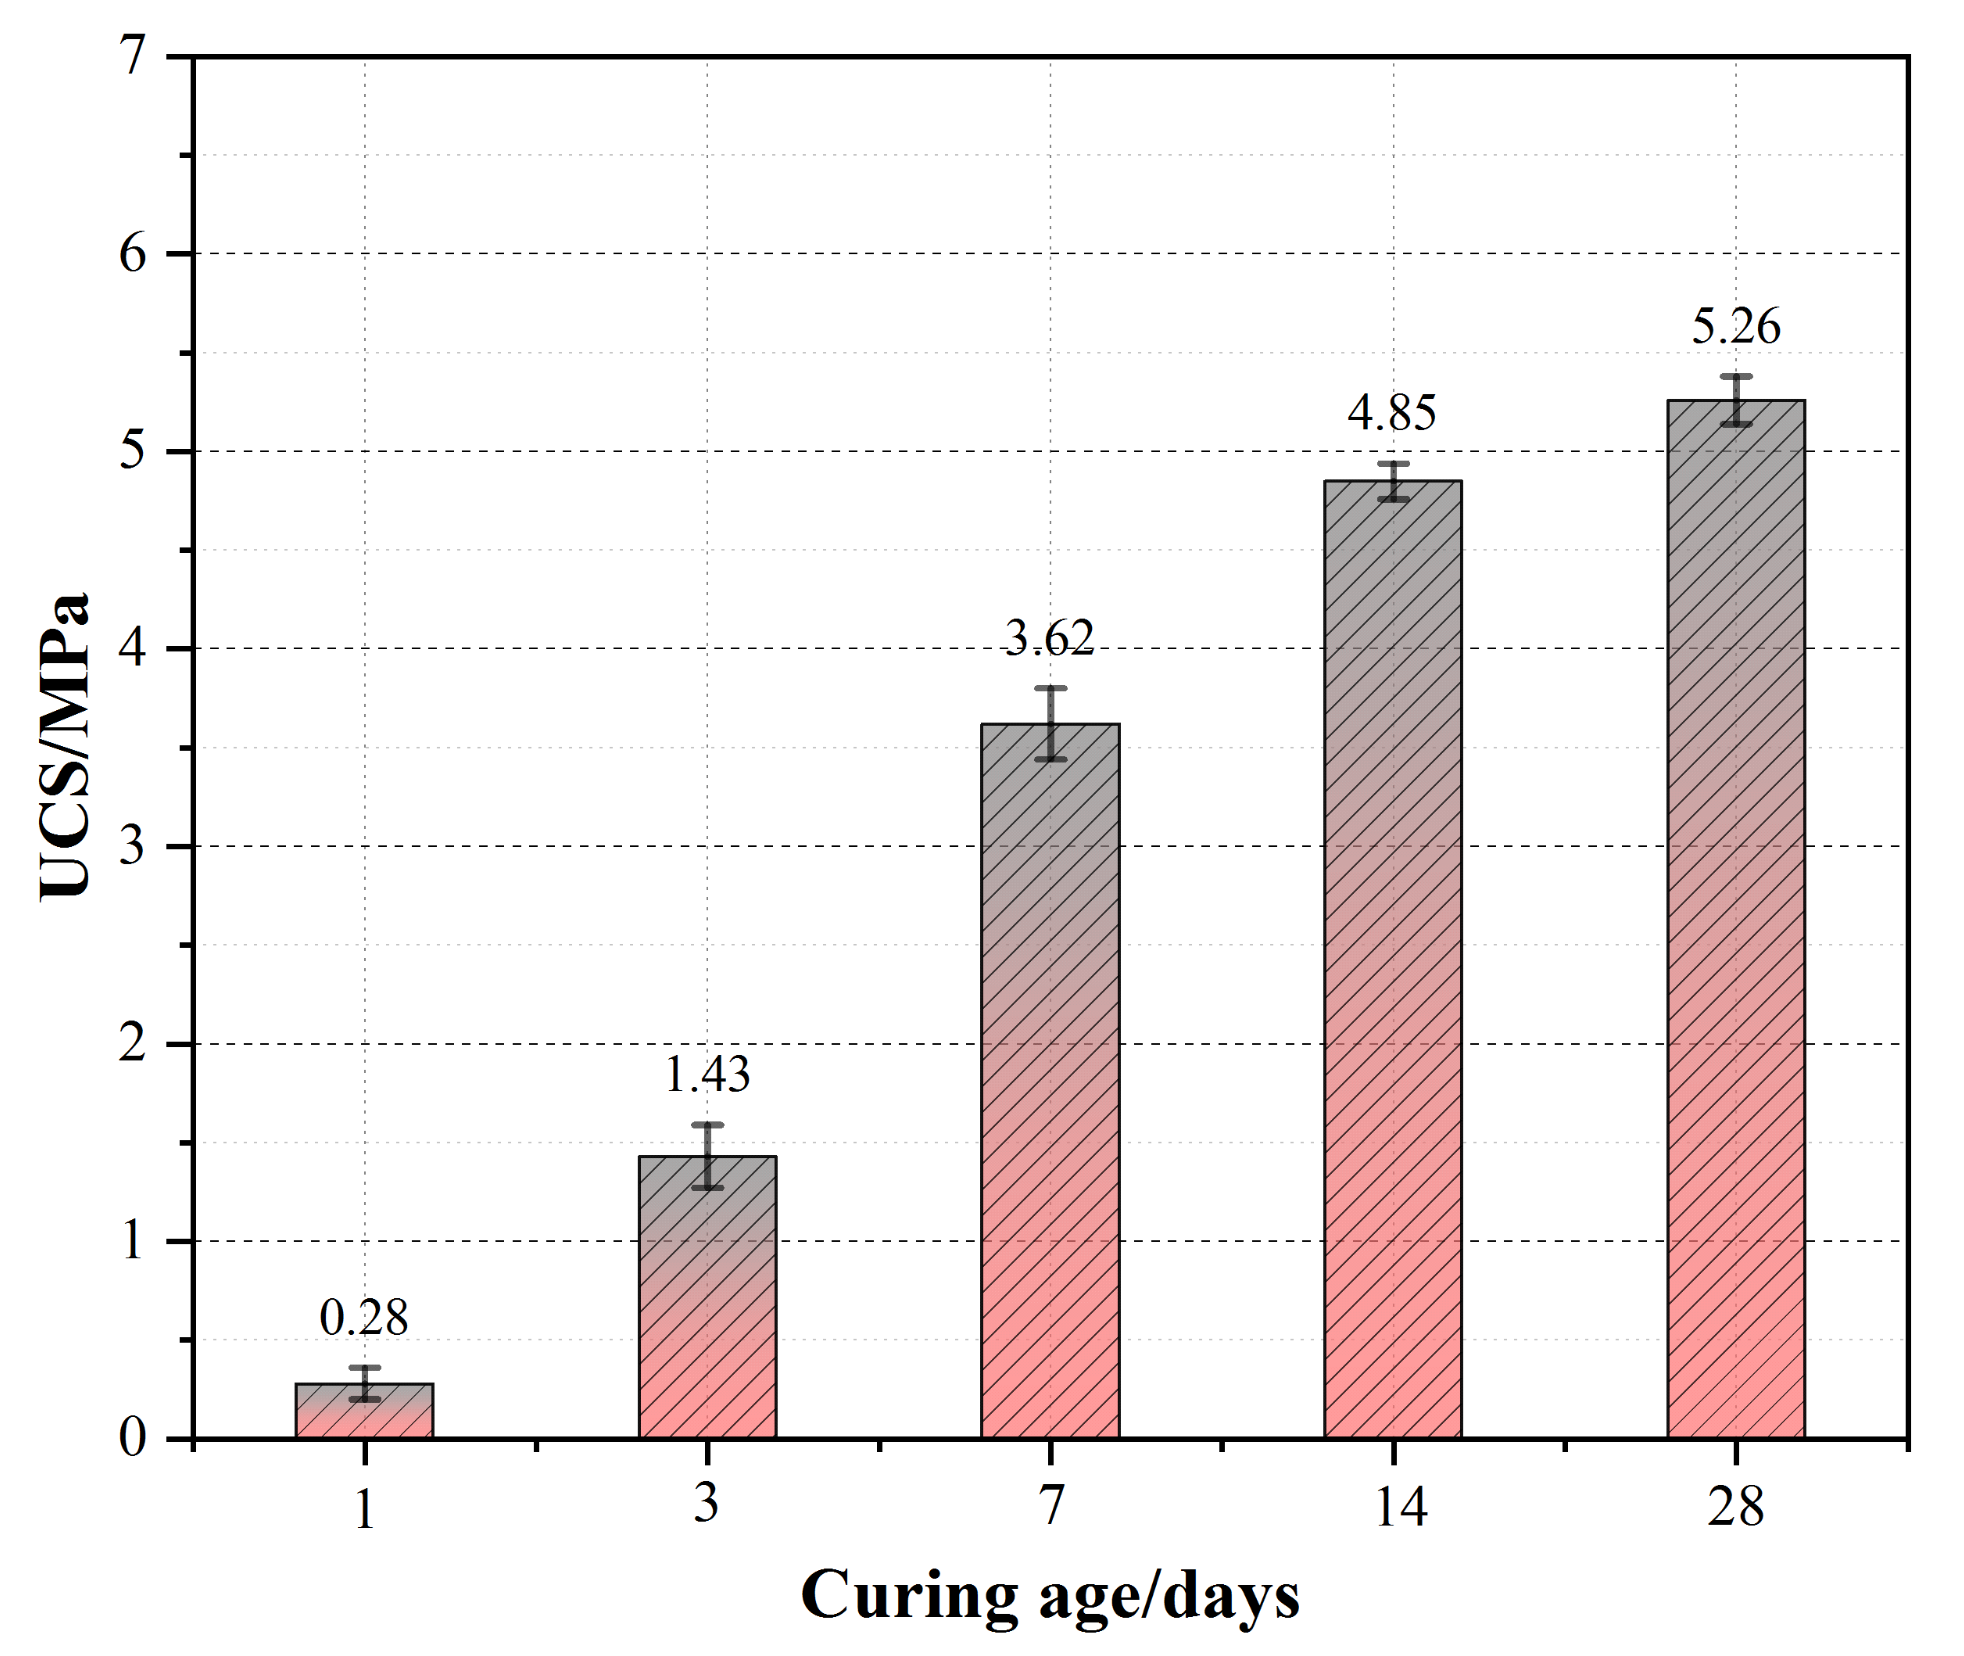
- The precursor material gradually dissolved, and the content of C–S–H and C–A–S–H amorphous gel and aluminosilicate crystals increased, which effectively filled the pores inside the CPB, thereby improving compressive strength.
Author Contributions
Funding
Institutional Review Board Statement
Informed Consent Statement
Data Availability Statement
Conflicts of Interest
Appendix A

| Test Number | Factor | Response | |||||
|---|---|---|---|---|---|---|---|
| 1 | 2 | 3 | 4 | 1 | 2 | 3 | |
| A (%) | B (%) | C (%) | D | 28-dUCS (MPa) | Slump (mm) | Cost (USD/m3) | |
| 1 | 15 | 15 | 83 | 4.5 | 5.18 | 170 | 4.19 |
| 2 | 12.5 | 20 | 82 | 5 | 3.05 | 220 | 3.52 |
| 3 | 15 | 25 | 83 | 4.5 | 4.82 | 185 | 3.69 |
| 4 | 12.5 | 10 | 82 | 4 | 5.25 | 213 | 4.81 |
| 5 | 17.5 | 10 | 82 | 5 | 4.58 | 198 | 4.00 |
| 6 | 12.5 | 10 | 82 | 5 | 4.32 | 211 | 3.98 |
| 7 | 17.5 | 10 | 82 | 4 | 5.65 | 187 | 4.85 |
| 8 | 15 | 15 | 83 | 4.5 | 5.41 | 168 | 4.19 |
| 9 | 15 | 15 | 85 | 4.5 | 2.95 | 10 | 4.28 |
| 10 | 15 | 5 | 83 | 4.5 | 5.82 | 155 | 4.68 |
| 11 | 15 | 15 | 83 | 3.5 | 6.1 | 132 | 5.13 |
| 12 | 15 | 15 | 83 | 5.5 | 3.36 | 185 | 3.49 |
| 13 | 12.5 | 10 | 84 | 4 | 5.36 | 93 | 4.92 |
| 14 | 15 | 15 | 83 | 4.5 | 5.33 | 175 | 4.19 |
| 15 | 10 | 15 | 83 | 4.5 | 4.65 | 210 | 4.11 |
| 16 | 17.5 | 10 | 84 | 4 | 4.72 | 45 | 4.97 |
| 17 | 12.5 | 20 | 84 | 5 | 3.35 | 150 | 3.61 |
| 18 | 17.5 | 20 | 82 | 4 | 5.59 | 195 | 4.34 |
| 19 | 15 | 15 | 81 | 4.5 | 3.1 | 235 | 4.09 |
| 20 | 15 | 15 | 83 | 4.5 | 5.32 | 173 | 4.19 |
| 21 | 17.5 | 10 | 84 | 5 | 4.2 | 78 | 4.09 |
| 22 | 17.5 | 20 | 84 | 4 | 4.62 | 60 | 4.42 |
| 23 | 15 | 15 | 83 | 4.5 | 5.34 | 178 | 4.19 |
| 24 | 12.5 | 20 | 82 | 4 | 4.68 | 203 | 4.30 |
| 25 | 20 | 15 | 83 | 4.5 | 4.85 | 150 | 4.20 |
| 26 | 12.5 | 20 | 84 | 4 | 4.88 | 110 | 4.37 |
| 27 | 15 | 15 | 83 | 4.5 | 5.2 | 170 | 4.19 |
| 28 | 17.5 | 20 | 84 | 5 | 3.42 | 125 | 3.65 |
| 29 | 12.5 | 10 | 84 | 5 | 4.34 | 140 | 4.04 |
| 30 | 17.5 | 20 | 82 | 5 | 3.95 | 215 | 3.54 |
Appendix B
| Source | Sum of Squares | Mean Square | F Value | p-Value | ||||||||
|---|---|---|---|---|---|---|---|---|---|---|---|---|
| R1 | R2 | R3 | R1 | R2 | R3 | R1 | R2 | R3 | R1 | R2 | R3 | |
| Model | 22.26 | 89,089.88 | 5.57 | 1.59 | 6363.56 | 0.4 | 93.72 | 192.03 | 4394.48 | <0.0001 | <0.0001 | <0.0001 |
| A | 0.15 | 5310.38 | 0.01 | 0.15 | 5310.38 | 0.01 | 8.86 | 160.25 | 110.48 | 0.0094 | <0.0001 | <0.0001 |
| B | 1.97 | 1247.04 | 1.45 | 1.97 | 1247.04 | 1.45 | 116.24 | 37.63 | 15,962.62 | <0.0001 | <0.0001 | <0.0001 |
| C | 0.26 | 69,445.04 | 0.051 | 0.26 | 69,445.04 | 0.051 | 15.1 | 2095.58 | 566.92 | 0.0015 | <0.0001 | <0.0001 |
| D | 9.4 | 4732.04 | 4.03 | 9.4 | 4732.04 | 4.03 | 553.99 | 142.79 | 44,461.15 | <0.0001 | <0.0001 | <0.0001 |
| AB | 0.19 | 232.56 | 6.25 × 10⁻⁶ | 0.19 | 232.56 | 6.25 × 10⁻⁶ | 11.15 | 7.02 | 0.069 | 0.0045 | 0.0182 | 0.7963 |
| AC | 0.74 | 1105.56 | 3.063 × 10⁻⁴ | 0.74 | 1105.56 | 3.063 × 10⁻⁴ | 43.59 | 33.36 | 3.38 | <0.0001 | <0.0001 | 0.0858 |
| AD | 0.029 | 45.56 | 1.562 × 10⁻⁴ | 0.029 | 45.56 | 1.562 × 10⁻⁴ | 1.7 | 1.37 | 1.73 | 0.2115 | 0.2593 | 0.2087 |
| BC | 2.03 × 10⁻³ | 264.06 | 5.625 × 10⁻⁵ | 2.03 × 10⁻³ | 264.06 | 5.625 × 10⁻⁵ | 0.12 | 7.97 | 0.62 | 0.7345 | 0.0129 | 0.4429 |
| BD | 0.38 | 175.56 | 6.806 × 10⁻³ | 0.38 | 175.56 | 6.806 × 10⁻³ | 22.29 | 5.3 | 75.16 | 0.0003 | 0.0361 | <0.0001 |
| CD | 0.063 | 1207.56 | 5.625 × 10⁻⁵ | 0.063 | 1207.56 | 5.625 × 10⁻⁵ | 3.68 | 36.44 | 0.62 | 0.0742 | <0.0001 | 0.4429 |
| A2 | 0.46 | 31.57 | 1.765 × 10⁻³ | 0.46 | 31.57 | 1.765 × 10⁻³ | 27.23 | 0.95 | 19.49 | 0.0001 | 0.3445 | 0.0005 |
| B2 | 4.43 × 10⁻³ | 55.86 | 7.44 × 10⁻⁶ | 4.43 × 10⁻³ | 55.86 | 7.44 × 10⁻⁶ | 0.26 | 1.69 | 0.082 | 0.6168 | 0.2138 | 0.7783 |
| C2 | 8.63 | 4853.36 | 7.44 × 10⁻⁶ | 8.63 | 4853.36 | 7.44 × 10⁻⁶ | 508.83 | 146.46 | 0.082 | <0.0001 | <0.0001 | 0.7783 |
| D2 | 0.5 | 507.65 | 0.026 | 0.5 | 507.65 | 0.026 | 29.37 | 15.32 | 286.02 | <0.0001 | 0.0014 | <0.0001 |
| Residual | 0.25 | 497.08 | 1.358 × 10⁻³ | 0.017 | 497.08 | |||||||
| Lack of fit | 0.22 | 427.75 | 1.358 × 10⁻³ | 0.022 | 427.75 | 1.358 × 10⁻³ | 2.74 | 3.08 | 0.1391 0.1128 | |||
| Pure error | 0.039 | 69.33 | 0 | 7.87 × 10⁻³ | 69.33 | 0 | ||||||
| Cor total | 22.52 | 89,586.97 | 5.57 | 89,586.97 | ||||||||
| Std. dev. | 0.13 | 5.76 | 9.516 × 10⁻³ | R-Squared | 0.9887 | 0.9945 | 0.9998 | |||||
| Mean | 4.65 | 157.97 | 4.21 | Adj R-squared | 0.9781 | 0.9893 | 0.9995 | |||||
| C.V.% | 2.8 | 3.64 | 0.23 | Pred R-squared | 0.9424 | 0.9714 | 0.9986 | |||||
| PRESS | 1.3 | 2563.68 | 7.824 × 10⁻³ | Adeq R-squared | 34.344 | 52.859 | 243.478 | |||||
References
- Chen, S.; Du, Z.; Zhang, Z.; Yin, D.; Feng, F.; Ma, J. Effects of red mud additions on gangue-cemented paste backfill properties. Powder Technol. 2020, 367, 833–840. [Google Scholar] [CrossRef]
- Jin, J.; Qin, Z.; Lü, X.; Liu, T.; Zhang, G.; Shi, J.; Zuo, S.; Li, D. Rheology control of self-consolidating cement-tailings grout for the feasible use in coal gangue-filled backfill. Constr. Build. Mater. 2022, 316, 125836. [Google Scholar] [CrossRef]
- China Agriculture Press. China Fisheries Yearbook; China Agriculture Press: Beijing, China, 2020. [Google Scholar]
- Li, Z.; You, H.; Gao, Y.; Wang, C.; Zhang, J. Effect of ultrafine red mud on the workability and microstructure of blast furnace slag-red mud based geopolymeric grouts. Powder Technol. 2021, 392, 610–618. [Google Scholar] [CrossRef]
- Alam, S.; Das, S.K.; Rao, B.H. Strength and durability characteristic of alkali activated GGBS stabilized red mud as geo-material. Constr. Build. Mater. 2019, 211, 932–942. [Google Scholar] [CrossRef]
- Yang, B.; Jang, J.G. Environmentally benign production of one-part alkali-activated slag with calcined oyster shell as an activator. Constr. Build. Mater. 2020, 257, 119552. [Google Scholar] [CrossRef]
- Ercikdi, B.; Külekci, G.; Yılmaz, T. Utilization of granulated marble wastes and waste bricks as mineral admixture in cemented paste backfill of sulphide-rich tailings. Constr. Build. Mater. 2015, 93, 573–583. [Google Scholar] [CrossRef]
- Yilmaz, T.; Ercikdi, B.; Deveci, H. Utilisation of construction and demolition waste as cemented paste backfill material for underground mine openings. J. Environ. Manag. 2018, 222, 250–259. [Google Scholar] [CrossRef]
- Yilmaz, T.; Ercikdi, B.; Cihangir, F. Evaluation of the neutralization performances of the industrial waste products (IWPs) in sulphide-rich environment of cemented paste backfill. J. Environ. Manag. 2020, 258, 110037. [Google Scholar] [CrossRef]
- Liu, L.; Xin, J.; Huan, C.; Qi, C.; Zhou, W.; Song, K.-I. Pore and strength characteristics of cemented paste backfill using sulphide tailings: Effect of sulphur content. Constr. Build. Mater. 2020, 237, 117452. [Google Scholar] [CrossRef]
- Yin, S.; Wu, A.; Hu, K.; Wang, Y.; Zhang, Y. The effect of solid components on the rheological and mechanical properties of cemented paste backfill. Miner. Eng. 2012, 35, 61–66. [Google Scholar] [CrossRef]
- Qiu, J.; Guo, Z.; Yang, L.; Jiang, H.; Zhao, Y. Effects of packing density and water film thickness on the fluidity behaviour of cemented paste backfill. Powder Technol. 2020, 359, 27–35. [Google Scholar] [CrossRef]
- Qiu, J.; Guo, Z.; Yang, L.; Jiang, H.; Zhao, Y. Effect of tailings fineness on flow, strength, ultrasonic and microstructure characteristics of cemented paste backfill. Constr. Build. Mater. 2020, 263, 120645. [Google Scholar] [CrossRef]
- Chen, Q.; Tao, Y.; Zhang, Q.; Qi, C. The rheological, mechanical and heavy metal leaching properties of cemented paste backfill under the influence of anionic polyacrylamide. Chemosphere 2022, 286 Pt 1, 131630. [Google Scholar] [CrossRef] [PubMed]
- Zhang, Q.-L.; Li, Y.-T.; Chen, Q.-S.; Liu, Y.-K.; Feng, Y.; Wang, D.-L. Effects of temperatures and pH values on rheological properties of cemented paste backfill. J. Cent. South. Univ. 2021, 28, 1707–1723. [Google Scholar] [CrossRef]
- Zhao, K.; Yu, X.; Zhu, S.; Yan, Y.; Zhou, Y.; He, Z.; Song, Y.; Huang, M. Acoustic emission fractal characteristics and mechanical damage mechanism of cemented paste backfill prepared with tantalum niobium mine tailings. Constr. Build. Mater. 2020, 258, 119720. [Google Scholar] [CrossRef]
- Zhang, S.; Ren, F.; Zhao, Y.; Qiu, J.; Guo, Z. The effect of stone waste on the properties of cemented paste backfill using alkali-activated slag as binder. Constr. Build. Mater. 2021, 283, 122686. [Google Scholar] [CrossRef]
- Jiang, H.; Qi, Z.; Yilmaz, E.; Han, J.; Qiu, J.; Dong, C. Effectiveness of alkali-activated slag as alternative binder on workability and early age compressive strength of cemented paste backfills. Constr. Build. Mater. 2019, 218, 689–700. [Google Scholar] [CrossRef]
- Sun, Q.; Tian, S.; Sun, Q.; Li, B.; Cai, C.; Xia, Y.; Wei, X.; Mu, Q. Preparation and microstructure of fly ash geopolymer paste backfill material. J. Clean. Prod. 2019, 225, 376–390. [Google Scholar] [CrossRef]
- Chen, Q.; Tao, Y.; Feng, Y.; Zhang, Q.; Liu, Y. Utilization of modified copper slag activated by Na2SO4 and CaO for unclassified lead/zinc mine tailings based cemented paste backfill. J. Environ. Manag. 2021, 290, 112608. [Google Scholar] [CrossRef]
- Cihangir, F.; Ercikdi, B.; Kesimal, A.; Deveci, H.; Erdemir, F. Paste backfill of high-sulphide mill tailings using alkali-activated blast furnace slag: Effect of activator nature, concentration and slag properties. Miner. Eng. 2015, 83, 117–127. [Google Scholar] [CrossRef]
- Lemougna, P.N.; Wang, K.-T.; Tang, Q.; Cui, X.-M. Study on the development of inorganic polymers from red mud and slag system: Application in mortar and lightweight materials. Constr. Build. Mater. 2017, 156, 486–495. [Google Scholar] [CrossRef]
- Standard Practice for Making and Curing Concrete Test Specimens in the Field. Available online: https://dot.ca.gov/-/media/dot-media/programs/construction/documents/policies-procedures-publications/cpd/cpd20-2-attachment-3-astm-c31-c31m-19.pdf (accessed on 20 October 2021).
- ASTM. Standard Test Method for Compressive Strength of Cylindrical Concrete Specimens; ASTM: West Conshohocken, PA, USA, 2009. [Google Scholar]
- ISO 1920-2:2016; Testing of Concrete—Part 2: Properties of Fresh Concrete. ISO: Geneva, Switzerland, 1920.
- ASTM. Standard Test Method for Density (Unit Weight), Yield, and Air Content (Gravimetric); ASTM: West Conshohocken, PA, USA, 2001. [Google Scholar]
- Nemeth, M.A. Response Surface Methodology: Process and Product Optimization Using Designed Experiments. J. Qual. Technol. 2003, 35, 428–429. [Google Scholar] [CrossRef]
- Bian, Q.; Nener, B.; Wang, X. A quantum inspired genetic algorithm for multimodal optimization of wind disturbance alleviation flight control system. Chin. J. Aeronaut. 2019, 32, 2480–2488. [Google Scholar] [CrossRef]
- Yza, B.; Jqa, B.; Sza, B.; Zga, B.; Zma, B.; Xsa, B.; Jxa, B. Effect of sodium sulfate on the hydration and mechanical properties of lime-slag based eco-friendly binders. Constr. Build. Mater. 2020, 250, 118603. [Google Scholar]
- Bobirica, C.; Orbeci, C.; Bobirica, L.; Palade, P.; Deleanu, C.; Pantilimon, C.M.; Pirvu, C.; Radu, I.C. Influence of red mud and waste glass on the microstructure, strength, and leaching behavior of bottom ash-based geopolymer composites. Sci Rep. 2020, 10, 19827. [Google Scholar] [CrossRef] [PubMed]
- Sun, Q.; Wei, X.; Li, T.; Zhang, L. Strengthening Behavior of Cemented Paste Backfill Using Alkali-Activated Slag Binders and Bottom Ash Based on the Response Surface Method. Materials 2020, 13, 855. [Google Scholar] [CrossRef] [Green Version]
- Chen, C.; Li, X.; Chen, X.; Chai, J.; Tian, H. Development of cemented paste backfill based on the addition of three mineral additions using the mixture design modeling approach. Constr. Build. Mater. 2019, 229, 116919. [Google Scholar] [CrossRef]


| Materials | CaO | SiO2 | Al2O3 | MgO | Fe2O3 | SO3 | Na2O | TiO2 | LOI | Others |
|---|---|---|---|---|---|---|---|---|---|---|
| COS | 95.71 | 0.21 | 0.06 | 0.29 | 0.05 | 0.75 | 0.99 | -- | 1.10 | 0.84 |
| RM | 2.52 | 8.99 | 18.50 | 0.15 | 48.24 | 0.33 | 8.18 | 8.18 | 3.50 | 1.41 |
| Slag | 33.13 | 30.21 | 19.38 | 10.19 | 0.21 | 2.03 | 0.52 | 0.97 | 2.90 | 0.46 |
| IOT | 5.68 | 40.87 | 13.16 | 4.82 | 17.00 | 0.54 | 3.98 | -- | 11.9 | 2.05 |
| Factor | Code | Unit | Level | ||||
|---|---|---|---|---|---|---|---|
| −2 | −1 | 0 | 1 | 2 | |||
| COS dosage | A | % | 10 | 12.5 | 15 | 17.5 | 20 |
| RM substitution rate | B | % | 5 | 10 | 15 | 20 | 25 |
| Solid mass | C | % | 81 | 82 | 83 | 84 | 85 |
| Aggregate-binder ratio | D | - | 3.5 | 4.0 | 4.5 | 5.0 | 5.5 |
| Materials | COS | Slag | Water |
|---|---|---|---|
| Unit price (USD/kg) | 0.0047 | 0.0137 | 0.000665 |
| Term | 28-dUCS (MPa) | Slump (mm) | Cost (USD/m3) |
|---|---|---|---|
| Experimental | 5.26 | 202 | 4.16 |
| Predicted | 5.24 | 200 | 4.15 |
| 1 Days | 3 Days | 7 Days | 14 Days | 28 Days | |
|---|---|---|---|---|---|
| Quartz | 34.4 | 17.8 | 12.7 | 32.5 | 23.6 |
| Albite | 18.3 | 30.8 | 35.0 | 34.0 | 33.2 |
| Calcite | 7.8 | 9.0 | 10.2 | 11.9 | 17.6 |
| Kaolinite | 17.2 | 13.3 | 3.9 | 3.9 | 2.1 |
| Actinolite | 22.3 | 29.1 | 38.3 | 17.7 | -- |
| Foshagite | -- | -- | -- | -- | 23.6 |
Publisher’s Note: MDPI stays neutral with regard to jurisdictional claims in published maps and institutional affiliations. |
© 2022 by the authors. Licensee MDPI, Basel, Switzerland. This article is an open access article distributed under the terms and conditions of the Creative Commons Attribution (CC BY) license (https://creativecommons.org/licenses/by/4.0/).
Share and Cite
Lu, H.; Sun, Q. Preparation and Strength Formation Mechanism of Calcined Oyster Shell, Red Mud, Slag, and Iron Tailing Composite Cemented Paste Backfill. Materials 2022, 15, 2199. https://doi.org/10.3390/ma15062199
Lu H, Sun Q. Preparation and Strength Formation Mechanism of Calcined Oyster Shell, Red Mud, Slag, and Iron Tailing Composite Cemented Paste Backfill. Materials. 2022; 15(6):2199. https://doi.org/10.3390/ma15062199
Chicago/Turabian StyleLu, Hongxu, and Qi Sun. 2022. "Preparation and Strength Formation Mechanism of Calcined Oyster Shell, Red Mud, Slag, and Iron Tailing Composite Cemented Paste Backfill" Materials 15, no. 6: 2199. https://doi.org/10.3390/ma15062199
APA StyleLu, H., & Sun, Q. (2022). Preparation and Strength Formation Mechanism of Calcined Oyster Shell, Red Mud, Slag, and Iron Tailing Composite Cemented Paste Backfill. Materials, 15(6), 2199. https://doi.org/10.3390/ma15062199