Article

Third-Generation Thermodynamic Descriptions for Ta-Cr and Ta-V Binary Systems

1
School of Materials Science and Engineering, Hebei University of Technology, Tianjin 300130, China
2
Department of Mechanical and Electrical Engineering, Xiamen University, Xiamen 361005, China
*
Author to whom correspondence should be addressed.
Materials 2022, 15(6), 2074; https://doi.org/10.3390/ma15062074
Submission received: 30 November 2021 / Revised: 25 January 2022 / Accepted: 2 February 2022 / Published: 11 March 2022
(This article belongs to the Special Issue Light Alloys and High-Temperature Alloys)

Abstract

:
The third-generation thermodynamic descriptions for Ta-Cr and Ta-V binary systems were performed to construct the reliable thermodynamic database for refractory high-entropy alloys (RHEAs) containing Laves phase. The third-generation Gibbs energy expressions of pure Cr and V in both solid and liquid phases were established, from which the thermodynamic properties and thermal vacancy can be well described. The thermodynamic descriptions of Ta-Cr and Ta-V over the whole composition and temperature regions were carried out based on the reviewed phase equilibria and thermodynamic data with the CALPHAD (CALculation of PHAse Diagrams) approach. Specifically, the thermodynamic parameters of C14 and C15 Laves phases were evaluated by combining the theoretically computed and experimentally measured thermodynamic properties as well as the semiempirical relations. The calculated phase diagrams and thermodynamic properties in Ta-Cr and Ta-V systems according to the present thermodynamic parameters had a nice agreement with the experimental data even down to 0 K, indicating the reliability of the present modeling.

1. Introduction

Refractory high-entropy alloys (RHEAs) demonstrate excellent mechanical properties as well as good corrosion resistance and oxidation resistance up to 1600 °C, making them considerable candidates for high-temperature applications [1,2,3,4]. Generally, RHEAs contain refractory elements and form a single solid solution phase with a body-centered cubic (BCC, A2) structure. The addition of the elements, such as Cr and V, which have strong interactions with other refractory elements, can contribute to the formation of Laves phases in RHEAs [5,6,7]. With a minor amount of precipitated Laves phase in A2 solution, the strength of RHEAs can be significantly improved [6,7]. To identify the precipitation of Laves phase in RHEAs, varieties of empirical criteria have been proposed [8,9,10]. With the rapid development of a computational approach, the process of identifying the formation of Laves phase in RHEAs can be sped up to meet unique requirements. Of varied computational methods, the CALPHAD (CALculation of PHAse Diagrams) approach, which can calculate the phase equilibrium in multicomponent alloys, is one of the most powerful methods for Laves phases containing RHEA design and selection [11,12,13]. An accurate thermodynamic database is the prerequisite in CALPHAD-type calculations.
To develop an accurate thermodynamic database over the whole temperature region with physical sense, the concept of a third-generation thermodynamic database has been proposed since 1995 [14]. Under this framework, several research groups [14,15,16,17,18,19] have made efforts to establish new thermodynamic models for pure elements by using the Debye or Einstein models. Recently, a kind of third-generation thermodynamic model [13], which enables one to describe the thermodynamic properties of pure elements down to 0 K as well as thermal vacancy concentration near the melting point, has been proposed by combining the Segmented Regression (SR) model [15], two-state model [20] and thermal vacancy description [18]. By applying such a model, a third-generation thermodynamic database for MoNbTaW RHEAs was developed [13]. To further develop the third-generation thermodynamic databases for Laves containing RHEAs, reliable thermodynamic descriptions for Laves phase are essential. Currently, the reports on third-generation thermodynamic descriptions of Laves phase are rather limited in the literature. Jiang et al. [21,22] established the third-generation Gibbs energy of Laves phase in the Ta-Cr and Cr-Nb systems by considering the experimental heat capacity data with the SR model. Contrastingly, such a strategy was not valid for those systems when the heat capacity data of Laves phase were absent. Thus, a universal strategy to obtain thermodynamic description for Laves phase is needed.
In this work, the Ta-Cr and Ta-V systems that contain the hexagonal C14 (MgZn2-type) and cubic C15 (MgCu2-type) Laves phases are selected as the target. Following our previous work [13], the third-generation Gibbs energy expressions of pure Cr and V will be established first. Then, the experimental phase equilibrium and thermodynamic properties in Ta-Cr and Ta-V systems will be reviewed and their discrepancies will be clarified. After that, a universal strategy to obtain reliable thermodynamic parameters in Laves phase will be proposed, and the thermodynamic modeling of the Ta-Cr and Ta-V binary systems will be performed via the CALPHAD approach.

2. Thermodynamic Model

There are four stable phases (i.e., liquid, A2, C14, C15) in Ta-Cr and Ta-V binary systems. The liquid and A2 are the solution phases, while C14 and C15 are the Laves phase. Their thermodynamic models are briefly introduced as follows.

2.1. A2 and Liquid Solution Phases

To describe the thermal vacancy contribution in the A2 phase, the substitutional model (i, j, Va), where Va denotes thermal vacancy, was used. The molar Gibbs energy of the A2 phase is as follows:
G m A 2 = x i G i A 2 , d f + x j G j A 2 , d f + y v a 1 y v a G v a + R T ( x i ln x i + x j ln x j + y v a 1 y v a ln y v a ) + ( 1 y v a ) x i x j n = 0 L i , j A 2 n ( x i x j ) n + 1 1 y v a ( x i y v a L i , v a A 2 + x j y v a L j , v a A 2 )
where R and T are the gas constant and absolute temperature, x i is the mole fraction of element i, and y v a is the thermal vacancy concentration. L i , j is the interaction parameter between the elements i and j, and L i , V a is the one between the element i and thermal vacancy. G v a represents the Gibbs energy of thermal vacancy in the A2 phase. G i A 2 ,   d f in Equation (1) is the molar Gibbs energy of the defect-free element i, the expression of which will be developed by using the SR model [15]. For the liquid phase, its molar Gibbs energy expression is similar to that of the A2 phase but excludes the contribution from the thermal vacancy (to make yva = 0 in Equation (1)). The Gibbs energy of pure element in a liquid state will be established by applying the two-state model [20].

2.2. C14 and C15 Laves Phases

A two-sublattice model (i, j)2 (i, j) was employed to describe the solid solubility in C14 and C15 phases. Take the C15 phase in Ta-Cr binary, for example; its molar Gibbs energy is given as follows:
G C 15 = G 0 C r : T a C 15 y C r y T a + G 0 C r : C r C 15 y Cr y C r + G 0 T a : T a C 15 y T a y T a + G 0 T a : C r C 15 y T a y C r + 2 R T ( y C r ln y C r + y T a ln y T a ) + R T ( y C r ln y C r + y T a ln y T a ) + y C r y C r y T a L 0 C r : C r , T a C 15 + y T a y C r y T a L 0 T a : C r , T a C 15 + y C r y T a y C r L 0 C r , T a : C r C 15 + y C r y T a y T a L 0 C r , T a : T a C 15
where y i and y i denote the site fractions in the first and second sublattice of element i. G 0 i : j C 15 is the end-member Gibbs energy when the first sublattice is occupied by i while the second sublattice is occupied by j. Its expression is given as
G 0 i : j C 15 = A + B T + 2 G i A 2 , def + G j A 2 , def
where A and B are the coefficients to be optimized. L 0 C r : i . j C 15 and L 0 T a : i . j C 15 are the interaction parameters between i and j in the second sublattice when the first is occupied by Cr or Ta. Similarly, L 0 i . j : C r C 15 and L 0 i . j : T a C 15 represent the interaction parameters between i and j in the first sublattice when the second sublattice is occupied by Cr or Ta, which are all also needed to be determined during the thermodynamic assessment.

3. Results

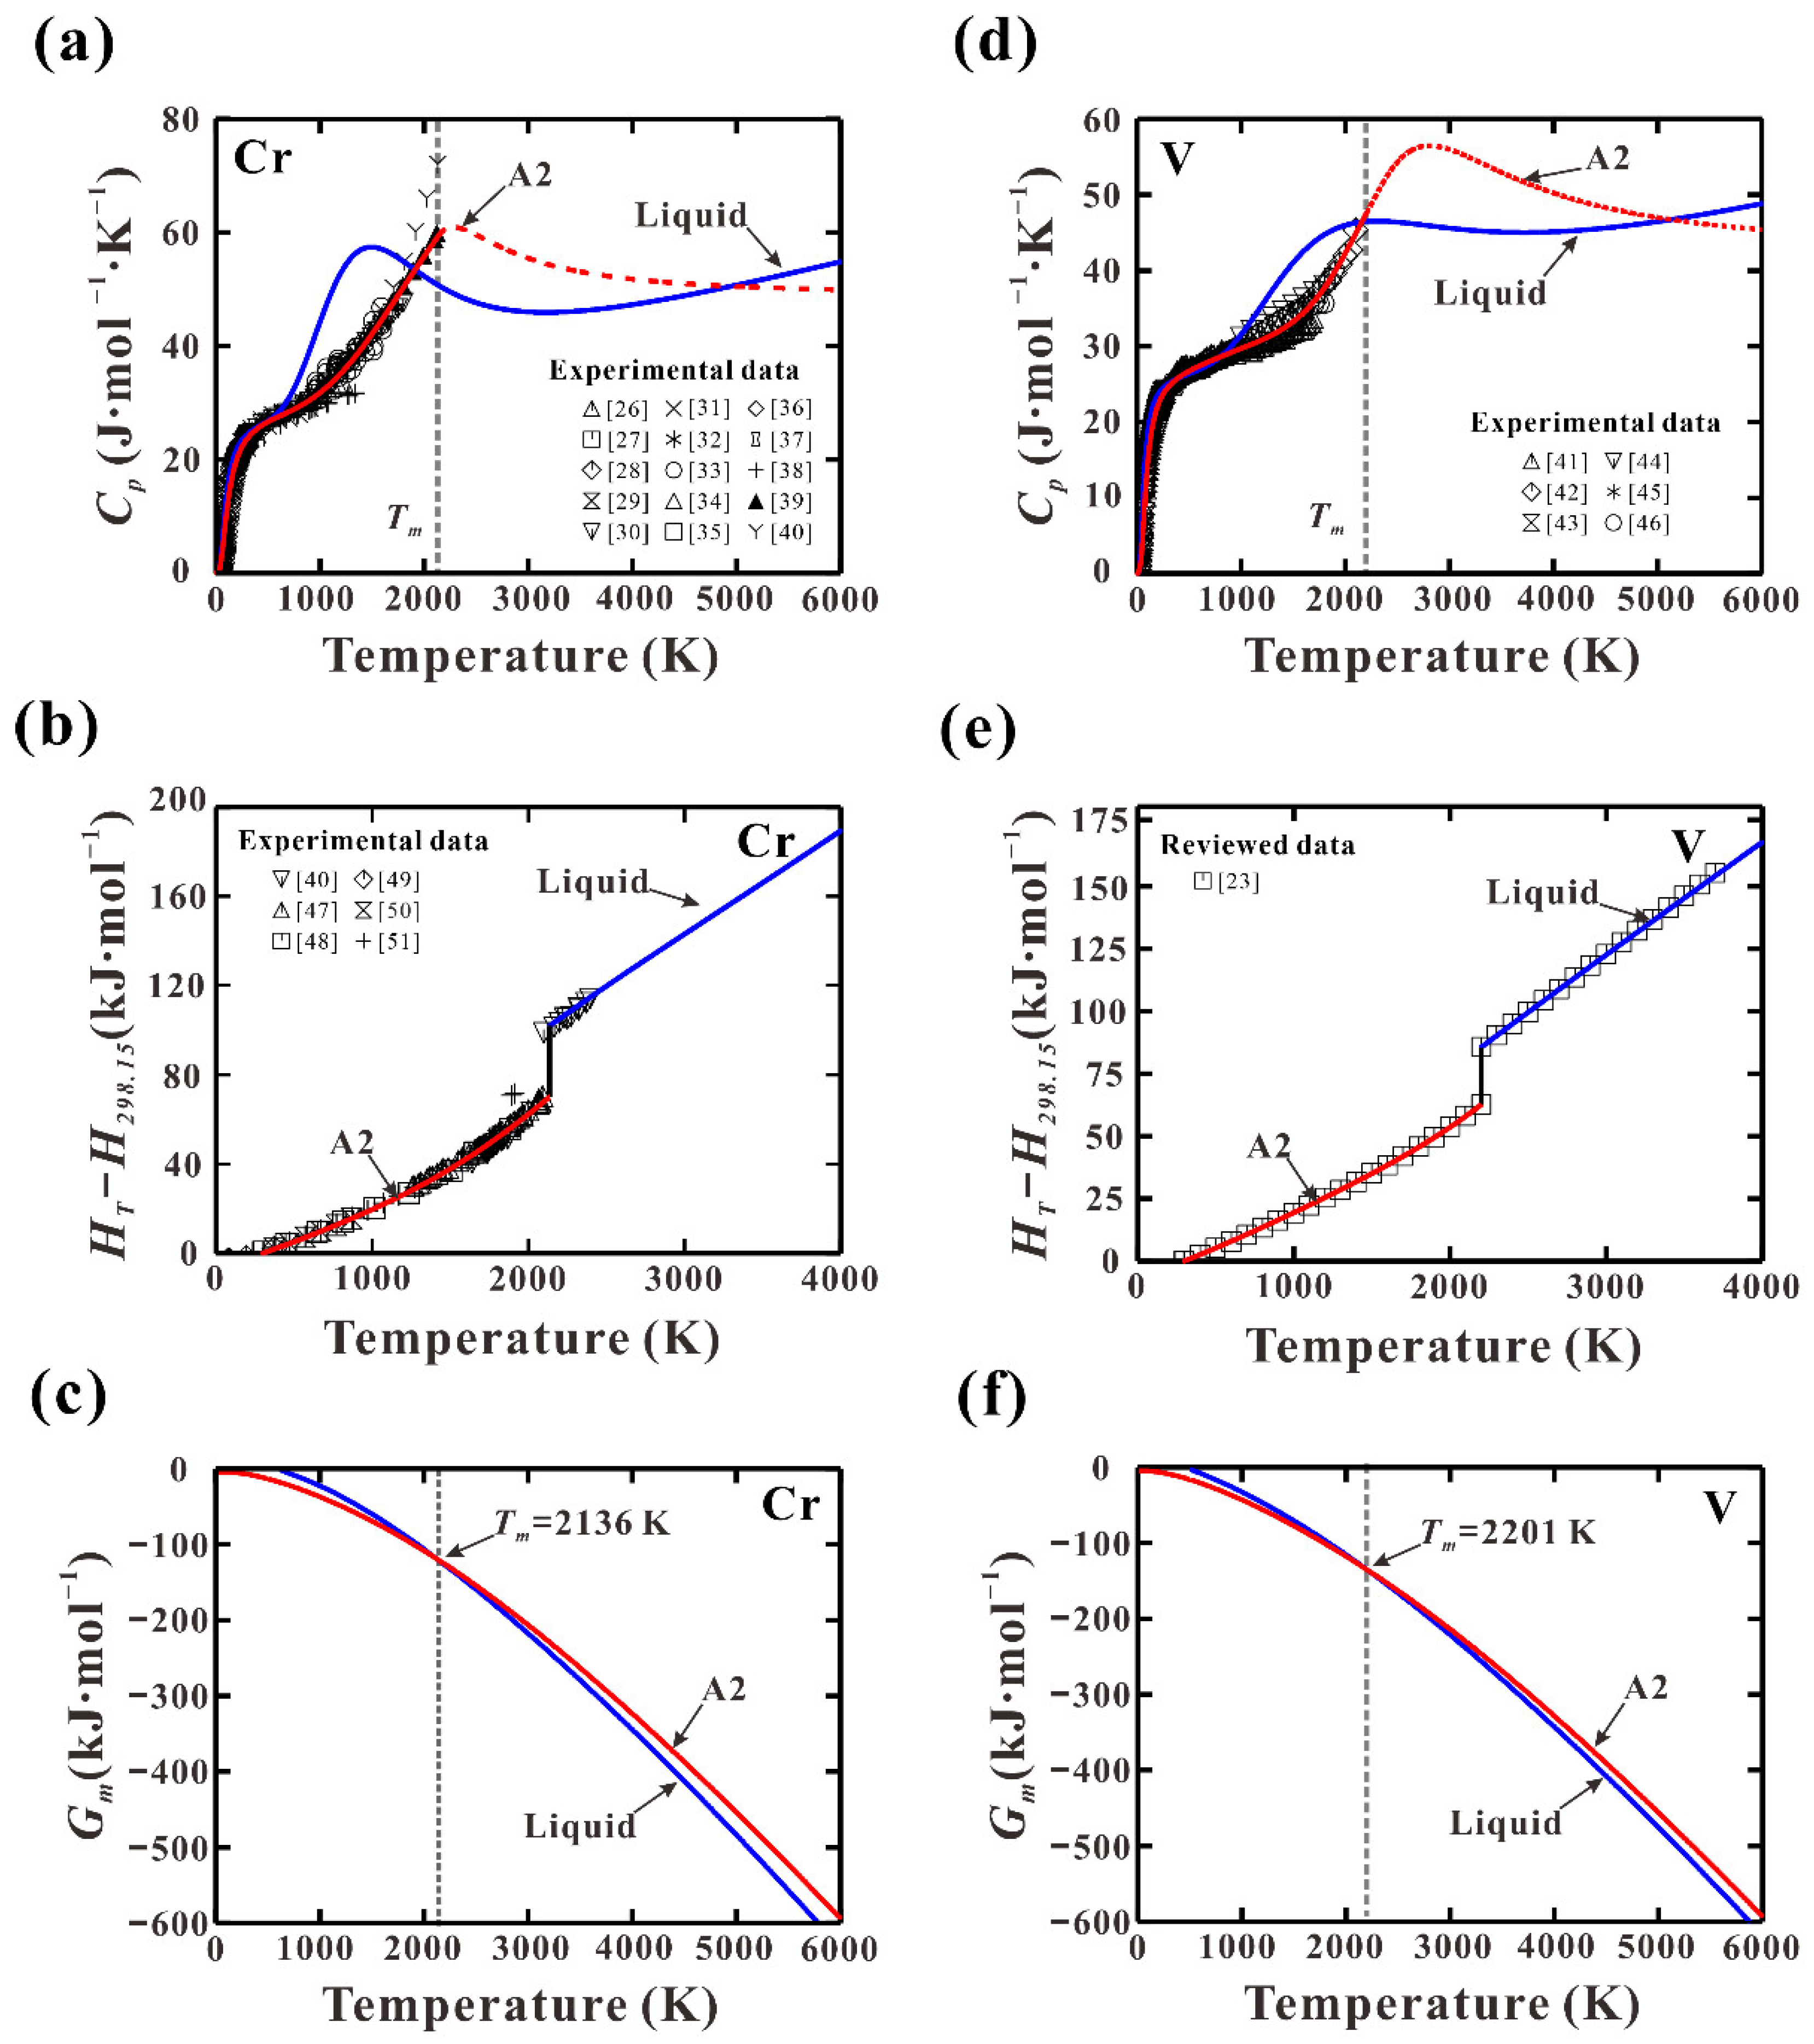
3.1. The Third-Generation Gibbs Energy Expressions for Pure Cr and V

The reliable thermodynamic properties of pure Cr and V are the essential inputs to establish their Gibbs energy expressions. Recently, the measured thermodynamic properties including heat capacity (Cp), heat content (HTH298), enthalpy of fusion for pure Cr and V have been collected and reviewed by Obaied et al. [19] and Arblaster [23], respectively. The discrepancies of the measured data from different resources have been clearly clarified by them. Therefore, the reviewed thermodynamic properties are adopted in the present modeling. In addition, the thermal vacancy concentrations in pure Cr and V at their melting temperature were experimentally investigated by means of modulation and drop methods [24,25]. It is generally accepted that the effects of thermal vacancy on thermodynamic properties will become obvious with the temperature above 2/3Tm [18]. Thus, the expressions of defect-free Gibbs energy expressions ( G i A 2 , d f ) in Equation (1) of pure Cr and V in their solid stable states (below Tm) were evaluated by fitting the experimental heat capacity from 0 K to 2/3Tm. As for the expressions above Tm, the strategy making C p and d C p / d T curves continue at Tm was used. Then, the interaction parameter L i , V a was evaluated by considering the thermodynamic properties above 2/3Tm as well as the thermal vacancy concentration at melting point. The Gibbs energy of the A2 phase with thermal vacancy over the whole temperature range for Cr and V can be evaluated by combining the estimated G i A 2 , d f and L i , V a .The molar Gibbs energies of pure Cr and V in a liquid state were obtained with a two-state model by considering the experimental entropy, enthalpy and heat capacity at and above Tm. The finally obtained third-generation Gibbs energies for solid and liquid Cr and V are listed in Table 1.
Figure 1a,d show the calculated Cp of pure Cr and V in their solid A2 and liquid states. The experimental Cp data [26,27,28,29,30,31,32,33,34,35,36,37,38,39,40,41,42,43,44,45,46] are also appended in the figure for comparison, showing a nice agreement with present calculations. Figure 1b,d show the calculated HT-H298 of pure Cr and V from 298 to 4000 K together with the reported data [23,47,48,49,50,51]. An excellent agreement can be observed. The Gibbs energies of solid A2 and liquid phases in pure Cr and V from 0 K to 6000 K were calculated and displayed in Figure 1c,f, revealing the lattice stability over the whole temperature range.
With the present established Gibbs energies, the thermal vacancy can be the equilibrium concentration of thermal vacancy in pure Cr, and V can be predicted by the following relation [18]:
y v a = exp ( G i A 2 , d f + L i , v a A 2 ( 1 y v a ) 2 R T )
Figure 2 shows the calculated thermal vacancy concentrations in solid Cr and V. As can be seen, the thermal vacancy concentrations increase with the increase in temperatures, and a dramatic increase can be observed near the melting points. Besides, the present predicted thermal vacancy concentrations are in good agreement with those from measurements [24,25] at melting points. The above results indicate the reliability of the established third-generation Gibbs energies for pure Cr and V.

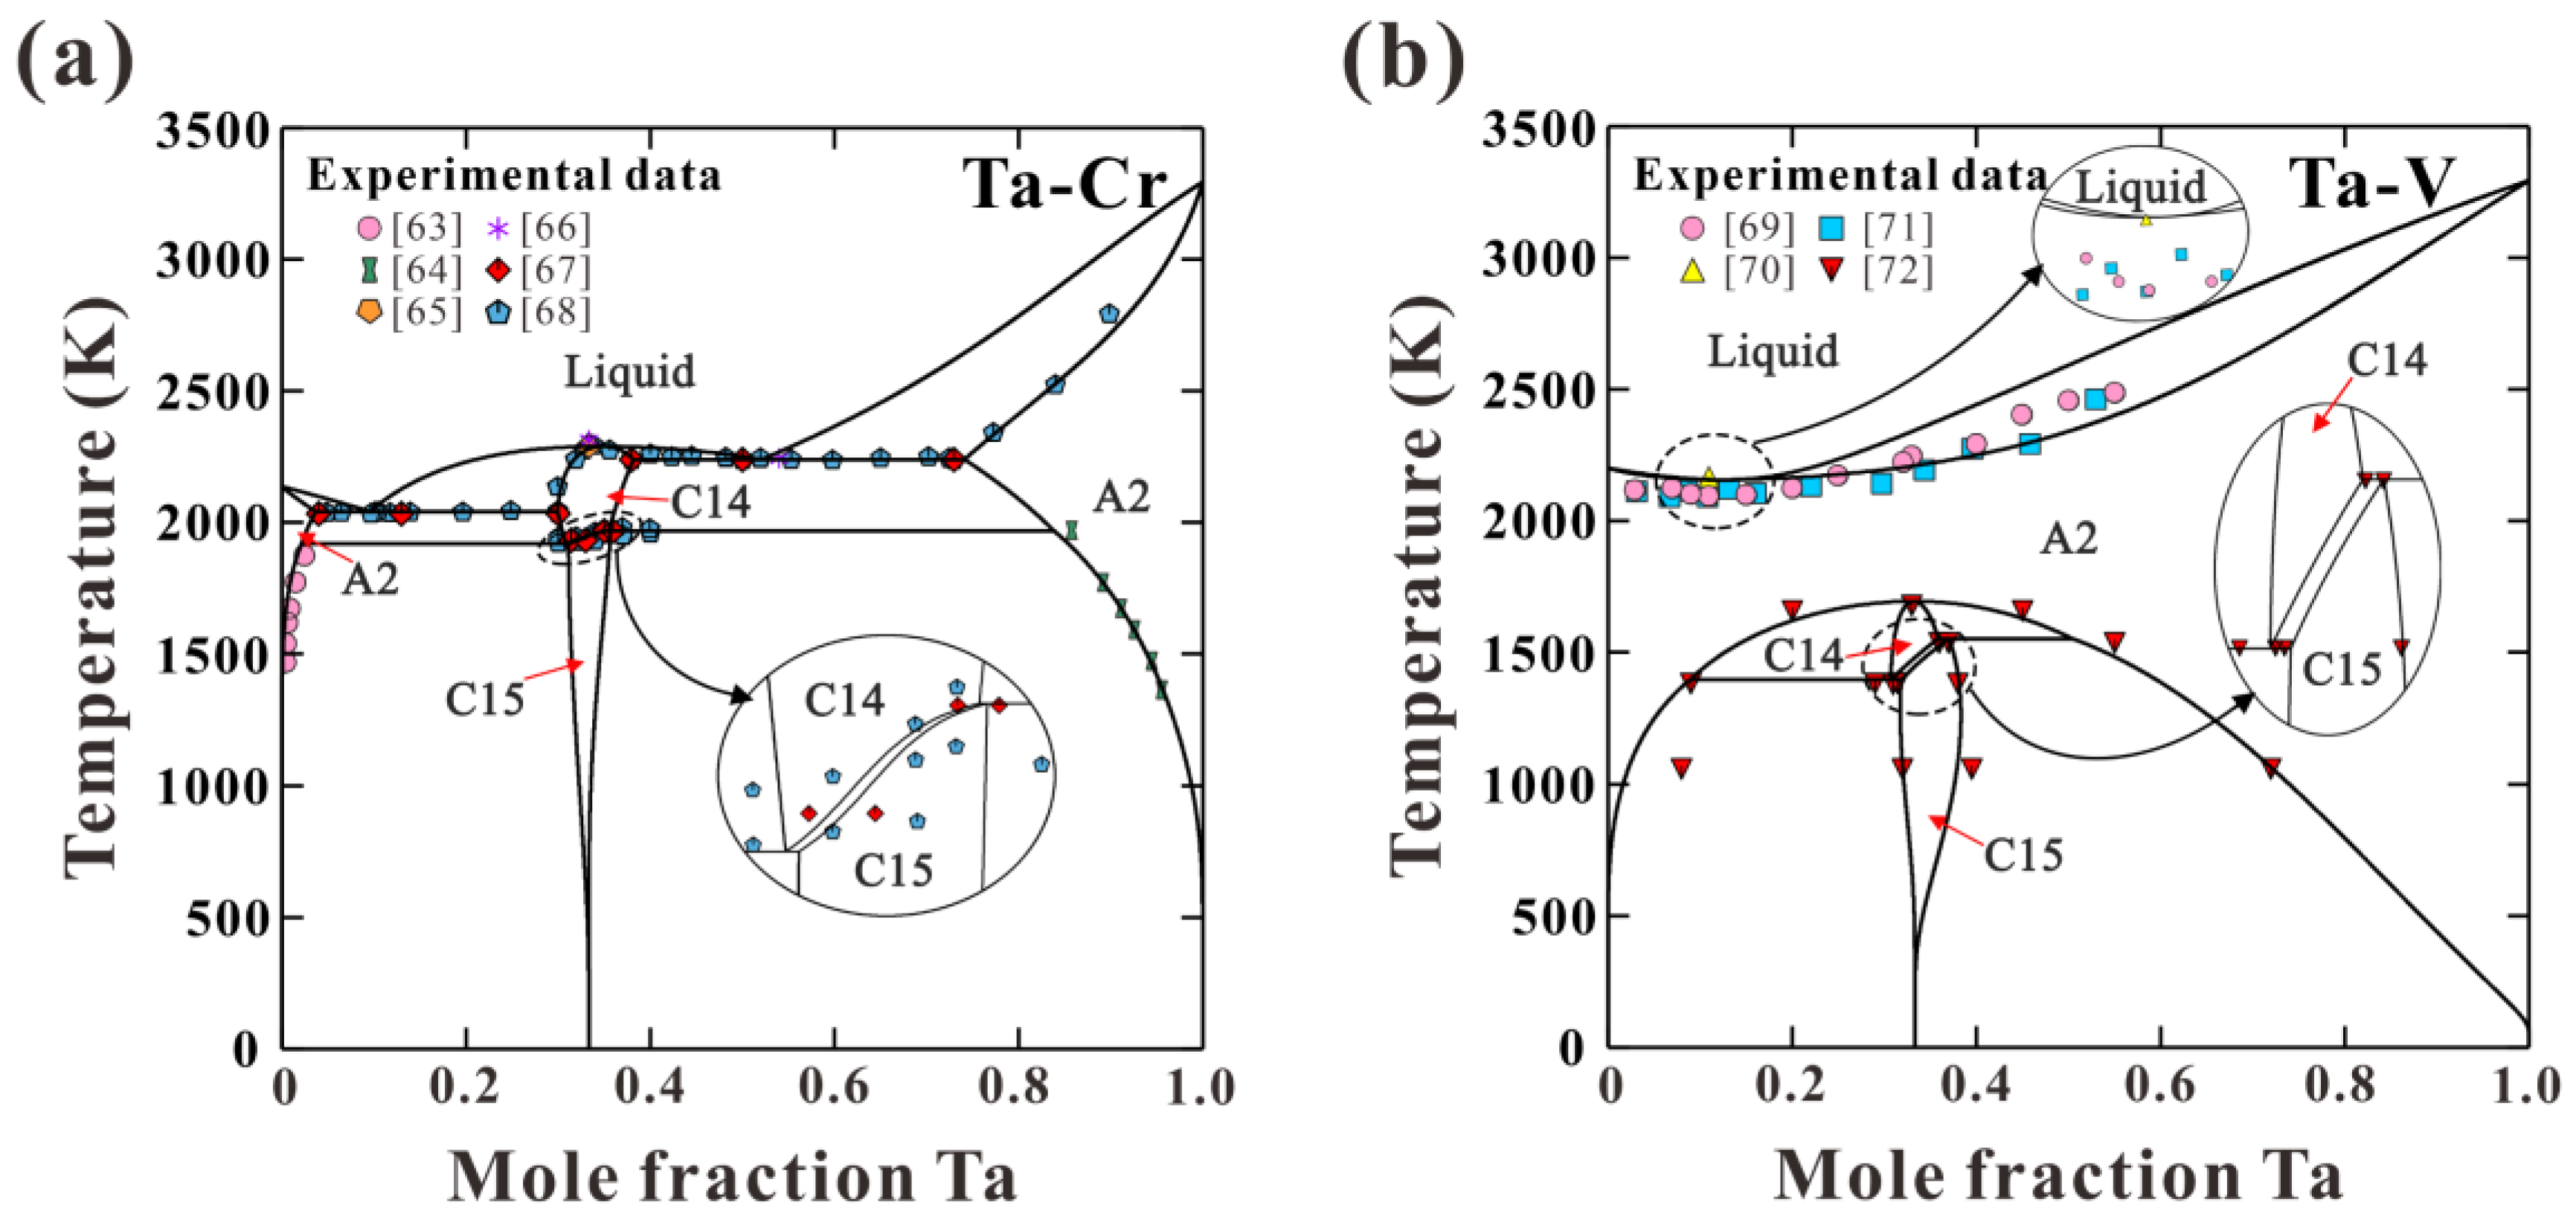
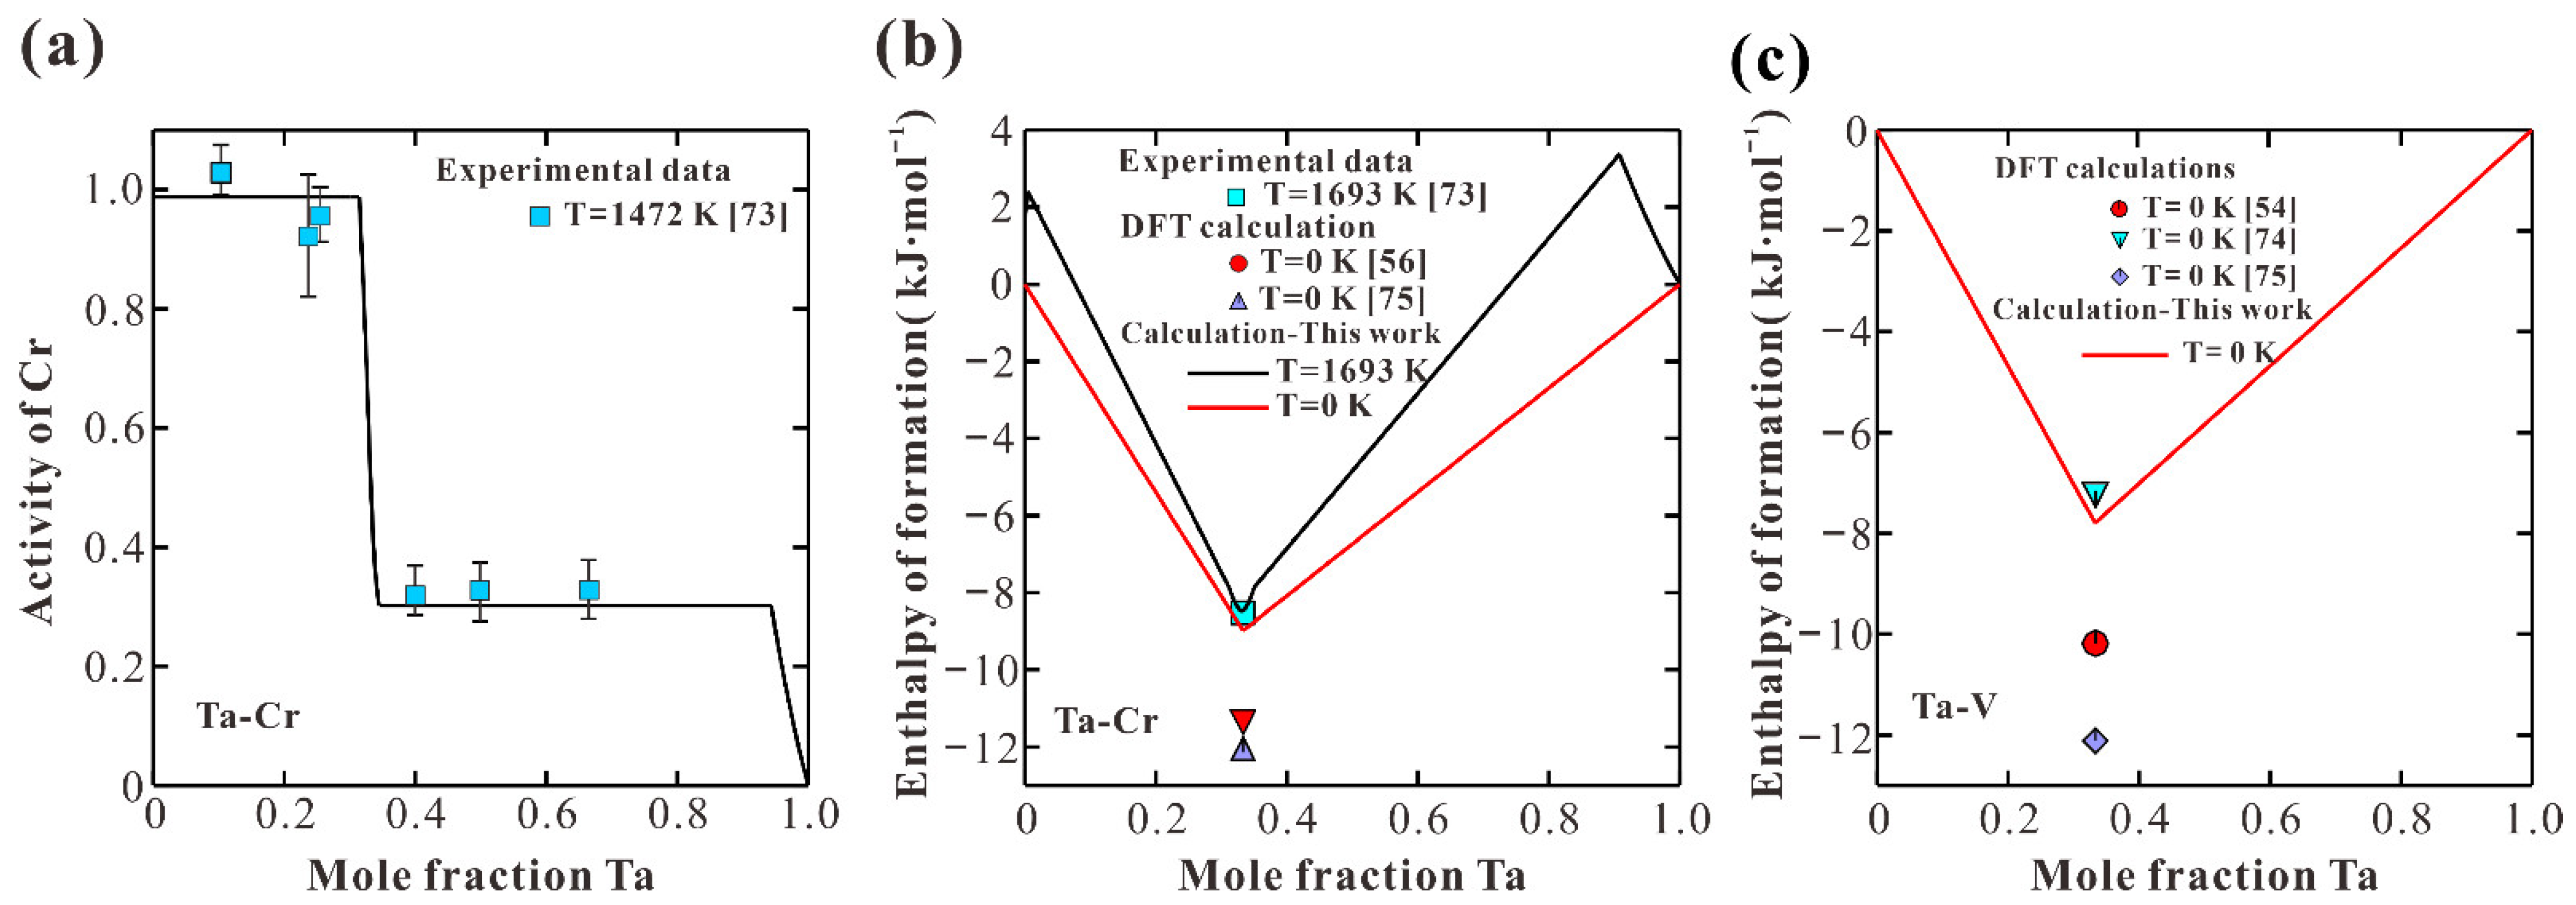
3.2. Thermodynamic Descriptions of Ta-Cr and Ta-V Binary Systems

Ta-Cr and Ta-V binary systems were thermodynamically assessed by several research groups [52,53,54,55,56]. In these thermodynamic modeling, the Gibbs energy of pure elements were taken from SGTE (Scientific Group Thermodata Europe) data [57], which is also known as the second generation of thermodynamic description. In this description, the Gibbs energy was expressed as empirical temperature polynomials and valid only down to 298 K. In this section, the Ta-Cr and Ta-V binary systems were thermodynamically re-assessed by utilizing the above established third-generation Gibbs energy expressions for pure Cr and V as well as those for Ta from our previous work [13]. In addition, an effective strategy to obtain Gibbs energy for Laves phase was proposed and applied to C14 and C15 Laves phases in Ta-Cr and Ta-V systems.
Since the experimental phase equilibrium and thermodynamic properties in the Ta-Cr binary system have been recently reviewed by Jiang et al. [22], their reviewed data were adopted in the present modeling. As for the Ta-V binary system, most of the reported data have been reviewed by Danon and Servant [55] (2004). Thus, only the latest experimental data in the Ta-V binary system available in the literature will be briefly summarized and their discrepancies will be clarified. The greatest controversy in the Ta-V binary system is focused on the phase transition between C14 and C15 Laves phases. By reviewing the existing experimental data, Danon and Servant [55] concluded that C14 existed at a high temperature, while C15 existed at a low temperature, and there was a narrow (C15 + C14) two-phase region from 1400 to 1548 K. In addition, the eutectoid (C14 → C15+A2) and peritectoid (C14 + A2 → C15) reactions can be found in the V-rich and Ta-rich sides. After that, Pavlů et al. [56] pointed out that the C14 phase was more stable than C15 at 0 K based on their ab initio calculations. Thus, in their thermodynamic modeling, the C14 existed in two temperature regions, that is, from 0 to 626 K and from 1409 to 1703 K. Later, the measurements from Khan et al. [58] indicated that C14 was not found in four Ta-V alloys, which were annealed at 1473 K for 15 days. However, the recent phase equilibrium investigations in ternary Ta-V-Ni [59] and Ta-V-Co [60] systems displayed that the C14 phase existed in the Ta-V side at 1473 and 1573 K but was not found at 1173, 1273 and 1373 K after long-time annealing. Since no further experimental data confirm the existence of C14 below 626 K, as proposed by Pavlů et al. [56], the phase relationship between C14 and C15 recommended by Danon and Servant [55] was adopted in the present modeling.
During the thermodynamic modeling, the interaction parameters of the liquid and A2 phases were evaluated by considering the liquidus, solidus temperatures and invariant reactions. To obtain accurate thermodynamic descriptions for C14 and C15 Laves phases, the values of end-members in Equation (2) should be fixed initially. In this work, the values of G 0 C r : T a and G 0 V : T a were evaluated by considering the experimental thermodynamic properties referenced to Cr2Ta and V2Ta alloys, which generally locate in the stable C14 or C15 phase region. The endmembers G 0 C r : C r , G 0 T a : T a and G 0 V : V are the Gibbs energies of pure elements with MgZn2-type (C14) and MgCu2-type (C15) crystal structures, which are the metastable ones, and their values cannot be directly obtained from the experimental investigation. Sluiter [61] computed the formation energies of a great deal of pure elements at 0 K in a variety of structures, including C14 and C15 by using electronic density functional theory (DFT). These theoretically predicted values can be served as start values for G 0 C r : C r , G 0 T a : T a and G 0 V : V . To satisfy the Wagner–Schottky defects, there should be a constraint among the end-members when applying the two-sublattice model, that is, G 0 i : i + G 0 j : j = G 0 i : j + G 0 j : i [62]. In the present work, the values of G 0 T a : C r and G 0 T a : V are obtained by applying the above constraint. The interaction parameters in C14 and C15 Laves phase were adjusted to reproduce the invariant reactions. The thermodynamic parameters of Ta-Cr and Ta-V binary systems are summarized in Table 2.
Figure 3 shows the calculated phase diagrams of Ta-Cr and Ta-V binary systems according to the present thermodynamic descriptions. It shows that most of the experimental data [63,64,65,66,67,68,69,70,71,72] can be well reproduced. There are two invariant reactions between C14 and C15 Laves phases in Ta-Cr system, including a eutectoid reaction C14 → A2(Cr) + C15 and a peritectoid reaction (C14 + A2(Ta) → C15), as shown in the enlarged area in Figure 3a. A similar phase transition between C14 and C15 Laves phases in the Ta-V system can be observed. There is an azeotropic melting point in the Ta-V binary system, as shown in Figure 3b. The composition and temperature of this azeotropic melting point were calculated to be 12.4 at.% Ta and 2156 K, which were close to the measured ones [68,69,70]. Table 3 summarizes the calculated compositions and temperatures of the invariant reactions in Ta-Cr and Ta-V systems together with those from measurements [67,68,69,70,71,72] and previous calculations [53,54,55,56]. The present calculations agree reasonably with most of the measured data. Besides, the present results are quite close to those from previous assessments [53,54,55,56]. Figure 4 (a) presents the calculated activity of Cr over the whole composition range in the Ta-Cr system at 1472 K compared with the experimental data [73]. As can be seen, the calculations are within the uncertainty range of the experimental data. Figure 4b shows the calculated enthalpy of formation in the Ta-Cr system at 0 and1693 K, and the measured data [73] and DFT calculations [54,56,73,74,75] are also appended for a comparison. The calculated enthalpy formation of the C15 phase at 1693 K has a nice agreement with that from measurement [73]. In addition, the calculated enthalpy of formation at 0 K is more negative than that at 1693 K. Figure 4c gives the calculated enthalpy formation in the Ta-V system at 0 K. Since the theoretically computed formation enthalpy in the C15 phase from different sources is rather scattered, the present calculated result is reasonable.
Figure 5 shows the calculated Cp of Cr2Ta and V2Ta alloys from 0 to 1400 K. Based on the present modeling, Cr2Ta and V2Ta alloys locate in the C15 single phase region below 1948.6 and 1446.7 K. Although the experimental Cp data were not considered during the modeling, the present calculations show a nice agreement with the reported data [76,77]. The calculations from previous thermodynamic assessments [52,53,54,55,56] are also presented in Figure 5 for a comparison. As shown in Figure 5a, the calculated Cp of Cr2Ta from [53,54] are quite close to the present calculated ones at high temperatures, while obvious deviations can be observed at low temperatures (below 298 K). The present calculations show better agreement with the measured ones. In addition, the values of Cp for Cr2Ta and V2Ta alloys, according to the previous assessments [53,54,55,56], decrease rapidly as the temperature decreases and become negative at 85 and 62 K, which is physically inaccurate. It also implies that the present thermodynamic description of C15 Laves phase in Ta-Cr and Ta-V binary systems is reliable. It is highly believed that the present strategy to establish the thermodynamic descriptions of Laves phase is reliable, which can be applied to develop the third-generation thermodynamic database for Laves phases containing RHEAs.

4. Conclusions

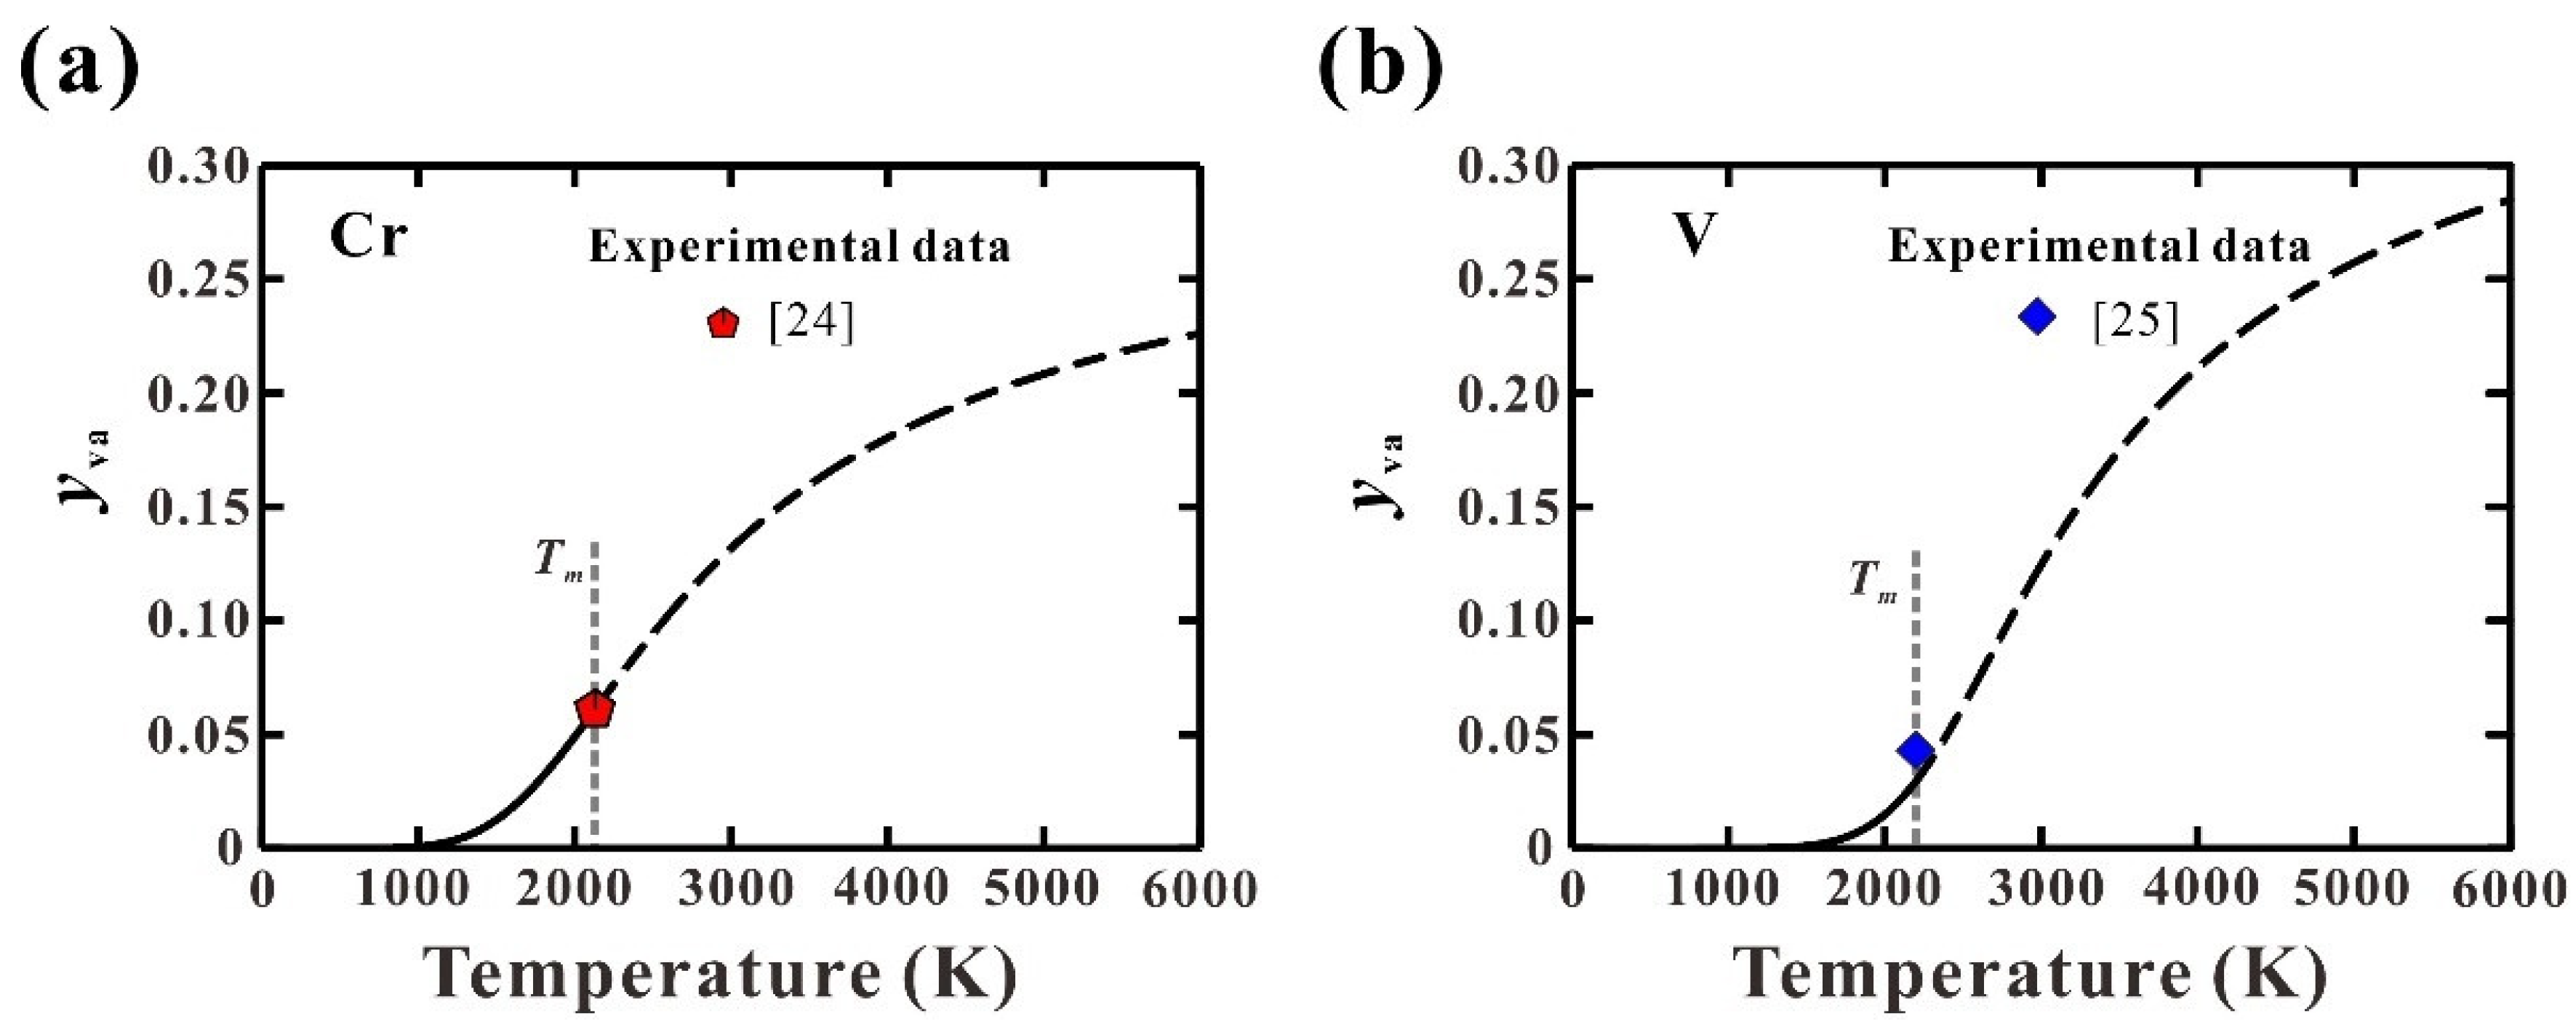
  • The third-generation Gibbs energy expressions of pure Cr and V in both the liquid and A2 phases were established. By applying these expressions, the thermodynamic properties down to 0 K and thermal vacancy near the melting point can be well described. Besides, the lattice stability of Cr and V over the whole temperature range can be guaranteed.
  • Based on the third-generation Gibbs energy expressions of pure elements, the Ta-Cr and Ta-V binary systems were thermodynamically assessed by considering the reviewed phase equilibria and thermodynamic data with the CALPHAD approach. A strategy to estimate the Gibbs energy of Laves phase was proposed by combining the theoretically computed and experimentally measured thermodynamic properties as well as semiempirical relation. Such a method was applied to C14 and C15 Laves phases in Ta-Cr and Ta-V binary systems. The calculated phase diagrams and thermodynamic properties showed nice agreement with the measured ones. Significant improvements can be observed at low temperatures compared with those from the second-generation thermodynamic descriptions, indicating the high reliability of the present thermodynamic descriptions.

Author Contributions

Methodology, Y.T.; validation, E.Z., Y.C. and X.X.; writing—original draft preparation, E.Z.; writing—review and editing, Y.T., X.X. and Y.C.; resources, Y.C. and X.X; supervision, Y.T.; funding acquisition, Y.T. All authors have read and agreed to the published version of the manuscript.

Funding

This research was funded by Natural Science Foundation of Hebei Province, China, grant number E2019202234, and National Joint Engineering Research Center for Abrasion Control and Molding of Metal Materials, grant number HKDNM2019019.

Institutional Review Board Statement

Not applicable.

Informed Consent Statement

Not applicable.

Data Availability Statement

The data presented in this study are available on request from the corresponding author.

Conflicts of Interest

The authors declare no conflict of interest.

References

  1. Senkov, O.N.; Wilks, G.B.; Miracle, D.B.; Chang, C.P.; Liaw, P.K. Refractory high-entropy alloys. Intermetallics 2010, 18, 1758–1765. [Google Scholar] [CrossRef]
  2. Senkov, O.N.; Miracle, D.B.; Chaput, K.J.; Couzinie, J.-P. Development and exploration of refractory high entropy alloys—A review. J. Mater. Res. 2018, 33, 3092–3128. [Google Scholar] [CrossRef] [Green Version]
  3. Miracle, D.B.; Tsai, M.-H.; Senkov, O.N.; Soni, V.; Banerjee, R. Refractory high entropy superalloys (RSAs). Scr. Mater. 2020, 187, 445–452. [Google Scholar] [CrossRef]
  4. Couzinié, J.-P.; Senkov, O.N.; Miracle, D.B.; Dirras, G. Comprehensive data compilation on the mechanical properties of refractory high-entropy alloys. Data Brief 2018, 21, 1622–1641. [Google Scholar] [CrossRef] [PubMed]
  5. Qin, G.; Li, Z.; Chen, R.; Zheng, H.; Fan, C.; Wang, L.; Su, Y.; Ding, H.; Guo, J.; Fu, H. CoCrFeMnNi high-entropy alloys reinforced with Laves phase by adding Nb and Ti elements. J. Mater. Res. 2018, 34, 1011–1020. [Google Scholar] [CrossRef]
  6. Yi, J.; Wang, L.; Xu, M.; Yang, L. Microstructure and mechanical properties of refractory high-entropy alloy HfMoNbTiCr. Mater. Techol. 2021, 55, 305–310. [Google Scholar] [CrossRef]
  7. Yao, H.W.; Miao, J.W.; Liu, Y.M.; Guo, E.Y.; Huang, H.; Lu, Y.P.; Wang, T.M.; Li, T.J. Effect of Ti and Nb contents on microstructure and mechanical properties of HfZrVTaMoWTixNby refractory high-entropy alloys. Adv. Energy Mater. 2021, 23, 2100225. [Google Scholar]
  8. Stein, F.; Palm, M.; Sauthoff, G. Structure and stability of Laves phases. Part I. Critical assessment of factors controlling Laves phase stability. Intermetallics 2004, 12, 713–720. [Google Scholar] [CrossRef]
  9. Yurchenko, N.; Stepanov, N.; Salishchev, G. Laves-phase formation criterion for high-entropy alloys. Mater. Sci. Technol. 2017, 33, 17–22. [Google Scholar] [CrossRef]
  10. Yao, H.; Qiao, D.; Miao, J.; Wang, J.; Guo, E.; Lu, Y. Criteria for laves-phase formation in refractory high-entropy alloys. Phil. Mag. Lett. 2021, in press. [Google Scholar] [CrossRef]
  11. Gao, M.C.; Carney, C.S.; Doğan, Ö.N.; Jablonksi, P.D.; Hawk, J.A.; Alman, D.E. Design of refractory high-entropy alloys. JOM 2015, 67, 2653–2669. [Google Scholar] [CrossRef]
  12. Raturi, A.; Aditya, J.; Gurao, N.P.; Biswas, K. ICME approach to explore equiatomic and non-equiatomic single phase BCC refractory high entropy alloys. J. Alloys Compd. 2018, 806, 587–595. [Google Scholar] [CrossRef]
  13. Zhang, E.K.; Tang, Y.; Wen, M.W.; Obaied, A.; Roslyakova, I.; Zhang, L.J. On phase stability of Mo-Nb-Ta-W refractory high entropy alloys. Int. J. Refract. Met. Hard Mater. 2022, 103, 105780. [Google Scholar] [CrossRef]
  14. Chase, M.W.; Ansara, I.; Dinsdale, A.; Eriksson, G.; Grimvall, G.; Hoglund, L.; Yokokawa, H. Group 1: Heat capacity models for crystalline phases from 0 K to 6000 K. Calphad 1995, 19, 437–447. [Google Scholar]
  15. Roslyakova, I.; Sundman, B.; Dette, H.; Zhang, L.J.; Steinbach, I. Modeling of Gibbs energies of pure elements down to 0 K using segmented regression. Calphad 2016, 55, 165–180. [Google Scholar] [CrossRef] [Green Version]
  16. Bigdeli, S.; Mao, H.H.; Selleby, M. On the third-generation Calphad databases: An updated description of Mn. Phys. Status Solidi B 2015, 252, 2199–2208. [Google Scholar] [CrossRef]
  17. Hao, L.Y.; Ruban, A.; Xiong, W. CALPHAD modeling based on Gibbs energy functions from zero kevin and improved magnetic model: A case study on the Cr-Ni system. Calphad 2021, 73, 102268. [Google Scholar] [CrossRef]
  18. Tang, Y.; Zhang, L.J. Effect of thermal vacancy on thermodynamic behaviors in BCC W close to melting point: A thermodynamic study. Materials 2018, 11, 1648. [Google Scholar] [CrossRef] [Green Version]
  19. Obaied, A.; Bocklund, B.; Zomorodpoosh, S.; Zhang, L.J.; Otis, R.; Liu, Z.-K.; Roslyakova, I. Thermodynamic re-assessment of pure chromium using modified segmented regression model. Calphad 2020, 69, 101762. [Google Scholar] [CrossRef]
  20. Ågren, J. Thermodynamics of supercooled liquids and their glass transition. Phys. Chem. Liq. 1988, 18, 123–139. [Google Scholar] [CrossRef]
  21. Jiang, Y.X.; Zomorodpoosh, S.; Roslyakova, I.; Zhang, L.J. Thermodynamic re-assessment of binary Cr-Nb system down to 0 K. Calphad 2018, 62, 109–118. [Google Scholar] [CrossRef]
  22. Jiang, Y.X.; Zomorodpoosh, S.; Roslyakova, I.; Zhang, L.J. Thermodynamic re-assessment of the binary Cr–Ta system down to 0 K. Int. J. Mater. Res. 2019, 110, 797–807. [Google Scholar]
  23. Arblaster, J.W. Thermodynamic properties of vanadium. J. Phase Equilib. Diffus. 2017, 38, 51–64. [Google Scholar] [CrossRef]
  24. Chekhovskoi, V.Y. The energy of formation of vacancies and their concentration in chromium. Sov. Phys. Solid State 1979, 21, 1089–1090. [Google Scholar]
  25. Chekhovskoii, V.Y.; Tarasov, V.D.; Grigoreva, N.V. Contribution of equilibrium vacancies to vanadium caloric properties. High Temp. 2011, 49, 826–831. [Google Scholar] [CrossRef]
  26. Anderson, C. The heat capacities of chromium, chromic oxide, chromous chloride and chromic chloride at low temperatures. J. Am. Chem. Soc. 1937, 59, 488–491. [Google Scholar] [CrossRef]
  27. Estermann, I.; Friedberg, S.A.; Goldman, J.E. The specific heats of several metals between 1.8 and 4.2 K. Phys. Rev. 1952, 87, 582–588. [Google Scholar] [CrossRef]
  28. Kemeny, T.; Fogarassy, B.; Arajs, S.; Moyer, C.A. Heat-capacity studies of chromium-rich antiferromagnetic chromium-iron alloys. Phys. Rev. B 1979, 20, 2975–2979. [Google Scholar] [CrossRef]
  29. Beaumont, R.H.; Chihara, H.; Morrison, J.A. An anomaly in the heat capacity of chromium at 38.5 °C. Phil. Mag. 1960, 5, 188–191. [Google Scholar] [CrossRef]
  30. Kohlhaas, R.; Braun, M. Die thermodynamischen funktionen des reinen eisens: Wärmeinhalt und spezifische wärme austenitischer eisenlegierungen und stähle. Arch. Eisenhuttenwes 1965, 34, 391–399. [Google Scholar] [CrossRef]
  31. Armstrong, L.D.; Grayson-Smith, H. High temperature calorimetry: II. Atomic heats of chromium, manganese, and cobalt between 0° and 800 °C. Can. J. Res. 1950, 28, 51–59. [Google Scholar] [CrossRef]
  32. Kalishevich, G.I.; Krentsis, R.V. The standard specific heats, entropies, and enthalpies of silicon and chromium and its alloys. Zh. Fiz. Khim. 1965, 39, 2999–3001. [Google Scholar]
  33. Krauss, F. Die messung der spezifischen wärme von metallen bei hohen temperature. Z. Metallkd. 1958, 49, 386–392. [Google Scholar]
  34. Martin, D.; Newton, R.F.; Girmes, W.R.; Blankenship, F.F. Activities in the chromium-nickel system. J. Phys. Chem. 1958, 62, 980–982. [Google Scholar]
  35. Simon, F.; Simson, V.C.; Ruhemann, M. An investigation on the specific heat at low temperature, the specific heat of the halides of ammonia between −70 °C and room temperature. Z. Phys. Chem. 1927, 129, 339–348. [Google Scholar]
  36. Clusius, K.; Franzosini, P. Ergebnisse der tieftemperaturforschung. XXXII. Atom-und elektronenwarme des chroms zwischen 14 K und 273 K. Z. Naturforsch. 1962, 17, 522–525. [Google Scholar] [CrossRef] [Green Version]
  37. Rayne, J.A.; Kemp, W.R.G. The heat capacities of chromium and nickel. Phil. Mag. 1956, 1, 918–925. [Google Scholar] [CrossRef]
  38. Jaeger, F.; Rosenbohm, E. The exact measurement of the specific heats of metals at high temperatures. XVII. Calorimetric retardation phenomena in the case of cerium and chromium. Proc. Acad. Sci. Amst. 1934, 37, 489–497. [Google Scholar]
  39. Touloukian, Y.S.; Saxena, S.C.; Hestermans, P. Thermophysical Properties of Matter-the TPRC Data Series, 11; Ho, C.Y., Ed.; Thermophysical and Electronic Properties Information Analysis Center: Boulder, CO, USA, 1975; pp. 61–62. [Google Scholar]
  40. Lin, R.; Frohberg, M. Enthalpy measurements of solid and liquid chromium by levitation calorimetry. High Temp. High Press. 1988, 20, 539–544. [Google Scholar]
  41. Bendick, W.; Pepperhoff, W. The heat capacity of Ti, V. and Cr. J. Phys. F Met. Phy. 1982, 12, 1085–1090. [Google Scholar] [CrossRef]
  42. Cezairliyan, A.; Righini, F.; McClure, J.L. Simultaneous measurements of heat capacity, electrical resistivity and hemispherical total emittance by a pulse heating technique: Vanadium, 1500 to 2100 K. J. Res. Natl. Bur. Stand. A Phys. Chem. 1974, 78A, 143–147. [Google Scholar] [CrossRef] [PubMed]
  43. Clusius, K.; Franzosini, P.; Piesbergen, U. Ergebnisse der tieftemperaturforschung. XXXII. Die atom und elektronwarme des vanadins und niobs zwischen 10 and 273 K. Z. Naturforschg. 1960, 15A, 728–734. [Google Scholar] [CrossRef]
  44. Filippov, L.P.; Yurchak, P. High temperature investigation of the thermal properties of solids. Inzh. Fiz. Zh. 1971, 21, 561–577. [Google Scholar] [CrossRef]
  45. Kohlhaas, R.; Braun, M.; Vollmer, O. Die atomwarme von titan, vanadin und chrom im berich hoher temperature. Z. Naturforsch. 1965, 20A, 1077–1079. [Google Scholar] [CrossRef]
  46. Takahashi, Y.; Nakamura, J.-I.; Smith, J.F. Laser flash calorimetry. III. Heat capacity of vanadium from 80 to 1000 K. J. Chem. Thermodyn. 1982, 14, 977–982. [Google Scholar] [CrossRef]
  47. Conway, J.B.; Hein, R.A. Enthalpy measurements of solid materials to 2400 °C by means of a drop technique. In Advances in Thermophysical Properties at Extreme Temperatures and Pressures; Cratch, S., Ed.; The American Society of Mechanical Engineers: New York, NY, USA, 1965; pp. 152–155. [Google Scholar]
  48. Lucks, C.; Deem, H. Thermal Conductivities, Heat Capacities, and Linear Thermal Expansion of Five Materials. Wright Air Development Center; Report No. WADC-TR-55-496; Wright-Patterson Air Force Base: Dayton, OH, USA, 1956. [Google Scholar]
  49. Schimpff, H. On the heat capacity of metals and intermetallic compounds. Z. Phys. Chem. Neue Folge 1910, 71, 257–300. [Google Scholar] [CrossRef]
  50. Schübel, P. Metallographische mitteilungen aus dem institut für physikalische chemie der universitat gottingen. lxxxvii. Über die warmekapazitat von metallen und metallverbindungen zwischen 18–600 °C. Z. Anorg. Chem. 1914, 87, 81–119. [Google Scholar] [CrossRef]
  51. Umino, S. On the latent heat of fusion of several metals and their specific heats at high temperatures. Sci. Rep. Tohuku Imp. Univ. 1926, 15, 597–617. [Google Scholar]
  52. Kaufman, L. Coupled thermochemical and phase diagram data for tantalum based binary alloys. Calphad 1991, 15, 243–259. [Google Scholar] [CrossRef]
  53. Dupin, N.; Ansara, I. Thermodynamic assessment of the Cr-Ta system. J. Phase Equilib. 1993, 14, 451–456. [Google Scholar] [CrossRef]
  54. Pavlů, J.; Vřeštál, J.; Šob, M. Re-modeling of Laves phases in the Cr–Nb and Cr–Ta systems using first-principles results. Calphad 2009, 33, 179–186. [Google Scholar] [CrossRef]
  55. Danon, C.A.; Servant, C.A. Thermodynamic evaluation of the Ta-V system. J. Alloys Compd. 2004, 366, 191–200. [Google Scholar] [CrossRef]
  56. Pavlů, J.; Vřeštál, J.; Chen, X.-Q.; Rogl, P. Thermodynamic modeling of Laves phases in the Ta–V system: Reassessment using first-principles results. Calphad 2011, 35, 103–108. [Google Scholar] [CrossRef]
  57. Dinsdale, A.T. SGTE data for pure elements. Calphad 1991, 15, 317–425. [Google Scholar] [CrossRef]
  58. Khan, A.U.; Broz, P.; Niu, H.Y.; Bursik, J.; Grytsiv, A.; Chen, X.-Q.; Giester, G.; Rogl, P. The system Ta-V-Si: Crystal structure and phase equilibria. J. Solid State Chem. 2012, 187, 114–123. [Google Scholar] [CrossRef]
  59. Wang, C.P.; Liang, Y.; Yang, S.; Zhang, J.; Huang, Y.; Han, J.; Lu, Y.; Liu, X.J. Phase equilibria in the Ni-V-Ta ternary system. Metals 2018, 8, 774. [Google Scholar] [CrossRef]
  60. Ruan, J.J.; Wang, C.P.; Yang, S.Y.; Omori, T.; Yang, T.; Kimura, Y.; Liu, X.J.; Kainuma, R.; Ishida, K. Experimental investigations of microstructures and phase equilibria in the Co-V-Ta ternary system. J. Alloys Compd. 2016, 664, 141–148. [Google Scholar] [CrossRef]
  61. Sluiter, M.H.F. Ab initio lattice stabilities of some elemental complex structures. Calphad 2006, 30, 357–366. [Google Scholar] [CrossRef]
  62. Coughanowr, C.A.; Ansara, I.; Luoma, R.; Hamalainen, M.; Lukas, H.L. Assessment of the Cu-Mg System. Z. Metallkd. 1991, 82, 574–581. [Google Scholar]
  63. Auld, J.; Ryan, N. The solid solubility of tantalum in chromium. J. Less Common. Met. 1961, 3, 221–225. [Google Scholar] [CrossRef]
  64. Gebhardt, E.; Rexer, J. Precipitations in Ta-Cr solid solutions. Z. Metallkd. 1967, 47, 611–617. [Google Scholar]
  65. Elliott, R.; Rostoker, W. The occurrence of Laves-type phases among transition elements trans. ASM 1958, 50, 617–633. [Google Scholar]
  66. Kocherzhinskii, Y.; Petkov, V.; Shishkin, E. Phase equilibrium and crystal structure of the intermediate phase in the Ta-Cr system. Metallofizika 1973, 46, 75–80. [Google Scholar]
  67. Venkatraman, M.; Neumann, J. The Cr-Ta (chromium-tantalum) system. J. Phase Equilib. 1987, 8, 112–116. [Google Scholar] [CrossRef]
  68. Rudy, E. Compendium of Phase Diagram Data. Air Force Materials Laboratory; Report No. AFML-Tr-65-2. Part V; Wrighr Patterson AFB: Dayton, OH, USA, 1969. [Google Scholar]
  69. Nefedov, A.P.; Sokolovskaya, E.M.; Grigorev, A.T.; Chechernikov, V.I.; Sokolova, I.G.; Guzei, L.S. Solid-state phase transformations in vanadium-tantalum alloys. Vestn. Moskov. Univ. Ser. II Khim. 1965, 5, 42–47. [Google Scholar]
  70. Smith, J.F.; Carlson, O.N. The Ta-V (tantalum-vanadium) system. Bull. Alloy Phase Diagr. 1983, 4, 284–289. [Google Scholar] [CrossRef]
  71. Eremenko, V.N.; Tretyachenko, L.A.; Yakhimovich, R.I. Fusion diagram of the tantalum-vanadium system. Russ. J. Inorg. Chem. 1960, 5, 1110–1112. [Google Scholar]
  72. Savitskii, E.M.; Efimov, J.V. Superconducting metallic compounds and their alloys. Monatsh. Chem. 1972, 103, 270–287. [Google Scholar]
  73. Feschotte, P.; Kubaschewski, O. Thermochemical properties of the laves phase Cr2Ta. Trans. Faraday Soc. 1964, 60, 1941–1946. [Google Scholar] [CrossRef]
  74. Chihi, T.; Fatmi, M.; Ghebouli, B. Ab initio calculations for properties of laves phase V2M (M = Zr, Hf, Ta) compounds. Am. J. Phys. 2013, 2, 88–92. [Google Scholar] [CrossRef]
  75. Kirklin, S.; Saal, J.E.; Meredig, B.; Thompson, A.; Doak, J.W.; Aykol, M.; Rühl, S.; Wolverton, C. The Open Quantum Materials Database (OQMD): Assessing the accuracy of DFT formation energies. NPJ Comput. Mater. 2015, 1, 15010. [Google Scholar] [CrossRef] [Green Version]
  76. Hafstrom, J.W.; Knapp, G.S.; Aldred, A.T. Electronic and lattice properties of V2Hf1-xTax C15 superconductors. Phys. Rev. B 1978, 17, 2892–2900. [Google Scholar] [CrossRef]
  77. Martin, J.F.; Müller, F.; Kubaschewski, O. Thermodynamic properties of TaCr2 and NbCr2. Trans. Faraday Soc. 1970, 66, 1065–1072. [Google Scholar] [CrossRef]
Figure 1. Calculated thermodynamic properties: (a,d) heat capacity (Cp); (b,e) heat content (HTH298); (c,f) molar Gibbs energy of pure Cr and V in comparison with reported data [23,26,27,28,29,30,31,32,33,34,35,36,37,38,39,40,41,42,43,44,45,46,47,48,49,50,51].
Materials 15 02074 g001
Figure 2. Calculated thermal vacancy concentrations in pure solid (a) Cr and (b) V along with measured data [24,25] at melting points.
Materials 15 02074 g002
Figure 3. Calculated phase diagrams for (a) Ta-Cr and (b) Ta-V binary systems along with experimental data [63,64,65,66,67,68,69,70,71,72].
Materials 15 02074 g003
Figure 4. Calculated thermodynamic properties in Ta−Cr and Ta-V systems together with reported data [54,56,73,74,75]: (a) activity of Cr in Ta-Cr system at 1472 K; (b) enthalpy of formation in Ta-Cr system at 0 and 1693 K; (c) enthalpy of formation in Ta-V system at 0 K.
Materials 15 02074 g004
Figure 5. Calculated Cp for (a) Cr2Ta and (b) V2Ta alloys from 0 to 1400 K along with the reported data [76,77].
Materials 15 02074 g005
Table 1. The third-generation Gibbs energy expressions for pure Cr and V in solid A2 and liquid phases.
Element PhasesGibbs Energy (J/mol)
CrA2 G C r A 2 ,   d f = { 13245.18 2.89 × 10 3 T 2 + 16 . 21 T ln ( e 432.5532 / T 1 ) + 8.71 T ln ( e 251.1734 / T 1 )     0 < T < 531.9 13745.71 + 14.84 T + 1.26 × 10 3 T 2 1.12 × 10 6 T 3 2.52 T ln ( T ) + 16 . 21 T ln ( e 432.5532 / T 1 ) + 8.71 T ln ( e 251.1734 / T 1 ) 531.9 < T < 2136 38598.14 + 188.46 T 23.90 T ln ( T ) 5.42 × 10 19 T 5 + 9.03 × 10 38 T 11 + 16 . 21 T ln ( e 432.5532 / T 1 ) + 8.71 T ln ( e 251.1734 / T 1 ) T > 2136
G V A A 2 = + 30 T ;   L C r , V A A 2 = + 72220 41.50 T
Liquid G C r l i q = 14164 . 90 + 24.942 T ln ( 1 e 297.2382 / T ) 2.23 × 10 3 T 2 8.314 T ln ( 1 + e ( 45995.32 14.8855 T 1.16 × 10 1 ln ( T ) ) / 8.314 T )
VA2 G V A 2 ,   d f = { 11655.70 2.50 × 10 3 T 2 + 23 . 58 T ln ( e 289.5879 / T 1 ) + 1.29 T ln ( e 90.48463 / T 1 ) 0 < T < 2201 42621.43 + 144.41 T 17.69 T ln ( T ) + 4.38 × 10 19 T 5 4.76 × 10 38 T 11 + 23 . 58 T ln ( e 289.5879 / T 1 ) + 1.29 T ln ( e 90.48463 / T 1 )               T > 2201
G V A A 2 = + 30 T ;   L V , V A A 2 = + 130500 60.01 T
Liquid G V l i q = 11355.04 + 24.942 T ln ( 1 e 205.2036 / T ) 1.77 × 10 3 T 2 8.314 T ln ( 1 + e ( 53359.83 10.4607 T 5.66 × 10 1 ln ( T ) ) / 8.314 T )
Table 2. Summary of the thermodynamic parameters of Ta-Cr and Ta-V binary systems.
SystemsPhasesThermodynamic Parameters (J/mol)
Ta-CrLiquid L 0 C r , T a L i q u i d = + 5647 . 3 4 . 576 T ; L 1 C r , T a L i q u i d = + 10555 . 4 1 . 121 T ; L 2 C r , T a L i q u i d = 21769 . 6 + 3 . 718 T
A2 L 0 C r , T a A 2 = + 84411 . 6 30 . 246 T ; L 1 C r , T a A 2 = + 50274 . 2 21 . 825 T ; L 2 C r , T a A 2 = 4321 . 6
C14 G 0 C r : C r C 14 = + 83400.0 + 3 G C r A 2 , d f G 0 T a : T a C 14 = + 29100.0 + 3 G T a A 2 , d f G 0 C r : T a C 14 = 19550.7 5.770 T + 2 G C r A 2 , d f + G T a A 2 , d f G 0 T a : C r C 14 = + 132050 . 7 + 5 . 536 T + G C r A 2 , d f + 2 G T a A 2 , d f L 0 C r , T a : * C 14 = + 219623 . 9 74.407 T ; L 0 * : C r , T a C 14 = + 95266 . 4 77 . 887 T
C15 G 0 T a : T a C 15 = + 33600.0 + 3 G T a A 2 , d f G 0 C r : C r C 15 = + 79200.0 + 3 G C r A 2 , d f G 0 C r : T a C 15 = 26555.2 2.170 T + 2 G C r A 2 , d f + G T a A 2 , d f G 0 T a : C r C 15 = + 139755 . 2 + 1 . 813 T + G C r A 2 , d f + 2 G T a A 2 , d f L 0 C r , T a : * C 15 = + 51828 . 2 + 8 . 181 T ; L 0 * : C r , T a C 15 = 61398 . 1 + 7 . 891 T
Ta-VLiquid L 0 V : T a L i q u i d = 5751 . 2 ;   L 1 V : T a L i q u i d = 3341 . 9
A2 L 0 V : T a A 2 = + 3731 . 5 ;   L 1 V : T a A 2 = 10998 . 9
C14 G 0 T a : T a C 14 = + 29100.0 + 3 G T a A 2 , d f G 0 V : V C 14 = + 28800.0 + 3 G V A 2 , d f G 0 V : T a C 14 = 18925.2 + 2 G V A 2 , d f + G T a A 2 , d f G 0 T a : V C 14 = + 76825.2 + G V A 2 , d f + 2 G T a A 2 , d f L 0 V , T a : * C 14 = 11321.2 ; L 0 * : V , T a C 14 = 6751.6
C15 G 0 T a : T a C 15 = + 33600.0 + 3 G T a A 2 , d f G 0 V : V C 15 = + 33000.0 + 3 G V A 2 , d f G 0 V : T a C 15 = 23389.9 + 3.004 T + 2 G V A 2 , d f + G T a A 2 , d f G 0 T a : V C 15 = + 89989.9 3.004 T + G V A 2 , d f + 2 G T a A 2 , d f L 0 V , T a : * C 15 = 349.549 + 1.025 T ; L 0 * : V , T a C 15 = 7515.567
Table 3. Calculated temperatures and compositions of invariant reactions in Ta-Cr and Ta-V binary systems in comparison with the measured ones [67,68,69,70,71,72] and previous calculated ones [53,54,55,56].
SystemsReactionsTemperature (K)Composition (at. %Ta)Ref.
Ta-CrLiquid → C142293.0 ± 20--33.30--[67] (Exp.)
2309.7--34.90--[53] (Cal.)
2304--34.22--[54] (Cal.)
2290.0--34.87--This work (Cal.)
Liquid → A2(Cr) + C142033.0 ± 20~13.00~4.00~30.00[67] (Exp.)
2040.0 ± 10~10.50~3.50~30.00[68] (Exp.)
2044.711.534.5330.03[53] (Cal.)
2065.19.883.8930.65[54] (Cal.)
2041.99.593.6829.94This work (Cal.)
Liquid → A2(Ta) + C142238.0 ± 20~50.0~73.00~38.00[67] (Exp.)
2223.449.4172.7537.90[53] (Cal.)
2239.249.9673.3237.70[54] (Cal.)
2239.052.1274.1338.21This work (Cal.)
C14 → A2(Cr) + C151933.0~31.40--~33.00[67] (Exp.)
1917.230.962.8132.23[53] (Cal.)
1903.330.971.8731.11[54] (Cal.)
1921.030.832.1731.15This work (Cal.)
C14 + A2(Ta) → C151968.0~35.00--~36.00[67] (Exp.)
1982.935.1780.5835.55[53] (Cal.)
1991.237.2984.7237.39[54] (Cal.)
1969.035.5283.8635.72This work (Cal.)
Ta-VLiquid → A22153.0--11.00--[70] (Exp.)
2098.0--15.00--[69] (Exp.)
----12.00--[68] (Exp.)
2099--12.89--[55] (Cal.)
2099--12.89--[56] (Cal.)
2156.0--12.40--This work (Cal.)
A2 → C141693.0--~33.00--[71] (Exp.)
1702.2--32.70--[55] (Cal.)
1703.3--32.62--[56] (Cal.)
1693.0--~33.00--[72] (Exp.)
1695.1--33.22--This work (Cal.)
C14 + A2(Ta) → C151553.036.0037.0055.00[72] (Exp.)
1550.235.9737.3650.27[55] (Cal.)
1556.136.1437.7857.21[56] (Cal.)
1552.535.8737.0250.46This work (Cal.)
C14 → A2(V) + C151398.029.009.0031.50[72] (Exp.)
1403.031.026.4831.29[55] (Cal.)
1409.530.693.4131.64[56] (Cal.)
1396.030.708.9031.85This work (Cal.)
Publisher’s Note: MDPI stays neutral with regard to jurisdictional claims in published maps and institutional affiliations.

