
Mineralogical Characteristics and Luminescent Properties of Natural Fluorite with Three Different Colors


Abstract
:1. Introduction
2. Materials and Methods
3. Results and Discussion
3.1. EPMA
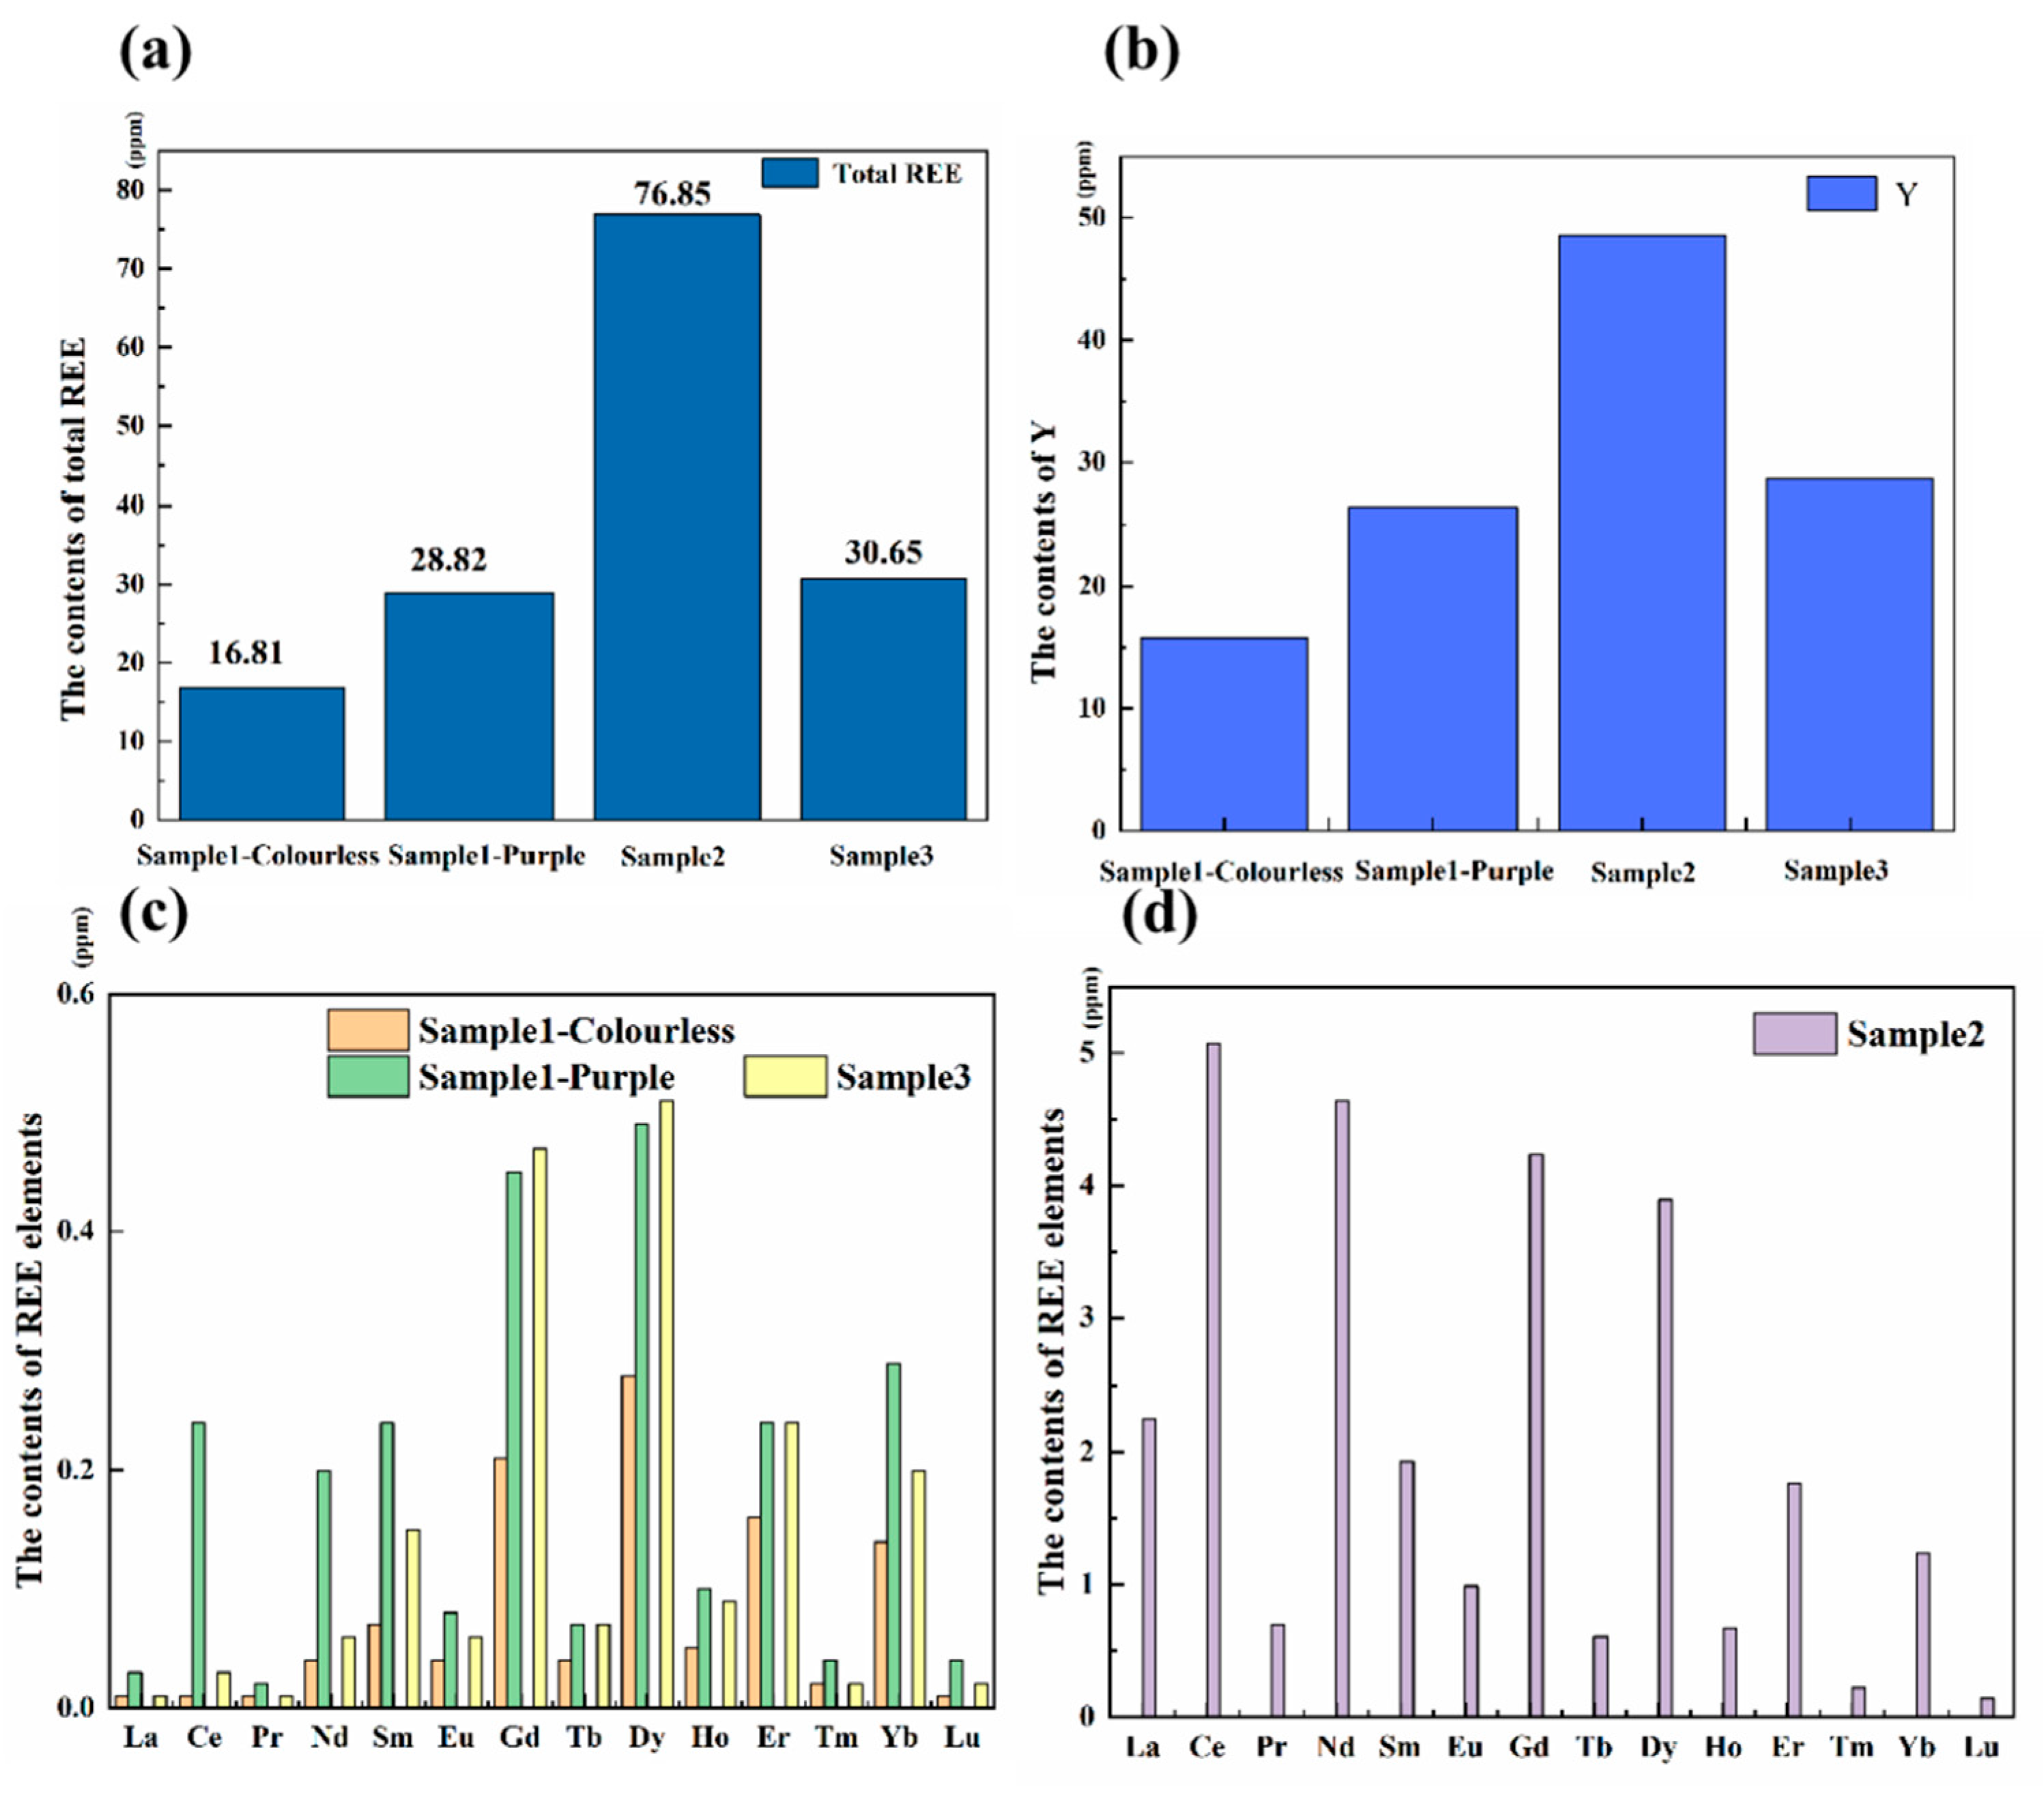
3.2. LA-ICP-MS
3.3. XRD
3.4. Infrared Spectra
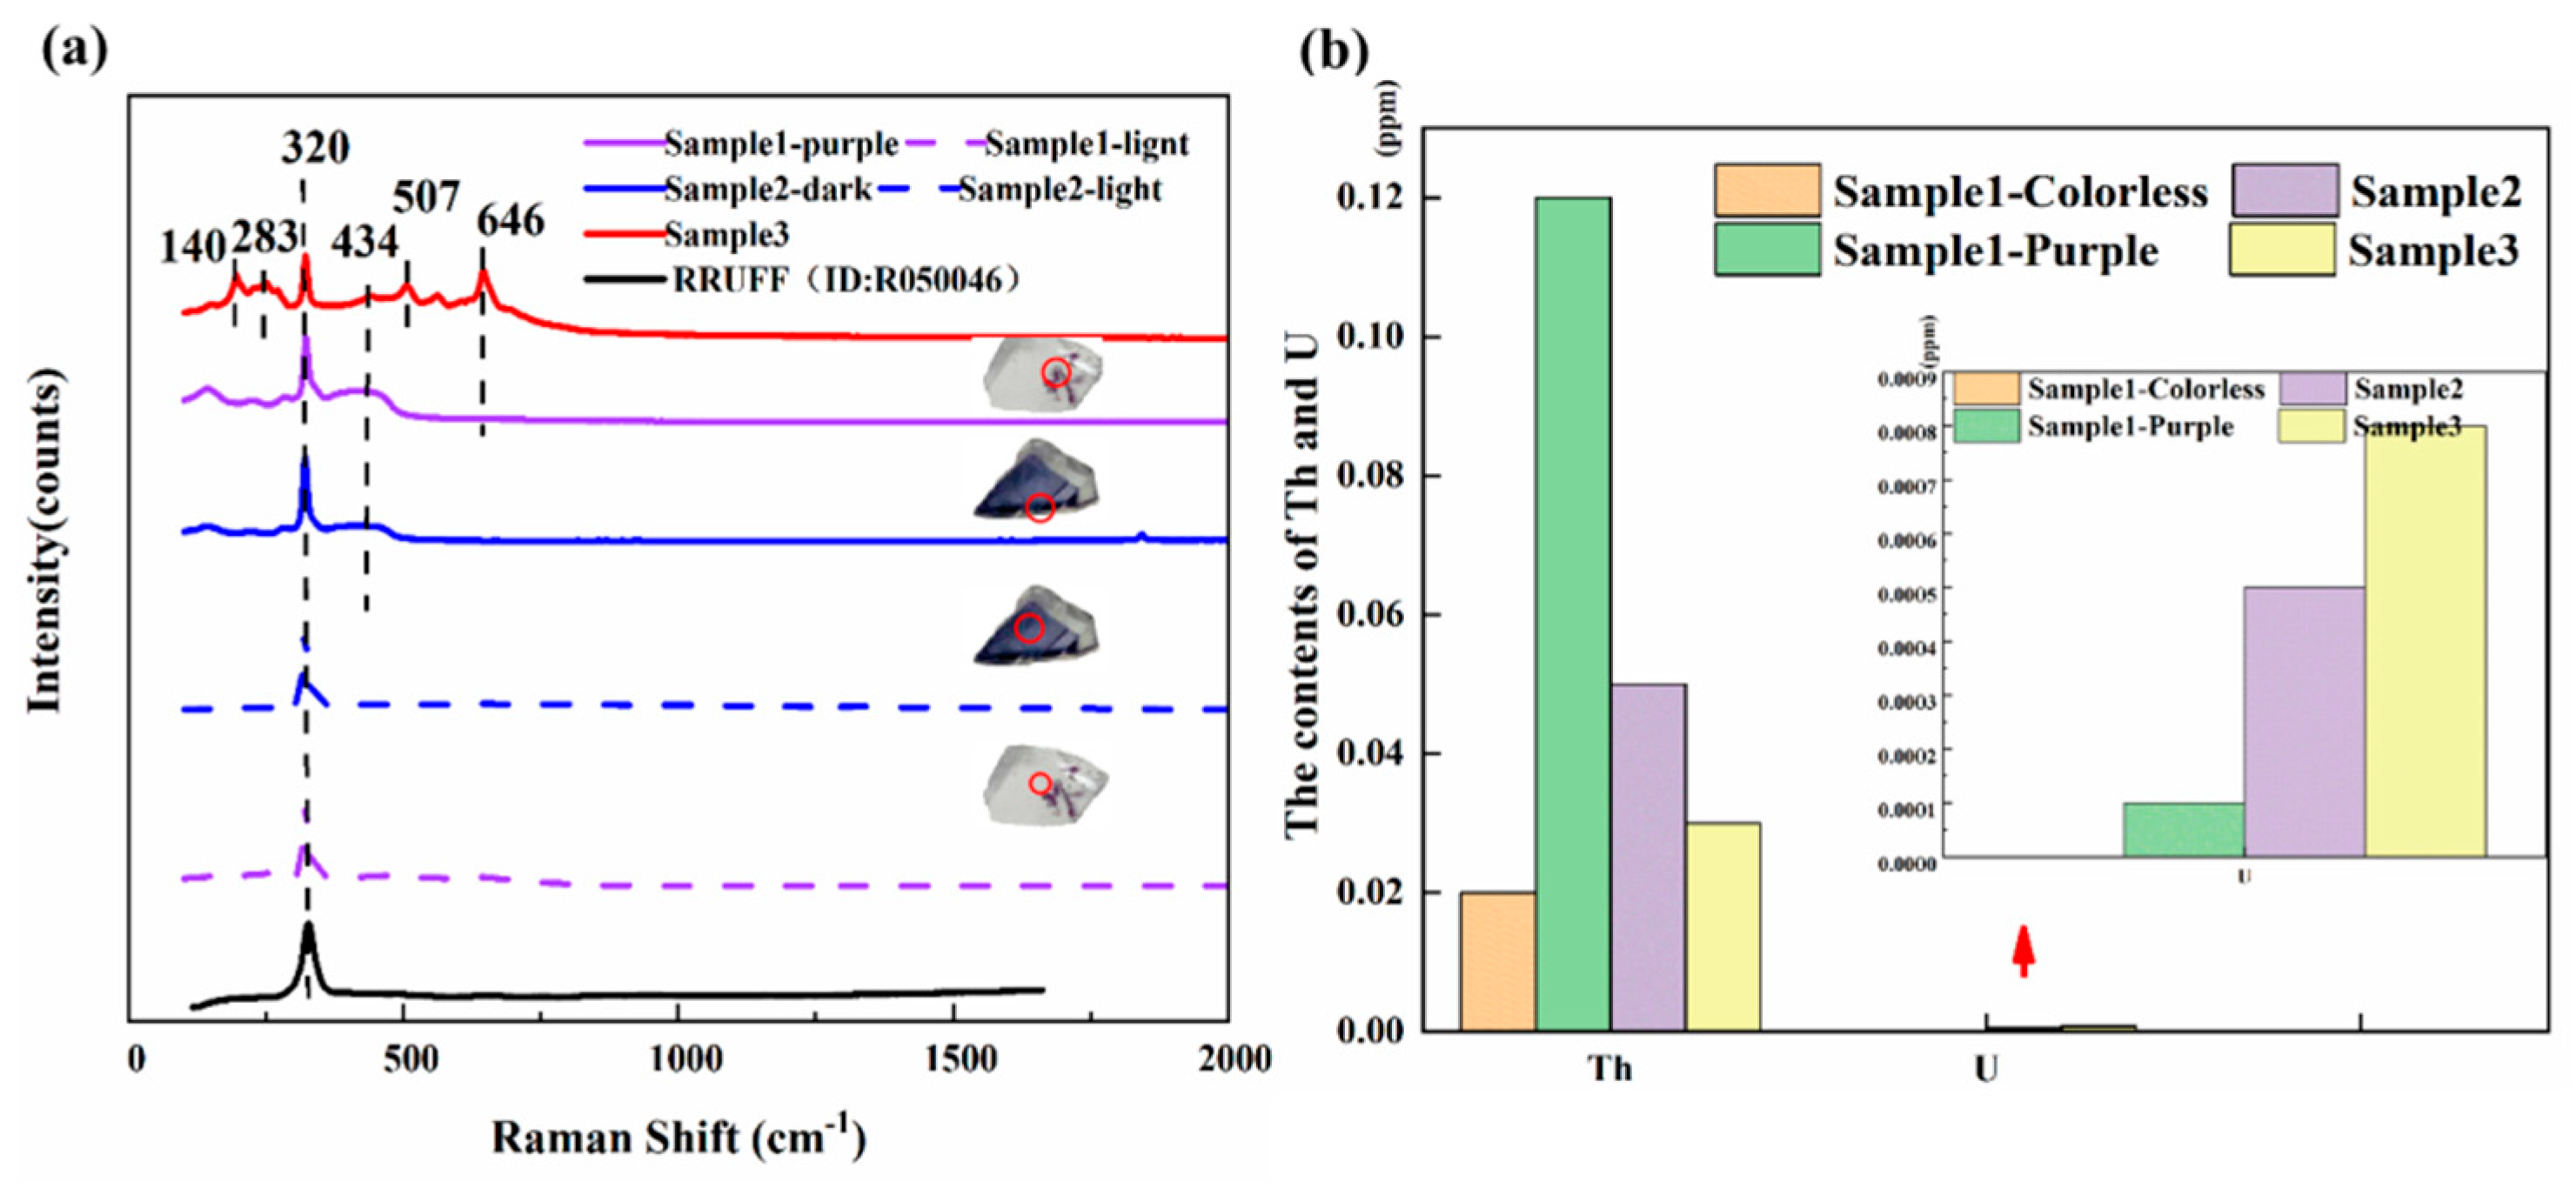
3.5. Raman Spectra
3.6. UV-Vis Spectra
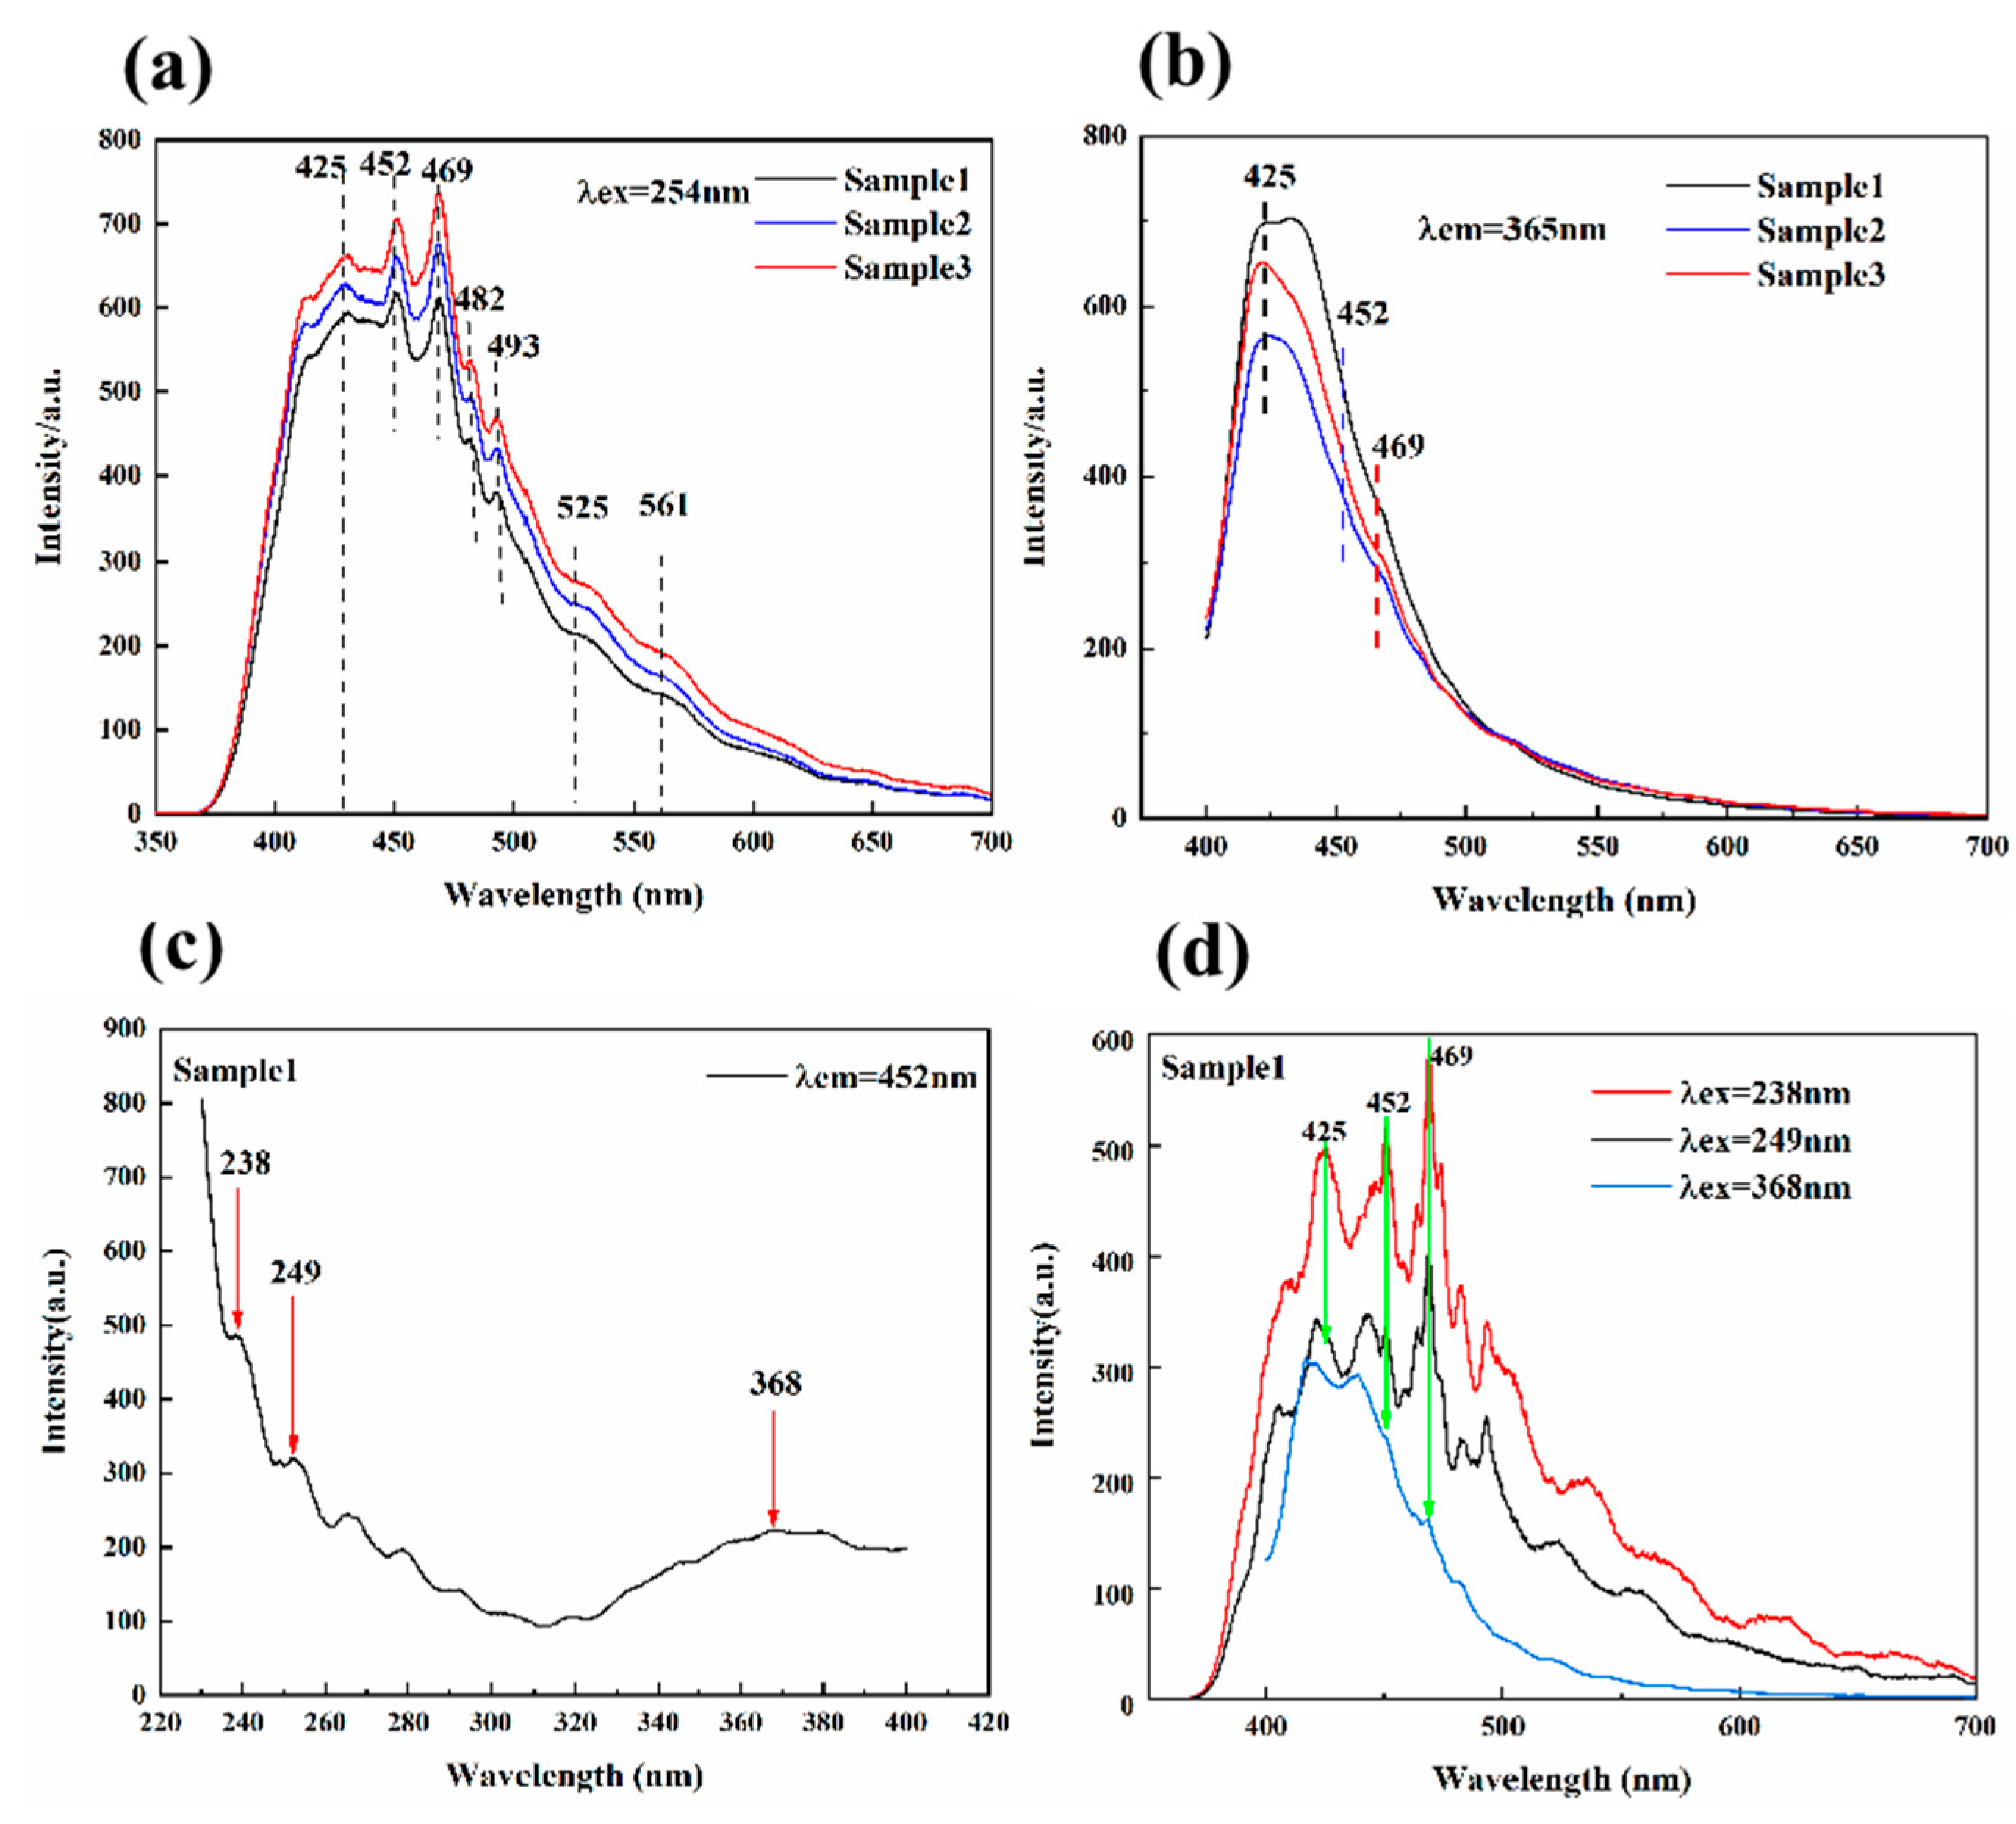
3.7. Photoluminescence Spectroscopy
4. Conclusions
Supplementary Materials
Author Contributions
Funding
Institutional Review Board Statement
Informed Consent Statement
Data Availability Statement
Conflicts of Interest
References
- Bill, H.; Calas, G. Color centers, associated rare-earth ions and the origin of coloration in natural fluorites. Phys. Chem. Miner. 1978, 3, 117–131. [Google Scholar] [CrossRef]
- Mitra, S. Nature and genesis of color centres in yellow and colorless fluorite from Ambadongar, Gujarat, India. Neues Jahrb. Mineral. 1981, 141, 290–308. [Google Scholar]
- Alig, R.C.; Kiss, Z.J.; Brown, J.P. Energy levels of Ce2+ in CaF2. Phys. Rev. 1969, 186, 276–284. [Google Scholar] [CrossRef]
- Braithwaite, R.S.W. The Cause of the color of Blue John and other Purple Fluorites. Mineral. Mag. 1973, 39, 401–411. [Google Scholar] [CrossRef]
- Nassau, K. The origin of color in minerals. Am. Mineral. 1978, 63, 219–229. [Google Scholar]
- Bill, H. Origin of the coloration of yellow fluorites: The O3− center structure and dynamical aspects. J. Chem. Phys. 1982, 76, 219–224. [Google Scholar] [CrossRef]
- Galwey, A.K. The Blue Coloration in Banded Fluorite (Blue John) from Castleton, Derbyshire, England. Mineral. Mag. 1979, 43, 243–250. [Google Scholar] [CrossRef]
- Bill, H.; Lacroix, R. Investigation of different centres in CaF2 crystals. In: Magnetic Resonance and Relaxation. Proc. Congr. 1967, 14, 262–268. [Google Scholar]
- Scouler, W.J. Effect of Mono- and Trivalent Cations on Color Centers in Calcium Fluoride. Technical Report 147; Massachusetts Institute of Technology. Laboratory for Insulation Research: Cambridge, MA, USA, 1960. [Google Scholar]
- Kim, M.; Yoon, Y.; Kang, M.; Shin, D. Spectroscopic characteristics of natural fluorite induced by electron-beam irradiation. J. Ceram. Processing Res. 2013, 13, 541–546. [Google Scholar]
- Wenjun, L. Restudy of black fluorite in the Huayuan lead-zinc deposit, Chengdu Li. J. Eng. Coll. 1999, 26, 101–105. [Google Scholar]
- Xiang, X.; Zu, X.T.; Zhu, S.; Ding, T.H.; Wang, L.M. Effects of electron irradiation and subsequent annealing on the optical absorption and photoluminescence of CaF2 single crystals. Opt. Mater. 2006, 28, 930–934. [Google Scholar] [CrossRef]
- McKeever, S.W.; Brown, M.D.; Abbundi, R.J.; Chan, H.; Mathur, V.K. Characterization of optically active sites in CaF2: Ce, Mn from optical spectra. J. Appl. Phys. 1986, 60, 2505–2510. [Google Scholar] [CrossRef]
- Gaft, M.; Waychunas, G.A.; Rossman, G.R.; Nagli, L.; Panczer, G.; Cheskis, D.; Raichlin, Y. Red photoluminescence and purple color of naturally irradiated fuorite. Phys. Chem. Miner. 2020, 47, 46. [Google Scholar] [CrossRef]
- Makhov, V.N.; Batygov, S.K.; Dmitruk, L.N.; Kirm, M.; Vielhauer, S.; Stryganyuk, G. VUV 5d-4f luminescence of Gd3+ and Lu3+ ions in the CaF2 host. Phys. Solid State 2008, 50, 1625–1630. [Google Scholar] [CrossRef] [Green Version]
- Ye, W.; Liu, X.; Huang, Q.; Zhou, Z.; Hu, G. Co-precipitation synthesis and self-reduction of CaF2: Eu2+ nanoparticles using different surfactants. Mater. Res. Bull. Int. J. Report. Res. Cryst. Growth Mater. Prep. Charact. 2016, 83, 428–433. [Google Scholar]
- Upadeo, S.V.; Gundurao, T.K.; Moharil, S.V. Mechanism of thermoluminescence in CaF2: Eu and CaSO4: Eu phosphors. J. Phys. Condens. Matter. 1994, 6, 9459–9468. [Google Scholar] [CrossRef]
- Ogundare, F.O.; Balogun, F.A.; Hussain, L.A. Temperature dependence of photoluminescence emission characteristics in a natural fluorite. Mineral. Petrol. 2007, 90, 167–173. [Google Scholar] [CrossRef]
- Cirillo-Penn, K.M.; Wright, J.C. Identification of defect structures in Eu3+: CaF2 by site selective spectroscopy of relaxation dynamics. J. Lumin. 1991, s48–s49, 505–508. [Google Scholar] [CrossRef]
- Yamashita, N.; Takagoshi, A. Energy transfer from Eu2+ to Mn2+ in MgS: Eu2+, Mn2+. Jpn. J. Appl. Phys. 1997, 36, 5532–5536. [Google Scholar] [CrossRef]
- Pandurangappa, C.; Lakshminarasappa, B.N.; Nagabhushana, B.M. Synthesis and optical studies of gamma irradiated Eu doped nanocrystalline CaF2. J. Alloy. Compd. 2011, 509, 7671–7673. [Google Scholar] [CrossRef]
- Aierken, S.; Lee, K.H.; Kusachi, I.; Yamashita, N. Photoluminescence properties of natural fluorite. J. Miner. Petrolog. 2005, 95, 228–235. [Google Scholar]
- Burruss, R.C.; Ging, T.G.; Eppinger, R.G. Laser-excited fluorescence of rare earth elements in fluorite: Initial observations with a laser Raman microprobe. Geochim. Cosmochim. Acta 1992, 56, 2713–2723. [Google Scholar] [CrossRef]
- Blanc, P.; Baumer, A.; Cesbron, F.; Ohnenstetter, D.; Panczer, G.; Rémond, G. Systematic Cathodoluminescence Spectral Analysis of Synthetic Doped Minerals: Anhydrite, Apatite, Calcite, Fluorite, Scheelite and Zirco; Springer: Berlin/Heidelberg, Germany, 2000. [Google Scholar]
- Sidike, A.; Yamashita, I.K. Natural fluorite emitting yellow fluorescence under UV light. Phys. Chem. Miner. 2003, 30, 478–485. [Google Scholar] [CrossRef]
- Loh, E. Ultraviolet-Absorption Spectra of Europium and Ytterbium in Alkaline Earth Fluorides. Phys. Rev. 1969, 184, 348–352. [Google Scholar] [CrossRef]
- Gaft, M.; Panczer, G.; Reisfeld, R.; Uspensky, E. Laser-induced time-resolved luminescence as a tool for rare-earth element identification in minerals. Phys. Chem. Miner. 2001, 28, 347–363. [Google Scholar] [CrossRef]
- Gaft, M.; Reisfeld, R.; Renata Panczer, G. Modern Luminescence Spectroscopy of Minerals and Materials; Springer: Berlin/Heidelberg, Germany, 2015. [Google Scholar]
- Wanwilairat, S.; Vilaithong, T.; Rhodes, M.; Hoffmann, W. High- resolution emission spectra of CaF2: Tm. Radiat. Prot. Dosim. 2000, 88, 307–310. [Google Scholar] [CrossRef]
- Chrysochoos, J.; Jacobs, P.W.; Stillman, M.J.; Chadwick, A.V. Laser induced emission spectra of Pr3+ in CaF2 at low temperatures. J. Lumin. 1983, 28, 177–190. [Google Scholar] [CrossRef]
- Zhang, L.; Xu, J.; Hu, Y.; Chen, G.; Wang, Z. Near-infrared Quantum Cutting in Pr3+-Yb3+ Co-doped Oxyfluoride Glass Ceramics Containing CaF2 Nanocrystals. J. Wuhan Univ. Technol. 2013, 28, 455–459. [Google Scholar] [CrossRef]
- Schlesinger, M.; Kwan, C.T. Optical studies of Dy3+-doped calcium fluoride. Phys. Rev. B 1971, 3, 2852–2855. [Google Scholar] [CrossRef]
- Lesniak, K. Crystal fields and dopant-ligand separations in cubic centres of rare-earth ions in fluorites. J. Phys. Condens. Matter 1990, 2, 5563–5574. [Google Scholar] [CrossRef]
- Sivaram, A.; Jagannath, H.; Rao, D.R.; Venkateswarlu, P. Steady state and transient fluorescence studies of CaF2: Dy3+ single Crystals. J. Phys. Chem. Solids 1979, 40, 1007–1018. [Google Scholar] [CrossRef]
- Czaja, M.; Bodył-Gajowska, S.; Lisiecki, R.; Meijerink, A.; Mazurak, Z. The luminescence properties of rare-earth ions in natural fluorite. Phys. Chem. Miner. 2012, 39, 639–648. [Google Scholar] [CrossRef] [Green Version]
- Pandurangappa, C.; Lakshminarasappa, B.N. Optical absorption and Photoluminescence studies in Gamma-irradiated nanocrystalline CaF2. J. Nanomed. Nanotechnol. 2011, 2, 592–595. [Google Scholar] [CrossRef]
- Zongming, W. Practical Infrared Spectroscopy, 2nd ed.; Petroleum Industry Press: Beijing, China, 1990. [Google Scholar]
- Singh, R.K. FTIR spectroscpy of natural fluorite from Ambadongar, Gujarat. J. Geol. Soc. India 2013, 81, 215–218. [Google Scholar] [CrossRef]
- Baatartsogt, B.; Wagner, T.; Taubald, H.; Mierdel, K.; Markl, G. Hydrogen isotope determination of fluid inclusion water from hydrothermal fluorite: Constraining the effect of the extraction technique. Chem. Geol. 2007, 244, 474–482. [Google Scholar] [CrossRef]
- Aines, R.D.; Rossman, G.R. Water in minerals? A peak in the infrared. J. Geophys. Res. 1984, 89, 4059–4071. [Google Scholar] [CrossRef]
- Hu, J.S.; Misra, M.; Miller, J.D. Characterization of adsorbed oleate species at the fluorite surface by FTIR spectroscopy. Int. J. Miner. Processing 1986, 18, 73–84. [Google Scholar] [CrossRef]
- Zhifeng, Y.; Hong, X. Study on the evolution characteristics of metallogenic fluid in Yaogangxian tungsten deposit, Hunan Province. Miner. Depos. 2015, 4, 309–320. [Google Scholar]
- González-Partida, E.; Carrillo-Chávez, A.; Grimmer, J.O.; Pironon, J.; Mutterer, J.; Levresse, G. Fluorite deposits at Encantada–Buenavista, Mexico: Products of Mississippi Valley type processes. Ore Geol. Rev. 2003, 23, 107–124. [Google Scholar] [CrossRef]
- Megasari, E.; Dharsono, H.D.; Fadil, R.; Zakaria, M.N.; Widyaputra, S.S.; Cahyanto, A. The Evaluation of Setting Time and FTIR Spectroscopy of Carbonate Apatite Cement as Endodontic Sealer. Key Eng. Mater. 2018, 782, 32–37. [Google Scholar] [CrossRef]
- Jia, C.P.; Qiao, C.H.; Wei, J.C.; Wang, H.M.; Shi, L.Q.; Ning, F.Z.; Liu, S.L.; Yang, M.Y.; Xu, X.; Dong, F.Y.; et al. The Study on the Mechanism of Fluorine Transformation between Water and Rock (Soil) in Seawater Intrusion Areas Based on FTIR Spectrum. Spectrosc. Spectr. Anal. 2019, 39, 1036–1040. [Google Scholar]
- Li, S.; Ihli, J.; Marchant, W.J.; Zeng, M.; Chen, L.; Wehbe, K.; Cinque, G.; Cespedes, O.; Kapur, N.; Meldrum, F.C. Synchrotron FTIR mapping of mineralization in a microfluidic device. Lab Chip 2017, 17, 1616–1624. [Google Scholar] [CrossRef]
- Garrido-Cordero, J.A.; Odriozola, C.P.; Sousa, A.C.; Gonçalves, V.S. Fluorite and translucent beads in Iberian Late Prehistory. Mater. Manuf. Processes 2020, 35, 1424–1430. [Google Scholar] [CrossRef]
- Keramidas, V.G.; White, W.B. Raman Spectra of Oxides with the Fluorite Structure. J. Chem. Phys. 1973, 59, 1561–1562. [Google Scholar] [CrossRef]
- Srivastava, R.; Lauer, H.V.; Chase, L.L.; Bron, W.E. Raman Frequencies of Fluorite Crystals. Phys. Lett. A 1971, 36, 333–334. [Google Scholar] [CrossRef]
- Alencar, I.; Ruiz-Fuertes, J.; Schwartz, K.; Trautmann, C.; Bayarjargal, L.; Haussühl, E.; Winkler, B. Irradiation effects in CaF2 probed by Raman scattering. J. Raman Spectrosc. 2016, 47, 978–983. [Google Scholar] [CrossRef]
- Čermáková, Z.; Bezdička, P.; Němec, I.; Hradilová, J.; Šrein, V.; Blažek, J.; Hradil, D. Naturally irradiated fluorite as a historic violet pigment: X-ray diffraction and Raman spectroscopic study. Acta Crystallogr. Sect. A Found. Adv. 2015, 71, s529–s530. [Google Scholar] [CrossRef]
- Chen, H.; Stimets, R.W. Fluorescence of trivalent neodymium in various materials excited by a 785 nm laser. Am. Mineral. 2014, 99, 332–342. [Google Scholar] [CrossRef]
- Li, L.; Tang, X.; Jiang, Z.; Zhou, X.; Jiang, S.; Luo, X.; Xiang, G.; Zhou, K. NaBaLa2(PO4)3: A novel host lattice for Sm3+-doped phosphor materials emitting reddish-orange light. J. Alloy. Compd. 2017, 701, 515–523. [Google Scholar] [CrossRef]
- Guo, Q.; Wang, Q.; Jiang, L.; Liao, L.; Liu, H.; Mei, L. A novel apatite, Lu5(SiO4)3N:(Ce,Tb), phosphor material: Synthesis, structure and applications for NUV-LEDs. Phys. Chem. Chem. Phys. 2016, 18, 15545–15554. [Google Scholar] [CrossRef]


| Sample | a, b, c (Å) | Cell Volume (Å3) | Fitting Profiles (R) |
|---|---|---|---|
| 1 | 5.45278 | 162.13 | 7.52 |
| 2 | 5.46082 | 162.93 | 8.52 |
| 3 | 5.45843 | 162.63 | 11.49 |
| PDF#35-0816 | 5.46305 | 163.0 |
| Possible REE Ions | Emission Lines (nm) | Electronic Transitions | Reference |
|---|---|---|---|
| Eu2+ | 425 | Eg-8S7/2 | [21,22,23,24,25] |
| Tm3+ | 452 | 1D2-3H4 | [26,27,28,29,30] |
| Er3+ | 4I15/2-4F5/2 | ||
| Pr3+ | 469 | 3H4-3P1 | [31,32] |
| Tm3+ | 482 and 493 | 1G4-3H6 | [32,33] |
| Tb3+ | 5D4-7F6 | ||
| Er3+ | 4I15/2-4G7/2 | ||
| Dy3+ | 4F9/2-6H15/2 | ||
| Pr3+ | 3H4-3P0 | ||
| Er3+ | 525 | 2H11/2-4I15/2 | [34,35] |
| Er3+ | 561 | 4S3/2-4I15/2 | [35,36] |
| Sm3+ | 4G5/2-6H5/2 | ||
| Dy3+ | 4F9-6H13/2 |
| Sample Name | λem = 425 nm | λem = 452 nm | λem = 469 nm |
|---|---|---|---|
| Sample 1 | 0.129 ms | 0.125 ms | 0.009 ms |
| Sample 2 | 0.129 ms | 0.008 ms | 0.043 ms |
| Sample 3 | 0.130 ms | 0.119 ms | 0.040 ms |
Publisher’s Note: MDPI stays neutral with regard to jurisdictional claims in published maps and institutional affiliations. |
© 2022 by the authors. Licensee MDPI, Basel, Switzerland. This article is an open access article distributed under the terms and conditions of the Creative Commons Attribution (CC BY) license (https://creativecommons.org/licenses/by/4.0/).
Share and Cite
Ge, X.; Guo, Q.; Wang, Q.; Li, T.; Liao, L. Mineralogical Characteristics and Luminescent Properties of Natural Fluorite with Three Different Colors. Materials 2022, 15, 1983. https://doi.org/10.3390/ma15061983
Ge X, Guo Q, Wang Q, Li T, Liao L. Mineralogical Characteristics and Luminescent Properties of Natural Fluorite with Three Different Colors. Materials. 2022; 15(6):1983. https://doi.org/10.3390/ma15061983
Chicago/Turabian StyleGe, Xiao, Qingfeng Guo, Qianqian Wang, Tao Li, and Libing Liao. 2022. "Mineralogical Characteristics and Luminescent Properties of Natural Fluorite with Three Different Colors" Materials 15, no. 6: 1983. https://doi.org/10.3390/ma15061983
APA StyleGe, X., Guo, Q., Wang, Q., Li, T., & Liao, L. (2022). Mineralogical Characteristics and Luminescent Properties of Natural Fluorite with Three Different Colors. Materials, 15(6), 1983. https://doi.org/10.3390/ma15061983