
Al2O3-Cu-Ni Composites Manufactured via Uniaxial Pressing: Microstructure, Magnetic, and Mechanical Properties

 ,
,  ,
,
Abstract
:1. Introduction
2. Materials and Methods
2.1. Materials
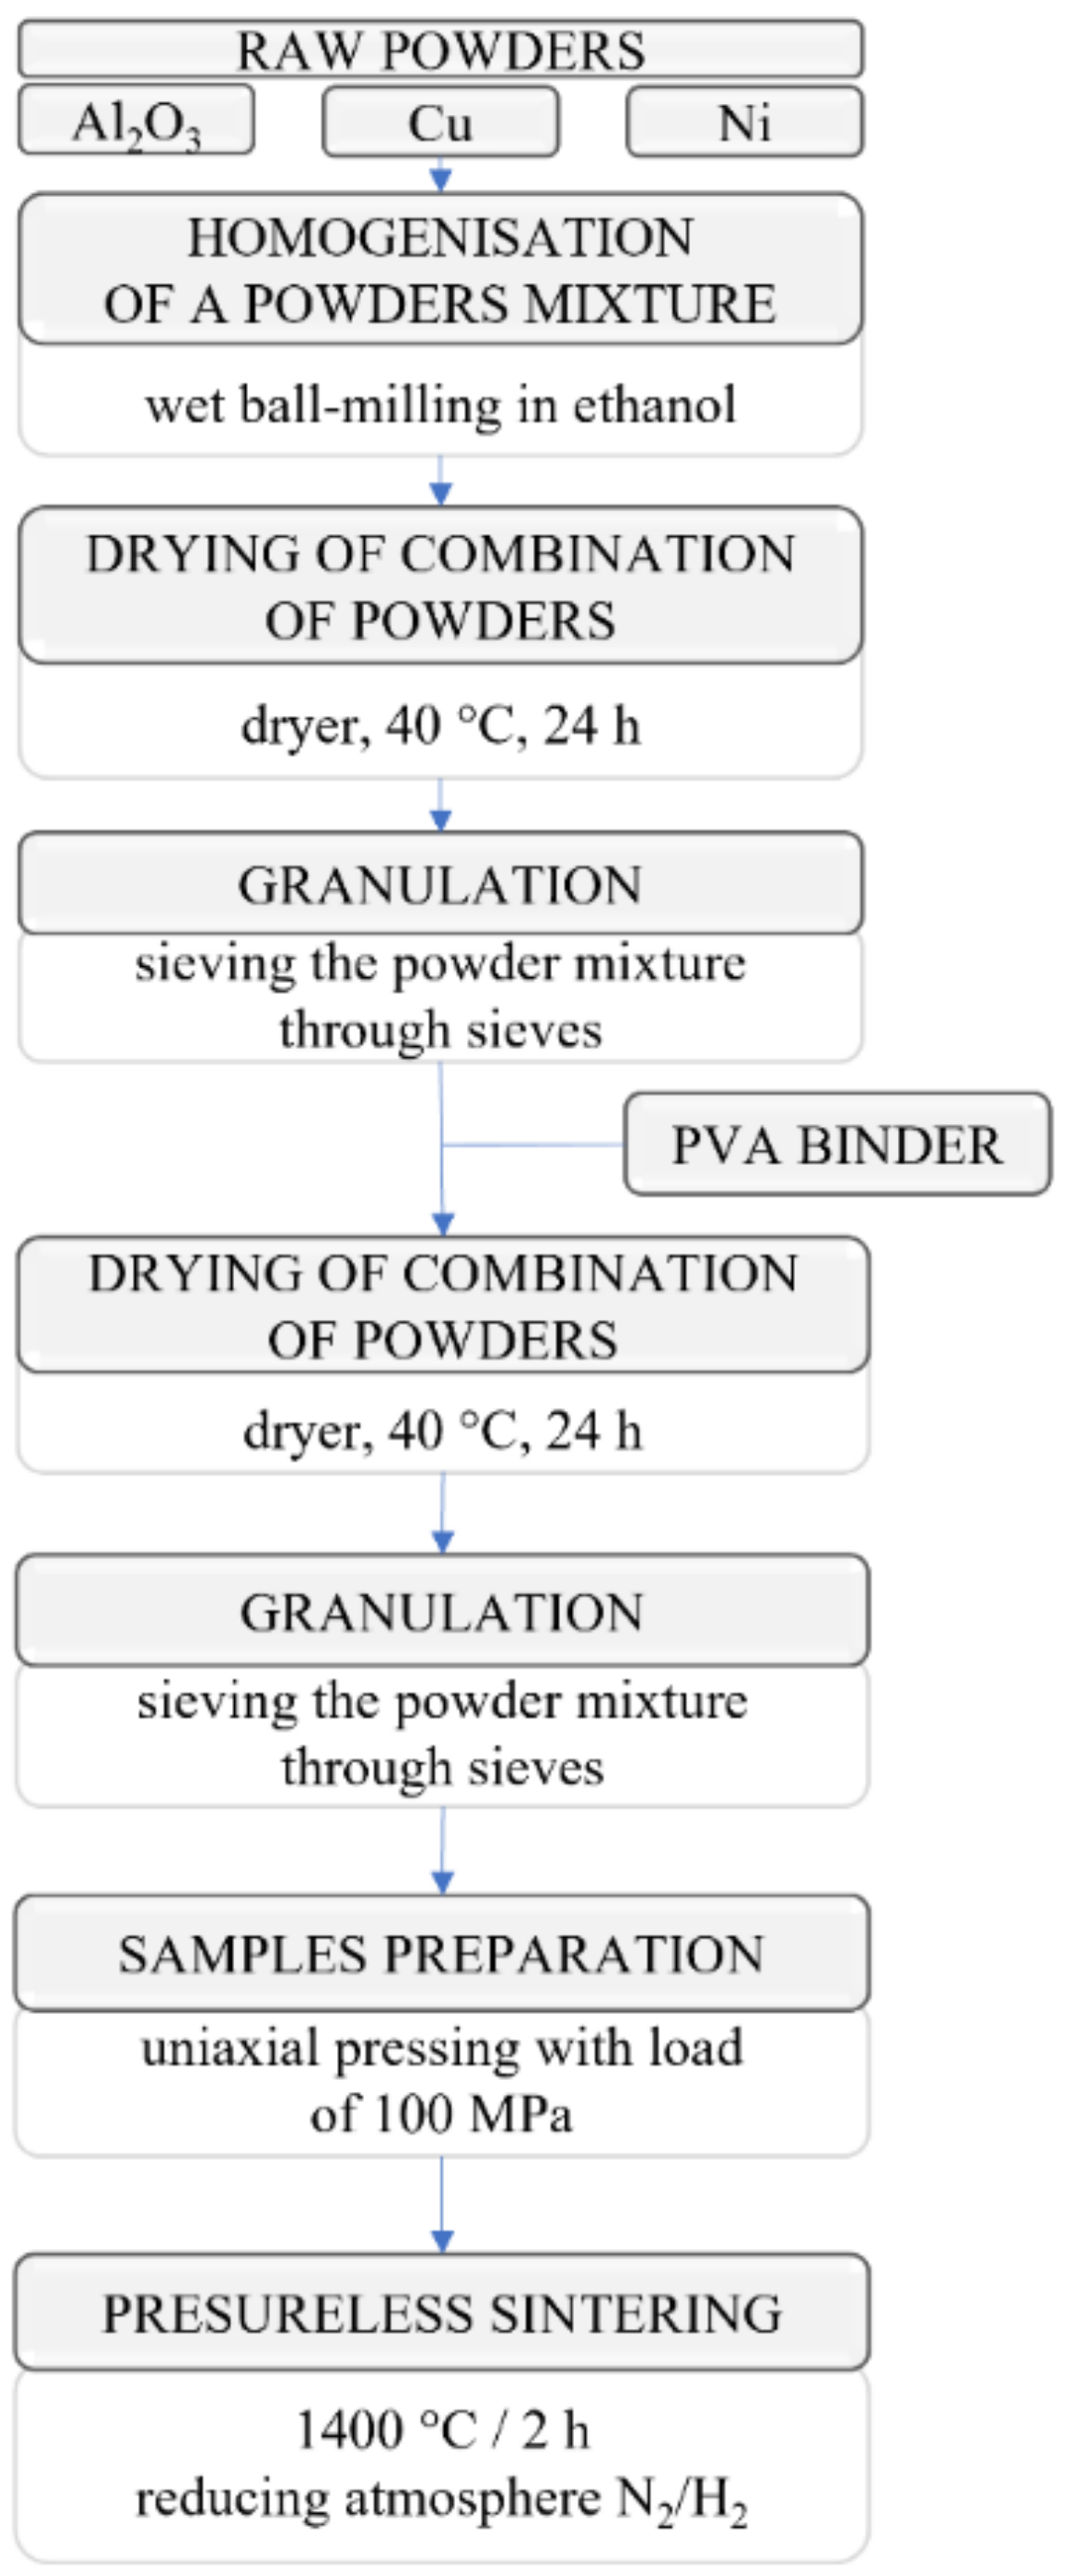
2.2. Preparation of Samples
2.3. Properties Characterization
3. Results and Discussion
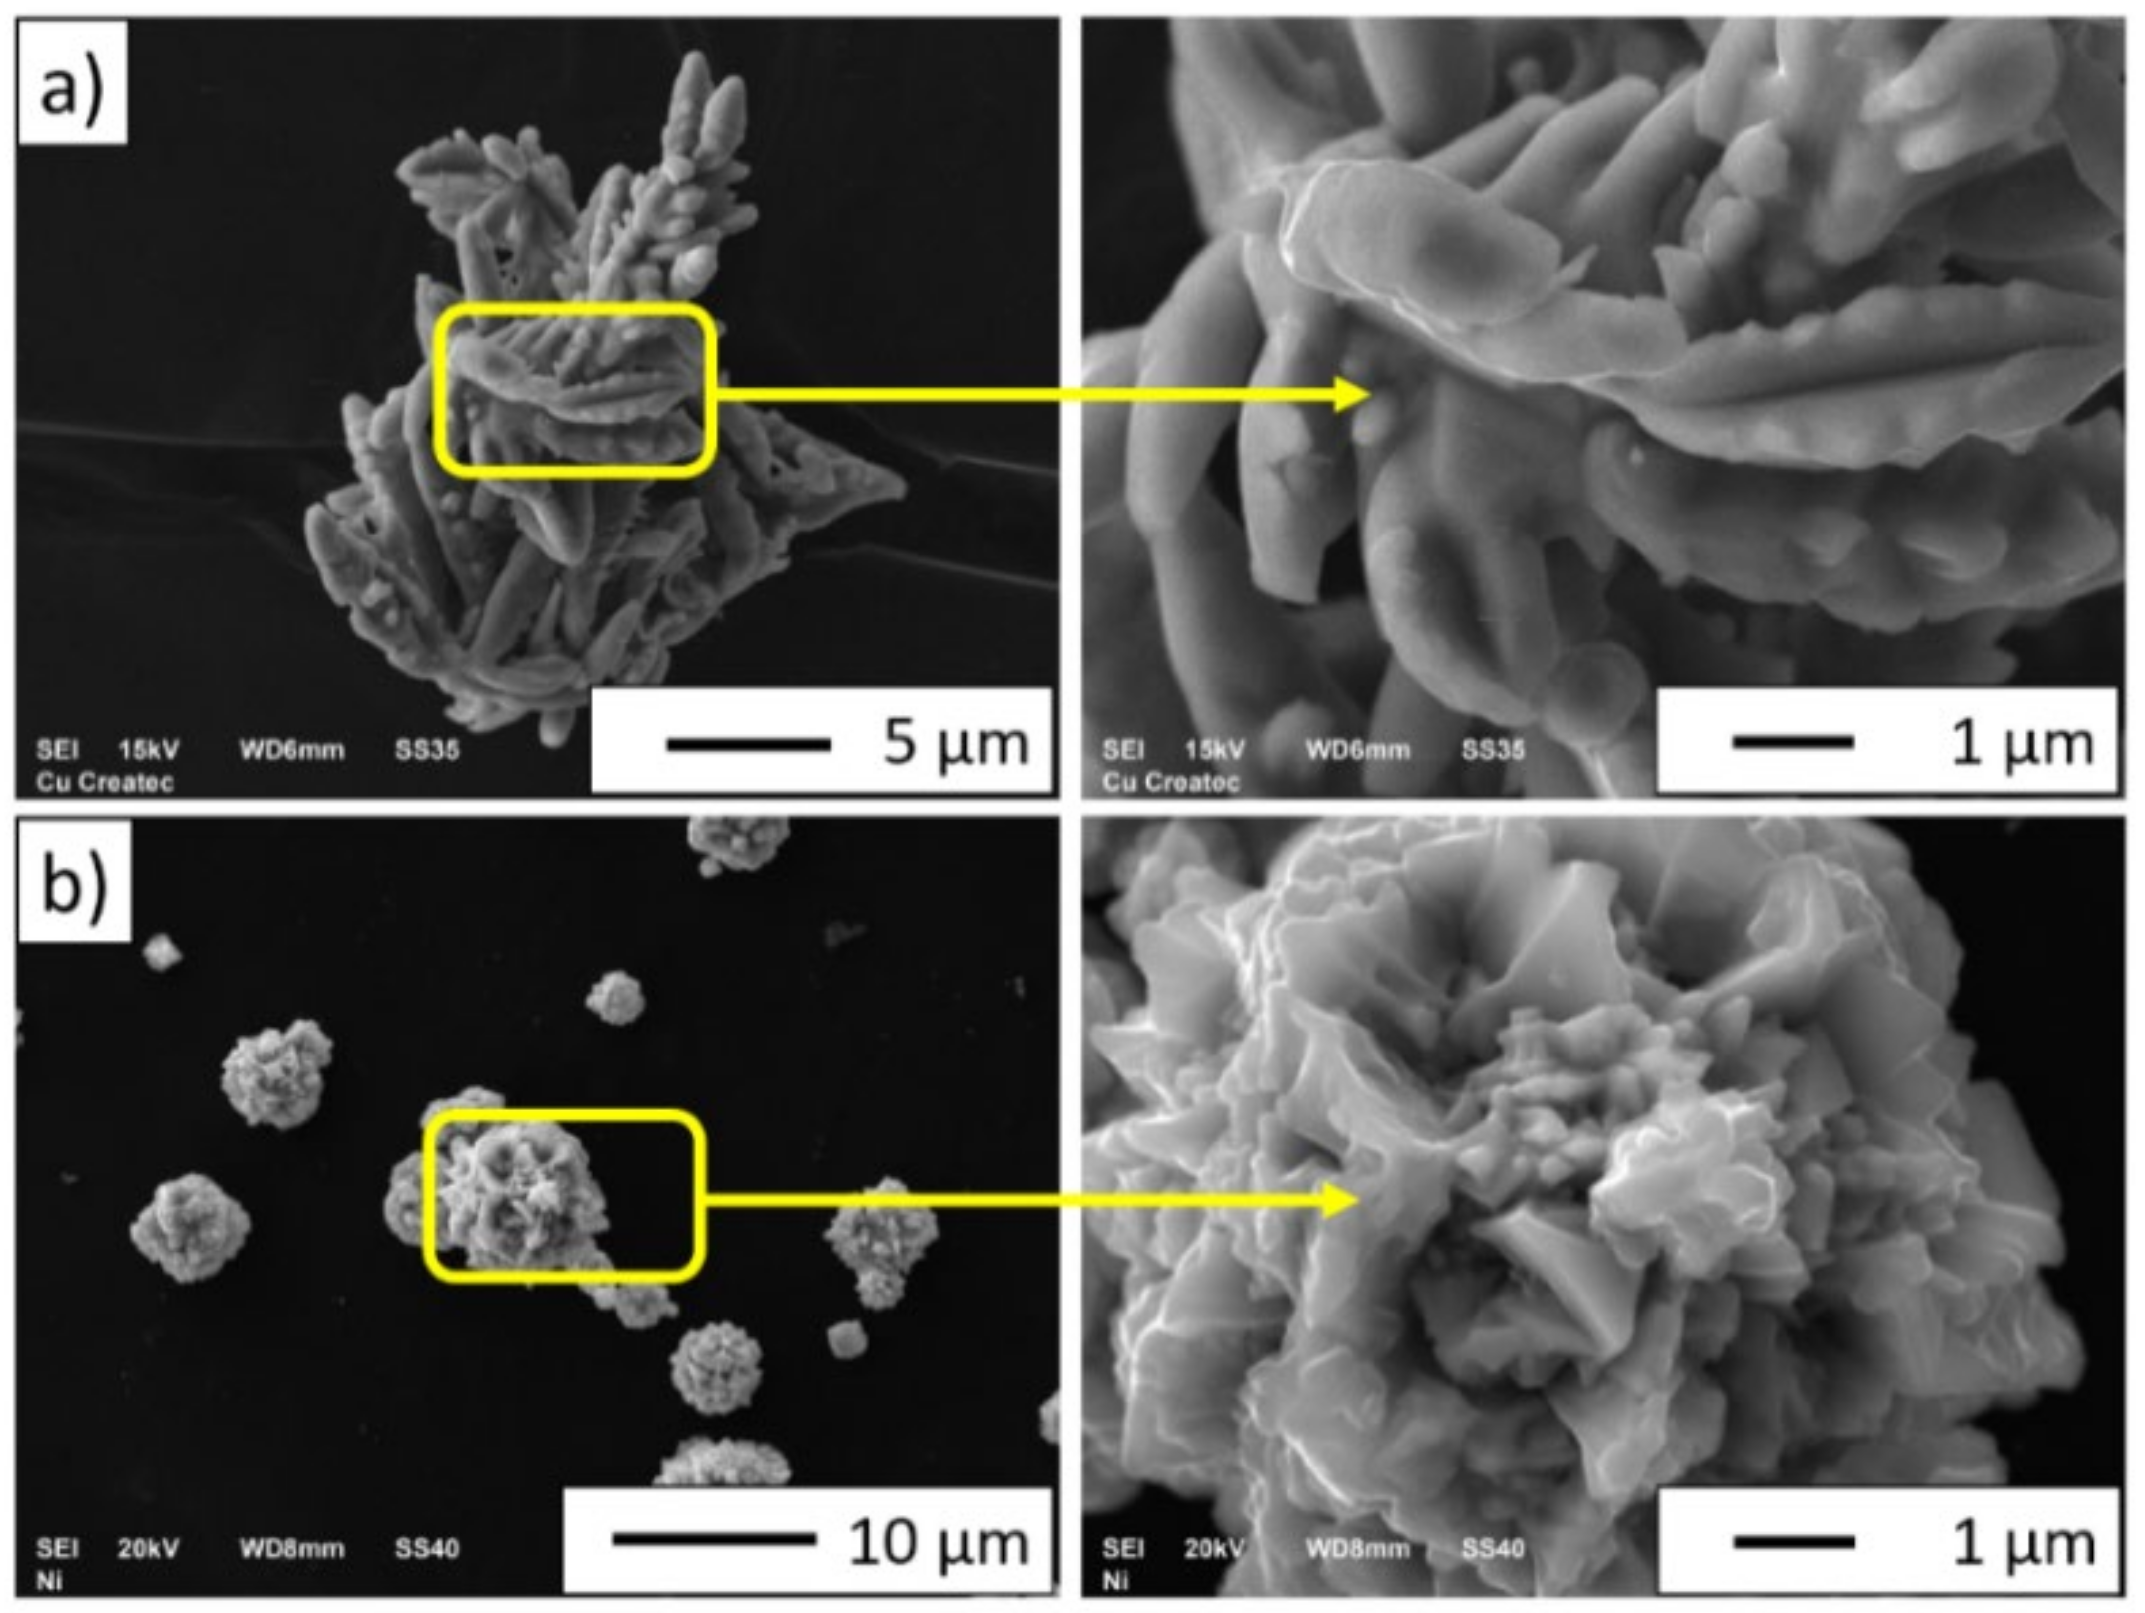
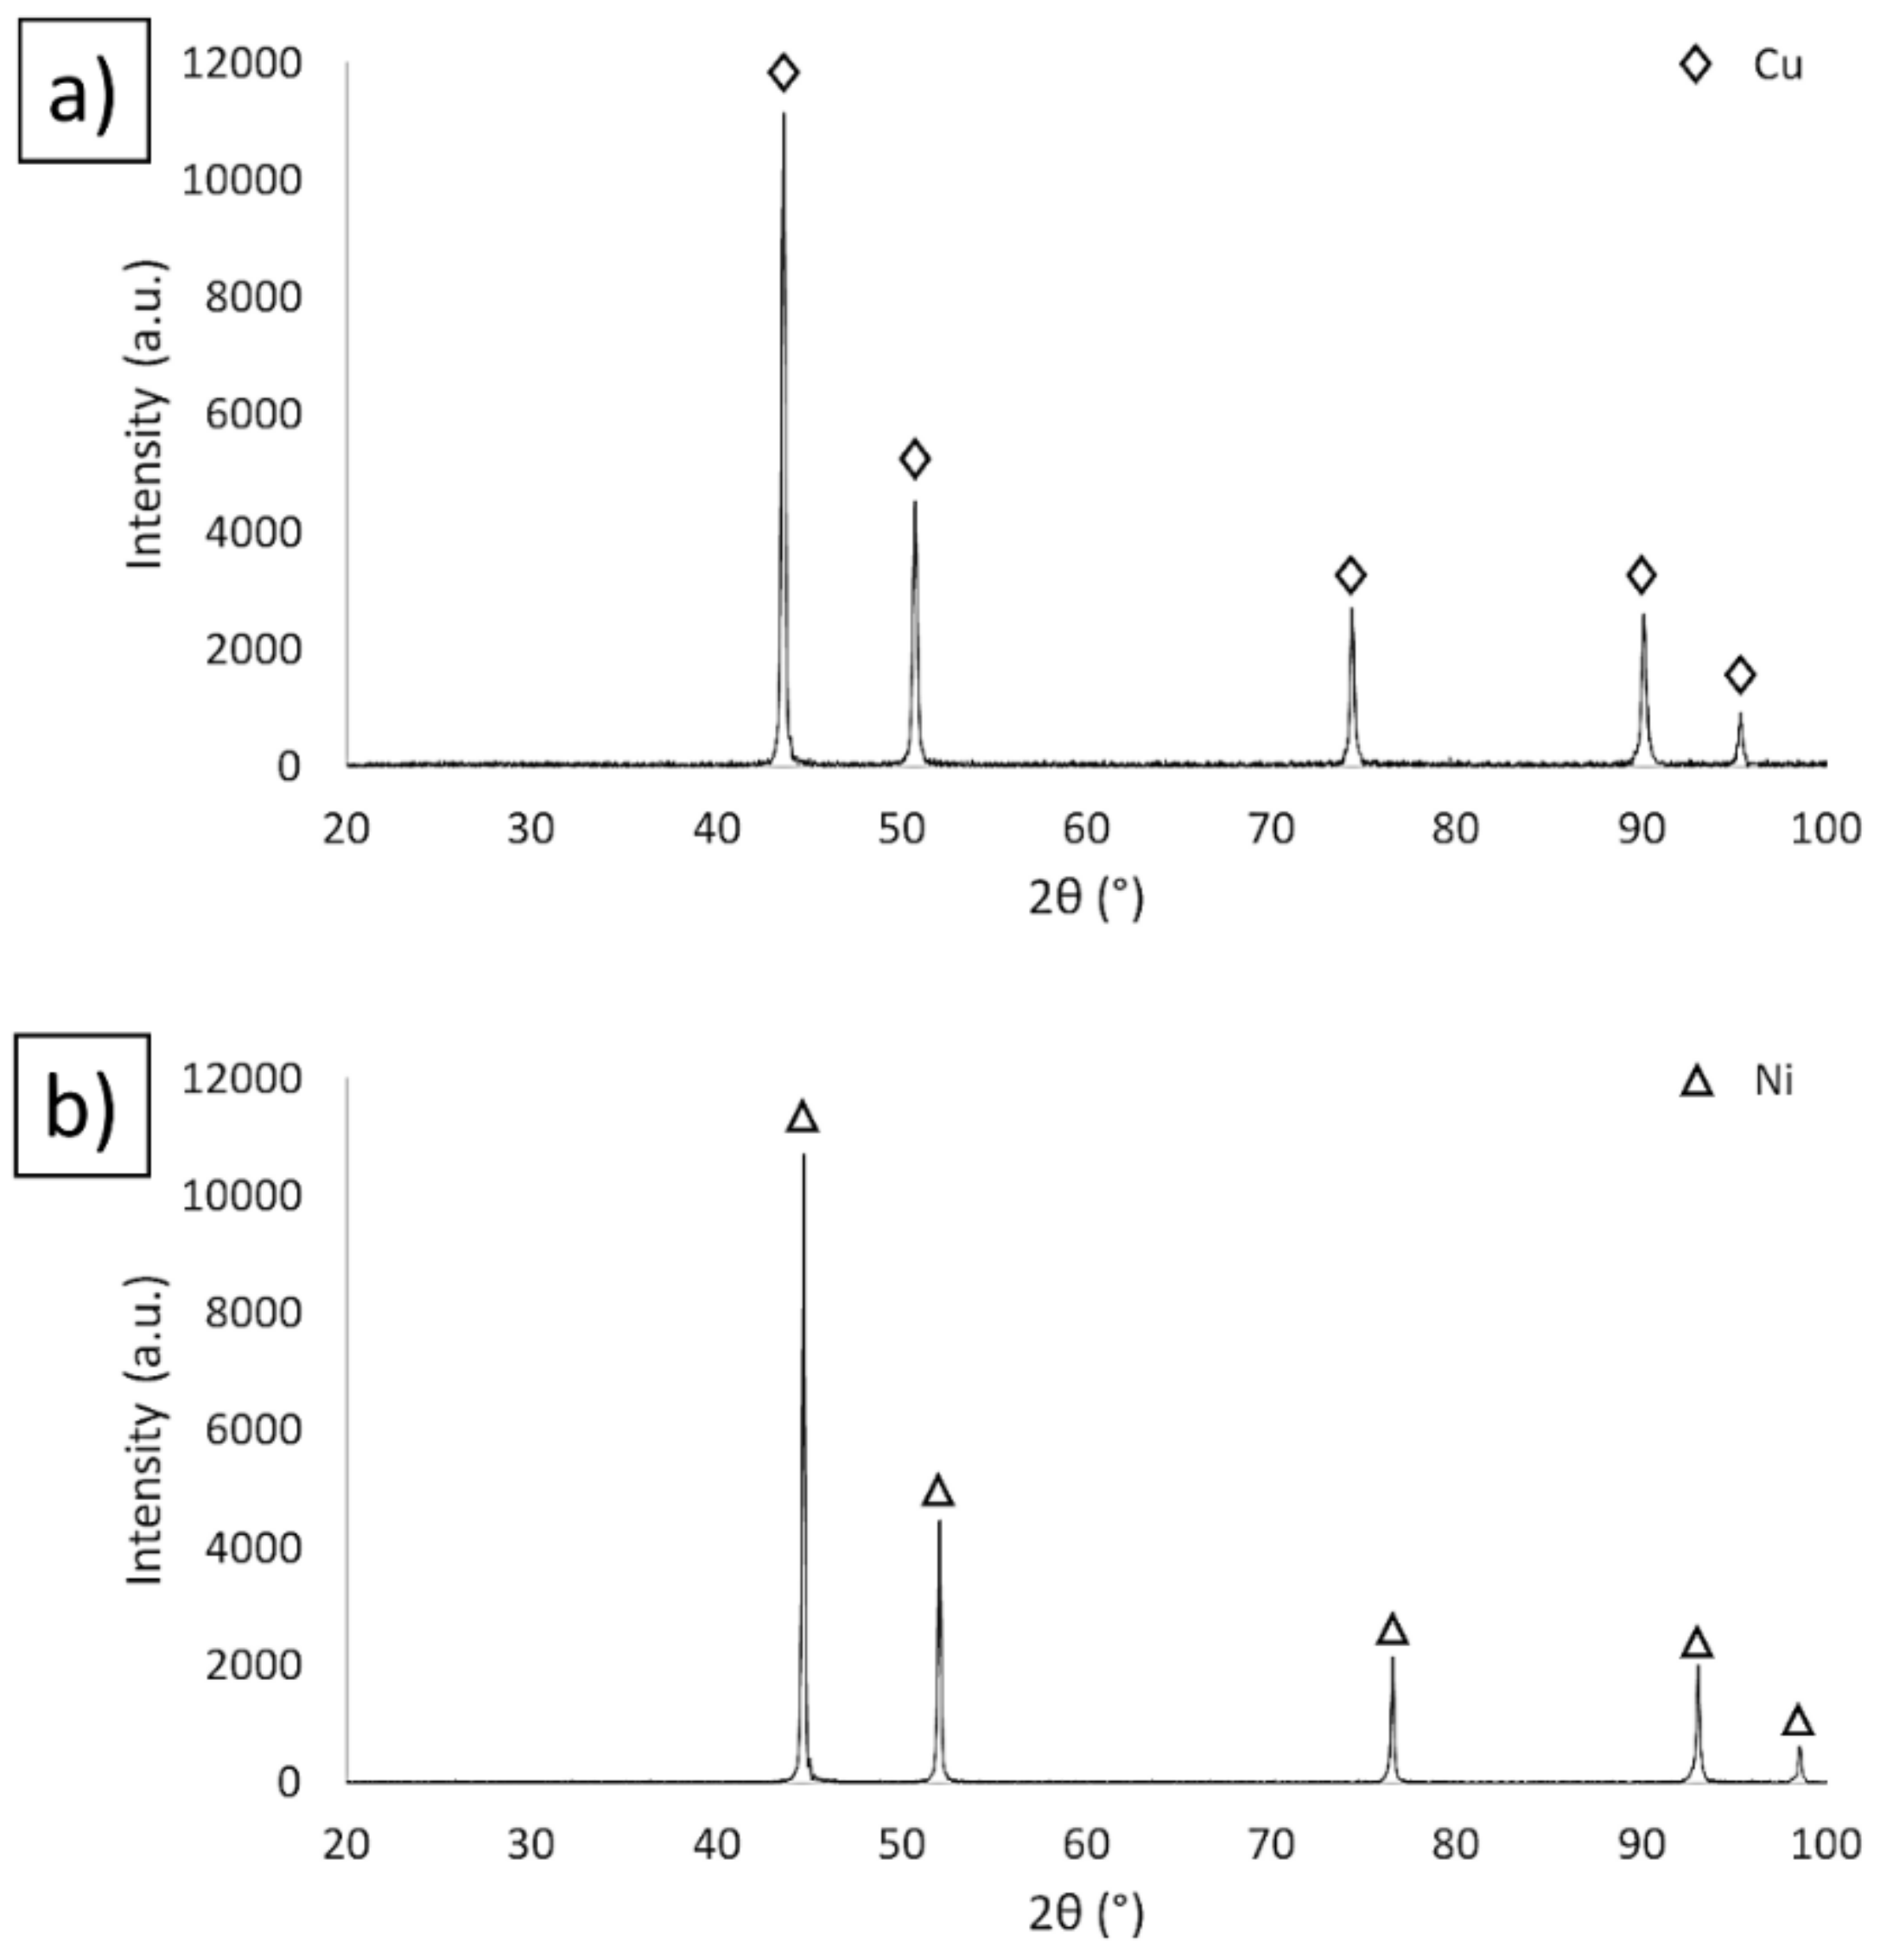
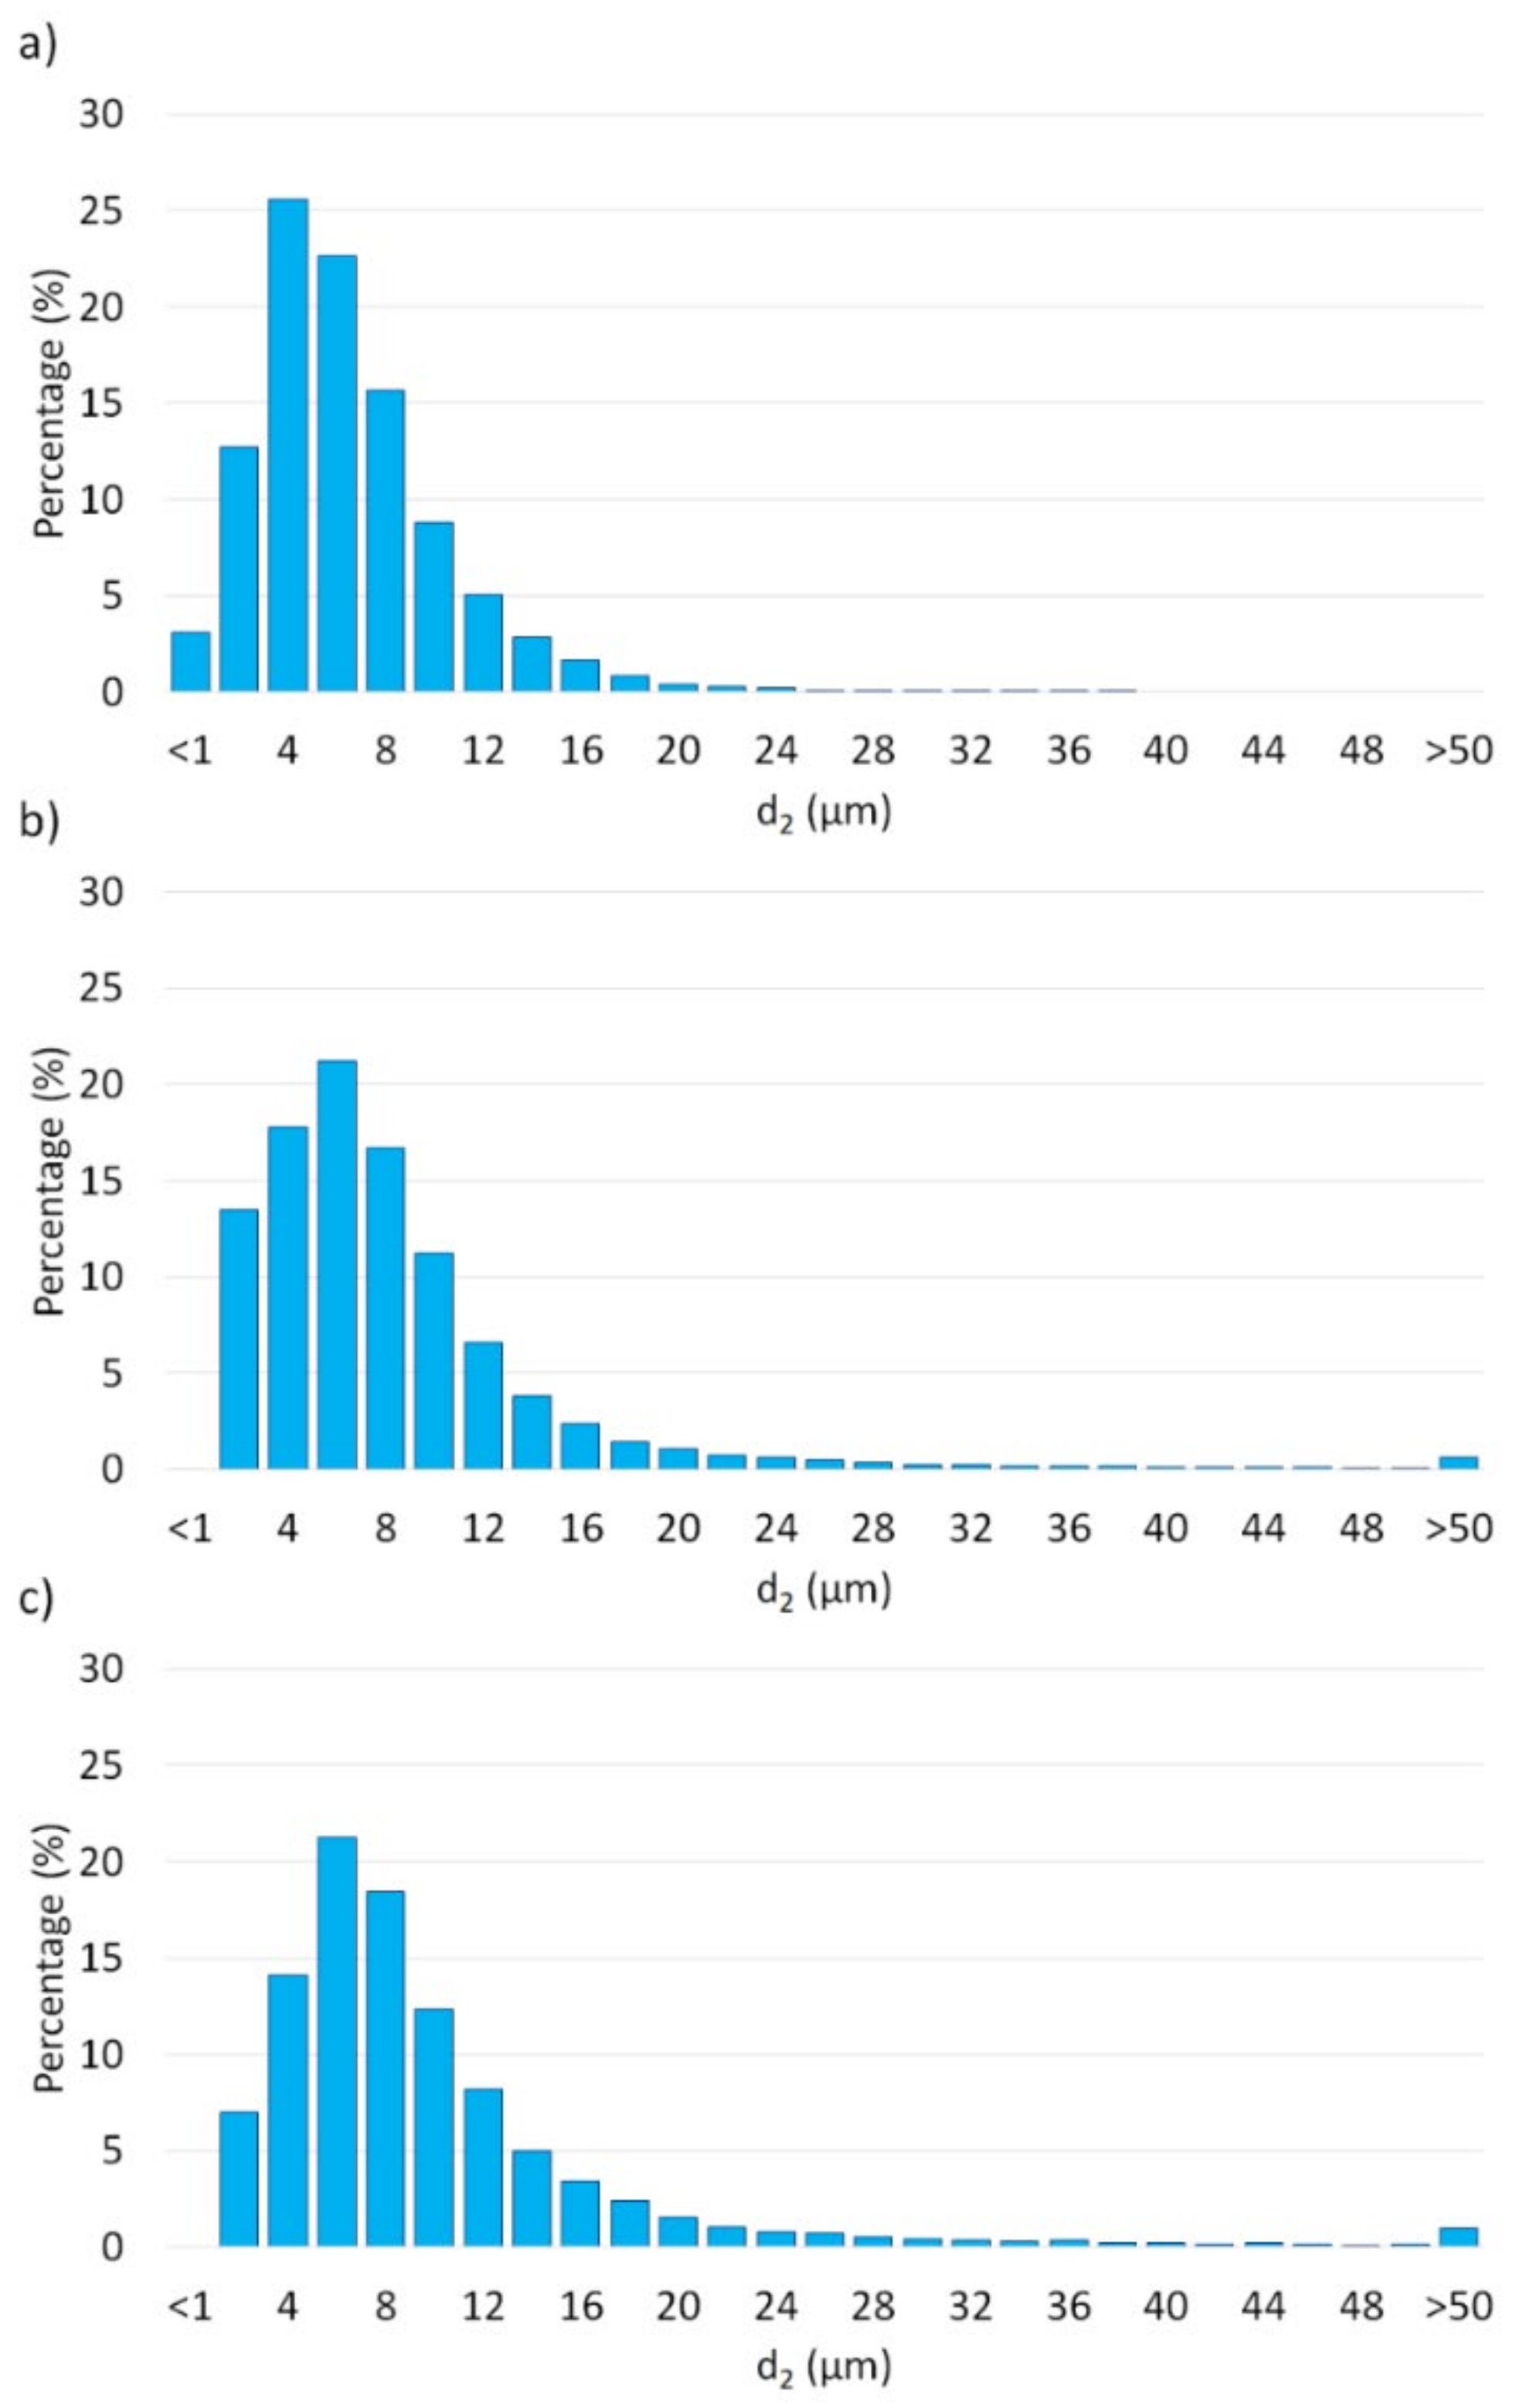
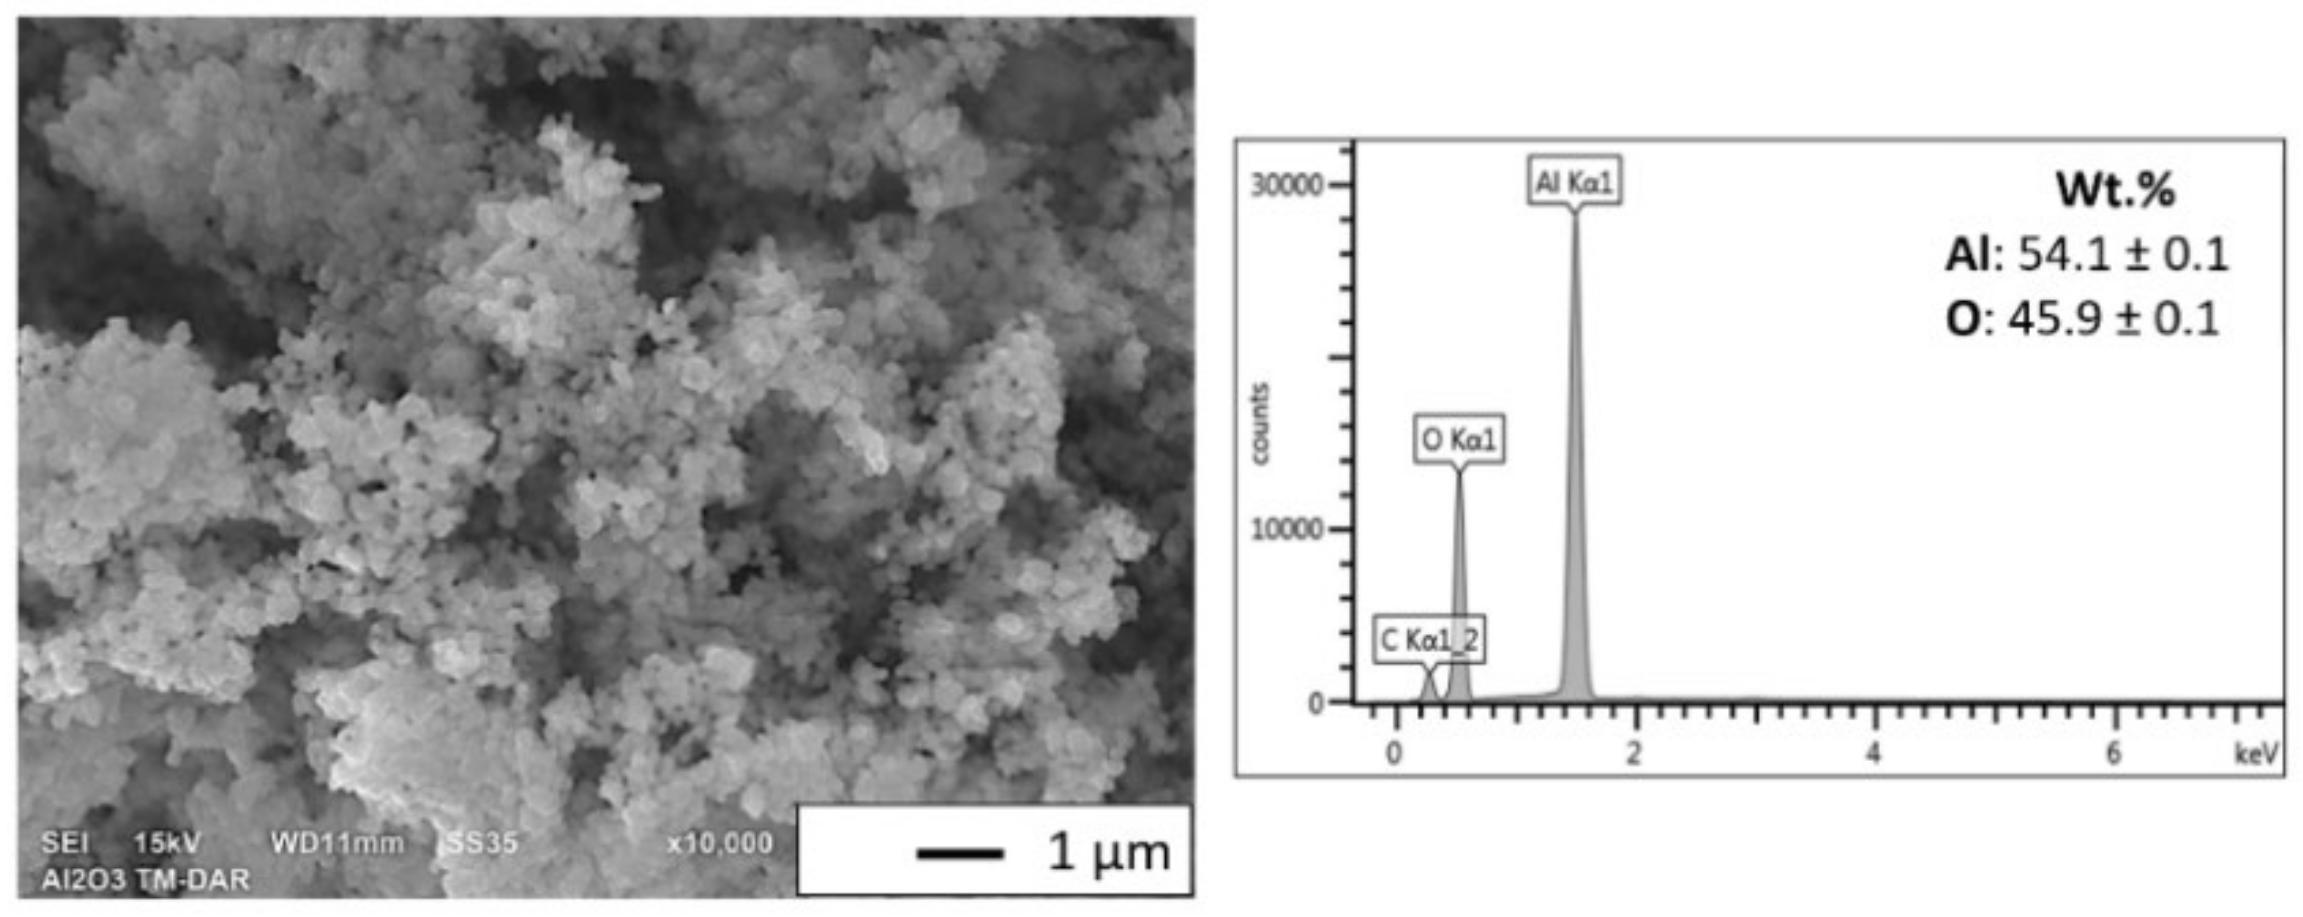
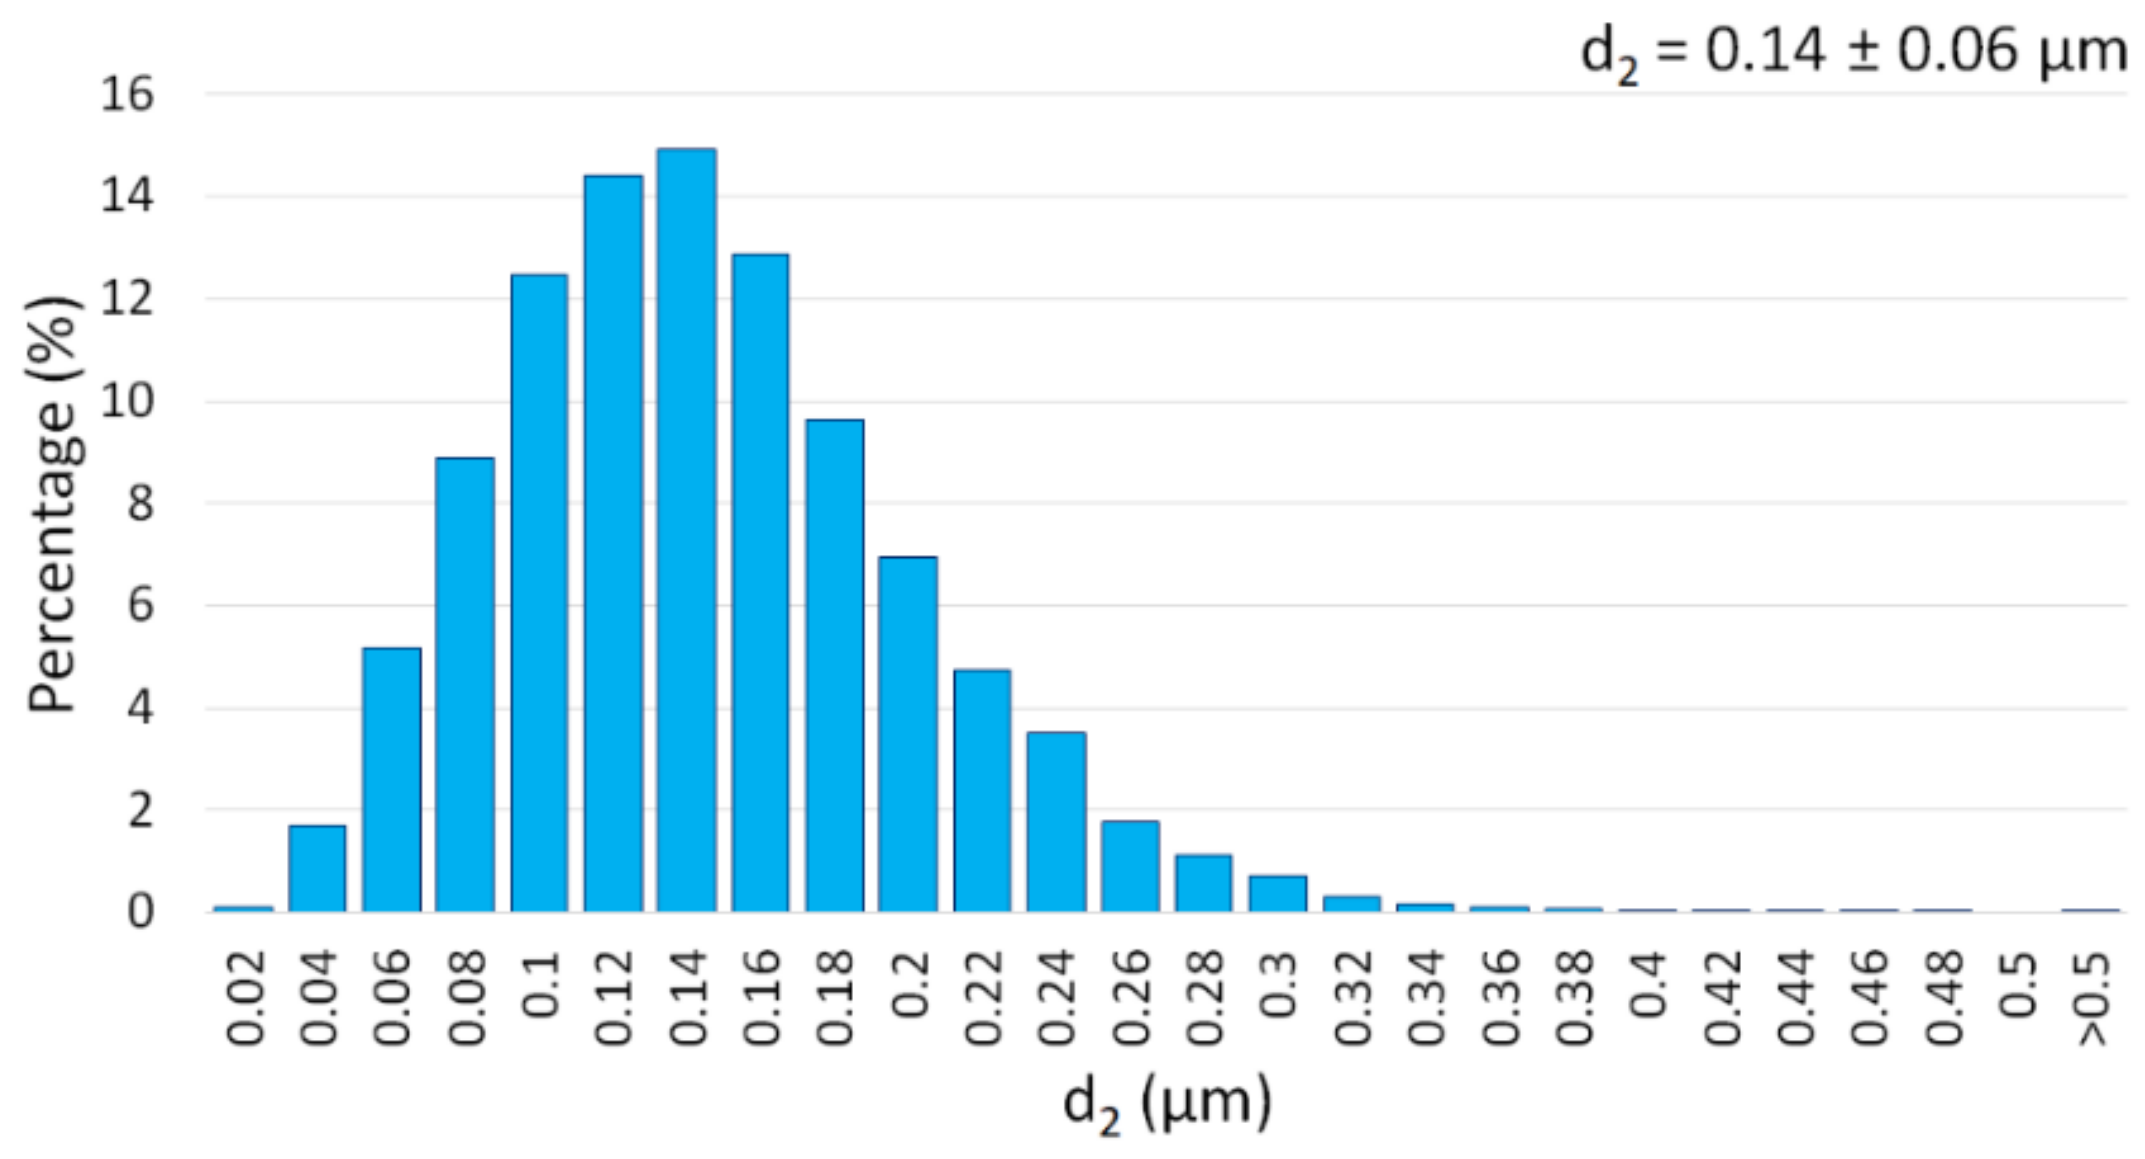
3.1. Description of the Initial Powders
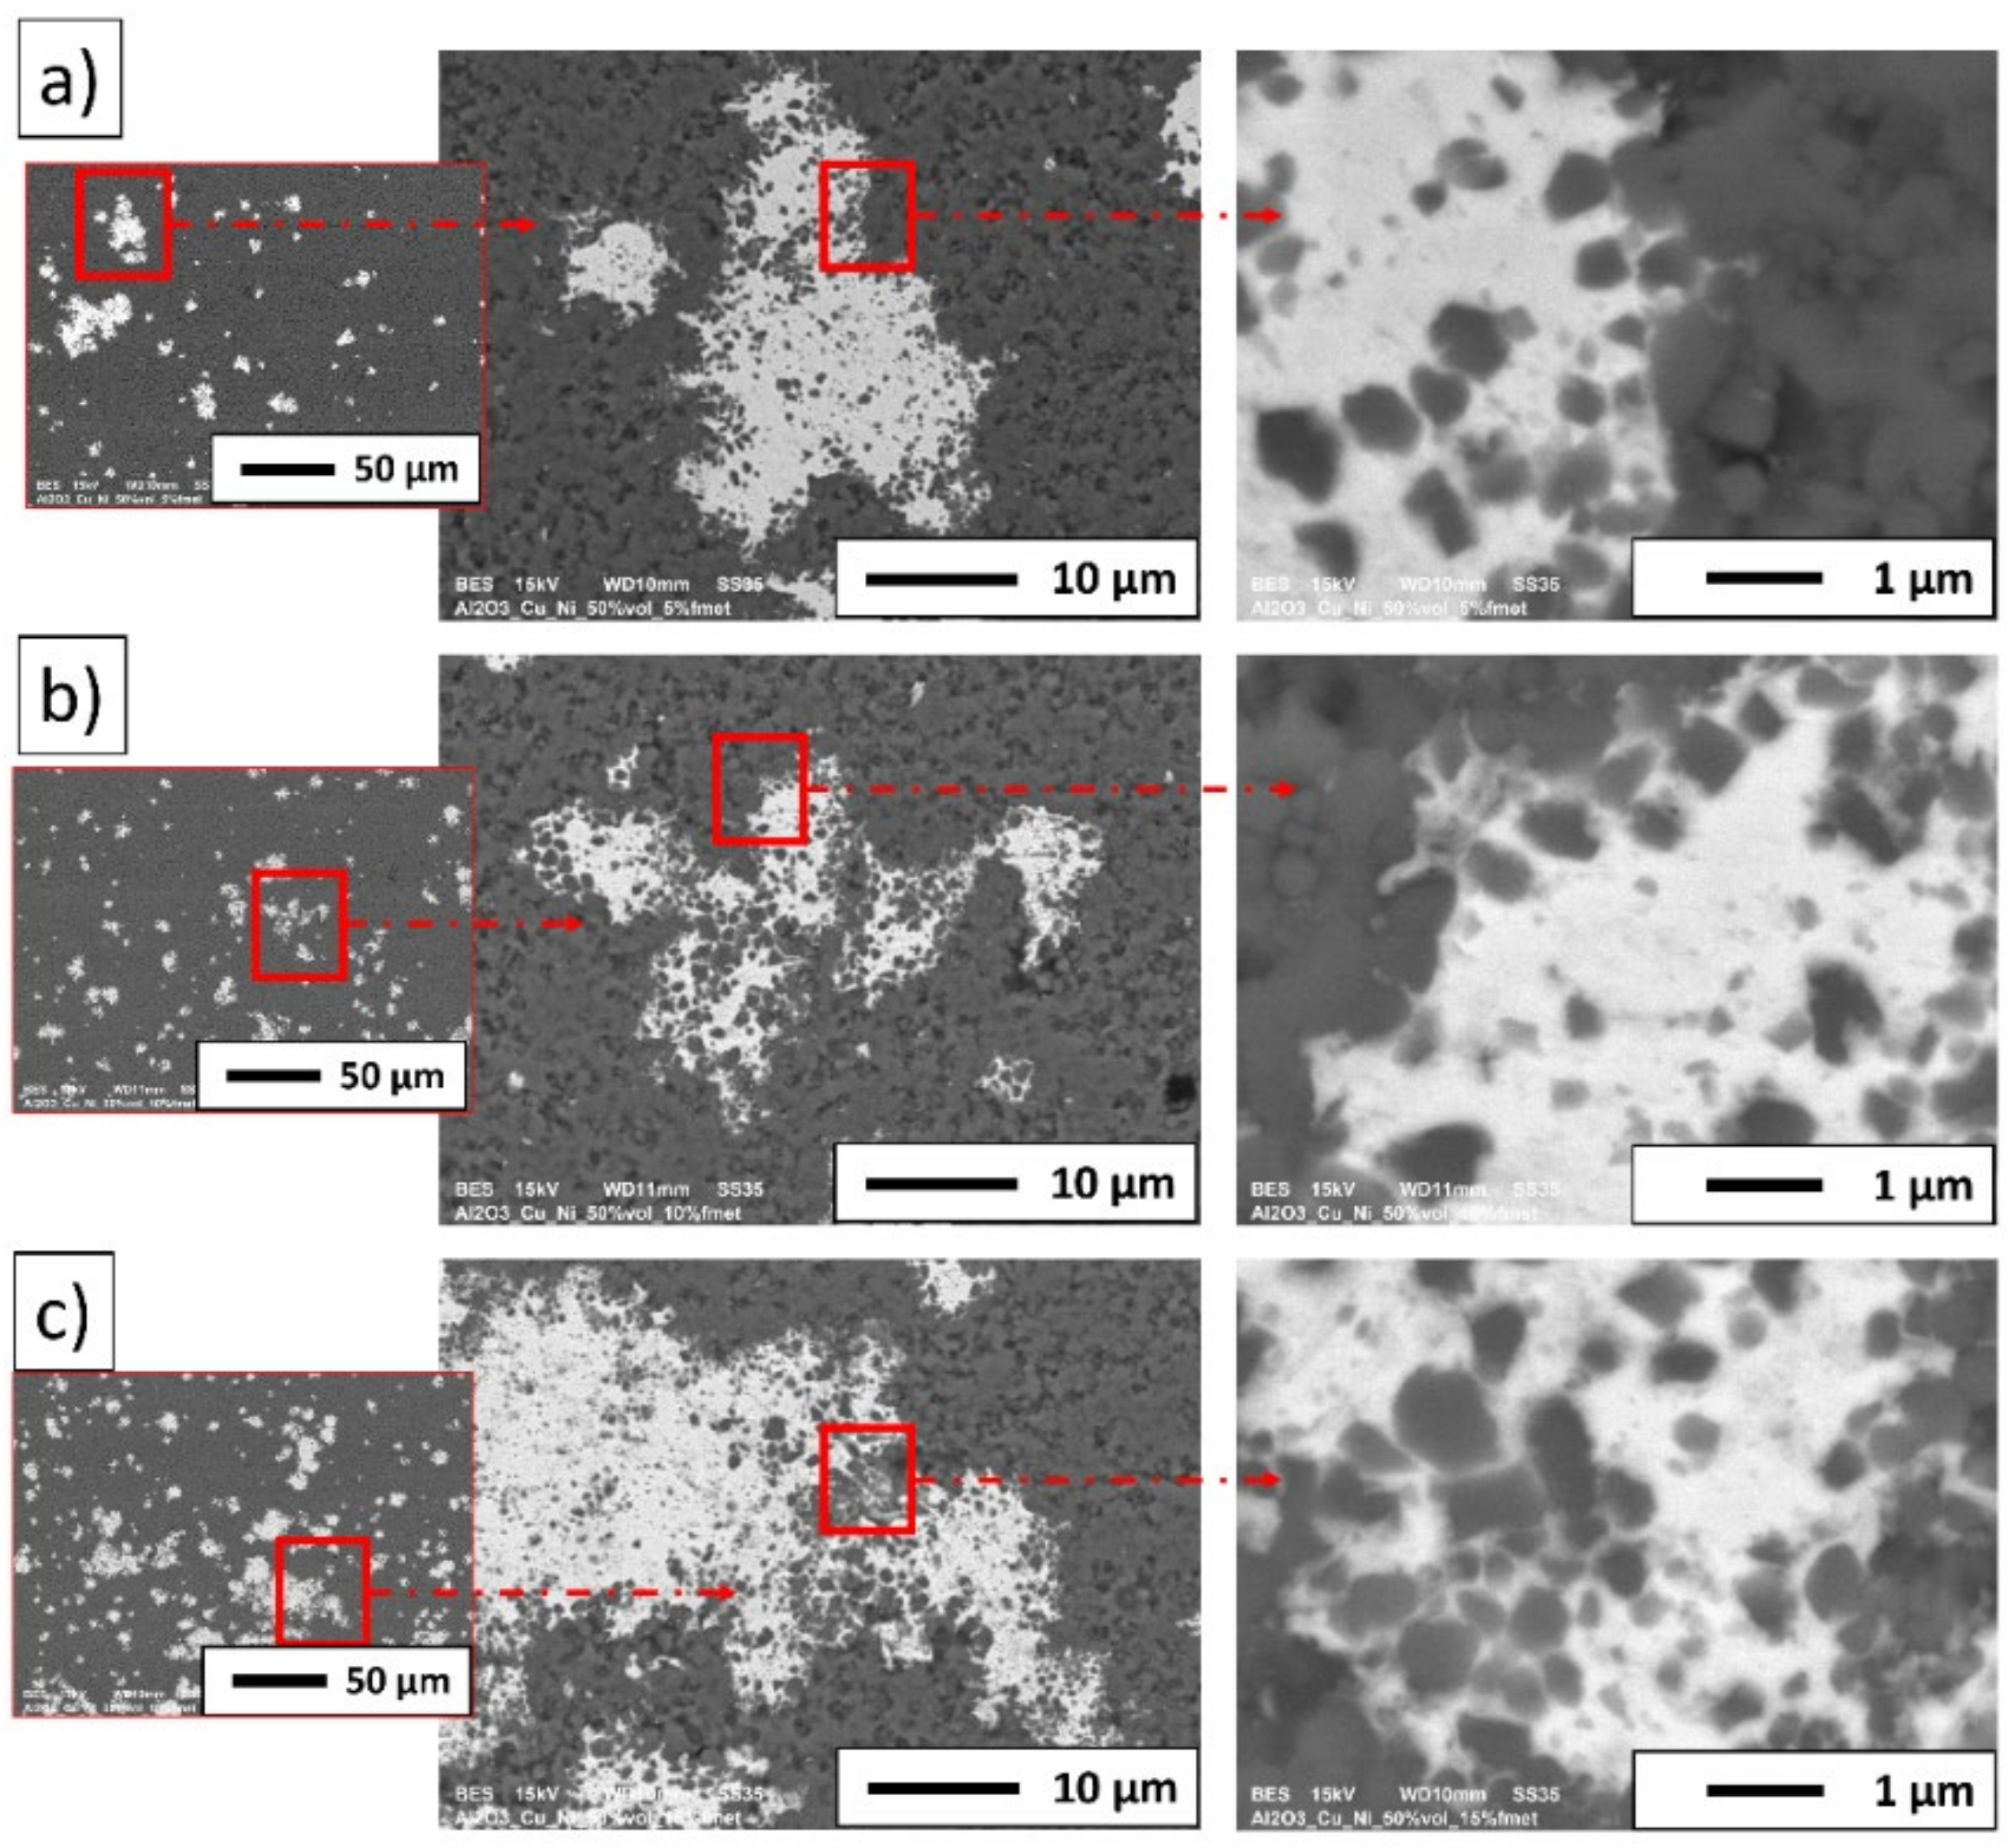
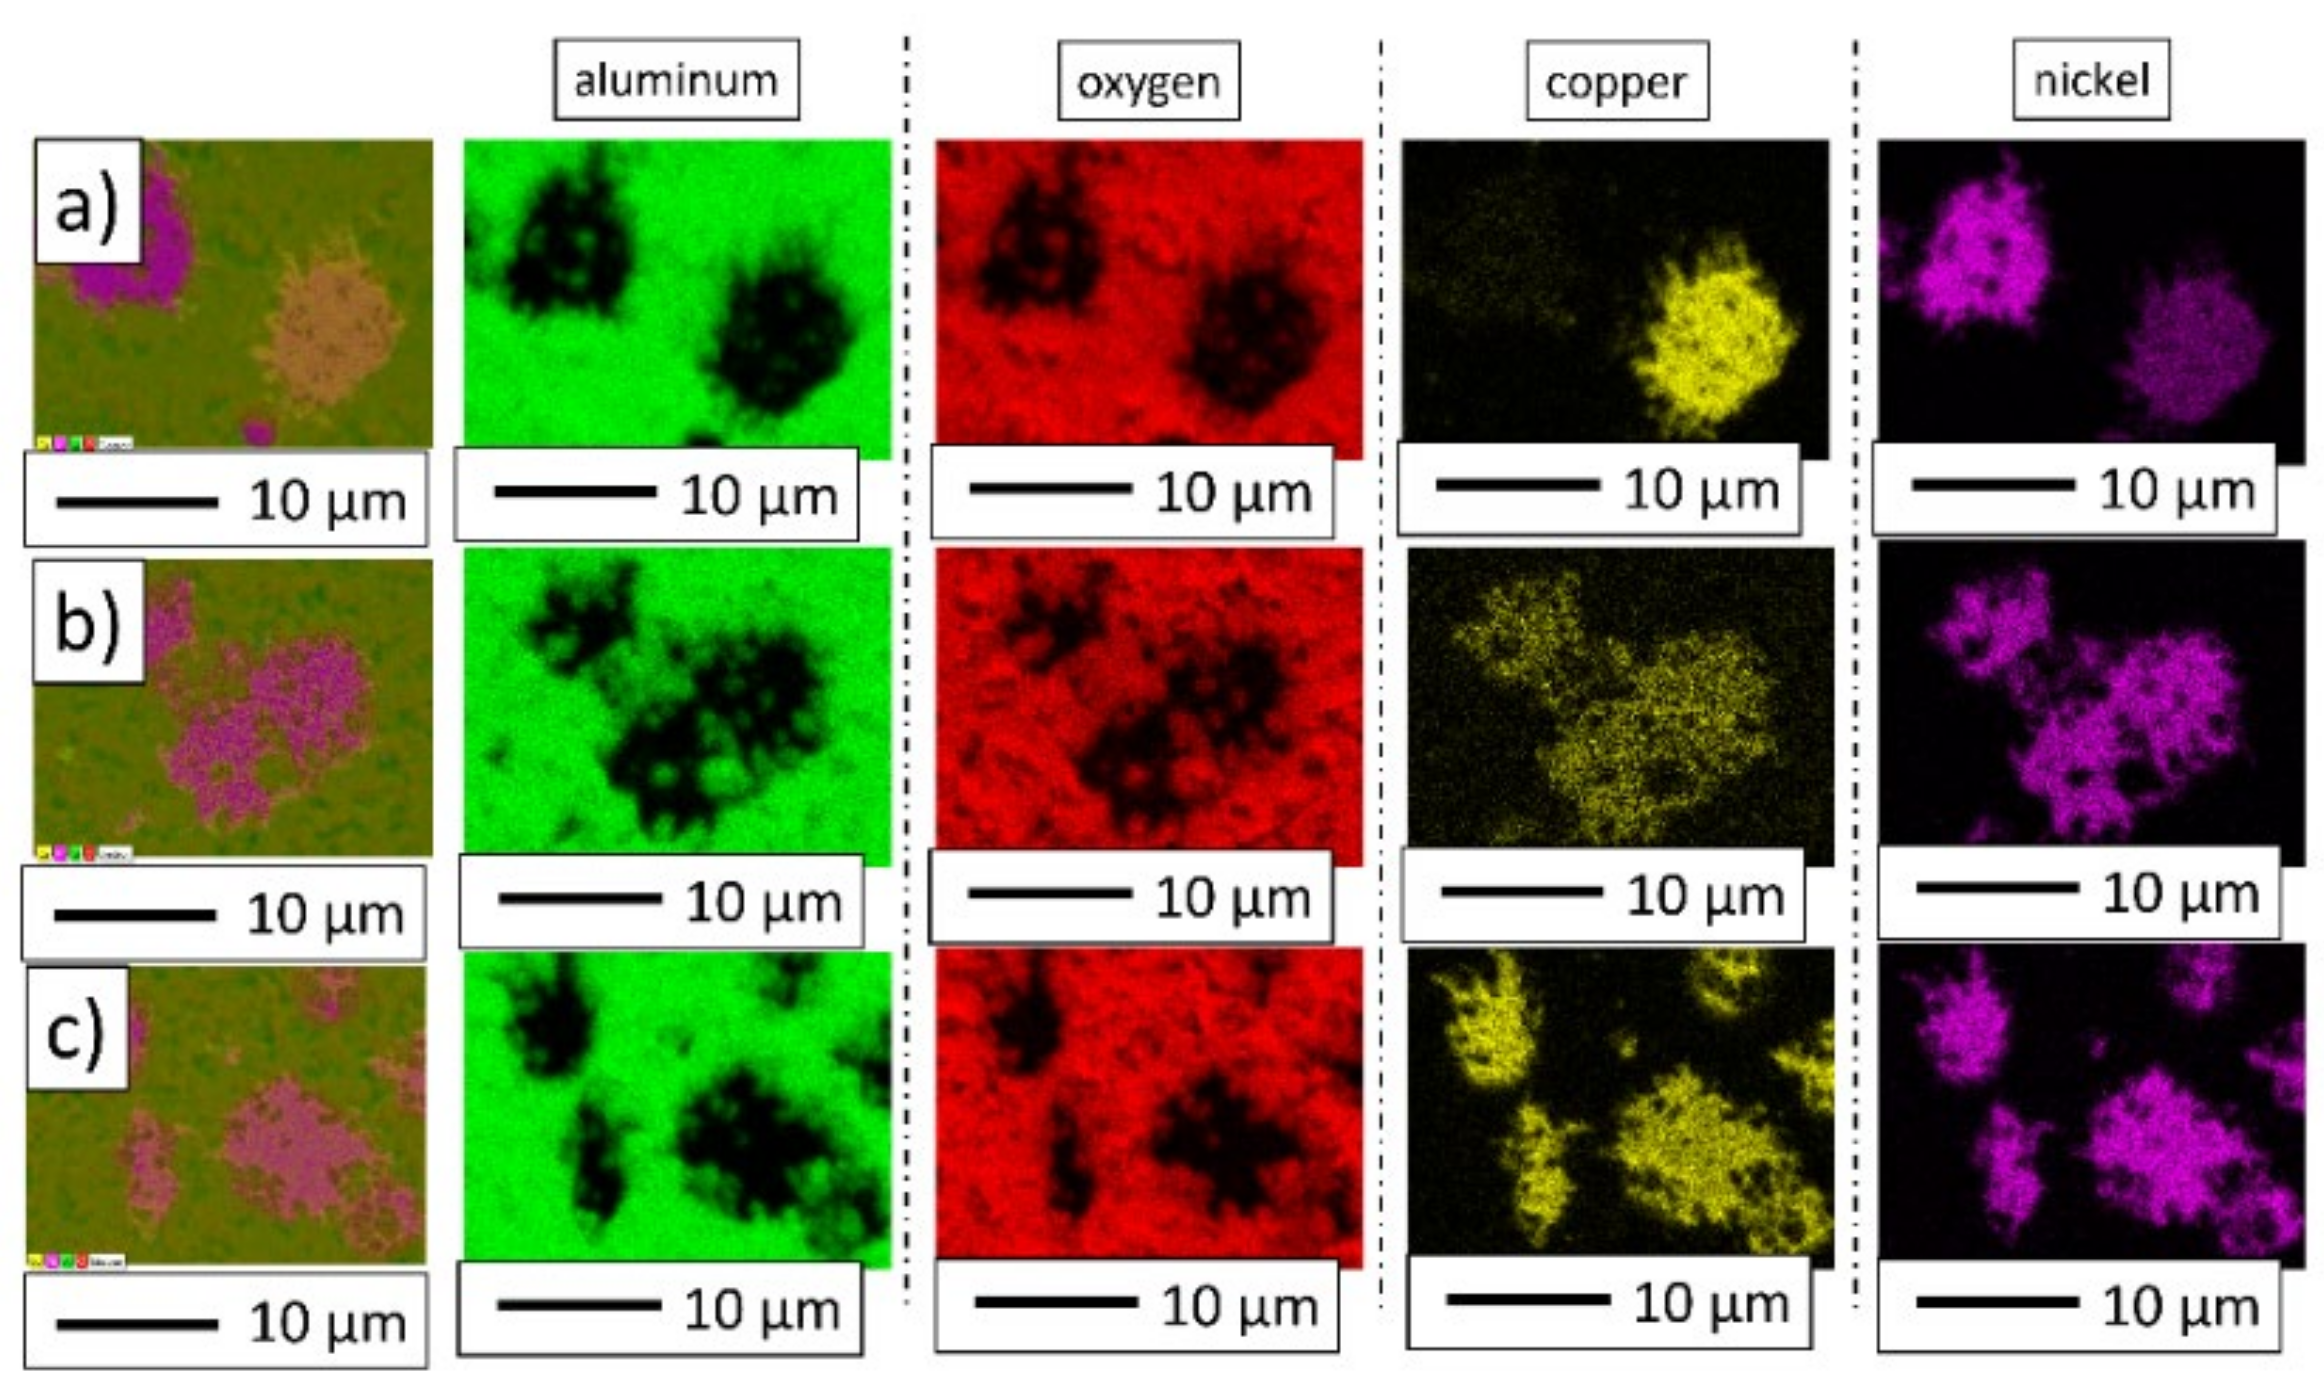
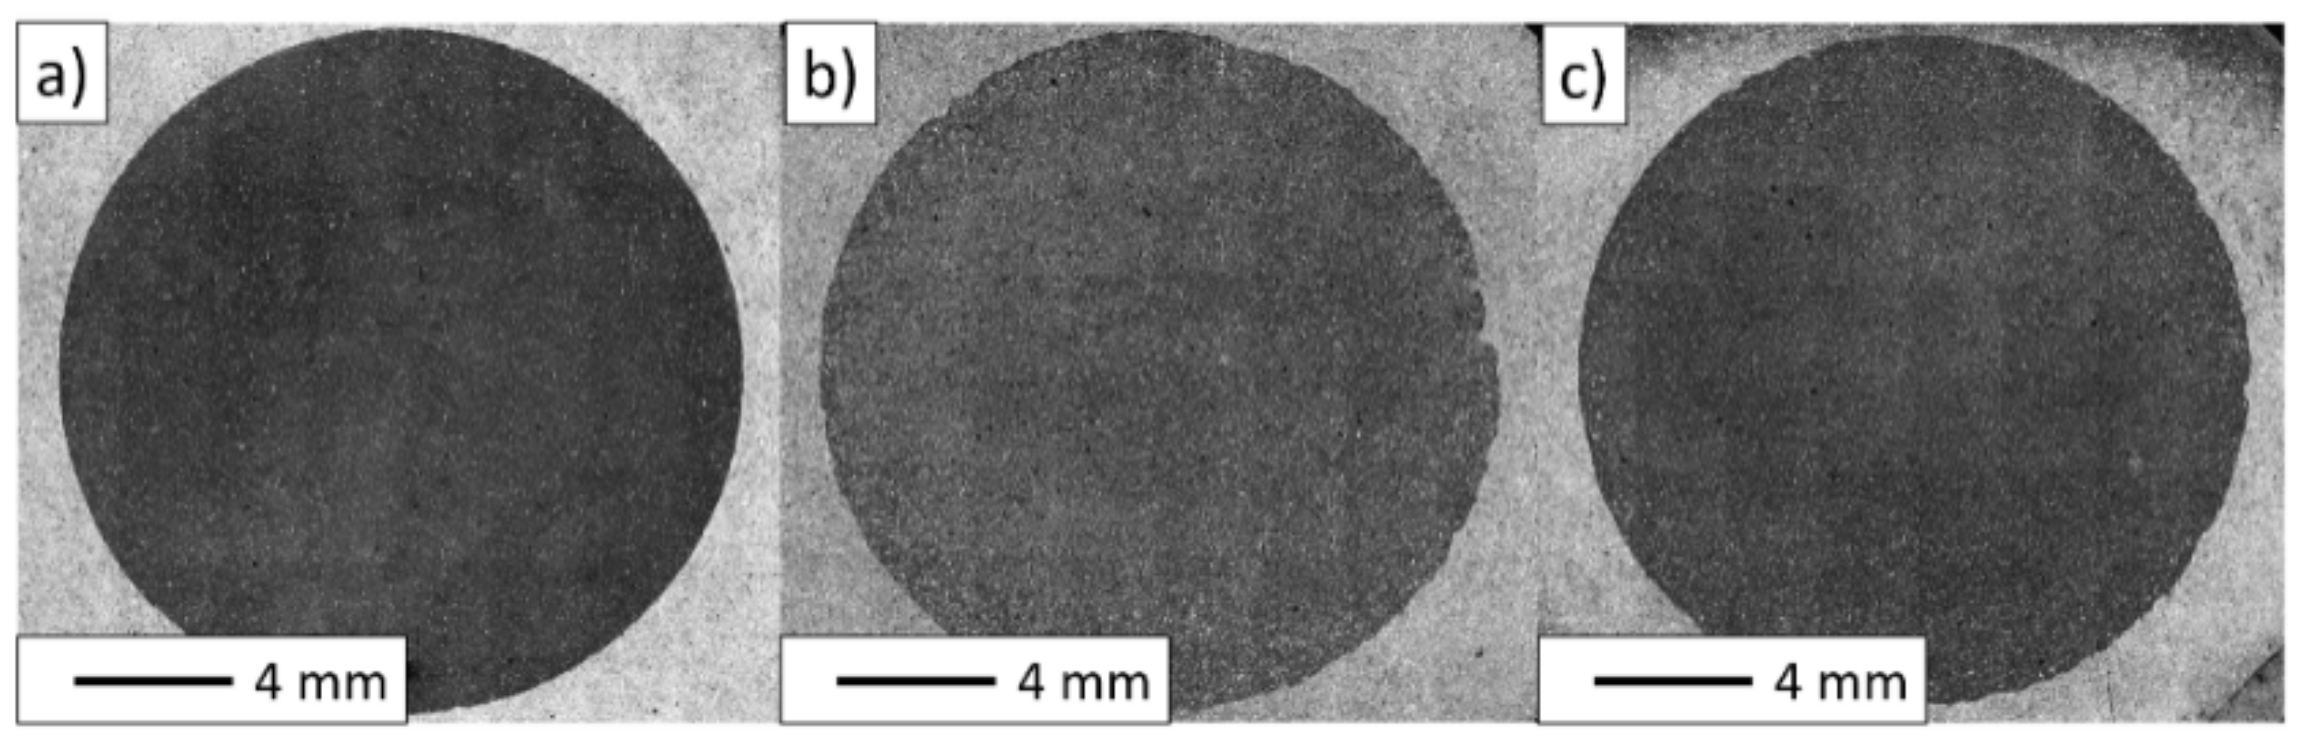
3.2. Description of the Composites
4. Conclusions
Author Contributions
Funding
Institutional Review Board Statement
Informed Consent Statement
Data Availability Statement
Acknowledgments
Conflicts of Interest
References
- Wang, X.; Gao, X.; Zhang, Z.; Cheng, L.; Ma, H.; Yang, W. Advances in Modifications and High-Temperature Applications of Silicon Carbide Ceramic Matrix Composites in Aerospace: A Focused Review. J. Eur. Ceram. Soc. 2021, 41, 4671–4688. [Google Scholar] [CrossRef]
- Arsenault, R.J.; Fishman, S.; Taya, M. Deformation and Fracture Behavior of Metal-Ceramic Matrix Composite Materials. Prog. Mater. Sci. 1994, 38, 1–157. [Google Scholar] [CrossRef]
- Zhou, W.; Ai, S.; Chen, M.; Zhang, R.; He, R.; Pei, Y.; Fang, D. Preparation and Thermodynamic Analysis of the Porous ZrO2/(ZrO2 + Ni) Functionally Graded Bolted Joint. Compos. B Eng. 2015, 82, 13–22. [Google Scholar] [CrossRef]
- An, Q.; Chen, J.; Ming, W.; Chen, M. Machining of SiC Ceramic Matrix Composites: A Review. Chin. J. Aeronaut. 2021, 34, 540–567. [Google Scholar] [CrossRef]
- Kota, N.; Charan, M.S.; Laha, T.; Roy, S. Review on Development of Metal/Ceramic Interpenetrating Phase Composites and Critical Analysis of Their Properties. Ceram. Int. 2022, 48, 1451–1483. [Google Scholar] [CrossRef]
- Zhou, W.; Zhang, R.; Ai, S.; He, R.; Pei, Y.; Fang, D. Load Distribution in Threads of Porous Metal–Ceramic Functionally Graded Composite Joints Subjected to Thermomechanical Loading. Compos. Struct. 2015, 134, 680–688. [Google Scholar] [CrossRef] [Green Version]
- Asthana, R.; Kumar, A.; Dahotre, N.B. Powder Metallurgy and Ceramic Forming. In Materials Processing and Manufacturing Science; Asthana, R., Kumar, A., Dahotre, N.B., Eds.; Academic Press: Burlington, VT, USA, 2006; pp. 167–245. [Google Scholar]
- Konstanty, J.S. Applications of Powder Metallurgy to Cutting Tools. In Advances in Powder Metallurgy; Chang, I., Zhao, Y., Eds.; Woodhead Publishing Series in Metals and Surface Engineering; Woodhead Publishing: Sawston, UK, 2013; pp. 555–585. [Google Scholar]
- Daniel, B.S.S.; Murthy, V.S.R.; Murty, G.S. Metal-Ceramic Composites via in-Situ Methods. J. Mater. Process. Technol. 1997, 68, 132–155. [Google Scholar] [CrossRef]
- Ozturk, K.; Gecu, R.; Karaaslan, A. Microstructure, Wear and Corrosion Characteristics of Multiple-Reinforced (SiC–B4C–Al2O3) Al Matrix Composites Produced by Liquid Metal Infiltration. Ceram. Int. 2021, 47, 18274–18285. [Google Scholar] [CrossRef]
- Put, S.; Vleugels, J.; Anné, G.; Van der Biest, O. Functionally Graded Ceramic and Ceramic–Metal Composites Shaped by Electrophoretic Deposition. Colloids Surf. A Physicochem. Eng. Asp. 2003, 222, 223–232. [Google Scholar] [CrossRef]
- Zhang, R.; He, R.; Zhou, W.; Wang, Y.; Fang, D. Design and Fabrication of Porous ZrO2/(ZrO2+Ni) Sandwich Ceramics with Low Thermal Conductivity and High Strength. Mater. Des. 2014, 62, 1–6. [Google Scholar] [CrossRef]
- Yüzbasi, N.S.; Graule, T. Colloid Casting Processes: Slip Casting, Centrifugal Casting, and Gel Casting. In Encyclopedia of Materials: Technical Ceramics and Glasses; Pomeroy, M., Ed.; Elsevier: Oxford, UK, 2021; pp. 146–153. [Google Scholar]
- Sadoun, A.M.; Meselhy, A.F.; Abdallah, A.W. Microstructural, Mechanical and Wear Behavior of Electroless Assisted Silver Coated Al2O3–Cu Nanocomposites. Mater. Chem. Phys. 2021, 266, 124562. [Google Scholar] [CrossRef]
- Zygmuntowicz, J.; Wachowski, M.; Piotrkiewicz, P.; Kaszuwara, W. Effect of the Powder Consolidation Method Type on the Microstructure and Selected Properties of Al2O3-Cu-Ni Composites. Arch. Metall. Mater. 2020, 65, 967–974. [Google Scholar] [CrossRef]
- Zhang, X.; Zhang, Y.; Tian, B.; An, J.; Zhao, Z.; Volinsky, A.A.; Liu, Y.; Song, K. Arc Erosion Behavior of the Al2O3-Cu/(W, Cr) Electrical Contacts. Compos. B Eng. 2019, 160, 110–118. [Google Scholar] [CrossRef]
- Zygmuntowicz, J.; Kosiorek, J.; Piotrkiewicz, P.; Zacharko, B.; Wachowski, M.; Kaszuwara, W. Investigation on Microstructure and Selected Properties of Aluminum Oxide–Copper–Nickel Ceramic–Metal Composites. Int. J. Environ. Sci. Technol. 2021, 4, 212–222. [Google Scholar] [CrossRef]
- Zygmuntowicz, J.; Winkler, H.; Wachowski, M.; Piotrkiewicz, P.; Kaszuwara, W. Novel Functionally Gradient Composites Al2O3-Cu-Mo Obtained via Centrifugal Slip Casting. Metall. Mater. Trans. A 2021, 52, 3628–3646. [Google Scholar] [CrossRef]
- Sheibani, S.; Ataie, A.; Heshmati-Manesh, S.; Caballero, A.; Criado, J.M. Influence of Al2O3 Reinforcement on Precipitation Kinetic of Cu–Cr Nanocomposite. Thermochim. Acta 2011, 526, 222–228. [Google Scholar] [CrossRef]
- Ding, H.; Bao, X.; Jamili-Shirvan, Z.; Jin, J.; Deng, L.; Yao, K.; Gong, P.; Wang, X. Enhancing Strength-Ductility Synergy in an Ex Situ Zr-Based Metallic Glass Composite via Nanocrystal Formation within High-Entropy Alloy Particles. Mater. Des. 2021, 210, 110108. [Google Scholar] [CrossRef]
- Ding, H.; Zhao, Z.; Jin, J.; Deng, L.; Gong, P.; Wang, X. Densification Mechanism of Zr-Based Bulk Metallic Glass Prepared by Two-Step Spark Plasma Sintering. J. Alloys Compd. 2021, 850, 156724. [Google Scholar] [CrossRef]
- Massalski, T.B.; Okamoto, H. Binary Alloy Phase Diagrams; ASM International: Materials Park, OH, USA, 1990. [Google Scholar]
- Matsumoto, H.; Locatelli, M.R.; Nakashima, K.; Glaeser, A.M.; Mori, K. Wettability of Al2O3 by liquid Cu as influenced by additives and partial transient liquid-phase bonding of Al2O3. Mater. Trans. 1995, 4, 555–564. [Google Scholar] [CrossRef] [Green Version]
- Schmitz, J.; Brillo, J.; Egry, I. Surface tension of liquid Cu and anisotropy of its wetting of sapphire. J. Mater. Sci. 2010, 45, 2144–2149. [Google Scholar] [CrossRef]
- Trunec, M.; Maca, K. Advanced Ceramic Processes. In Advanced Ceramics for Dentistry; Shen, J.Z., Kosmač, T., Eds.; Butterworth-Heinemann: Oxford, UK, 2014; pp. 123–150. [Google Scholar]
- Mouzon, J.; Glowacki, E.; Odén, M. Comparison between Slip-Casting and Uniaxial Pressing for the Fabrication of Translucent Yttria Ceramics. J. Mater. Sci. 2008, 43, 2849–2856. [Google Scholar] [CrossRef]
- Zygmuntowicz, J.; Bulski, B.; Szymańska, J.; Piotrkiewicz, P.; Kaszuwara, W. Characterization of the Alumina Oxide, Copper and Nickel Powders and Their Processing Intended for Fabrication of the Novel Hybrid Composite: A Comparative Study. Mater. Werkst. 2021, 52, 379–391. [Google Scholar] [CrossRef]
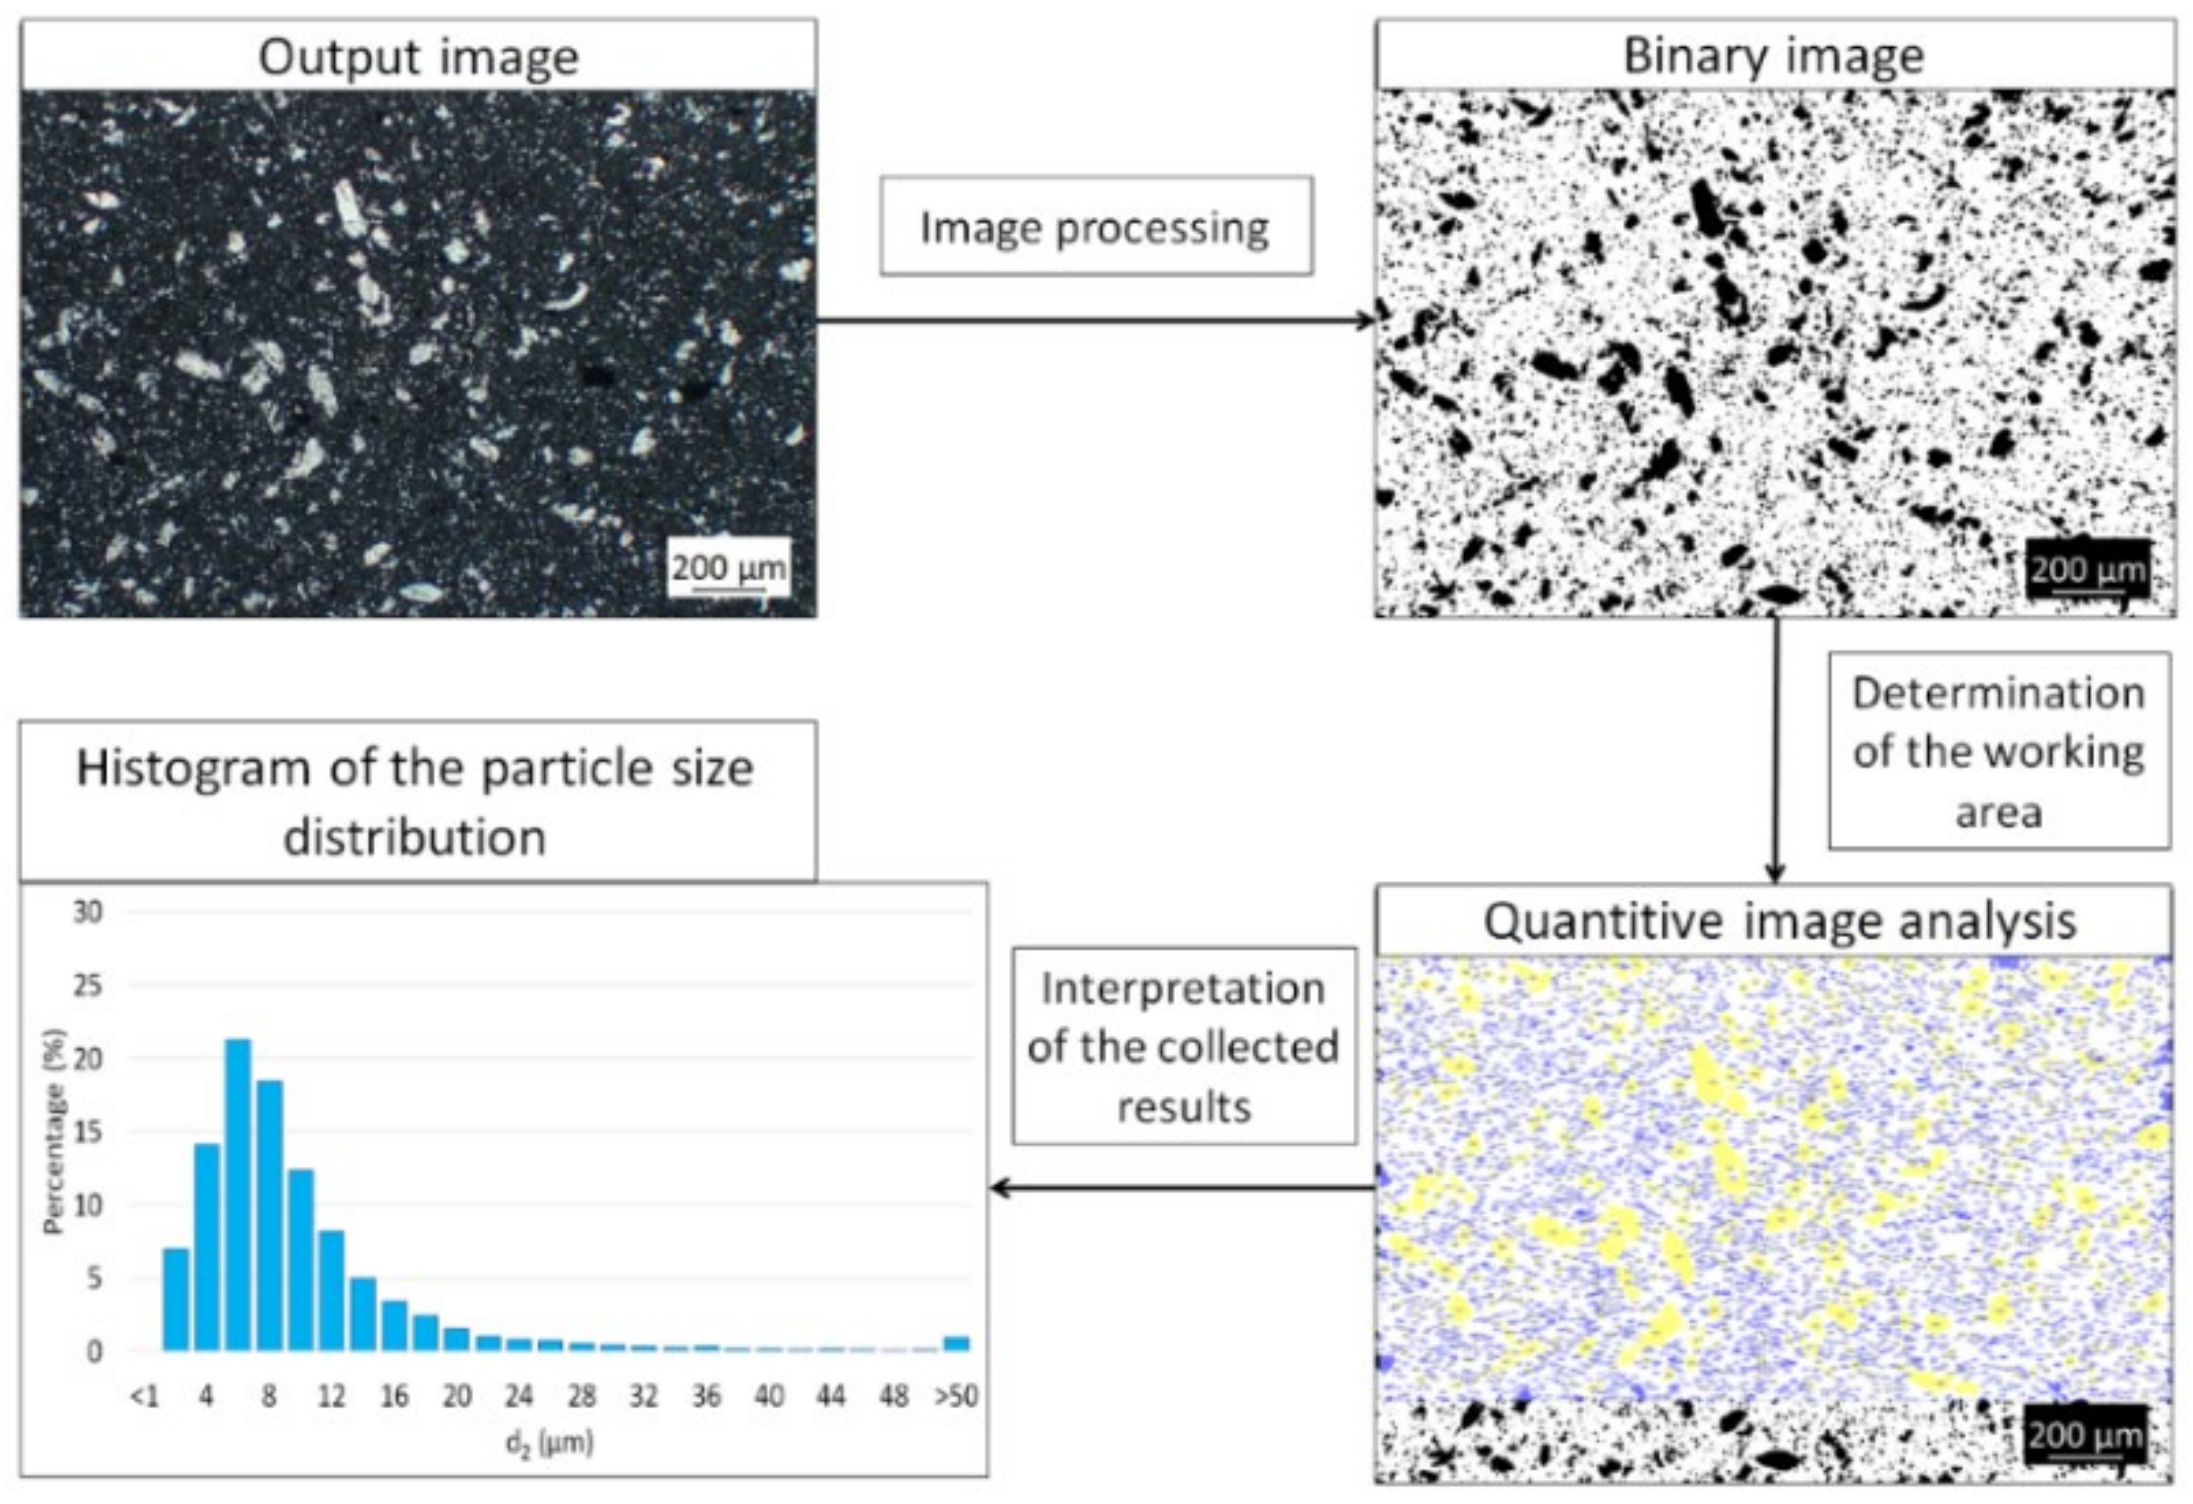
- Michalski, J.; Wejrzanowski, T.; Pielaszek, R.; Konopka, K.; Łojkowski, W.; Kurzydłowski, K.J. Application of image analysis for characterization of powders. Mater. Sci. Pol. 2005, 23, 79–86. [Google Scholar]
- Wejrzanowski, T.; Spychalski, L.; Rożniatowski, K.; Kurzydłowski, K.J. Image based analysis of complex microstructures of engineering materials. Int. J. Appl. Math. Comput. Sci. 2008, 18, 33–39. [Google Scholar] [CrossRef]
- Niihara, K. A Fracture Mechanics Analysis of Indentation-Induced Palmqvist Crack in Ceramics. J. Mater. Sci. Lett. 1983, 2, 221–223. [Google Scholar] [CrossRef]
- Evans, A.G.; Charles, E.A. Fracture Toughness Determinations by Indentation. J. Am. Ceram. Soc. 1976, 59, 371–372. [Google Scholar] [CrossRef]
- Lankford, J. Indentation Microfracture in the Palmqvist Crack Regime: Implications for Fracture Toughness Evaluation by the Indentation Method. J. Mater. Sci. Lett. 1982, 1, 493–495. [Google Scholar] [CrossRef]
- Ownby, P.D.; Liu, J. Surface Energy of Liquid Copper and Single-Crystal Sapphire and the Wetting Behavior of Copper on Sapphire. J. Adhes. Sci. Technol. 1988, 2, 255–269. [Google Scholar] [CrossRef]
- Gorges, E.; Egry, I. The Surface Tension of Copper-Nickel Alloys. J. Mater. Sci. 1995, 30, 2517–2520. [Google Scholar] [CrossRef]
- Zygmuntowicz, J.; Falkowski, P.; Wachowski, M.; Miazga, A.; Piotrkiewicz, P.; Kaszuwara, W. Microstructure and Mechanical Properties of Al2O3-Cu-Ni Hybrid Composites Fabricated by Slip Casting. Process. Appl. Ceram. 2020, 14, 1–8. [Google Scholar] [CrossRef]
- Straumal, B.B.; Protasova, S.G.; Mazilkin, A.A.; Rabkin, E.; Goll, D.; Schütz, G.; Baretzky, B.; Valiev, R.Z. Deformation-Driven Formation of Equilibrium Phases in the Cu–Ni Alloys. J. Mater. Sci. 2012, 47, 360–367. [Google Scholar] [CrossRef]
- Mary, J.A.; Manikandan, A.; Kennedy, L.J.; Bououdina, M.; Sundaram, R.; Vijaya, J.J. Structure and Magnetic Properties of Cu-Ni Alloy Nanoparticles Prepared by Rapid Microwave Combustion Method. Trans. Nonferrous Met. Soc. China 2014, 24, 1467–1473. [Google Scholar] [CrossRef]
- Rocha-Rangel, E.; López-Hernández, J.; Calles-Arriaga, C.A.; Pech-Rodríguez, W.J.; Armendáriz-Mireles, E.N.; Castillo-Robles, J.A.; Rodríguez-García, J.A. Effect of Additions of Metal Submicron Particles on Properties of Alumina Matrix Composites. J. Mater. Res. 2019, 34, 2983–2989. [Google Scholar] [CrossRef] [Green Version]
- Irshad, H.M.; Hakeem, A.S.; Ahmed, B.A.; Ali, S.; Ali, S.; Ali, S.; Ehsan, M.A.; Laoui, T. Effect of Ni Content and Al2O3 Particle Size on the Thermal and Mechanical Properties of Al2O3/Ni Composites Prepared by Spark Plasma Sintering. Int. J. Refract. Met. Hard Mater. 2018, 76, 25–32. [Google Scholar] [CrossRef]
- Miranda-Hernández, J.; Moreno-Guerrero, S.; Soto-Guzmán, A.B.; Rocha-Rangel, E. Production and Characterization of Al2O3-Cu Composite Materials. J. Ceram. Process. Res. 2006, 7, 311–314. [Google Scholar]


| Al2O3 | Cu | Ni | |
|---|---|---|---|
| Purity (%) | 99.9 | 99.8 | 99.8 |
| Density (g/cm3) | 3.98 | 8.96 | 8.9 |
| Mean Particle Size (μm) | 0.12 ± 0.02 | <150 | 3–7 |
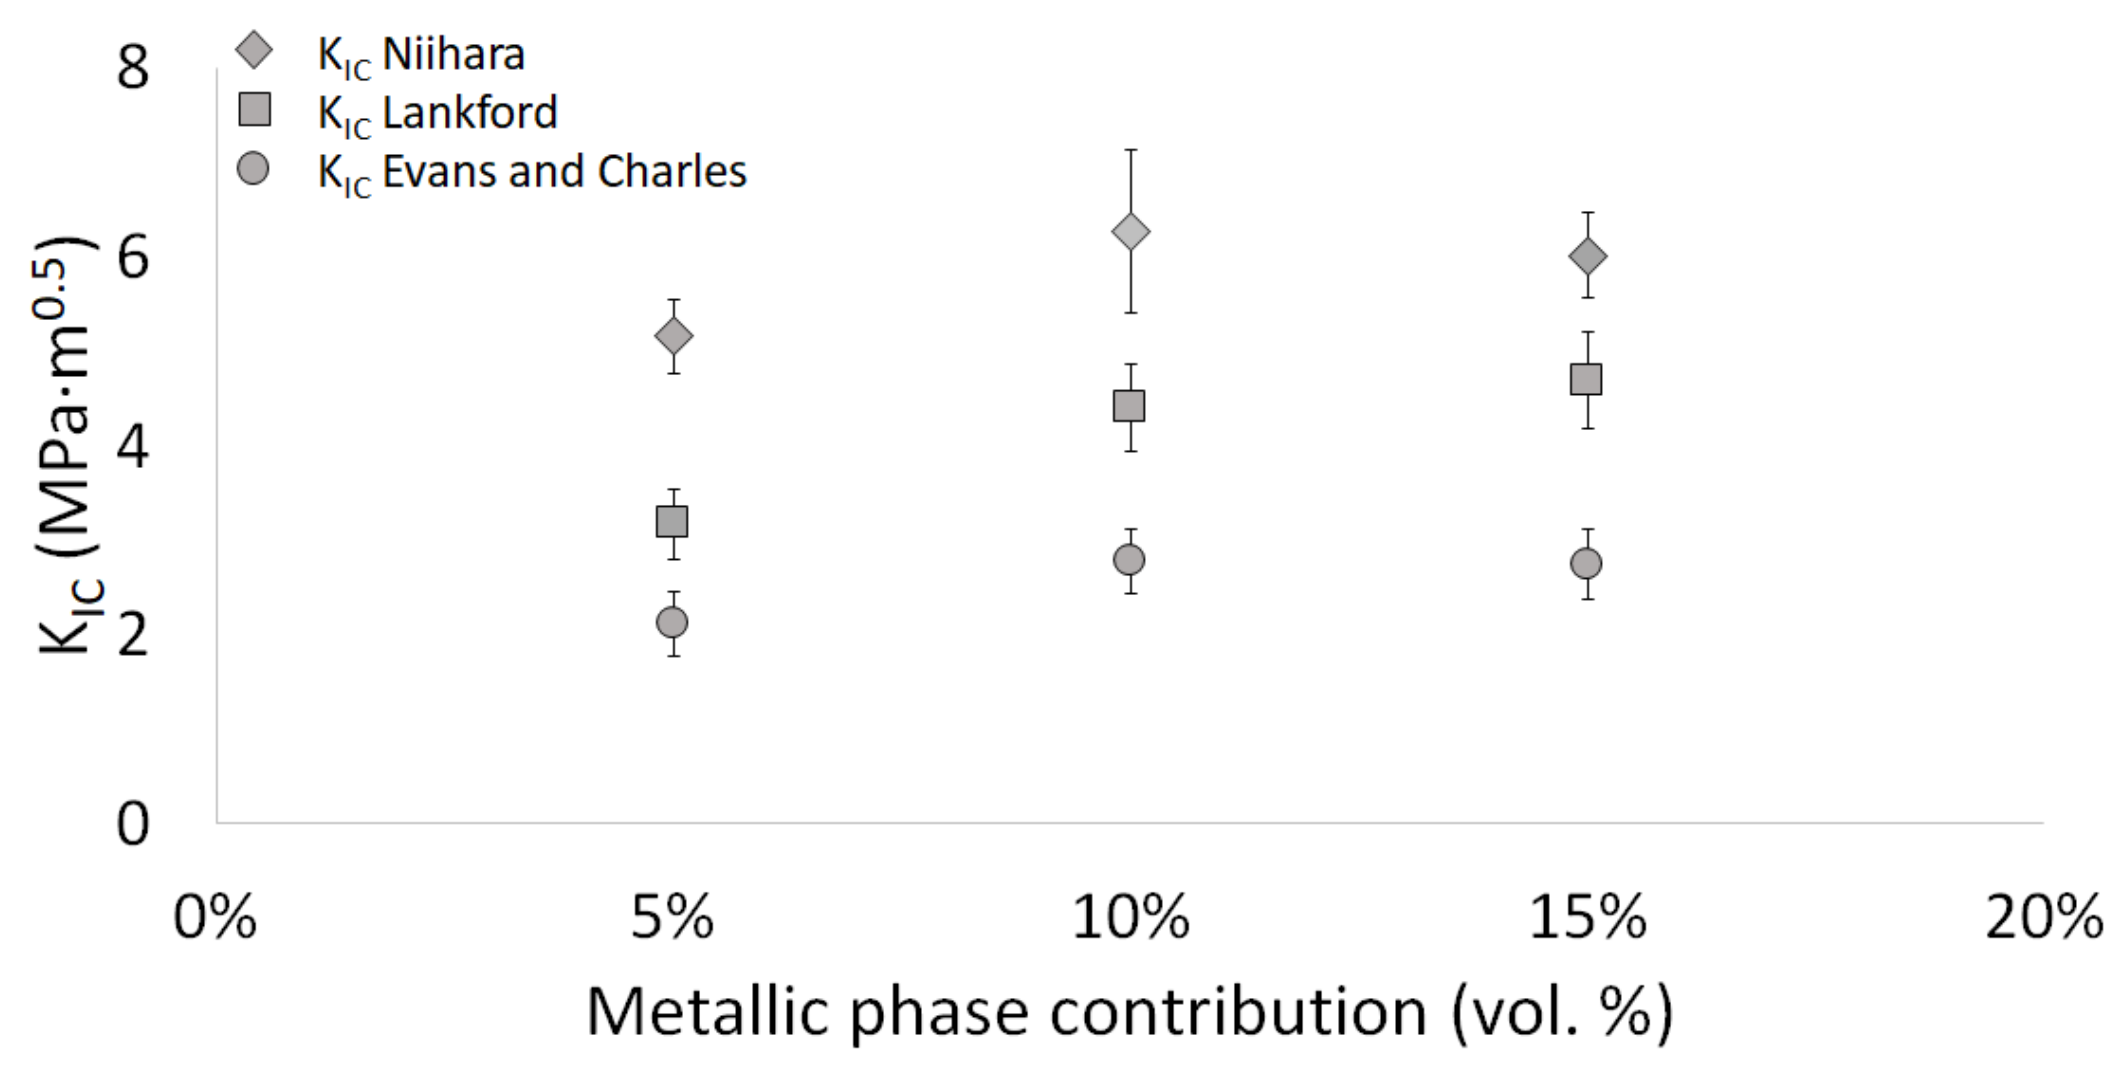
| Author | Equation | |
|---|---|---|
| Niihara | [30] | |
| Evans and Charles | [31] | |
| Lankford | [32] |
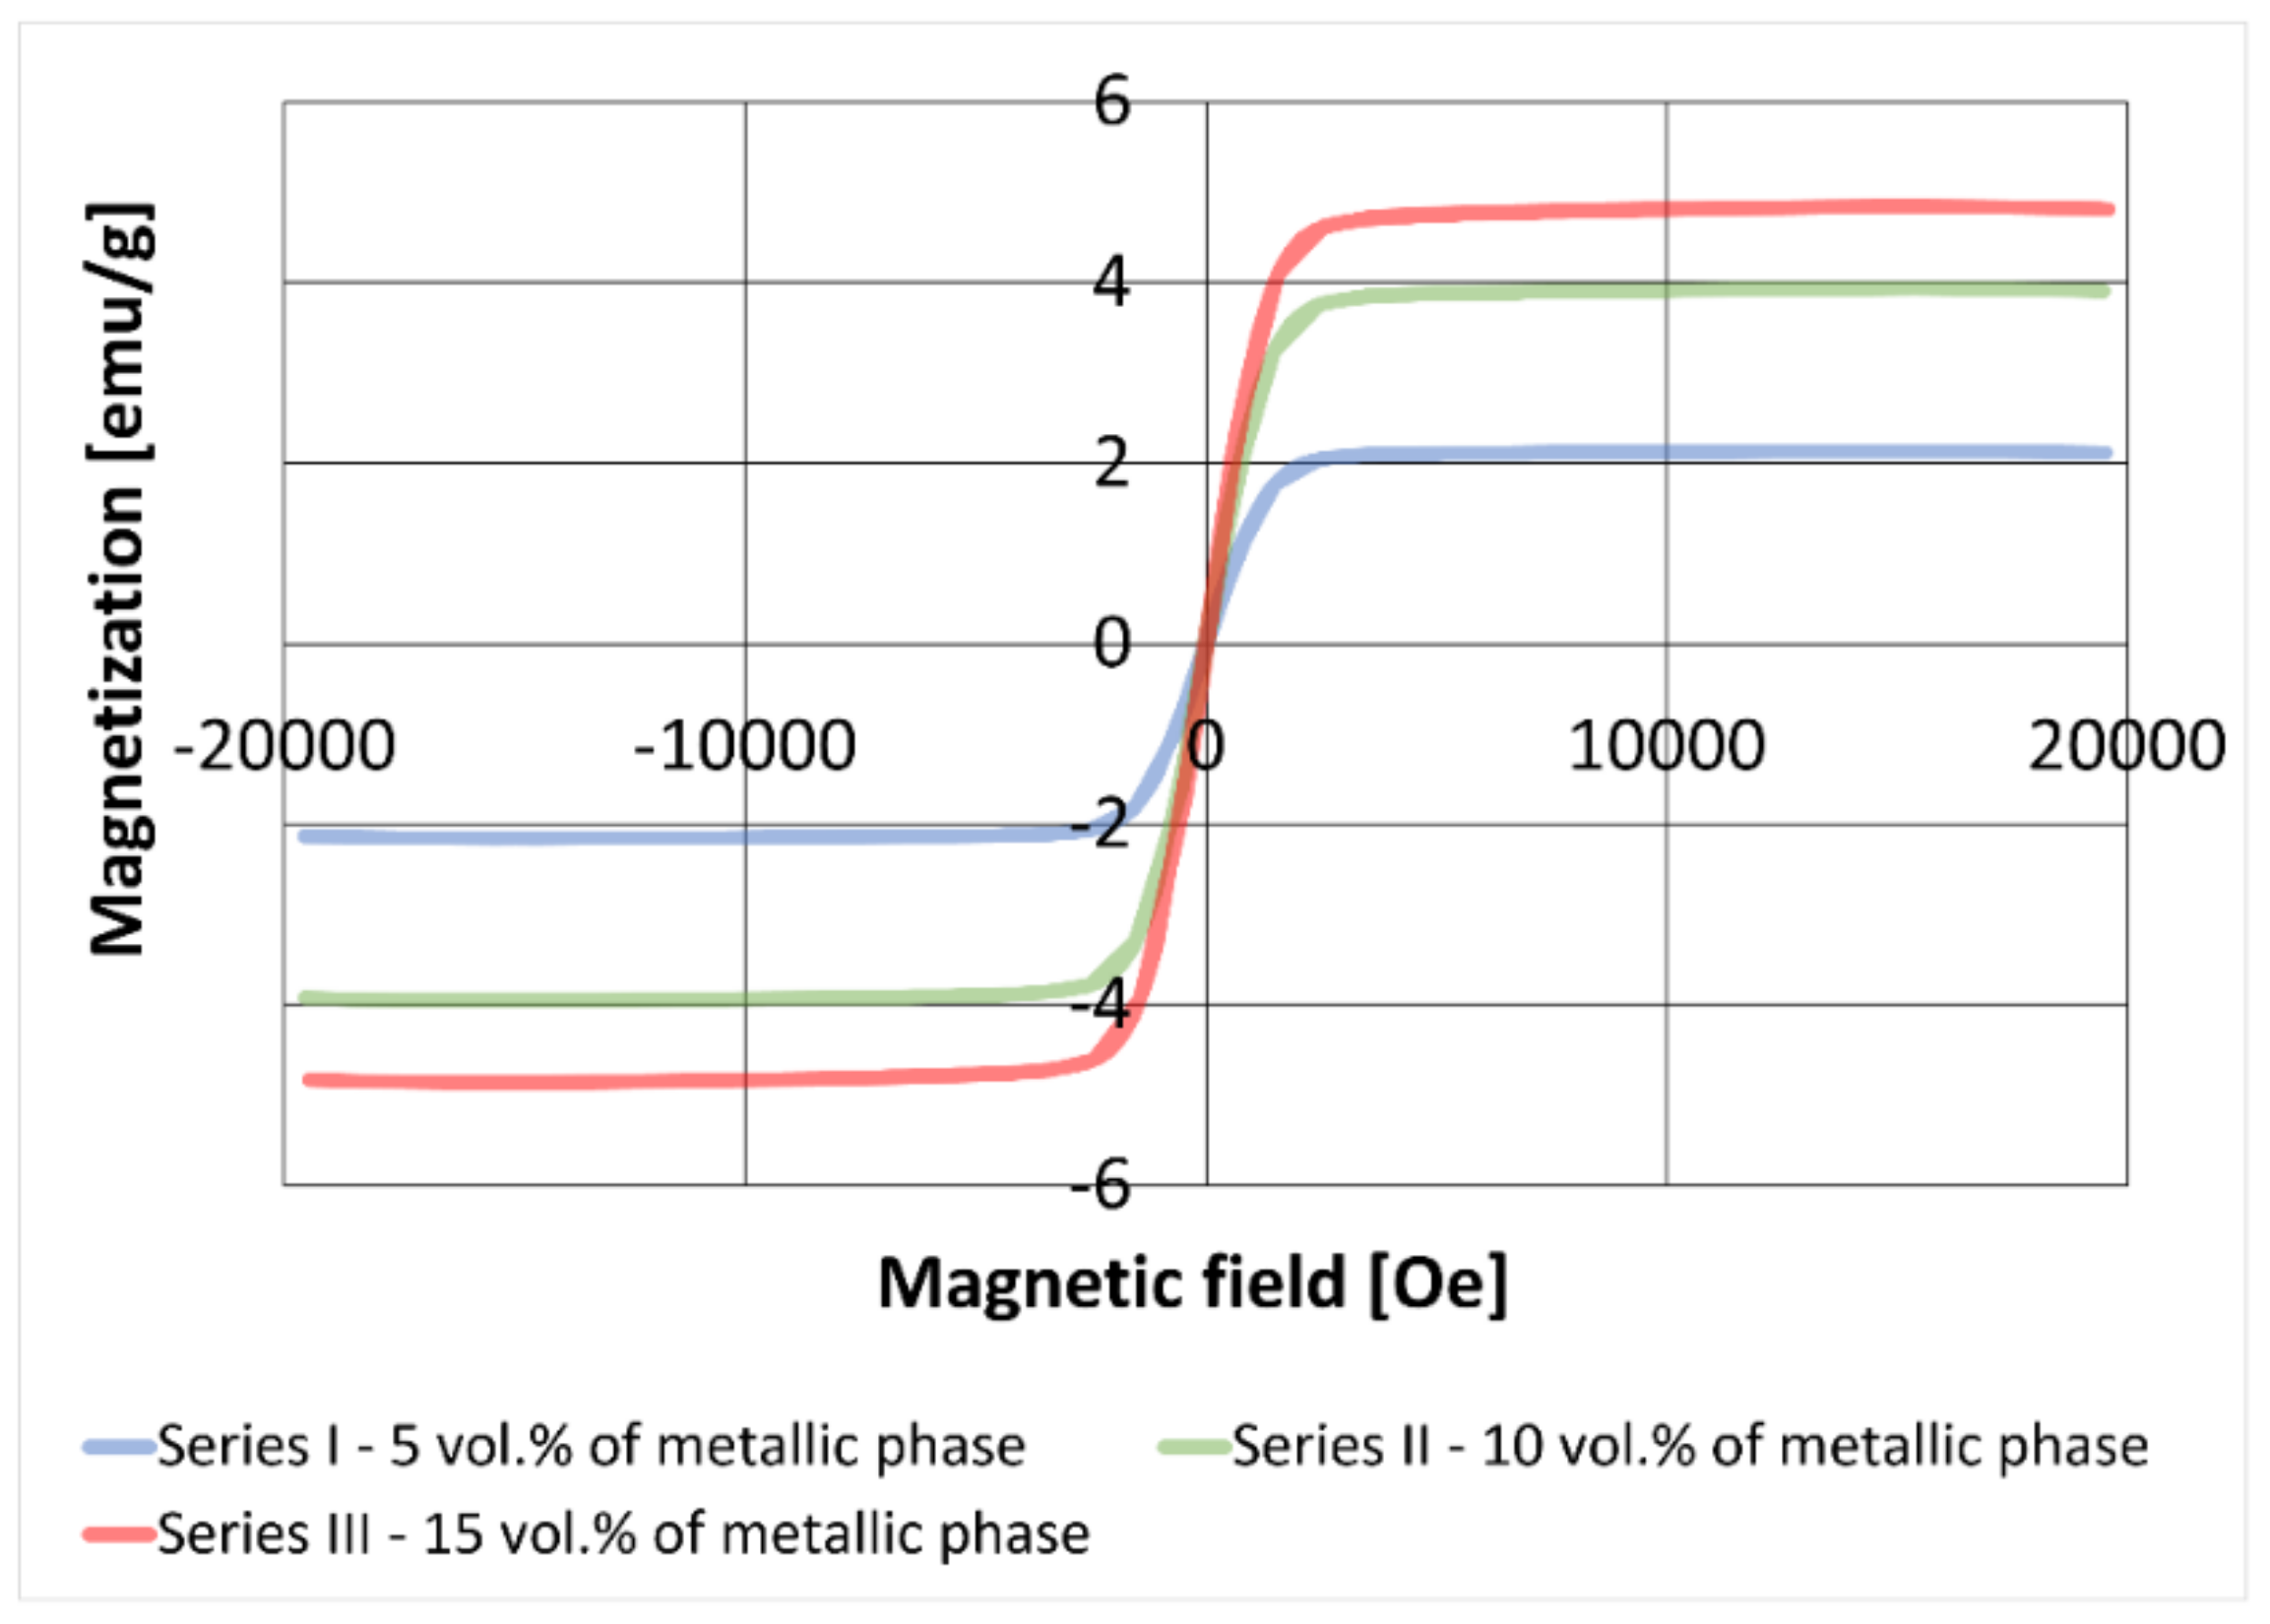
| Series I—5 vol.% of the Metallic Phase | Series II—10 vol.% of the Metallic Phase | Series III—15 vol.% of the Metallic Phase | |
|---|---|---|---|
| Theoretical density (g/cm3) | 4.237 | 4.484 | 4.731 |
| Relative density (%) | 96.07 ± 0.37 | 97.02 ± 0.31 | 96.06 ± 0.78 |
| Open porosity (%) | 1.23 ± 0.37 | 0.08 ± 0.04 | 1.60 ± 0.61 |
| Water absorption (%) | 0.30 ± 0.09 | 0.02 ± 0.01 | 0.35 ± 0.14 |
| Series I—5 vol.% of the Metallic Phase | Series II—10 vol.% of the Metallic Phase | Series III—15 vol.% of the Metallic Phase | |
|---|---|---|---|
| Niihara | 5.16 ± 0.39 | 6.27 ± 0.87 | 6.01 ± 0.45 |
| Lankford | 3.17 ± 0.37 | 4.41 ± 0.46 | 4.69 ± 0.51 |
| Evans and Charles | 2.11 ± 0.27 | 2.78 ± 0.27 | 2.74 ± 0.29 |
Publisher’s Note: MDPI stays neutral with regard to jurisdictional claims in published maps and institutional affiliations. |
© 2022 by the authors. Licensee MDPI, Basel, Switzerland. This article is an open access article distributed under the terms and conditions of the Creative Commons Attribution (CC BY) license (https://creativecommons.org/licenses/by/4.0/).
Share and Cite
Piotrkiewicz, P.; Zygmuntowicz, J.; Wachowski, M.; Cymerman, K.; Kaszuwara, W.; Więcław Midor, A. Al2O3-Cu-Ni Composites Manufactured via Uniaxial Pressing: Microstructure, Magnetic, and Mechanical Properties. Materials 2022, 15, 1848. https://doi.org/10.3390/ma15051848
Piotrkiewicz P, Zygmuntowicz J, Wachowski M, Cymerman K, Kaszuwara W, Więcław Midor A. Al2O3-Cu-Ni Composites Manufactured via Uniaxial Pressing: Microstructure, Magnetic, and Mechanical Properties. Materials. 2022; 15(5):1848. https://doi.org/10.3390/ma15051848
Chicago/Turabian StylePiotrkiewicz, Paulina, Justyna Zygmuntowicz, Marcin Wachowski, Konrad Cymerman, Waldemar Kaszuwara, and Anna Więcław Midor. 2022. "Al2O3-Cu-Ni Composites Manufactured via Uniaxial Pressing: Microstructure, Magnetic, and Mechanical Properties" Materials 15, no. 5: 1848. https://doi.org/10.3390/ma15051848
APA StylePiotrkiewicz, P., Zygmuntowicz, J., Wachowski, M., Cymerman, K., Kaszuwara, W., & Więcław Midor, A. (2022). Al2O3-Cu-Ni Composites Manufactured via Uniaxial Pressing: Microstructure, Magnetic, and Mechanical Properties. Materials, 15(5), 1848. https://doi.org/10.3390/ma15051848