
Nitric Acid Dissolution of Tennantite, Chalcopyrite and Sphalerite in the Presence of Fe (III) Ions and FeS2


Abstract
1. Introduction
2. Materials and Methods
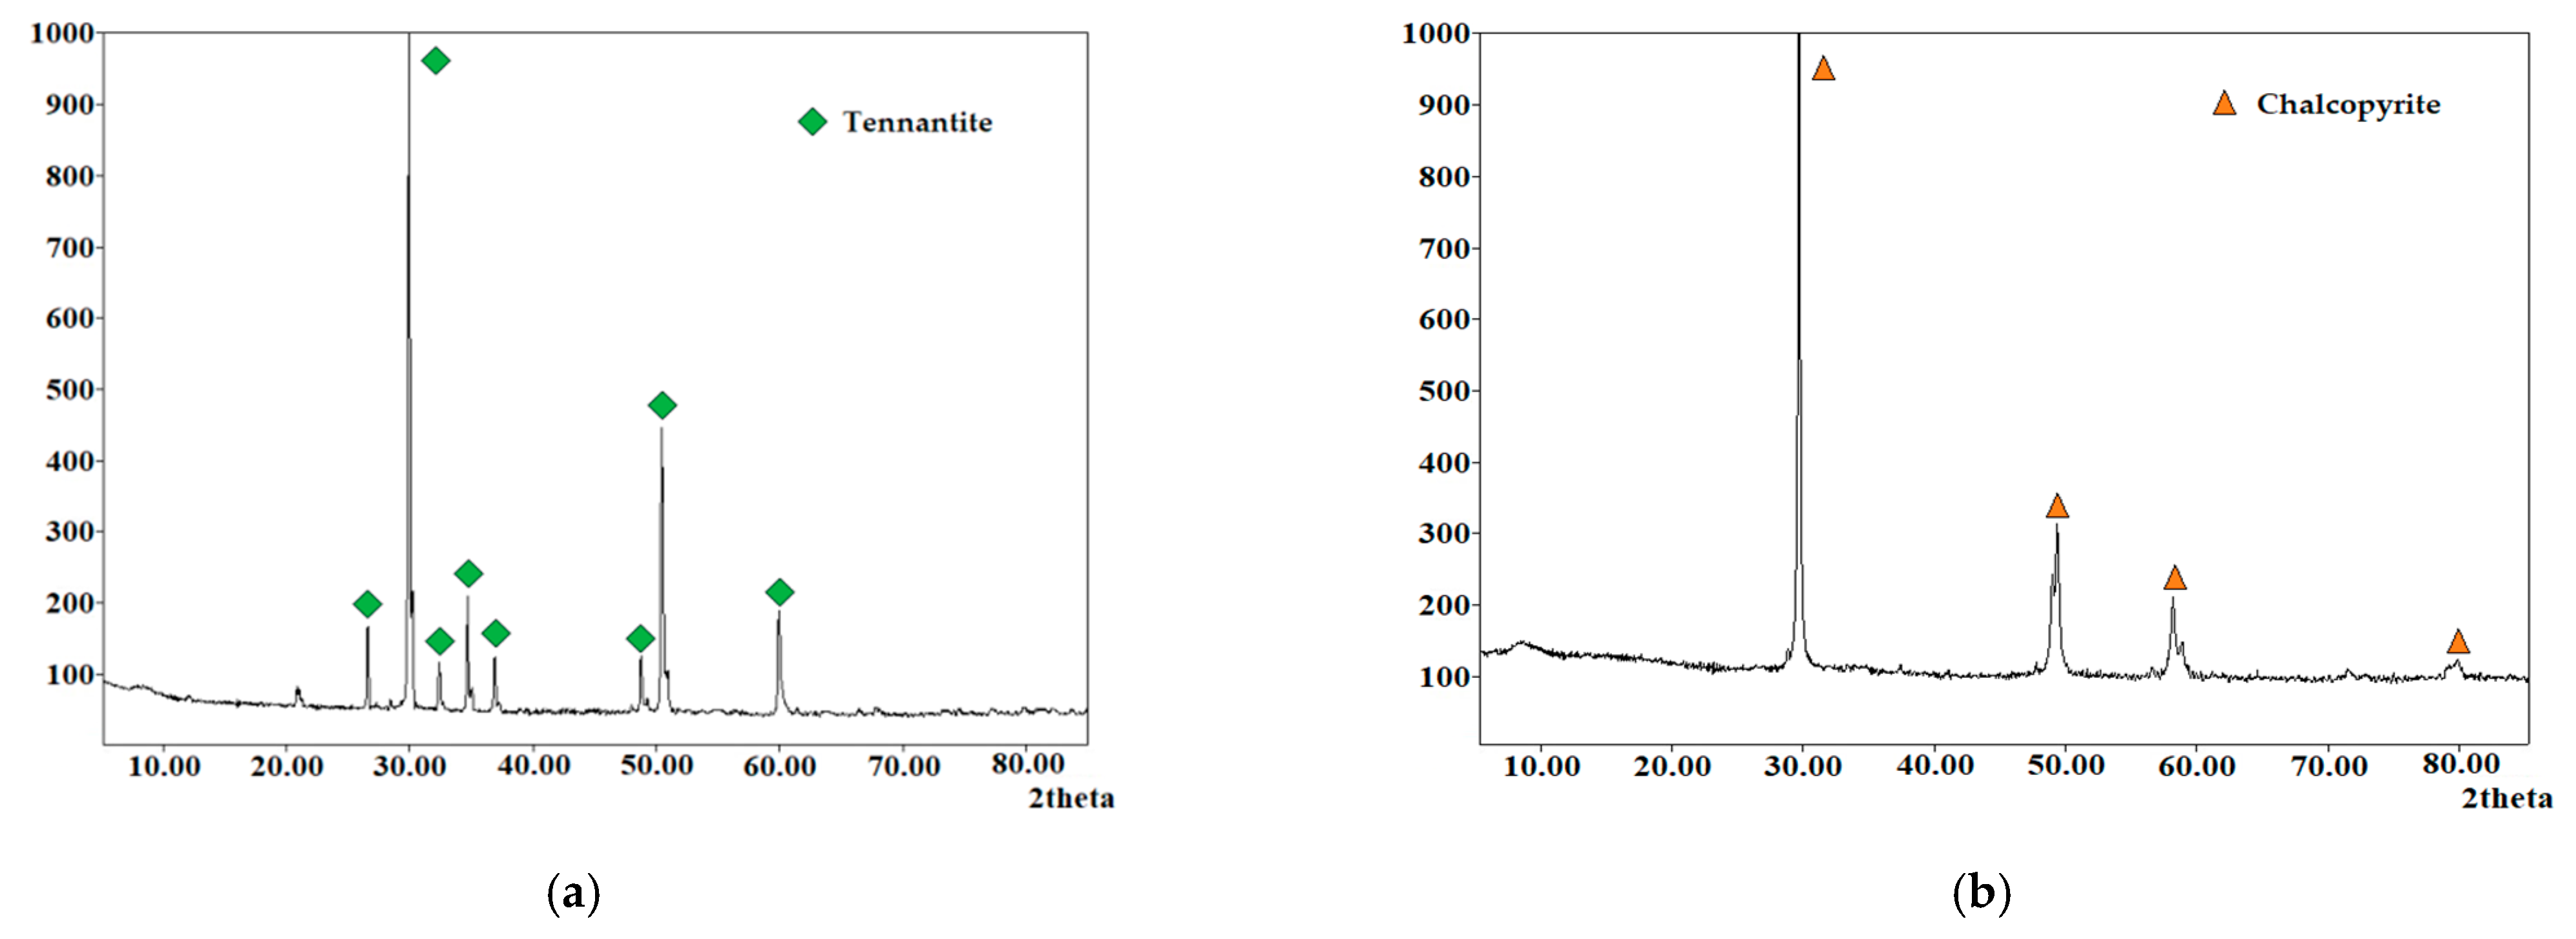
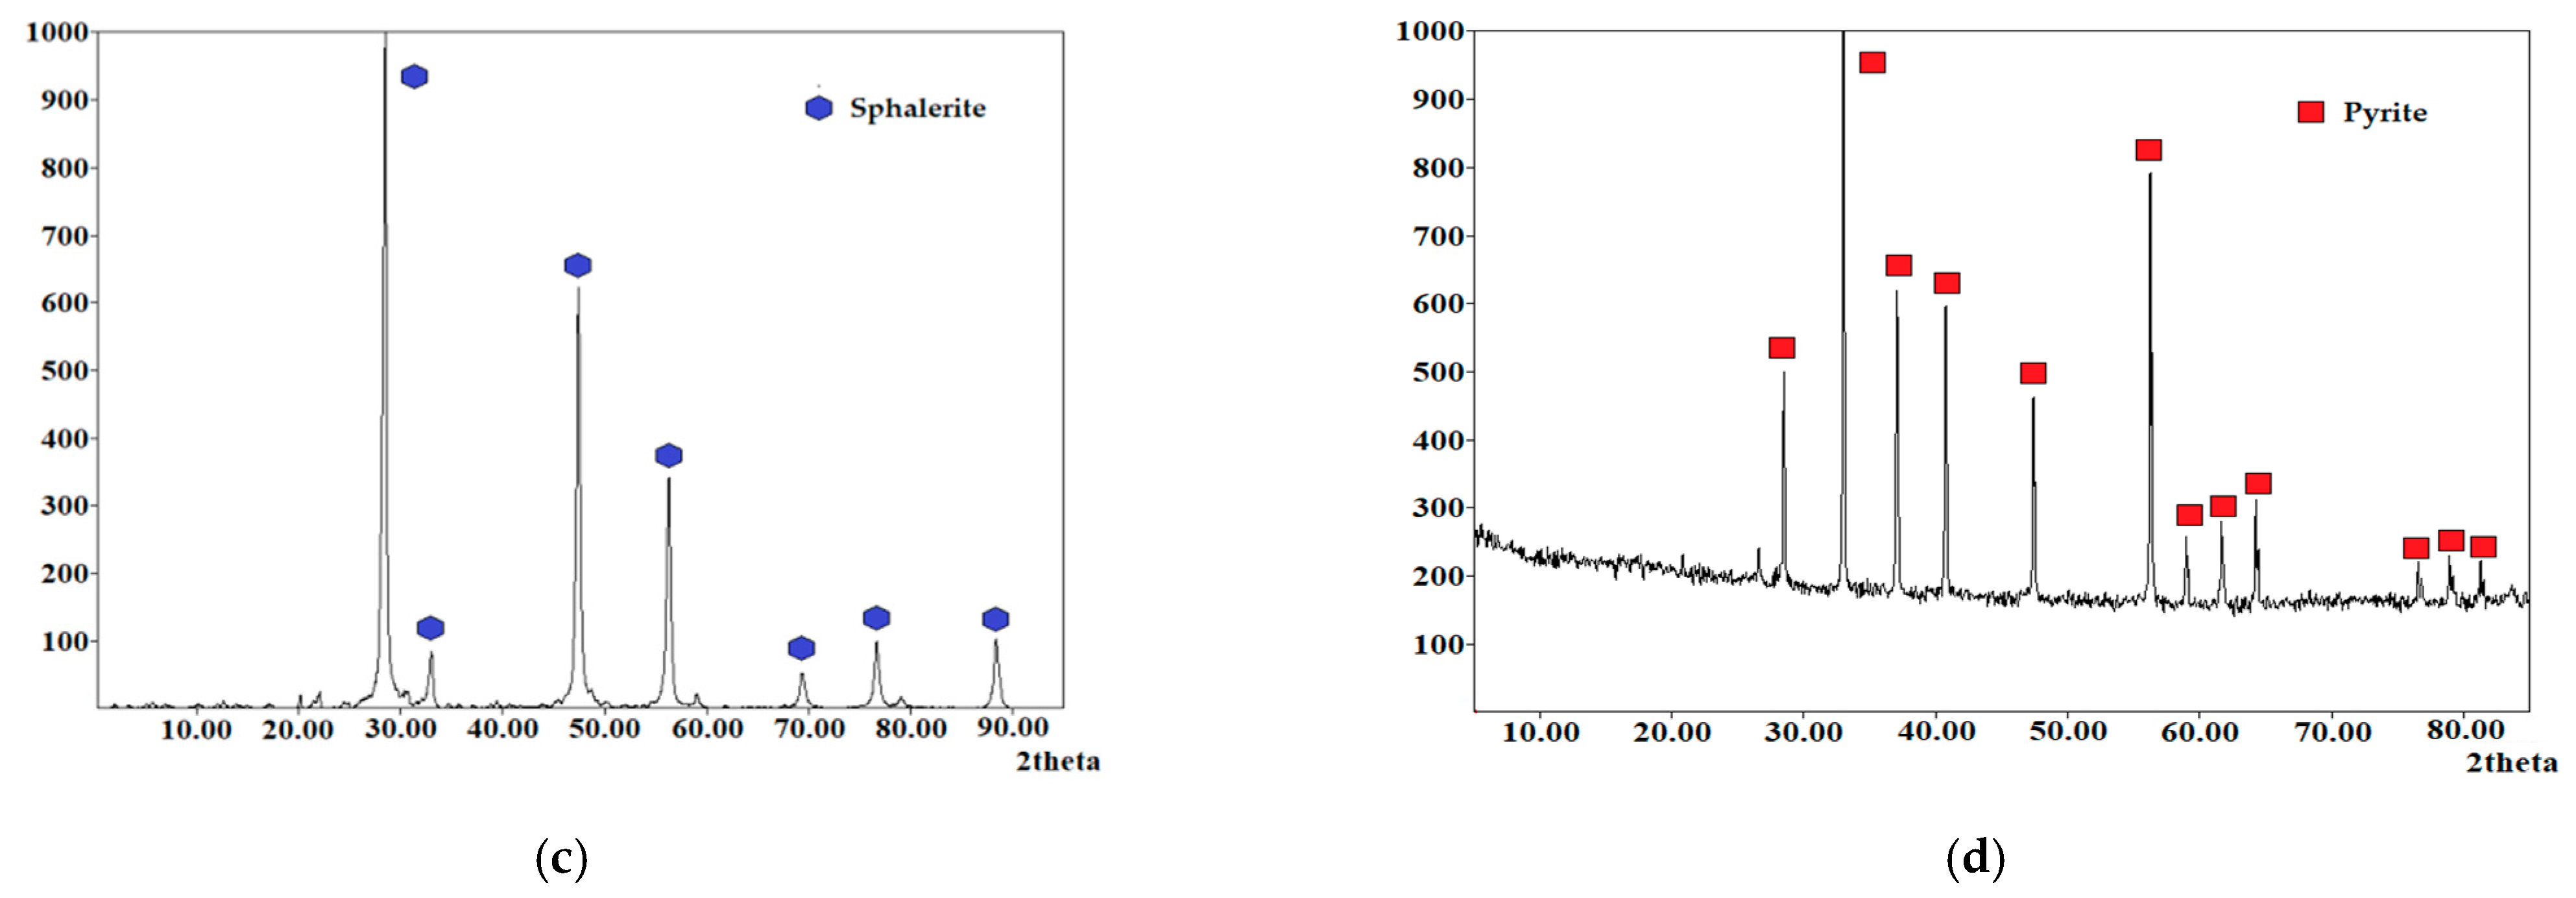
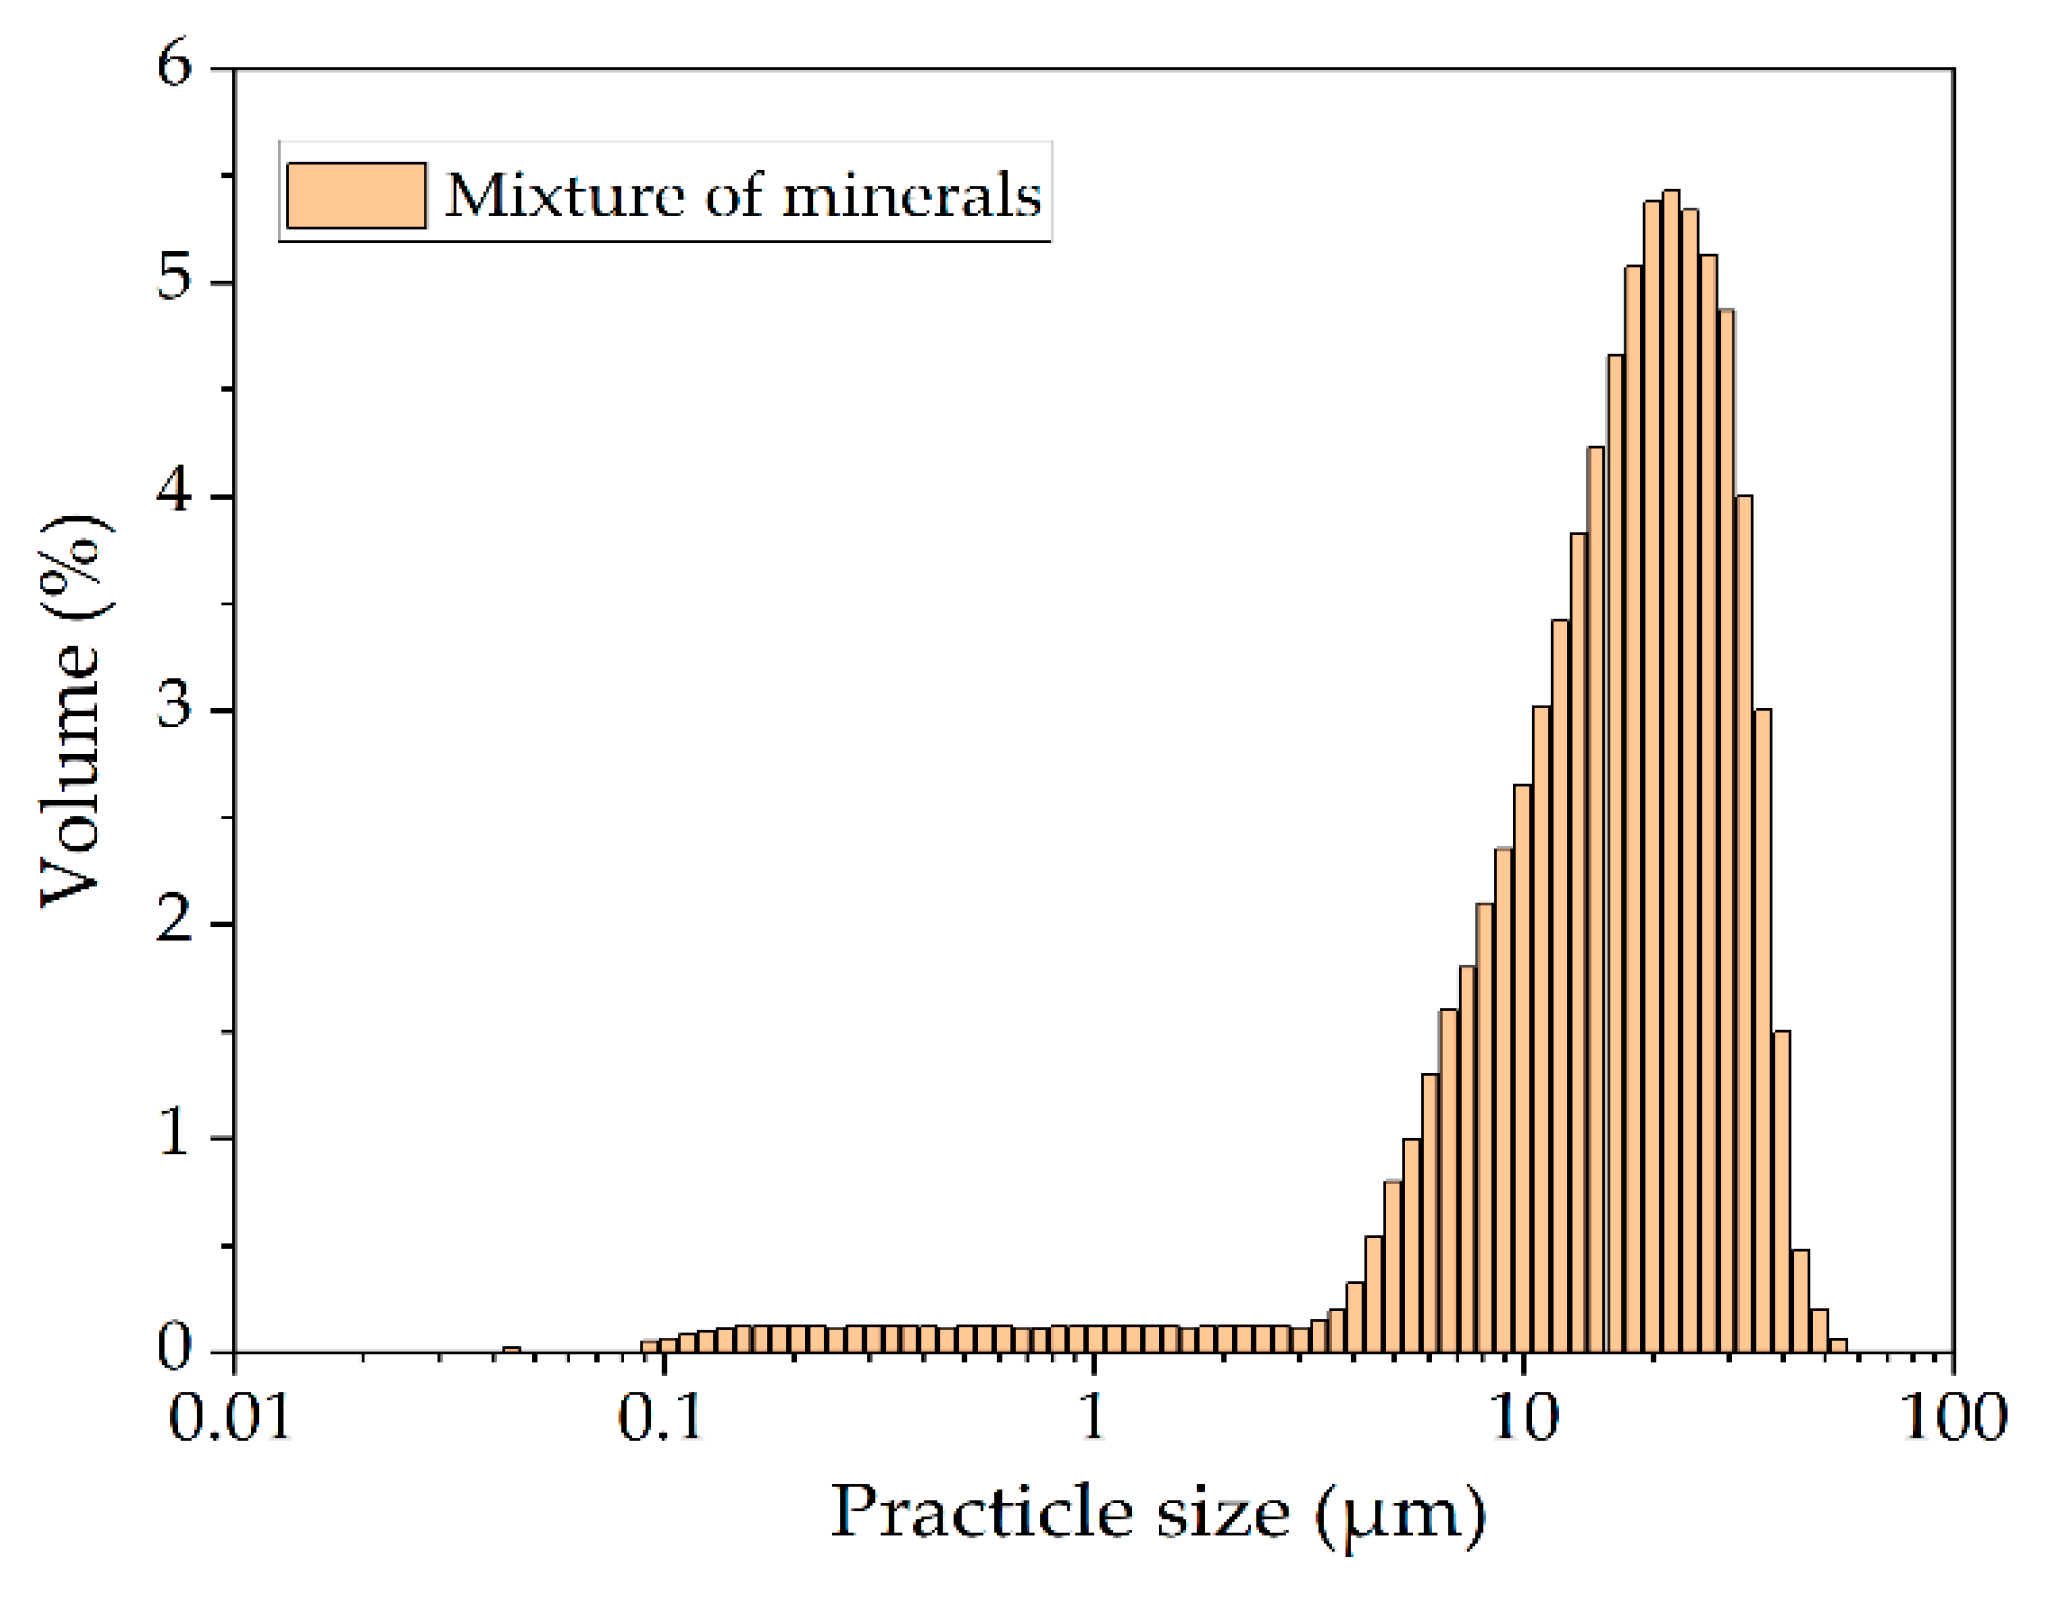
2.1. Materials
2.2. Apparatuses
2.3. Experiments
2.4. Analysis
2.5. Calculation Method
3. Results and Discussion
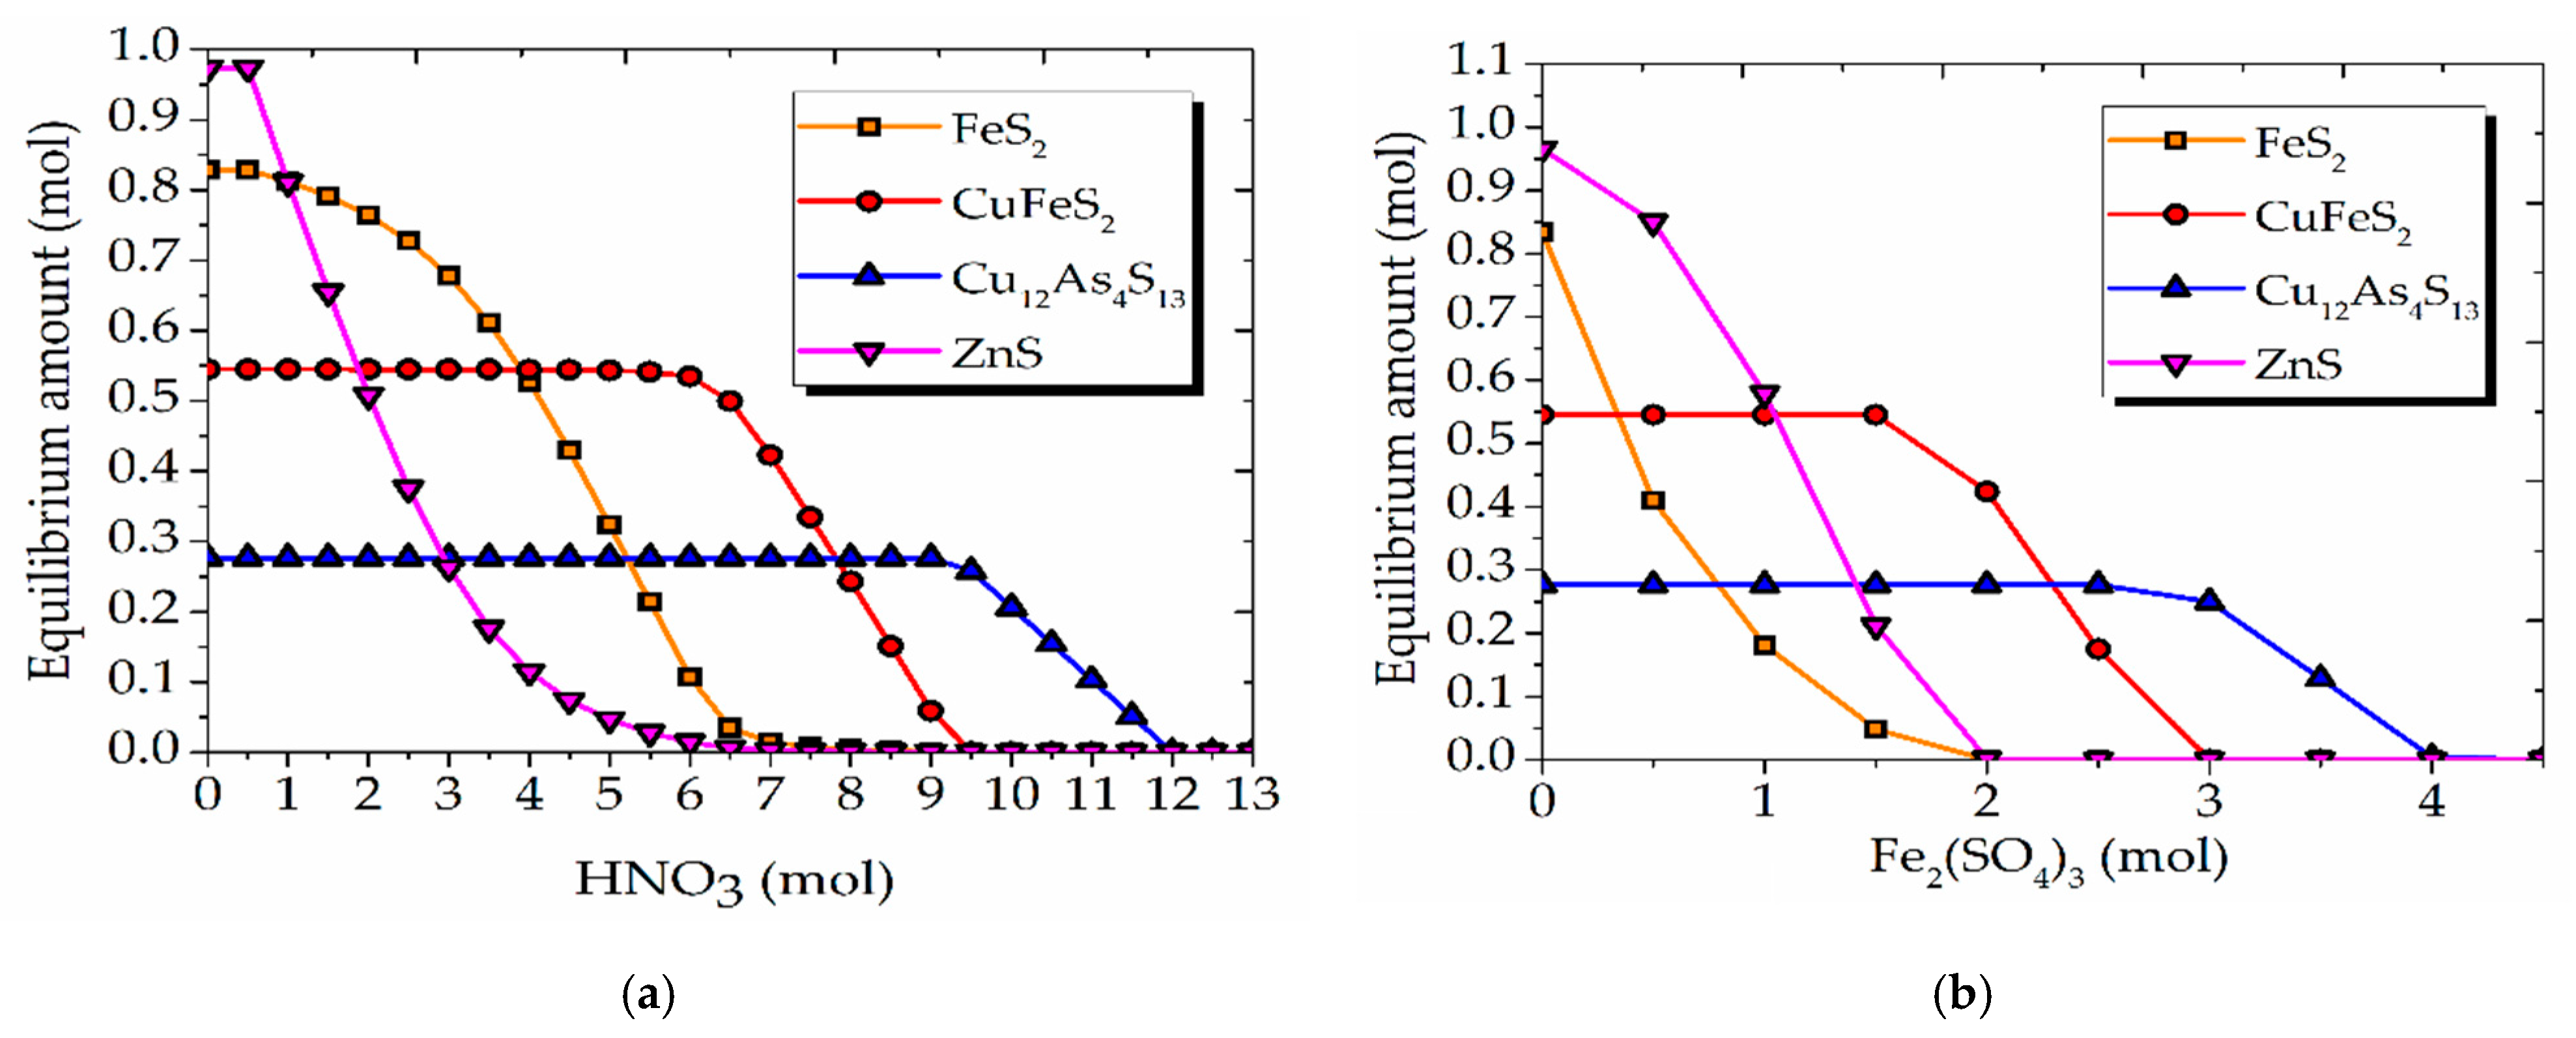
3.1. Thermodynamics of Nitric Acid Dissolution of a Mixture of Minerals
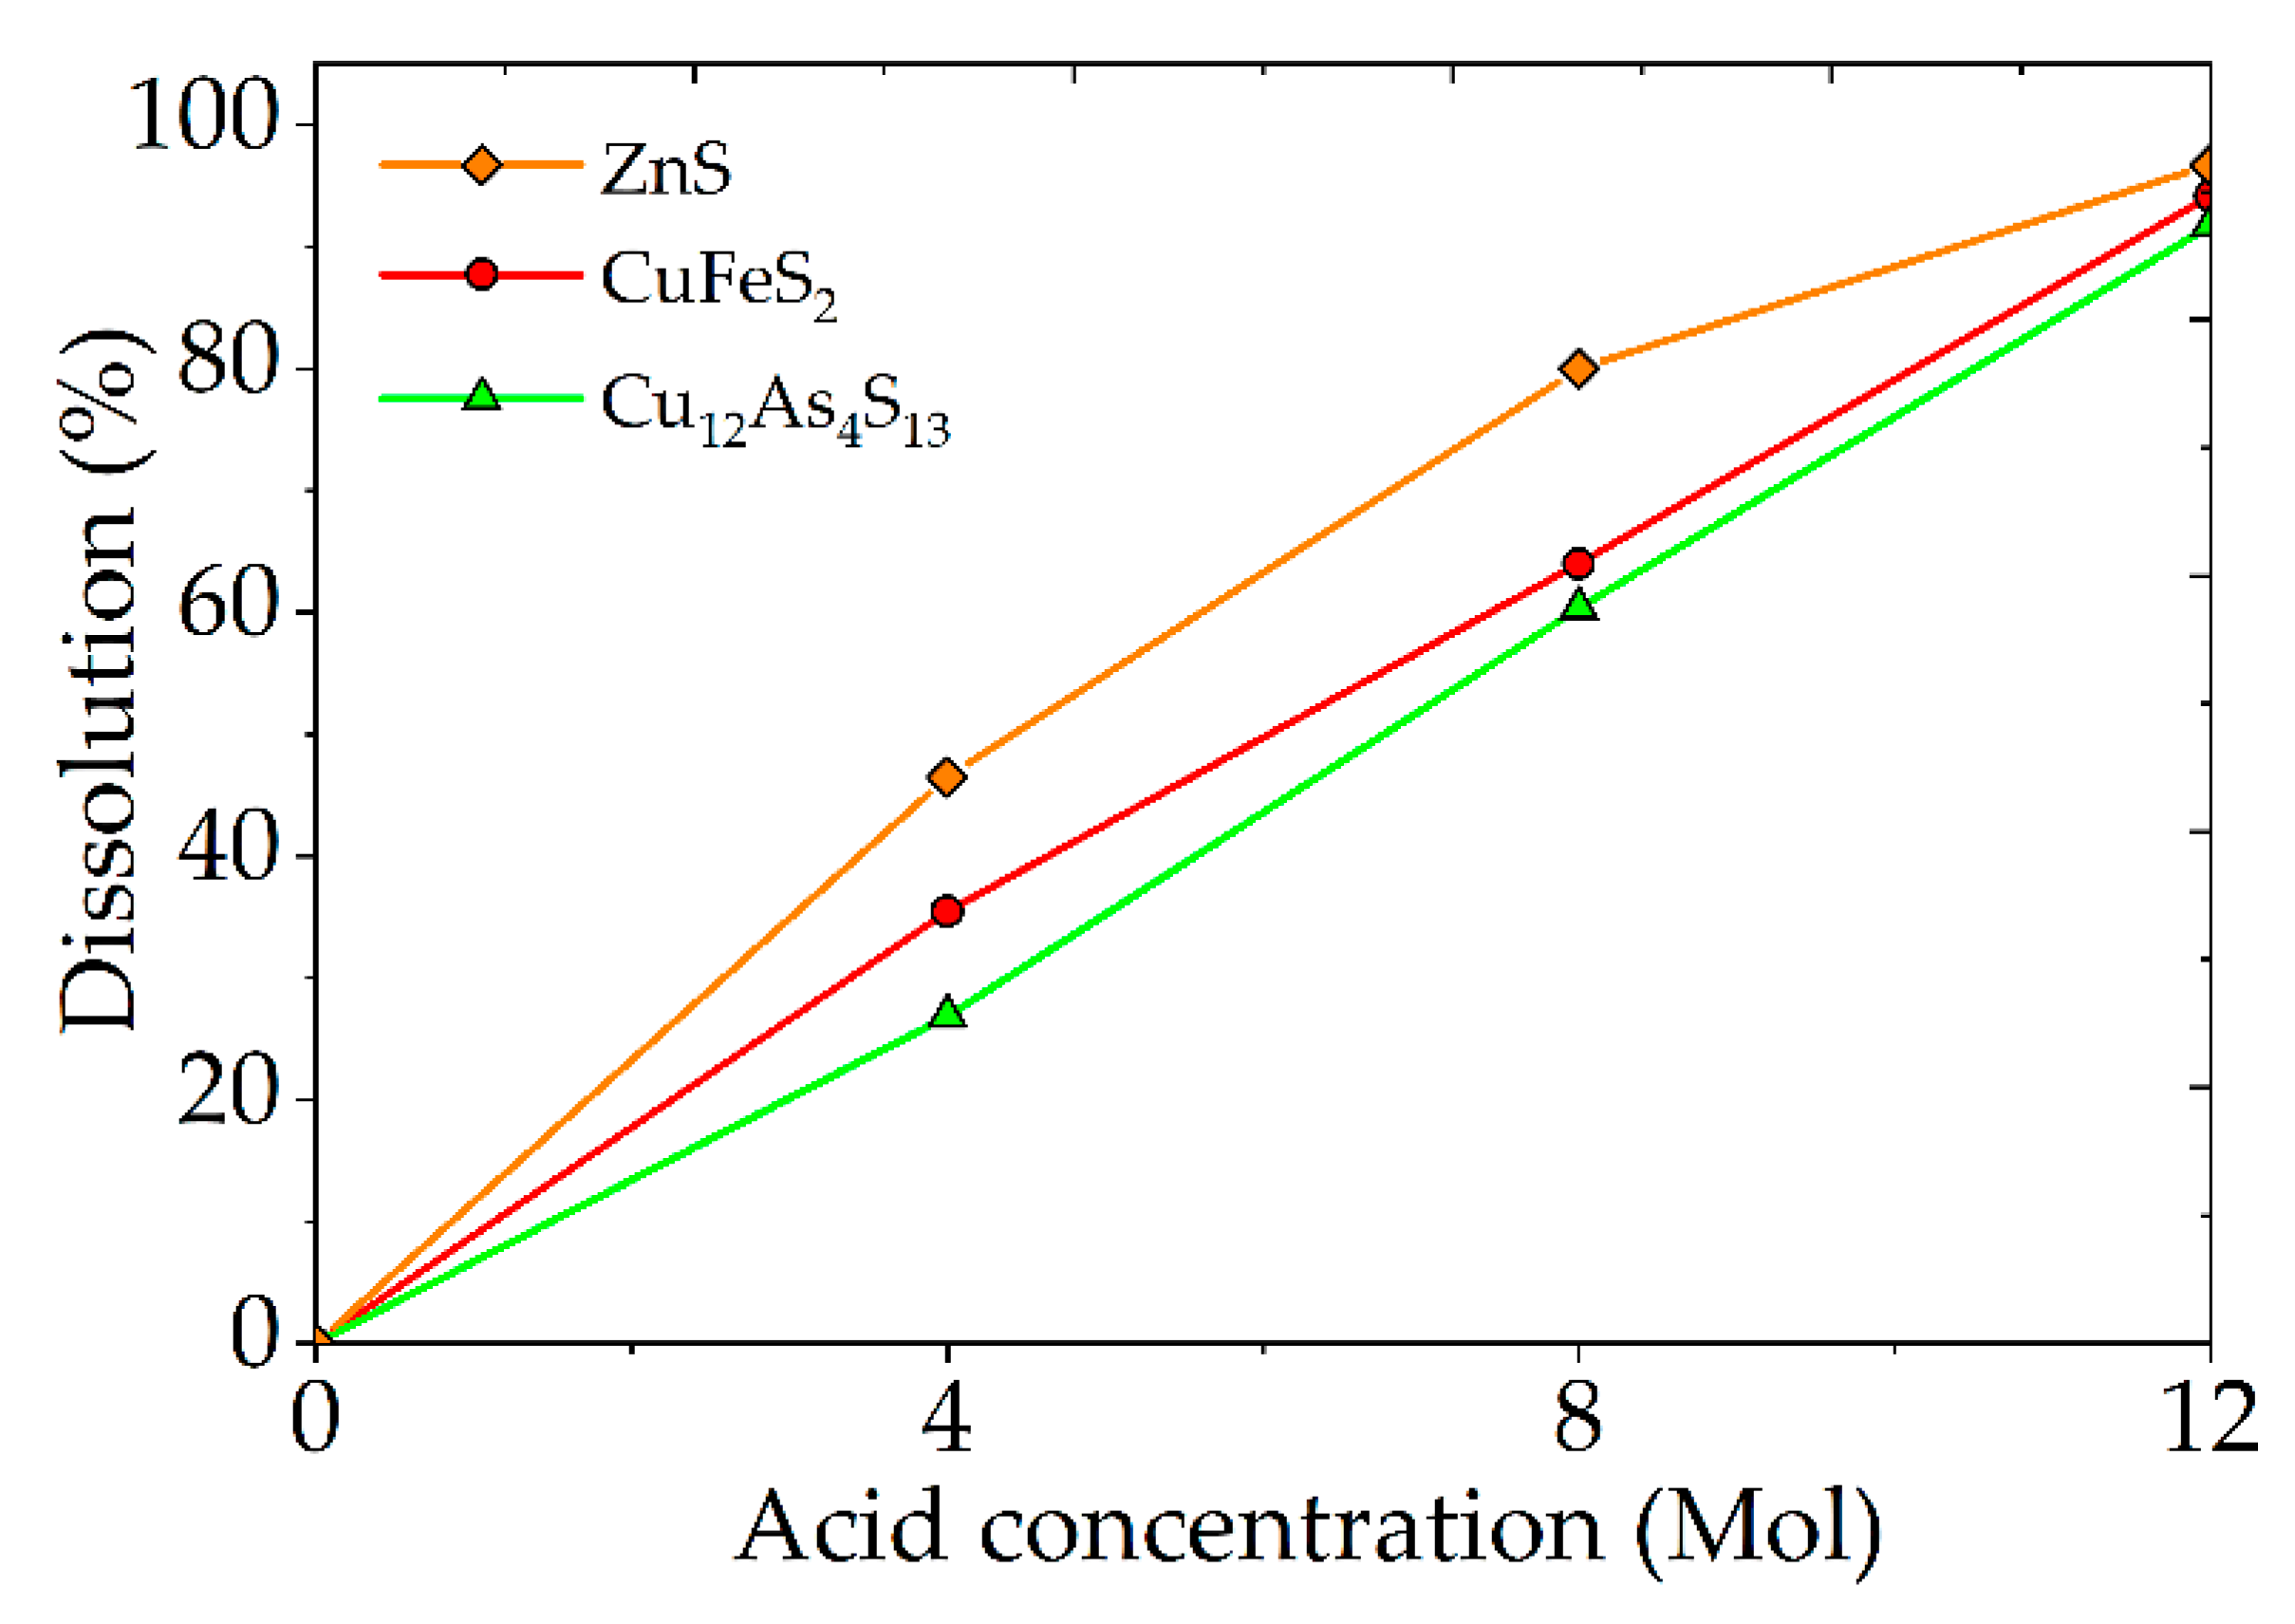
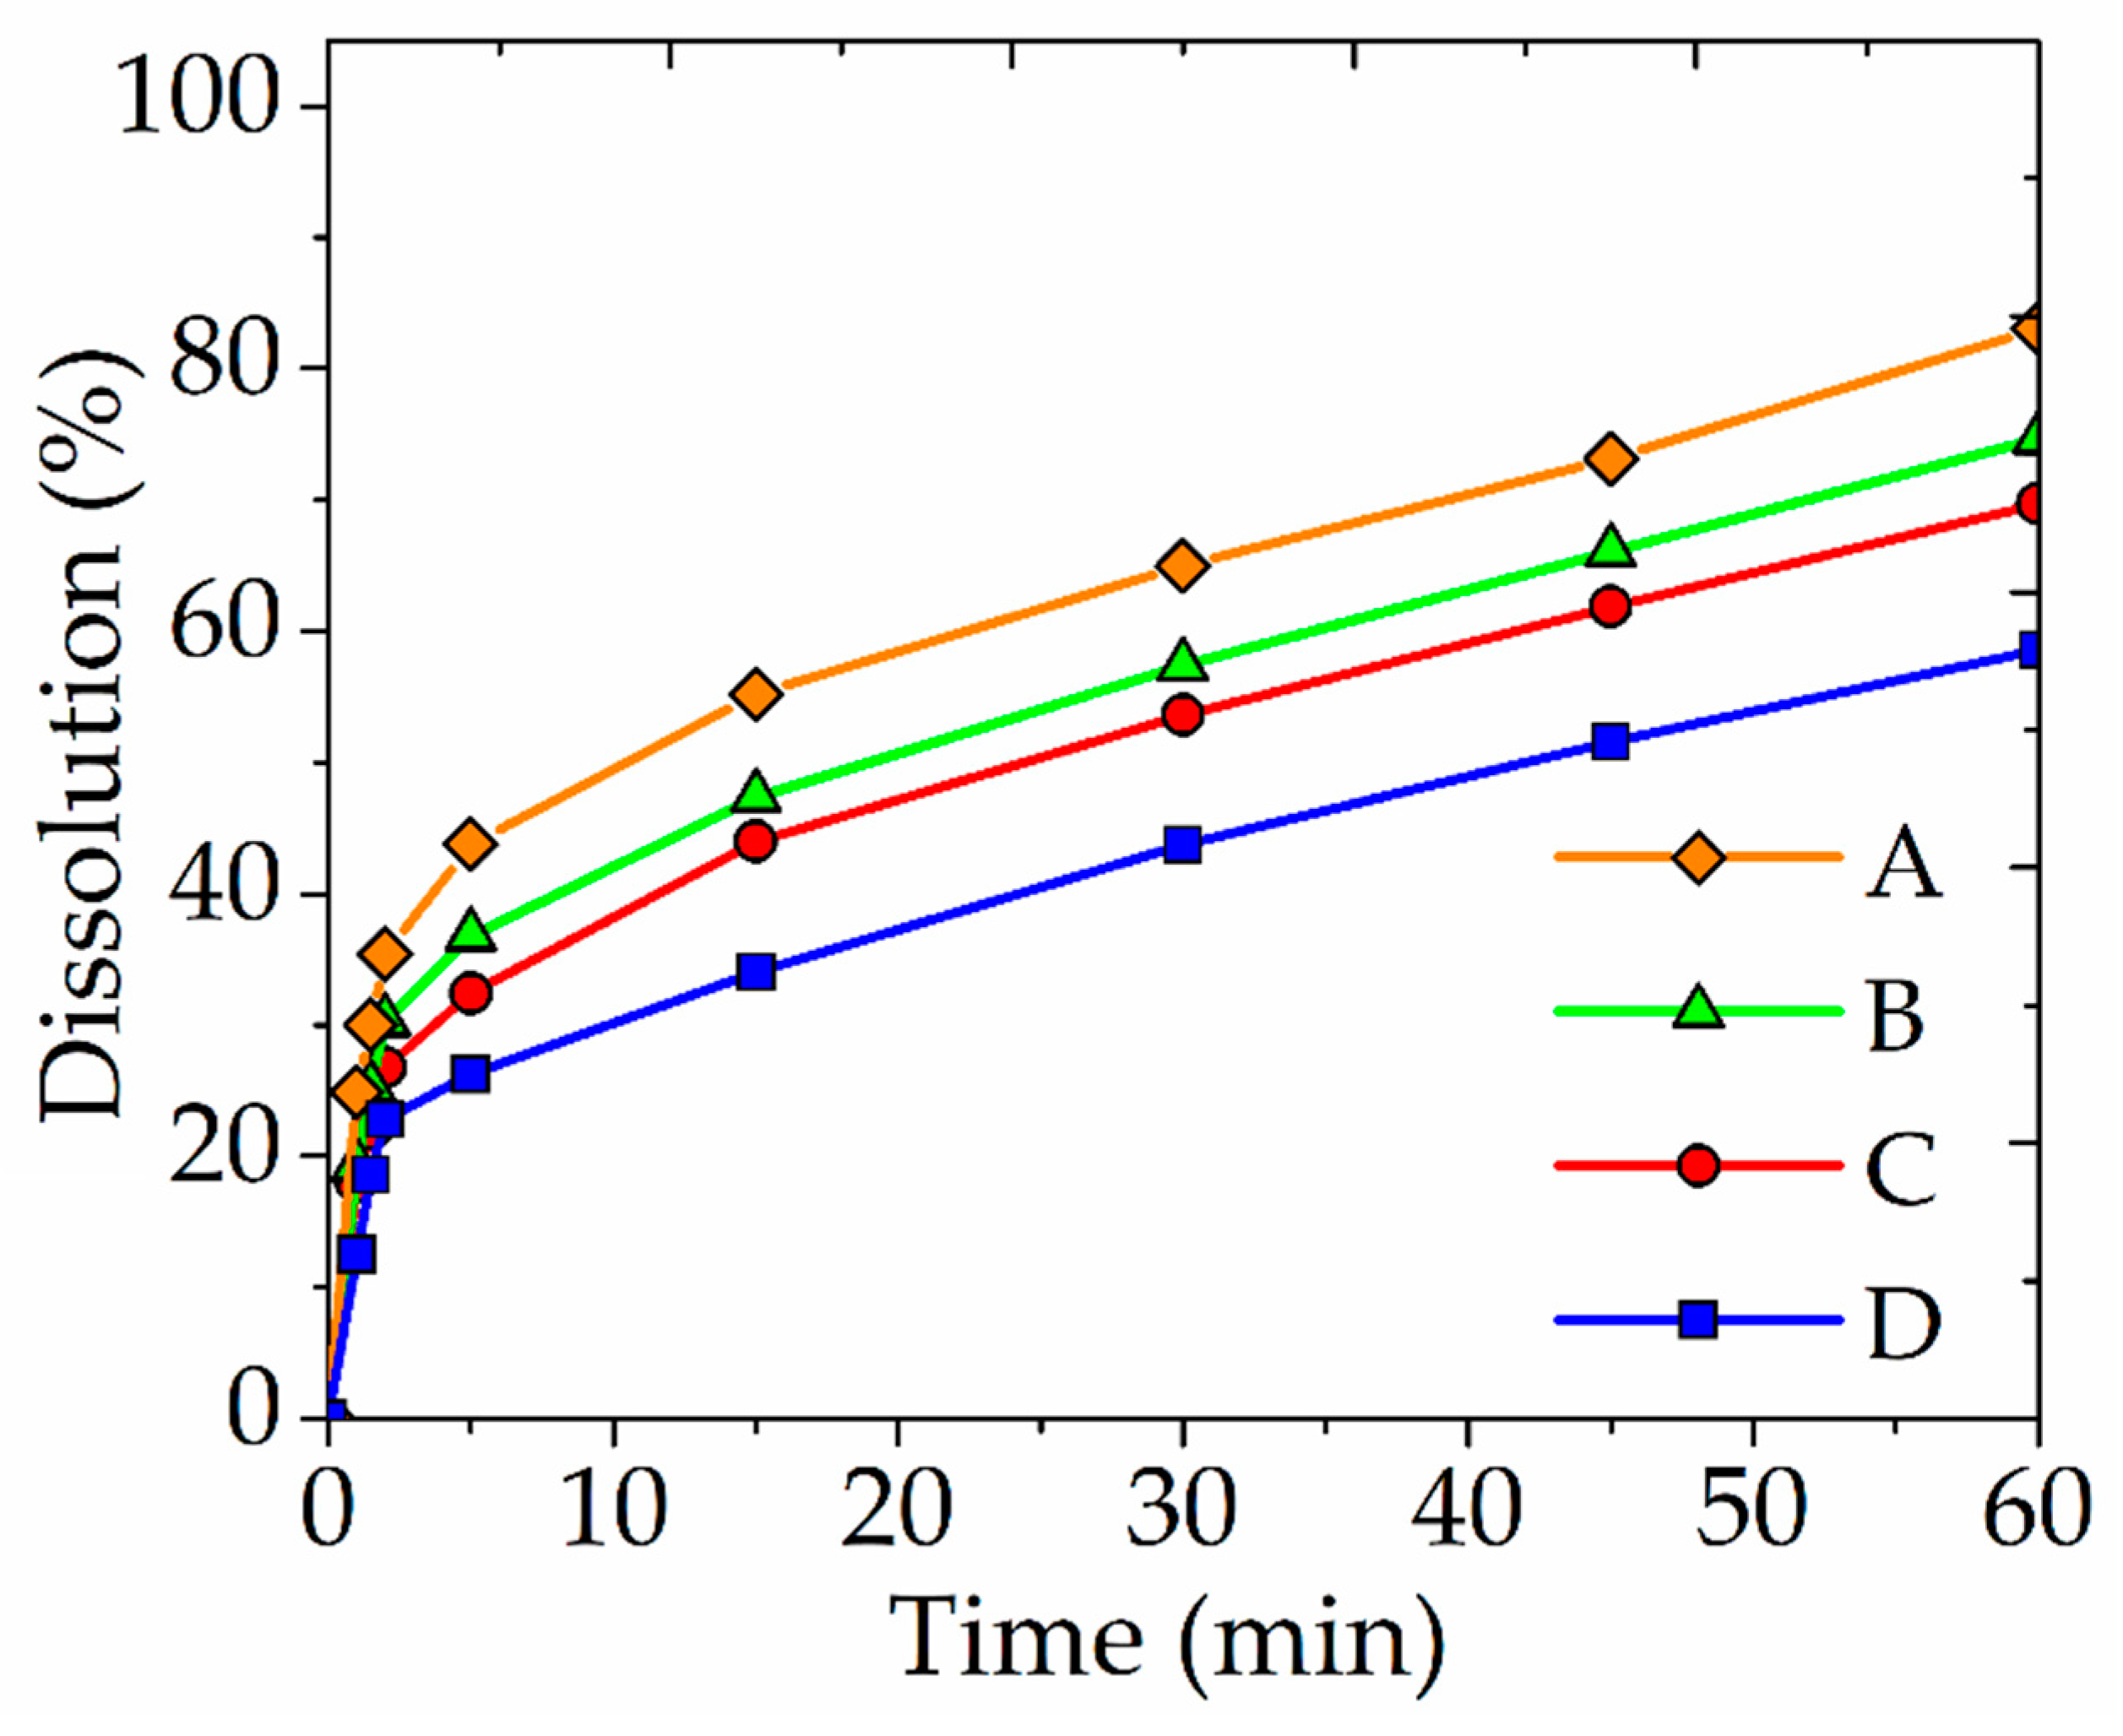
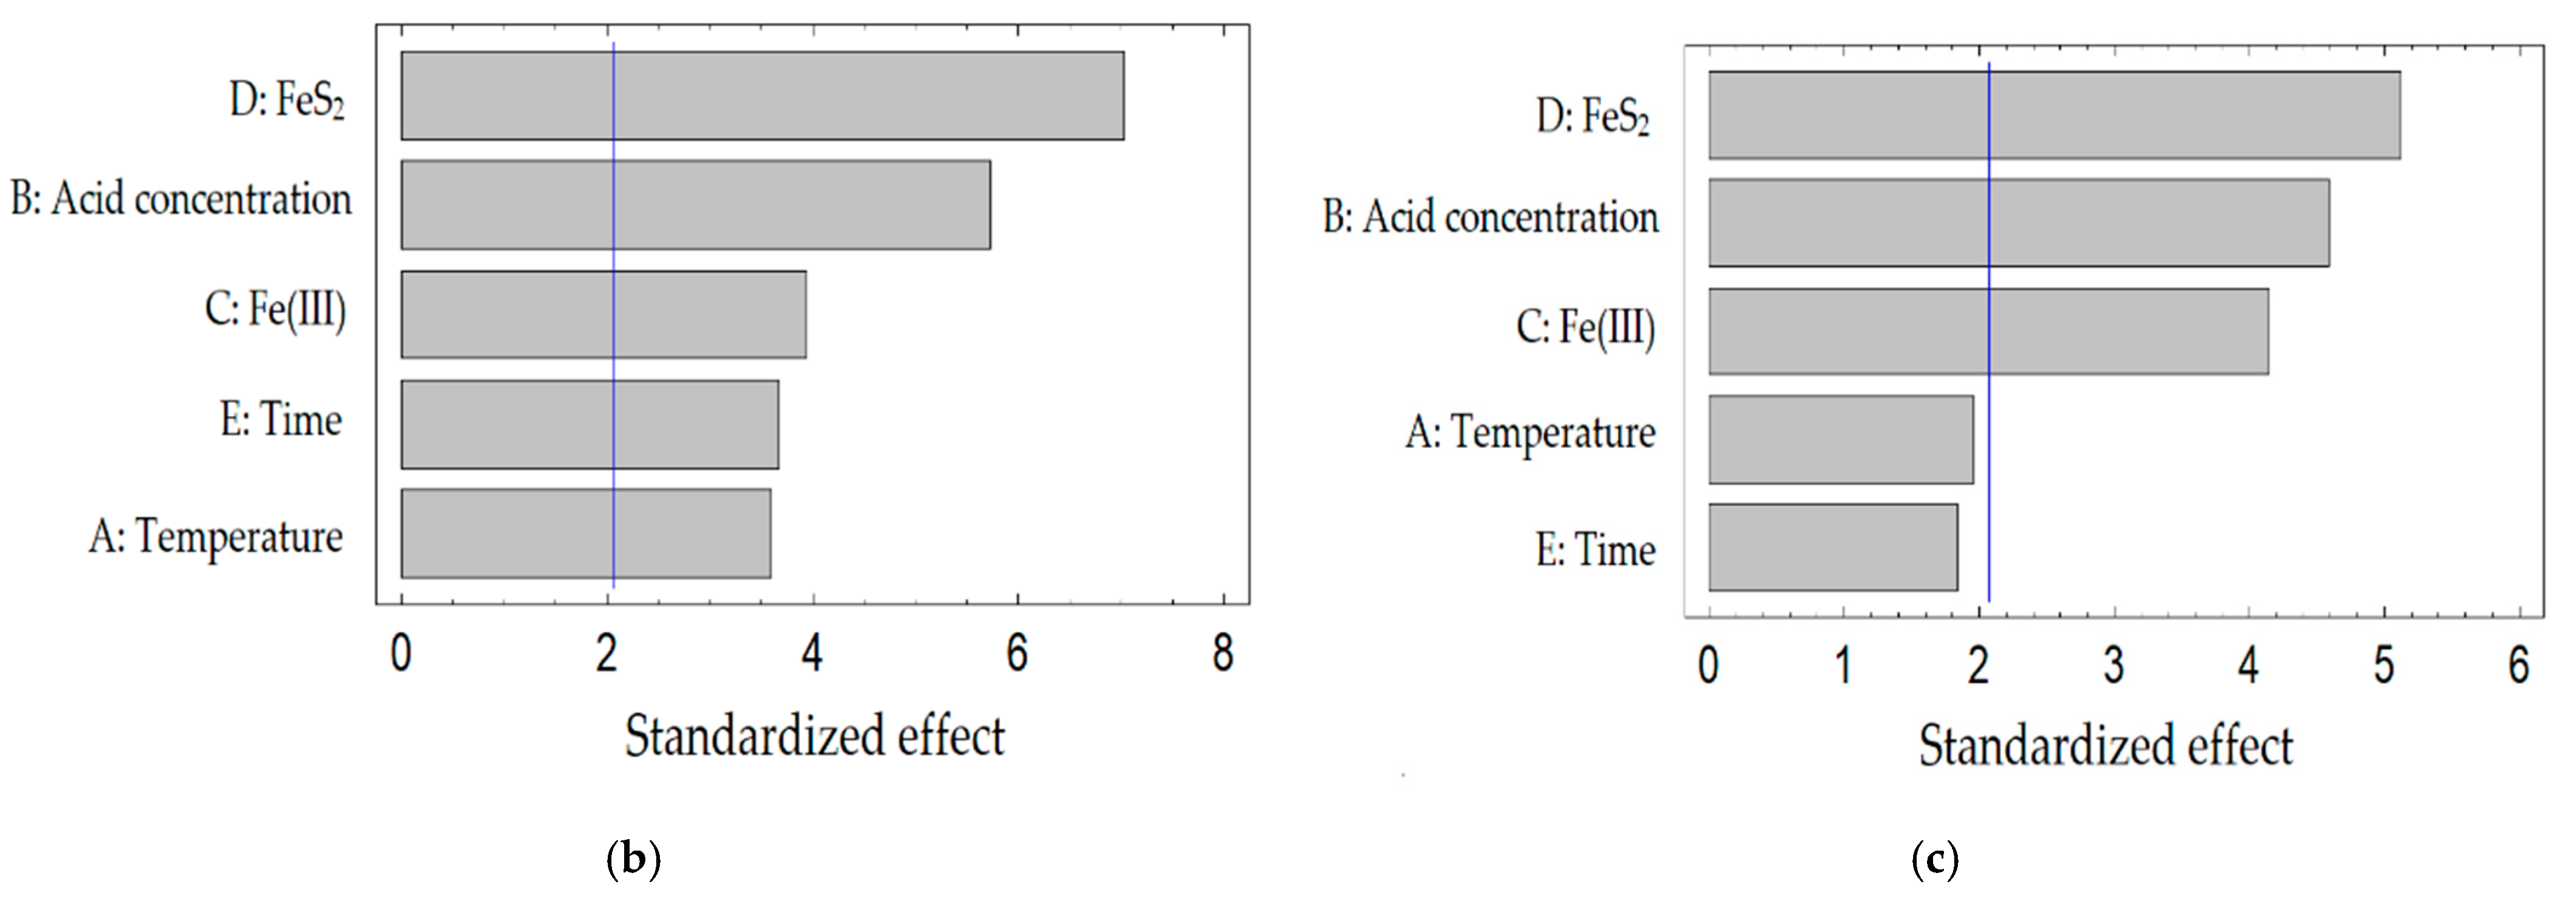
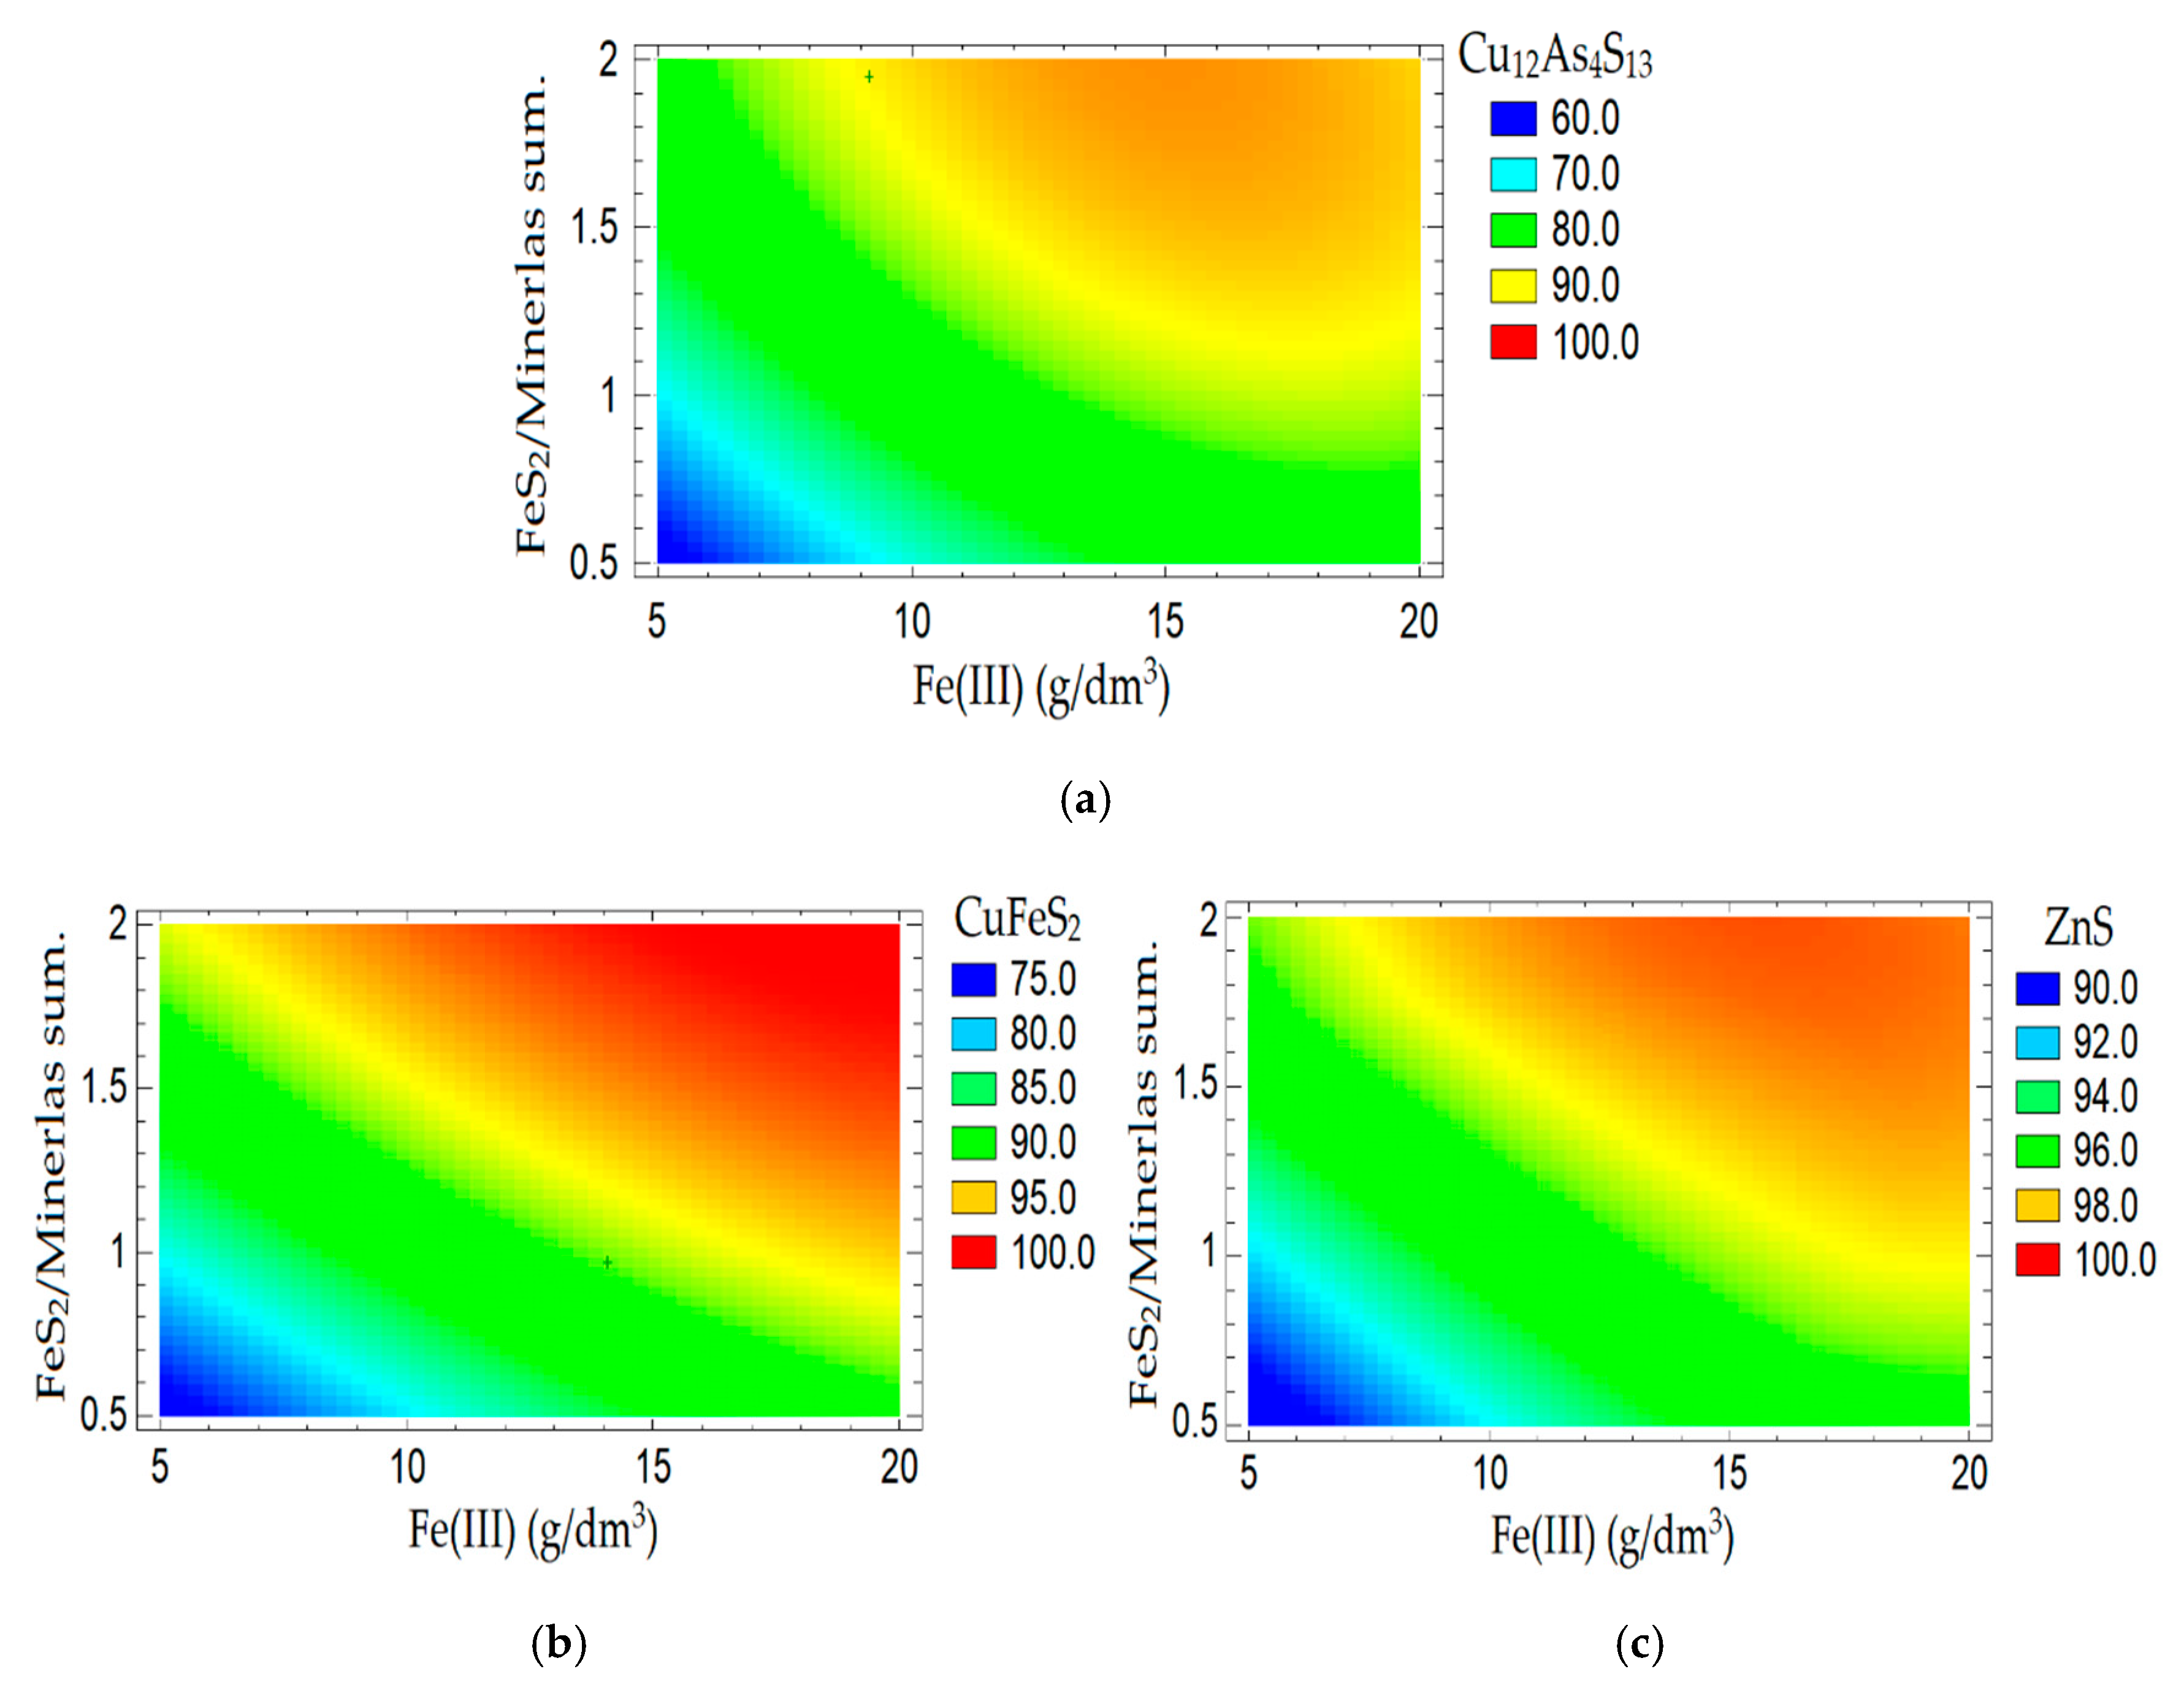
3.2. Determination of Optimal Parameters of Nitric Acid Leaching
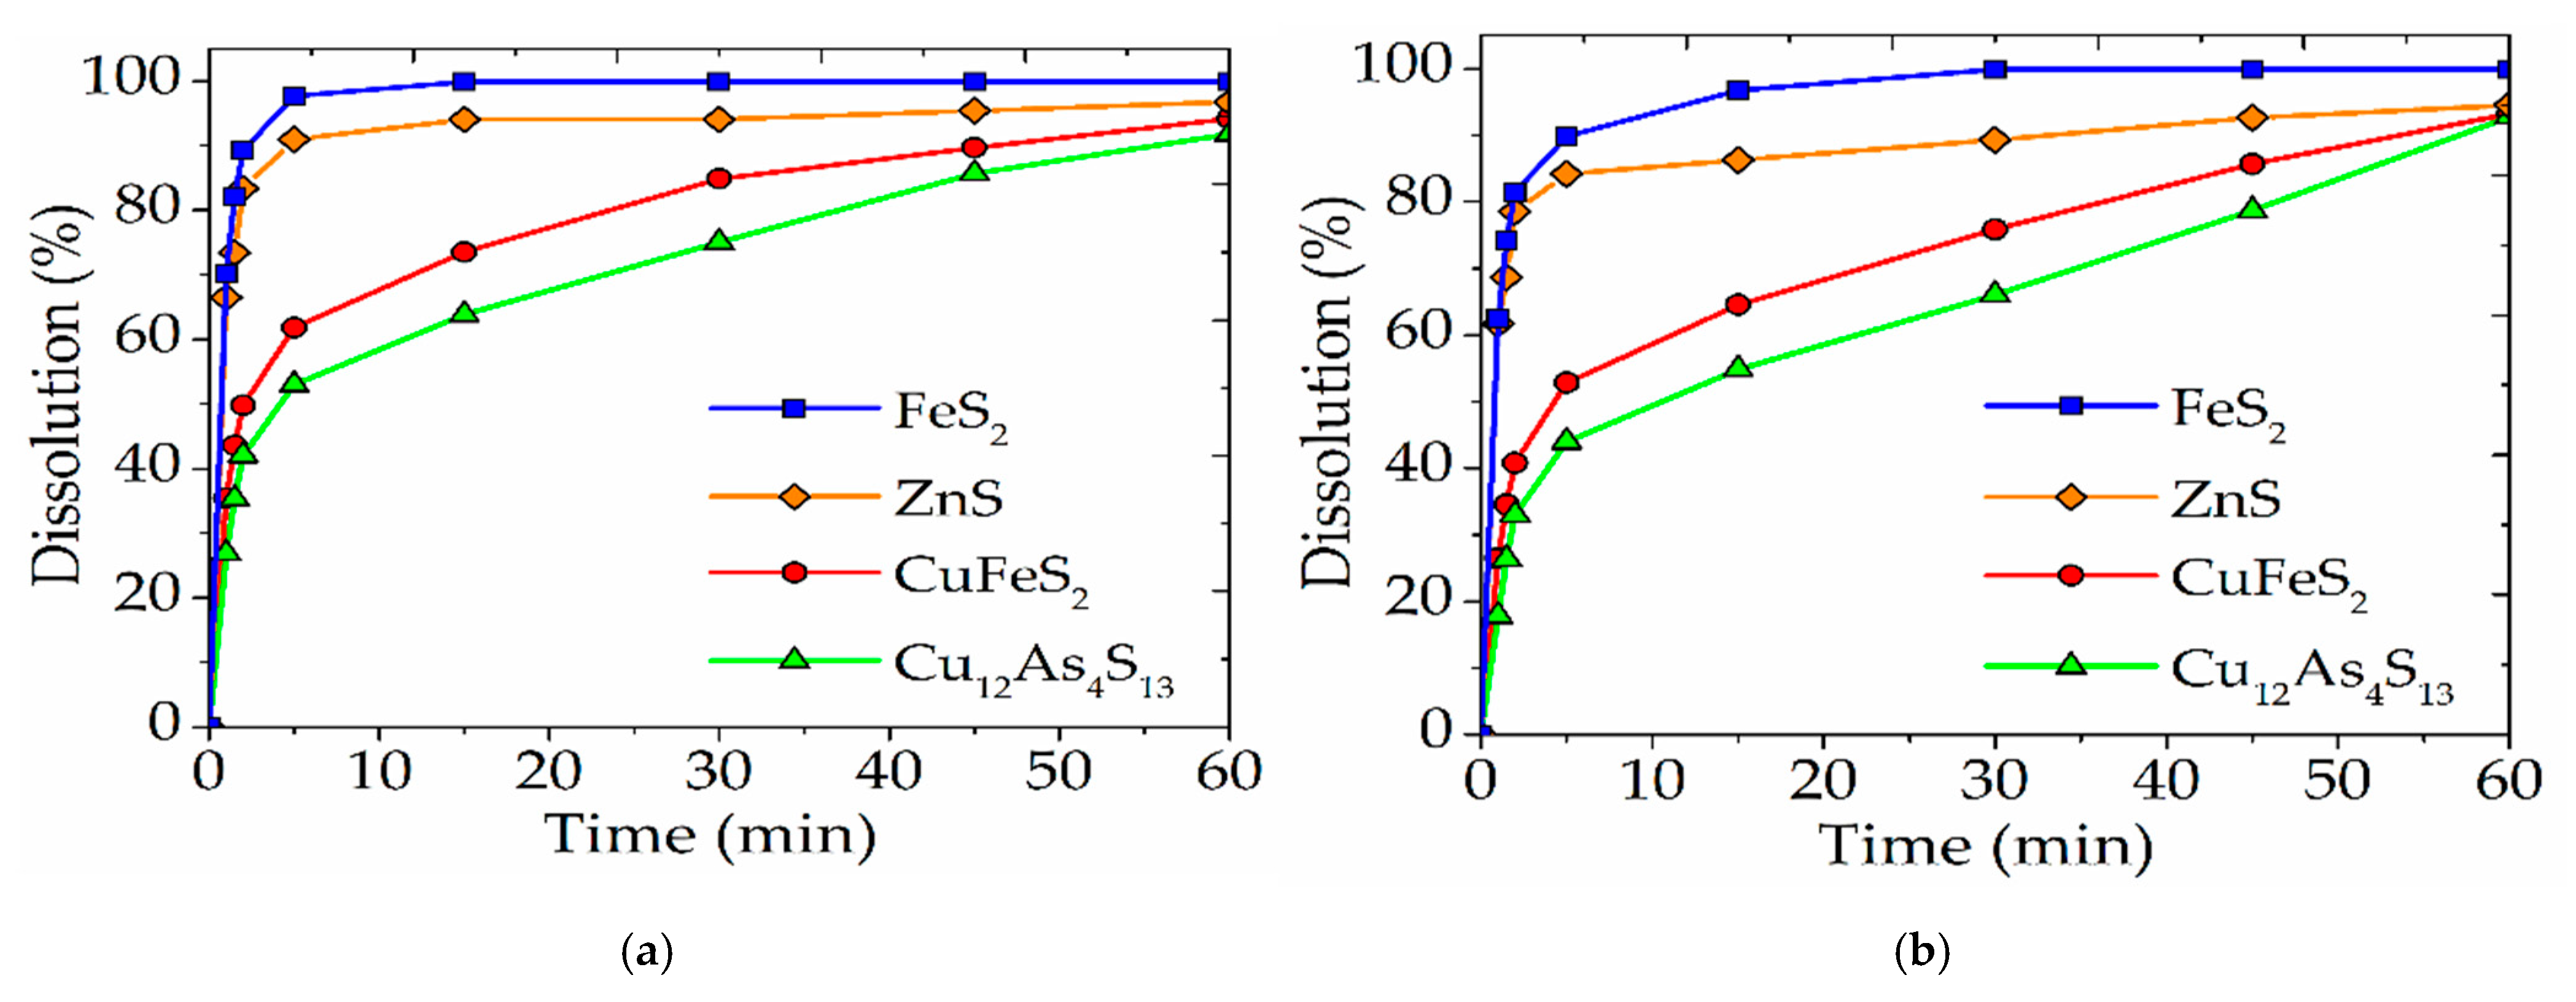
3.3. Comparison of Nitric Acid Leaching of a Natural Mineral Mixture and Industrial Cu-As Concentrate
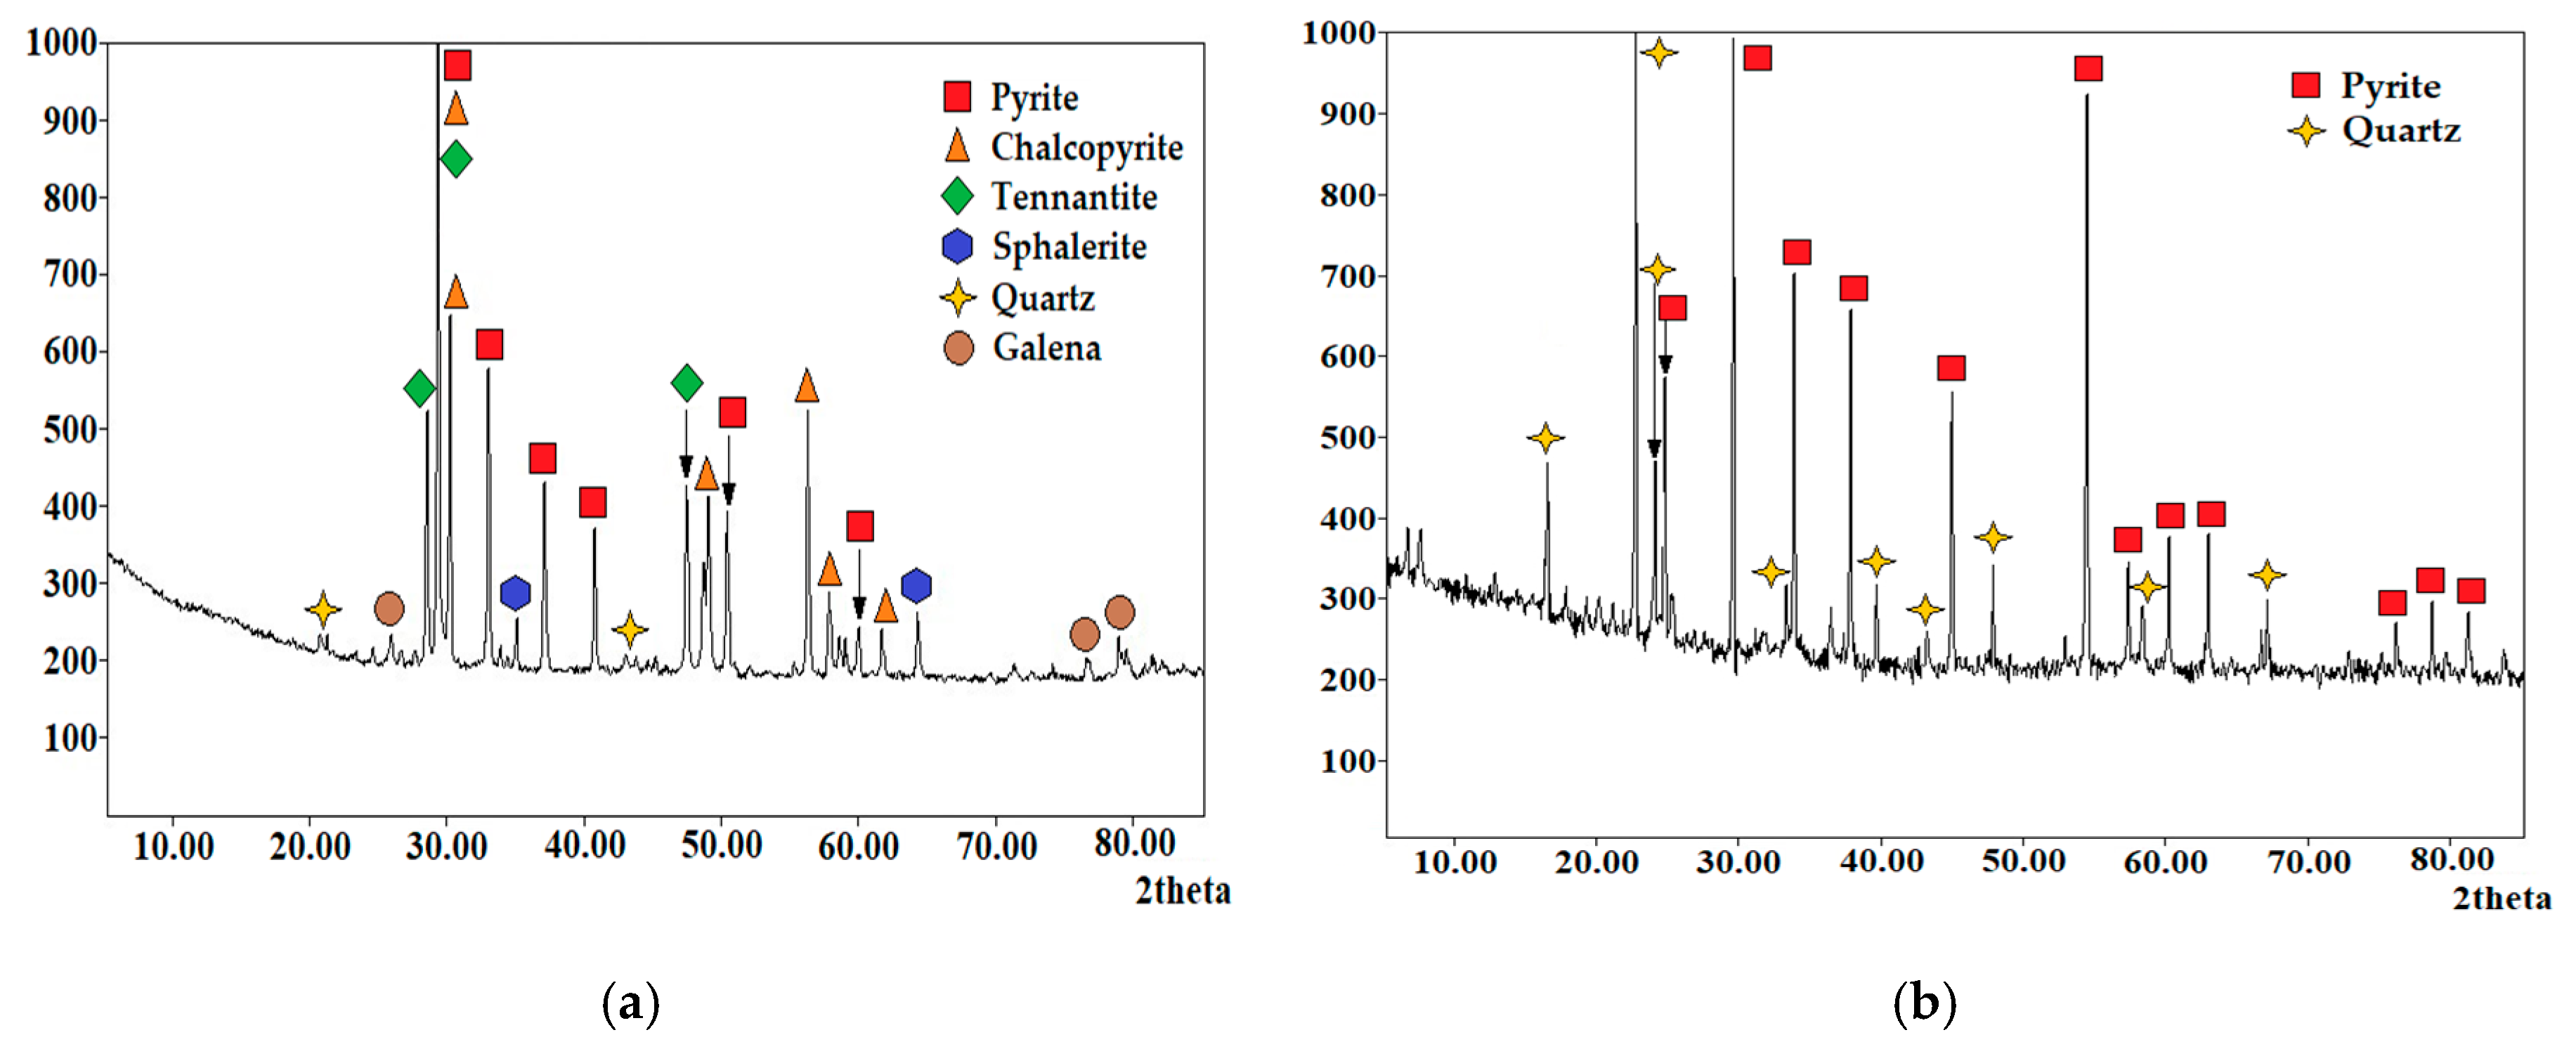
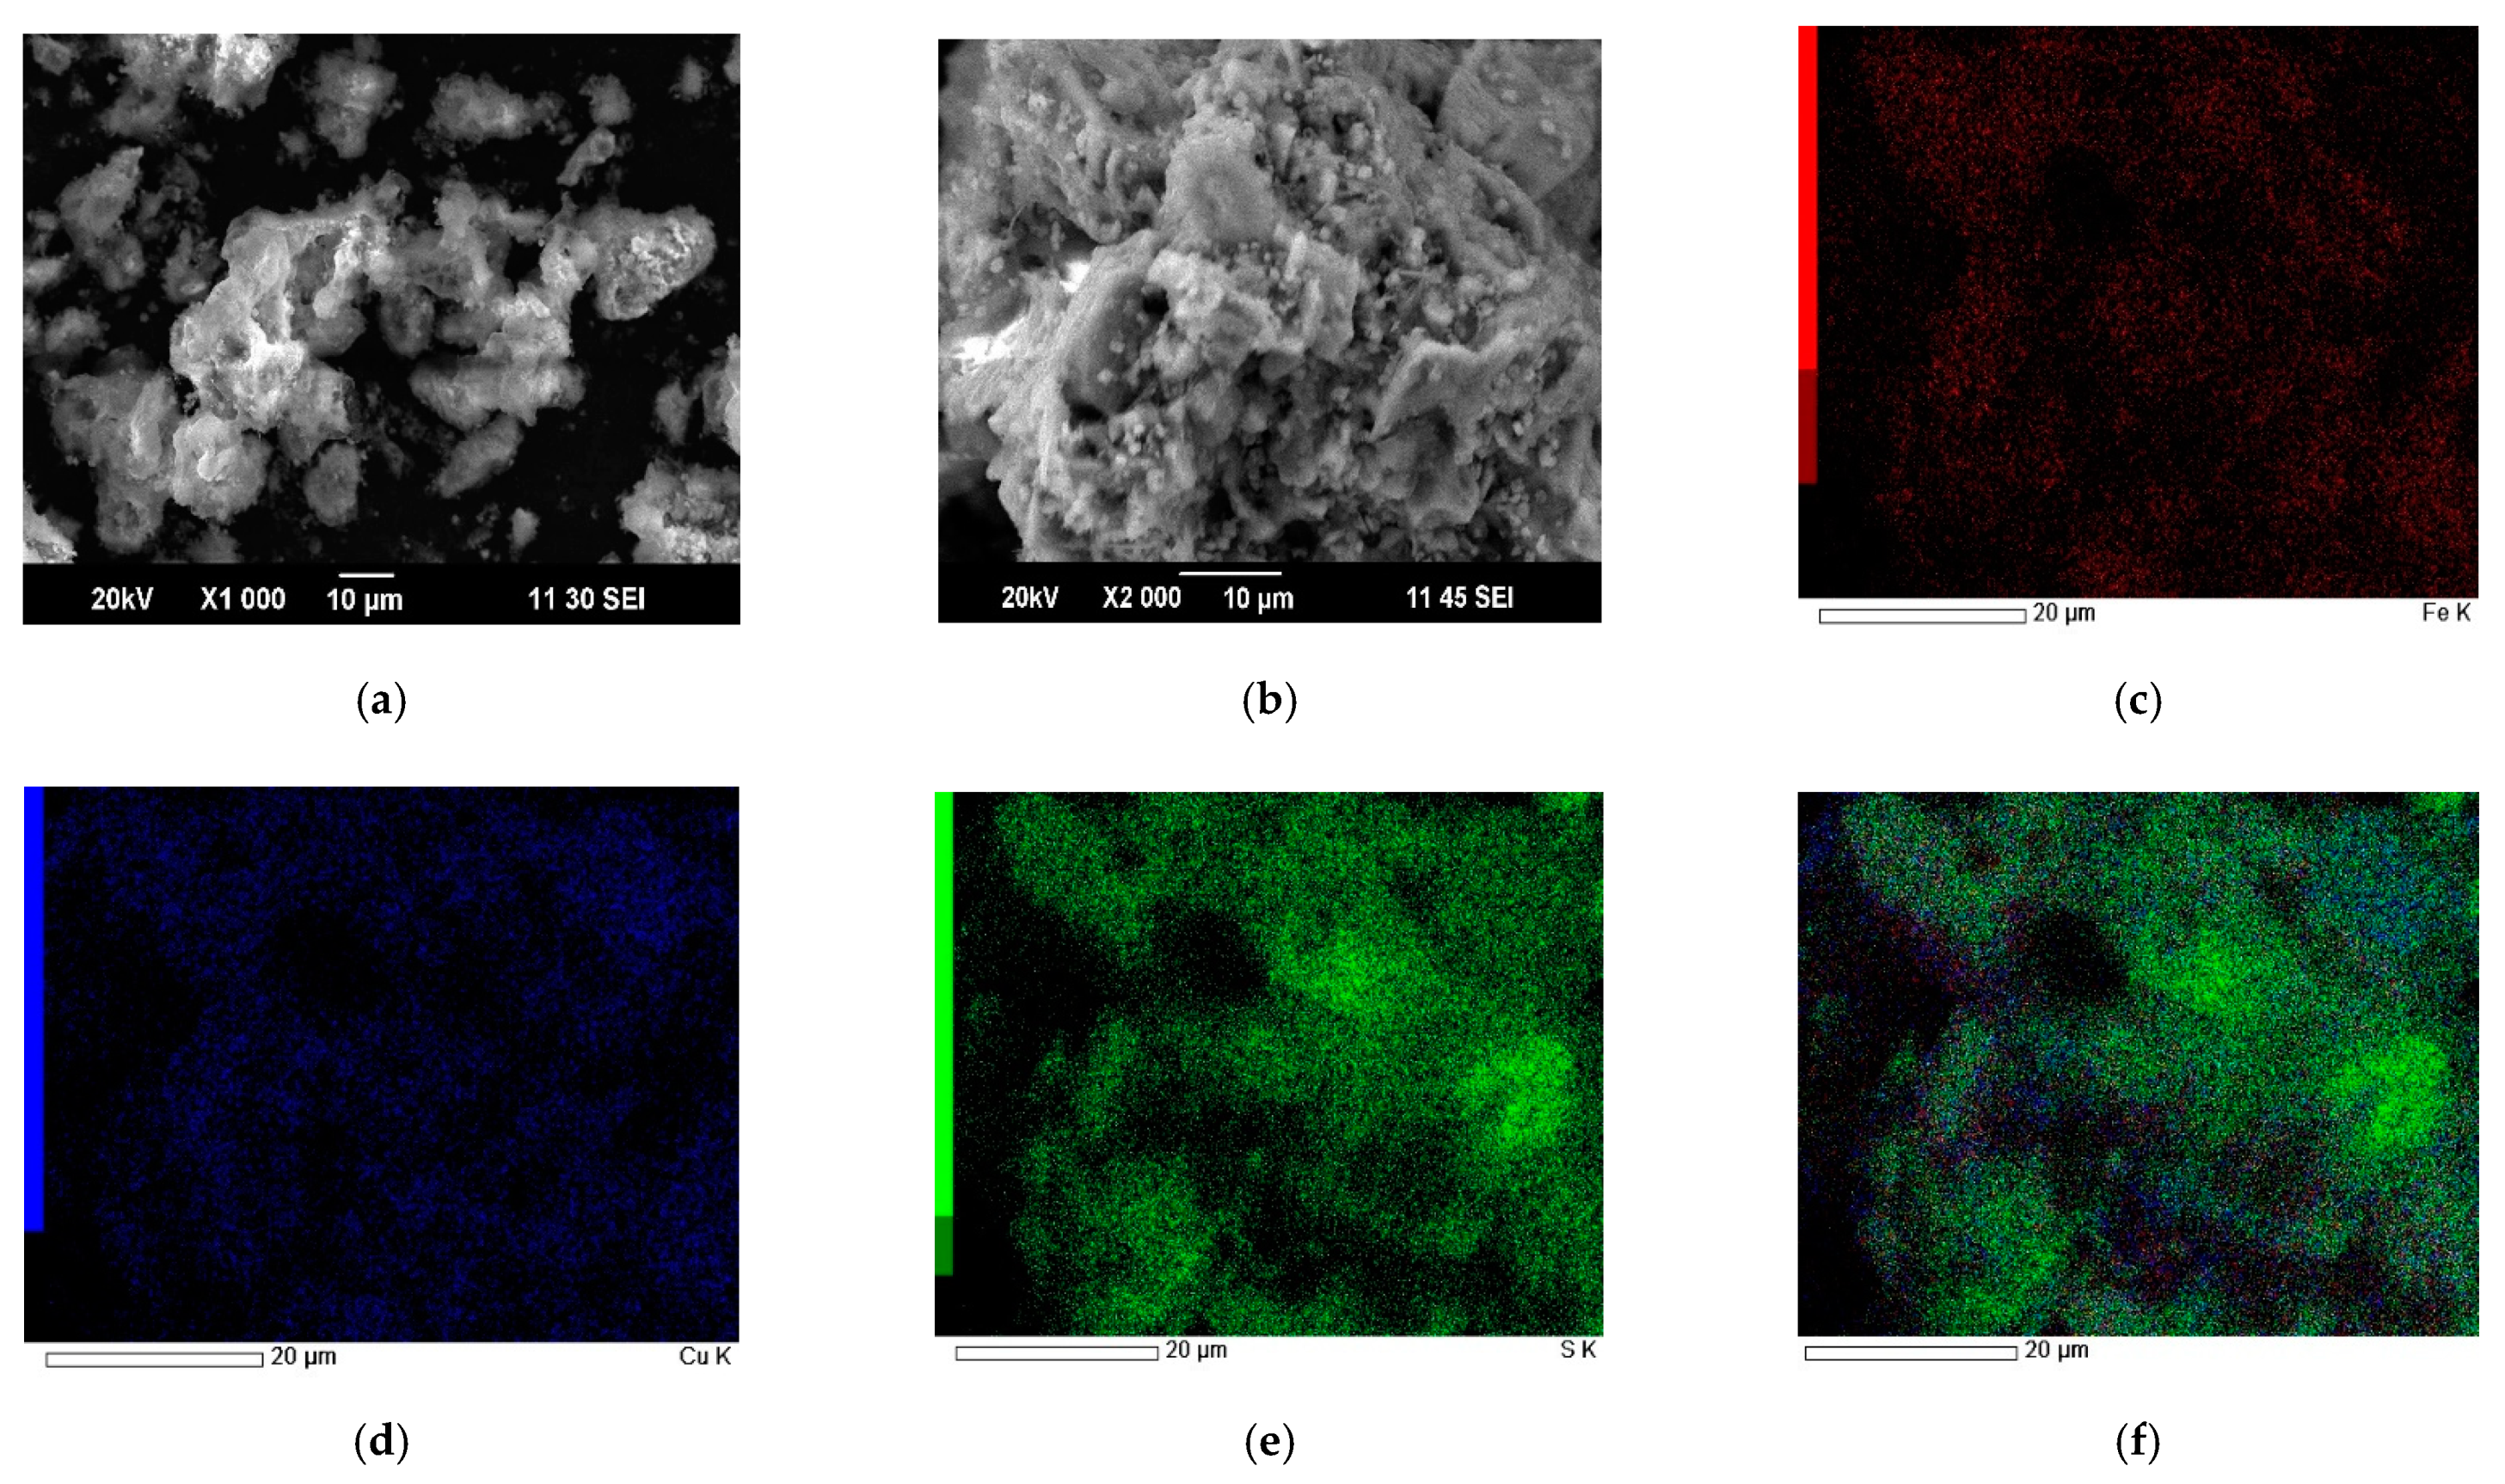
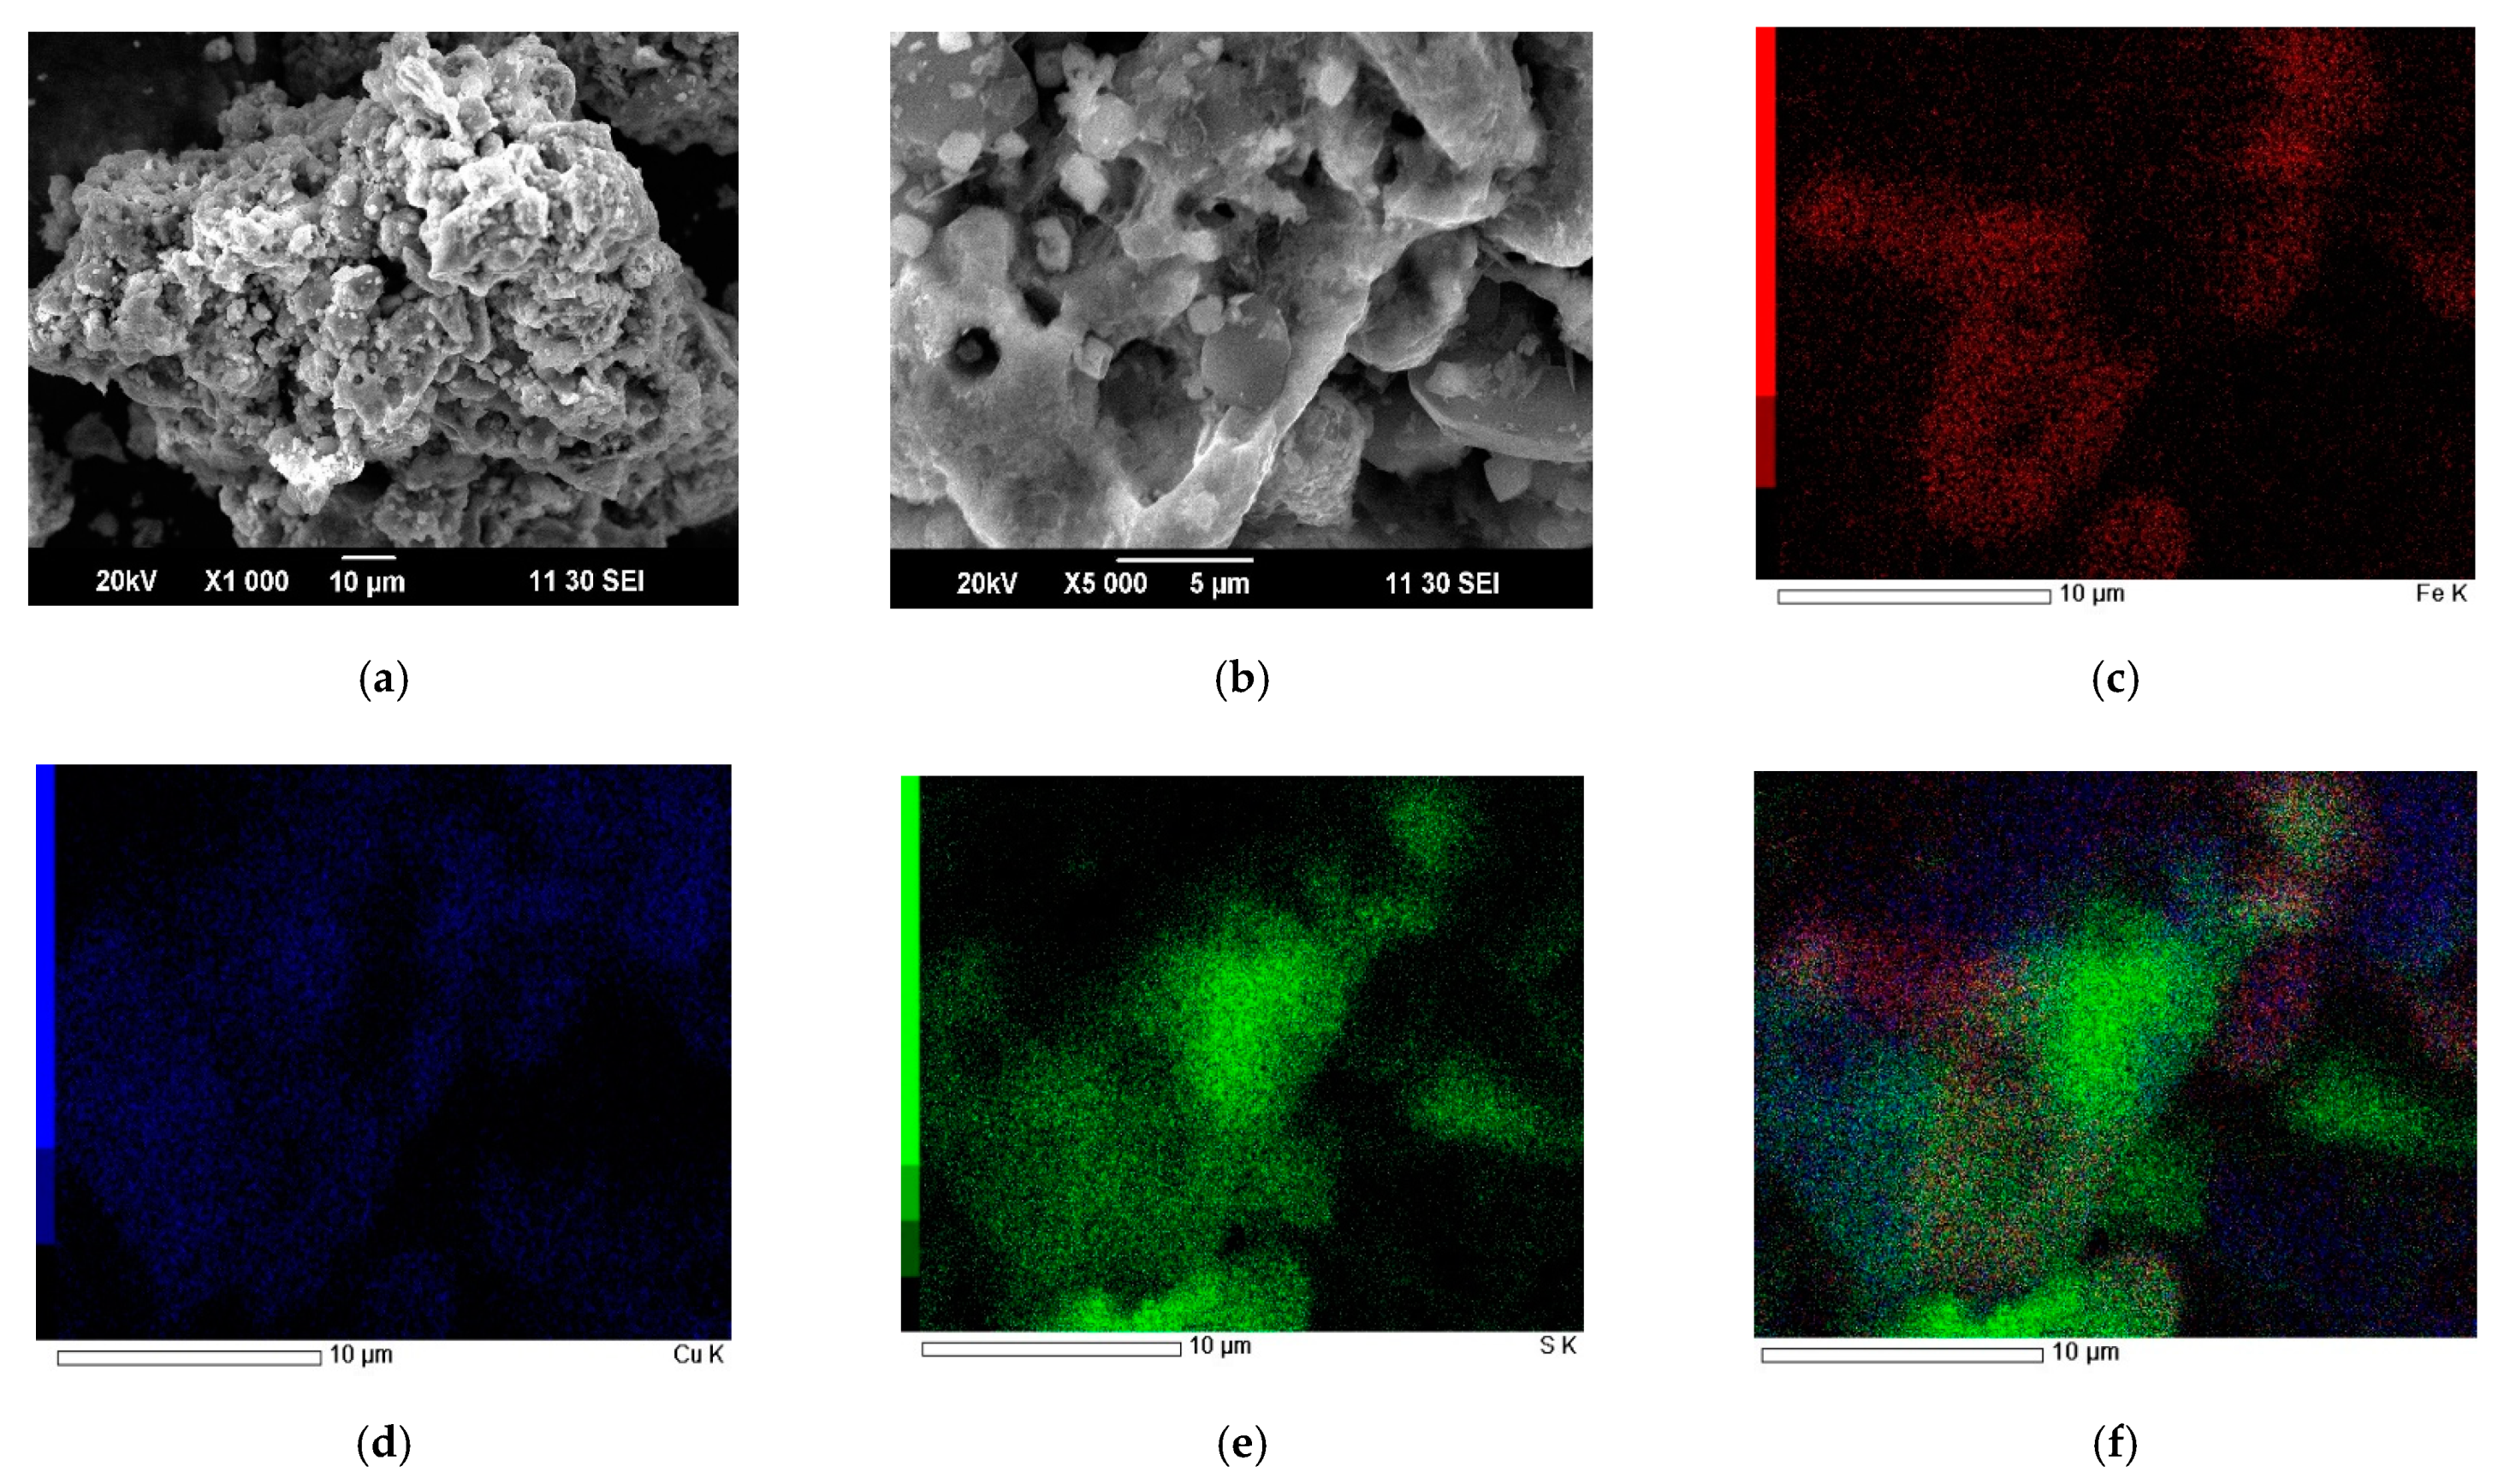
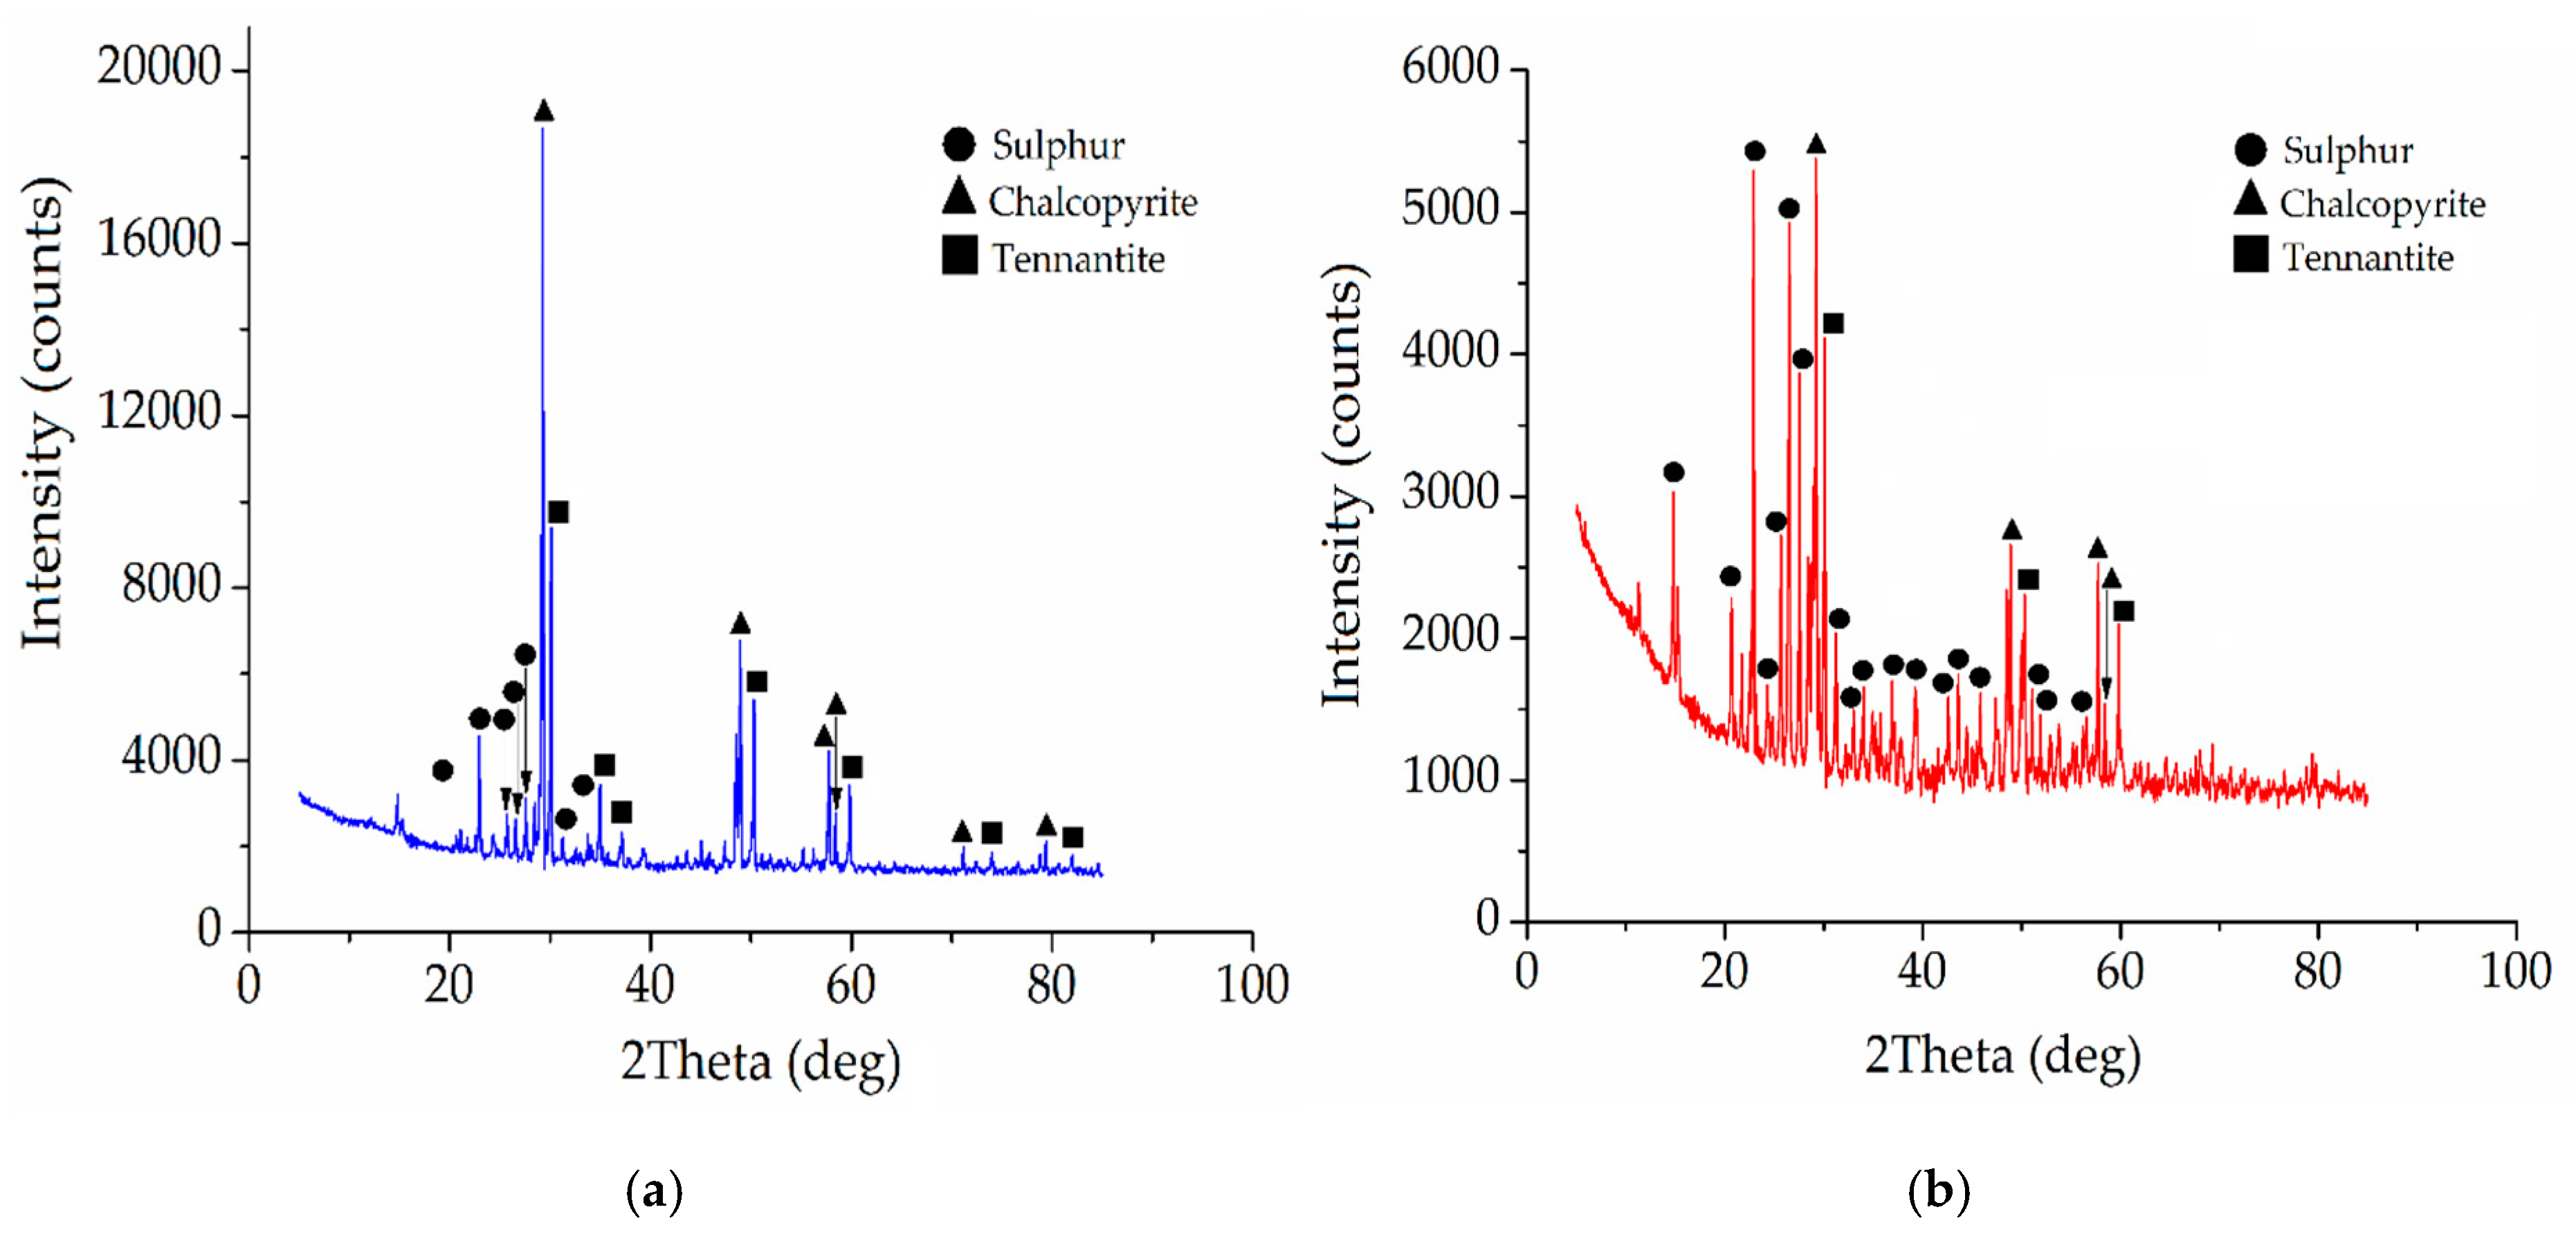
3.4. Characteristics of the Received Cakes
4. Conclusions
- The optimal conditions for nitric acid leaching with the addition of Fe (III) ions and FeS2 are: concentration of nitric acid—6 mol/dm3; time—60 min; temperature—80 °C; concentration of Fe (III) ions—16.5 mol/dm3; mass ratio of amount of FeS2 to a mixture of minerals—1.2:1. The dissolution degree of sulfide minerals achieved was more than 90%. Thereby, it was possible to reduce the required concentration of nitric acid from 12 mol/dm3 to 6 mol/dm3.
- The most significant factors of the process are: the nitric acid concentration, the concentration of Fe (III) ions, and the amount of FeS2. The combination of the addition of Fe (III) ions and FeS2 into the process has the greatest effect. The multiple correlation coefficients R2 for the obtained regression equations were 0.93 for tennantite, 0.93 for chalcopyrite, and 0.95 for sphalerite, respectively. This indicates the adequacy of the chosen model.
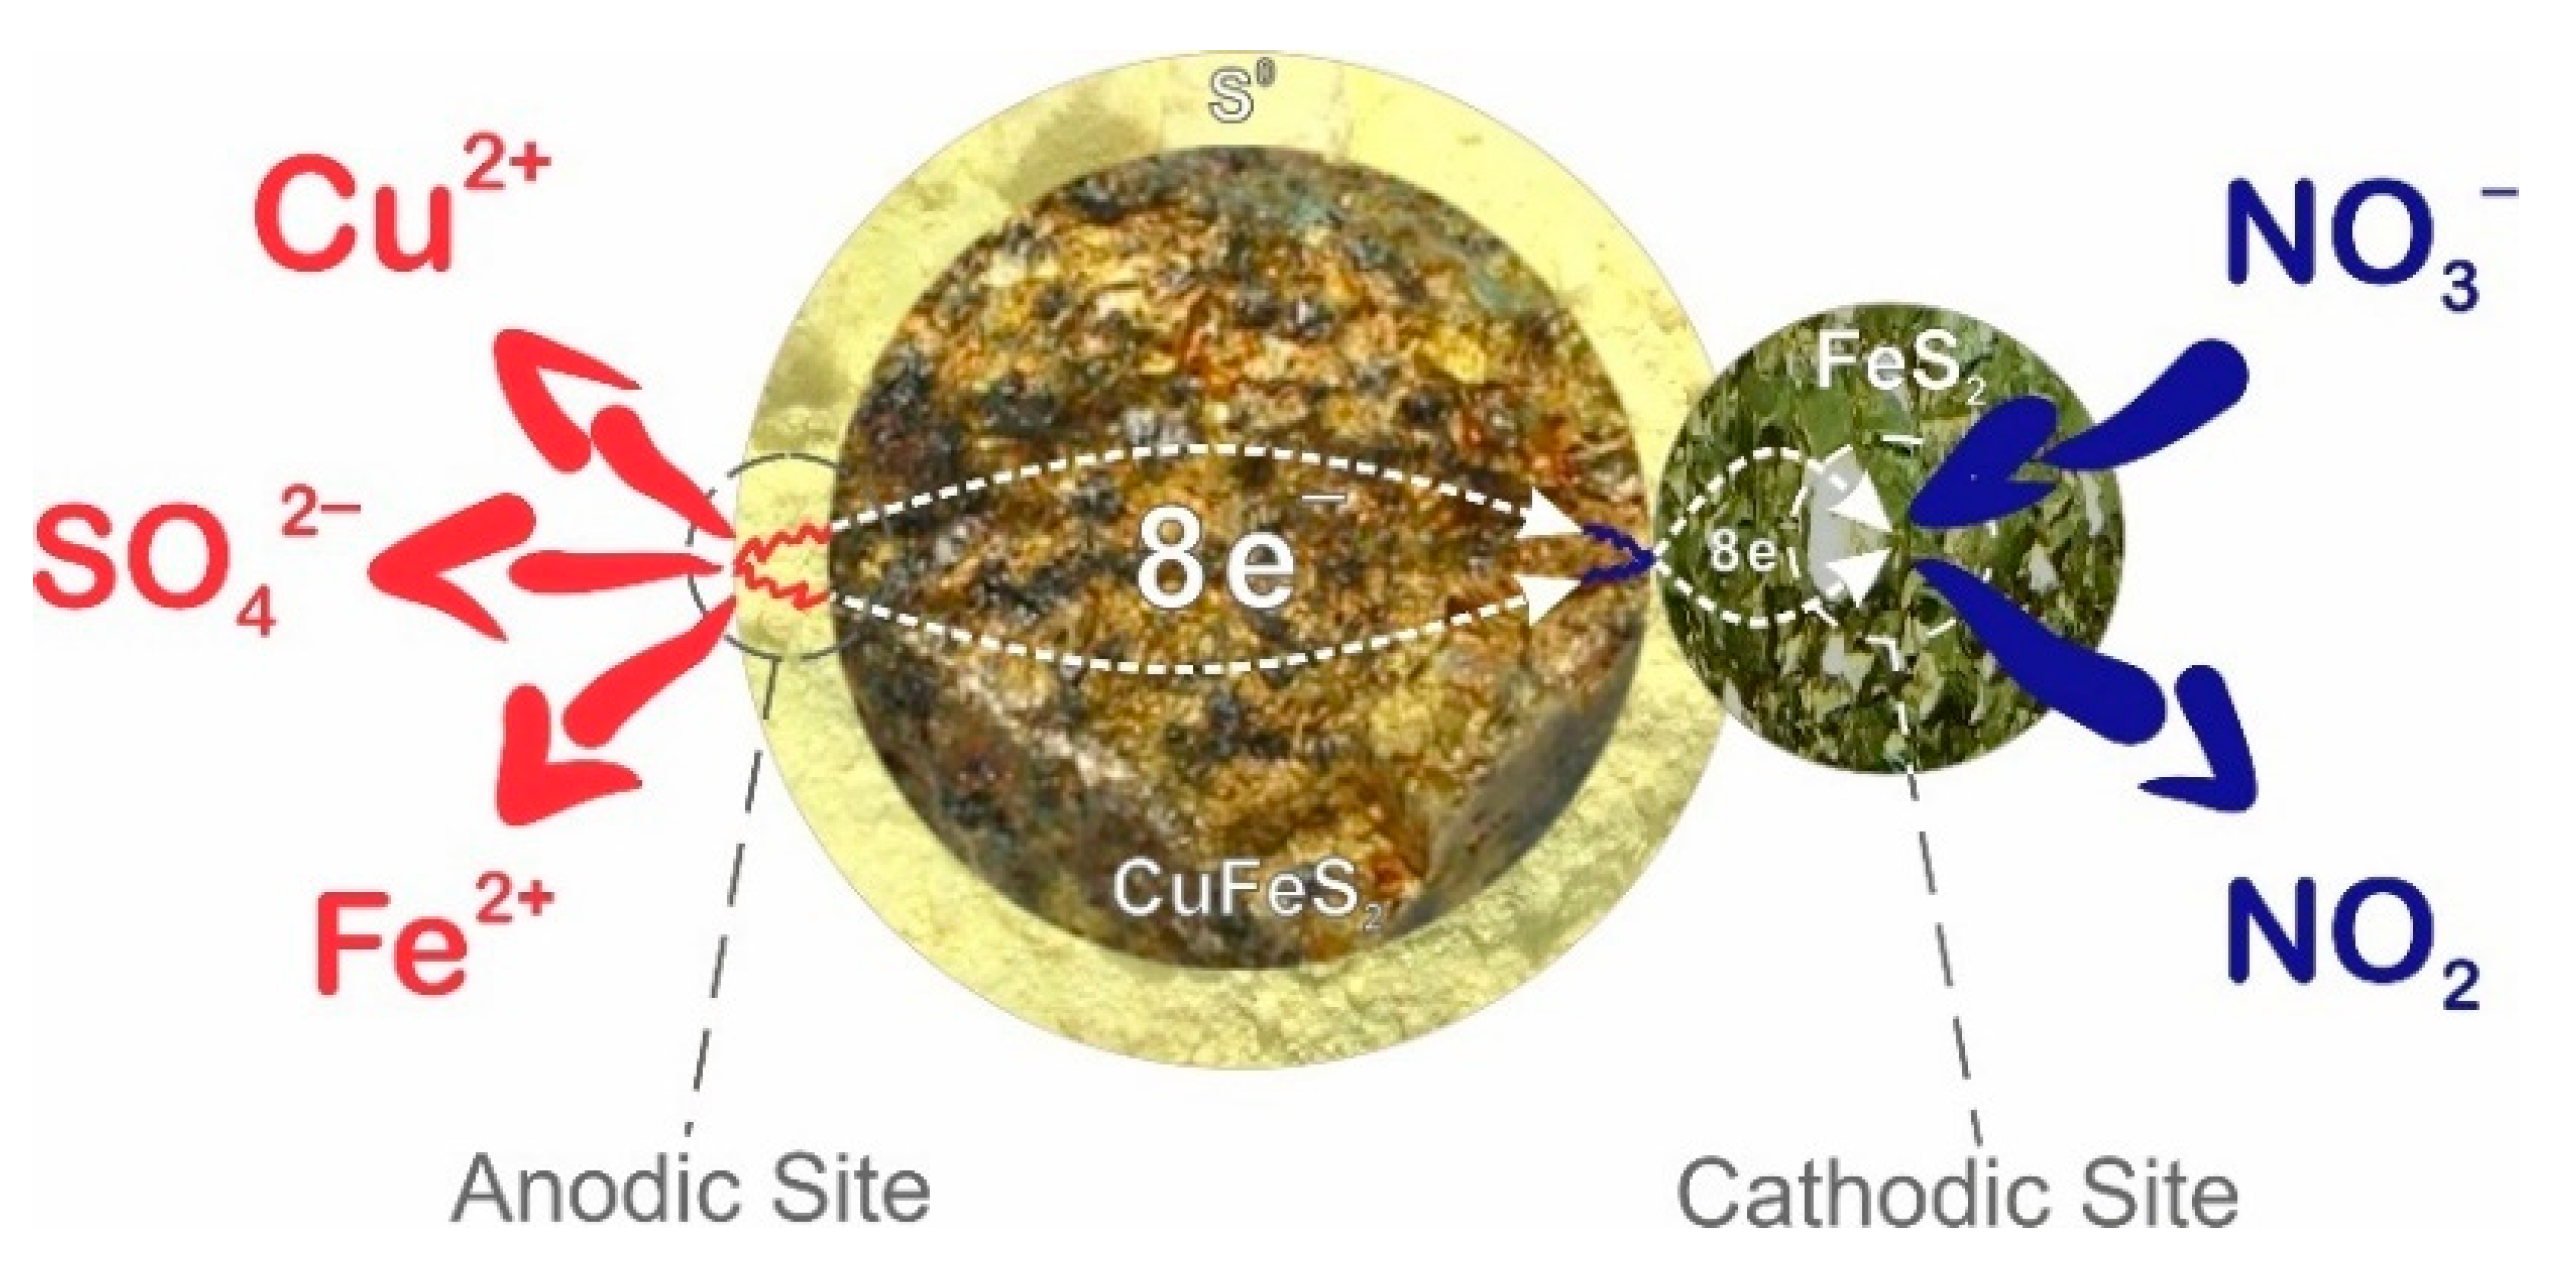
- During nitric acid leaching of a mixture of sulfide minerals, pyrite can act as an alternative catalytic surface for sulfide copper minerals. Due to the galvanic couple formed between the minerals, it is possible to reduce the influence of the passivating layer.
Author Contributions
Funding
Data Availability Statement
Acknowledgments
Conflicts of Interest
References
- Vikentev, A. Selenium, tellurium and precious metal mineralogy in Uchalinsk copper-zinc-pyritic district, the Urals. IOP Conf. Ser. Mater. Sci. Eng. 2016, 123, 012027. [Google Scholar] [CrossRef]
- Shibayama, A.; Takasaki, Y.; William, T.; Yamatodani, A.; Higuchi, Y.; Sunagawa, S.; Ono, E. Treatment of smelting residue for arsenic removal and recovery of copper using pyro–hydrometallurgical process. J. Hazard. Mater. 2010, 181, 1016–1023. [Google Scholar] [CrossRef] [PubMed]
- Kovyazin, A.; Timofeev, K.; Krauhin, S. Copper smelting fine dust autoclave leaching. Mater. Sci. Forum 2019, 946, 615–620. [Google Scholar] [CrossRef]
- Jarošíková, A.; Ettler, V.; Mihaljevič, M.; Penížek, V.; Matoušek, T.; Culka, A.; Drahota, P. Transformation of arsenic-rich copper smelter flue dust in contrasting soils: A 2-year field experiment. Environ. Pollut. 2018, 237, 83–92. [Google Scholar] [CrossRef] [PubMed]
- Lv, X.-D.; Li, G.; Xin, Y.-T.; Yan, K.; Yi, Y. Selective Leaching of Arsenic from High-Arsenic Dust in the Alkaline System and its Prediction Model Using Artificial Neural Network. Min. Metall. Explor. 2021, 28, 2133–2144. [Google Scholar] [CrossRef]
- Guo, X.-Y.; Yi, Y.; Shi, J.; Tian, Q.-H. Leaching behavior of metals from high-arsenic dust by NaOH-Na2S alkaline leaching. Trans. Nonferrous Met. Soc. China 2016, 26, 575–580. [Google Scholar] [CrossRef]
- Isabaev, S.M.; Kuzgibekova, K.M.; Zikanova, T.A.; Zhinova, E.V. Complex hydrometallurgical processing of lead arsenic-containing dust from copper production. Tsvetnye Met. 2017, 8, 33–38. [Google Scholar] [CrossRef]
- Vircikova, E.; Havlik, M. Removing As from converter dust by a hydrometallurgical method. J. Miner. Met. Mater. Soc. 1999, 51, 20–23. [Google Scholar] [CrossRef]
- Montenegro, V.; Sano, H.; Fujisawa, T. Recirculation of high arsenic content copper smelting dust to smelting and converting processes. Miner. Eng. 2013, 49, 184–189. [Google Scholar] [CrossRef]
- Montenegro, V.; Sano, H.; Fujisawa, T. Recirculation of chilean copper smelting dust with high arsenic content to the smelting process. Mater. Trans. 2008, 49, 2112–2118. [Google Scholar] [CrossRef]
- Xue, J.; Long, D.; Zhong, H.; Wang, S.; Liu, L. Comprehensive recovery of arsenic and antimony from arsenic-rich copper smelter dust. J. Hazard. Mater. 2021, 413, 125365. [Google Scholar] [CrossRef] [PubMed]
- Karimov, K.A.; Naboichenko, S.S.; Kritskii, A.V.; Tret’yak, M.A.; Kovyazin, A.A. Oxidation Sulfuric Acid Autoclave Leaching of Copper Smelting Production Fine Dust. Metallurgist 2019, 62, 1244–1249. [Google Scholar] [CrossRef]
- Jarošíková, A.; Ettler, V.; Mihaljevič, M.; Drahota, P.; Culka, A.; Racek, M. Characterization and pH-dependent environmental stability of arsenic trioxide-containing copper smelter flue dust. J. Environ. Manag. 2018, 209, 71–80. [Google Scholar] [CrossRef]
- Azcue, J.M.; Mudroch, A.; Rosa, F.; Hall, G. Effects of abandoned gold mine tailings on the arsenic concentrations in water and sediments of jack of Clubs Lake, B.C. Environ. Technol. 1994, 15, 669–678. [Google Scholar] [CrossRef]
- Bissen, M.; Frimmel, F.H. Arsenic–A review. Part I: Occurrence, Toxicity, Speciation, Mobility. Acta Hydroch. Hydrob. 2003, 31, 9–18. [Google Scholar] [CrossRef]
- Jackson, T.A.; Vlaar, S.; Nguyen, N.; Leppard, G.G.; Finan, T.M. Effects of Bioavailable Heavy Metal Species, Arsenic, and Acid Drainage from Mine Tailings on a Microbial Community Sampled Along a Pollution Gradient in a Freshwater Ecosystem. Geomicrobiol. J. 2015, 35, 724–750. [Google Scholar] [CrossRef]
- Riveros, P.A.; Dutrizac, J.E. Studies on the leaching of tennantite. tetrahedrite and enargite in acidic sulfate and chloride media. In International Symposium on Copper Hydrometallurgy, Toronto, Canada; Riveros, P.A., Dixon, D.G., Dreisinger, D.B., Collins, M.J., Eds.; Canadian Institute of Mining, Metallurgy and Petroleum: Toronto, ON, Canada, 2007; pp. 313–331. [Google Scholar]
- Riveros, P.A.; Dutrizac, J.E. The leaching of tennantite, tetrahedrite and enargite in acidic sulfate and chloride media. Can. Metall. Q. 2008, 47, 235–244. [Google Scholar] [CrossRef]
- Correia, M.J.; Carvalho, J.; Monhemius, J. The Effect of Tetrahedrite Composition on Its Leaching Behaviour in FeCl3-NaCl-HCl Solutions. Miner. Eng. 2001, 14, 185–195. [Google Scholar] [CrossRef]
- Lin, H.K. Electrochemical Behaviour of Tennantite in Chloride Solutions. J. Electrochem. Soc. 2006, 153, 74–79. [Google Scholar] [CrossRef]
- Gajam, S.; Raghavan, S. A kinetic study of enargite dissolution in ammoniacal solutions. Int. J. Miner. Process. 1983, 10, 113–129. [Google Scholar] [CrossRef][Green Version]
- Aghazadeh, S.; Abdollahi, H.; Gharabaghi, M.; Mirmohammadi, M. Selective leaching of antimony from tetrahedrite rich concentrate using alkaline sulfide solution with experimental design: Optimization and kinetic studies. J. Taiwan Inst. Chem. Eng. 2021, 119, 298–312. [Google Scholar] [CrossRef]
- Awe, S.A.; Sandström, A. Selective leaching of arsenic and antimony from a tetrahedrite rich complex sulphide concentrate using alkaline sulphide solution. Miner. Eng. 2010, 23, 1227–1236. [Google Scholar] [CrossRef]
- Awe, S.A.; Samuelsson, C.; Sandström, A. Dissolution kinetics of tetrahedrite mineral in alkaline sulphide media. Hydrometallurgy 2010, 103, 167–172. [Google Scholar] [CrossRef]
- Neiva Correia, M.J.; Carvalho, J.R.; Monhemius, A.J. Study of the autoclave leaching of a tetrahedrite concentrate. Miner. Eng. 1993, 11, 1117–1125. [Google Scholar] [CrossRef]
- Kritskii, A. Hydrothermal Treatment of Arsenopyrite Particles with CuSO4 Solution. Materials 2021, 23, 7472. [Google Scholar] [CrossRef] [PubMed]
- Karimov, K.A.; Rogozhnikov, D.A.; Naboichenko, S.S.; Karimova, L.M.; Zakharian, S.V. Autoclave Ammonia Leaching of Silver from Low-Grade Copper Concentrates. Metallurgist 2018, 62, 783–789. [Google Scholar] [CrossRef]
- Corkhill, C.L.; Wincott, P.L.; Lloyd, J.R.; Vaughan, D.J. The oxidative dissolution of arsenopyrite (FeAsS) and enargite (Cu3AsS4) by Leptospirillum ferrooxidans. Geochim. Cosmochim. Acta 2008, 72, 5616–5633. [Google Scholar] [CrossRef]
- Safarzadeh, M.S.; Moats, M.S.; Miller, J.D. Recent trends in the processing of enargite concentrates. Miner. Process. Extr. Metall. Rev. 2014, 35, 283–367. [Google Scholar] [CrossRef]
- Anderson, C.G.; Twidwell, L.G. Hydrometallurgical processing of gold-bearing copper enargite concentrates. Can. Metall. Q. 2008, 47, 337–346. [Google Scholar] [CrossRef]
- Rogozhnikov, D.A.; Shoppert, A.A.; Dizer, O.A.; Karimov, K.A.; Rusalev, R.E. Leaching Kinetics of Sulfides from Refractory Gold Concentrates by Nitric Acid. Metals 2019, 9, 465. [Google Scholar] [CrossRef]
- Rogozhnikov, D.A.; Zakharian, S.V.; Dizer, O.A.; Karimov, K.A. Nitric acid leaching of the copper-bearing arsenic sulphide concentrate of Akzhal. Tsvetnye Met. 2020, 8, 11–17. [Google Scholar] [CrossRef]
- Shinoda, K.; Tanno, T.; Fujita, T.; Suzuki, S. Coprecipitation of Large Scorodite Particles from Aqueous Fe(II) and As(V) Solution by Oxygen Injection. Mater. Trans. 2009, 50, 1196–1201. [Google Scholar] [CrossRef]
- Krause, E.; Ettel, V.A. Solubilities and stabilities of ferric arsenate compounds. Hydrometallurgy 1989, 22, 311–337. [Google Scholar] [CrossRef]
- Langmuir, D.; Mahoney, J.; Rowson, J. Solubility products of amorphous ferric arsenate and crystalline scorodite (FeAsO4 · 2H2O) and their application to arsenic behavior in buried mine tailings. Geochim. Cosmochim. Acta 2006, 70, 2942–2956. [Google Scholar] [CrossRef]
- Paktunc, D.; Dutrizac, J.; Gertsman, V. Synthesis and phase transformations involving scorodite, ferric arsenate and arsenical ferrihydrite: Implications for arsenic mobility. Geochim. Cosmochim. Acta 2008, 75, 2649–2672. [Google Scholar] [CrossRef]
- Li, Y.; Liu, Z.; Li, Q.; Liu, F.; Liu, Z. Alkaline oxidative pressure leaching of arsenic and antimony bearing dusts. Hydrometallurgy 2016, 166, 41–47. [Google Scholar] [CrossRef]
- Gow, R.N.; Huang, H.; Young, C. Utility of mass-balanced EH-pH diagrams I—Applications of Gibbs’ Phase Rule. Miner. Metall. Process. 2016, 33, 58–67. [Google Scholar] [CrossRef]
- Gow, R.N.; Huang, H.; Young, C. Utility of mass-balanced EH-pH diagrams II: Stoichiometry of Cu-As-S-H2O system. Miner. Metall. Process. 2016, 33, 107–115. [Google Scholar] [CrossRef]
- Dixon, D.G.; Mayne, D.D.; Baxter, K.G. Galvanox™—A novel galvanically-assisted atmospheric leaching technology for copper concentrates. Can. Metall. Q. 2008, 47, 327–336. [Google Scholar] [CrossRef]
- Nazari, G.; Dixon, D.G.; Dreisinger, D.B. Enhancing the kinetics of chalcopyrite leaching in the GalvanoxTM process. Hydrometallurgy 2011, 105, 251–258. [Google Scholar] [CrossRef]
- Nazari, G.; Dixon, D.G.; Dreisinger, D.B. The mechanism of chalcopyrite leaching in the presence of silver-enhanced pyrite in the GalvanoxTM process. Hydrometallurgy 2012, 113–114, 122–130. [Google Scholar] [CrossRef]
- Nazari, G.; Dixon, D.G.; Dreisinger, D.B. The role of silver-enhanced pyrite in enhancing the electrical conductivity of sulfur product layer during chalcopyrite leaching in the GalvanoxTM process. Hydrometallurgy 2012, 113–114, 177–184. [Google Scholar] [CrossRef]
- Córdoba, E.M.; Muñoz, J.A.; Blázquez, M.L.; González, F.; Ballester, A. Leaching of chalcopyrite with ferric ion. Part I: General aspects. Hydrometallurgy 2008, 93, 81–87. [Google Scholar] [CrossRef]
- Dutrizac, J.E. The dissolution of chalcopyrite in ferric sulfate and ferric chloride media. Metall. Trans. 1981, 12, 371–378. [Google Scholar] [CrossRef]
- Hidalgo, T.; Kuhar, L.; Beinlich, A.; Putnis, A. Kinetics and mineralogical analysis of copper dissolution from a bornite/chalcopyrite composite sample in ferric chloride and methanesulfonic-acid solutions. Hydrometallurgy 2019, 188, 140–156. [Google Scholar] [CrossRef]
- Lorenzo-Tallafigo, J.; Iglesias-Gonzalez, N.; Romero, R.; Mazuelos, A.; Carranza, F. Ferric leaching of the sphalerite contained in a bulk concentrate: Kinetic study. Miner. Eng. 2018, 125, 50–59. [Google Scholar] [CrossRef]
- Neil, C.W.; Jun, Y.-S. Fe 3+ addition promotes arsenopyrite dissolution and iron (III) (Hydr)oxide formation and phase transformation. Environ. Sci. Technol. Lett. 2016, 3, 30–35. [Google Scholar] [CrossRef]
- Perez, I.P.; Dutrizac, J.E. The effect of the iron content of sphalerite on its rate of dissolution in ferric sulphate and ferric chloride media. Hydrometallurgy 1991, 26, 211–232. [Google Scholar] [CrossRef]
- Dobrosz-Gómez, I.; Ramos García, B.D.; GilPavas, E.; Gómez García, M.Á. Kinetic study on HCN volatilization in gold leaching tailing ponds. Miner. Eng. 2017, 110, 185–194. [Google Scholar] [CrossRef]
- Innocenzi, V.; Ippolito, N.M.; De Michelis, I.; Medici, F.; Vegliò, F. A hydrometallurgical process for the recovery of terbium from fluorescent lamps: Experimental design, optimization of acid leaching process and process analysis. J. Environ. Manag. 2016, 184, 552–559. [Google Scholar] [CrossRef]
- Rogozhnikov, D.; Karimov, K.; Shoppert, A.; Dizer, O.; Naboichenko, S. Kinetics and mechanism of arsenopyrite leaching in nitric acid solutions in the presence of pyrite and Fe(III) ions. Hydrometallurgy 2021, 199, 105525. [Google Scholar] [CrossRef]


| Element/Mineral | S | Fe | Cu | As | Zn | Total |
|---|---|---|---|---|---|---|
| Cu12As4S13 | 26.8 | - | 51.7 | 21.5 | - | 100.0 |
| CuFeS2 | 36.8 | 29.8 | 33.2 | - | - | 100.0 |
| ZnS | 29.9 | - | - | - | 70.1 | 100.0 |
| FeS2 | 44.53 | 55.47 | - | - | - | 100.0 |
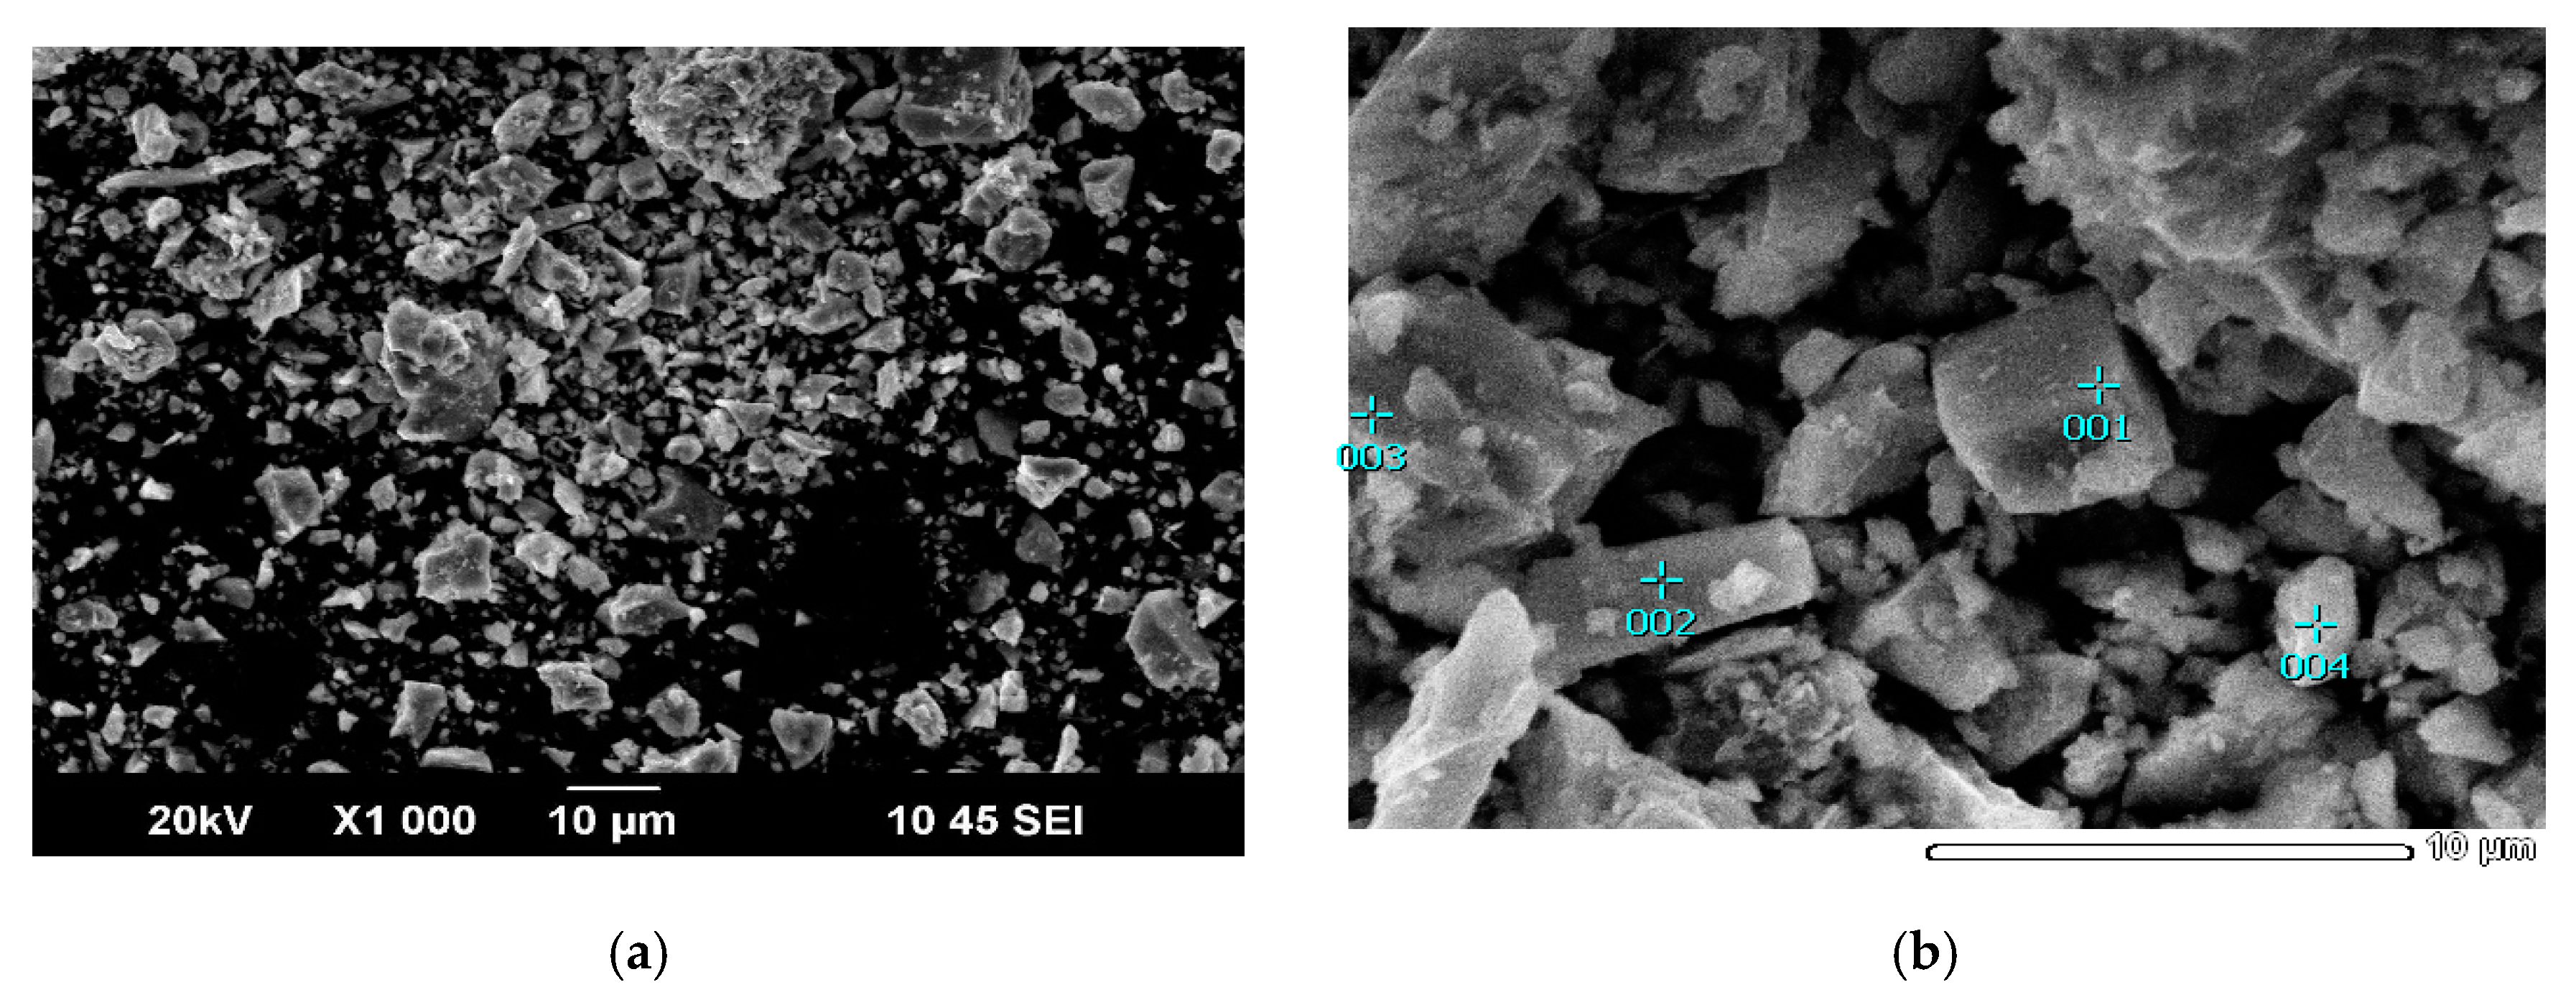
| Element | S | Fe | Cu | As | Total |
|---|---|---|---|---|---|
| Point 001 | 32.6 | 30.4 | 34.8 | 1.2 | 100.0 |
| Point 002 | 27.1 | 2.1 | 51.2 | 19.6 | 100.0 |
| Point 003 | 31.8 | 29.2 | 37.2 | 1.8 | 100.0 |
| Point 004 | 36.5 | 31.6 | 29.0 | 2.9 | 100.0 |
| Content, % | ||||||||
|---|---|---|---|---|---|---|---|---|
| S | Fe | Cu | Zn | As | Pb | Si | Al | Other |
| 39.4 | 27.9 | 18.0 | 4.8 | 2.9 | 2.1 | 0.8 | 0.5 | 3.6 |
| Content, % | ||||
|---|---|---|---|---|
| S | Fe | O2 | Si | Other |
| 25.8 | 23.9 | 23.8 | 16.4 | 10.1 |
| Source | Sum of Squares | Df | Mean Square | F-Ratio | p-Value |
|---|---|---|---|---|---|
| Cu12As4S13 | |||||
| A: Temperature | 1896.92 | 1 | 1896.92 | 8.61 | 0.021 |
| B: Acid concentration | 4238.39 | 1 | 4238.39 | 19.25 | 0.003 |
| C: Fe(III) | 2279.08 | 1 | 2279.08 | 10.35 | 0.014 |
| D: FeS2 | 5471.07 | 1 | 5471.07 | 24.84 | 0.001 |
| E: Time | 1506.64 | 1 | 1506.64 | 6.84 | 0.034 |
| CuFeS2 | |||||
| A: Temperature | 1617.19 | 1 | 1617.19 | 9.01 | 0.0199 |
| B: Acid concentration | 4099.75 | 1 | 4099.75 | 22.83 | 0.0020 |
| C: Fe(III) | 1945.73 | 1 | 1945.73 | 10.84 | 0.0133 |
| D: FeS2 | 6176.19 | 1 | 6176.19 | 34.39 | 0.0006 |
| E: Time | 1683.8 | 1 | 1683.8 | 9.38 | 0.0183 |
| ZnS | |||||
| A: Temperature | 568.548 | 1 | 568.548 | 5.31 | 0.5486 |
| B: Acid concentration | 3537.47 | 1 | 3537.47 | 33.04 | 0.0007 |
| C: Fe(III) | 2880.17 | 1 | 2880.17 | 26.90 | 0.0013 |
| D: FeS2 | 4405.57 | 1 | 4405.57 | 41.15 | 0.0004 |
| E: Time | 645.106 | 1 | 645.106 | 6.03 | 0.5938 |
Publisher’s Note: MDPI stays neutral with regard to jurisdictional claims in published maps and institutional affiliations. |
© 2022 by the authors. Licensee MDPI, Basel, Switzerland. This article is an open access article distributed under the terms and conditions of the Creative Commons Attribution (CC BY) license (https://creativecommons.org/licenses/by/4.0/).
Share and Cite
Dizer, O.; Rogozhnikov, D.; Karimov, K.; Kuzas, E.; Suntsov, A. Nitric Acid Dissolution of Tennantite, Chalcopyrite and Sphalerite in the Presence of Fe (III) Ions and FeS2. Materials 2022, 15, 1545. https://doi.org/10.3390/ma15041545
Dizer O, Rogozhnikov D, Karimov K, Kuzas E, Suntsov A. Nitric Acid Dissolution of Tennantite, Chalcopyrite and Sphalerite in the Presence of Fe (III) Ions and FeS2. Materials. 2022; 15(4):1545. https://doi.org/10.3390/ma15041545
Chicago/Turabian StyleDizer, Oleg, Denis Rogozhnikov, Kirill Karimov, Evgeniy Kuzas, and Alexey Suntsov. 2022. "Nitric Acid Dissolution of Tennantite, Chalcopyrite and Sphalerite in the Presence of Fe (III) Ions and FeS2" Materials 15, no. 4: 1545. https://doi.org/10.3390/ma15041545
APA StyleDizer, O., Rogozhnikov, D., Karimov, K., Kuzas, E., & Suntsov, A. (2022). Nitric Acid Dissolution of Tennantite, Chalcopyrite and Sphalerite in the Presence of Fe (III) Ions and FeS2. Materials, 15(4), 1545. https://doi.org/10.3390/ma15041545