
Moisture-Dependent Physical-Mechanical Properties of Maize, Rice, and Soybeans as Related to Handling and Processing


Abstract
1. Introduction
2. Materials and Methods
2.1. Sample Preparation
2.2. Moisture Content Measurement
2.3. Bulk Density Characterization
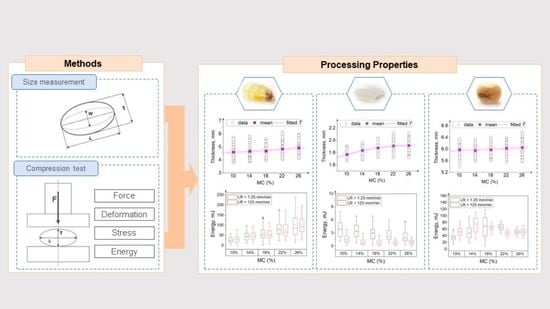
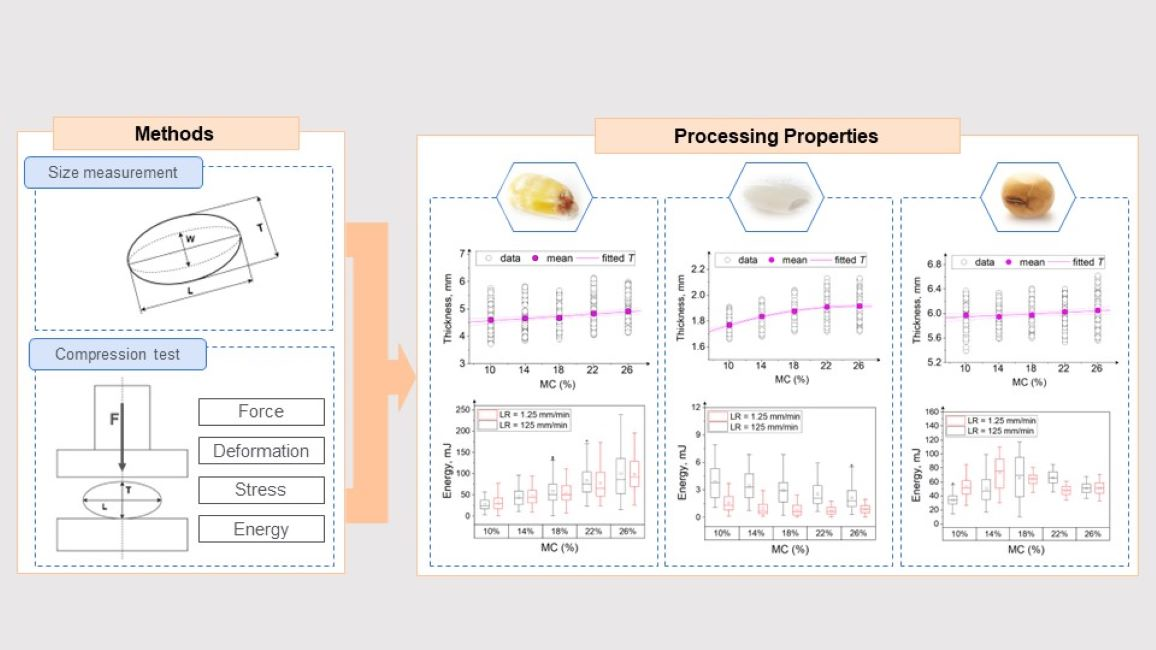
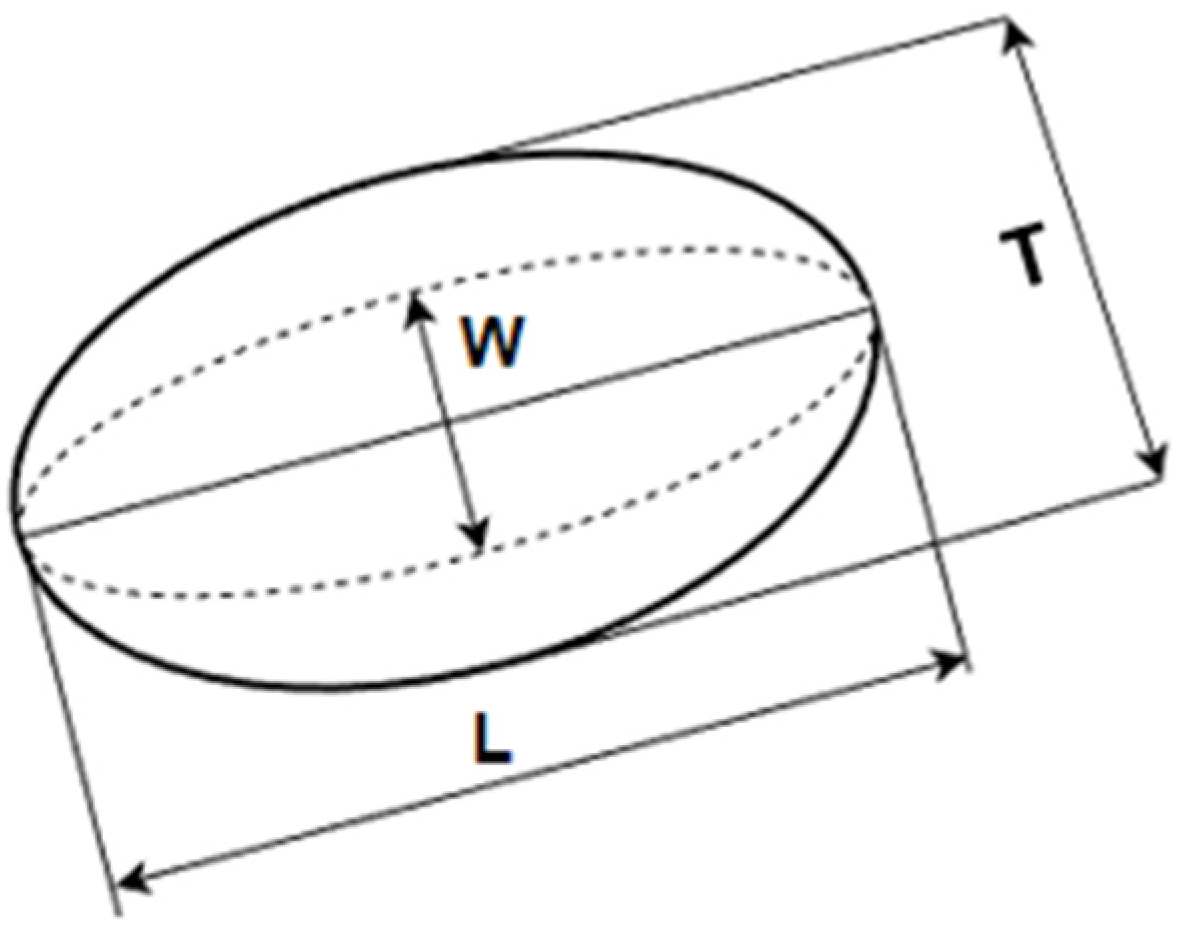
2.4. Size Measurement
2.5. Shape Determination
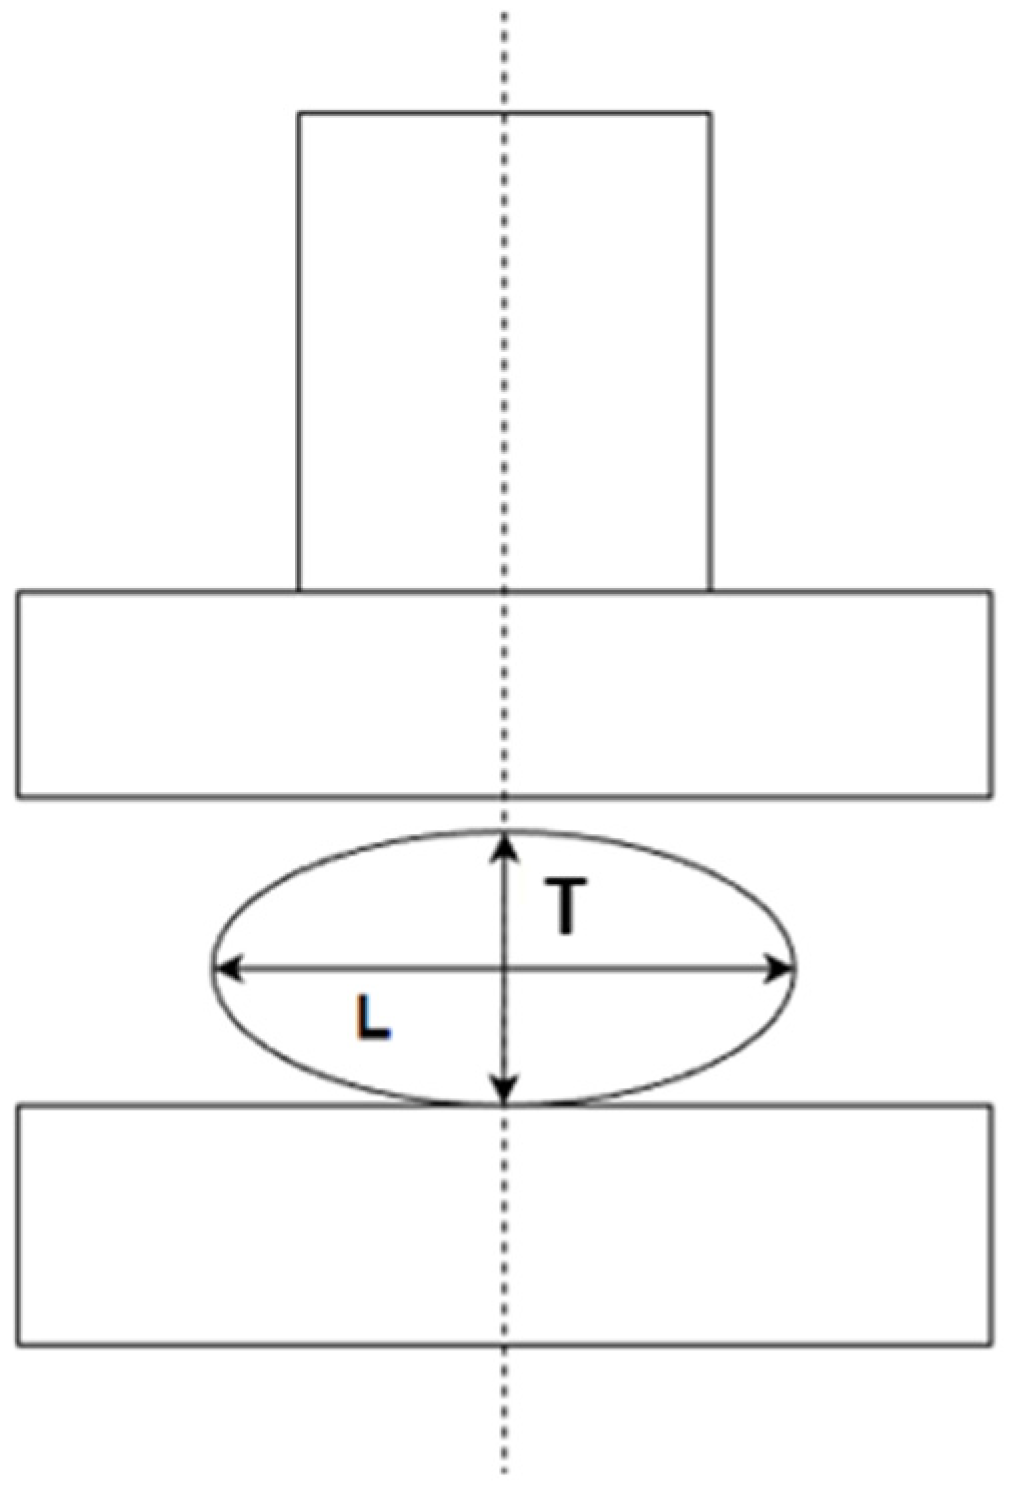
2.6. Compression Test
2.7. Statistical Analysis
3. Results and Discussion
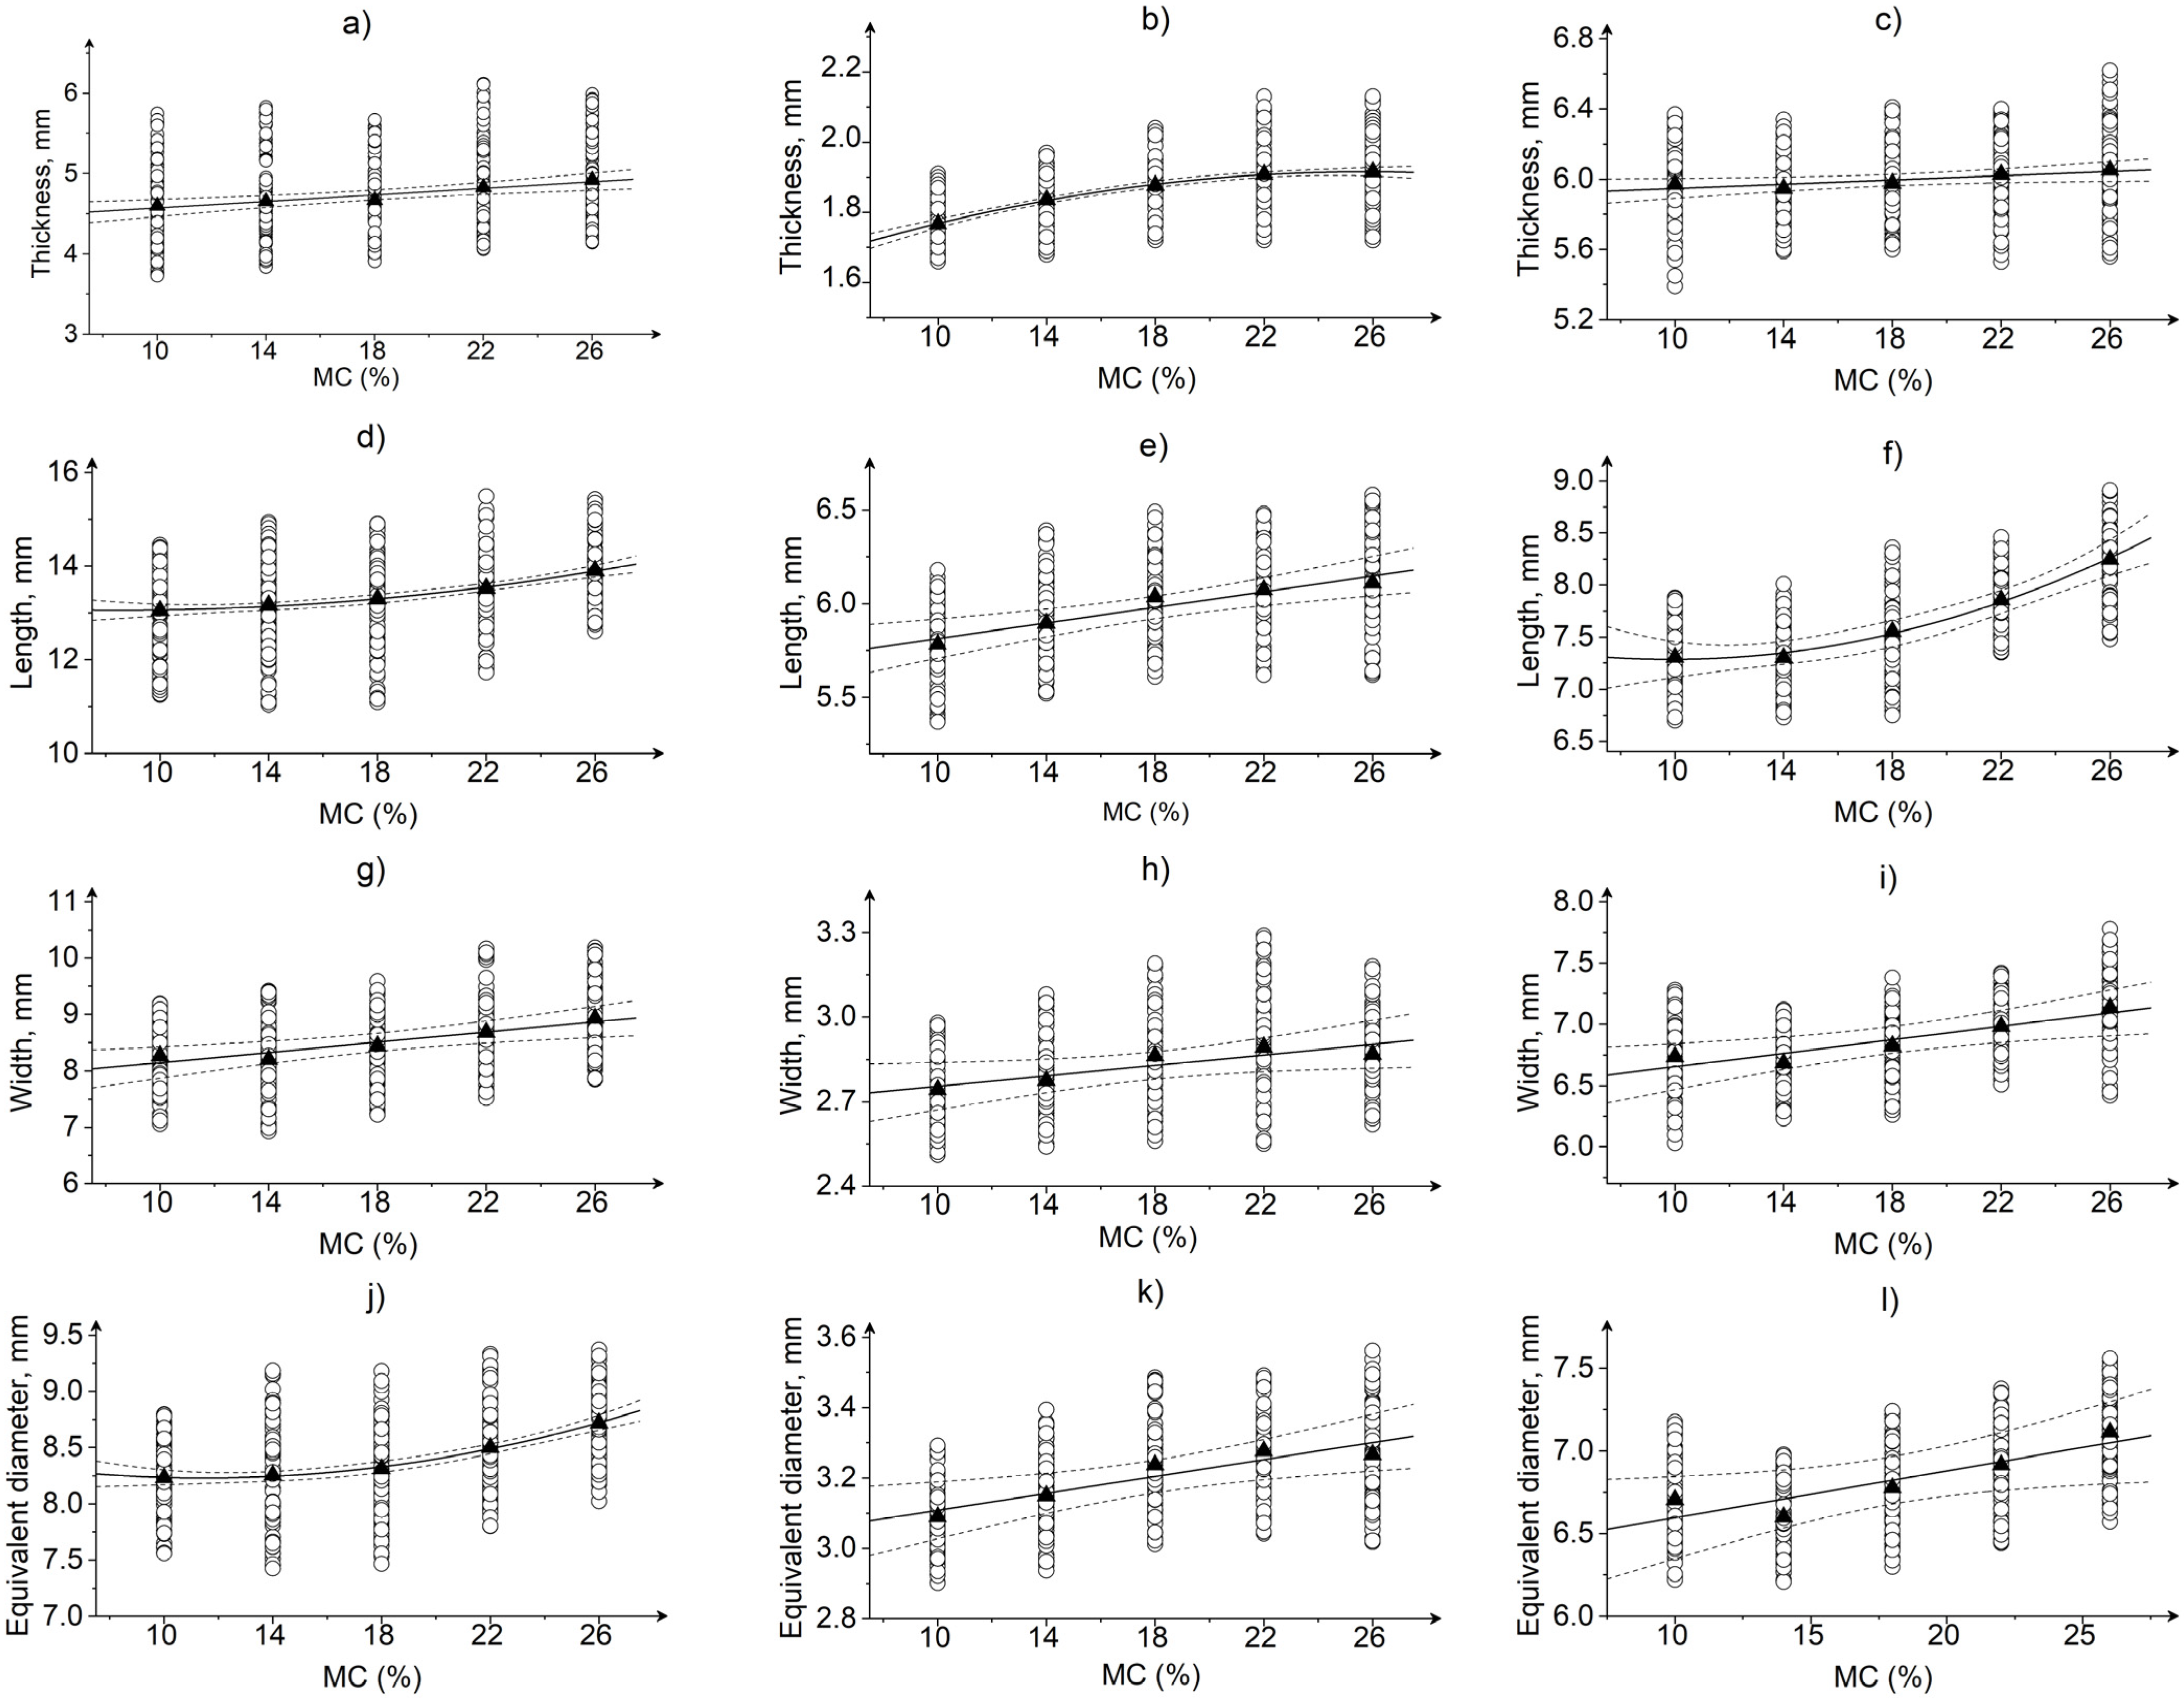
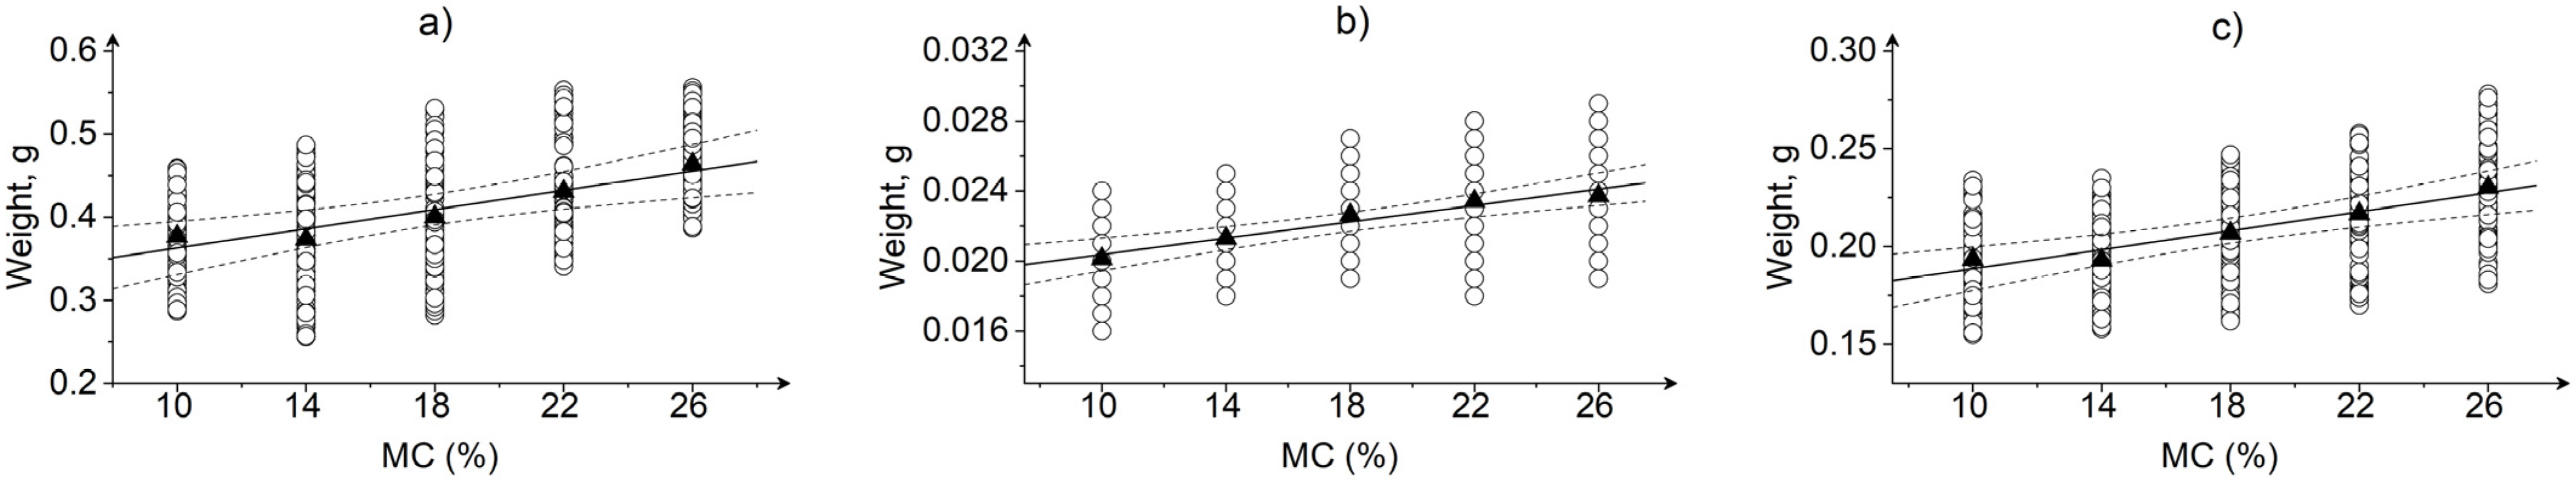
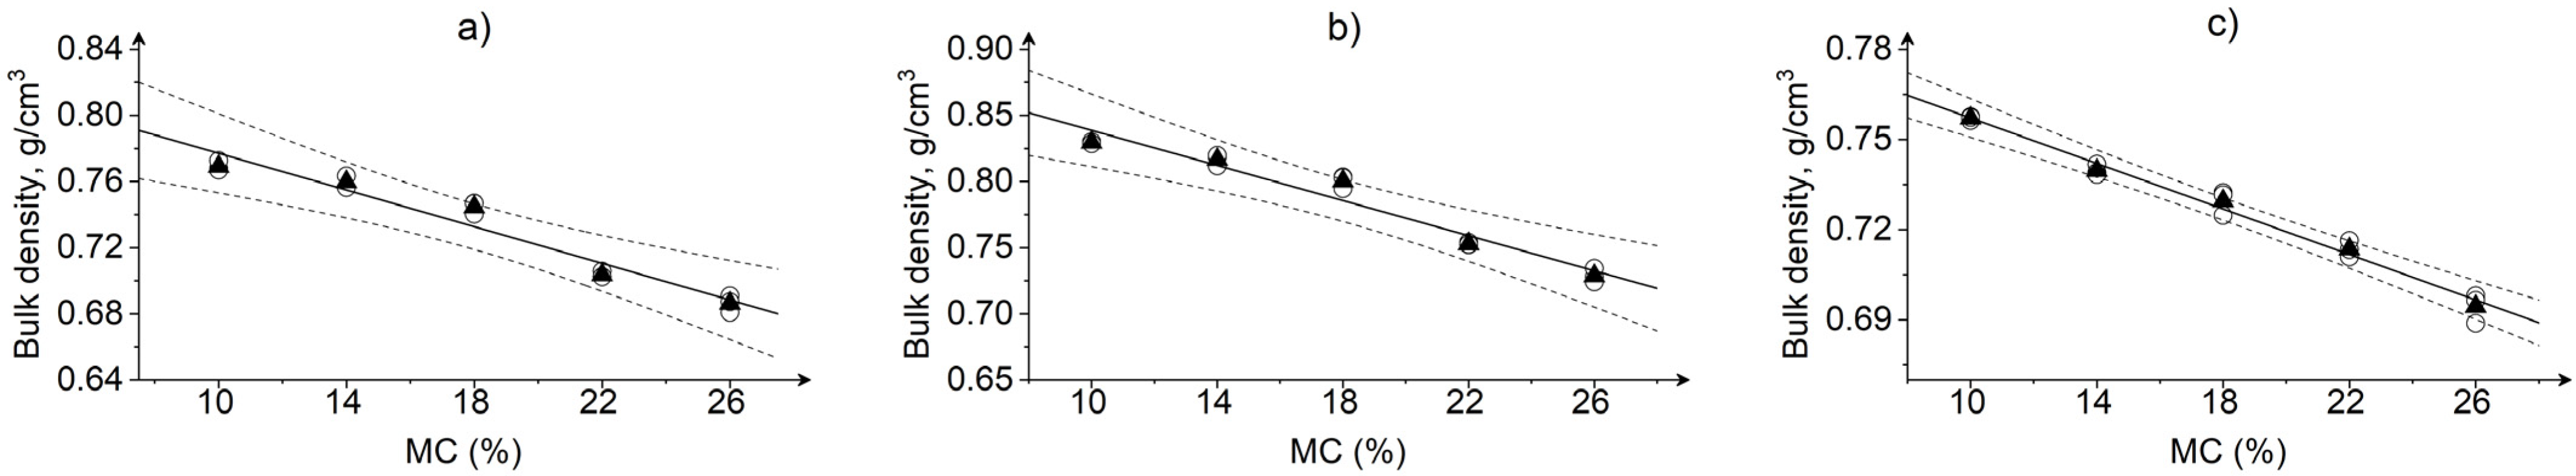
3.1. Effect of Moisture Content on the Size of Grain Kernel
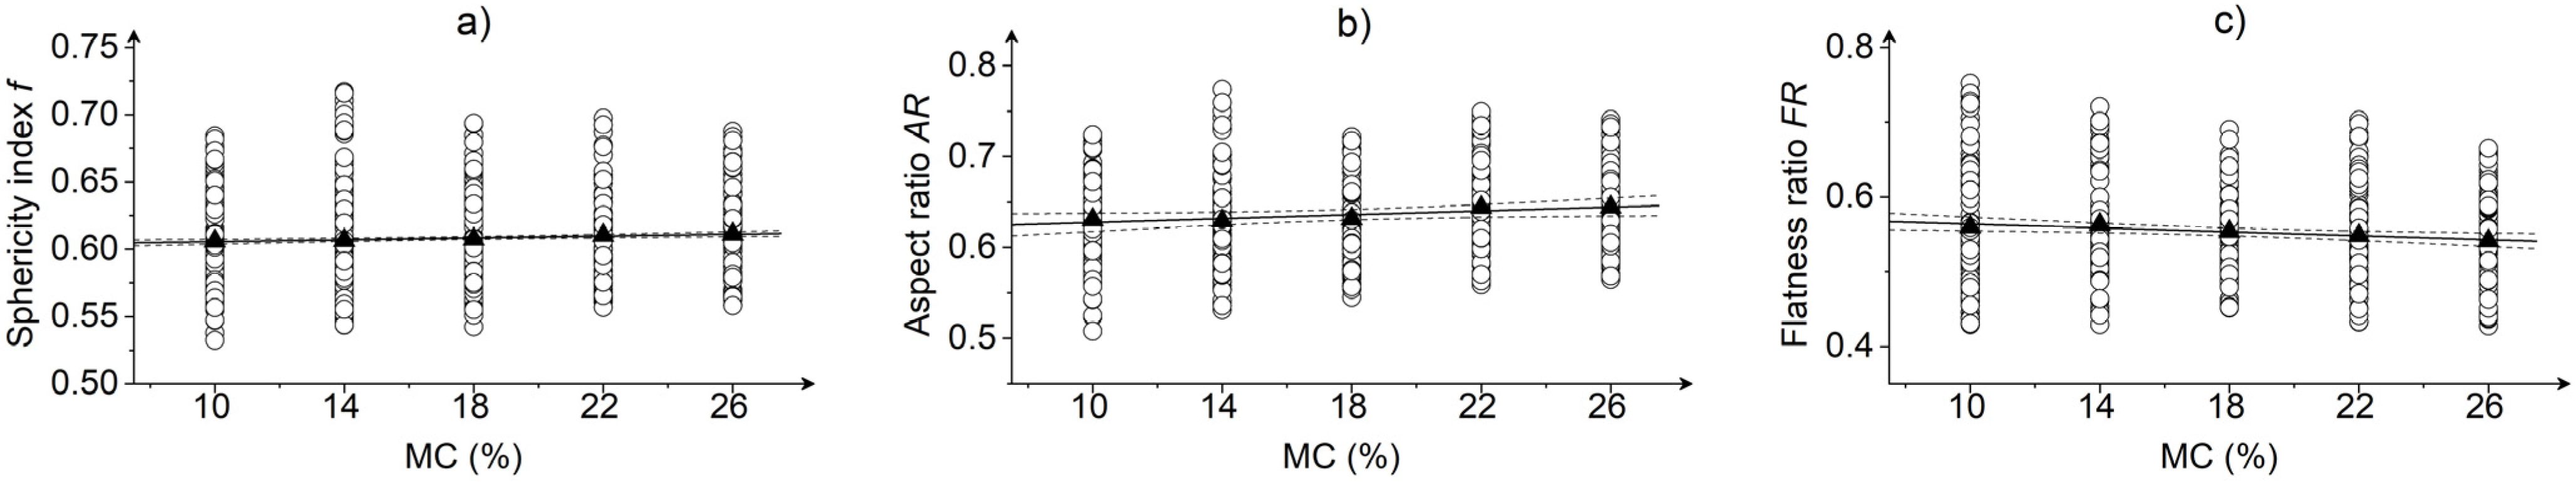
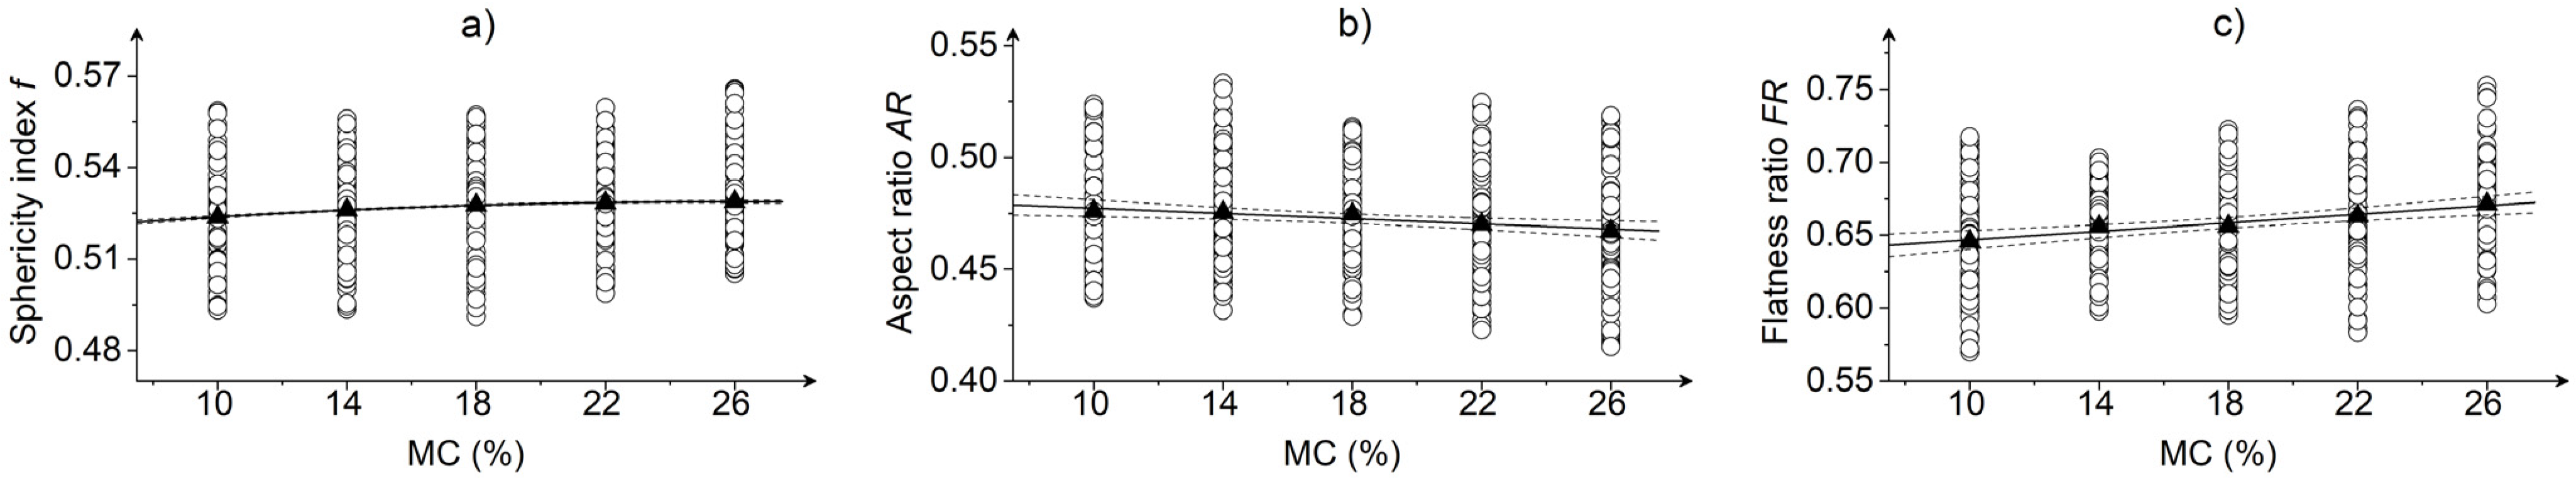
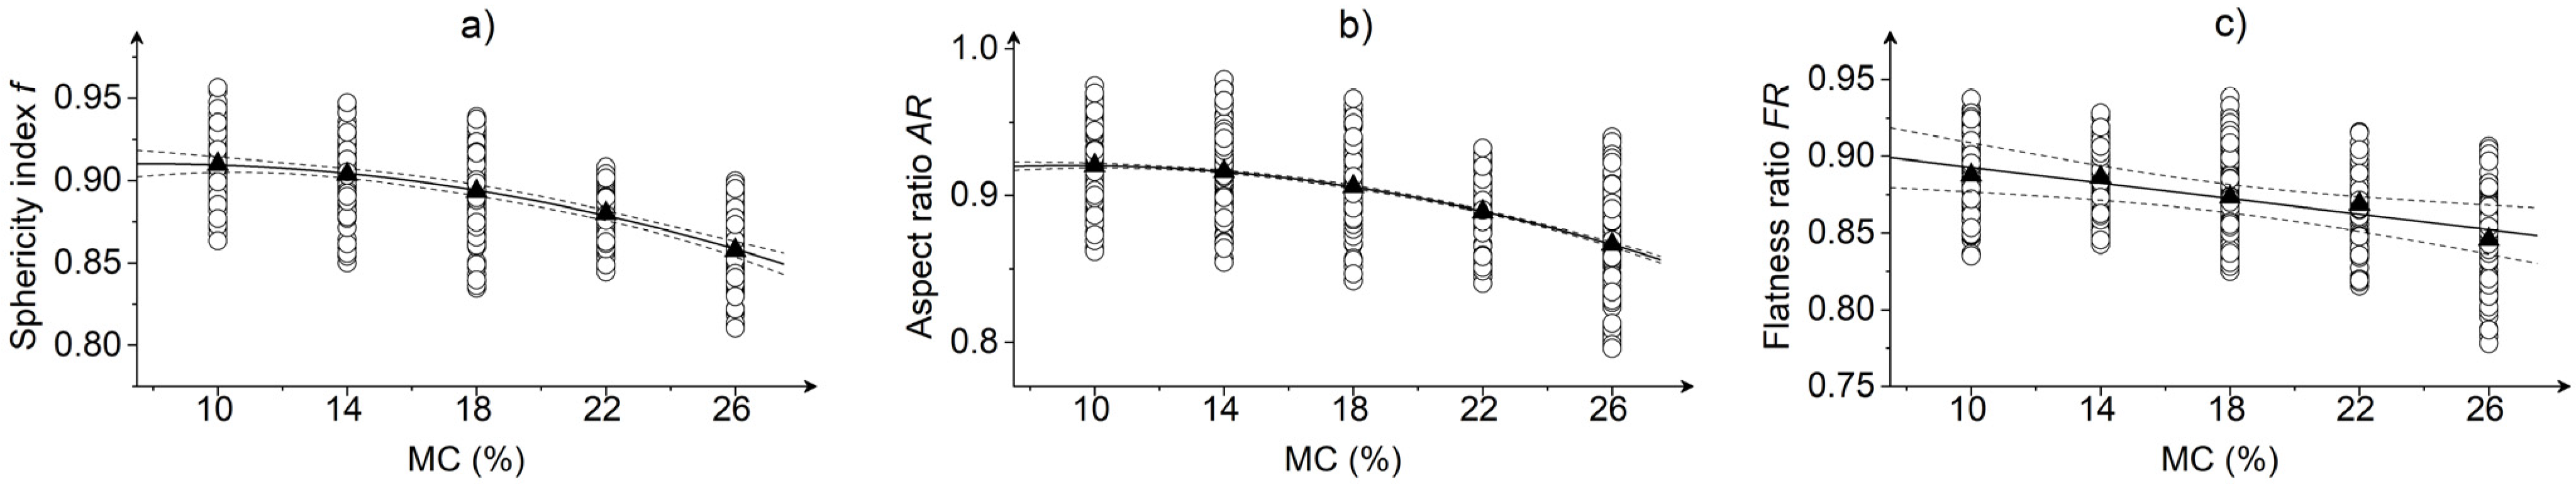
3.2. Effect of Moisture Content on the Shape of Grain Kernels
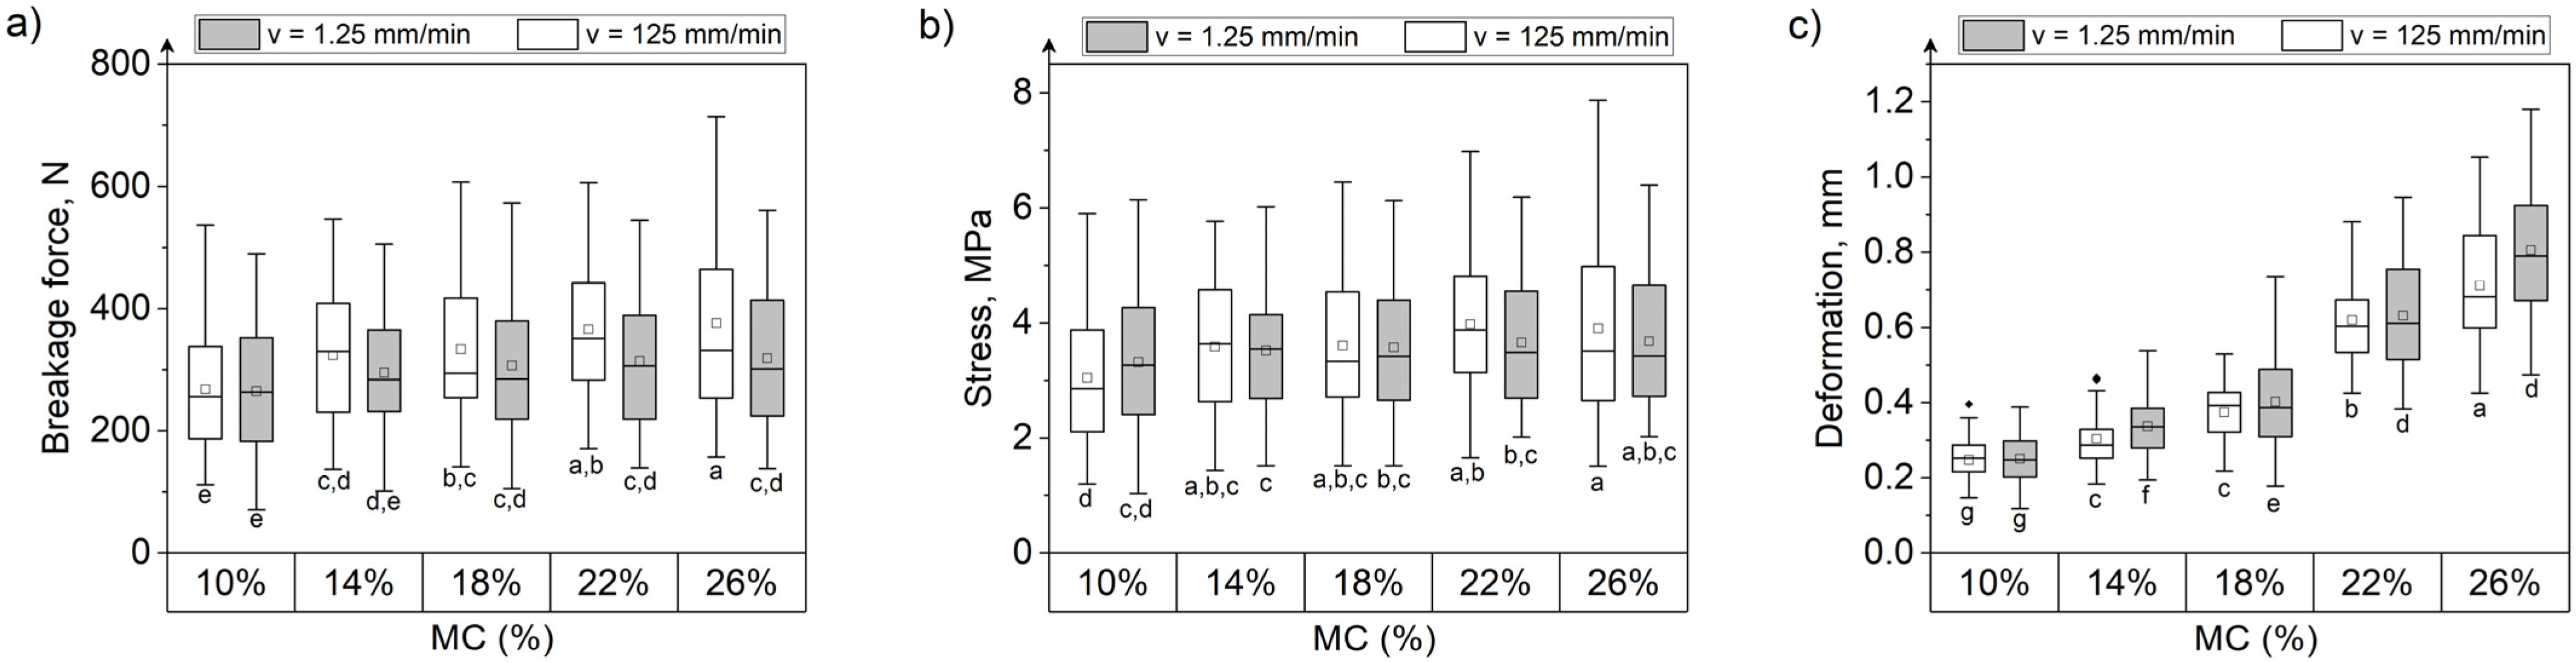
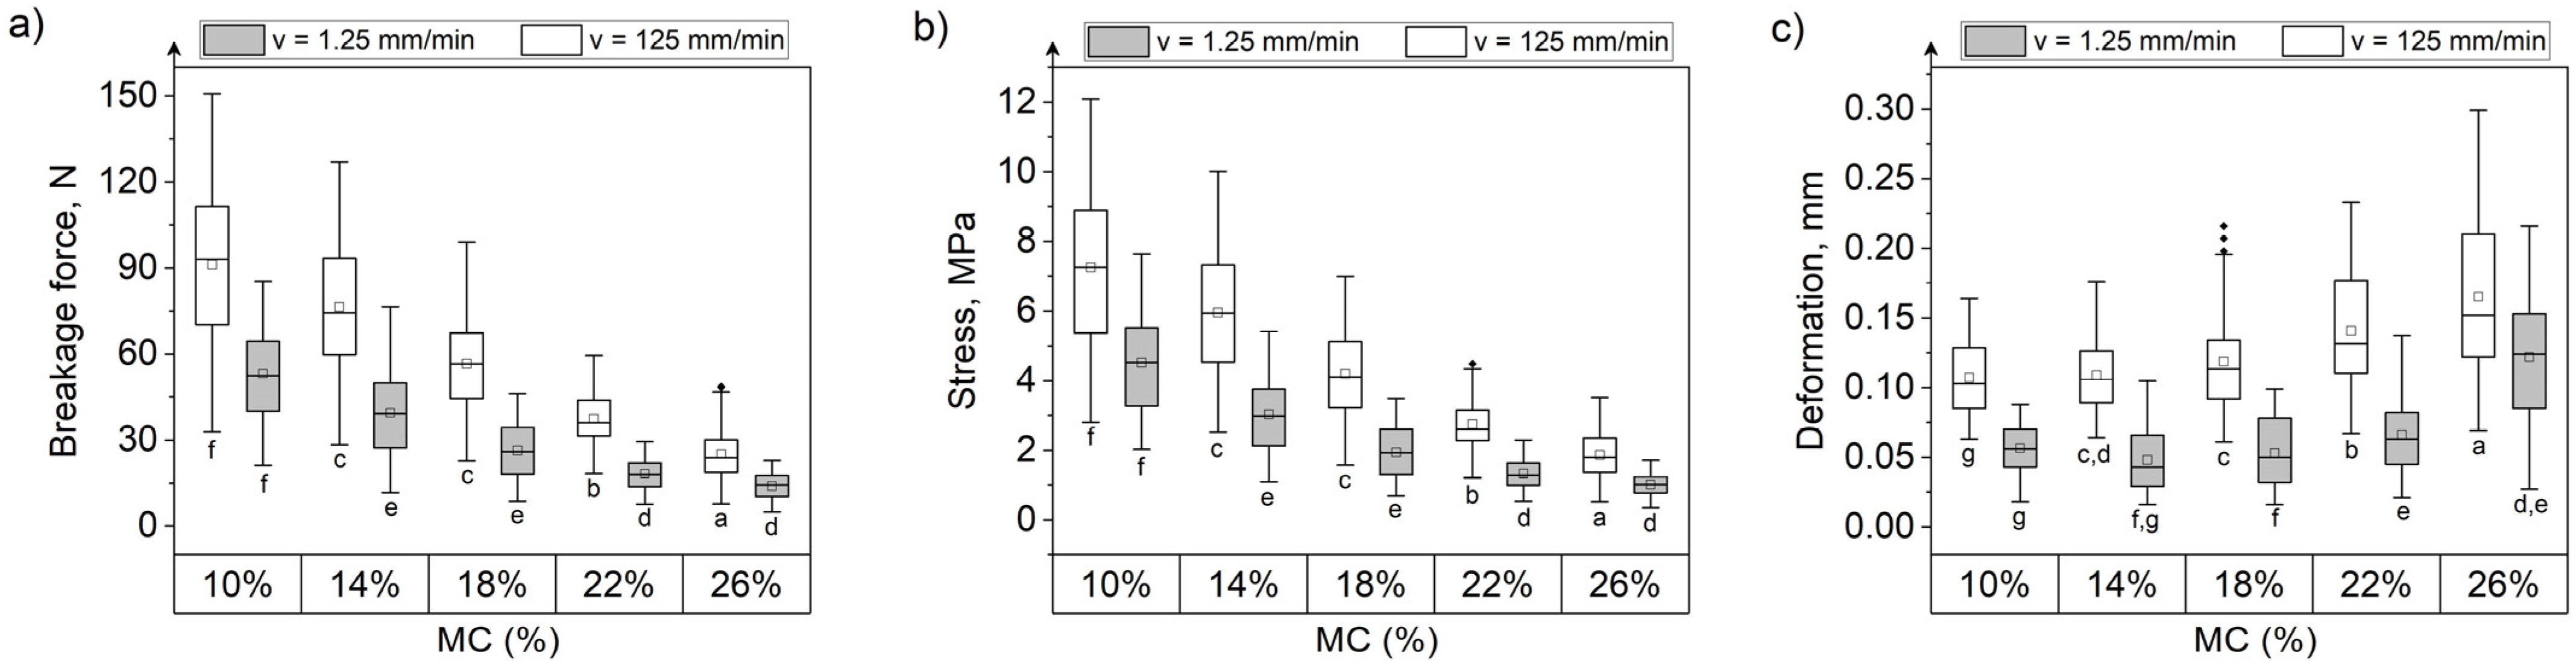
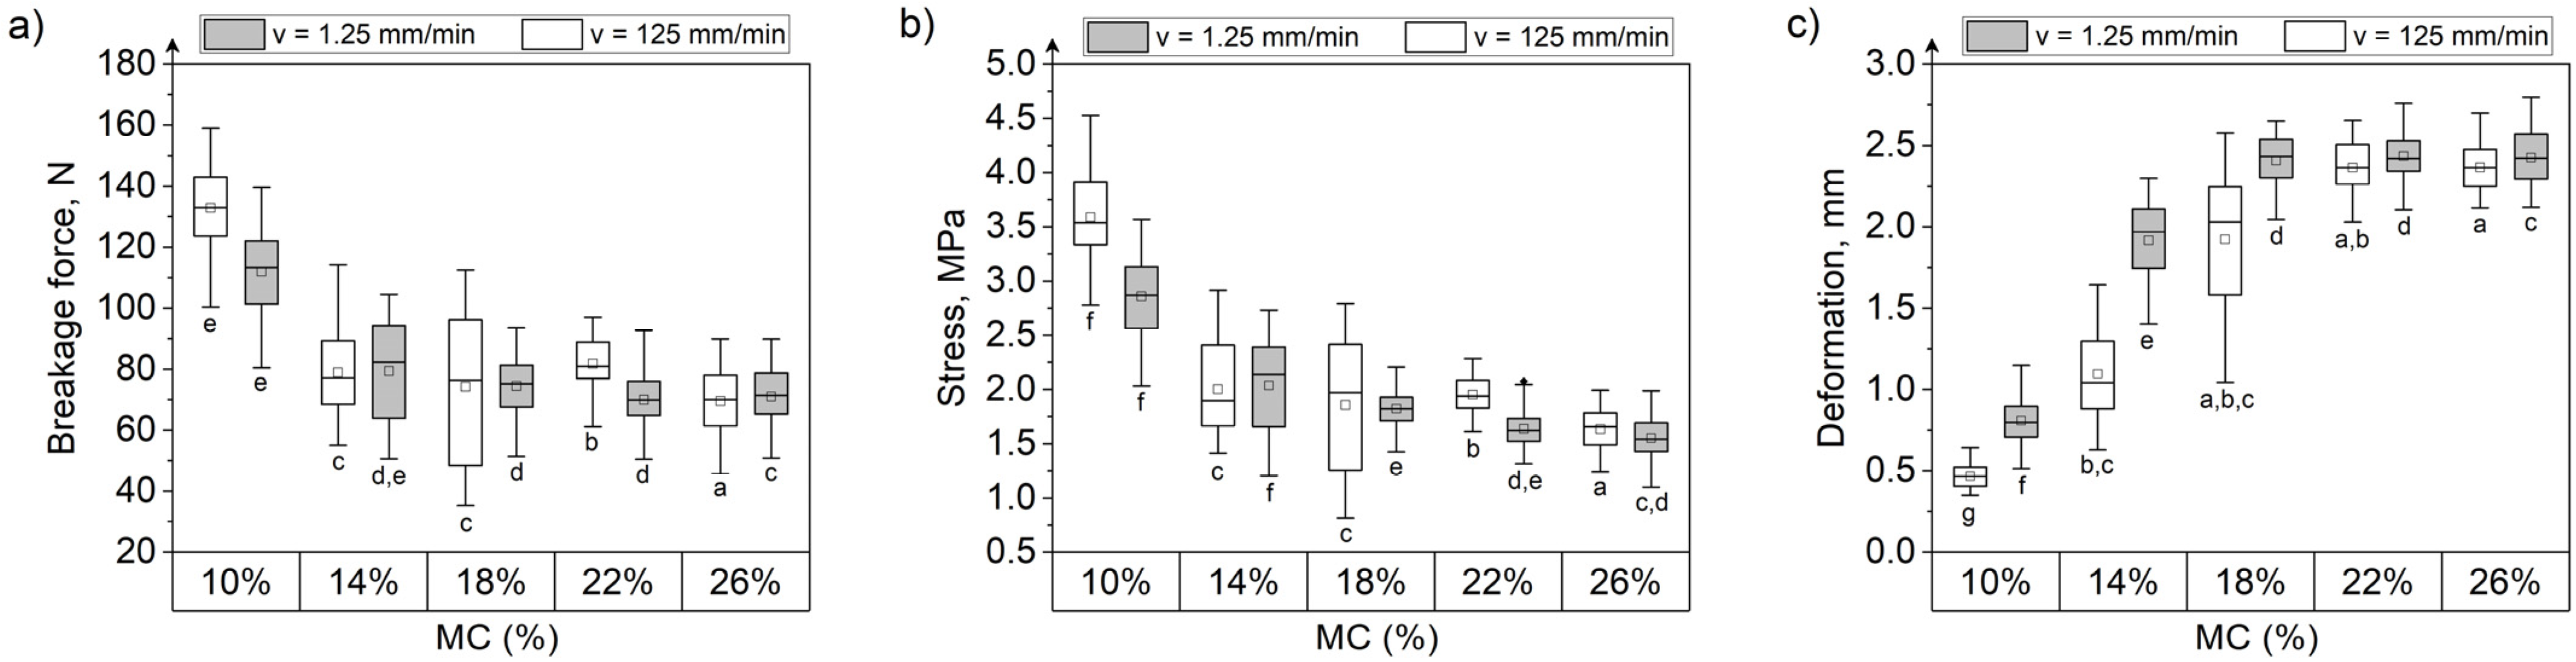
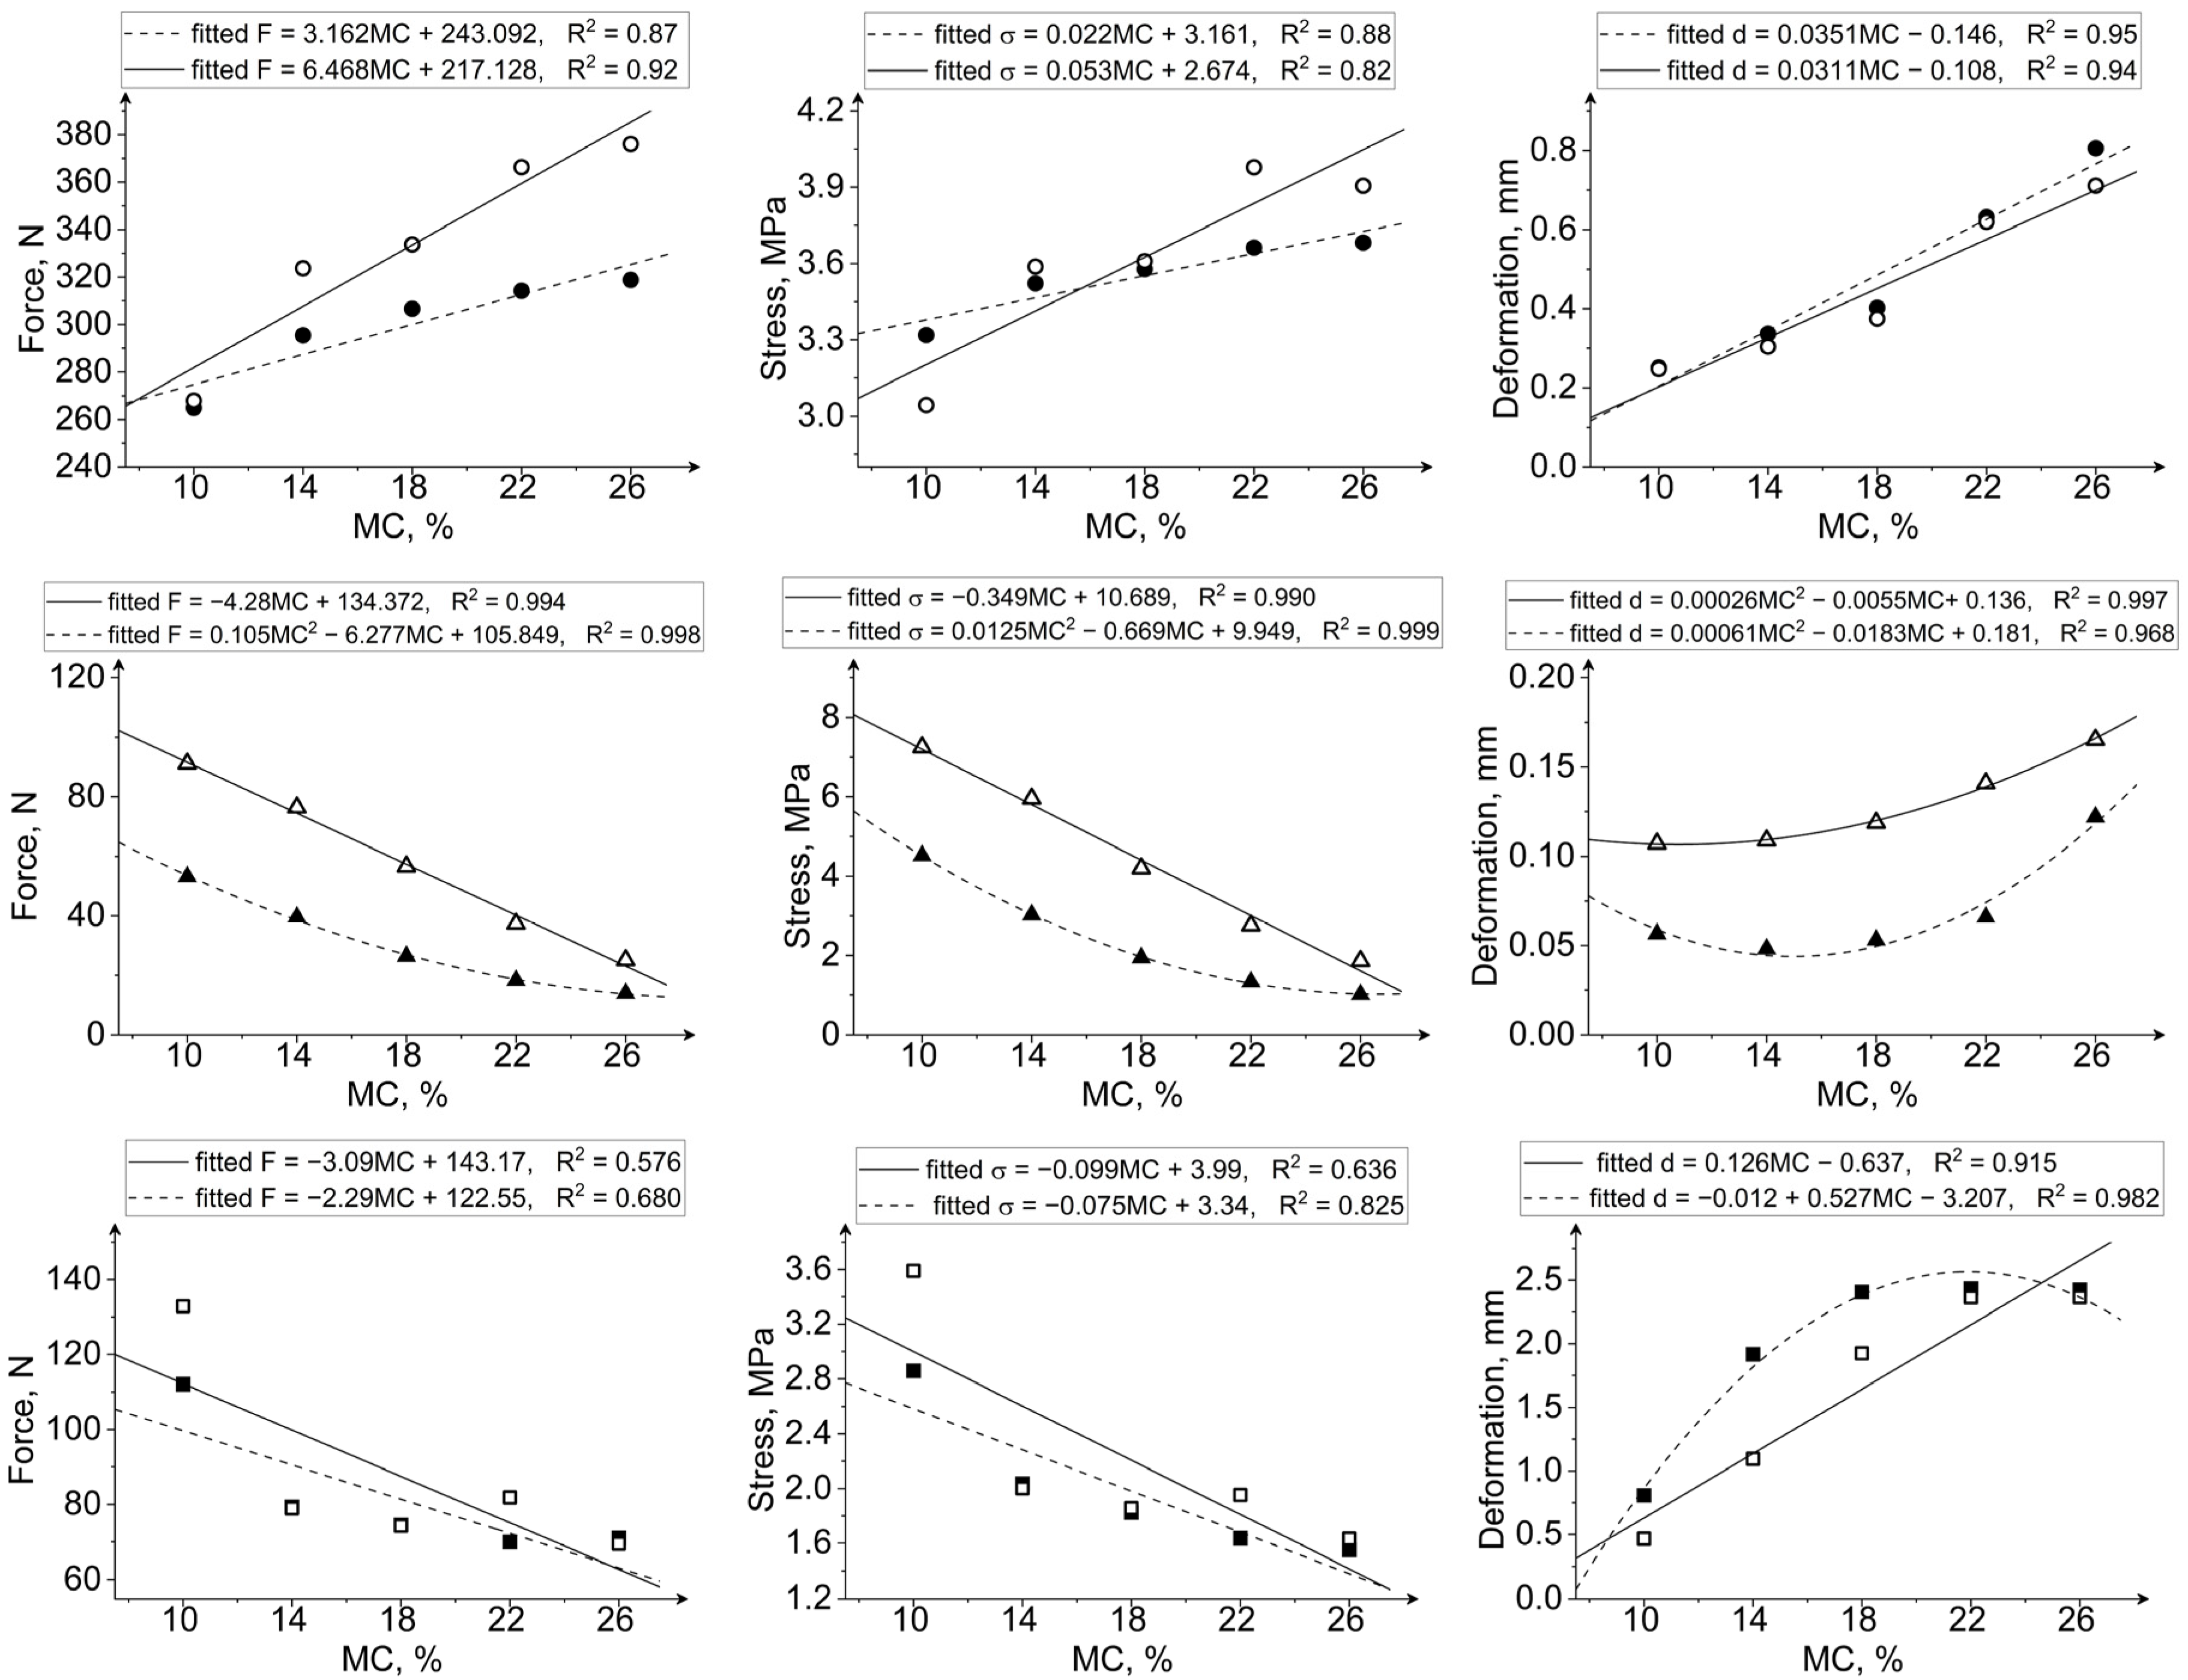
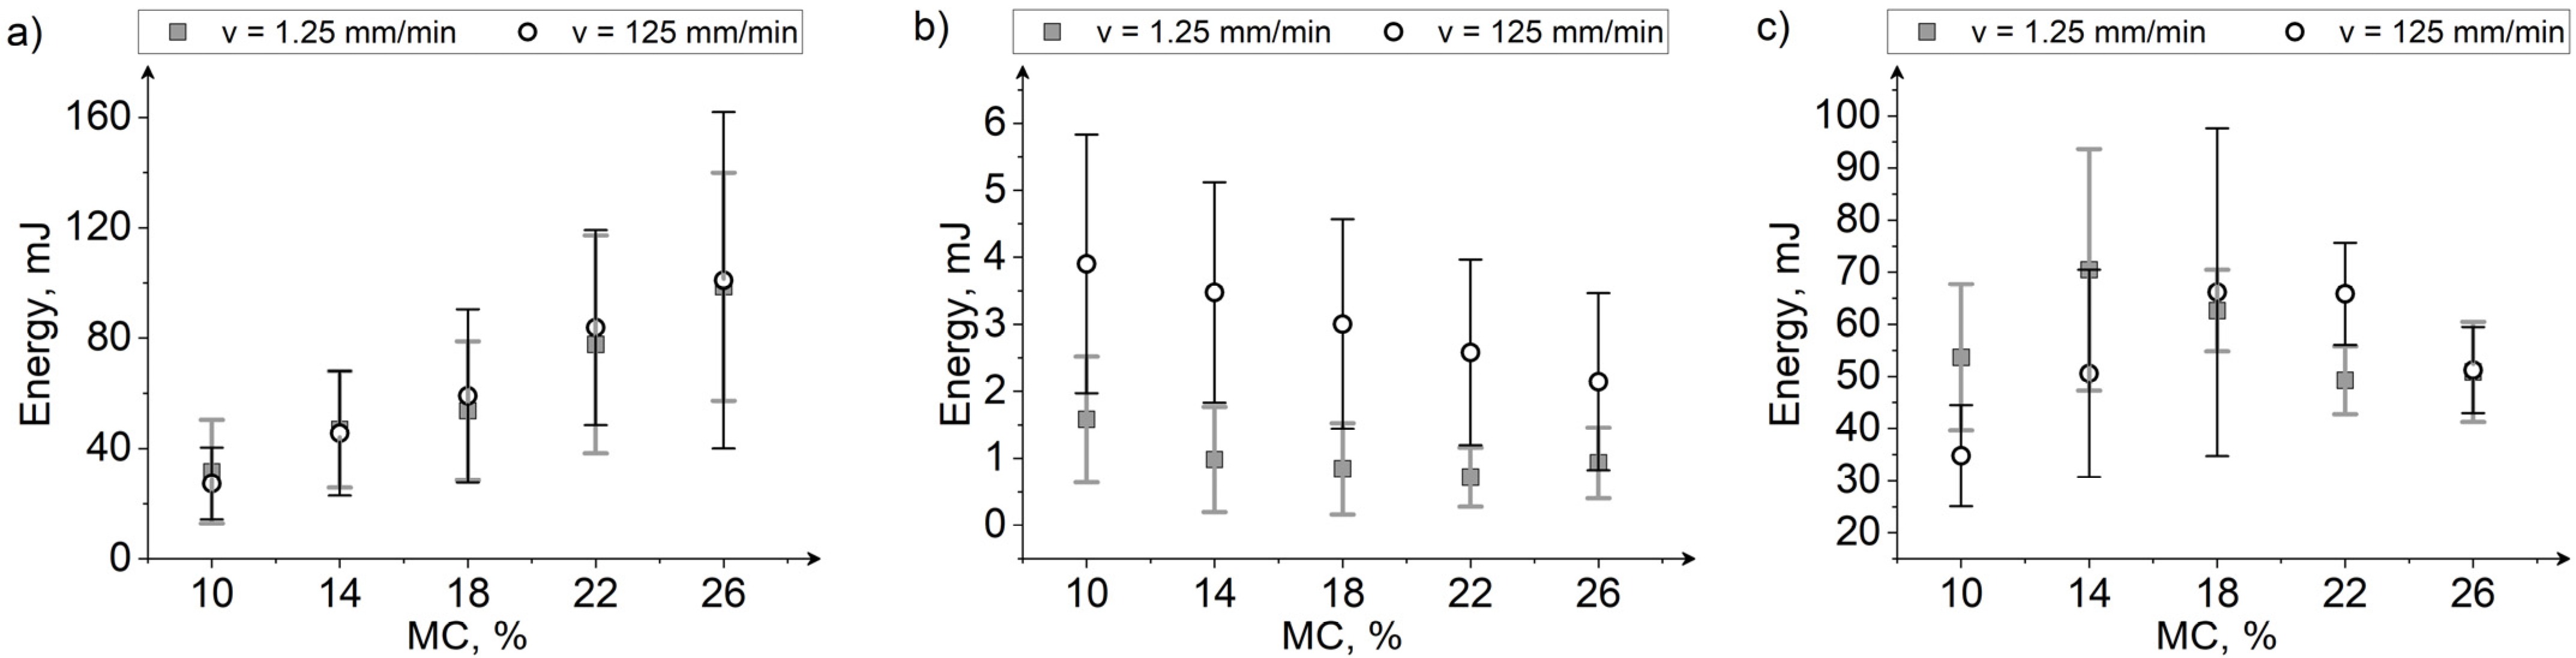
3.3. Effect of Moisture Content and Loading Rate on the Mechanical Behavior of Grain Kernels during Compression
3.4. Consequences of Variable Grain Moisture Content on the Grain Processing and Machine Design
4. Conclusions
Author Contributions
Funding
Institutional Review Board Statement
Informed Consent Statement
Data Availability Statement
Acknowledgments
Conflicts of Interest
References
- Jan, K.; Panesar, P.; Singh, S. Effect of Moisture Content on the Physical and Mechanical Properties of Quinoa Seeds. Int. Agrophysics 2019, 33, 41–48. [Google Scholar] [CrossRef] [PubMed]
- Mannheim, V. Empirical and Scale-up Modeling in Stirred Ball Mills. Chem. Eng. Res. Des. 2011, 89, 405–409. [Google Scholar] [CrossRef]
- Tomporowski, A. Stream of Efficiency of Rice Grains Multi-Disc Grinding. Eksploat. Niezawodn. Maint. Reliab. 2012, 14, 150–153. [Google Scholar]
- Kosturkiewicz, B.; Janewicz, A.; Hryniewicz, M.; Gara, P.; Bembenek, M.; Kosturkiewicz, Ł. Compacting of Gypsum from Flue Gas Desulphurisation Plants in Roll Presses. Przem. Chem. 2016, 1, 70–73. [Google Scholar] [CrossRef]
- Horabik, J.; Rusinek, R. Pressure Ratio of Cereal Grains Determined in a Uniaxial Compression Test. Int. Agrophysics 2002, 16, 23–28. [Google Scholar]
- Schulze, D. Powders and Bulk Solids; Springer: Berlin/Heidelberg, Germany, 2008; ISBN 978-3-540-73767-4. [Google Scholar]
- Davydov, S.Y.; Valiev, N.G.; Tauger, V.M. Effect of the Flow of Transported Bulk Material on Design Features of a Belt Conveyor. Refract. Ind. Ceram. 2019, 60, 10–13. [Google Scholar] [CrossRef]
- Barletta, D.; Berry, R.J.; Larsson, S.H.; Lestander, T.A.; Poletto, M.; Ramírez-Gómez, Á. Assessment on Bulk Solids Best Practice Techniques for Flow Characterization and Storage/Handling Equipment Design for Biomass Materials of Different Classes. Fuel Process. Technol. 2015, 138, 540–554. [Google Scholar] [CrossRef]
- Hlosta, J.; Jezerská, L.; Rozbroj, J.; Žurovec, D.; Nečas, J.; Zegzulka, J. DEM Investigation of the Influence of Particulate Properties and Operating Conditions on the Mixing Process in Rotary Drums: Part 1—Determination of the DEM Parameters and Calibration Process. Processes 2020, 8, 222. [Google Scholar] [CrossRef]
- Bembenek, M.; Buczak, M.; Baiul, K. Modelling of the Fine-Grained Materials Briquetting Process in a Roller Press with the Discrete Element Method. Materials 2022, 15, 4901. [Google Scholar] [CrossRef]
- Gierz, Ł.; Kolankowska, E.; Markowski, P.; Koszela, K. Measurements and Analysis of the Physical Properties of Cereal Seeds Depending on Their Moisture Content to Improve the Accuracy of DEM Simulation. Appl. Sci. 2022, 12, 549. [Google Scholar] [CrossRef]
- Qiao, M.; Xia, G.; Cui, T.; Xu, Y.; Gao, X.; Su, Y.; Li, Y.; Fan, H. Effect of Moisture, Protein, Starch, Soluble Sugar Contents and Microstructure on Mechanical Properties of Maize Kernels. Food Chem. 2022, 379, 132147. [Google Scholar] [CrossRef]
- Perez-Garcia, O.A.; Carreira, X.C.; Carral, E.; Fernandez, M.E.; Mariño, R.A. Evaluation of Traditional Grain Store Buildings (Hórreos) in Galicia (NW Spain): Analysis of Outdoor/Indoor Temperature and Humidity Relationships. Span. J. Agric. Res. 2010, 8, 925–935. [Google Scholar] [CrossRef]
- Makky, M.; Santosa; Putri, R.E.; Nakano, K. Determination of Moisture Content in Rice Using Non-Destructive Short-Wave near Infrared Spectroscopy; AIP Publishing: Bali, Indonesia, 2019; p. 020014. [Google Scholar]
- Müller, A.; Nunes, M.T.; Maldaner, V.; Coradi, P.C.; de Moraes, R.S.; Martens, S.; Leal, A.F.; Pereira, V.F.; Marin, C.K. Rice Drying, Storage and Processing: Effects of Post-Harvest Operations on Grain Quality. Rice Sci. 2022, 29, 16–30. [Google Scholar] [CrossRef]
- Chandravarnan, P.; Agyei, D.; Ali, A. Green and Sustainable Technologies for the Decontamination of Fungi and Mycotoxins in Rice: A Review. Trends Food Sci. Technol. 2022, 124, 278–295. [Google Scholar] [CrossRef]
- Grain Production Worldwide by Type 2021/22. Available online: https://www.statista.com/statistics/263977/world-grain-production-by-type/ (accessed on 14 June 2022).
- United States Department of Agriculture. World Agricultural Production; Circular Series WAP 11-22; United States Department of Agriculture: Washington, DC, USA, 2022. [Google Scholar]
- Kruszelnicka, W. Study of Selected Physical-Mechanical Properties of Corn Grains Important from the Point of View of Mechanical Processing Systems Designing. Materials 2021, 14, 1467. [Google Scholar] [CrossRef]
- Angelovič, M.; Krištof, K.; Jobbágy, J.; Findura, P.; Križan, M. The Effect of Conditions and Storage Time on Course of Moisture and Temperature of Maize Grains. BIO Web Conf. 2018, 10, 02001. [Google Scholar] [CrossRef]
- AL-Aaty, Y.H.S.; Al-Jomaily, A.R.A. Effect of Variety and Humidity on the Loss of Maize Crop after Shelling in Shelling and Drying Factories of Maize (Zea Mays) in Iraq. IOP Conf. Ser. Earth Environ. Sci. 2021, 735, 012029. [Google Scholar] [CrossRef]
- Cao, W.; Nishiyama, Y.; Koide, S. Physicochemical, Mechanical and Thermal Properties of Brown Rice Grain with Various Moisture Contents. Int. J. Food Sci. Technol. 2004, 39, 899–906. [Google Scholar] [CrossRef]
- Babic, L.J.; Radojcin, M.; Pavkov, I.; Babic, M.; Turan, J.; Zoranovic, M.; Stanisic, S. Physical Properties and Compression Loading Behaviour of Corn Seed. Int. Agrophysics 2013, 27, 119–126. [Google Scholar] [CrossRef]
- Tavakoli, H.; Rajabipour, A.; Mohtasebi, S.S. Moisture-Dependent Some Engineering Properties of Soybean Grains. Agric. Eng. Int. CIGR J. 2009, 11, 1110. [Google Scholar]
- Corrêa, P.C.; da Silva, F.S.; Jaren, C.; Afonso, P.C.; Arana, I. Physical and Mechanical Properties in Rice Processing. J. Food Eng. 2007, 79, 137–142. [Google Scholar] [CrossRef]
- Mabasso, G.A.; Siqueira, V.C.; Quequeto, W.D.; Resende, O.; Goneli, A.L.D. Compressive Strength of Corn Kernels Subjected to Drying under Different Rest Periods. Rev. Ciênc. Agronômica 2020, 51, 1–8. [Google Scholar] [CrossRef]
- Wang, B.; Wang, J. Mechanical Properties of Maize Kernel Horny Endosperm, Floury Endosperm and Germ. Int. J. Food Prop. 2019, 22, 863–877. [Google Scholar] [CrossRef]
- Tavakoli, H.; Mohtasebi, S.S.; Rajabipour, A.; Tavakoli, M. Effects of Moisture Content, Loading Rate, and Grain Orientation on Fracture Resistance of Barley Grain. Res. Agric. Eng. 2009, 55, 85–93. [Google Scholar] [CrossRef]
- Saiedirad, M.H.; Tabatabaeefar, A.; Borghei, A.; Mirsalehi, M.; Badii, F.; Varnamkhasti, M.G. Effects of Moisture Content, Seed Size, Loading Rate and Seed Orientation on Force and Energy Required for Fracturing Cumin Seed (Cuminum Cyminum Linn.) under Quasi-Static Loading. J. Food Eng. 2008, 86, 565–572. [Google Scholar] [CrossRef]
- Zareiforoush, H.; Komarizadeh, M.H.; Alizadeh, M.R.; Tavakoli, H.; Masoumi, M. Effects of Moisture Content, Loading Rate, and Grain Orientation on Fracture Resistance of Paddy (Oryza Sativa L.) Grain. Int. J. Food Prop. 2012, 15, 89–98. [Google Scholar] [CrossRef]
- Ardebili, M.S.; Najafi, G.; Ghobadian, B.; Hashjin, T.T. Determination of Some Mechanical Properties of Castor Seed (Ricinus Communis L.) to Design and Fabricate an Oil Extraction Machine. J. Agric. Sci. Technol. 2012, 14, 1219–1227. [Google Scholar]
- Probst, K.V.; Ambrose, R.P.K.; Pinto, R.L.; Bali, R.; Krishnakumar, P.; Ileleji, K.E. The Effect of Moisture Content on the Grinding Performance of Corn and Corncobs by Hammermilling. Trans. ASABE 2013, 56, 1025–1033. [Google Scholar]
- American Society of Agricultural and Biological Engineers. ASAE S352.2 R2017 Moisture Measurement—Unground Grain and Seeds; American Society of Agricultural and Biological Engineers: St. Joseph, MI, USA, 2017. [Google Scholar]
- IRRI Rice Knowledge Bank Measuring Rice Moisture Content—IRRI Rice Knowledge Bank. Available online: http://www.knowledgebank.irri.org/training/fact-sheets/postharvest-management/rice-quality-fact-sheet-category/item/measuring-rice-moisture-content-fact-sheet (accessed on 30 July 2022).
- Guo, D. Kernel and Bulk Density Changes Due to Moisture Content, Mechanical Damage, and Insect Damage. Open Access Theses 2015, 512, 100. [Google Scholar]
- Han, Y.; Zhao, D.; Chu, Y.; Zhen, J.; Li, G.; Zhao, H.; Jia, F. Breakage Behaviour of Single Rice Particles under Compression and Impact. Adv. Powder Technol. 2021, 32, 4635–4650. [Google Scholar] [CrossRef]
- Chen, Z.; Wassgren, C.; Ambrose, R.P.K. Measured Damage Resistance of Corn and Wheat Kernels to Compression, Friction, and Repeated Impacts. Powder Technol. 2021, 380, 638–648. [Google Scholar] [CrossRef]
- Kruszelnicka, W.; Marczuk, A.; Kasner, R.; Bałdowska-Witos, P.; Piotrowska, K.; Flizikowski, J.; Tomporowski, A. Mechanical and Processing Properties of Rice Grains. Sustainability 2020, 12, 552. [Google Scholar] [CrossRef]
- Ituen, E.U.U.; Mittal, J.P.; Adeoti, J.S. Water Absorption in Cereal Grains and Its Effect on Their Rupture Stress. J. Food Process. Eng. 1986, 8, 147–158. [Google Scholar] [CrossRef]
- Kibar, H.; Öztürk, T.; Esen, E. The Effect of Moisture Content on Physical and Mechanical. Span. J. Agric. Res. 2010, 8, 741–749. [Google Scholar] [CrossRef]
- Chhabra, N.; Kaur, A. Studies on Physical and Engineering Characteristics of Maize, Pearl Millet and Soybean. J. Pharmacogn. Phytochem. 2017, 6, 1–5. [Google Scholar]
- Dobrzański, B. The Cracking Mechanisms of the Legume Seeds; Instytut Agrofizyki im. Bohdana Dobrzańskiego PAN w Lublinie: Lublin, Poland, 1998. [Google Scholar]
- Sfayhi-Terras, D.; Hadjyahia, N.; Zarroug, Y. Effect of Soaking Time and Temperature on Water Absorption Capacity and Dimensional Changes of Bulgur. Cereal Chem. 2021, 98, 851–857. [Google Scholar] [CrossRef]
- Kocabyik, H.; Aktas, T.; Kayisoglu, B. Porosity Reate of Some Kernel Crops. J. Agron. 2004, 3, 76–80. [Google Scholar]
- Shahbazi, F.; Shahbazi, R. Mechanical Damage to Corn Seeds. Cercet. Agron. Mold. 2018, 51, 1–12. [Google Scholar] [CrossRef]
- Guo, Y.; Hou, L.; Li, L.; Gao, S.; Hou, J.; Ming, B.; Xie, R.; Xue, J.; Hou, P.; Wang, K.; et al. Study of Corn Kernel Breakage Susceptibility as a Function of Its Moisture Content by Using a Laboratory Grinding Method. J. Integr. Agric. 2022, 21, 70–77. [Google Scholar] [CrossRef]
- Zdunek, A.; Gancarz, M.; Cybulska, J.; Ranachowski, Z.; Zgórska, K. Turgor and Temperature Effect on Fracture Properties of Potato Tuber (Solanum Tuberosum Cv. Irga). Int. Agrophysics 2008, 22, 89–97. [Google Scholar]
- Li, X.; Liu, X.; Hua, Y.; Chen, Y.; Kong, X.; Zhang, C. Effects of Water Absorption of Soybean Seed on the Quality of Soymilk and the Release of Flavor Compounds. RSC Adv. 2019, 9, 2906–2918. [Google Scholar] [CrossRef] [PubMed]
- Obuchowski, W.; Salmanowicz, B.; Banaszak, Z.; Adamski, T.; Surma, M.; Kaczmarek, Z.; Majcher, M.; Ługowska, B. Grain Hardness of Wheat Bred in Poland and Its Relationship to Starch Damage during Milling. Int. Agrophysics 2010, 24, 69–74. [Google Scholar]
- Politiek, R.G.A.; Bruins, M.E.; Keppler, J.K.; Schutyser, M.A.I. Effect of Oil Content on Pin-Milling of Soybean. J. Food Eng. 2022, 334, 111149. [Google Scholar] [CrossRef]
- Su, Y.; Cui, T.; Zhang, D.; Xia, G.; Gao, X.; He, X.; Xu, Y. Effects of Shape Feature on Compression Characteristics and Crack Rules of Maize Kernel. J. Food Process. Preserv. 2020, 44, e14307. [Google Scholar] [CrossRef]
- Dong, P.; Xie, R.; Wang, K.; Ming, B.; Hou, P.; Hou, J.; Xue, J.; Li, C.; Li, S. Kernel Crack Characteristics for X-Ray Computed Microtomography (ΜCT) and Their Relationship with the Breakage Rate of Maize Varieties. J. Integr. Agric. 2020, 19, 2680–2689. [Google Scholar] [CrossRef]
- Hebda, T.; Frączek, J. Effect of Selected Factors on Seed Elasticity Index. Inzynieria Rol. 2005, 71, 171–180. [Google Scholar]
- Gorji, A.; Rajabipour, A.; Tavakoli, H. Fracture Resistance of Wheat Grain as a Function of Moisture Content, Loading Rate and Grain Orientation. Aust. J. Crop Sci. 2010, 4, 448–452. [Google Scholar]
- Zhao, N.; Fu, N.; Li, D.; Wang, L.; Chen, X.D. Study on Mechanical Properties for Shearing Breakage of Oat Kernel. Int. J. Food Eng. 2018, 14, 20170097. [Google Scholar] [CrossRef]
- Uguru, H.; Akpokodje, O.I.; Altuntas, E. A Study on Rupture Resistance of Groundnut (Cv. SAMNUT 22) Kernel. Turk. J. Agric. Eng. Res. 2021, 2, 19–33. [Google Scholar] [CrossRef]
- Dale, A.C.; Robinson, R.N. Pressure in Deep Grain Storage Structures. Agric. Eng. 1954, 35, 570–573. [Google Scholar]
- Urbaniak, D.; Otwinowski, H.; Wyleciał, T.; Zhukov, V.P.; Barochkin, A.Y.; Boryca, J. Research on the Grinding Energy Density in a Jet Mill. Materials 2021, 14, 2008. [Google Scholar] [CrossRef] [PubMed]
- Dziki, D.; Cacak-Pietrzak, G.; Miś, A.; Jończyk, K.; Gawlik-Dziki, U. Influence of Wheat Kernel Physical Properties on the Pulverizing Process. J. Food Sci. Technol. 2014, 51, 2648–2655. [Google Scholar] [CrossRef] [PubMed]
- Li, X.; Du, Y.; Liu, L.; Mao, E.; Yang, F.; Wu, J.; Wang, L. Research on the Constitutive Model of Low-Damage Corn Threshing Based on DEM. Comput. Electron. Agric. 2022, 194, 106722. [Google Scholar] [CrossRef]
- Srison, W.; Chuan-Udom, S.; Saengprachatanarak, K. Effects of Operating Factors for an Axial-Flow Corn Shelling Unit on Losses and Power Consumption. Agric. Nat. Resour. 2016, 50, 421–425. [Google Scholar] [CrossRef]
- Tomporowski, A. Badanie Użyteczności Rozdrabniania Ziaren Ryżu. Część I-Model Badawczy. Inż. Apar. Chem. 2010, 5, 119–120. [Google Scholar]


| Moisture Content, % w.b. | |||
|---|---|---|---|
| Maize | Rice | Soybeans | |
| Level 1: 10% | 10.02 | 9.98 | 9.76 |
| Level 2: 14% | 13.95 | 13.96 | 14.10 |
| Level 3: 18% | 18.02 | 17.91 | 17.92 |
| Level 4: 22% | 22.09 | 21.80 | 21.94 |
| Level 5: 26% | 26.40 | 25.71 | 26.19 |
| Thickness | Length | Width | Equivalent Diameter | Weight | Bulk Density | ||
|---|---|---|---|---|---|---|---|
| Maize | Pearson Corr. | 0.961 * | 0.968 * | 0.946 * | 0.939 * | 0.956 * | −0.972 * |
| p-value | 0.009 | 0.007 | 0.015 | 0.018 | 0.011 | 0.005 | |
| Rice | Pearson Corr. | 0.956 * | 0.963 * | 0.892 * | 0.937 * | 0.976 * | −0.975 * |
| p-value | 0.011 | 0.008 | 0.042 | 0.019 | 0.004 | 0.005 | |
| Soybeans | Pearson Corr. | 0.889 * | 0.958 * | 0.935 * | 0.899 * | 0.969 * | −0.996 * |
| p-value | 0.045 | 0.010 | 0.020 | 0.038 | 0.007 | 0.000 |
| Sphericity | Aspect Ratio | Flatness Ratio | ||
|---|---|---|---|---|
| Maize | Pearson Corr. | 0.960 * | 0.884 * | −0.934 * |
| p-value | 0.009 | 0.047 | 0.020 | |
| Rice | Pearson Corr. | 0.953 * | −0.942 * | 0.972 * |
| p-value | 0.012 | 0.017 | 0.006 | |
| Soybeans | Pearson Corr. | −0.973 * | −0.965 * | −0.944 * |
| p-value | 0.005 | 0.008 | 0.016 |
| Loading Rate 1.25 mm/min | Loading Rate 125 mm/min | ||||||
|---|---|---|---|---|---|---|---|
| Breakage Force | Breakage Stress | Deformation | Breakage Force | Breakage Stress | Deformation | ||
| Maize | Pearson Corr. | 0.930 * | 0.940 * | 0.974 * | 0.959 * | 0.907 * | 0.968 * |
| p-value | 0.022 | 0.017 | 0.005 | 0.010 | 0.033 | 0.006 | |
| Rice | Pearson Corr. | −0.980 * | −0.965 * | 0.777 | −0.997 * | −0.995 * | 0.949 * |
| p-value | 0.003 | 0.008 | 0.122 | 1.81 × 10⁻⁴ | 4.19 × 10⁻⁴ | 0.014 | |
| Soybeans | Pearson Corr. | −0.825 # | −0.908 * | 0.847 # | −0.759 | −0.797 | 0.957 * |
| p-value | 0.086 | 0.033 | 0.070 | 0.137 | 0.106 | 0.011 | |
| Energy (mJ) | |||
|---|---|---|---|
| Maize | Rice | Soybeans | |
| Loading rate | |||
| 1.25 | 61.14(a) | 1.01(b) | 58.02(a) |
| 125 | 62.36(a) | 3.02(a) | 53.88(b) |
| MC | |||
| 10% | 29.53(e) | 2.69(a) | 43.80(e) |
| 14% | 46.25(d) | 2.21(b) | 61.86(b) |
| 18% | 56.39(c) | 1.87(c) | 65.17(a) |
| 22% | 80.62(b) | 1.61(d) | 57.36(c) |
| 26% | 99.76(a) | 1.53(d) | 51.40(d) |
| Energy (mJ) | ||||||
|---|---|---|---|---|---|---|
| Maize | Rice | Soybeans | ||||
| Loading Rate | 1.25 mm/min | 125 mm/min | 1.25 mm/min | 125 mm/min | 1.25 mm/min | 125 mm/min |
| MC | ||||||
| 10% | 31.57(e) | 27.29(e) | 1.58(f) | 3.90(a) | 53.01(c) | 34.79(e) |
| 14% | 46.96(d) | 45.54(d) | 0.98(g) | 3.48(b) | 73.26(a) | 50.58(c,d) |
| 18% | 53.68(c,d) | 59.10(c) | 0.72(g) | 3.00(c) | 64.07(b) | 66.16(b) |
| 22% | 77.74(b) | 83.82(b) | 0.84(g) | 2.58(d) | 48.19(d) | 65.87(b) |
| 26% | 98.62(a) | 100.98(a) | 0.93(g) | 2.14(e) | 51.57(c,d) | 51.22(c,d) |
Publisher’s Note: MDPI stays neutral with regard to jurisdictional claims in published maps and institutional affiliations. |
© 2022 by the authors. Licensee MDPI, Basel, Switzerland. This article is an open access article distributed under the terms and conditions of the Creative Commons Attribution (CC BY) license (https://creativecommons.org/licenses/by/4.0/).
Share and Cite
Kruszelnicka, W.; Chen, Z.; Ambrose, K. Moisture-Dependent Physical-Mechanical Properties of Maize, Rice, and Soybeans as Related to Handling and Processing. Materials 2022, 15, 8729. https://doi.org/10.3390/ma15248729
Kruszelnicka W, Chen Z, Ambrose K. Moisture-Dependent Physical-Mechanical Properties of Maize, Rice, and Soybeans as Related to Handling and Processing. Materials. 2022; 15(24):8729. https://doi.org/10.3390/ma15248729
Chicago/Turabian StyleKruszelnicka, Weronika, Zhengpu Chen, and Kingsly Ambrose. 2022. "Moisture-Dependent Physical-Mechanical Properties of Maize, Rice, and Soybeans as Related to Handling and Processing" Materials 15, no. 24: 8729. https://doi.org/10.3390/ma15248729
APA StyleKruszelnicka, W., Chen, Z., & Ambrose, K. (2022). Moisture-Dependent Physical-Mechanical Properties of Maize, Rice, and Soybeans as Related to Handling and Processing. Materials, 15(24), 8729. https://doi.org/10.3390/ma15248729