

Mechanical Response of Glass–Epoxy Composites with Graphene Oxide Nanoparticles

 , , and
Abstract
1. Introduction
2. Materials and Methods
2.1. Sample Preparation
2.2. Testing of Composites
3. Results and Discussion
3.1. Thermomechanical Analysis
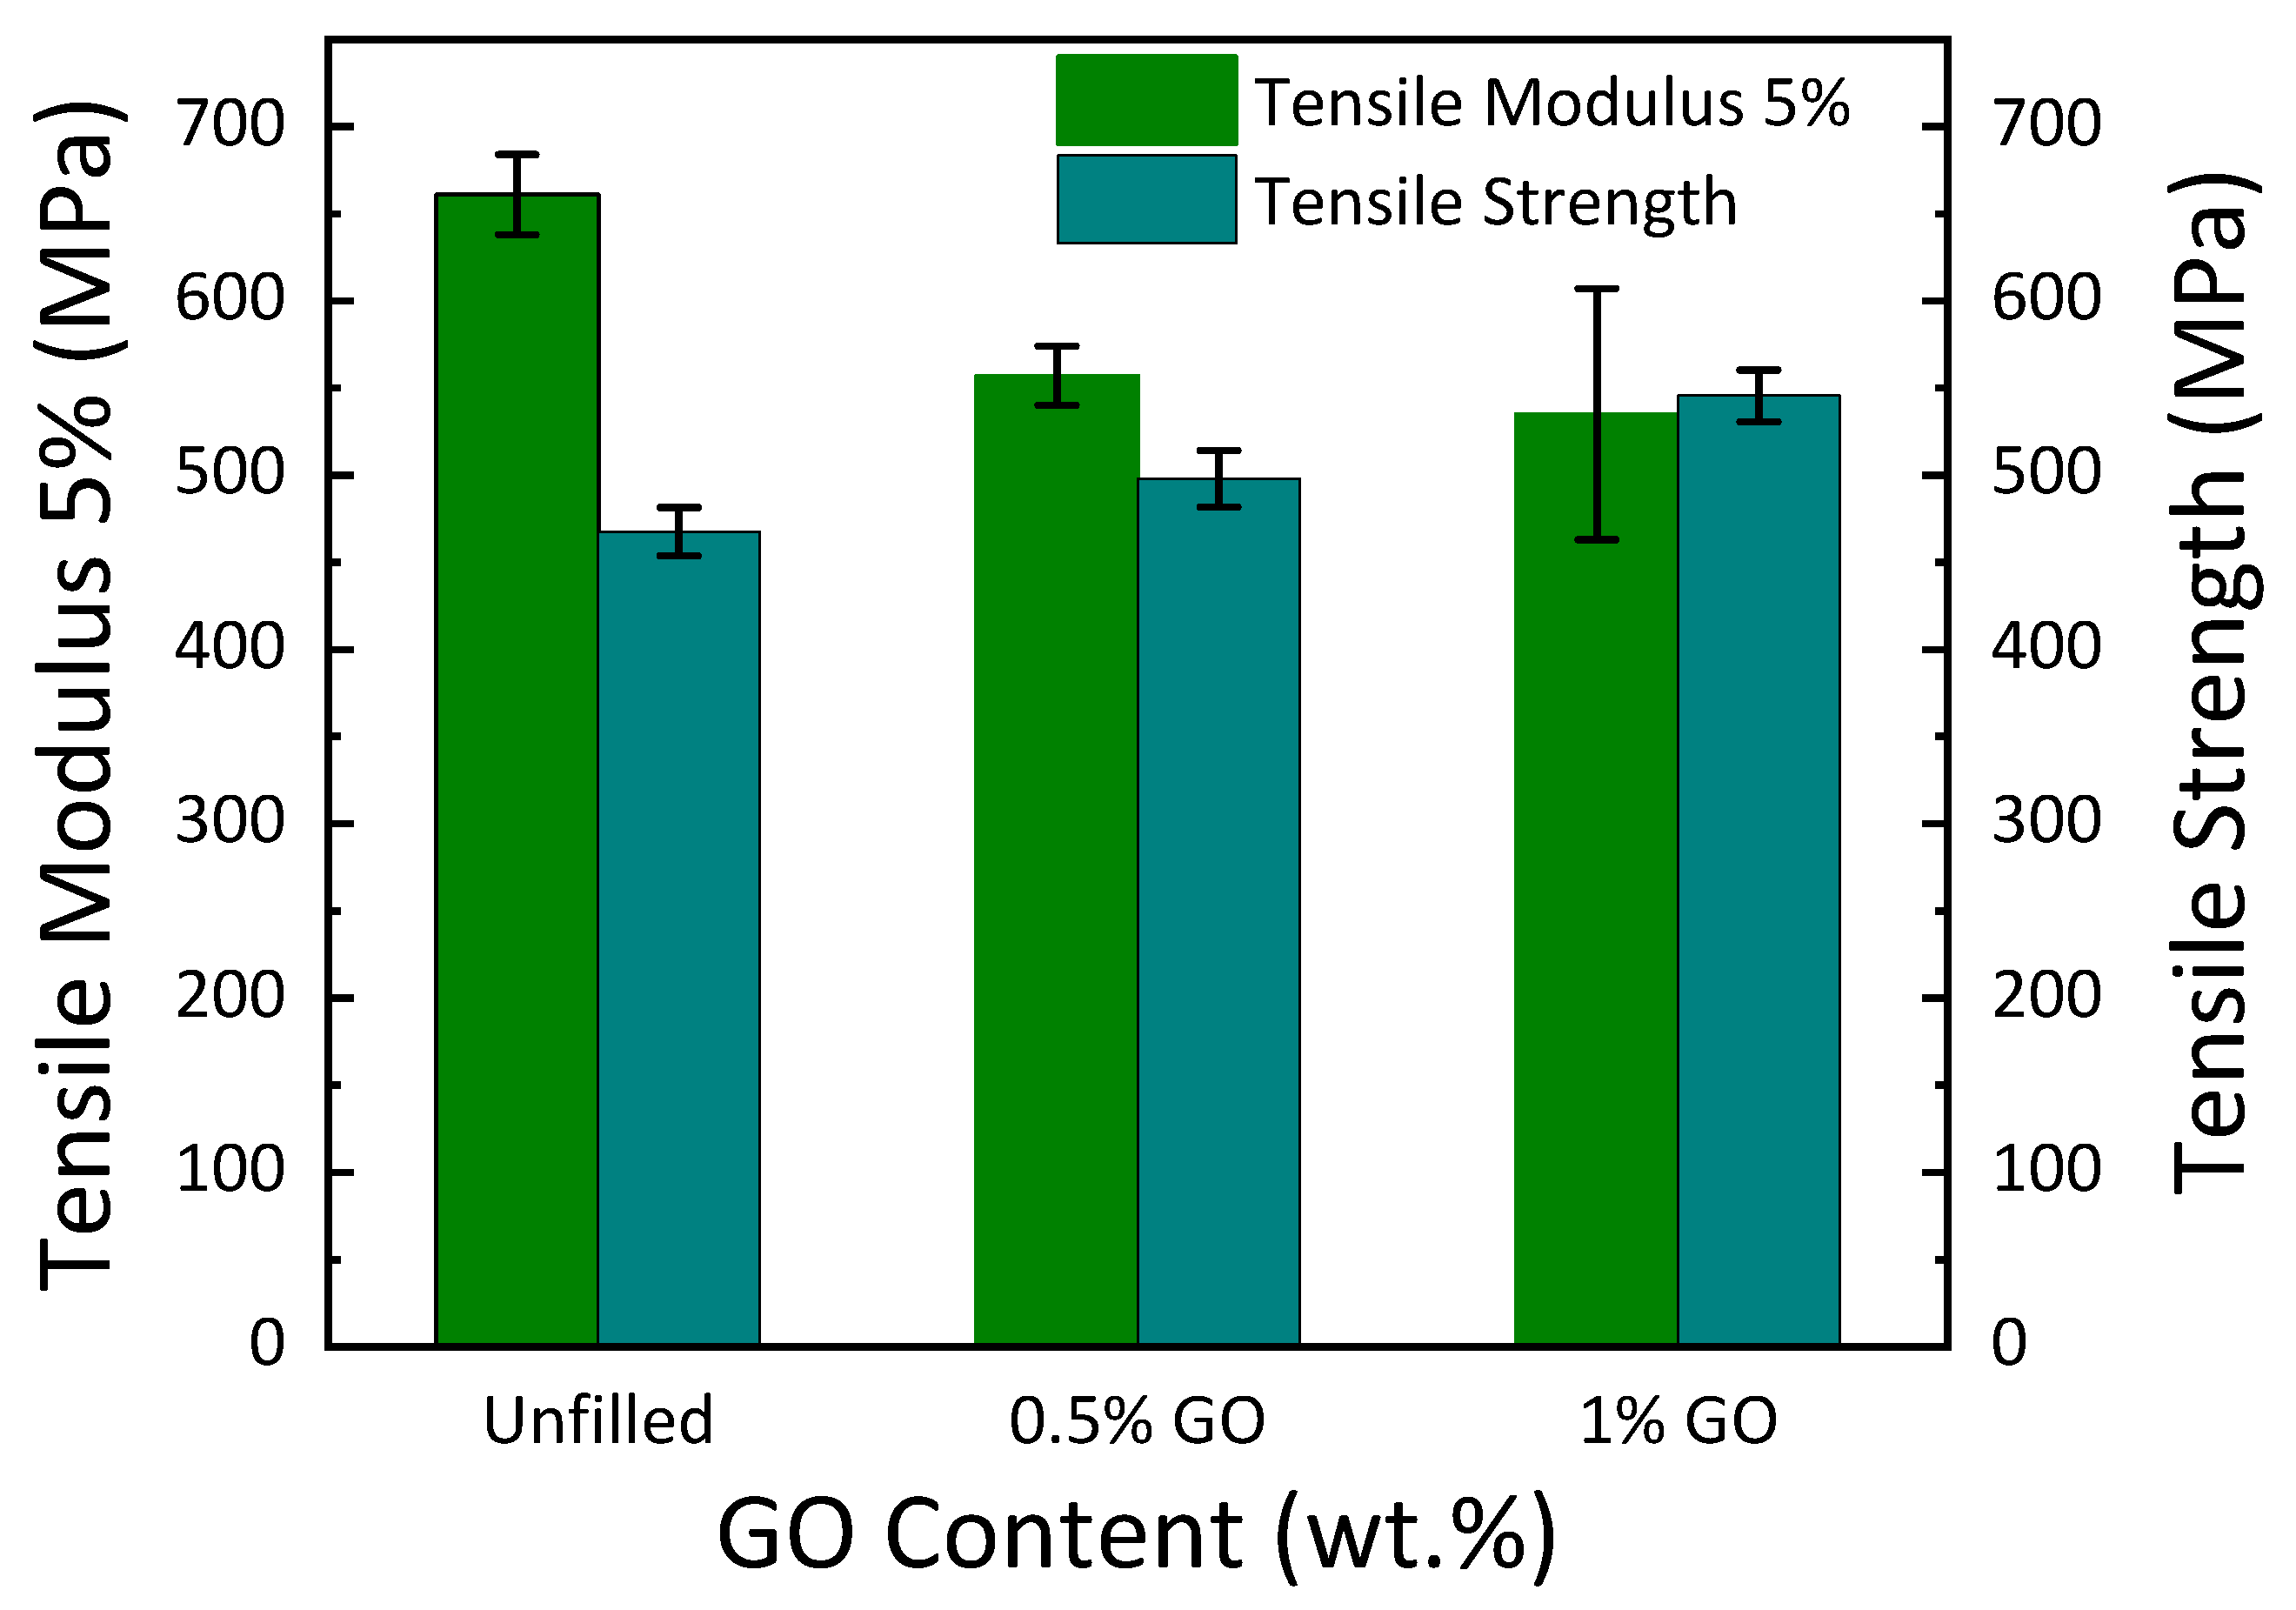
3.2. Tensile Test
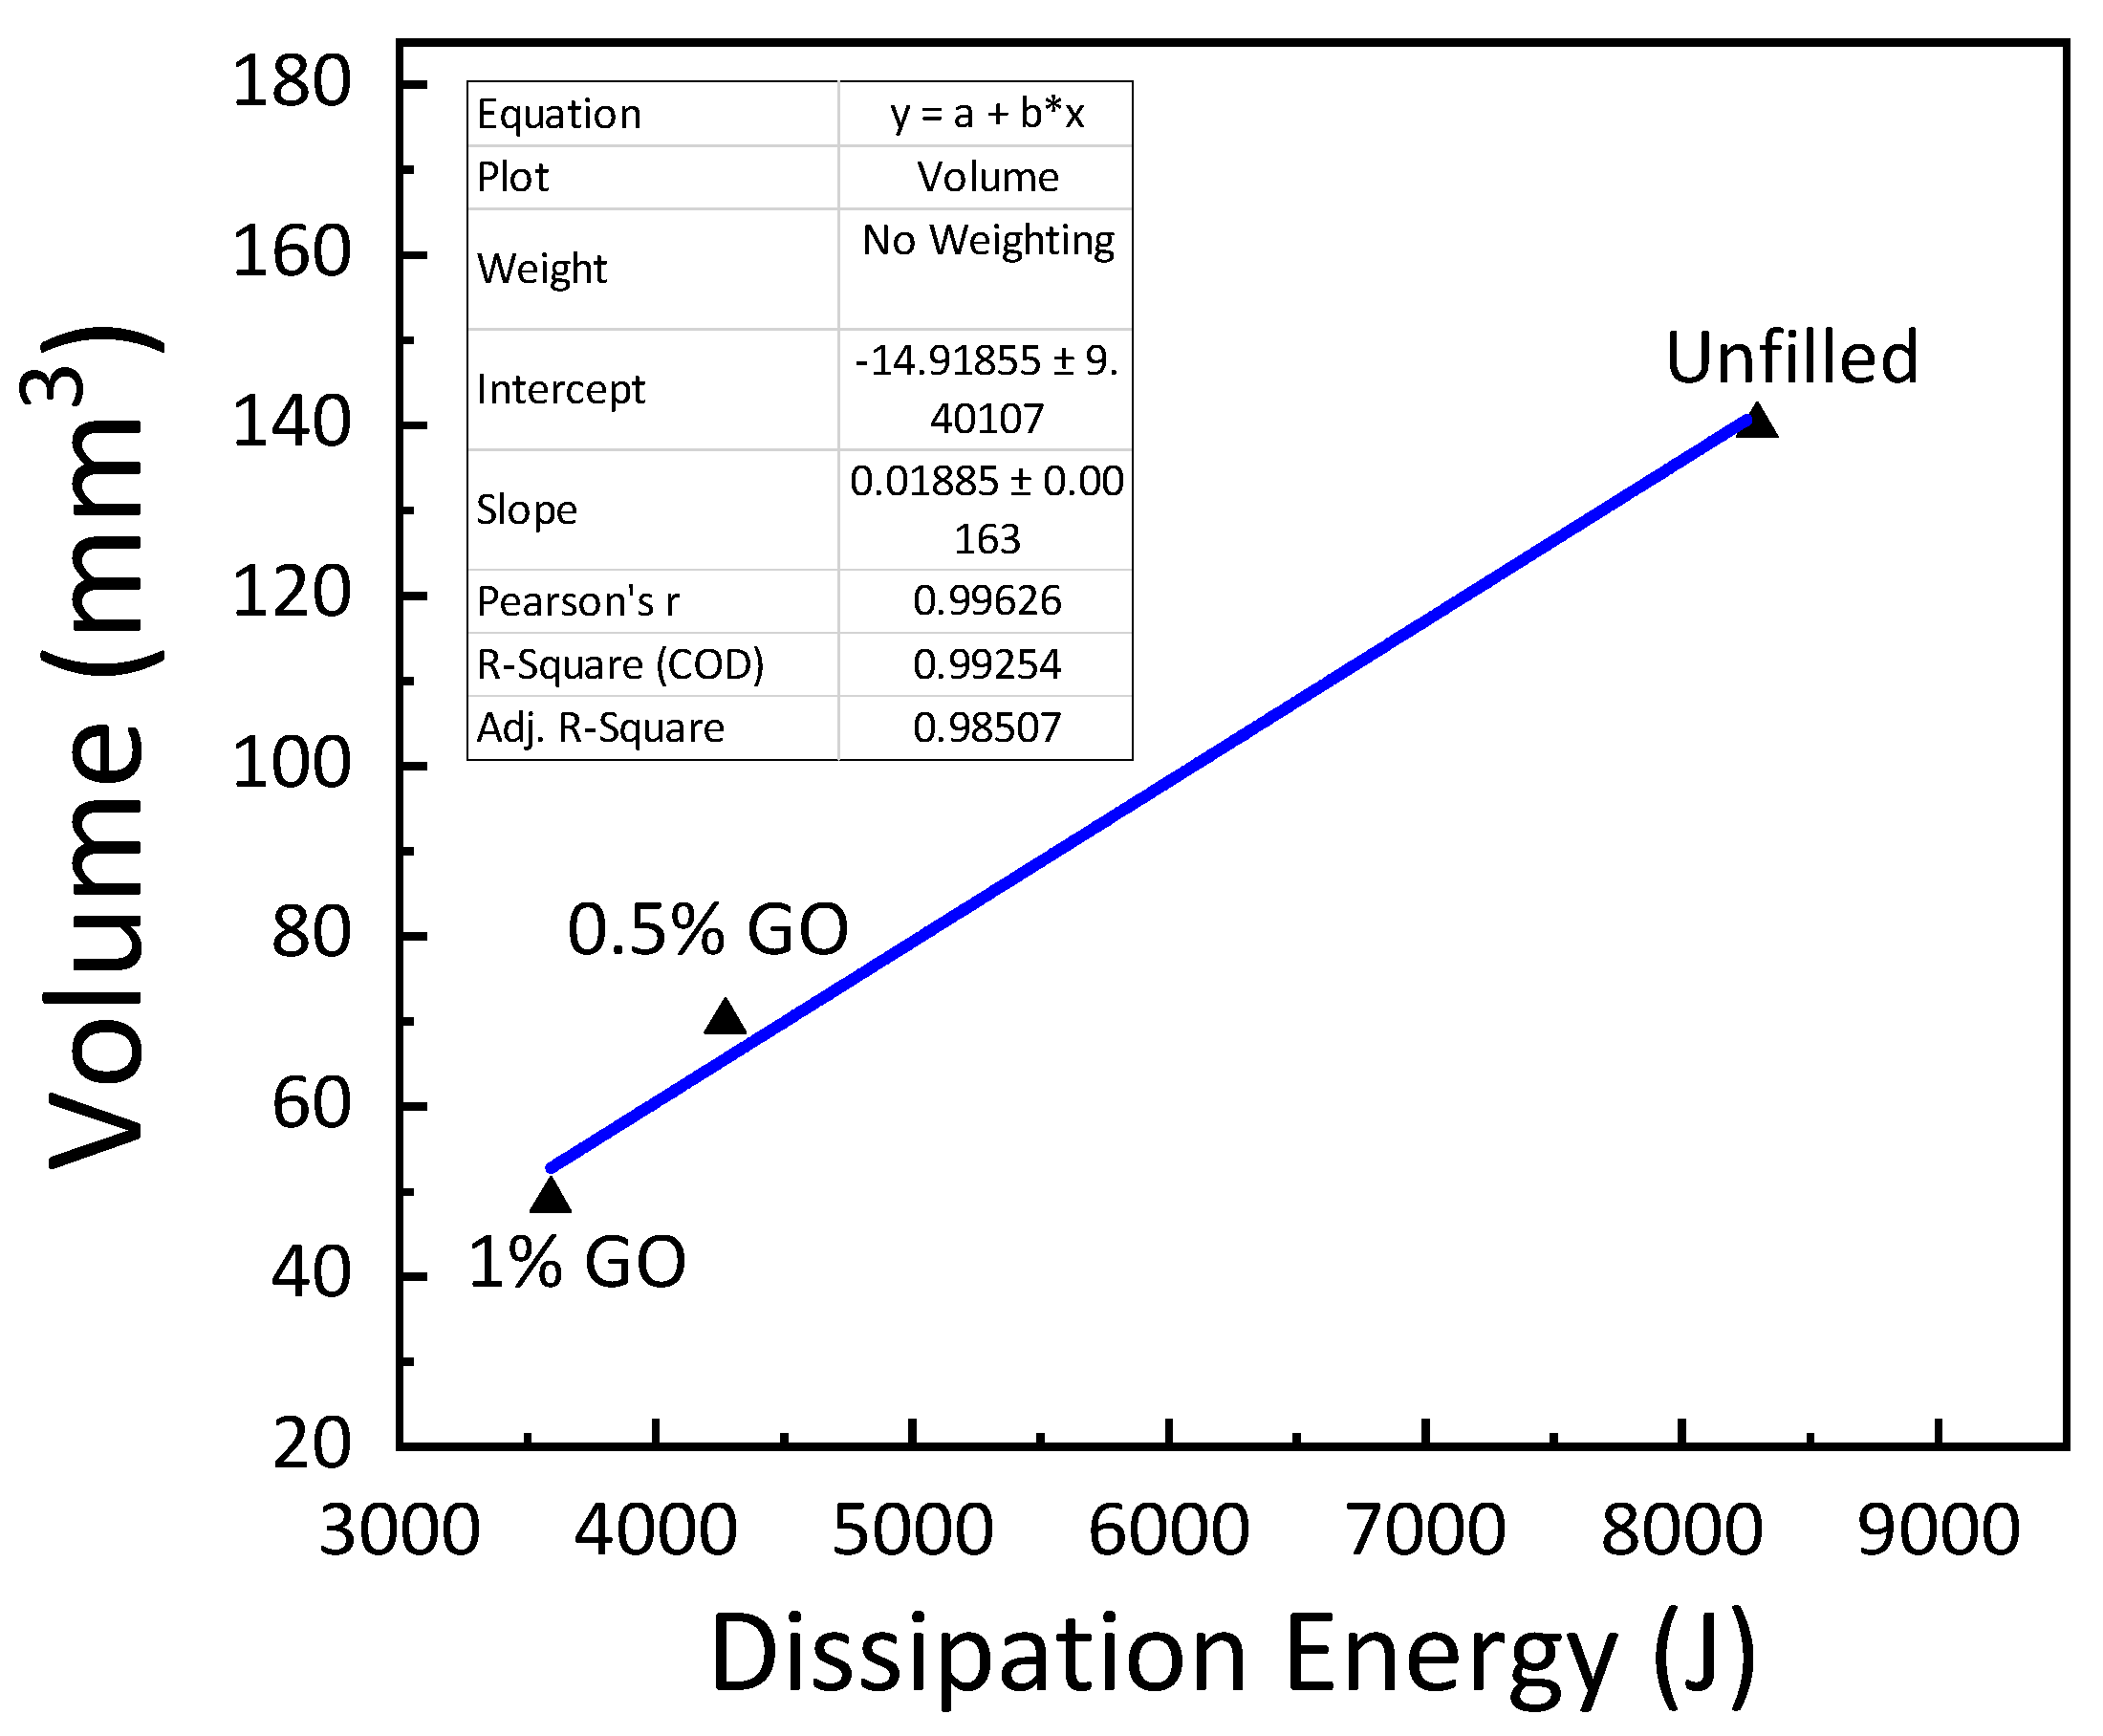
3.3. Wear Test
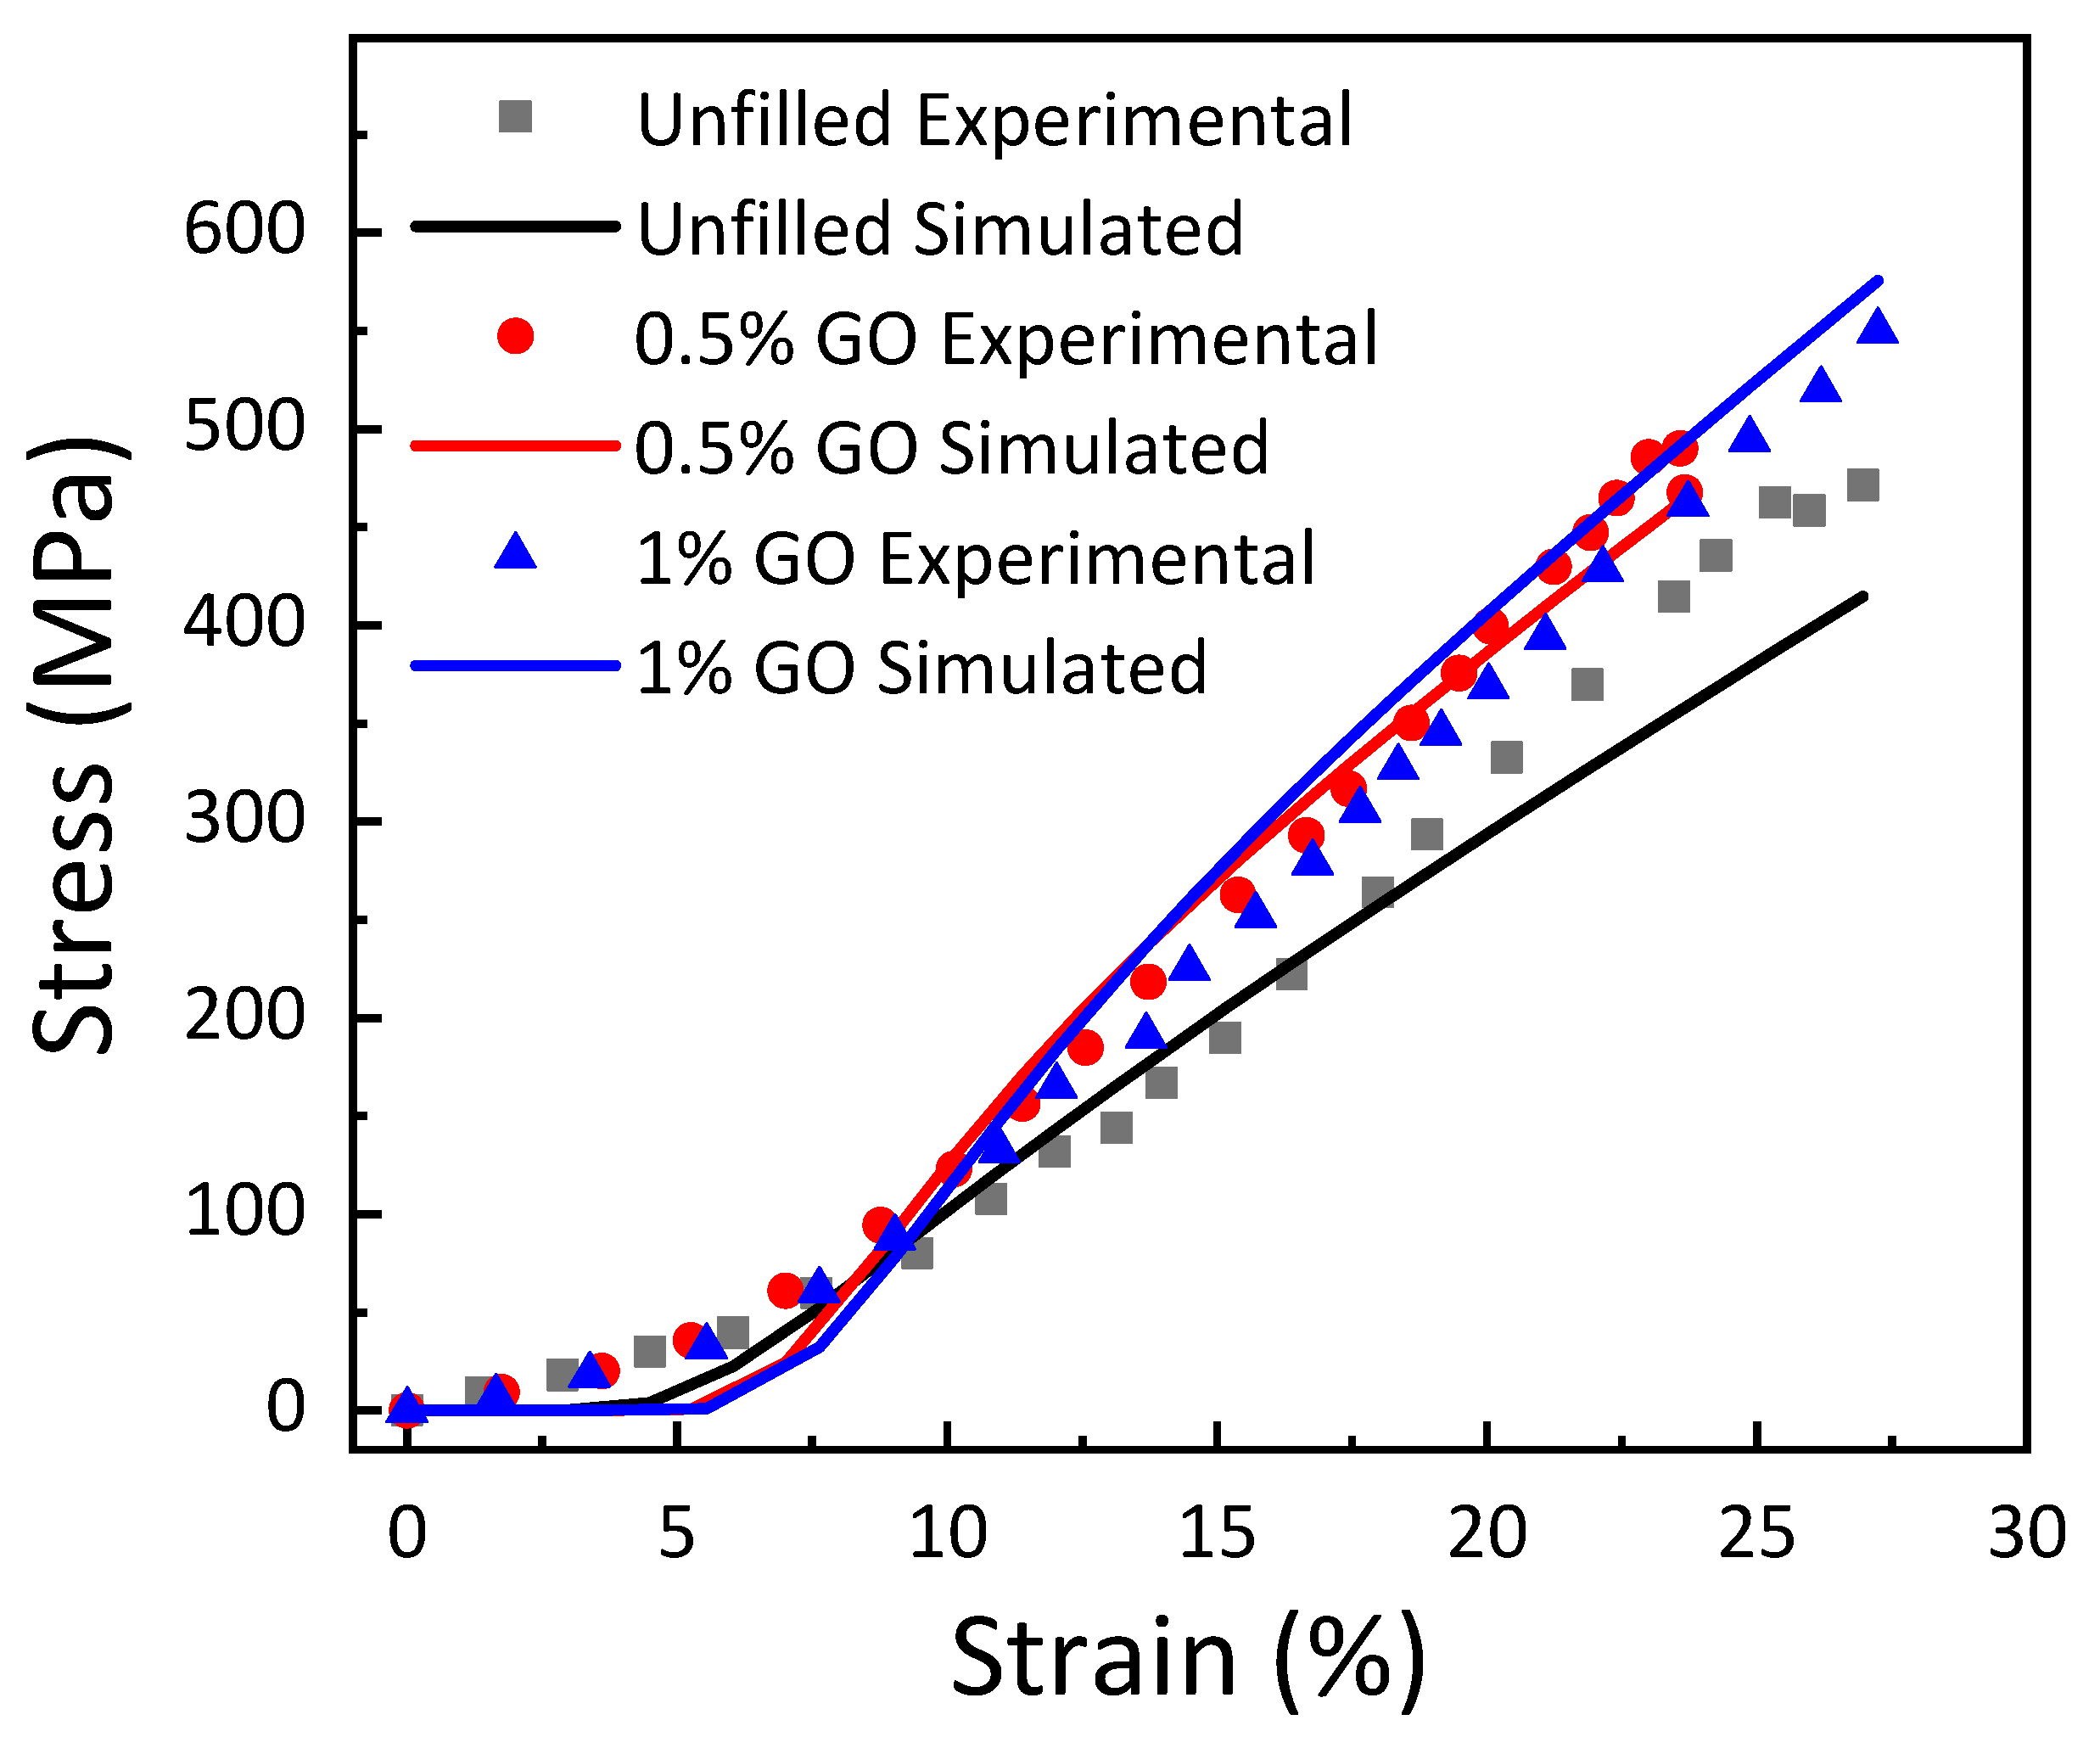
3.4. Modeling the Effect of Graphene Oxide Loading on the Stress–Strain Response
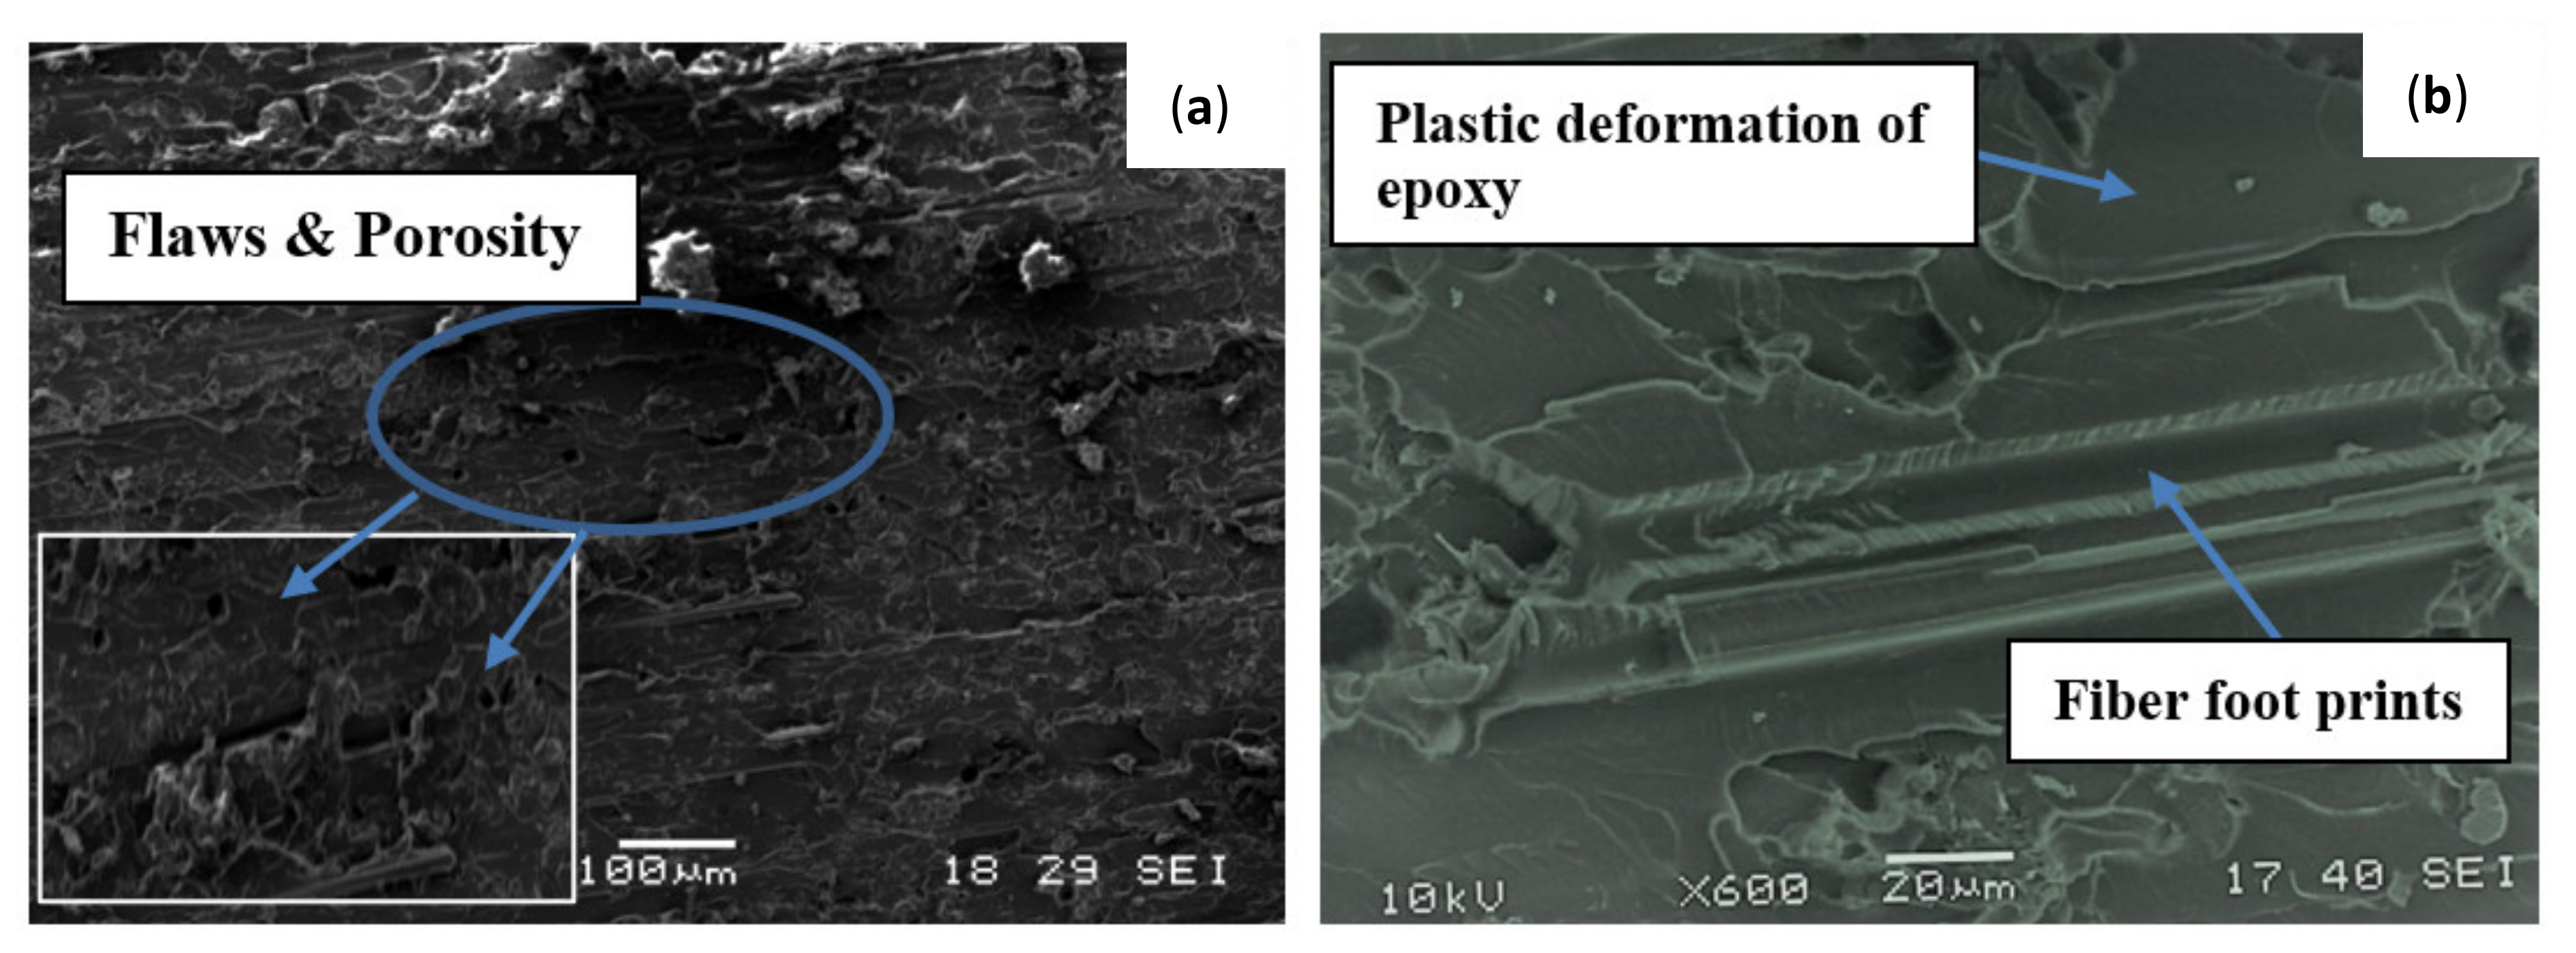
3.5. Fractography
4. Conclusions
Author Contributions
Funding
Institutional Review Board Statement
Informed Consent Statement
Data Availability Statement
Acknowledgments
Conflicts of Interest
References
- Donnet, J. Nano and microcomposites of polymers elastomers and their reinforcement. Compos. Sci. Technol. 2003, 63, 1085–1088. [Google Scholar] [CrossRef]
- Gouda, P.S.S.; Kudari, S.K.; Prabhuswamy, S.; Jawali, D. Fracture Toughness of Glass-Carbon (0/90)S Fiber Reinforced Polymer Composite—An Experimental and Numerical Study. J. Miner. Mater. Charact. Eng. 2011, 10, 671–682. [Google Scholar]
- Adin, M.Ş.; Kılıçkap, E. Strength of double-reinforced adhesive joints. Mater. Test. 2021, 63, 176–181. [Google Scholar] [CrossRef]
- Zheng, Y.; Ning, R. Effects of nanoparticles SiO2 on the performance of nanocomposites. Mater. Lett. 2003, 57, 2940–2944. [Google Scholar] [CrossRef]
- Gouda, P.S.; Jawali, D.; Kulkarni, R.; Kurbet, S.; Jawali, A.D. Effects of multi walled carbon nanotubes and graphene on the mechanical properties of hybrid polymer composites. Adv. Mater. Lett. 2013, 4, 261–270. [Google Scholar] [CrossRef]
- Adin, H.; Adin, M. Effect of particles on tensile and bending properties of jute epoxy composites. Mater. Test. 2022, 64, 401–411. [Google Scholar] [CrossRef]
- Cheng, X.; Yokozeki, T.; Wu, L.; Wang, H.; Zhang, J.; Koyanagi, J.; Weng, Z.; Sun, Q.-F. Electrical conductivity and interlaminar shear strength enhancement of carbon fiber reinforced polymers through synergetic effect between graphene oxide and polyaniline. Compos. Part A Appl. Sci. Manuf. 2016, 90, 243–249. [Google Scholar] [CrossRef]
- Moriche, R.; Sánchez, M.; Jiménez-Suárez, A.; Prolongo, S.; Ureña, A. Electrically conductive functionalized-GNP/epoxy based composites: From nanocomposite to multiscale glass fibre composite material. Compos. Part B Eng. 2016, 98, 49–55. [Google Scholar] [CrossRef]
- Song, P.; Cao, Z.; Cai, Y.; Zhao, L.; Fang, Z.; Fu, S. Fabrication of exfoliated graphene-based polypropylene nanocomposites with enhanced mechanical and thermal properties. Polymer 2011, 52, 4001–4010. [Google Scholar] [CrossRef]
- Jiang, S.; Li, Q.; Wang, J.; He, Z.; Zhao, Y.; Kang, M. Multiscale graphene oxide–carbon fiber reinforcements for advanced polyurethane composites. Compos. Part A Appl. Sci. Manuf. 2016, 87, 1–9. [Google Scholar] [CrossRef]
- Hou, W.; Gao, Y.; Wang, J.; Blackwood, D.J.; Teo, S. Recent advances and future perspectives for graphene oxide reinforced epoxy resins. Mater. Today Commun. 2020, 23, 100883. [Google Scholar] [CrossRef]
- Qu, C.-B.; Huang, Y.; Li, F.; Xiao, H.-M.; Liu, Y.; Feng, Q.-P.; Huang, G.-W.; Li, N.; Fu, S.-Y. Enhanced cryogenic mechanical properties of carbon fiber reinforced epoxy composites by introducing graphene oxide. Compos. Commun. 2020, 22, 100480. [Google Scholar] [CrossRef]
- Gouda, P.S.; Chatterjee, V.; Barhai, P.K.; GB, V.K. Fracture toughness of glass epoxy laminates using carbon nano particles and ETBN rubber. Mater. Perform. Charact. 2017, 6, 20170027. [Google Scholar] [CrossRef]
- Gumgol, U.; Umarfarooq, M.A.; Huddar, D.; Vastrad, J.V.; Wilkinson, A.; Gouda, P.S.S. Influence of kenaf and go on interlaminar radial stresses in glass/epoxy l-bend laminates. SN Appl. Sci. 2018, 1, 93. [Google Scholar] [CrossRef]
- Zhang, X.; Fan, X.; Yan, C.; Li, H.; Zhu, Y.; Li, X.; Yu, L. Interfacial microstructure and properties of carbon fiber composites modified with graphene oxide. ACS Appl. Mater. Interfaces 2012, 4, 1543–1552. [Google Scholar] [CrossRef]
- Chandrasekaran, S.; Sato, N.; Tölle, F.; Mülhaupt, R.; Fiedler, B.; Schulte, K. Fracture toughness and failure mechanism of graphene based epoxy composites. Compos. Sci. Technol. 2014, 97, 90–99. [Google Scholar] [CrossRef]
- Karthikeyan, S.; Ahmed, K.; Osatiashtiani, A.; Lee, A.F.; Wilson, K.; Sasaki, K.; Coulson, B.; Swansborough-Aston, W.; Douthwaite, R.E.; Li, W. Pompon Dahlia-like Cu2O/rGO nanostructures for visible light photocatalytic H2 production and 4-chlorophenol degradation. ChemCatChem 2020, 12, 1699–1709. [Google Scholar] [CrossRef]
- Jo, W.-K.; Kumar, S.; Isaacs, M.A.; Lee, A.F.; Karthikeyan, S. Cobalt promoted TiO2/GO for the photocatalytic degradation of oxytetracycline and Congo Red. Appl. Catal. B Environ. 2017, 201, 159–168. [Google Scholar] [CrossRef]
- Priyadharsan, A.; Vasanthakumar, V.; Karthikeyan, S.; Raj, V.; Shanavas, S.; Anbarasan, P.M. Multi-functional properties of ternary CeO2/SnO2/rGO nanocomposites: Visible light driven photocatalyst and heavy metal removal. J. Photochem. Photobiol. A Chem. 2017, 346, 32–45. [Google Scholar] [CrossRef]
- Ning, H.; Li, J.; Hu, N.; Yan, C.; Liu, Y.; Wu, L.; Liu, F.; Zhang, J. Interlaminar mechanical properties of carbon fiber reinforced plastic laminates modified with graphene oxide interleaf. Carbon 2015, 91, 224–233. [Google Scholar] [CrossRef]
- Mannov, E.; Schmutzler, H.; Chandrasekaran, S.; Viets, C.; Buschhorn, S.; Tölle, F.; Mülhaupt, R.; Schulte, K. Improvement of compressive strength after impact in fibre reinforced polymer composites by matrix modification with thermally reduced graphene oxide. Compos. Sci. Technol. 2013, 87, 36–41. [Google Scholar] [CrossRef]
- Zhang, M.C.; Guo, B.H.; Xu, J. A Review on Polymer Crystallization Theories. Crystals 2017, 7, 4. [Google Scholar] [CrossRef]
- Mercier, J.P. Nucleation in polymer crystallization: A physical or a chemical mechanism? Polym. Eng. Sci. 1990, 30, 270–278. [Google Scholar] [CrossRef]
- Low, Y.J.; Andriyana, A.; Ang, B.C.; Abidin, N.I.Z. Bioresorbable and degradable behaviors ofPGA: Current state and future prospects. Polym. Eng. Sci. 2020, 60, 2657–2675. [Google Scholar] [CrossRef]
- Alexopoulos, N.D.; Paragkamian, Z.; Poulin, P.; Kourkoulis, S.K. Fracture related mechanical properties of low and high graphene reinforcement of epoxy nanocomposites. Compos. Sci. Technol. 2017, 150, 194–204. [Google Scholar] [CrossRef]
- Baptista, R.; Mendão, A.; Rodrigues, F.; Figueiredo-Pina, C.G.; Guedes, M.; Marat-Mendes, R. Effect of high graphite filler contents on the mechanical and tribological failure behavior of epoxy matrix composites. Theor. Appl. Fract. Mech. 2016, 85, 113–124. [Google Scholar] [CrossRef]
- Bulut, M. Mechanical characterization of Basalt/epoxy composite laminates containing graphene nanopellets. Compos. Part B Eng. 2017, 122, 71–78. [Google Scholar] [CrossRef]
- Mahmood, H.; Vanzetti, L.; Bersani, M.; Pegoretti, A. Mechanical properties and strain monitoring of glass-epoxy composites with graphene-coated fibers. Compos. Part A Appl. Sci. Manuf. 2018, 107, 112–123. [Google Scholar] [CrossRef]
- Ghadge, R.R.; Prakash, S.; Ganorkar, S.A. Experimental investigations on fatigue life enhancement of composite (e-glass/epoxy) single lap joint with graphene oxide modified adhesive. Mater. Res. Express 2021, 8, 025202. [Google Scholar] [CrossRef]
- Teanmetawong, S.; Chantaramanee, T.; Lhosupasirirat, S.; Wongariyakawee, A.; Srikhirin, T. A Comparison Study of Magnetic Stirrer and Sonicator Technique to Disperse 1% Span20 Treated Layered Double Hydroxides (LDHs). In IOP Conference Series: Materials Science and Engineering; IOP Publishing: Incheon, Republic of Korea, 2019; Volume 654, p. 012005. [Google Scholar] [CrossRef]
- Sumitomo, S.; Koizumi, H.; Uddin, A.; Kato, Y. Comparison of dispersion behavior of agglomerated particles in liquid between ultrasonic irradiation and mechanical stirring. Ultrason. Sonochemistry 2018, 40, 822–831. [Google Scholar] [CrossRef]
- Feng, H.; Wang, X.; Wu, D. Fabrication of spirocyclic phosphazene epoxy-based nanocomposites with graphene via exfoliation of graphite platelets and thermal curing for enhancement of mechanical and conductive properties. Ind. Eng. Chem. Res. 2013, 52, 10160–10171. [Google Scholar] [CrossRef]
- Gojny, F.H.; Schulte, K. Functionalisation effect on the thermo-mechanical behaviour of multi-wall carbon nanotube/epoxy-composites. Compos. Sci. Technol. 2004, 64, 2303–2308. [Google Scholar] [CrossRef]
- Prolongo, S.; Gude, M.; Ureña, A. Improving the flexural and thermomechanical properties of amino-functionalized carbon nanotube/epoxy composites by using a pre-curing treatment. Compos. Sci. Technol. 2011, 71, 765–771. [Google Scholar] [CrossRef]
- Geethamma, V.G.; Kalaprasad, G.; Groeninckx, G.; Thomas, S. Dynamic mechanical behavior of short coir fiber reinforced natural rubber composites. Compos. Part A Appl. Sci. Manuf. 2005, 36, 1499–1506. [Google Scholar] [CrossRef]
- Shah, A.H.; Li, X.; Xu, X.; Dayo, A.Q.; Liu, W.-B.; Bai, J.; Wang, J. Evaluation of mechanical and thermal properties of modified epoxy resin by using acacia catechu particles. Mater. Chem. Phys. 2019, 225, 239–246. [Google Scholar] [CrossRef]
- Upadhyay, R.; Kumar, A. Epoxy-graphene-MoS2 composites with improved tribological behavior under dry sliding contact. Tribol. Int. 2019, 130, 106–118. [Google Scholar] [CrossRef]
- Ramalho, A.; Miranda, J.C. The relationship between wear and dissipated energy in sliding systems. Wear 2006, 260, 361–367. [Google Scholar] [CrossRef]
- Pervin, F.; Zhou, Y.; Rangari, V.K.; Jeelani, S. Testing and evaluation on the thermal and mechanical properties of carbon nano fiber reinforced SC-15 epoxy. Mater. Sci. Eng. A 2005, 405, 246–253. [Google Scholar] [CrossRef]
- Zhou, Y.; Pervin, F.; Lewis, L.; Jeelani, S. Fabrication and characterization of carbon/epoxy composites mixed with multi-walled carbon nanotubes. Mater. Sci. Eng. A 2008, 475, 157–165. [Google Scholar] [CrossRef]
- Prusty, R.K.; Ghosh, S.K.; Rathore, D.K.; Ray, B.C. Reinforcement effect of graphene oxide in glass fibre/epoxy composites at in-situ elevated temperature environments: An emphasis on graphene oxide content. Compos. Part A Appl. Sci. Manuf. 2017, 95, 40–53. [Google Scholar] [CrossRef]
- Wong, D.; Andriyana, A.; Ang, B.C.; Verron, E. Surface morphology and mechanical response of randomly oriented electrospun nanofibrous membrane. Polym. Test. 2016, 53, 108–115. [Google Scholar] [CrossRef]
- Andriyana, A.; Loo, M.S.; Chagnon, G.; Verron, E.; Ch’ng, S.Y. Modeling the Mullins effect in elastomers swollen by palm biodiesel. Int. J. Eng. Sci. 2015, 95, 1–22. [Google Scholar] [CrossRef]
- Rathore, D.K.; Prusty, R.K.; Kumar, D.S.; Ray, B.C. Mechanical performance of CNT-filled glass fiber/epoxy composite in in-situ elevated temperature environments emphasizing the role of CNT content. Compos. Part A Appl. Sci. Manuf. 2016, 84, 364–376. [Google Scholar] [CrossRef]


| Sample | Tg (°C) | Storage Modulus (MPa) | Loss Modulus (MPa) | Cross-Link Density (×10−2 mol/cm3) |
|---|---|---|---|---|
| GE–Unfilled | 82 | 1451.72 | 662.93 | 3.22 |
| 0.5% GO | 77 | 681.08 | 666.94 | 1.96 |
| 1% GO | 72 | 427.49 | 413.63 | 1.08 |
Publisher’s Note: MDPI stays neutral with regard to jurisdictional claims in published maps and institutional affiliations. |
© 2022 by the authors. Licensee MDPI, Basel, Switzerland. This article is an open access article distributed under the terms and conditions of the Creative Commons Attribution (CC BY) license (https://creativecommons.org/licenses/by/4.0/).
Share and Cite
Uppin, V.S.; Gouda, P.S.S.; Kittur, M.I.; Andriyana, A.; Ang, B.C.; Parveez, B.; Badruddin, I.A.; Javed, S.; Kamangar, S. Mechanical Response of Glass–Epoxy Composites with Graphene Oxide Nanoparticles. Materials 2022, 15, 8545. https://doi.org/10.3390/ma15238545
Uppin VS, Gouda PSS, Kittur MI, Andriyana A, Ang BC, Parveez B, Badruddin IA, Javed S, Kamangar S. Mechanical Response of Glass–Epoxy Composites with Graphene Oxide Nanoparticles. Materials. 2022; 15(23):8545. https://doi.org/10.3390/ma15238545
Chicago/Turabian StyleUppin, Vinayak S., P. S. Shivakumar Gouda, M. I. Kittur, A. Andriyana, B. C. Ang, Bisma Parveez, Irfan Anjum Badruddin, Syed Javed, and Sarfaraz Kamangar. 2022. "Mechanical Response of Glass–Epoxy Composites with Graphene Oxide Nanoparticles" Materials 15, no. 23: 8545. https://doi.org/10.3390/ma15238545
APA StyleUppin, V. S., Gouda, P. S. S., Kittur, M. I., Andriyana, A., Ang, B. C., Parveez, B., Badruddin, I. A., Javed, S., & Kamangar, S. (2022). Mechanical Response of Glass–Epoxy Composites with Graphene Oxide Nanoparticles. Materials, 15(23), 8545. https://doi.org/10.3390/ma15238545