
Pressure-Tuning Superconductivity in Noncentrosymmetric Topological Materials ZrRuAs
 , ,
, ,
Abstract
1. Introduction
2. Experimental Detail
3. Results and Discussion
4. Conclusions
Supplementary Materials
Author Contributions
Funding
Institutional Review Board Statement
Informed Consent Statement
Data Availability Statement
Conflicts of Interest
References
- Hasan, M.Z.; Kane, C.L. Colloquium: Topological insulators. Rev. Mod. Phys. 2010, 82, 3045–3067. [Google Scholar] [CrossRef]
- Qi, X.-L.; Zhang, S.-C. Topological insulators and superconductors. Rev. Mod. Phys. 2011, 83, 1057–1110. [Google Scholar] [CrossRef]
- Chiu, C.-K.; Teo, J.C.Y.; Schnyder, A.P.; Ryu, S. Classification of topological quantum matter with symmetries. Rev. Mod. Phys. 2016, 88, 035005. [Google Scholar] [CrossRef]
- Liu, J.; Vanderbilt, D. Weyl semimetals from noncentrosymmetric topological insulators. Phys. Rev. B 2014, 90, 155316. [Google Scholar] [CrossRef]
- Yin, J.X.; Wu, Z.; Wang, J.H.; Ye, Z.Y.; Gong, J.; Hou, X.Y.; Shan, L.; Li, A.; Liang, X.J.; Wu, X.X.; et al. Observation of a robust zero-energy bound state in iron-based superconductor Fe(Te,Se). Nat. Phys. 2015, 11, 543–546. [Google Scholar] [CrossRef]
- Wang, Z.; Zhang, P.; Xu, G.; Zeng, L.K.; Miao, H.; Xu, X.; Qian, T.; Weng, H.; Richard, P.; Fedorov, A.V.; et al. Topological nature of theFeSe0.5Te0.5superconductor. Phys. Rev. B 2015, 92, 115119. [Google Scholar] [CrossRef]
- Vancliff Johnson, W.J. Ternary Equiatomic Transition Metal Silicides and Germanides. J. Solid State Chem. 1972, 4, 123–130. [Google Scholar] [CrossRef]
- Qian, Y.; Nie, S.; Yi, C.; Kong, L.; Fang, C.; Qian, T.; Ding, H.; Shi, Y.; Wang, Z.; Weng, H.; et al. Topological electronic states in HfRuP family superconductors. Npj Comput. Mater. 2019, 5, 121. [Google Scholar] [CrossRef]
- Das, D.; Adroja, D.T.; Lees, M.R.; Taylor, R.W.; Bishnoi, Z.S.; Anand, V.K.; Bhattacharyya, A.; Guguchia, Z.; Baines, C.; Luetkens, H.; et al. Probing the superconducting gap structure in the noncentrosymmetric topological superconductor ZrRuAs. Phys. Rev. B 2021, 103, 144516. [Google Scholar] [CrossRef]
- Barz, H.; Ku, H.C.; Meisner, G.P.; Fisk, Z.; Matthias, B.T. Ternary transition metal phosphides: High-temperature superconductors. Proc. Natl. Acad. Sci. USA 1980, 77, 3. [Google Scholar] [CrossRef]
- Pei, C.; Zhang, J.; Gong, C.; Wang, Q.; Gao, L.; Zhao, Y.; Tian, S.; Cao, W.; Li, C.; Lu, Z.-Y.; et al. Distinct superconducting behaviors of pressurized WB2 and ReB2 with different local B layers. Sci. China Phys. Mech. Astron. 2022, 65, 287412. [Google Scholar] [CrossRef]
- Cao, W.; Zhao, N.; Pei, C.; Wang, Q.; Zhang, Q.; Ying, T.; Zhao, Y.; Gao, L.; Li, C.; Yu, N.; et al. Pressure-induced superconductivity in the noncentrosymmetric Weyl semimetals LaAlX (X = Si,Ge). Phys. Rev. B 2022, 105, 174502. [Google Scholar] [CrossRef]
- Pei, C.; Ying, T.; Zhao, Y.; Gao, L.; Cao, W.; Li, C.; Hosono, H.; Qi, Y. Pressure-induced reemergence of superconductivity in BaIr2Ge7 and Ba3Ir4Ge16 with cage structures. Matter Radiat. Extrem. 2022, 7, 038404. [Google Scholar] [CrossRef]
- Pei, C.; Ying, T.; Zhang, Q.; Wu, X.; Yu, T.; Zhao, Y.; Gao, L.; Li, C.; Cao, W.; Zhang, Q.; et al. Caging-Pnictogen-Induced Superconductivity in Skutterudites IrX3 (X = As, P). J. Am. Chem. Soc. 2022, 144, 6208–6214. [Google Scholar] [CrossRef]
- Wang, Q.; Kong, P.; Shi, W.; Pei, C.; Wen, C.; Gao, L.; Zhao, Y.; Yin, Q.; Wu, Y.; Li, G.; et al. Charge Density Wave Orders and Enhanced Superconductivity under Pressure in the Kagome Metal CsV3 Sb5. Adv. Mater. 2021, 33, e2102813. [Google Scholar] [CrossRef]
- Mao, H.K.; Xu, J.; Bell, P.M. Calibration of the ruby pressure gauge to 800 kbar under quasi-hydrostatic conditions. J. Geophys. Res. 1986, 91, 4673–4676. [Google Scholar] [CrossRef]
- Gresch, D.; Autès, G.; Yazyev, O.V.; Troyer, M.; Vanderbilt, D.; Bernevig, B.A.; Soluyanov, A.A. Z2Pack: Numerical implementation of hybrid Wannier centers for identifying topological materials. Phys. Rev. B 2017, 95, 064302. [Google Scholar] [CrossRef]
- Bennemann, K.H.; Ketterson, J.B. Superconductivity; Springer Science & Business Media: Berlin/Heidelberg, Germany, 2008. [Google Scholar]
- Mao, H.K.; Chen, X.J.; Ding, Y.; Li, B.; Wang, L. Solids, liquids, and gases under high pressure. Rev. Mod. Phys. 2018, 90, 015007. [Google Scholar] [CrossRef]
- Zhou, Y.; Dong, Z.-Y.; Hsieh, W.-P.; Goncharov, A.F.; Chen, X.-J. Thermal conductivity of materials under pressure. Nat. Rev. Phys. 2022, 4, 319–335. [Google Scholar] [CrossRef]
- Drozdov, A.P.; Kong, P.P.; Minkov, V.S.; Besedin, S.P.; Kuzovnikov, M.A.; Mozaffari, S.; Balicas, L.; Balakirev, F.F.; Graf, D.E.; Prakapenka, V.B.; et al. Superconductivity at 250 K in lanthanum hydride under high pressures. Nature 2019, 569, 528–531. [Google Scholar] [CrossRef]
- Kong, P.; Minkov, V.S.; Kuzovnikov, M.A.; Drozdov, A.P.; Besedin, S.P.; Mozaffari, S.; Balicas, L.; Balakirev, F.F.; Prakapenka, V.B.; Chariton, S.; et al. Superconductivity up to 243 K in the yttrium-hydrogen system under high pressure. Nat. Commun. 2021, 12, 5075. [Google Scholar] [CrossRef] [PubMed]
- Yu, Z.; Wang, L.; Hu, Q.; Zhao, J.; Yan, S.; Yang, K.; Sinogeikin, S.; Gu, G.; Mao, H.K. Structural phase transitions in Bi2Se3 under high pressure. Sci. Rep. 2015, 5, 15939. [Google Scholar] [CrossRef] [PubMed]
- Moriwaki, T.; Akahama, Y.; Kawamura, H.; Nakano, S.; Takemura, K. Structural Phase Transition of Rutile-Type MgH2 at High Pressures. J. Phys. Soc. Jpn. 2006, 75, 074603. [Google Scholar] [CrossRef]
- Sato, M.; Fujimoto, S. Topological phases of noncentrosymmetric superconductors: Edge states, Majorana fermions, and non-Abelian statistics. Phys. Rev. B 2009, 79, 094504. [Google Scholar] [CrossRef]
- Fujimoto, S. Topological order and non-Abelian statistics in noncentrosymmetrics-wave superconductors. Phys. Rev. B 2008, 77, 220501. [Google Scholar] [CrossRef]
- Pei, C.; Jin, S.; Huang, P.; Vymazalova, A.; Gao, L.; Zhao, Y.; Cao, W.; Li, C.; Nemes-Incze, P.; Chen, Y.; et al. Pressure-induced superconductivity and structure phase transition in Pt2HgSe3. Npj Quantum Mater. 2021, 6, 98. [Google Scholar] [CrossRef]
- Meisner, G.P.; Ku, H.C.; Barz, H. Superconducting equiatomic ternary transition metal arsenides. Mater. Res. Bull. 1983, 18, 983–991. [Google Scholar] [CrossRef]
- Hsieh, T.H.; Lin, H.; Liu, J.; Duan, W.; Bansil, A.; Fu, L. Topological crystalline insulators in the SnTe material class. Nat. Commun. 2012, 3, 982. [Google Scholar] [CrossRef]


| Pressure (GPa) | 0.3 | 0.9 | 2.1 | 6.0 | 13.5 | 17.1 | 24.0 | 29.8 |
|---|---|---|---|---|---|---|---|---|
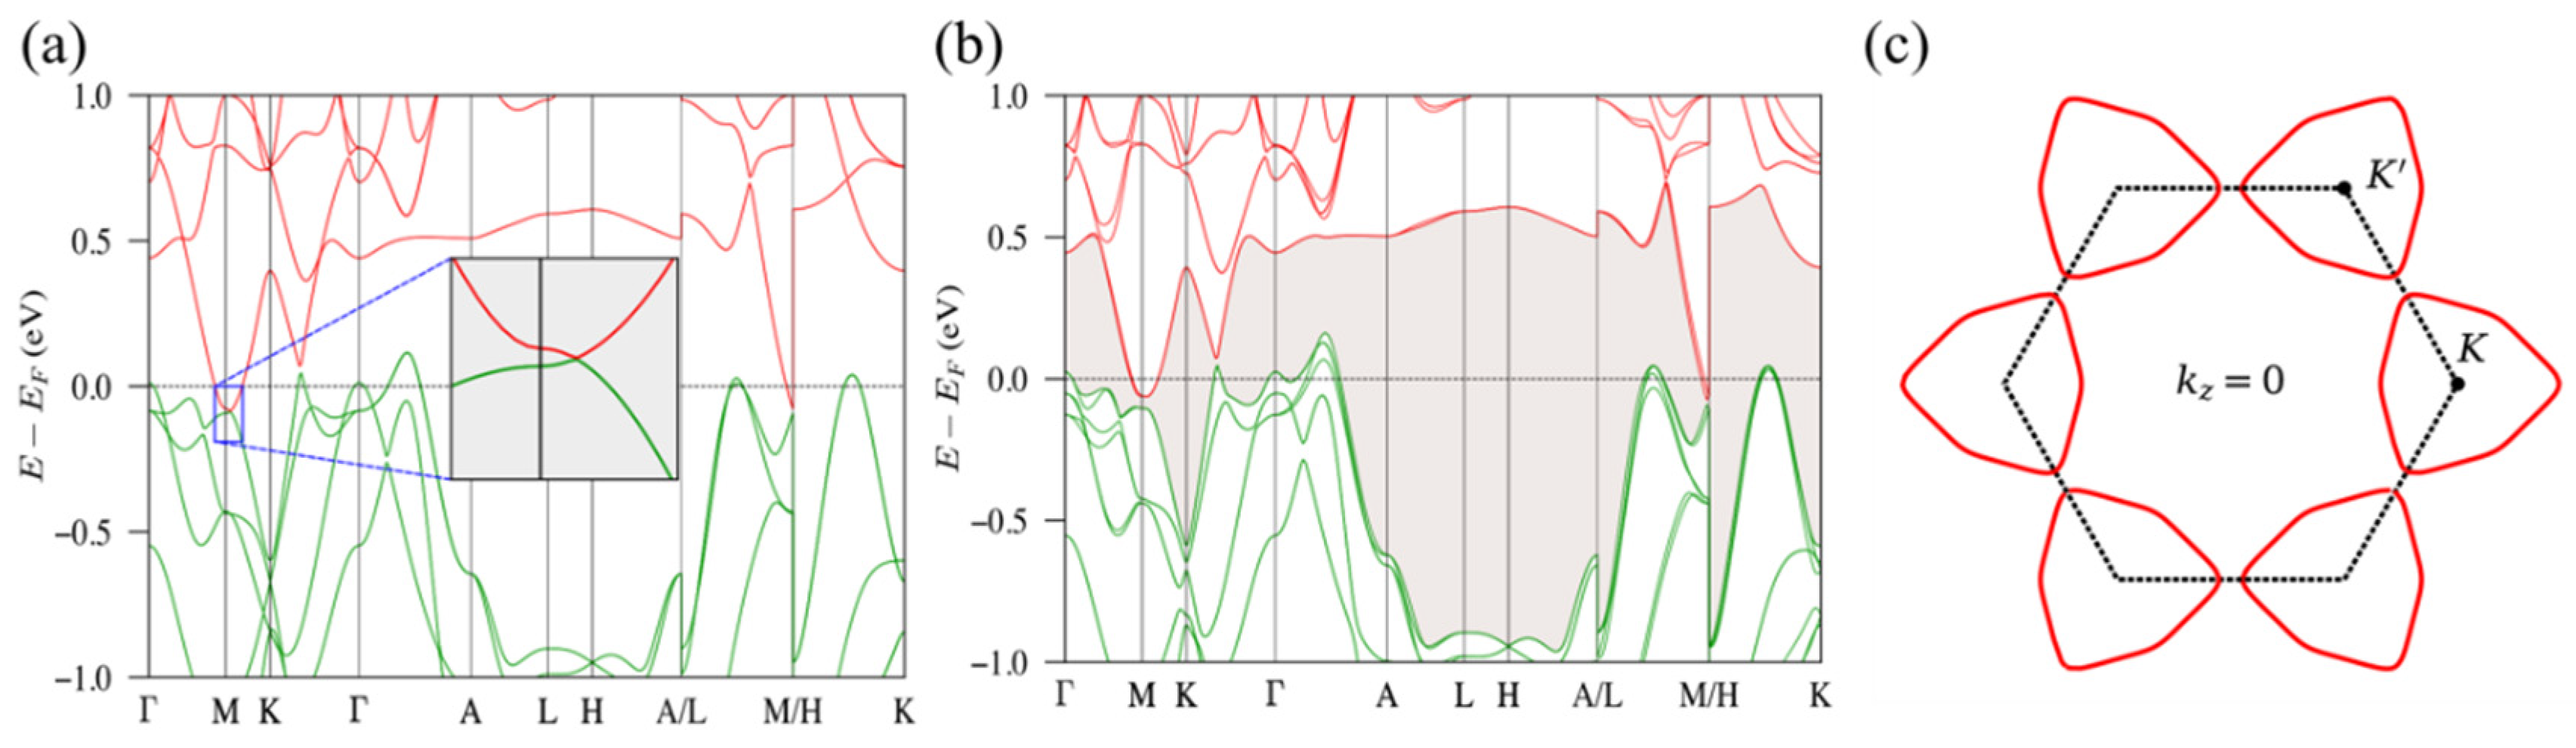
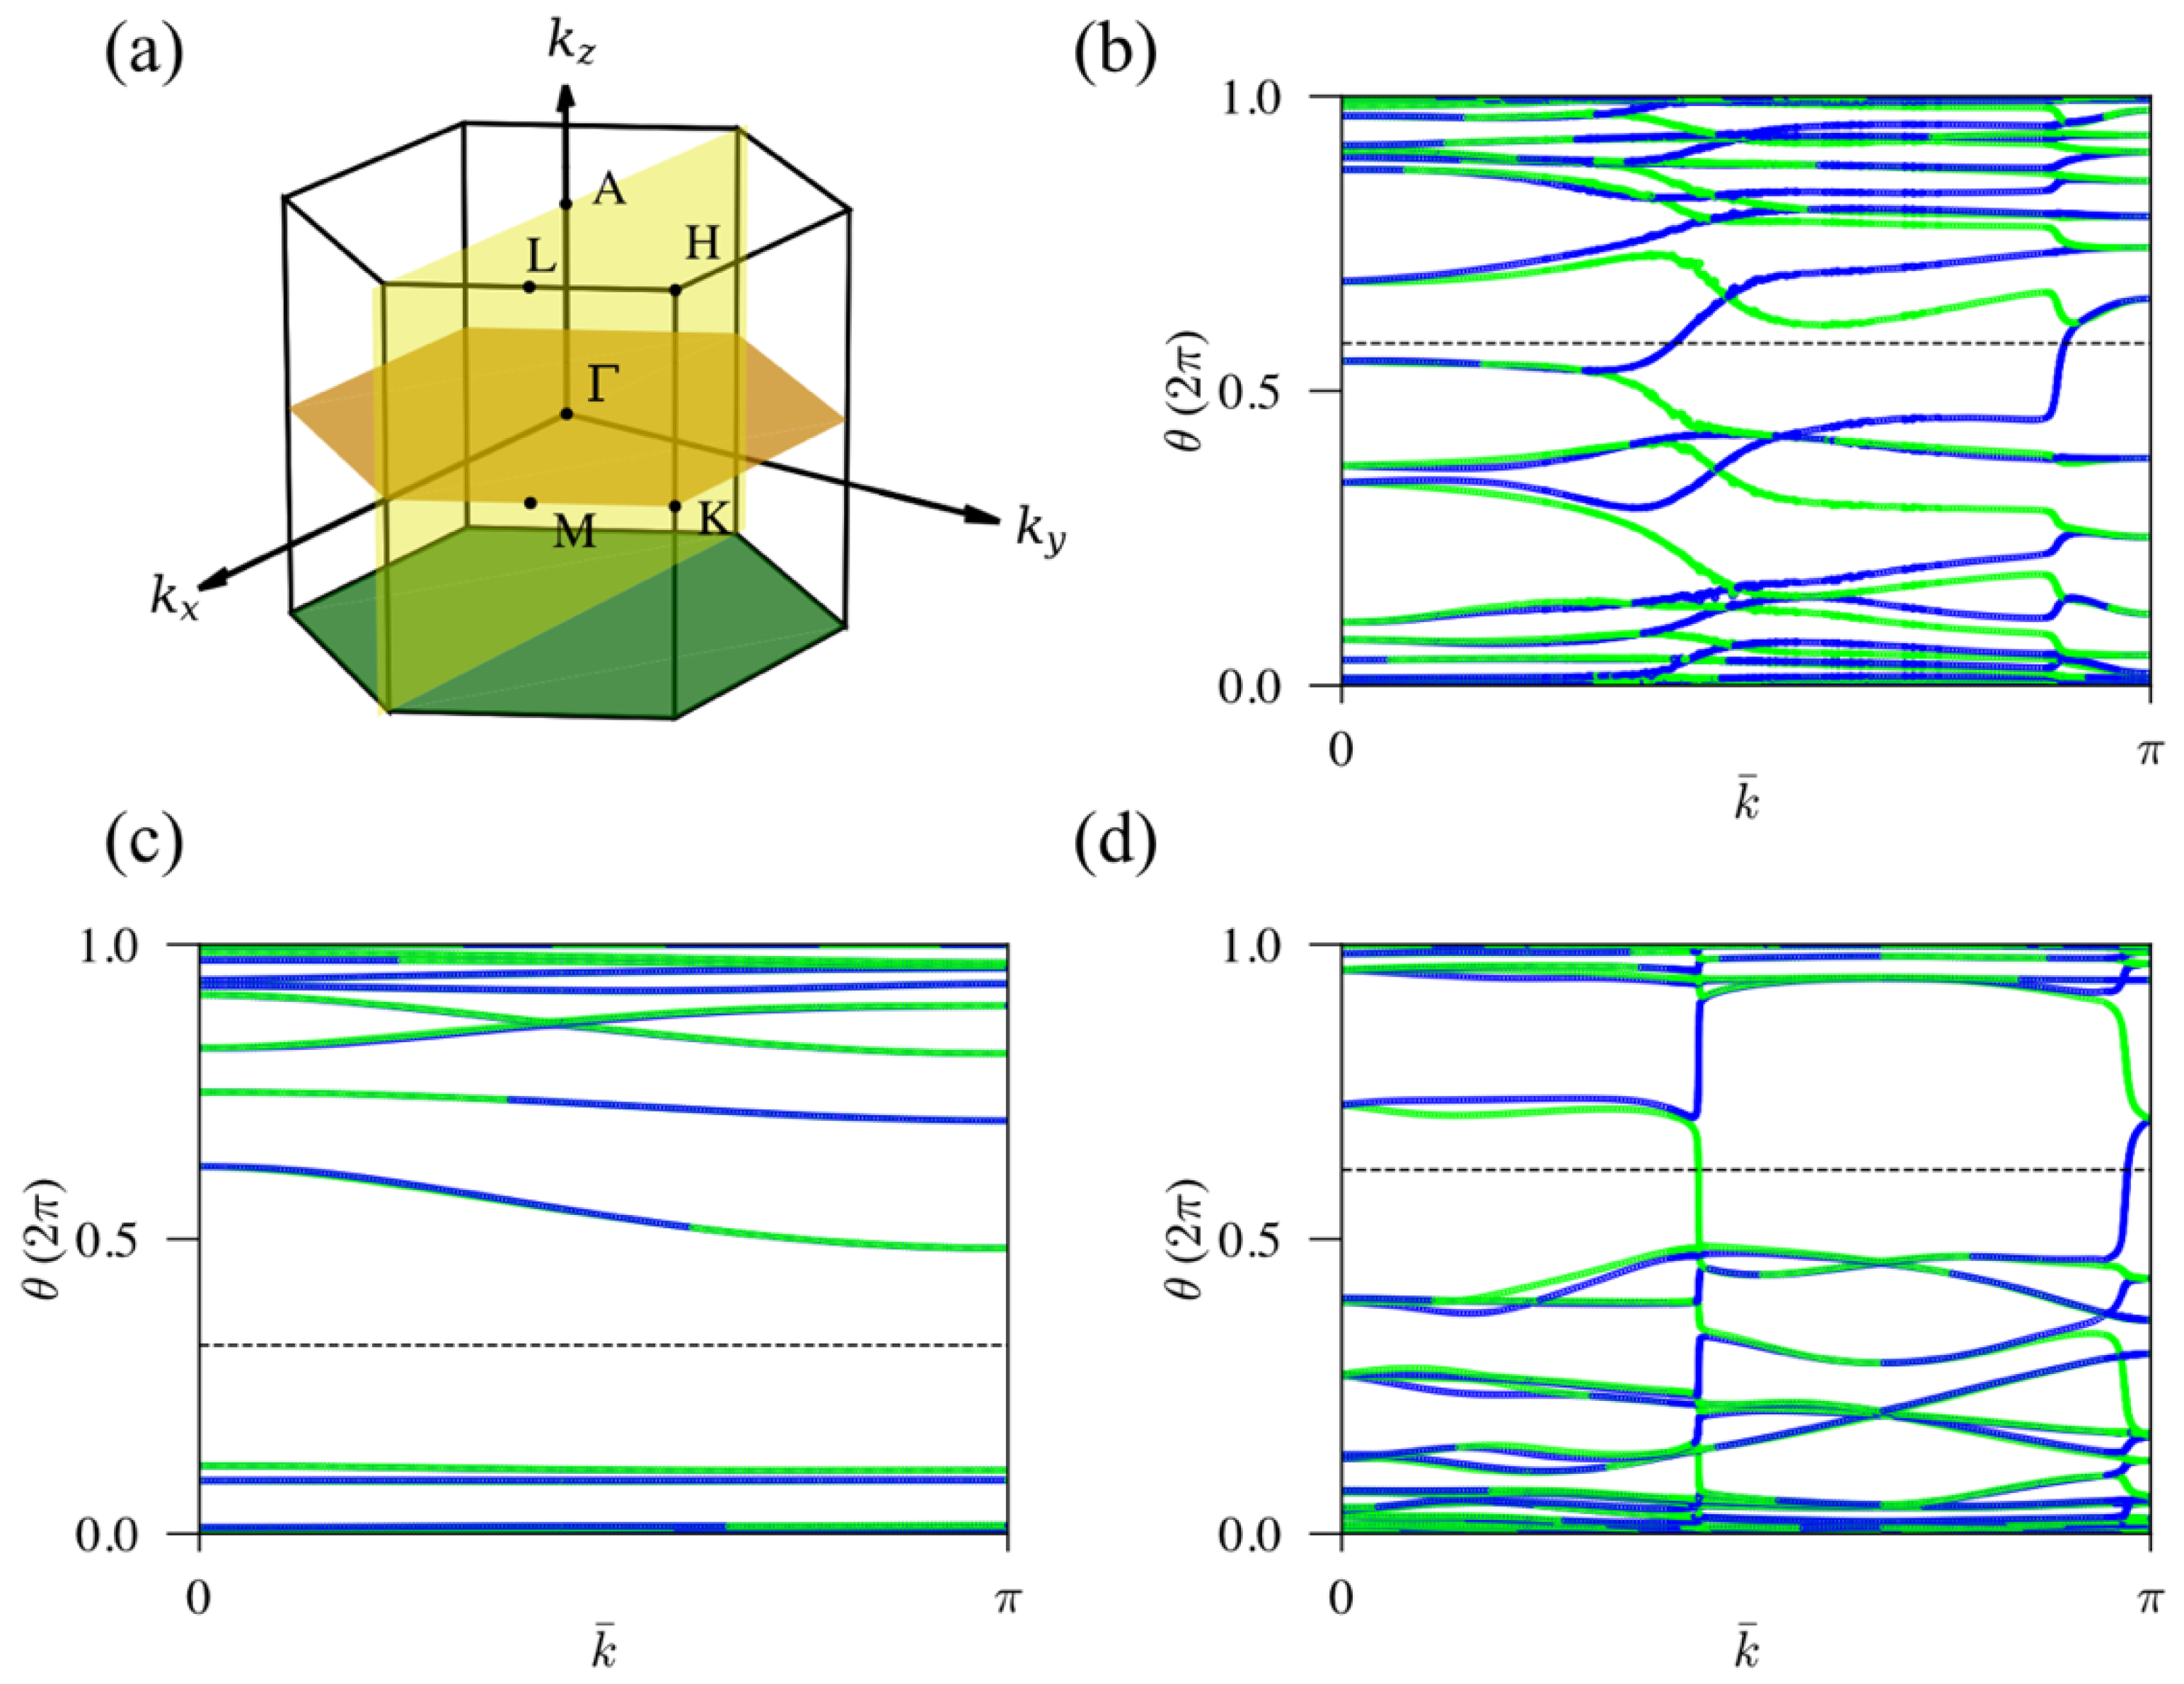
| CM (kz = 0) | 2 | −2 | 2 | −2 | 2 | 2 | 2 | 2 |
| CM (ky = 0) | 2 | −2 | −2 | 2 | 2 | −2 | −2 | −2 |
Publisher’s Note: MDPI stays neutral with regard to jurisdictional claims in published maps and institutional affiliations. |
© 2022 by the authors. Licensee MDPI, Basel, Switzerland. This article is an open access article distributed under the terms and conditions of the Creative Commons Attribution (CC BY) license (https://creativecommons.org/licenses/by/4.0/).
Share and Cite
Li, C.; Su, Y.; Zhang, C.; Pei, C.; Cao, W.; Wang, Q.; Zhao, Y.; Gao, L.; Zhu, S.; Zhang, M.; et al. Pressure-Tuning Superconductivity in Noncentrosymmetric Topological Materials ZrRuAs. Materials 2022, 15, 7694. https://doi.org/10.3390/ma15217694
Li C, Su Y, Zhang C, Pei C, Cao W, Wang Q, Zhao Y, Gao L, Zhu S, Zhang M, et al. Pressure-Tuning Superconductivity in Noncentrosymmetric Topological Materials ZrRuAs. Materials. 2022; 15(21):7694. https://doi.org/10.3390/ma15217694
Chicago/Turabian StyleLi, Changhua, Yunlong Su, Cuiwei Zhang, Cuiying Pei, Weizheng Cao, Qi Wang, Yi Zhao, Lingling Gao, Shihao Zhu, Mingxin Zhang, and et al. 2022. "Pressure-Tuning Superconductivity in Noncentrosymmetric Topological Materials ZrRuAs" Materials 15, no. 21: 7694. https://doi.org/10.3390/ma15217694
APA StyleLi, C., Su, Y., Zhang, C., Pei, C., Cao, W., Wang, Q., Zhao, Y., Gao, L., Zhu, S., Zhang, M., Chen, Y., Shi, Y., Li, G., & Qi, Y. (2022). Pressure-Tuning Superconductivity in Noncentrosymmetric Topological Materials ZrRuAs. Materials, 15(21), 7694. https://doi.org/10.3390/ma15217694