
Monotonic and Creep Studies on the Pull-Through Resistance of Laminated Glass with Locally Embedded Steel Mesh


Abstract
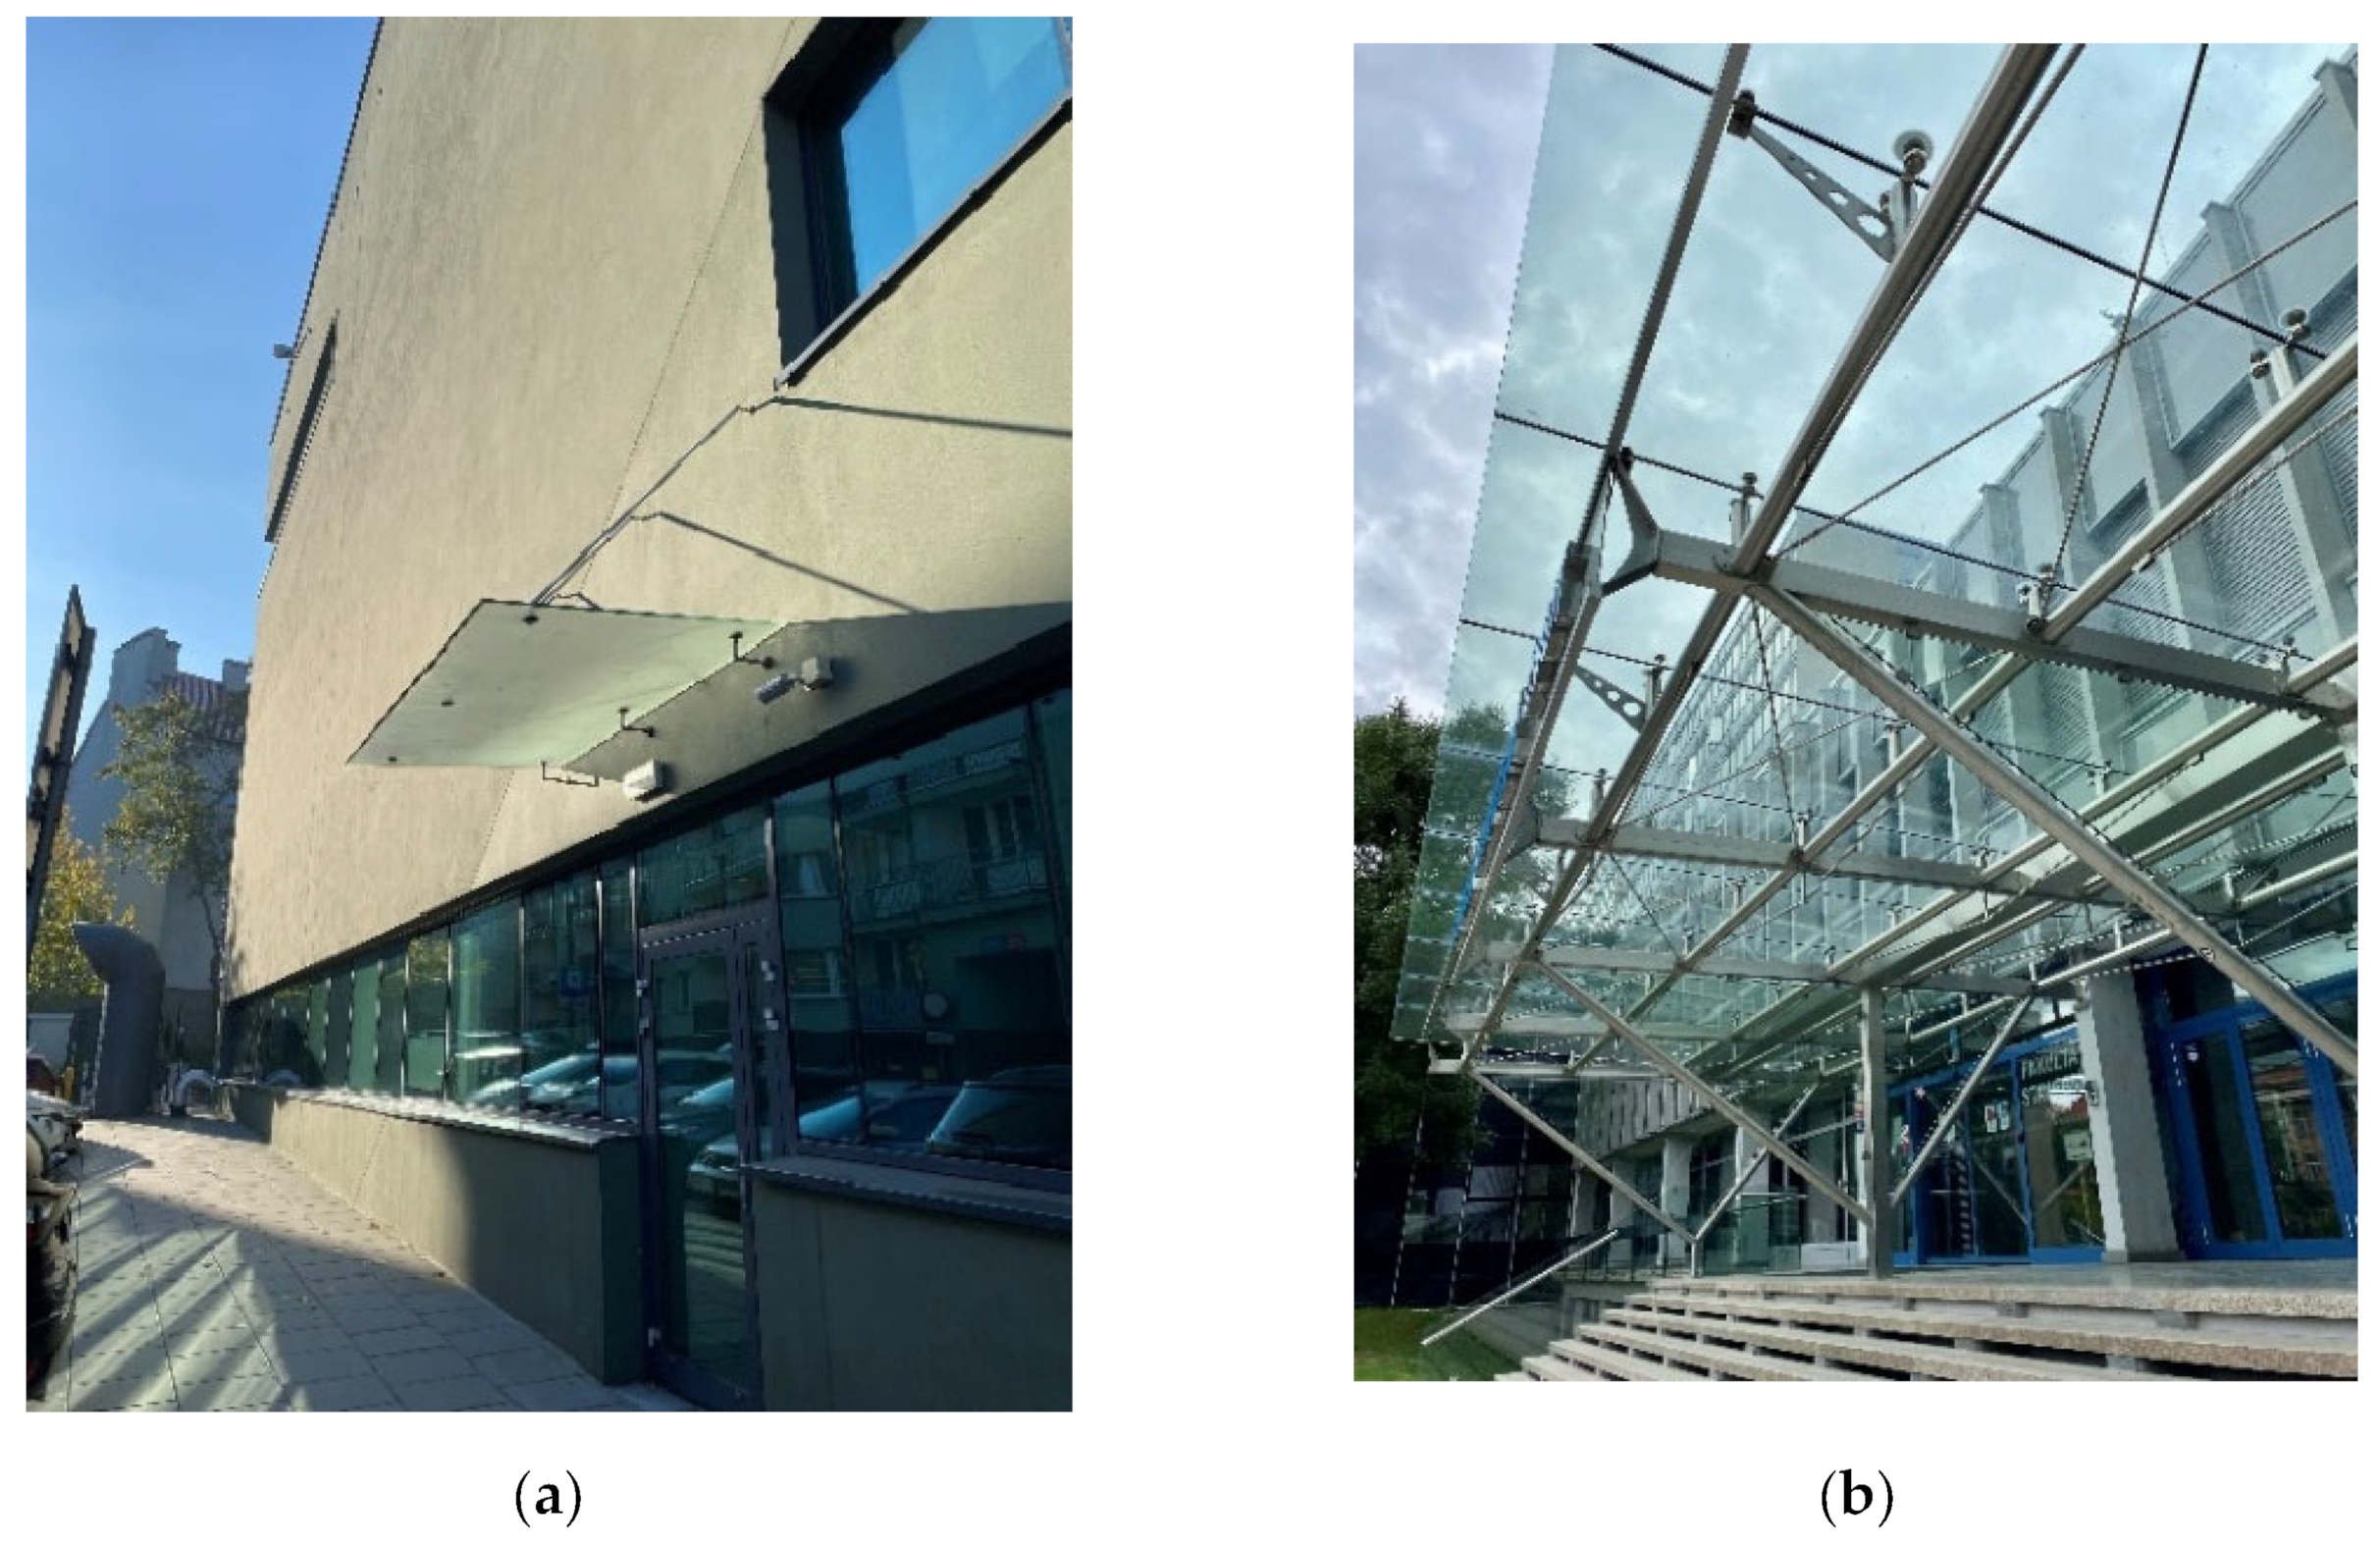
1. Introduction
2. Materials and Methods
2.1. Materials
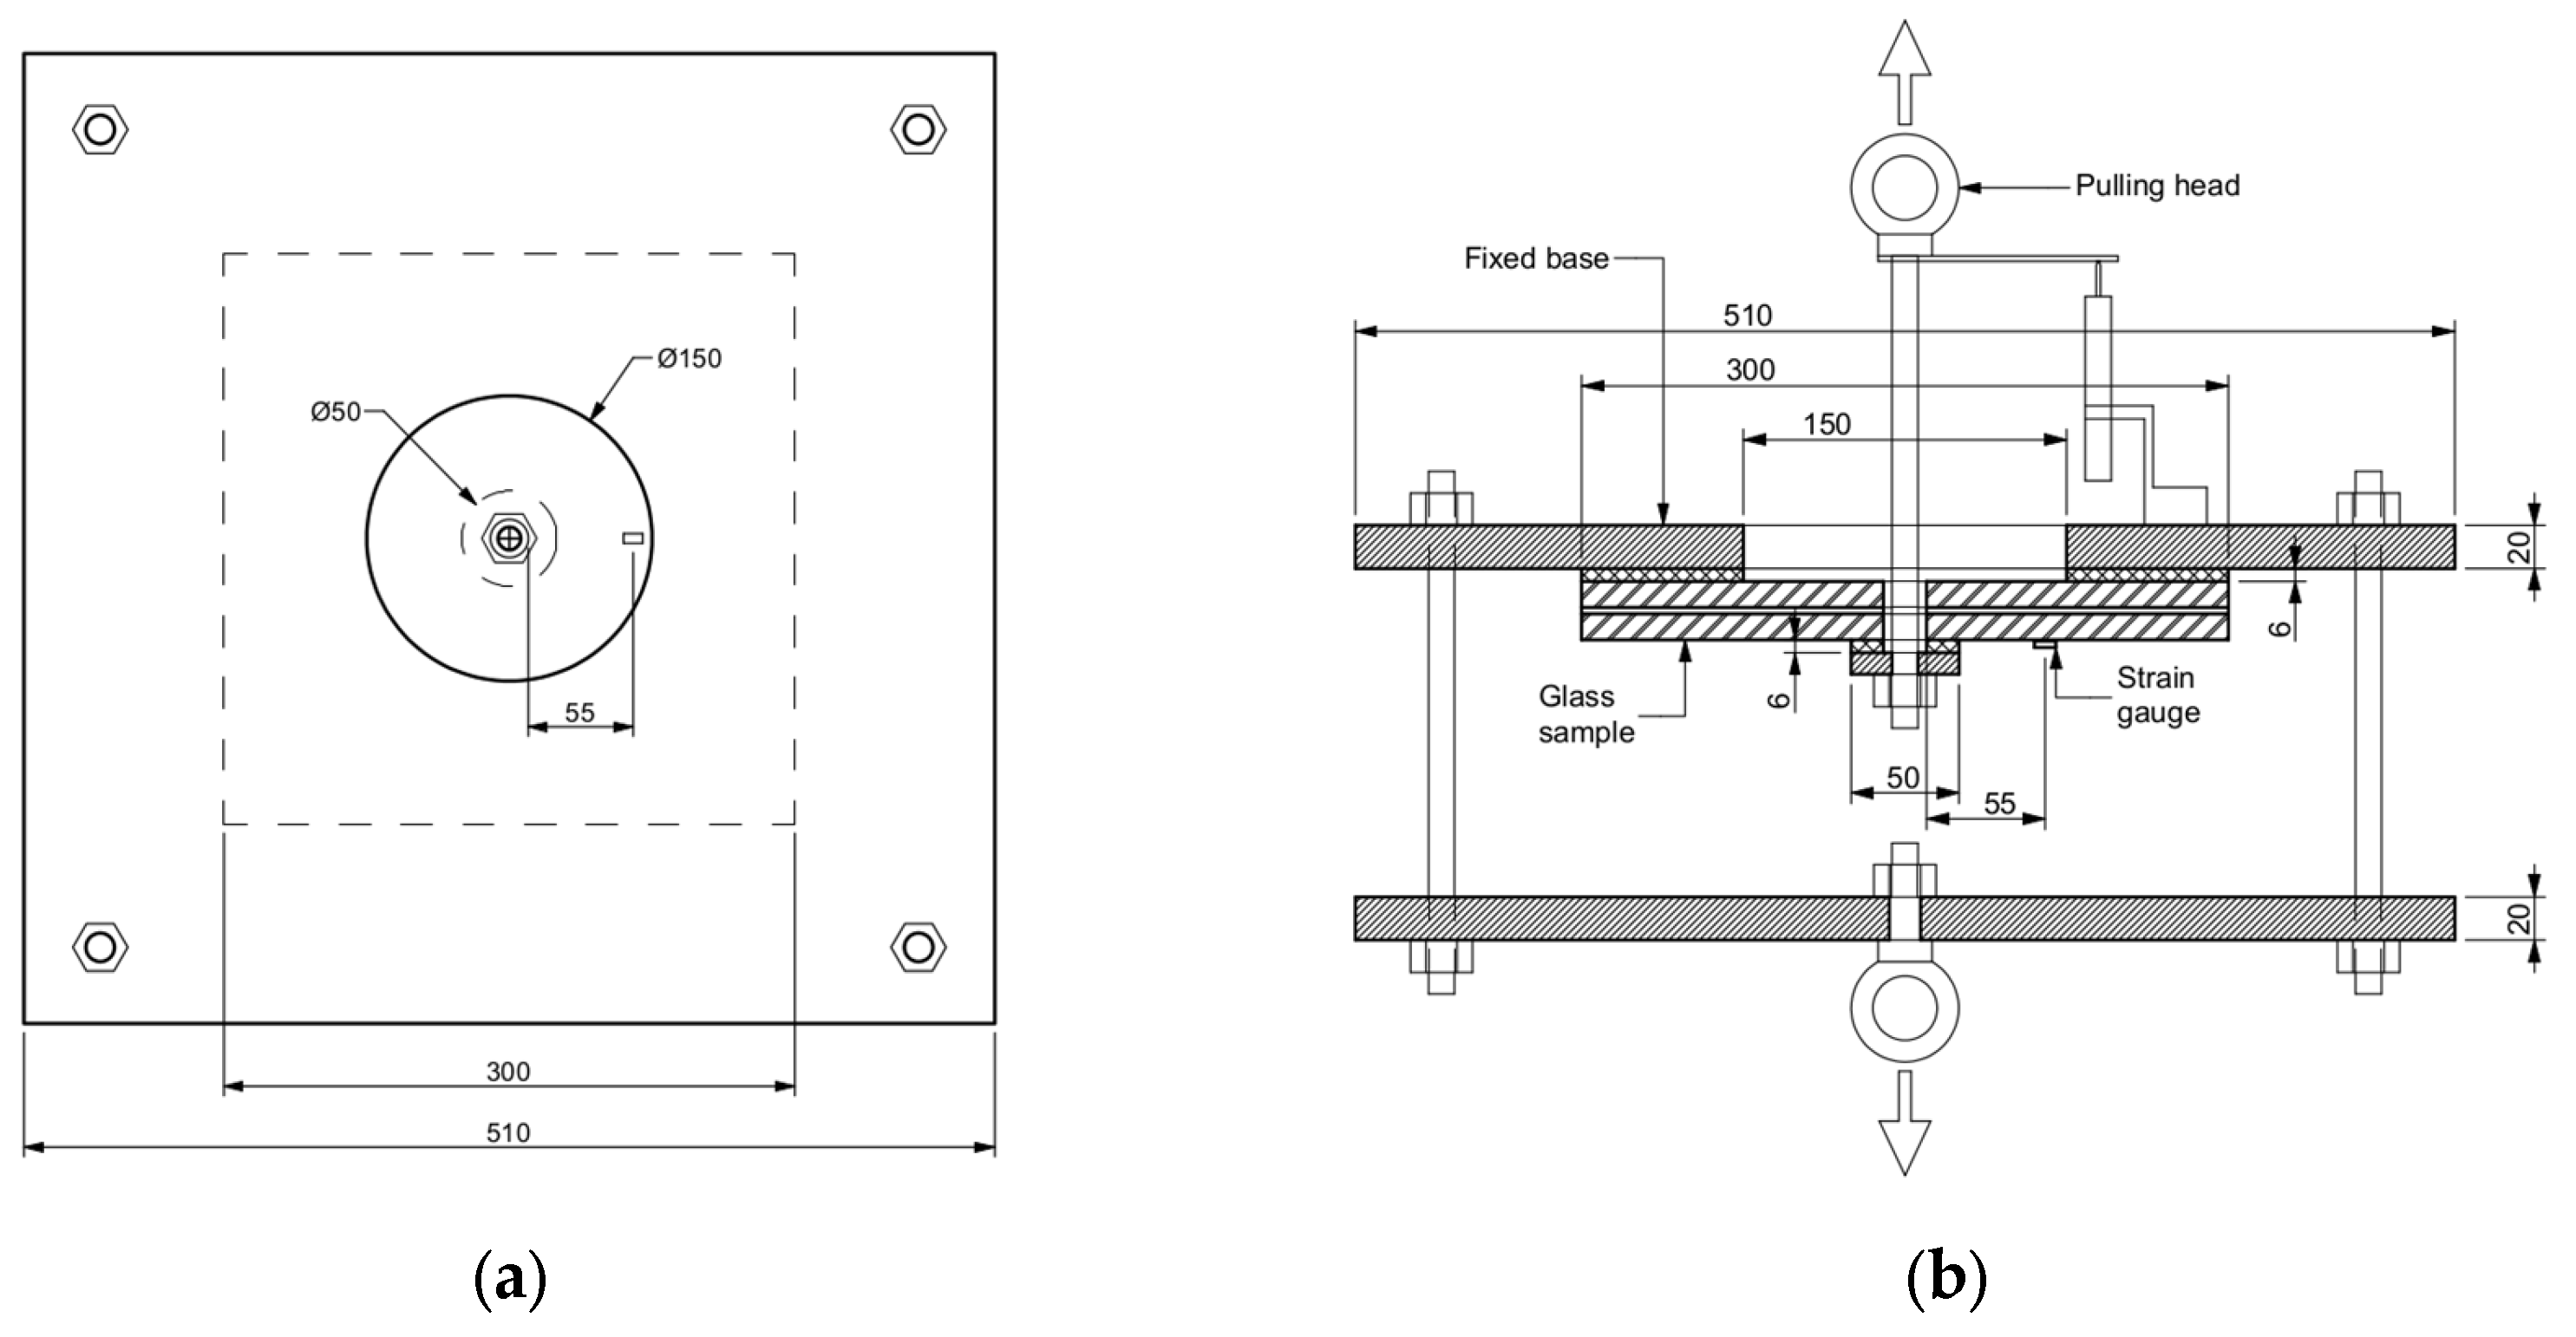
2.2. Test Specimens and Test Setup
2.3. Experiments
2.3.1. Monotonic Loading
2.3.2. Creep Test
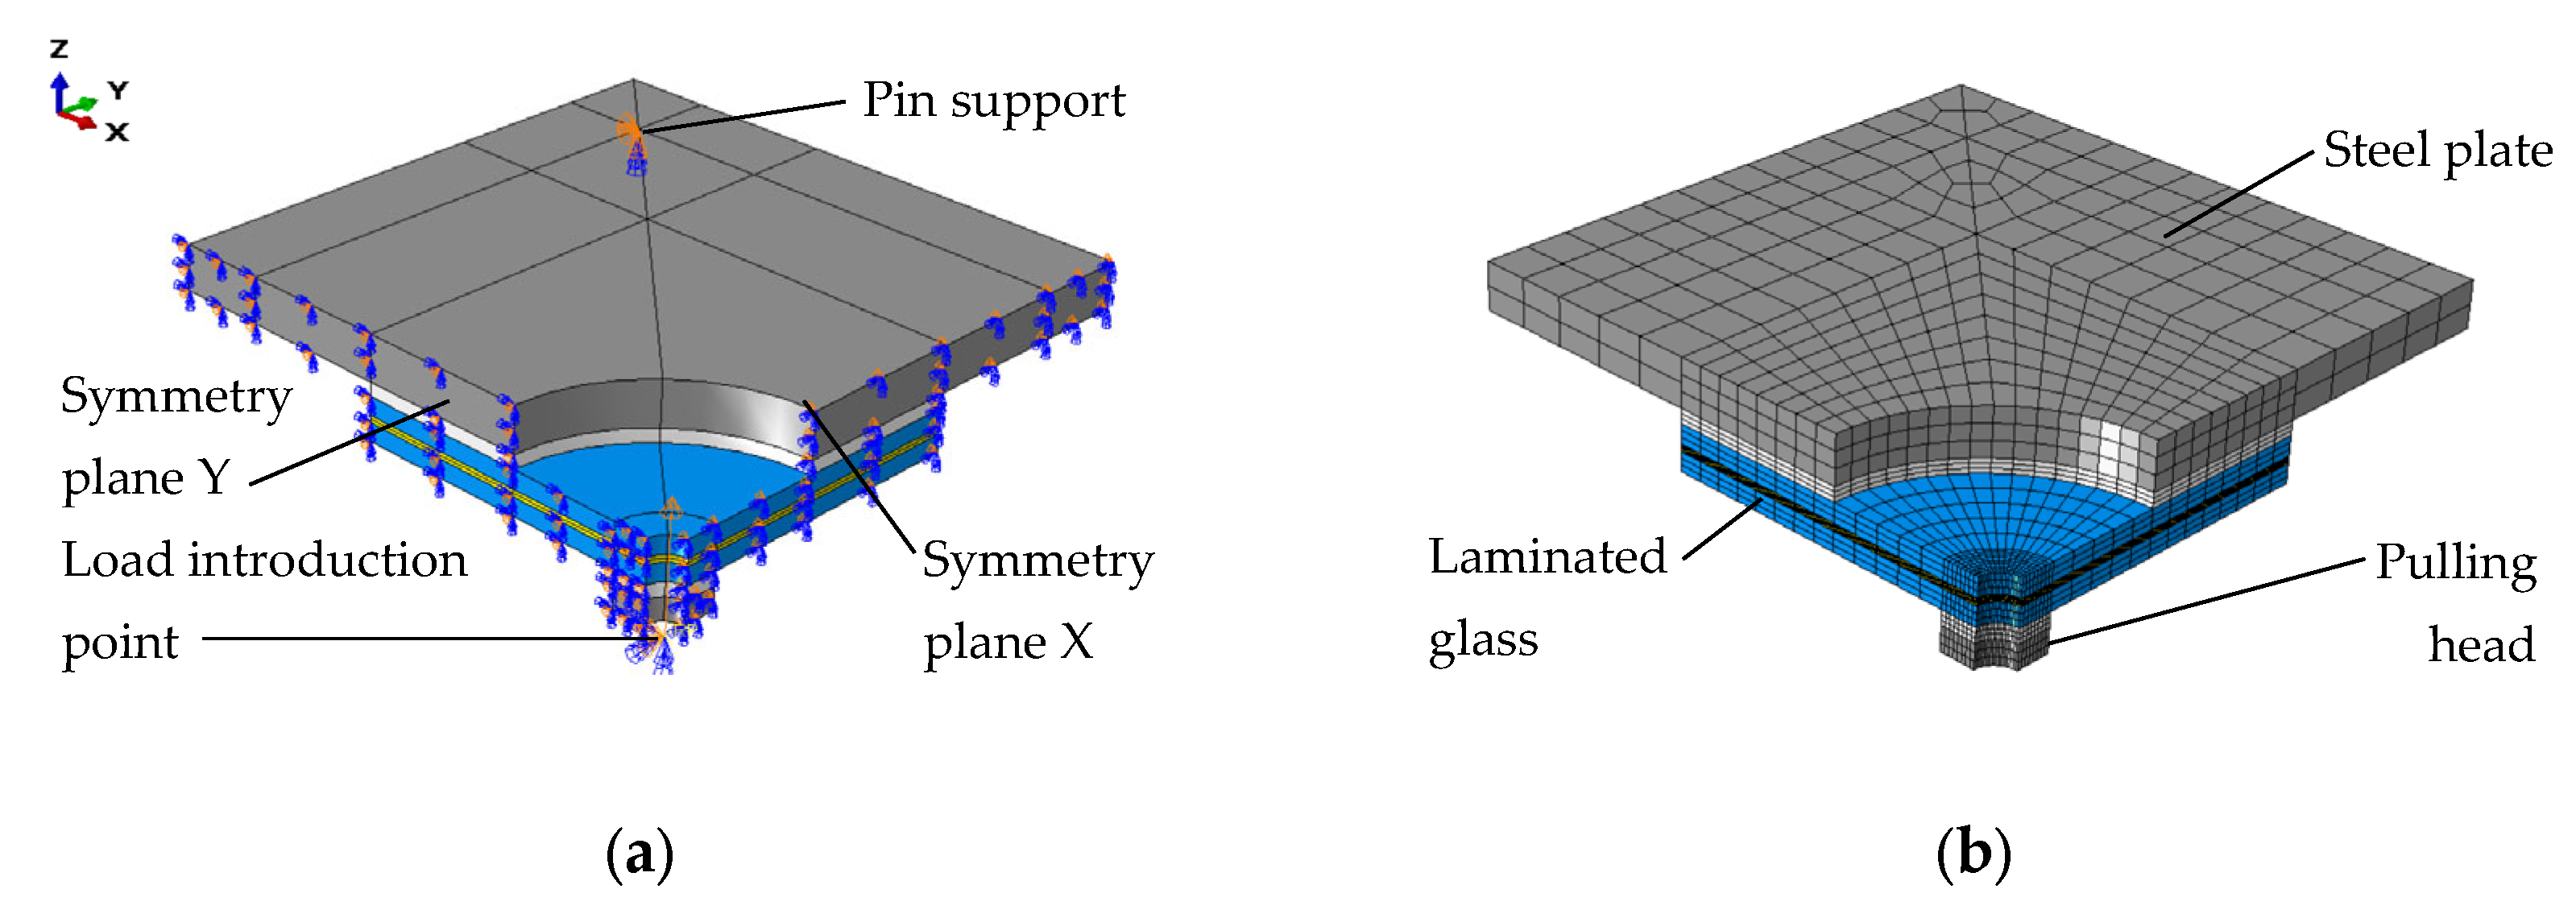
2.4. Numerical Modelling
3. Results and Discussion
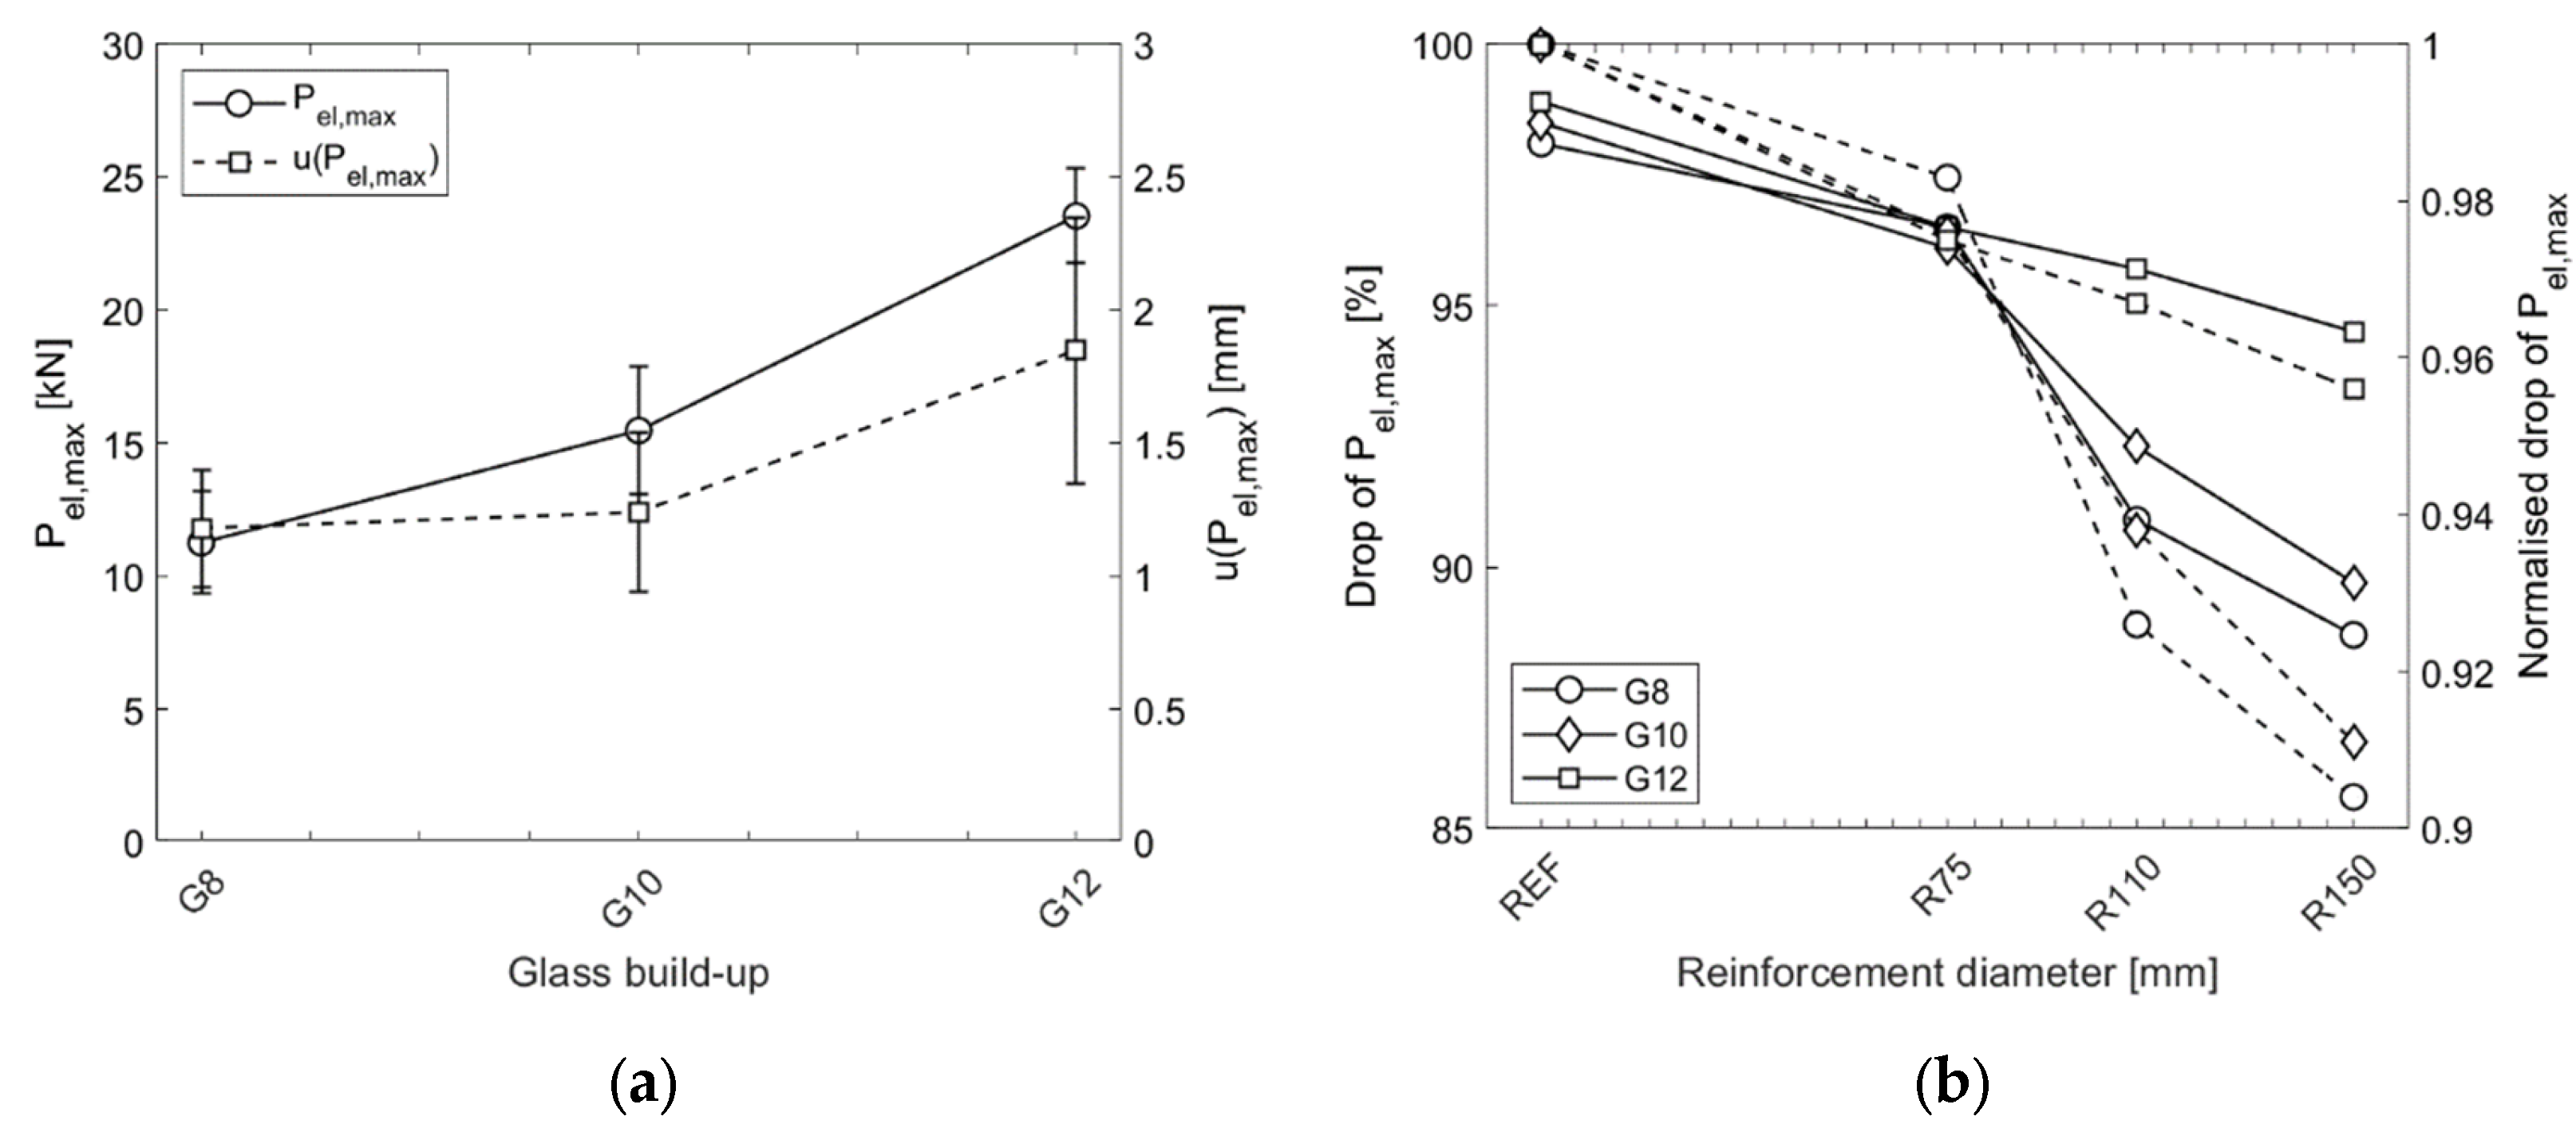
3.1. Monotonic Loading
3.2. Creep Test
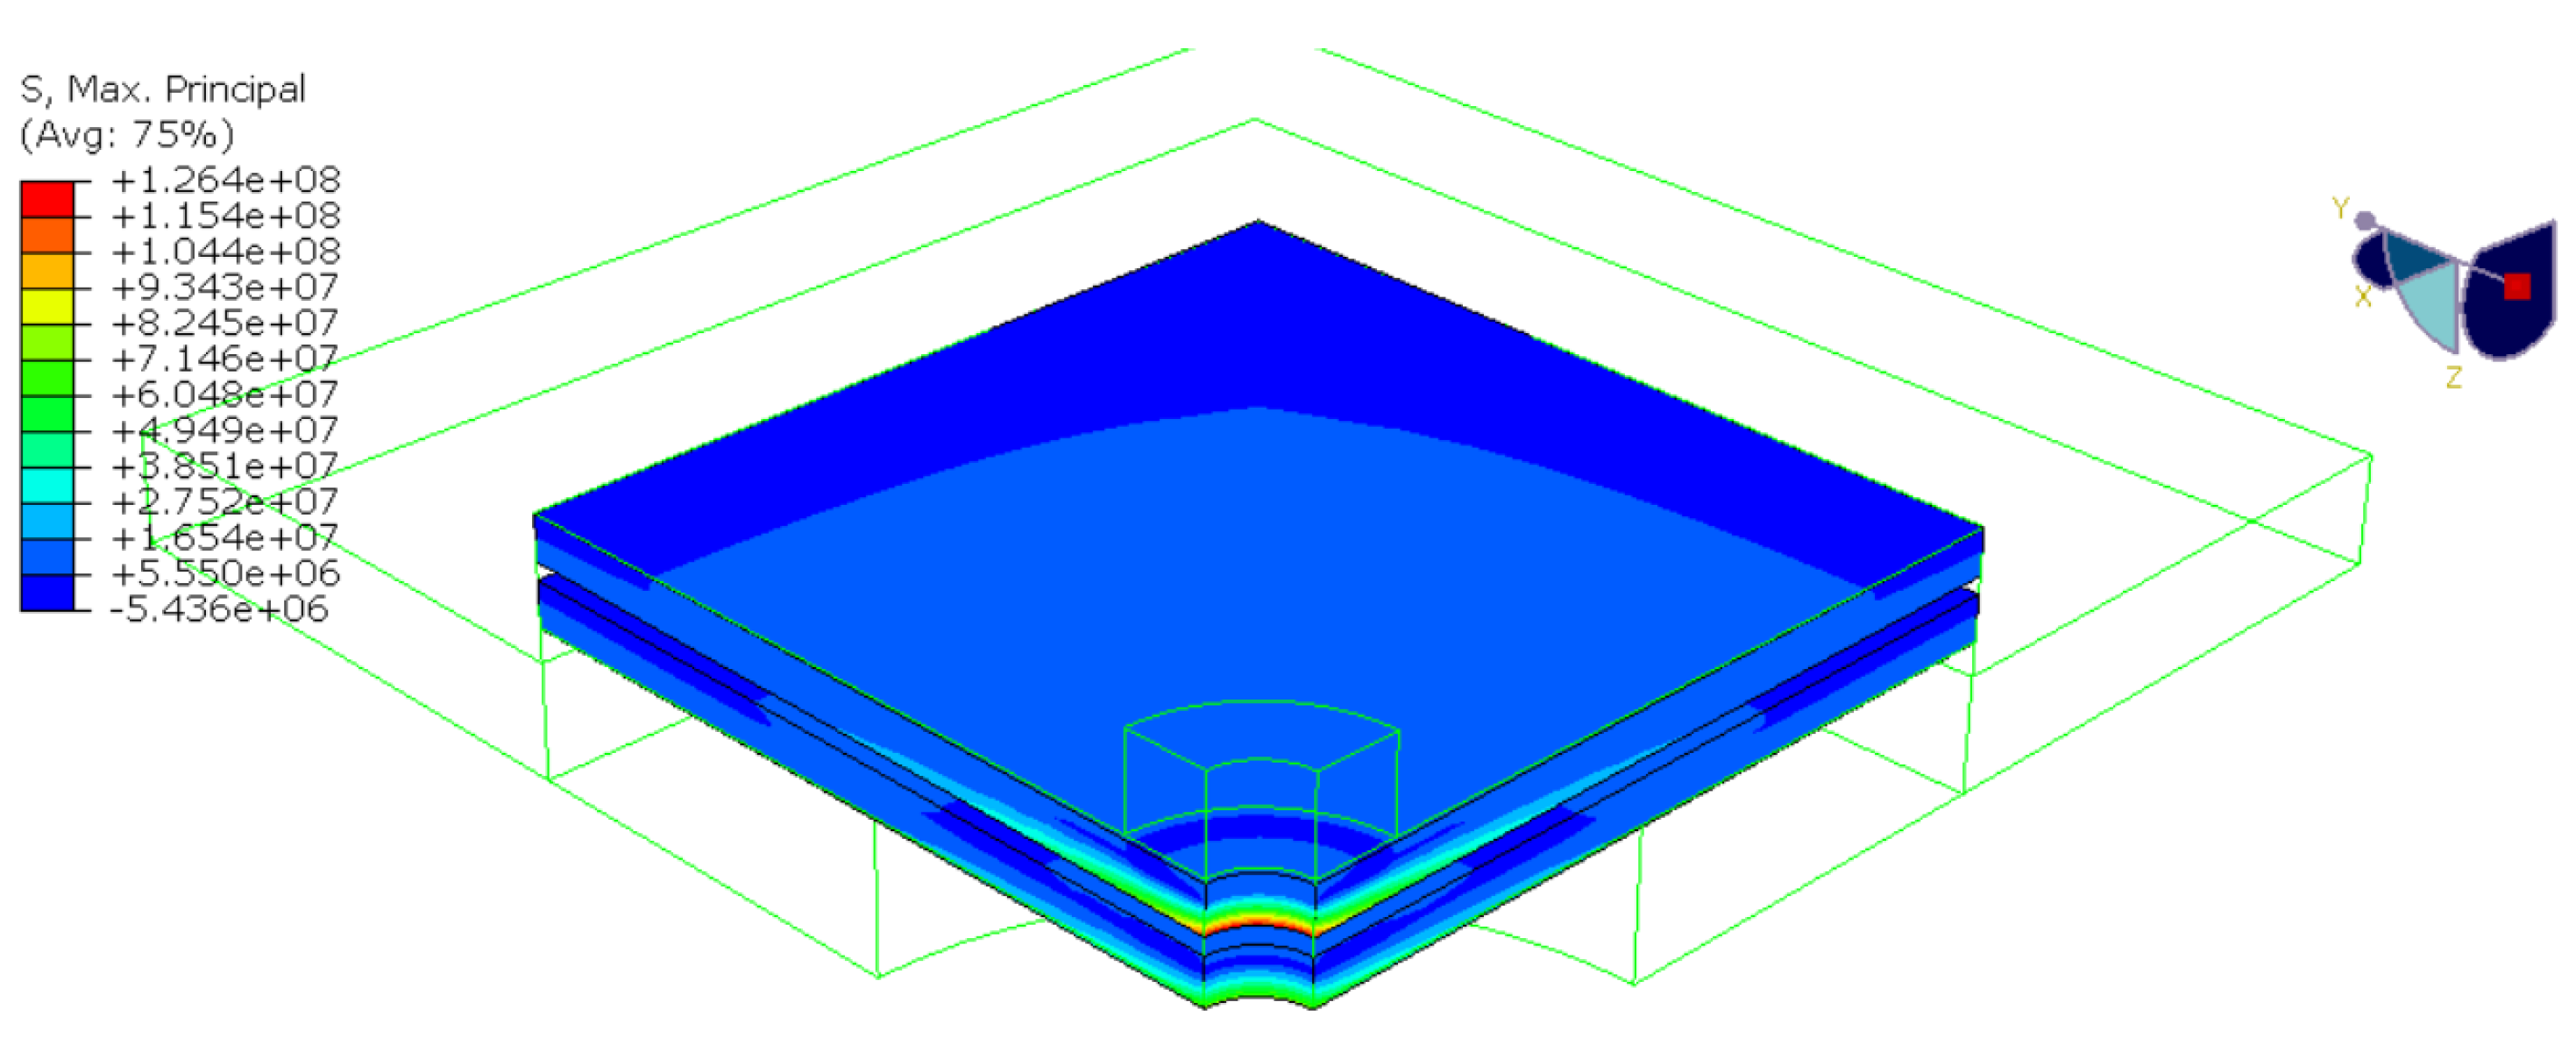
3.3. Numerical Modelling
4. Conclusions
- Regarding the monotonic loading experiment, the load increase after glass breakage was observed for all specimens; however, the reinforced specimens with embedded steel mesh showed significantly improved post-breakage capacity. It was found that the local reinforcement in the direct vicinity of the hole in glass increased the post-breakage strength by 46.3%, 102.6%, and 156.2% for the reinforcement diameters of 75 mm, 110 mm, and 150 mm, respectively. All samples failed at the average value of 63.63 ± 0.91 mm, indicating that the ultimate failure is related to the damage to the interlayer rather than the reinforcing mesh.
- The creep study found that the reinforcing mesh significantly increased the time to failure. This was especially valid for the smallest mesh (75 mm in diameter), in which the time to failure was increased by a factor of 6.5.
Author Contributions
Funding
Institutional Review Board Statement
Informed Consent Statement
Data Availability Statement
Acknowledgments
Conflicts of Interest
References
- Wurm, J. Glass Structures: Design and Construction of Self-Supporting Skins; Birkhauser: Basel, Switzerland, 2007. [Google Scholar]
- O’Regan, C. Structural Use of Glass in Buildings; IStructE Ltd.: London, UK, 2014. [Google Scholar]
- Coult, G.; Overend, M. Developments in Structural Glass; The Institution of Structural Engineers: London, UK, 2022. [Google Scholar]
- Haldimann, M.; Luible, A.; Overend, M. Structural Use of Glass; International Association for Bridge and Structural Engineering: Zürich, Switzerland, 2008. [Google Scholar]
- Belis, J.; Louter, C.; Nielsen, J.H.; Schneider, J. Architectural Glass. In Springer Handbook of Glass; Springer Handbooks Series; Musgraves, J.D., Hu, J., Calvez, L., Eds.; Springer: Berlin/Heidelberg, Germany, 2019. [Google Scholar]
- Feldmann, M.; Di Biase, P. The CEN-TS Structuralal Glass—Design and Construction Rules as pre-standard for the Eurocode. In Proceedings of the Engineering Transparency, Duesseldorf, Germany, 23–26 October 2018; pp. 90–98. [Google Scholar]
- CEN/TS 19100-1; Design of Glass Structures—Part 1: Basis of Design and Materials. CEN: Brussels, Belgium, 2021.
- CEN/TS 19100-2; Design of Glass Structures—Part 2: Design of Out-of-Plane Loaded Glass Components. CEN: Brussels, Belgium, 2021.
- Biolzi, L.; Cattaneoa, S.; Orlandob, M.; Piscitellic, L.R.; Spinelli, P. Constitutive relationships of different interlayer materials for laminated glass. Compos. Struct. 2020, 244, 112221. [Google Scholar] [CrossRef]
- Biolzi, L.; Cattaneo, S.; Simoncelli, M. Post-failure behavior of 2-ply laminated glass plates with different interlayers. Eng. Fract. Mech. 2022, 268, 108496. [Google Scholar] [CrossRef]
- Foraboschi, P. Optimal design of glass plates loaded transversally. Mater. Des. 2014, 62, 443–458. [Google Scholar] [CrossRef]
- Biolzi, L.; Casolo, S.; Orlandob, M.; Tateo, V. Modelling the response of a laminated tempered glass for different configurations of damage by a rigid body spring model. Eng. Fract. Mech. 2019, 218, 106596. [Google Scholar] [CrossRef]
- Chen, J.; Xu, J.; Yao, X.; Xu, X.; Liu, B.; Li, Y. Different driving mechanisms of in-plane cracking on two brittle layers of laminated glass. Int. J. Impact Eng. 2014, 69, 80–85. [Google Scholar] [CrossRef]
- Vedrtnam, A.; Pawar, S.J. Laminated plate theories and fracture of laminated glass plate—A review. Eng. Fract. Mech. 2017, 186, 316–330. [Google Scholar] [CrossRef]
- Bennison, S.J.; Stelzer, I.; Davies, P.S.; Sloan, J.G.; Xiaokun, H.; Gang, L. Calculation methods for the structural behavior of laminated glass. Glass Perform. Days 2009, 433–434. [Google Scholar]
- Baraldi, D.; Cecchi, A.; Foraboschi, P. Broken tempered laminated glass: Non-linear discrete element modelling. Compos. Struct. 2016, 140, 278–295. [Google Scholar] [CrossRef]
- Wang, X.; Yang, J.; Pan, Z.; Wang, F.; Meng, Y.; Zhu, Y. Exploratory investigation into the post-fracture model of laminated tempered glass using combined Voronoi-FDEM approach. Int. J. Mech. Sci. 2021, 19, 105989. [Google Scholar] [CrossRef]
- Bedon, C.; Santarsiero, M. Transparency in structural glass systems via mechanical, adhesive and laminated point fixings. Adv. Eng. Mater. 2018, 20, 1700815. [Google Scholar] [CrossRef]
- Kozłowski, M.; Zemła, K.; Kosmal, M.; Kopyłow, O. Experimental and FE Study on Impact Strength of Toughened Glass–Retrospective Approach. Materials 2021, 14, 7658. [Google Scholar] [CrossRef]
- Vyzantiadou, M.A.; Avdelas, A.V. Point fixed glazing systems: Technological and morphological aspects. J. Constr. Steel Res. 2004, 60, 1227–1240. [Google Scholar] [CrossRef]
- Sivanerupan, S.; Wilson, J.; Gad, E.; Lam, N. Analytical study of point fixed glass façade systems under monotonic in-plane loading. Adv. Struct. Eng. 2016, 19, 611–626. [Google Scholar] [CrossRef]
- Cervio, M.; Muciaccia, G.; Rosati, G. Tension–shear interaction domain for EVA-laminated countersunk point-fixing devices. Glass Struct. Eng. 2018, 3, 77–86. [Google Scholar] [CrossRef]
- Quaglini, V.; Cattaneo, S.; Biolzi, L. Numerical assessment of laminated cantilevered glass plates with point fixings. Glass Struct. Eng. 2020, 5, 187–204. [Google Scholar] [CrossRef]
- Zdražilová, M.; Sokol, Z.; Eliášová, M. Tests of Glass Insulating Panels with Embedded Laminated Point Connections. Int. J. Struct. Glass Adv. Mater. Res. 2022, 6, 8–14. [Google Scholar] [CrossRef]
- Stelzer, I.; Singh Rooprai, M. Post Breakage Strength Testing for Overhead Laminated Glass. In Proceedings of the Challenging Glass 5—Conference on Architectural and Structural Applications of Glass, Ghent University, Ghent, Belgium, 16–17 June 2016. [Google Scholar]
- Ølgaard, A.B.; Nielsen, J.H.; Olesen, J.F. Design of Mechanically Reinforced Glass Beams: Modelling and Experiments. Struct. Eng. Int. 2009, 19, 30–136. [Google Scholar] [CrossRef]
- Kozłowski, M.; Serrano, E.; Enquist, B. Experimental investigation on timber-glass composite i-beams. In Proceedings of the Challenging Glass 4 and COST Action TU0905 Final Conference, Lausanne, Switzerland, 6–7 February 2014; pp. 261–268. [Google Scholar]
- Kozłowski, M.; Dorn, M.; Serrano, E. Experimental testing of load-bearing timber–glass composite shear walls and beams. Wood Mater. Sci. Eng. 2015, 10, 276–286. [Google Scholar] [CrossRef]
- Kozłowski, M.; Kadela, M.; Hulimka, J. Numerical Investigation of Structural Behaviour of Timber-Glass Composite Beams. Proc. Eng. 2016, 161, 990–1000. [Google Scholar] [CrossRef]
- Bedon, C.; Louter, C. Structural glass beams with embedded GFRP, CFRP or steel reinforcement rods: Comparative experimental, analytical and numerical investigations. J. Build. Eng. 2019, 22, 227–241. [Google Scholar] [CrossRef]
- Corradi, M.; Speranzini, E. Post-Cracking Capacity of Glass Beams Reinforced with Steel Fibers. Materials 2019, 12, 231. [Google Scholar] [CrossRef]
- Bedon, C.; Rajčić, V. Textiles and Fabrics for Enhanced Structural Glass Facades: Potentials and Challenges. Buildings 2019, 9, 156. [Google Scholar] [CrossRef]
- Achintha, M.; Balan, B. Characterisation of the mechanical behaviour of annealed glass–GFRP hybrid beams. Constr. Build. Mater. 2017, 147, 174–184. [Google Scholar] [CrossRef]
- Achintha, M.; Bessonov, M. A novel design concept for connections in glass: Structural integrity of glass reinforced with externally–bonded GFRP laminates. In Proceedings of the IABSE Conference, International Association for Bridge and Structural Engineering, Bath, UK, 19–20 April 2017; pp. 45–46. [Google Scholar]
- Achintha, M.; Zirbo, T. Developments in GFRP reinforced bolted joints in glass. In Proceedings of the Challenging Glass 6 Conference on Architectural and Structural Applications of Glass, Delft, The Netherlands, 17–18 May 2018. [Google Scholar]
- Martín, M.; Centelles, X.; Solé, A.; Barreneche, C.; Inés Fernández, A.; Cabeza, L.F. Polymeric interlayer materials for laminated glass: A review. Constr. Build. Mater. 2020, 230, 116897. [Google Scholar] [CrossRef]
- EN 1993-1-1:2008; Eurocode 3: Design of Steel Structures—Part 1-1: General Rules and Rules for Buildings. CEN: Brussels, Belgium, 2020.
- EAD 090062-00-0404; Kits for External Wall Claddings Mechanically Fixed—European Assessment Document. EOTA: Brussels, Belgium, 2018.
- Dassault Systems. ABAQUS, v. 6.14. Computer Software and Online Documentation. Dassault Systems: Providence, RI, USA, 2018. [Google Scholar]
- Blau, P.J. Friction Science and Technology from Concepts to Applications; CRC Press: Boca Raton, FL, USA, 2009. [Google Scholar]
- EN 16612:2020; Glass in Building—Determination of the Lateral Load Resistance of Glass Panes by Calculation. CEN: Brussels, Belgium, 2020.
- Murray, G.; White, C.V.; Weise, W. Introduction to Engineering Materials; CRC Press: Boca Raton, FL, USA, 2007. [Google Scholar]
- SJ-MEPLA. Available online: https://www.mepla.net/en/download (accessed on 11 August 2022).
- Sanders, K.; Bos, F.; ten Brincke, E.; Belis, J. Edge strength of core drilled and waterjet cut holes in architectural glass. Glass Struct. Eng. 2021, 6, 131–145. [Google Scholar] [CrossRef]


| Test Series | Glass Thickness (mm) | Interlayer | Reinforcement |
|---|---|---|---|
| G8-REF | 2 × 8 mm | 2 × 1.52 mm | - |
| G8-R75 | Ø75 mm | ||
| G8-R110 | Ø110 mm | ||
| G8-R150 | Ø150 mm | ||
| G10-REF | 2 × 10 mm | - | |
| G10-R75 | Ø75 mm | ||
| G10-R110 | Ø110 mm | ||
| G10-R150 | Ø150 mm | ||
| G12-REF | 2 × 12 mm | - | |
| G12-R75 | Ø75 mm | ||
| G12-R110 | Ø110 mm | ||
| G12-R150 | Ø150 mm |
| Test Series | Pel,max (kN) | u(Pel,max) * (mm) | Pcr,min (kN) | Pcr,max (kN) | uult (mm) |
|---|---|---|---|---|---|
| G8-REF | 11.86 ± 1.62 | 1.50 ± 0.05 | 0.22 ± 0.08 | 1.39 ± 0.06 | 63.30 ± 3.09 |
| G8-R75 | 11.59 ± 1.71 | 1.09 ± 0.13 | 0.41 ± 0.16 | 2.10 ± 0.35 | 60.48 ± 4.58 |
| G8-R110 | 10.09 ± 2.46 | 0.95 ± 0.10 | 0.92 ± 0.12 | 3.01 ± 0.07 | 65.08 ± 0.94 |
| G8-R150 | 11.48 ± 1.10 | 1.22 ± 0.13 | 1.30 ± 0.06 | 3.70 ± 0.13 | 63.30 ± 2.23 |
| G10-REF | 17.38 ± 2.27 | 1.31 ± 0.22 | 0.27 ± 0.10 | 1.60 ± 0.04 | 64.33 ± 1.33 |
| G10-R75 | 16.42 ± 1.45 | 1.19 ± 0.33 | 0.65 ± 0.06 | 2.39 ± 0.31 | 59.93 ± 4.19 |
| G10-R110 | 13.14 ± 2.08 | 1.22 ± 0.37 | 1.01 ± 0.19 | 3.23 ± 0.53 | 66.58 ± 0.11 |
| G10-R150 | 14.92 ± 1.20 | 1.22 ± 0.24 | 1.52 ± 0.27 | 4.03 ± 0.21 | 61.19 ± 1.52 |
| G12-REF | 22.34 ± 2.05 | 2.12 ± 0.79 | 0.24 ± 0.08 | 1.93 ± 0.33 | 65.01 ± 2.47 |
| G12-R75 | 23.91 ± 0.88 | 1.67 ± 0.27 | 0.85 ± 0.11 | 2.68 ± 0.50 | 53.40 ± 6.67 |
| G12-R110 | 23.33 ± 1.29 | 1.75 ± 0.35 | 1.01 ± 0.55 | 3.67 ± 0.21 | 66.64 ± 0.05 |
| G12-R150 | 24.57 ± 1.82 | 1.87 ± 0.27 | 1.34 ± 0.66 | 4.85 ± 0.08 | 65.63 ± 0.91 |
| Test Series | Constant Force (kN) | Instantaneous Displacement (mm) | Displacement Rate (mm/min) | Estimated Time to Failure (h) |
|---|---|---|---|---|
| G8-REF | 1.1 | 18.20 | 1.6402 | 0.13 |
| G8-R75 | 1.1 | 7.42 | 0.1062 | 4.65 |
| G8-R110 | 1.1 | 2.26 | 0.0139 | 44.95 |
| G8-R150 | 1.1 | 1.89 | 0.0064 | 98.64 |
| G10-REF | 1.3 | 14.68 | 2.3687 | 0.09 |
| G10-R75 | 1.3 | 3.57 | 0.0855 | 5.92 |
| G10-R110 | 1.3 | 2.64 | 0.0065 | 84.39 |
| G10-R150 | 1.3 | 2.42 | 0.0027 | 203.98 |
| G12-REF | 1.4 | 10.23 | 1.4761 | 0.22 |
| G12-R75 | 1.4 | 3.89 | 0.0525 | 10.59 |
| G12-R110 | 1.4 | 1.69 | 0.0019 | 321.70 |
| G12-R150 | 1.4 | 1.57 | 0.0015 | 403.77 |
Publisher’s Note: MDPI stays neutral with regard to jurisdictional claims in published maps and institutional affiliations. |
© 2022 by the authors. Licensee MDPI, Basel, Switzerland. This article is an open access article distributed under the terms and conditions of the Creative Commons Attribution (CC BY) license (https://creativecommons.org/licenses/by/4.0/).
Share and Cite
Kozłowski, M.; Wasik, D.; Zemła, K. Monotonic and Creep Studies on the Pull-Through Resistance of Laminated Glass with Locally Embedded Steel Mesh. Materials 2022, 15, 7083. https://doi.org/10.3390/ma15207083
Kozłowski M, Wasik D, Zemła K. Monotonic and Creep Studies on the Pull-Through Resistance of Laminated Glass with Locally Embedded Steel Mesh. Materials. 2022; 15(20):7083. https://doi.org/10.3390/ma15207083
Chicago/Turabian StyleKozłowski, Marcin, Dominik Wasik, and Kinga Zemła. 2022. "Monotonic and Creep Studies on the Pull-Through Resistance of Laminated Glass with Locally Embedded Steel Mesh" Materials 15, no. 20: 7083. https://doi.org/10.3390/ma15207083
APA StyleKozłowski, M., Wasik, D., & Zemła, K. (2022). Monotonic and Creep Studies on the Pull-Through Resistance of Laminated Glass with Locally Embedded Steel Mesh. Materials, 15(20), 7083. https://doi.org/10.3390/ma15207083