
DFT Modelling of Molecular Structure, Vibrational and UV-Vis Absorption Spectra of T-2 Toxin and 3-Deacetylcalonectrin

 , , , ,
Abstract
:1. Introduction
2. Methodological Part
Calculation Details
3. Results
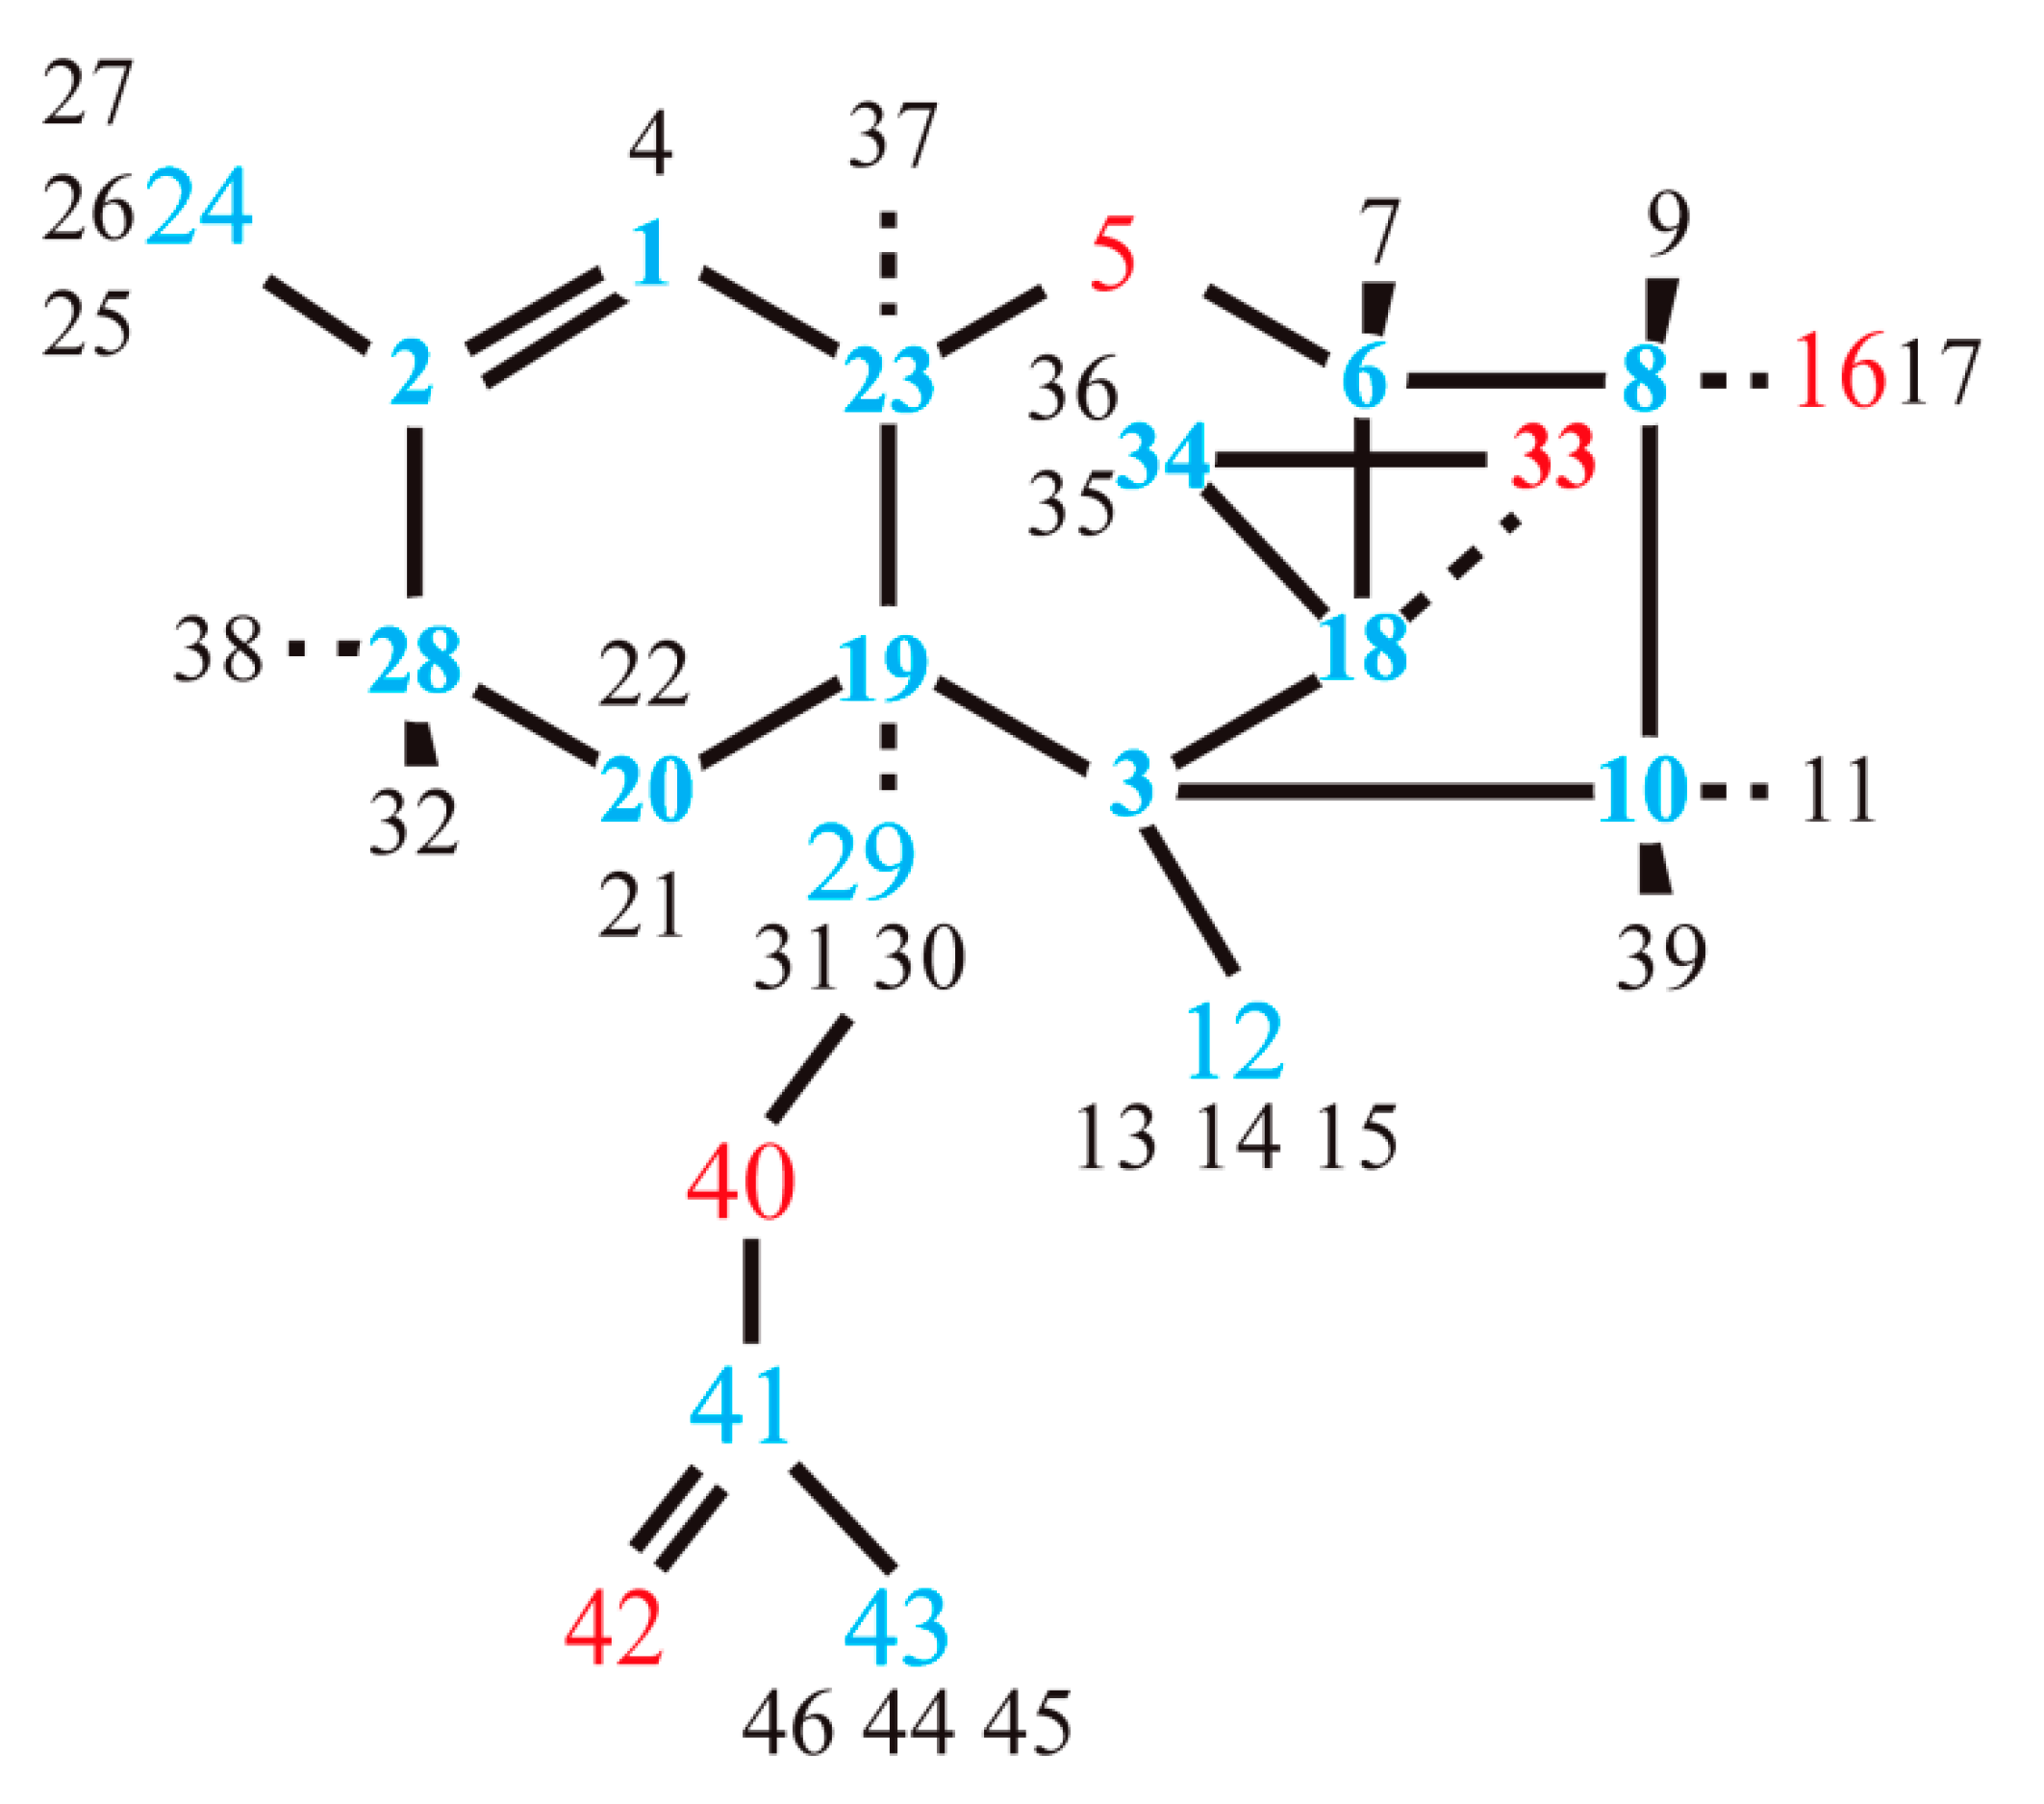
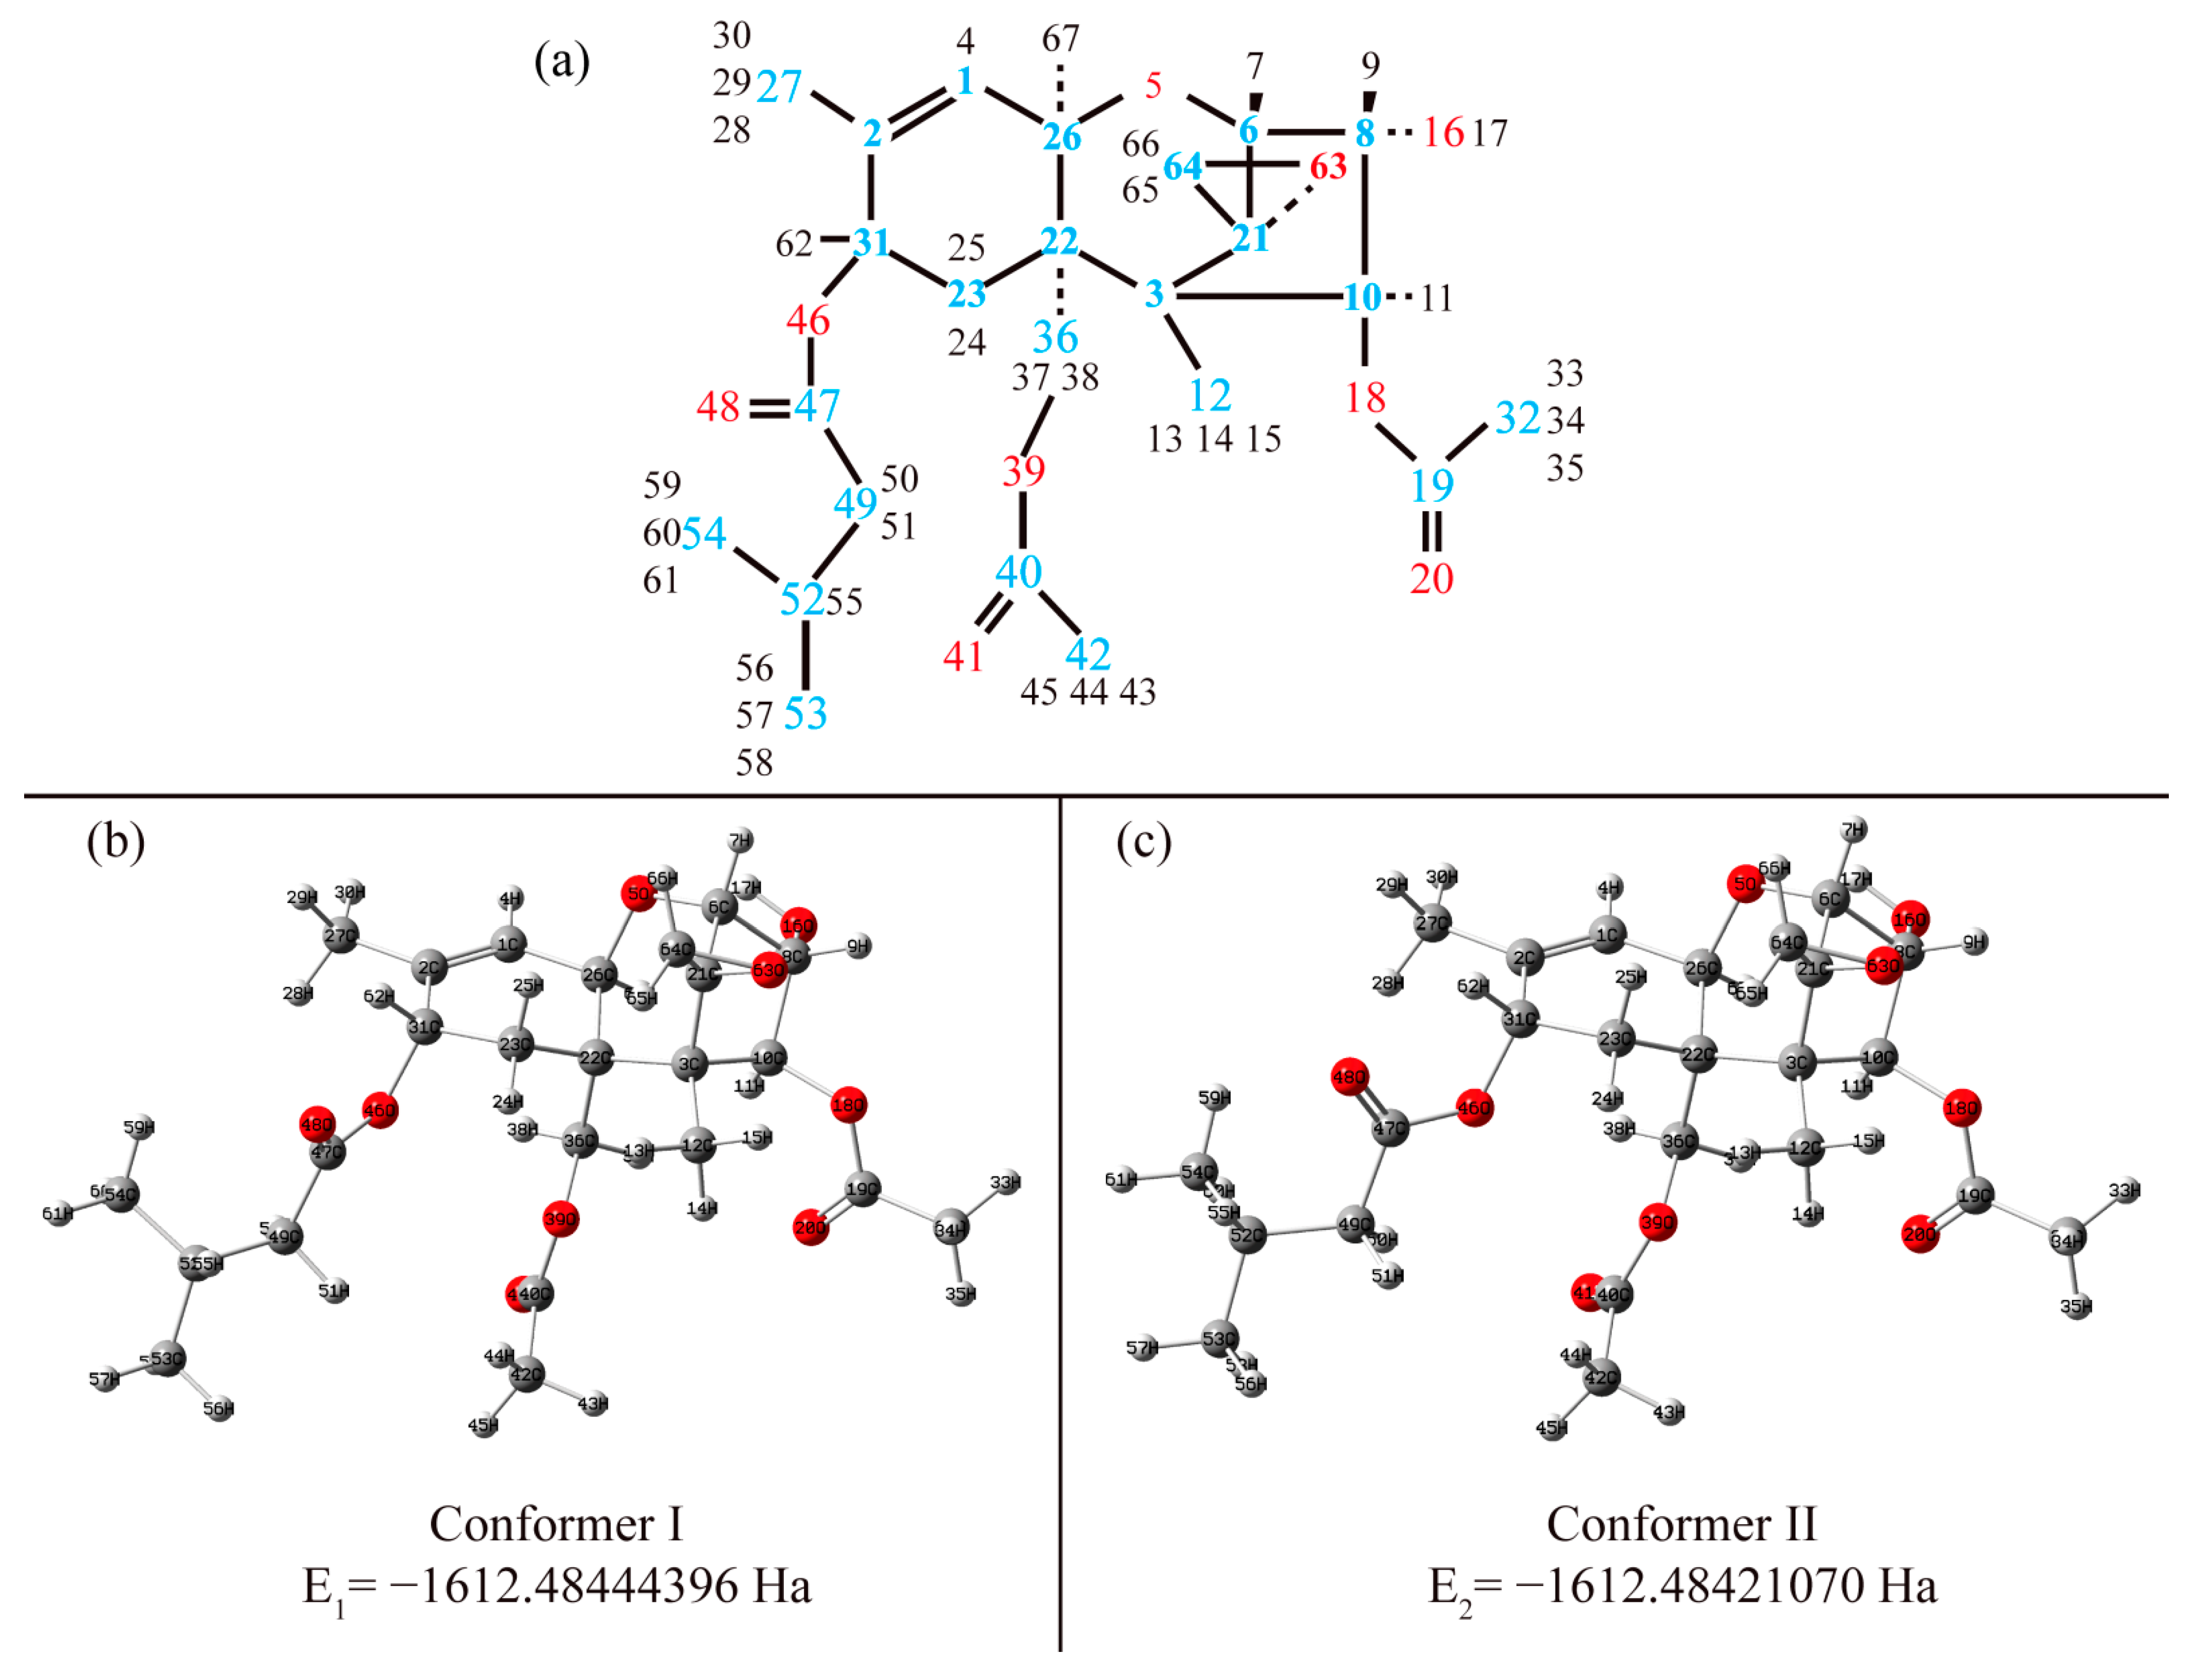
3.1. Structure
3.1.1. Structural Peculiarities of Fused Rings in Free Molecules
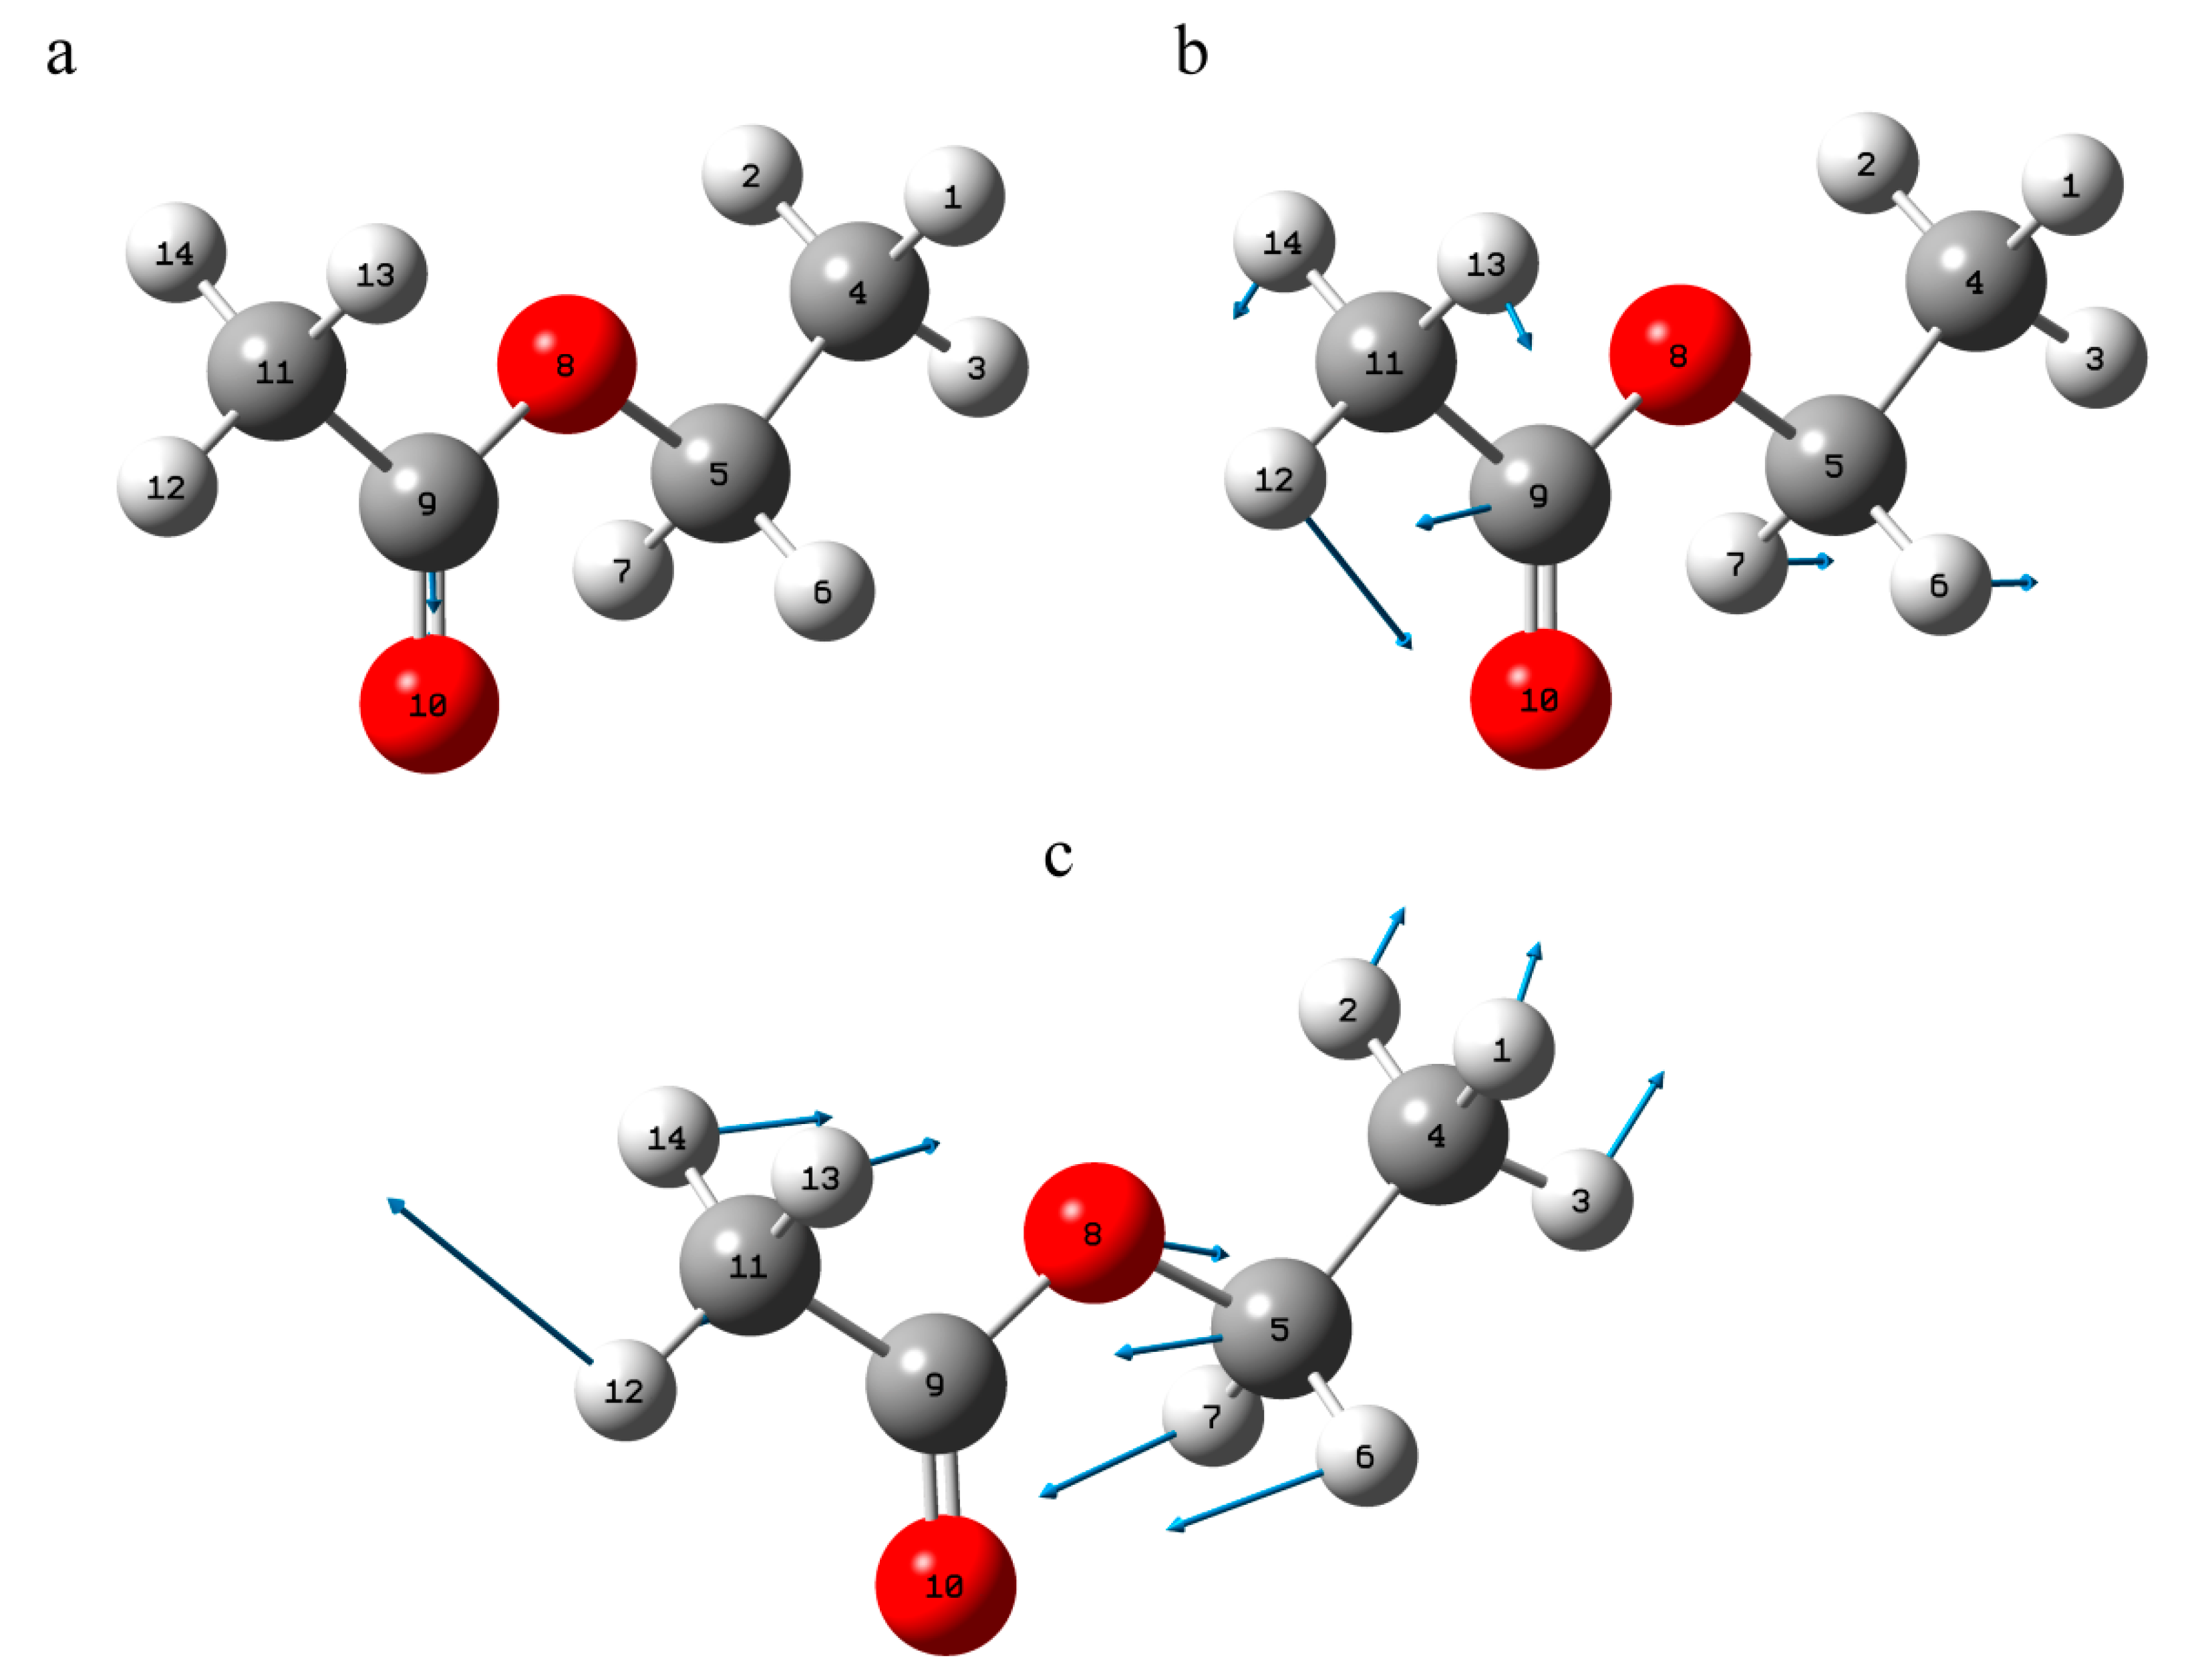
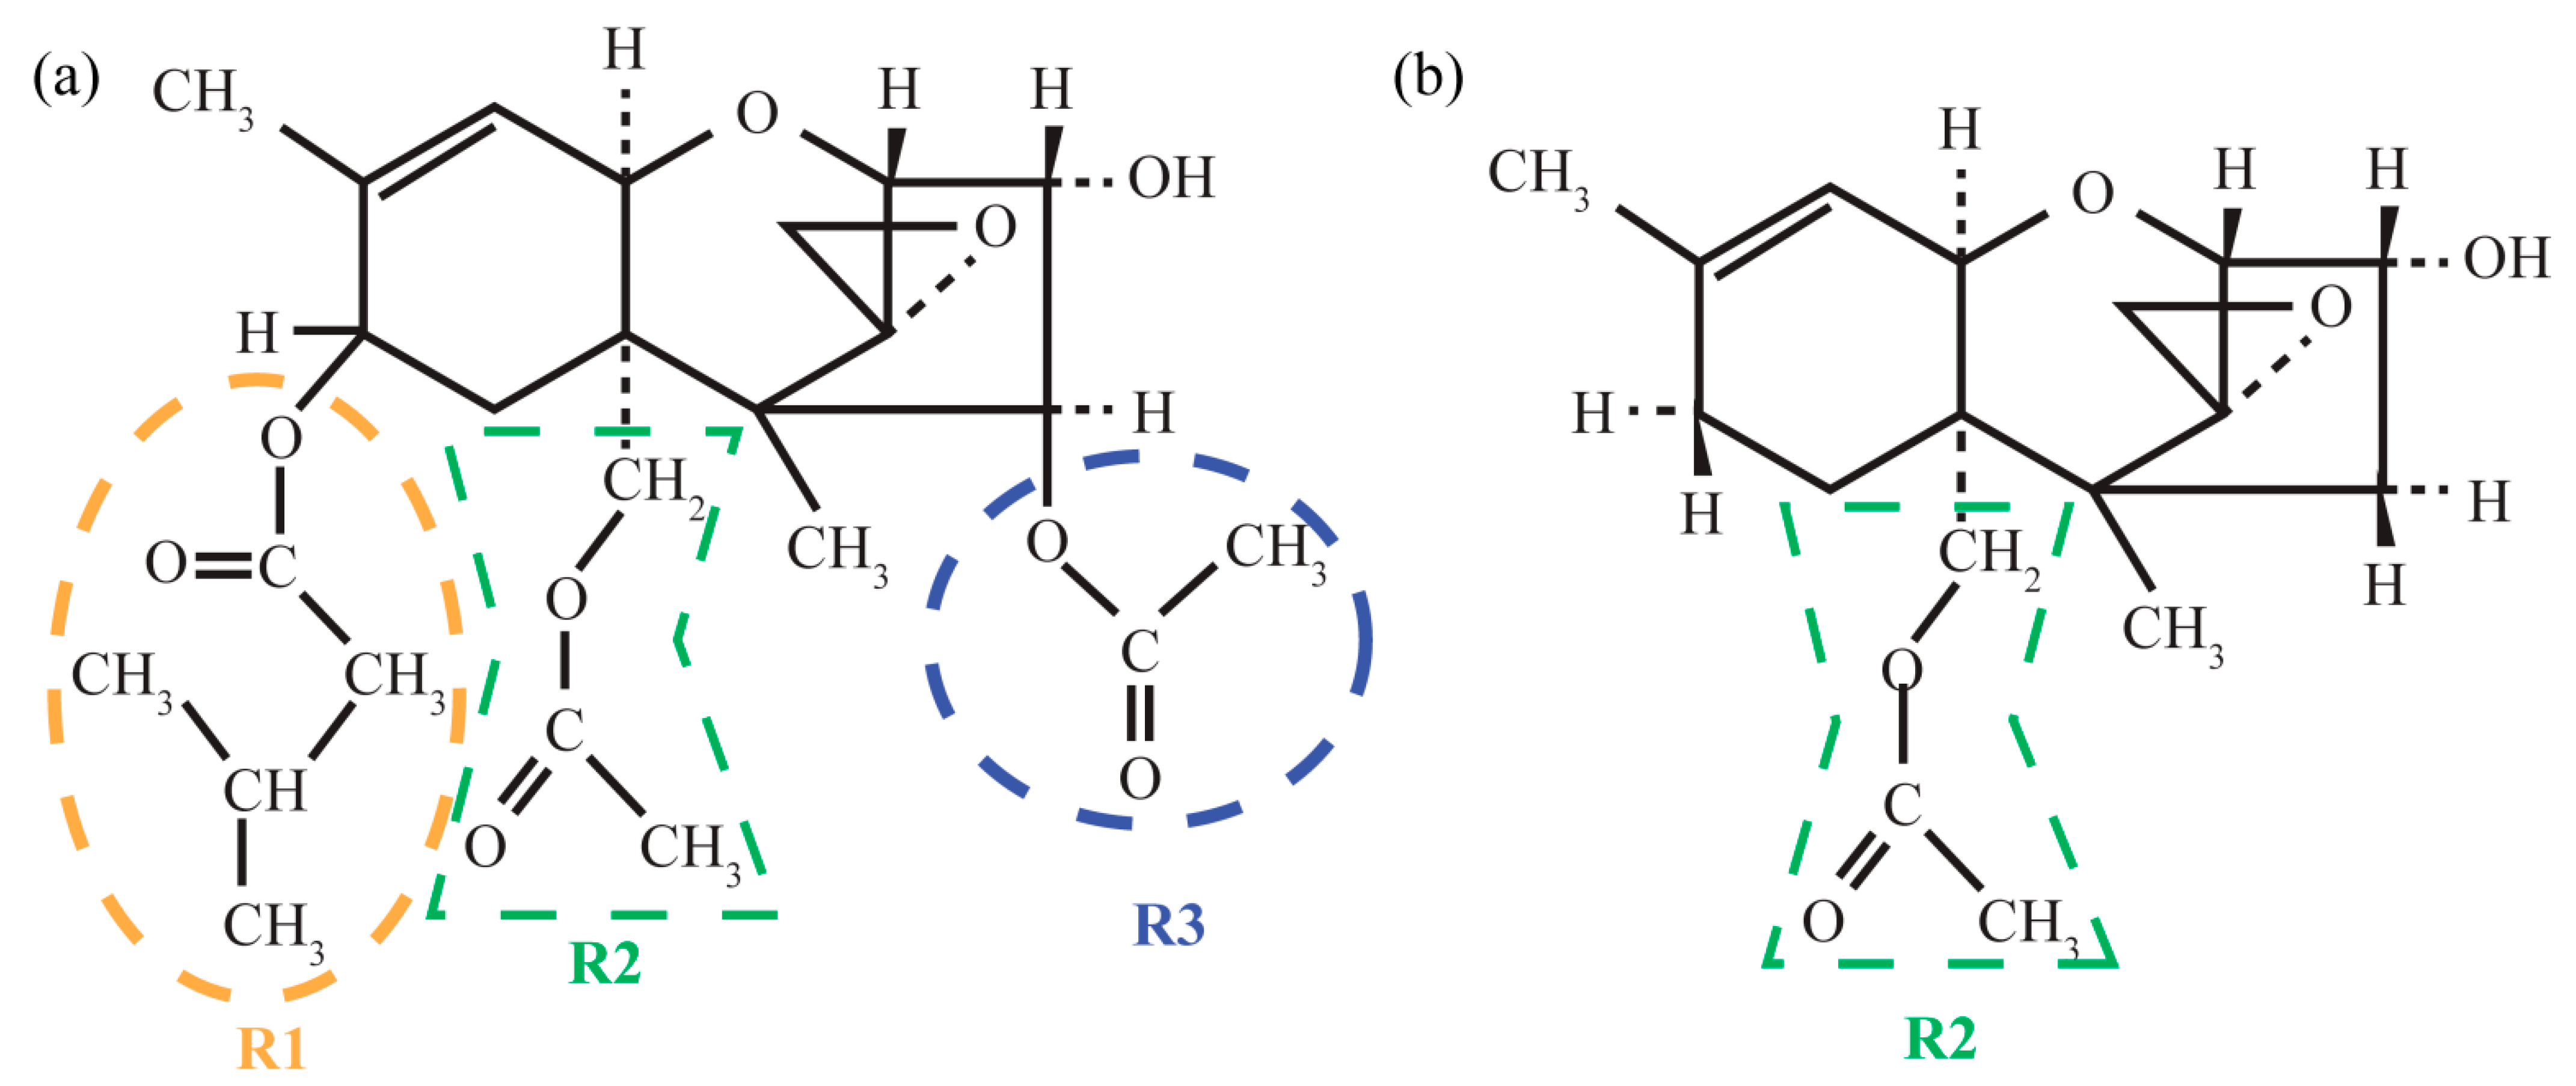
3.1.2. Arrangement of 3-Methylbutanoate and Acetate Groups
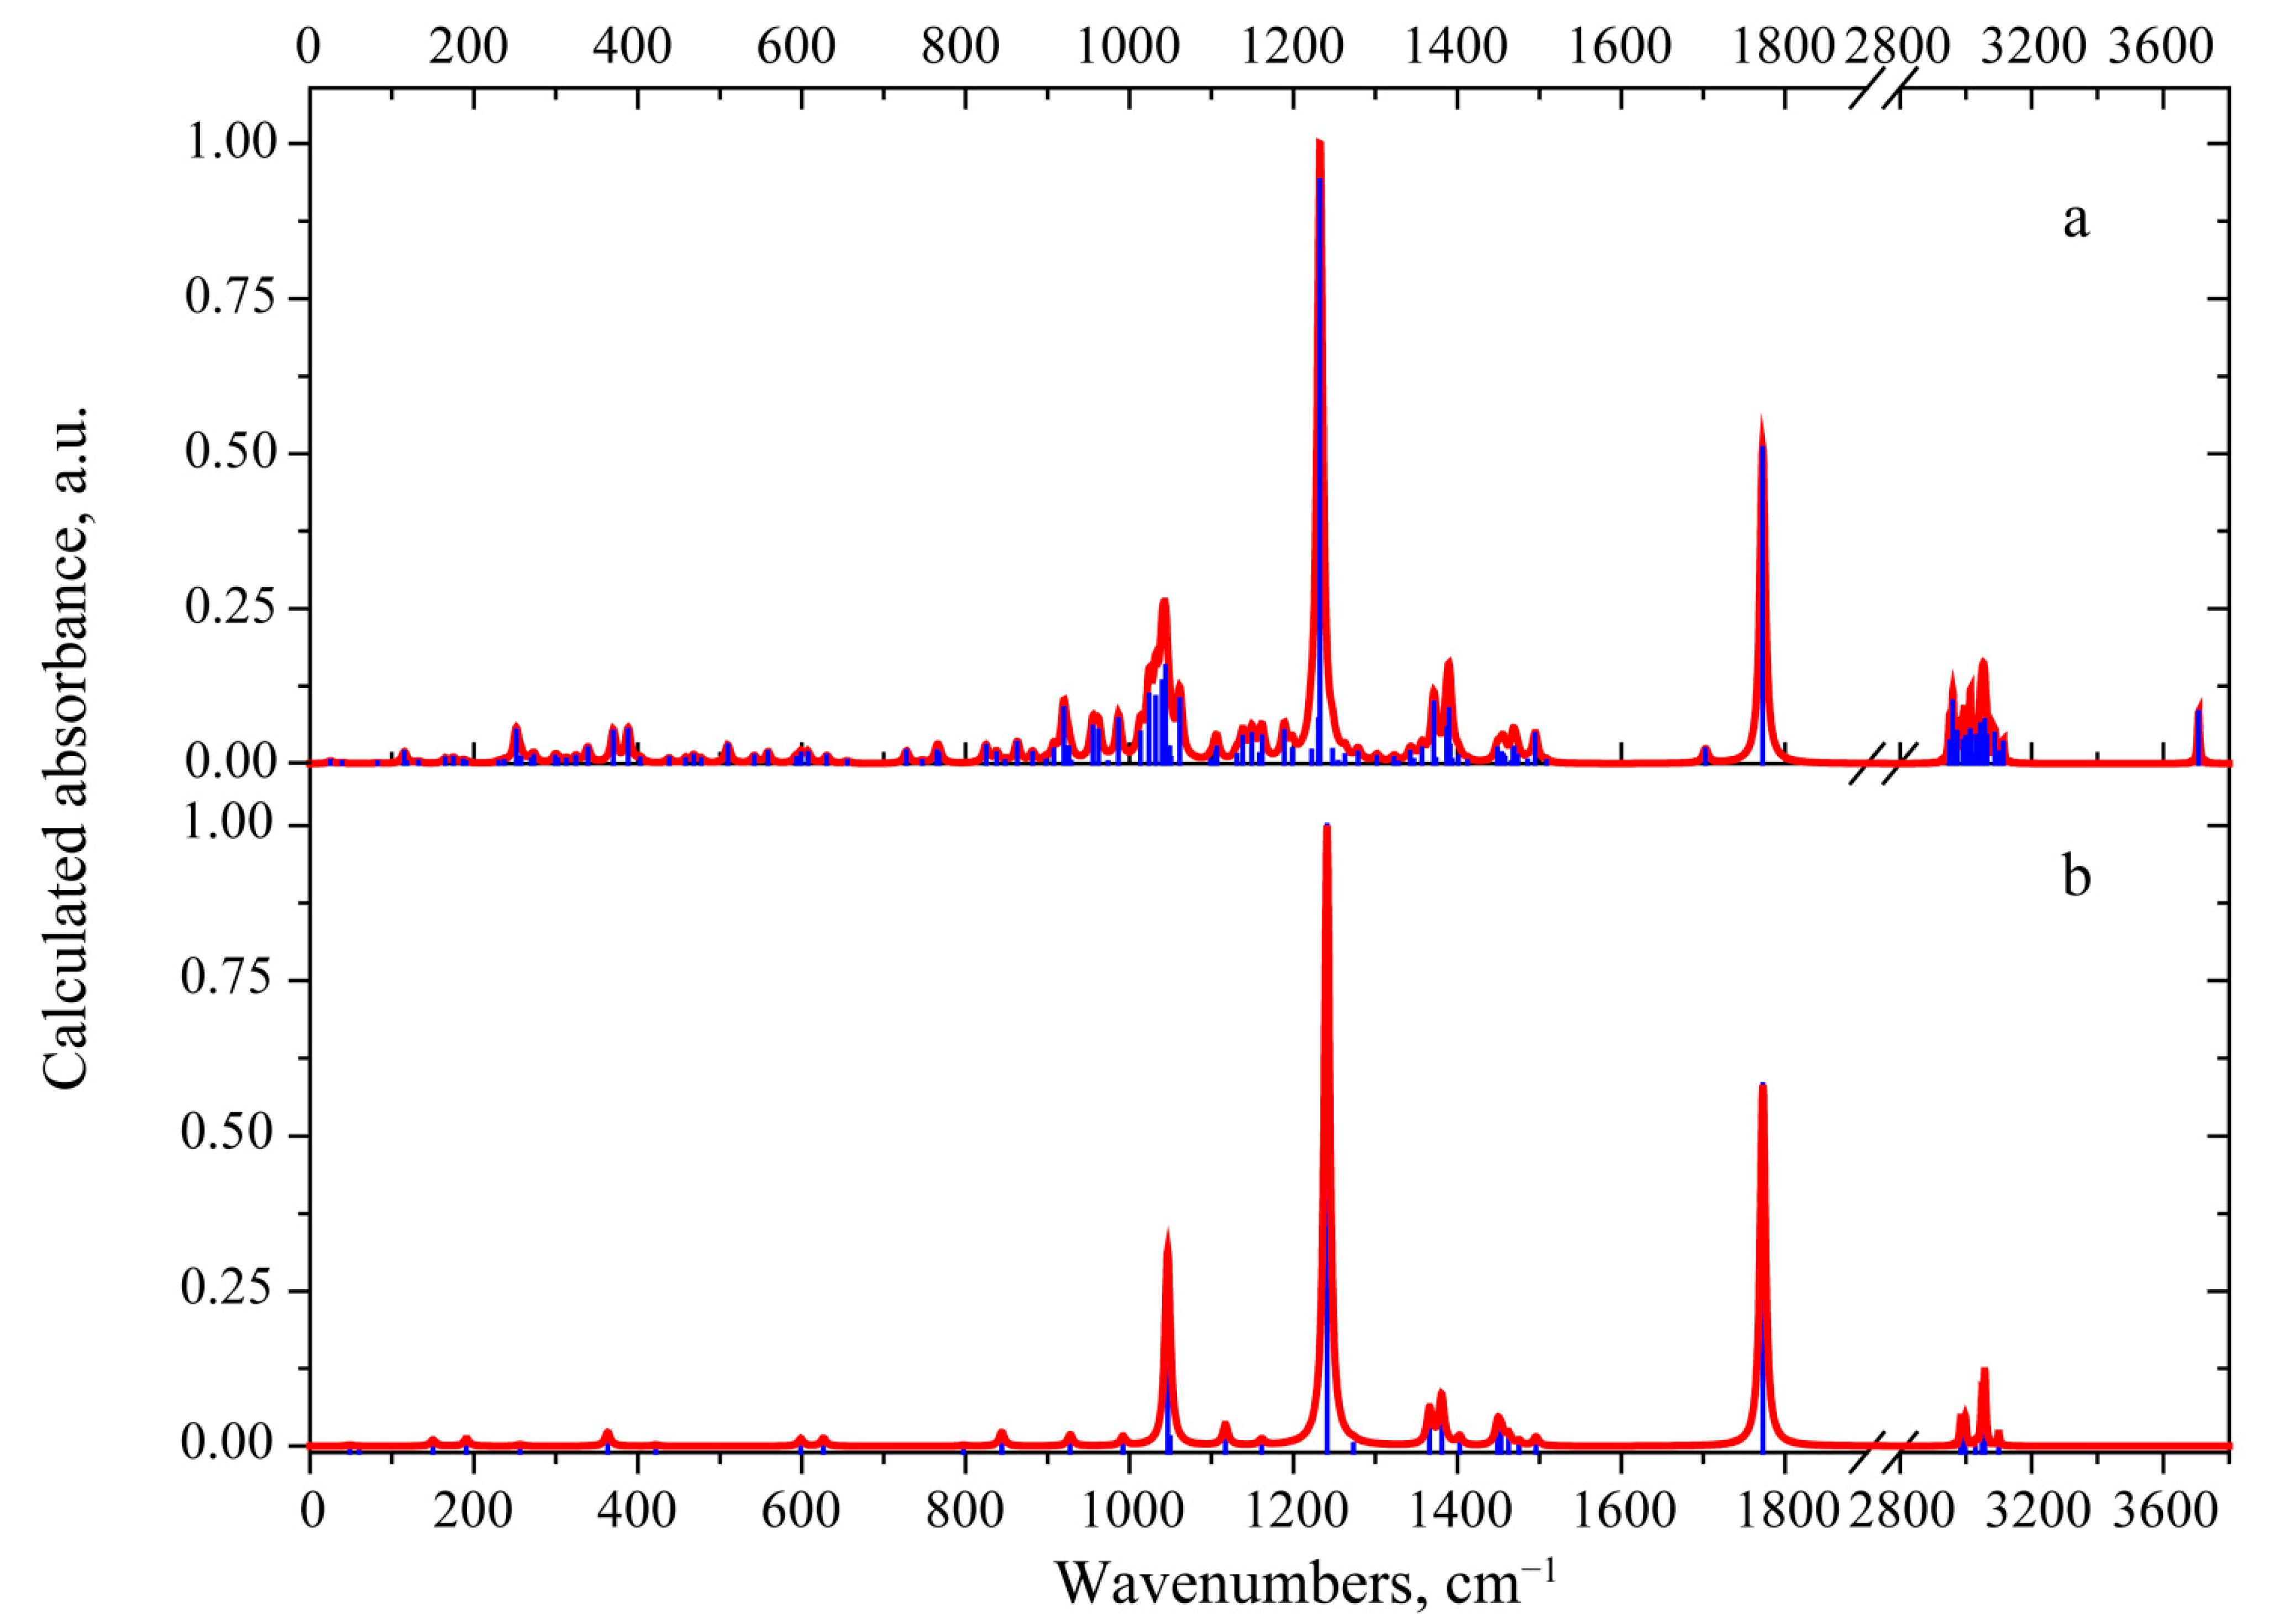
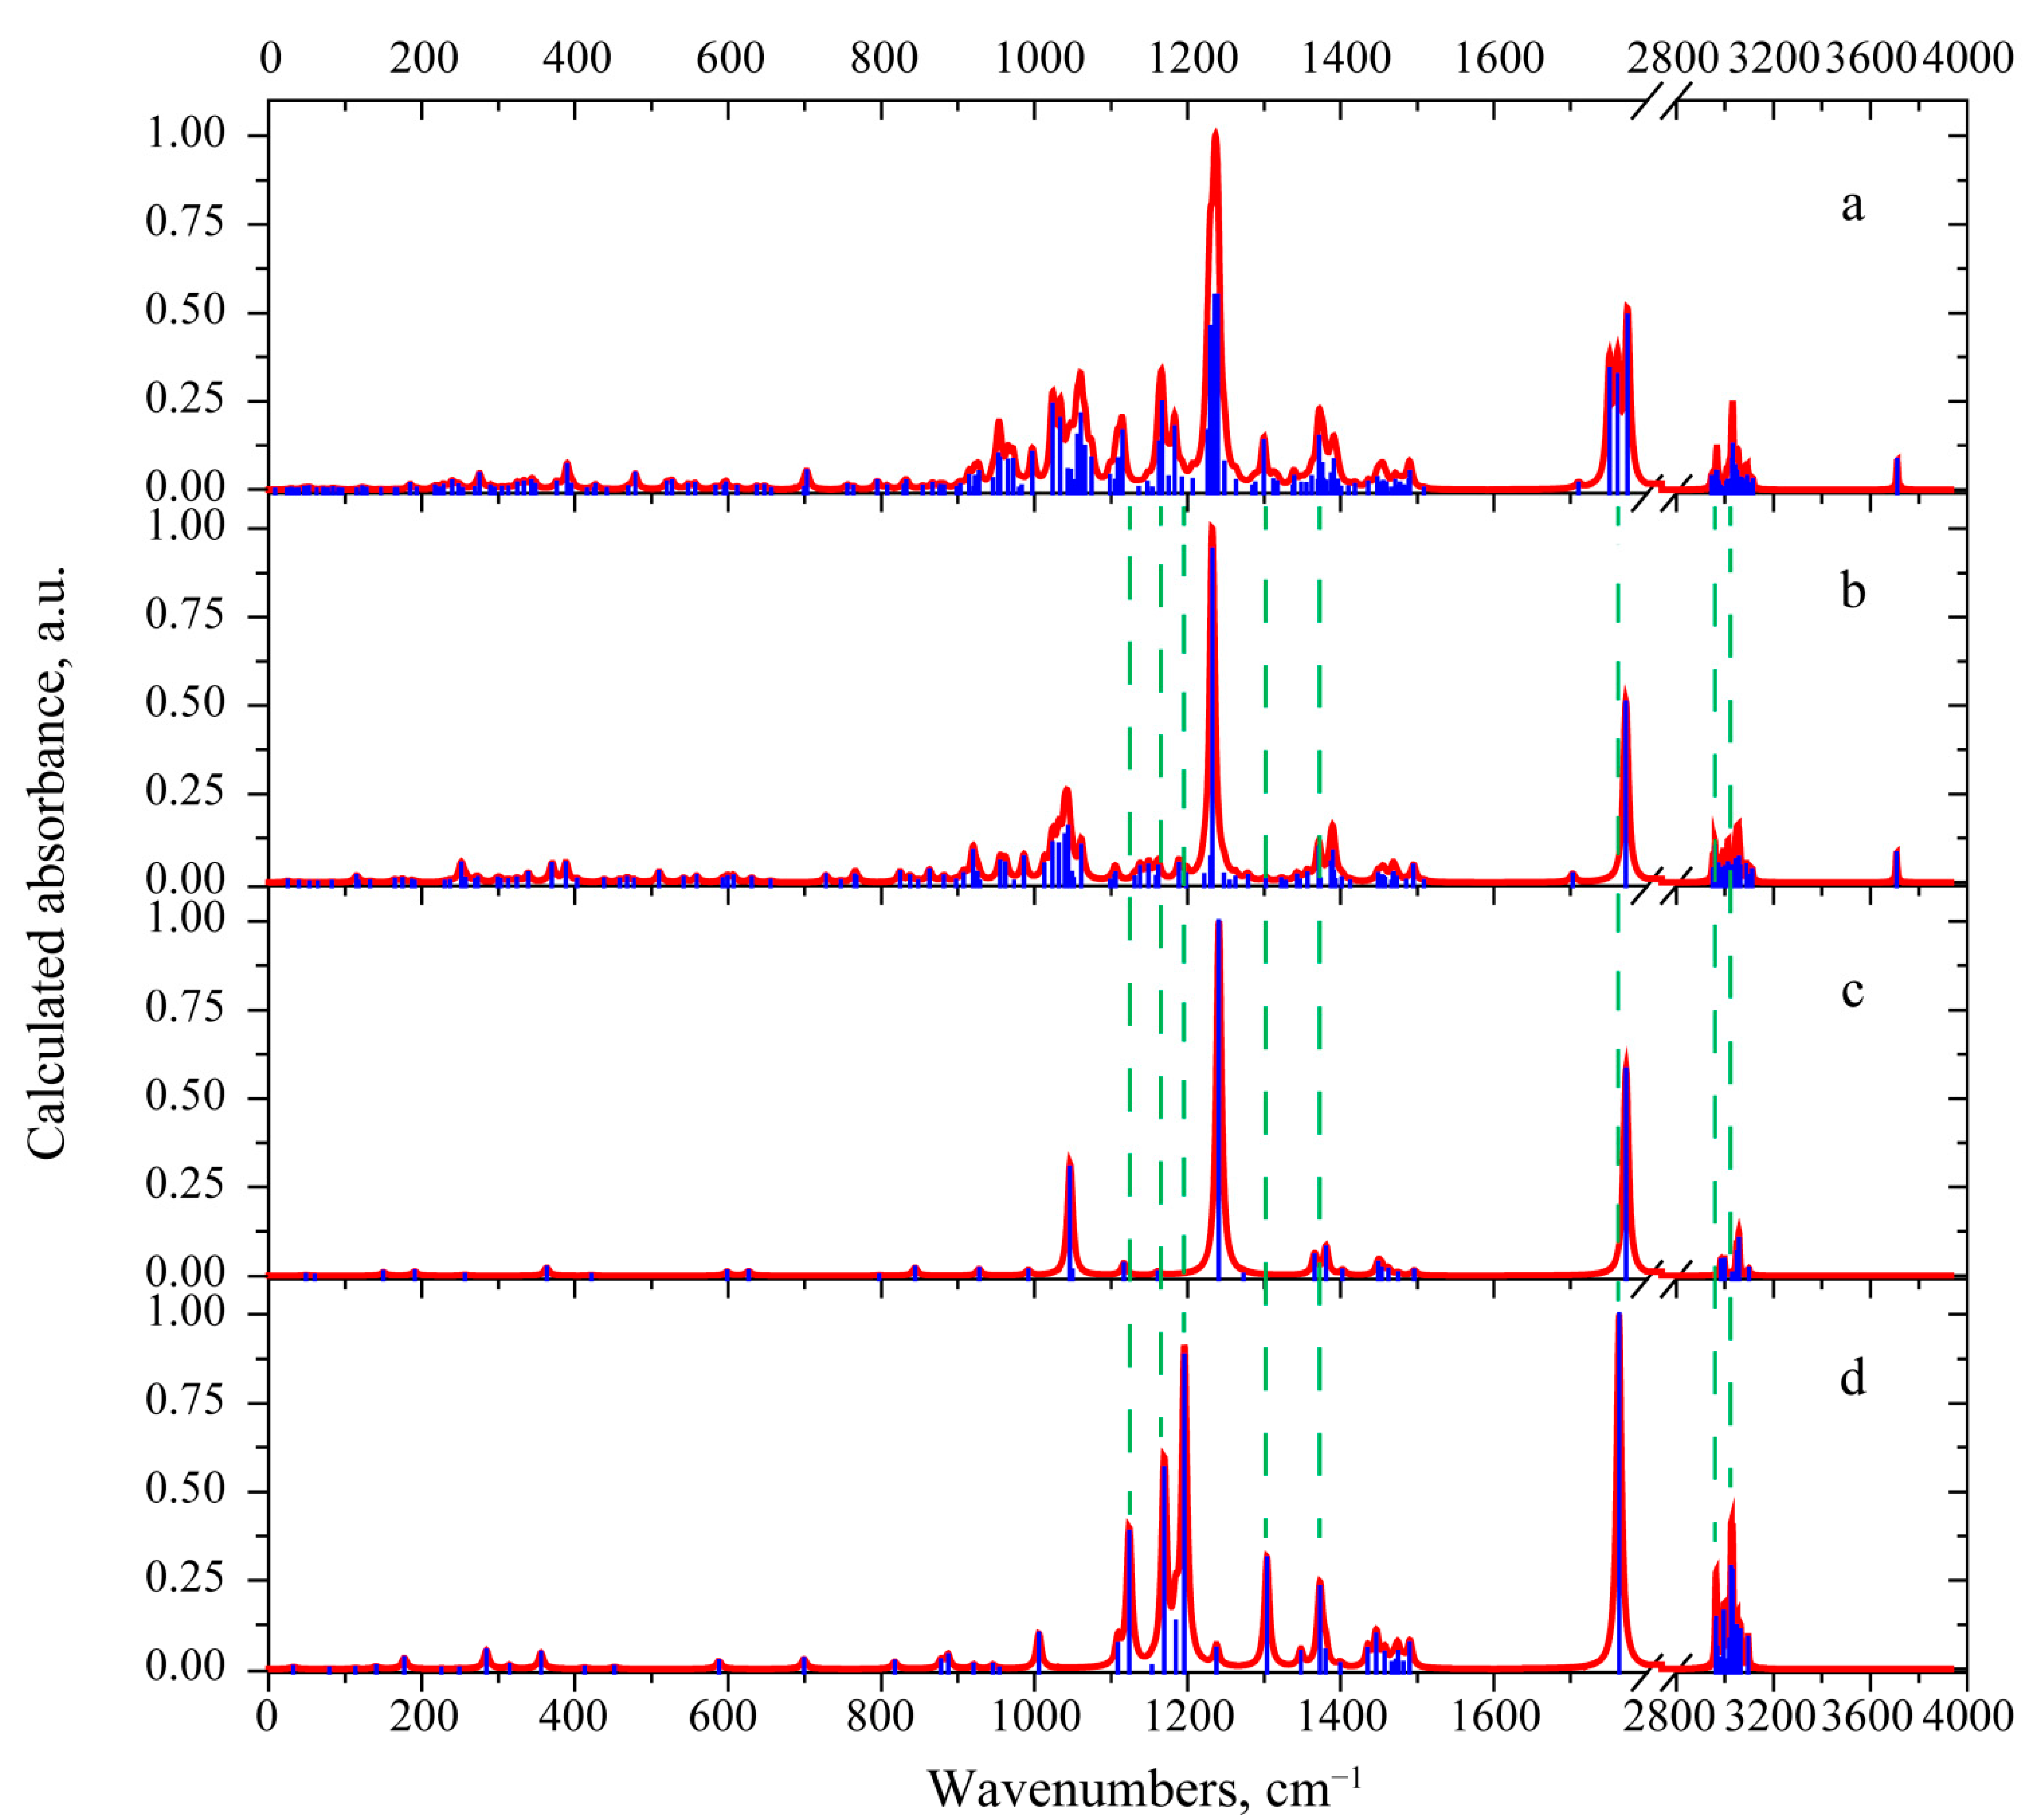
3.2. Vibrational Properties
3.2.1. 3-Deacetylcalonectrin Molecule
3.2.2. T-2 Toxin Molecule
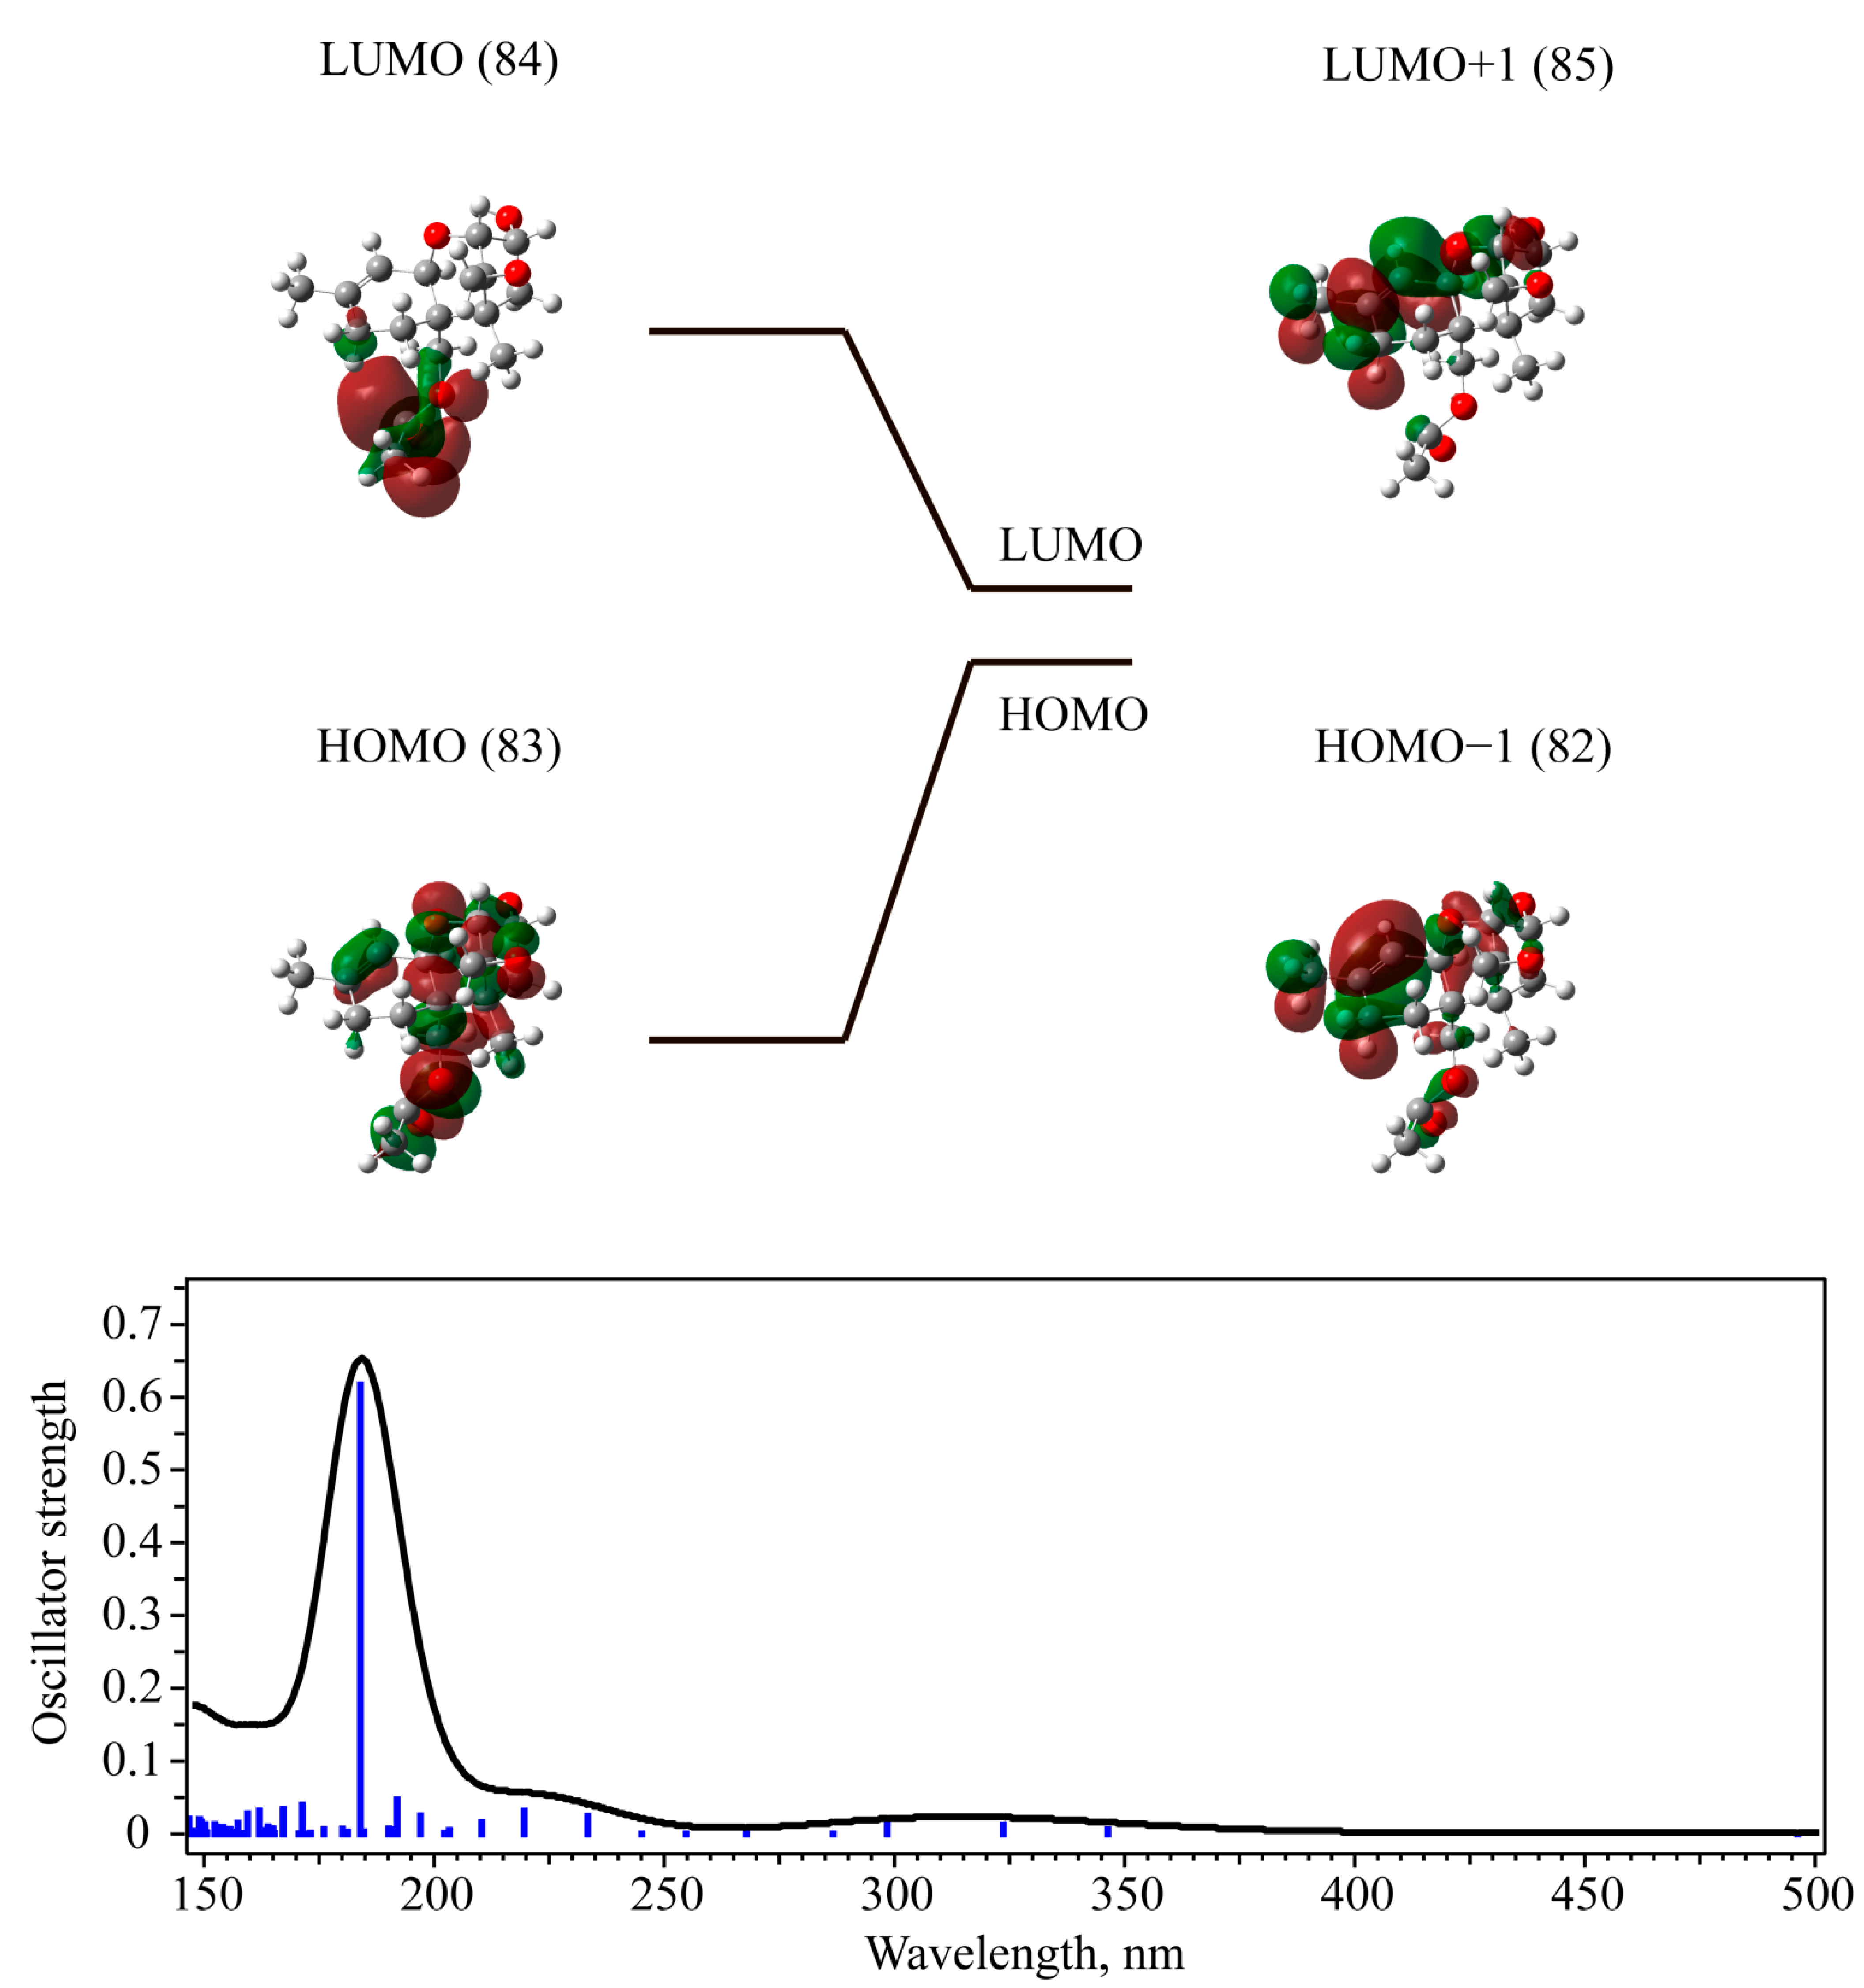
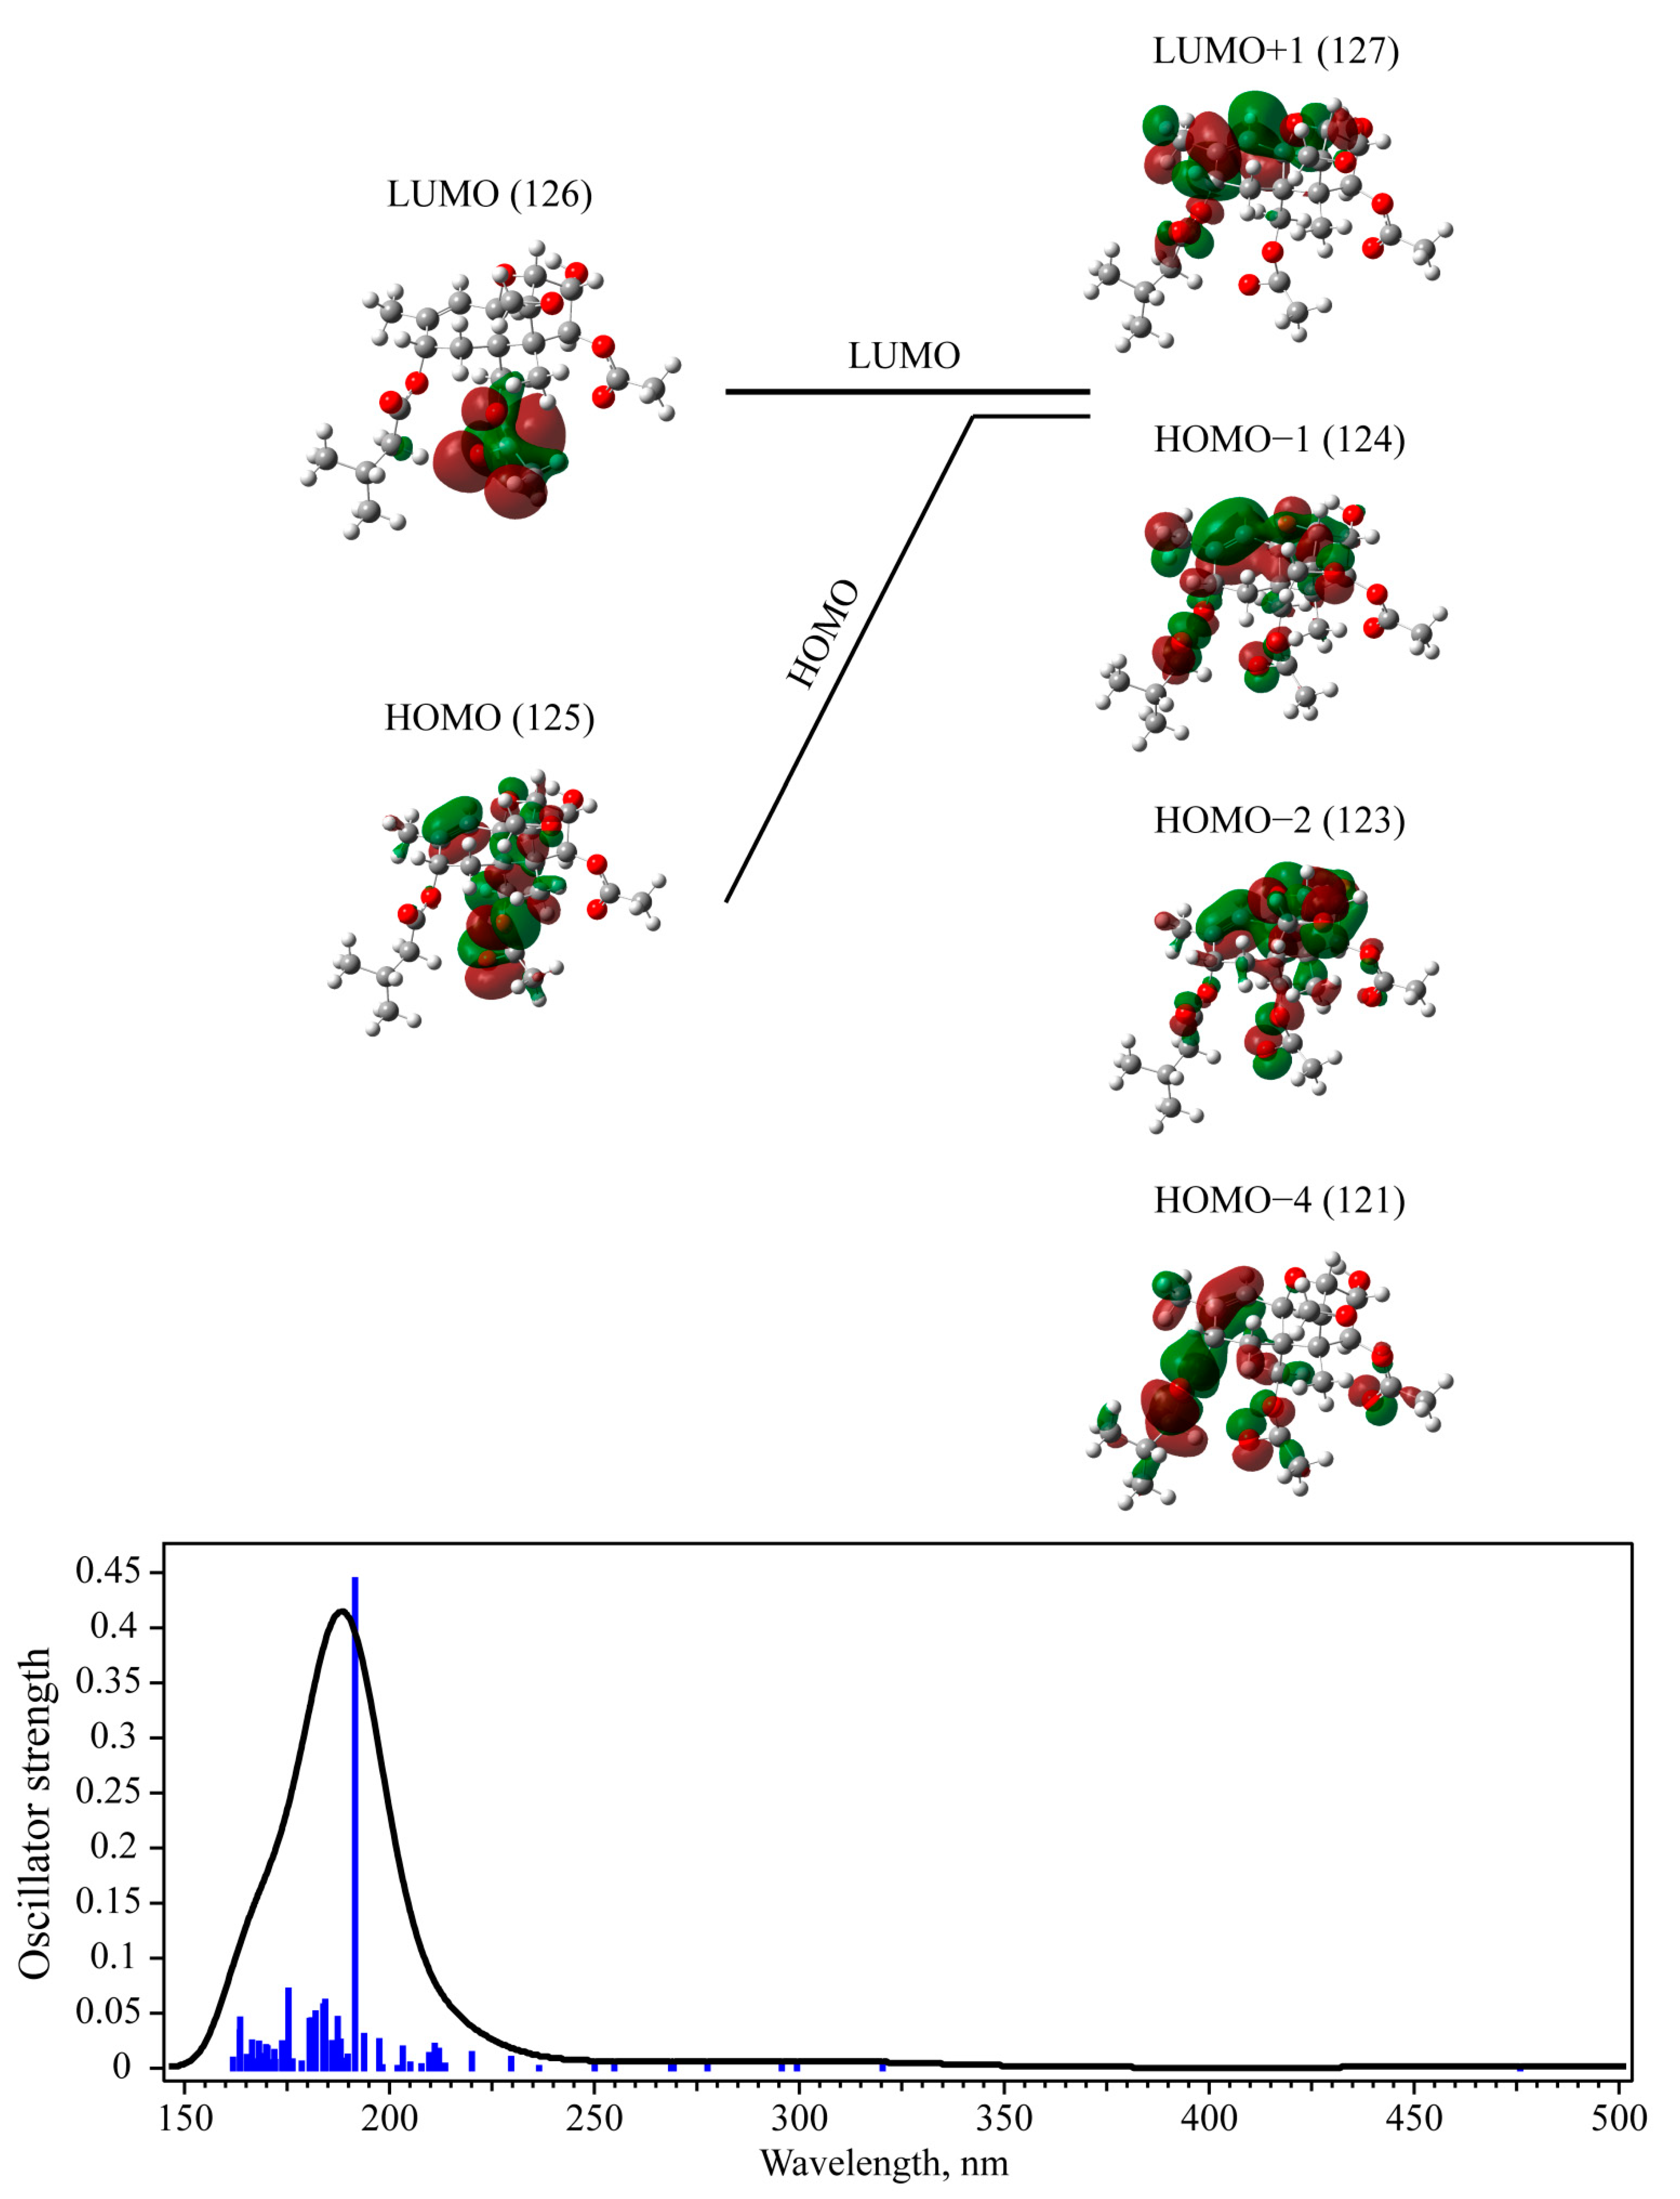
3.3. UV-Vis Absorption with TD-DFT Approach
4. Conclusions
Supplementary Materials
Author Contributions
Funding
Acknowledgments
Conflicts of Interest
References
- Kiseleva, M.; Chalyy, Z.; Sedova, I.; Aksenov, I. Stability of Mycotoxins in Individual Stock and Multi-Analyte Standard Solutions. Toxins 2020, 12, 94. [Google Scholar] [CrossRef] [PubMed] [Green Version]
- Häubl, G.; Berthiller, F.; Hametner, C.; Rechthaler, J.; Jaunecker, G.; Freudenschuss, M.; Krska, R.; Schuhmacher, R. Characterization of (13C24) T-2 Toxin and Its Use as an Internal Standard for the Quantification of T-2 Toxin in Cereals with HPLC–MS/MS. Anal. Bioanal. Chem. 2007, 389, 931–940. [Google Scholar] [CrossRef]
- Young, J.C.; Games, D.E. Analysis of Fusarium Mycotoxins by Gas Chromatography-Fourier Transform Infrared Spectroscopy. J. Chromatogr. A 1994, 663, 211–218. [Google Scholar] [CrossRef]
- Cole, R.J.; Schweikert, M.A.; Jarvis, B.B. (Eds.) Handbook of Secondary Fungal Metabolites, 1st ed.; Academic Press: Cambridge, MA, USA, 2003; Volume 3. [Google Scholar]
- Bianchini, A.; Bullerman, L.B. Mycotoxins Classification. In Encyclopedia of Food Microbiology, 2nd ed.; Elsevier: Amsterdam, The Netherland, 2014. [Google Scholar]
- Pankin, D.; Povolotckaia, A.; Kalinichev, A.; Povolotskiy, A.; Borisov, E.; Moskovskiy, M.; Gulyaev, A.; Lavrov, A.; Izmailov, A. Complex Spectroscopic Study for Fusarium Genus Fungi Infection Diagnostics of “Zalp” Cultivar Oat. Agronomy 2021, 11, 2402. [Google Scholar] [CrossRef]
- Chaudhary, P.; Shank, R.A.; Montina, T.; Goettel, J.T.; Foroud, N.A.; Hazendonk, P.; Eudes, F. Hydrogen-Bonding Interactions in T-2 Toxin Studied Using Solution and Solid-State NMR. Toxins 2011, 3, 1310–1331. [Google Scholar] [CrossRef] [Green Version]
- Krska, R.; Baumgartner, S.; Josephs, R. The State-of-the-Art in the Analysis of Type-A and -B Trichothecene Mycotoxins in Cereals. Fresenius J. Anal. Chem. 2001, 371, 285–299. [Google Scholar] [CrossRef]
- Bueno, D.; Muñoz, R.; Marty, J.-L. Common Methods to Detect Mycotoxins: A Review with Particular Emphasis on Electrochemical Detection. Sens. Electroanal. 2013, 8, 85–114. [Google Scholar]
- Savard, M.E.; Blackwell, B.A. Spectral Characteristics of Secondary Metabolites from Fusarium Fungi. In Mycotoxins in Grain: Compounds Other than Aflatoxin; Eagan Press: St. Paul, MN, USA, 1994; pp. 59–257. [Google Scholar]
- Gilardi, R.; George, C.; Flippen-Anderson, J.L. The Structure of T-2 Toxin. Acta Crystallogr. Sect. C Cryst. Struct. Commun. 1990, 46, 645–648. [Google Scholar] [CrossRef] [Green Version]
- Lo, Y.-H.; Hiramatsu, H. Online Liquid Chromatography–Raman Spectroscopy Using the Vertical Flow Method. Anal. Chem. 2020, 92, 14601–14607. [Google Scholar] [CrossRef] [PubMed]
- Qu, L.-L.; Jia, Q.; Liu, C.; Wang, W.; Duan, L.; Yang, G.; Han, C.-Q.; Li, H. Thin Layer Chromatography Combined with Surface-Enhanced Raman Spectroscopy for Rapid Sensing Aflatoxins. J. Chromatogr. A 2018, 1579, 115–120. [Google Scholar] [CrossRef]
- Zaffino, C.; Bedini, G.D.; Mazzola, G.; Guglielmi, V.; Bruni, S. Online Coupling of High-Performance Liquid Chromatography with Surface-Enhanced Raman Spectroscopy for the Identification of Historical Dyes. J. Raman Spectrosc. 2016, 47, 607–615. [Google Scholar] [CrossRef]
- Spencer, K.M.; Sylvia, J.M.; Clauson, S.L.; Bertone, J.F.; Christesen, S.D. Surface-Enhanced Raman for Monitoring Toxins in Water. Chem. Biol. Standoff Detect. 2004, 5268, 340–348. [Google Scholar]
- Pankin, D.; Kolesnikov, I.; Vasileva, A.; Pilip, A.; Zigel, V.; Manshina, A. Raman Fingerprints for Unambiguous Identification of Organotin Compounds. Spectrochim. Acta Part A Mol. Biomol. Spectrosc. 2018, 204, 158–163. [Google Scholar] [CrossRef]
- Koya, S.K.; Yurgelevic, S.; Brusatori, M.; Huang, C.; Diebel, L.N.; Auner, G.W. Rapid Detection of Clostridium Difficile Toxins in Stool by Raman Spectroscopy. J. Surg. Res. 2019, 244, 111–116. [Google Scholar] [CrossRef] [PubMed]
- Liu, Z.; Wang, L.; Bian, W.; Zhang, M.; Zhan, J. Porous Silver Coating Fiber for Rapidly Screening Organotin Compounds by Solid Phase Microextraction Coupled with Surface Enhanced Raman Spectroscopy. RSC Adv. 2017, 7, 3117–3124. [Google Scholar] [CrossRef] [Green Version]
- Foti, A.; D’Andrea, C.; Villari, V.; Micali, N.; Donato, M.; Fazio, B.; Maragò, O.; Gillibert, R.; de la Chapelle, M.L.; Gucciardi, P. Optical Aggregation of Gold Nanoparticles for SERS Detection of Proteins and Toxins in Liquid Environment: Towards Ultrasensitive and Selective Detection. Materials 2018, 11, 440. [Google Scholar] [CrossRef] [Green Version]
- Hassanain, W.A.; Izake, E.L.; Schmidt, M.S.; Ayoko, G.A. Gold Nanomaterials for the Selective Capturing and SERS Diagnosis of Toxins in Aqueous and Biological Fluids. Biosens. Bioelectron. 2017, 91, 664–672. [Google Scholar] [CrossRef] [Green Version]
- Pankin, D.; Martynova, N.; Smirnov, M.; Manshina, A. Spectral Properties of Triphenyltin Chloride Toxin and Its Detectivity by SERS: Theory and Experiment. Spectrochim. Acta Part A Mol. Biomol. Spectrosc. 2021, 245, 118933. [Google Scholar] [CrossRef]
- Jiang, S.; Chang, L.; Luo, J.; Zhang, J.; Liu, X.; Lee, C.-Y.; Zhang, W. Fabrication of a Honeycomb-like Bimetallic SERS Substrate for the Detection of Triphenyltin Chloride. Analyst 2021, 146, 6170–6177. [Google Scholar] [CrossRef]
- Frisch, M.J.; Trucks, G.W.; Schlegel, H.B.; Scuseria, G.E.; Robb, M.A.; Cheeseman, J.R.; Scalmani, G.; Barone, V.; Petersson, G.A.; Nakatsuji, H.; et al. GAUSSIAN 09, Revision B.01. Gaussian, Inc.: Wallingford, CT, USA, 2010. [Google Scholar]
- Appell, M.; Bosma, W.B. Assessment of the Electronic Structure and Properties of Trichothecene Toxins Using Density Functional Theory. J. Hazard. Mater. 2015, 288, 113–123. [Google Scholar] [CrossRef]
- Türker, L.; Gümüş, S. A Theoretical Study on Vomitoxin and Its Tautomers. J. Hazard. Mater. 2009, 163, 285–294. [Google Scholar] [CrossRef] [PubMed]
- Laurent, A.D.; Adamo, C.; Jacquemin, D. Dye Chemistry with Time-Dependent Density Functional Theory. Phys. Chem. Chem. Phys. 2014, 16, 14334–14356. [Google Scholar] [CrossRef]
- Cossi, M.; Barone, V.; Cammi, R.; Tomasi, J. Ab Initio Study of Solvated Molecules: A New Implementation of the Polarizable Continuum Model. Chem. Phys. Lett. 1996, 255, 327–335. [Google Scholar] [CrossRef]
- Liu, H.; Zhao, J.; Ji, G.; Wei, D.; Gong, Z. Vibrational Properties of Molecule and Crystal of TATB: A Comparative Density Functional Study. Phys. Lett. A 2006, 358, 63–69. [Google Scholar] [CrossRef]
- Morzyk-Ociepa, B.; Różycka-Sokołowska, E.; Michalska, D. Revised Crystal and Molecular Structure, FT-IR Spectra and DFT Studies of Chlorotetrakis(Imidazole)Copper(II) Chloride. J. Mol. Struct. 2012, 1028, 49–56. [Google Scholar] [CrossRef]
- Yuan, X.; Luo, K.; Liu, N.; Ji, X.; Liu, C.; He, J.; Tian, G.; Zhao, Y.; Yu, D. Cluster-Model DFT Simulations of the Infrared Spectra of Triazine-Based Molecular Crystals. Phys. Chem. Chem. Phys. 2018, 20, 20779–20784. [Google Scholar] [CrossRef]
- Kumar, N.; Singh, P.; Thapa, K.B.; Kumar, D. Molecular Spectroscopy and Adverse Optical Properties of N-(p-Hexyloxy-Benzylidene)–p-Toluidine (HBT) Liquid Crystal Molecule Studied by DFT Methodology. IOP SciNotes 2020, 1, 015202. [Google Scholar] [CrossRef]
- Mayo, D.W.; Miller, F.A.; Hannah, R.W. (Eds.) Course Notes on the Interpretation of Infrared and Raman Spectra; John Wiley & Sons, Inc.: Hoboken, NJ, USA, 2004; ISBN 9780471690085. [Google Scholar]
- Bennett, G.A.; Shotwell, O.L. Criteria for Determining Purity of Fusarium Mycotoxins. J. Assoc. Off. Anal. Chem. 1990, 73, 270–275. [Google Scholar] [CrossRef] [PubMed]
- Omurtag, G.Z.; Yazicioğlu, D. Occurrence of T-2 Toxin in Processed Cereals and Pulses in Turkey Determined by HPLC and TLC. Food Addit. Contam. 2001, 18, 844–849. [Google Scholar] [CrossRef]


| Mode No | Calculated Frequency, cm−1 | Scaled Frequency, cm−1 | IR Intensity, KM/Mole | Experiment [3] | Interpretation |
|---|---|---|---|---|---|
| 15 | 256 | 252 | 24.8 | predominantly tors(C6C8O16H17), tors(C18C3C12H13), tors(C18C3C12H14), tors(C18C3C12H15), tors(C3C19C23O5), tors(C3C18C6O5), | |
| 23 | 345 | 339 | 11.4 | predominantly tors(C6C8O16H17), ρ(H21C20H22), ρ(H31C29H30), δ(C1C2C24), ρ(H35C34H36), δ(C18C3C12) | |
| 24 | 377 | 370 | 23.8 | predominantly tors(C6C8O16H17) with small addition of δ(C24C2C28), ρ(H32C28H38), ρ(H11C10H39), δ(C2C28C20), δ(C1C23C19), δ(C19C3C18), δ(C23O5C6) | |
| 25 | 395 | 388 | 25.2 | predominantly tors(C6C8O16H17), δ(C43C41O40), δ(C24C2C28), δ(C20C19C3), δ(C19C3O10) | |
| 39 | 740 | 728 | 9.2 | δ(C1C23C19), δ(C23O5C6), ρ(H32C28H38), ρ(H21C20H22), ρ(H31C29H30), ρ(H22C20H21), tors(H4C1C2C24), v(C18C3), v(C18C6), ρ(H36C34H35), v(C2C24) | |
| 41 | 778 | 765 | 9.1 | v(C20C19), v(C19C3), v(C19C29), v(C2C28), v(C23C19), ρ(H38C28H32), ρ(H21C20H22), ρ(H11C10H39), tors(H4C1C2C24) | |
| 43 | 839 | 826 | 13.1 | v(C6O5), v(C23O5), v(C18O33), v(C2C28), v(C2C24), tors(H4C1C2C28), ρ(H39C10H11) | |
| 46 | 878 | 863 | 15.3 | v(C18O33), v(C18C6), v(C34O33), ρ(H13C12H14), ρ(H15C12H14), τ(H35C34H36), ρ(H31C29H30), tors(H4C1C2C28) | |
| 49 | 923 | 908 | 10.5 | ρ(H14C12H13), ρ(H14C12H15), ρ(H27C24H26), ρ(H27C24H25), ρ(H32C28H38), ρ(H11C10H39), w(H22C20H21), v(O40C41) | |
| 50 | 936 | 920 | 41.4 | v(C41O40), v(C23O5), v(C34O33), v(C29C19), v(C41C43), ρ(H39C10H11), ρ(H32C28H38), ρ(H22C20H21), τ (H35C34H36), tors(C19C23C1H4) | |
| 51 | 942 | 926 | 11.9 | τ (H35C34H36), v(C41O40), v(C2C28), v(C20C28), ρ(H27C24H25), ρ(H27C24H26), v(C6C18) | |
| 53 | 972 | 955 | 27.5 | v(C23O5), ρ(H32C28H38), τ (H22C20H21), τ (H27C24H25), v(C23C1), v(C6O5), ρ(H13C12H15), ρ(H14C12H15) | |
| 54 | 979 | 962 | 24.8 | v(C33O34), v(C18O34), δ(C18O33C34), ρ(H35C34H36), v(C10C8), δ(H7C6C18), ρ(H14C12H15), ρ(H14C12H13) | |
| 56 | 1004 | 987 | 33.1 | 974 | v(C28C20), v(C23C19), δ(C2C1C23), w(H32C28H38), ρ(H21C20H22), with small addition of v(O40C41), ρ(H26C24H27), ρ(H25C24H27), ρ(H15C12H14), ρ(H13C12H14) |
| 57 | 1031 | 1013 | 23.1 | 1013 | δ(H21C20C28), ρ(H25C24H27), ρ(H26C24H25), w(H32C28H38), ρ(H15C12H14), ρ(H15C12H13) ρ(H10C11H39), v(C19C23), v(C10C8), v(C20C28) |
| 58 | 1041 | 1024 | 51.3 | v(C28C20), v(C29O40), v(C1C23), ρ(H27C24H25), ρ(H27C24H26), v(C23O5), v(C6O5) | |
| 59 | 1050 | 1032 | 49.6 | v(C23O5), v(O5C6), v(C19C23), v(C8C10), v(C3C12), v(C1C23), ρ(H25C24H27), ρ(H26C24H25), ρ(H15C12H14), ρ(H15C12H13) | |
| 60 | 1058 | 1040 | 61.3 | predominantly v(C29O40), ρ(H44C43H46), ρ(H44C43H45), δ(C43C41O40), τ(H32C28H38), ρ(H26C24H27), ρ(H26C24H25), τ(H11C10H39), δ(C32C28H20), w(H22C20H21), tors(C24C2C1H4) | |
| 61 | 1062 | 1044 | 72.9 | v(O16C8), v(C8C10), τ(H11C10H39), δ(H17O16C8), ρ(H26C24H25), ρ(H27C24H26), ρ(H30C29H31), δ(C8C16C18), | |
| 62 | 1067 | 1049 | 11.7 | predominantly ρ(H26C24H25), ρ(H27C24H26), ρ(H45C43H44), ρ(H45C43H46), tors(C43C41O40C29), v(C8O16) τ (H11C10H39) | |
| 64 | 1080 | 1061 | 47.9 | v(C6O5), v(C23O5), v(C6C8), δ(H17O16C8), δ(H11C10C3), ρ(H13C12H14), ρ(H13C12H15), ρ(H35C34H36) | |
| 67 | 1126 | 1107 | 11.6 | ρ(H31C29H30), ρ(H22C20H21), ρ(H32C28H38), τ(H36C34H35), δ(C29C19C20), v(C3C19), τ(H25C24H26) | |
| 69 | 1158 | 1138 | 19.9 | v(C6C18), v(C3C12), w(H36C34H35), δ(H39C10C8), δ(H9C8C10), δ(H17O16C8), v(C8O16), τ (H21C20H22) | |
| 70 | 1169 | 1149 | 21.8 | v(C3C10), v(C3C19), ρ(H15C12H13), ρ(H15C12H14), δ(H37C23C1), δ(H4C1C23), τ (H32C28H38), τ (H11C10H39), δ(H27C24C2), w(H36C34H35) | |
| 72 | 1182 | 1162 | 20.3 | v(C24C2), δ(H4C1C23), δ(C23C1C2), w(H36C34H35), δ(H11C10C8), δ(H9C8C6), w(H32C28H38), δ(H17O16C8) | |
| 73 | 1209 | 1189 | 24.0 | 1173 | v(C20C19), v(C23C19), v(C30C10), τ (H31C29H30) δ(H11C10C3), ρ(H15C12H13), ρ(H15C12H14), δ(H32C28C2) |
| 74 | 1219 | 1198 | 10.5 | tors(H9C8C10H39), δ(H17O6C8), δ(H9C8C6), δ(H7C6C18) with small addition of v(C20C19), v(C19C3), v(C19C23) | |
| 76 | 1251 | 1230 | 32.7 | tors(H7C6O5C23), δ(H17O16C8), δ(H9C8O16), w(H36C34H35), τ (H21C20H22), v(C18C34), δ(H17C28C20) | |
| 77 | 1254 | 1233 | 437 | 1227 | predominantly v(O40C41), δ(H44C43C41) with small addition of δ(H45C43H46), w (H30C29H31) |
| 87 | 1380 | 1357 | 11.1 | 1387 | δ(H37C23O5), w(H22C20H21), δ(H17O16C8), δ(H7C6C8) |
| 88 | 1395 | 1371 | 45.6 | predominantly δsym(C43H3) | |
| 90 | 1411 | 1387 | 26.3 | predominantly δ(C19C23H37), δ(H17O16C8), δ(H9C8O16), δ(C23C1H4), δ(C28C20H21), w(H32C28H38) w(H30C29H31), | |
| 91 | 1414 | 1390 | 40.4 | δsym(C12H3), w(H30C29H31), δsym(C24H3), δ(C19C23H37), δ(H17O16C8), δ(H9C8O16) δ(H35C34C36) | |
| 96 | 1474 | 1449 | 11.0 | 1468 | δasym(C43H3), |
| 101 | 1493 | 1468 | 10.6 | δasym(C24H3), δ(H32C28H38), δasym(C12H3) | |
| 102 | 1495 | 1470 | 11.6 | δ(H11C10H39), δ(H21C20H22), δ(H32C28H38) | |
| 105 | 1521 | 1495 | 21.6 | δ(H30C29H31), δasym(C12H3) | |
| 107 | 1732 | 1703 | 10.5 | 1709 | v(C1=C2) |
| 108 | 1803 | 1772 | 236.3 | 1767 | v(C41=O42) |
| 109 | 3000 | 2949 | 15.1 | 3626 | v(C23H37) |
| 110 | 3003 | 2952 | 16.6 | vsym(H38C28H32) small addition of vsym(C24H3), v(C23H37) | |
| 111 | 3011 | 2960 | 46.5 | vsym(C24H3), small addition of vsym(H38C28H32) | |
| 113 | 3044 | 2992 | 16. 8 | v(C8H9) small addition v(C10H39) | |
| 114 | 3047 | 2995 | 14.4 | vsym(C12H3) | |
| 117 | 3065 | 3013 | 25.0 | vsym(H11C10H39) small addition of vsym(H21C20H22), vsym(H31C29H30), v(C8H9) | |
| 118 | 3066 | 3014 | 24.5 | vsym(H21C20H22) | |
| 120 | 3083 | 3031 | 20.6 | vsym(H35C34H36) | |
| 121 | 3096 | 3044 | 29.2 | v(C6H7) | |
| 122 | 3101 | 3048 | 17.6 | vasym(C24H3) | |
| 123 | 3103 | 3050 | 22.3 | vasym(H22C20H21), vasym(C12H3), vasym(H11C10H39) | |
| 125 | 3107 | 3054 | 26.2 | vasym(H11C10H39), vasym(H31C29H30), vasym(H22C20H21) | |
| 126 | 3111 | 3058 | 32.6 | vasym(H13C12H15), vasym(H21C20H22), vasym(H31C29H30) | |
| 128 | 3116 | 3063 | 20.6 | vasym(C12H3), vasym(H31C29H30), vasym(H11C10H39) | |
| 129 | 3141 | 3088 | 22.0 | v(=C1-H4) | |
| 131 | 3167 | 3114 | 15.6 | vasym(H35C34H36) | |
| 132 | 3771 | 3707 | 38.3 | 3626 | v(OH) |
| Mode No | Calculated Frequency, cm−1 | Scaled Frequency, cm−1 | IR Intensity, KM/Mole | Interpretation |
|---|---|---|---|---|
| 42 | 396 | 390 | 34.7 | tors(C6C8O16H17), δ(C26O5C6), δ(C22C3O21) |
| 49 | 487 | 479 | 23.0 | δ(O39C40C42), δ(C27C2C1), δ(O5C26C1), tors(C6C8O16H17), v(C10C8), v(C39C36) |
| 63 | 715 | 703 | 26.3 | δ(C12C3C10), v(C21C3), δ(C3C10O18), δ(C6C8O16), ρ(H25C23H24), v(C10C3), v(C12C3), v(C21C3), δ(C8C6O5), v(C64C21), v(C6C21) |
| 82 | 969 | 953 | 49.5 | v(C26O5), ρ(H59C54H61), ρ(H60C54H61), ρ(H57C53H58), ρ(H57C53H56), δ(C53C52H55), v(C16C26), ρ(H30C27H29), ρ(H30C27H28) |
| 83 | 971 | 955 | 43.5 | ρ(H59C54H61), ρ(H60C54H61), ρ(H57C53H58), ρ(H57C53H56), v(C52C53), v(C26O5), v(C6C8), tors (C31C2C1H4) |
| 84 | 982 | 965 | 40.9 | v(C64O63), v(C21O63), δ(C64O63C21), ρ(H56C53H57), v(C10C8), tors(C64C21C6H7) |
| 85 | 989 | 972 | 41.4 | v(C47O46), v(C47-C49H2), ρ(H56C53H57), δ(H59C54C52), ρ(H30C27H29), ρ(H30C27H28), ρ(H25C23H24) |
| 88 | 1015 | 997 | 51.7 | v(C26C22), v(O5C26), v(C47O46), ρ(H28C27H30), ρ(H28C27H29), ρ(H25C23H24), ρ(H37C36H38), δ(C26C22C23) |
| 89 | 1042 | 1024 | 120.0 | v(C31O46), v(C10O18), v(C1C26), v(C3C12), v(C22C26), ρ(H35C32H33), ρ(H35C32H34), ρ(H37C36H38), ρ(H24C23H25), ρ(H44C42H45) |
| 90 | 1052 | 1034 | 99.5 | v(C10O18), ρ(H33C32H35), ρ(H34C32H35), τ(H44C42H45), ρ(H24C23H25), ρ(H13C12H15), ρ(H14C12H15), ρ(H30C27H29), ρ(H30C27H28), v(C22C26), δ(H4C1C2) |
| 95 | 1074 | 1056 | 76.0 | v(C8O16), v(C8C10), v(C64O63), v(C21O63), ρ(H33C32H34), ρ(H35C32H34), δ(H7C6C21), δ(C8C6C21) |
| 96 | 1079 | 1061 | 106.4 | v(C6O5), v(C26O5), v(C36O39), v(C23C31), v(C8O16), ρ(H44C42H45), ρ(H43C42H45), ρ(H65C64H66), tors (C21C6C8C10), δ(H17O16C8) |
| 97 | 1085 | 1066 | 60.8 | v(C10O18), v(C31C23), v(C6O5), v(C26O5), ρ(H28C27H30), ρ(H29C27H30), tors(C31C2C1H4), tors(C31C2C27H28), tors(H67C26C1H4) |
| 98 | 1093 | 1075 | 43.6 | v(C8O16), ρ(H15C12H13), ρ(H14C12H13), v(C8C10), v(C8C6), δ(H11C10C3), ρ(H37C36H38), ρ(H24C25H23) |
| 102 | 1128 | 1109 | 42.5 | v(C23C22), v(C46C47), v(C1C26), v(C2C27), v(C47O46), τ (H65C64H66), tors(H4C1C26H67), δ(H50C49C47), ρ(H24C23H25), ρ(H15C12H13), tors(H59C54C52H55), δ(H58C53C52) |
| 103 | 1134 | 1115 | 82.3 | v(C47O46), tors(H50C49C52H55), δ(H58C53C52), δ(H59C54C52), τ(H57C53H58), w(H61C54H60) |
| 107 | 1183 | 1163 | 66.4 | v(C47O46), v(C52C49), v(C12C3), w(H66C64H65), w(H51C49H50), ρ(H57C53H56), ρ(H57C53H58), ρ(H59C54H61), ρ(H59C54H60), tors(H55C52C53H57), tors(H55C52C54H61), δ(H9C8C6), δ(H11C10C8), δ(H7C6C21), δ(H61C54C52) |
| 108 | 1187 | 1166 | 122.8 | v(C47O46), w(H51C49H50), δ(H55C52C49), δ(H57C53C52), δ(H61C54C52), w(H58C53H56), τ(H60C54H59), v(C52C49), w(H66C64H65), tors(H9C8C10H11) |
| 110 | 1204 | 1183 | 87.7 | v(C47O46), δ(C53C52C54), w(H60C54H61), w(H57C53H58), δ(H56C53C52), δ(H59C54C52), δ(H55C52C49), δ(H50C49C52), δ(H51C49C47), w(H51C49H50) |
| 114 | 1251 | 1230 | 229.3 | v(C39O40), δ(C40C42H45) with addition of tors(H7C6C8H9), δ(C8O16H17), τ(H50C49H51) |
| 115 | 1257 | 1236 | 273.1 | predominantly v(C19O18), τ(H50C49H51) with addition of δ(C19C32H35), δ(C6C8H9), δ(C21C6H7), δ(C8O16H17), δ(C54C52H55) |
| 116 | 1261 | 1239 | 273.4 | predominantly v(C40O39), v(C19O18), v(C47O46), τ(H51C49H50) with addition of tors(H55C52C54H60) |
| 121 | 1322 | 1300 | 68.4 | predominantly w(H51C49H50), δ(C53C52H55), v(C47C49), v(C47O46) with small addition of δ(C2C31H62) |
| 130 | 1395 | 1372 | 74.6 | predominantly δsym (C42H3), δsym (C32H3) |
| 131 | 1400 | 1376 | 35.9 | δ(C22C26H67), δ(C2C31H62), δ(C22C26H67), δ(C49C52H55), δ(C52C49H50), δ(C26C1H4) with small addition of δsym (C27H3), δsym (C32H3) |
| 134 | 1411 | 1387 | 21.8 | δ(C8O16H17), δ(O16C8H9), δ(O18C10H11) with small addition of δsym (C32H3) |
| 135 | 1415 | 1391 | 41.3 | δsym (C12H3), δsym (C27H3), δ(O16C8H9), δ(C8O16H17) |
| 143 | 1473 | 1448 | 16.3 | δasym (C32H3) |
| 147 | 1481 | 1456 | 10.6 | δasym(C42H3) with small addition of δ(H25C23H24), δasym (C27H3) |
| 150 | 1496 | 1471 | 12.1 | δasym(C27H3) with small addition of δ(C2C1H4) |
| 156 | 1516 | 1491 | 24.7 | δ(H37C36H38), δasym(C12H3) |
| 158 | 1740 | 1710 | 8.0 | predominantly v(C1=C2) with small addition of δ(H4C1C2) |
| 159 | 1781 | 1751 | 170.1 | v(C47=O48) |
| 160 | 1792 | 1762 | 162.1 | v(C19=O20) |
| 161 | 1805 | 1775 | 245.4 | v(C40=O41) |
| 162 | 2995 | 2944 | 18.3 | v(C26H67) |
| 163 | 3015 | 2964 | 25.3 | anti-phase vsym(C54H3) vsym(C53H3) |
| 164 | 3018 | 2966 | 23.9 | in-phase vsym(C54H3), vsym(C53H3), v(C52H55) with small addition of vsym(H51C49H50) |
| 165 | 3020 | 2969 | 24.8 | vsym(C27H3) |
| 177 | 3081 | 3029 | 41.9 | vasym(C53H3), vasym(H51C49H50), vasym(H61C54H60), v(C52H55) |
| 180 | 3085 | 3033 | 63.6 | vasym(C54H3), vasym(C53H3), v(C52H55), vasym(H50C49H51) |
| 181 | 3096 | 3043 | 32.9 | vasym(C54H3) |
| 194 | 3170 | 3116 | 13.8 | vasym(H65C64H66) |
| 195 | 3774 | 3710 | 42.1 | v(OH) |
| Compound | Transition Corresponding to Maximum Oscillator Strength | ||||
|---|---|---|---|---|---|
| Type | Oscillator Strength | Orbitals with Contribution >5% (%) | Wavelength, nm (Energy, eV) | Experimental Value from [1,33] | |
| T-2 toxin | Singlet | 0.4432 | 124 -> 127 (54%) 123 -> 127 (19%) 121 -> 127 (9%) | 192 (6.471) | 203 (6.109) |
| 3-deacetylcalonectrin | Singlet | 0.6168 | 82 -> 85 (88%) | 184 (6.739) | |
Publisher’s Note: MDPI stays neutral with regard to jurisdictional claims in published maps and institutional affiliations. |
© 2022 by the authors. Licensee MDPI, Basel, Switzerland. This article is an open access article distributed under the terms and conditions of the Creative Commons Attribution (CC BY) license (https://creativecommons.org/licenses/by/4.0/).
Share and Cite
Pankin, D.; Smirnov, M.; Povolotckaia, A.; Povolotskiy, A.; Borisov, E.; Moskovskiy, M.; Gulyaev, A.; Gerasimenko, S.; Aksenov, A.; Litvinov, M.; et al. DFT Modelling of Molecular Structure, Vibrational and UV-Vis Absorption Spectra of T-2 Toxin and 3-Deacetylcalonectrin. Materials 2022, 15, 649. https://doi.org/10.3390/ma15020649
Pankin D, Smirnov M, Povolotckaia A, Povolotskiy A, Borisov E, Moskovskiy M, Gulyaev A, Gerasimenko S, Aksenov A, Litvinov M, et al. DFT Modelling of Molecular Structure, Vibrational and UV-Vis Absorption Spectra of T-2 Toxin and 3-Deacetylcalonectrin. Materials. 2022; 15(2):649. https://doi.org/10.3390/ma15020649
Chicago/Turabian StylePankin, Dmitrii, Mikhail Smirnov, Anastasia Povolotckaia, Alexey Povolotskiy, Evgenii Borisov, Maksim Moskovskiy, Anatoly Gulyaev, Stanislav Gerasimenko, Aleksandr Aksenov, Maksim Litvinov, and et al. 2022. "DFT Modelling of Molecular Structure, Vibrational and UV-Vis Absorption Spectra of T-2 Toxin and 3-Deacetylcalonectrin" Materials 15, no. 2: 649. https://doi.org/10.3390/ma15020649
APA StylePankin, D., Smirnov, M., Povolotckaia, A., Povolotskiy, A., Borisov, E., Moskovskiy, M., Gulyaev, A., Gerasimenko, S., Aksenov, A., Litvinov, M., & Dorochov, A. (2022). DFT Modelling of Molecular Structure, Vibrational and UV-Vis Absorption Spectra of T-2 Toxin and 3-Deacetylcalonectrin. Materials, 15(2), 649. https://doi.org/10.3390/ma15020649