
Investigation of the Mechanical and Liquid Absorption Properties of a Rice Straw-Based Composite for Ayurvedic Treatment Tables

 , and
, and
Abstract
:1. Introduction
2. Materials and Methods
2.1. Materials
2.2. Preparation of RSp-Reinforced Composite
2.3. Physical and Mechanical Properties
2.3.1. Density and Void Content
2.3.2. Microhardness
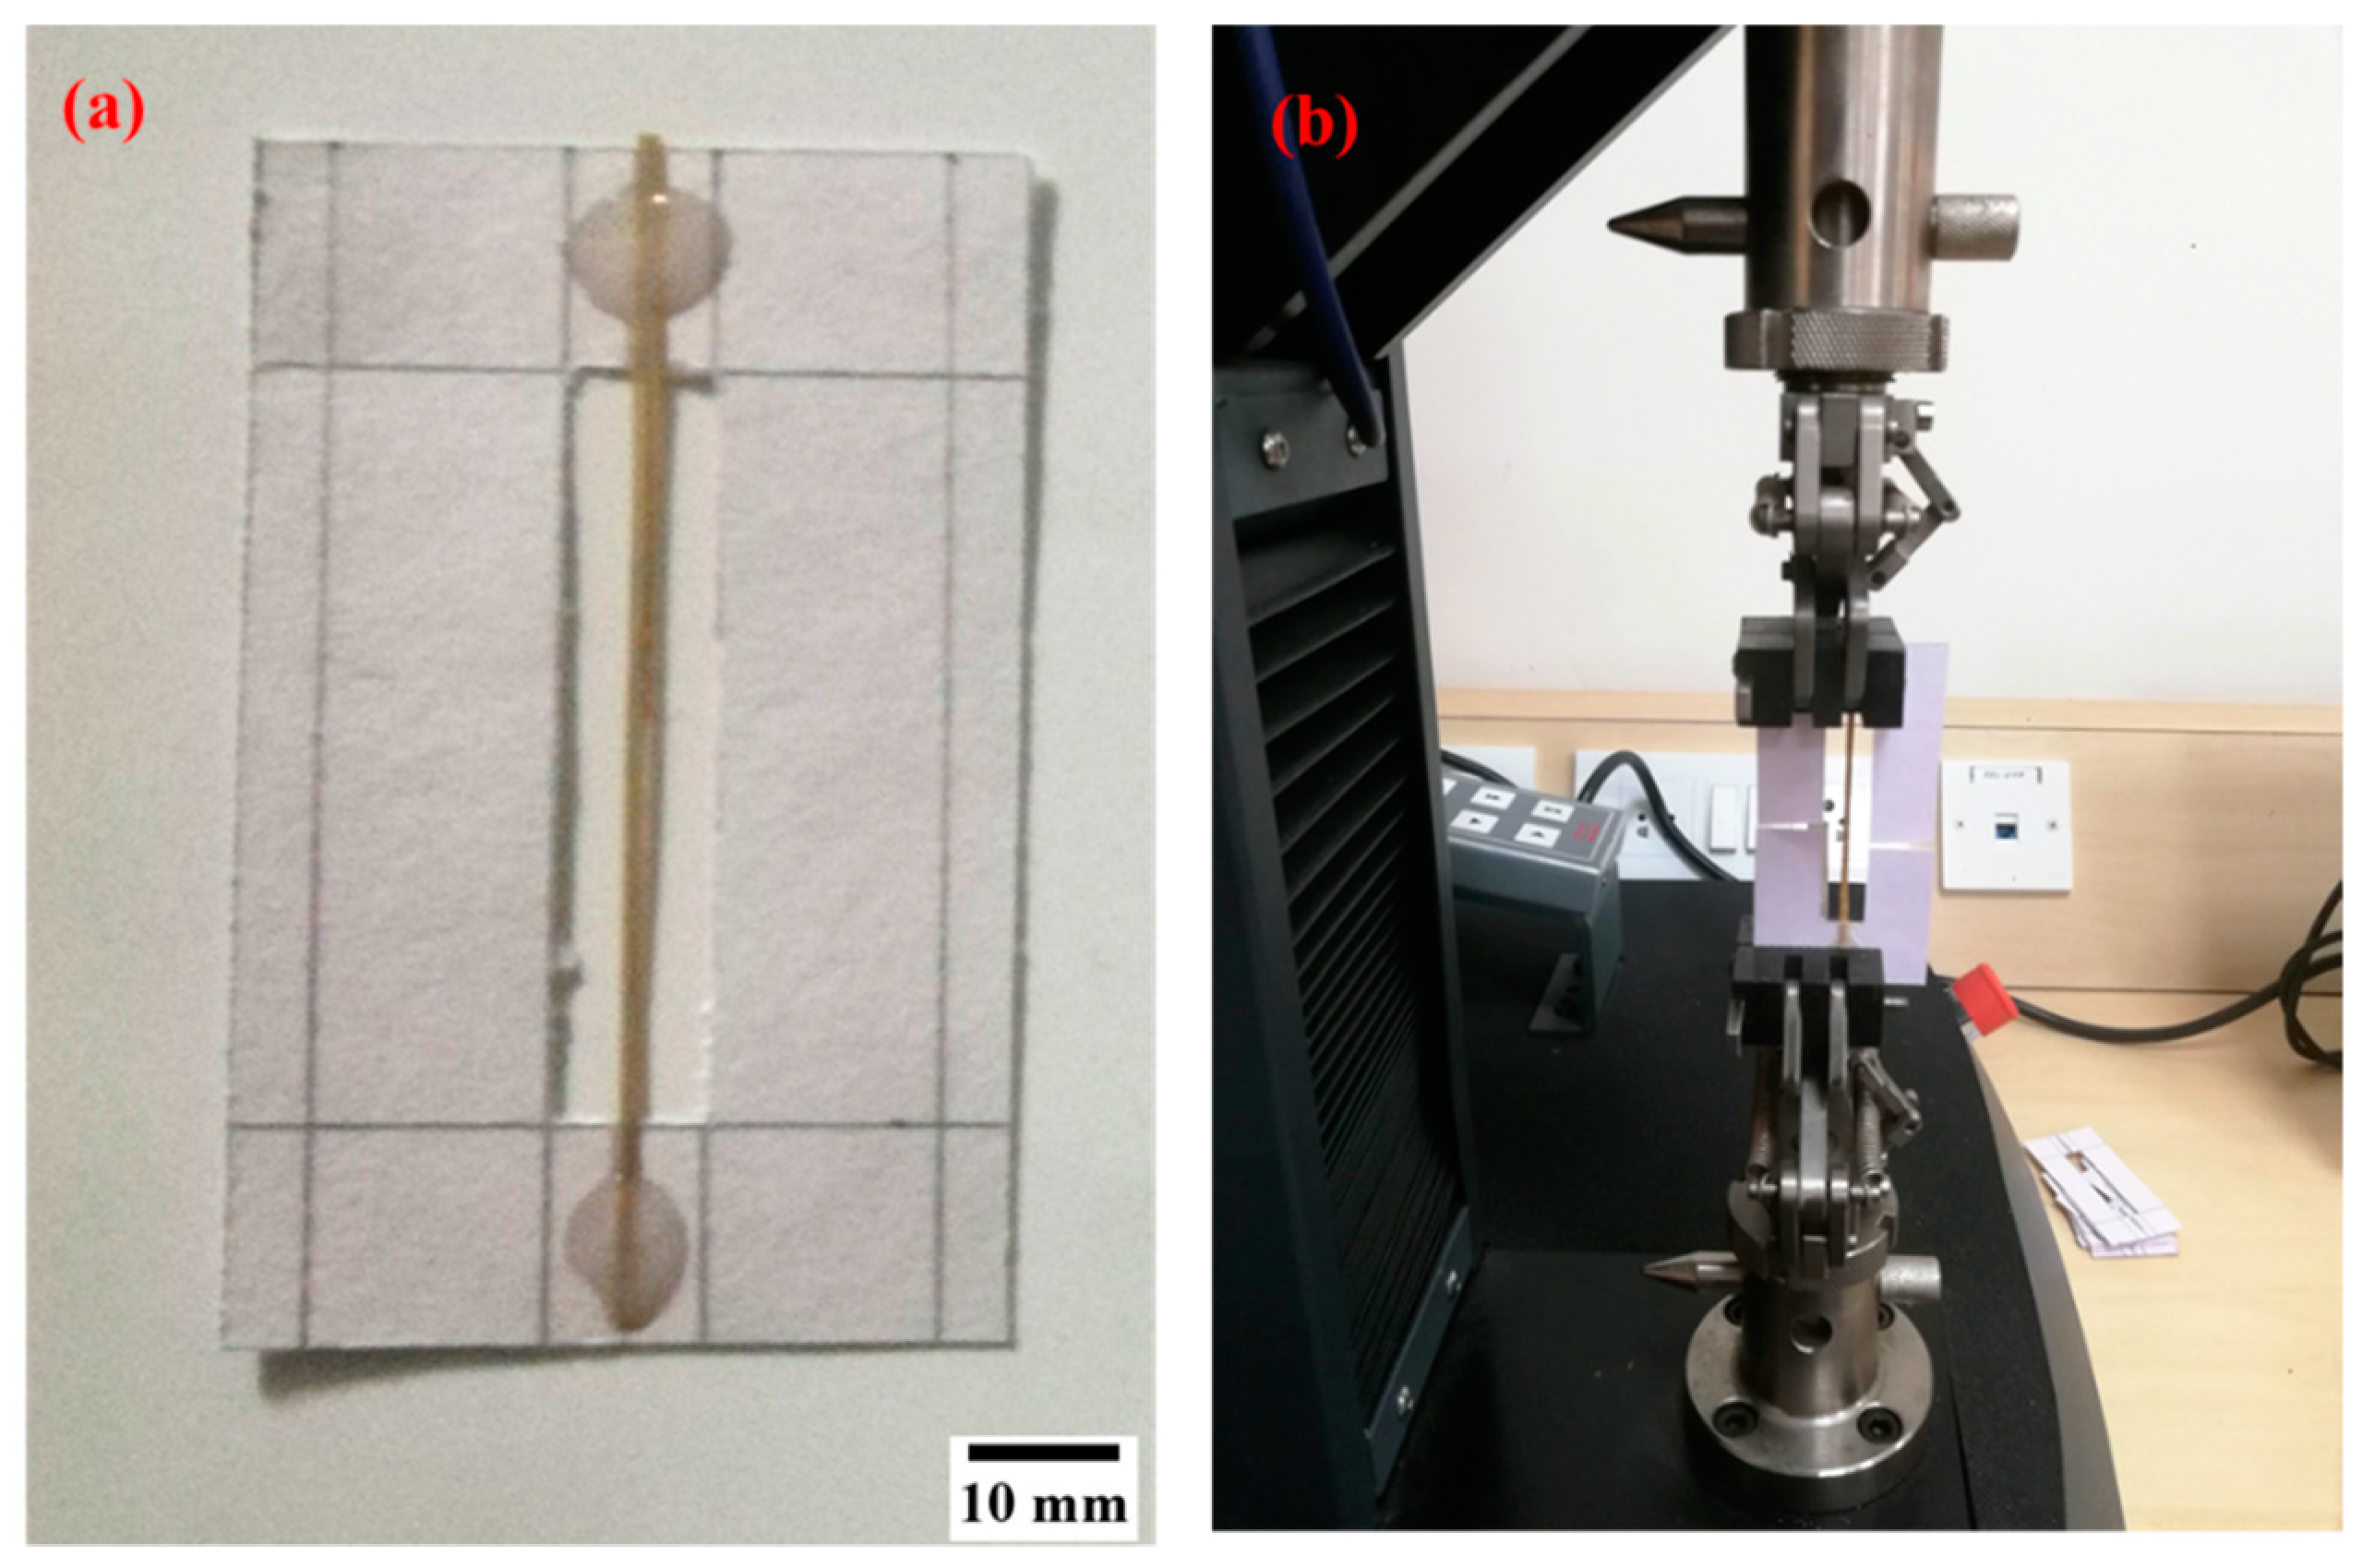
2.3.3. Tensile Strength of the RS and RSp Composite
2.3.4. Liquid Absorption and Microbial Study
3. Results
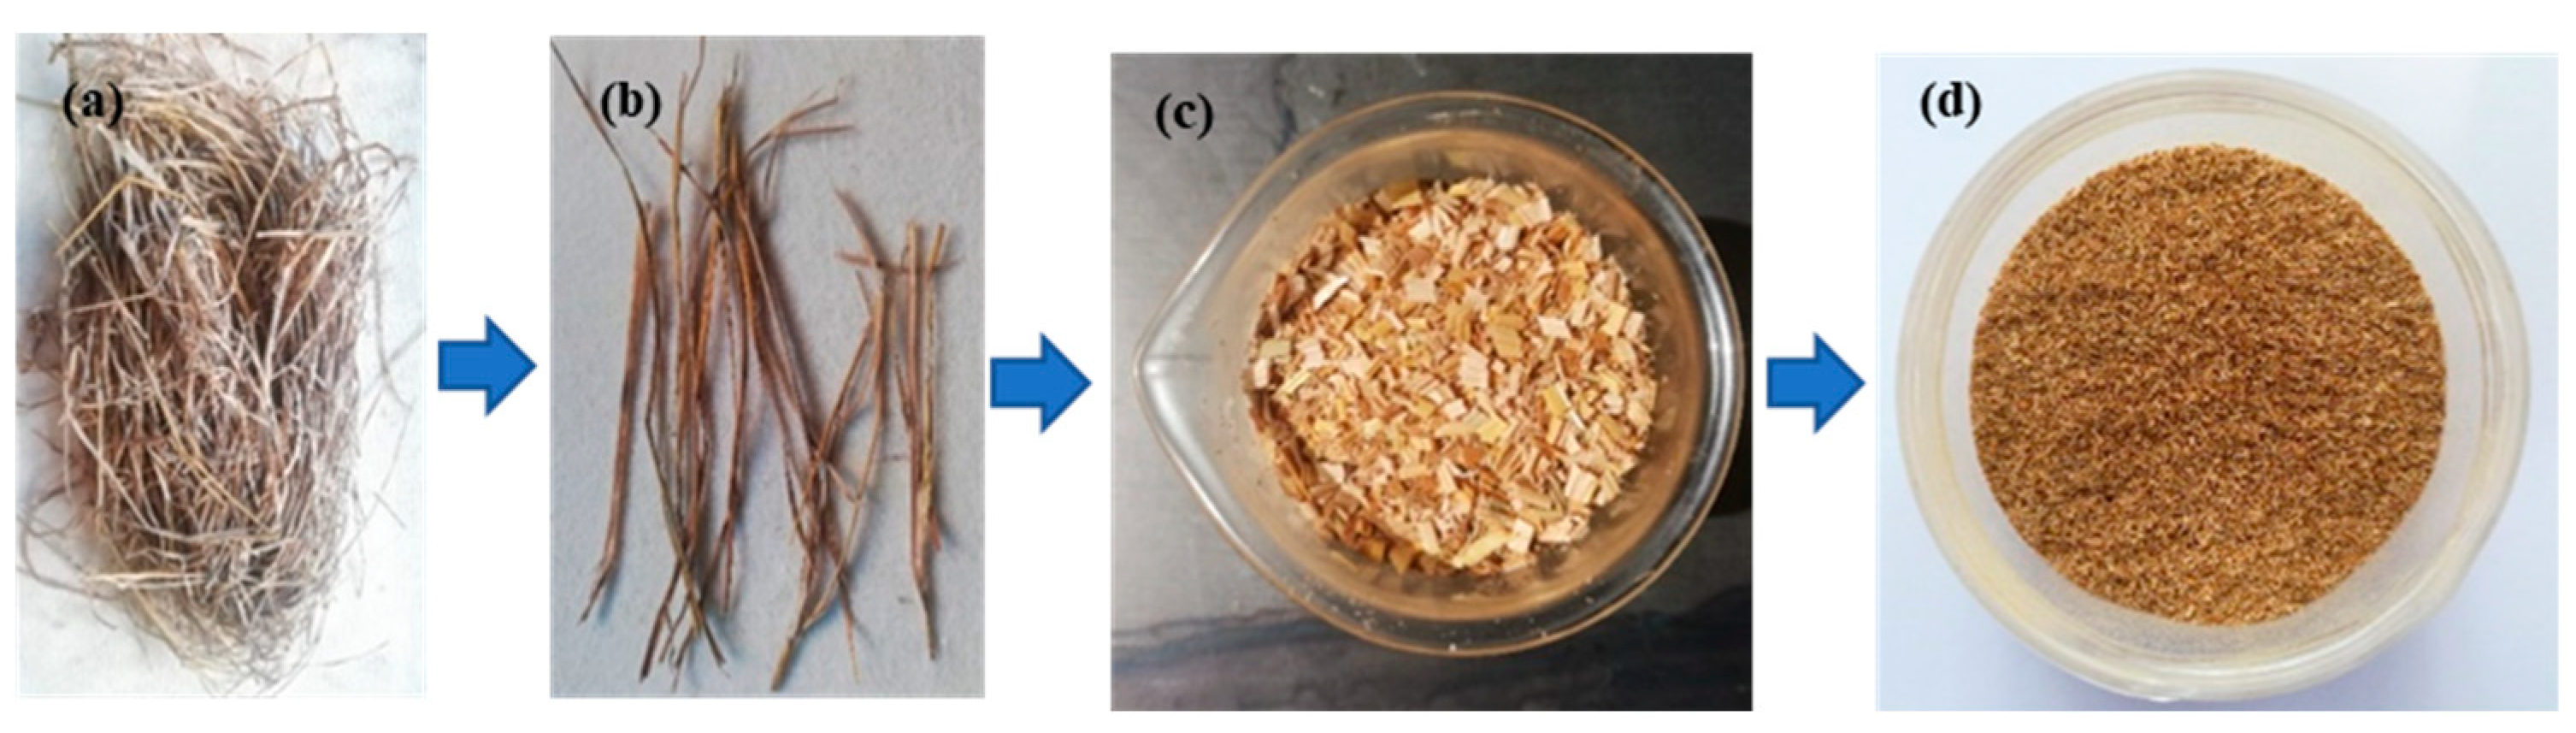
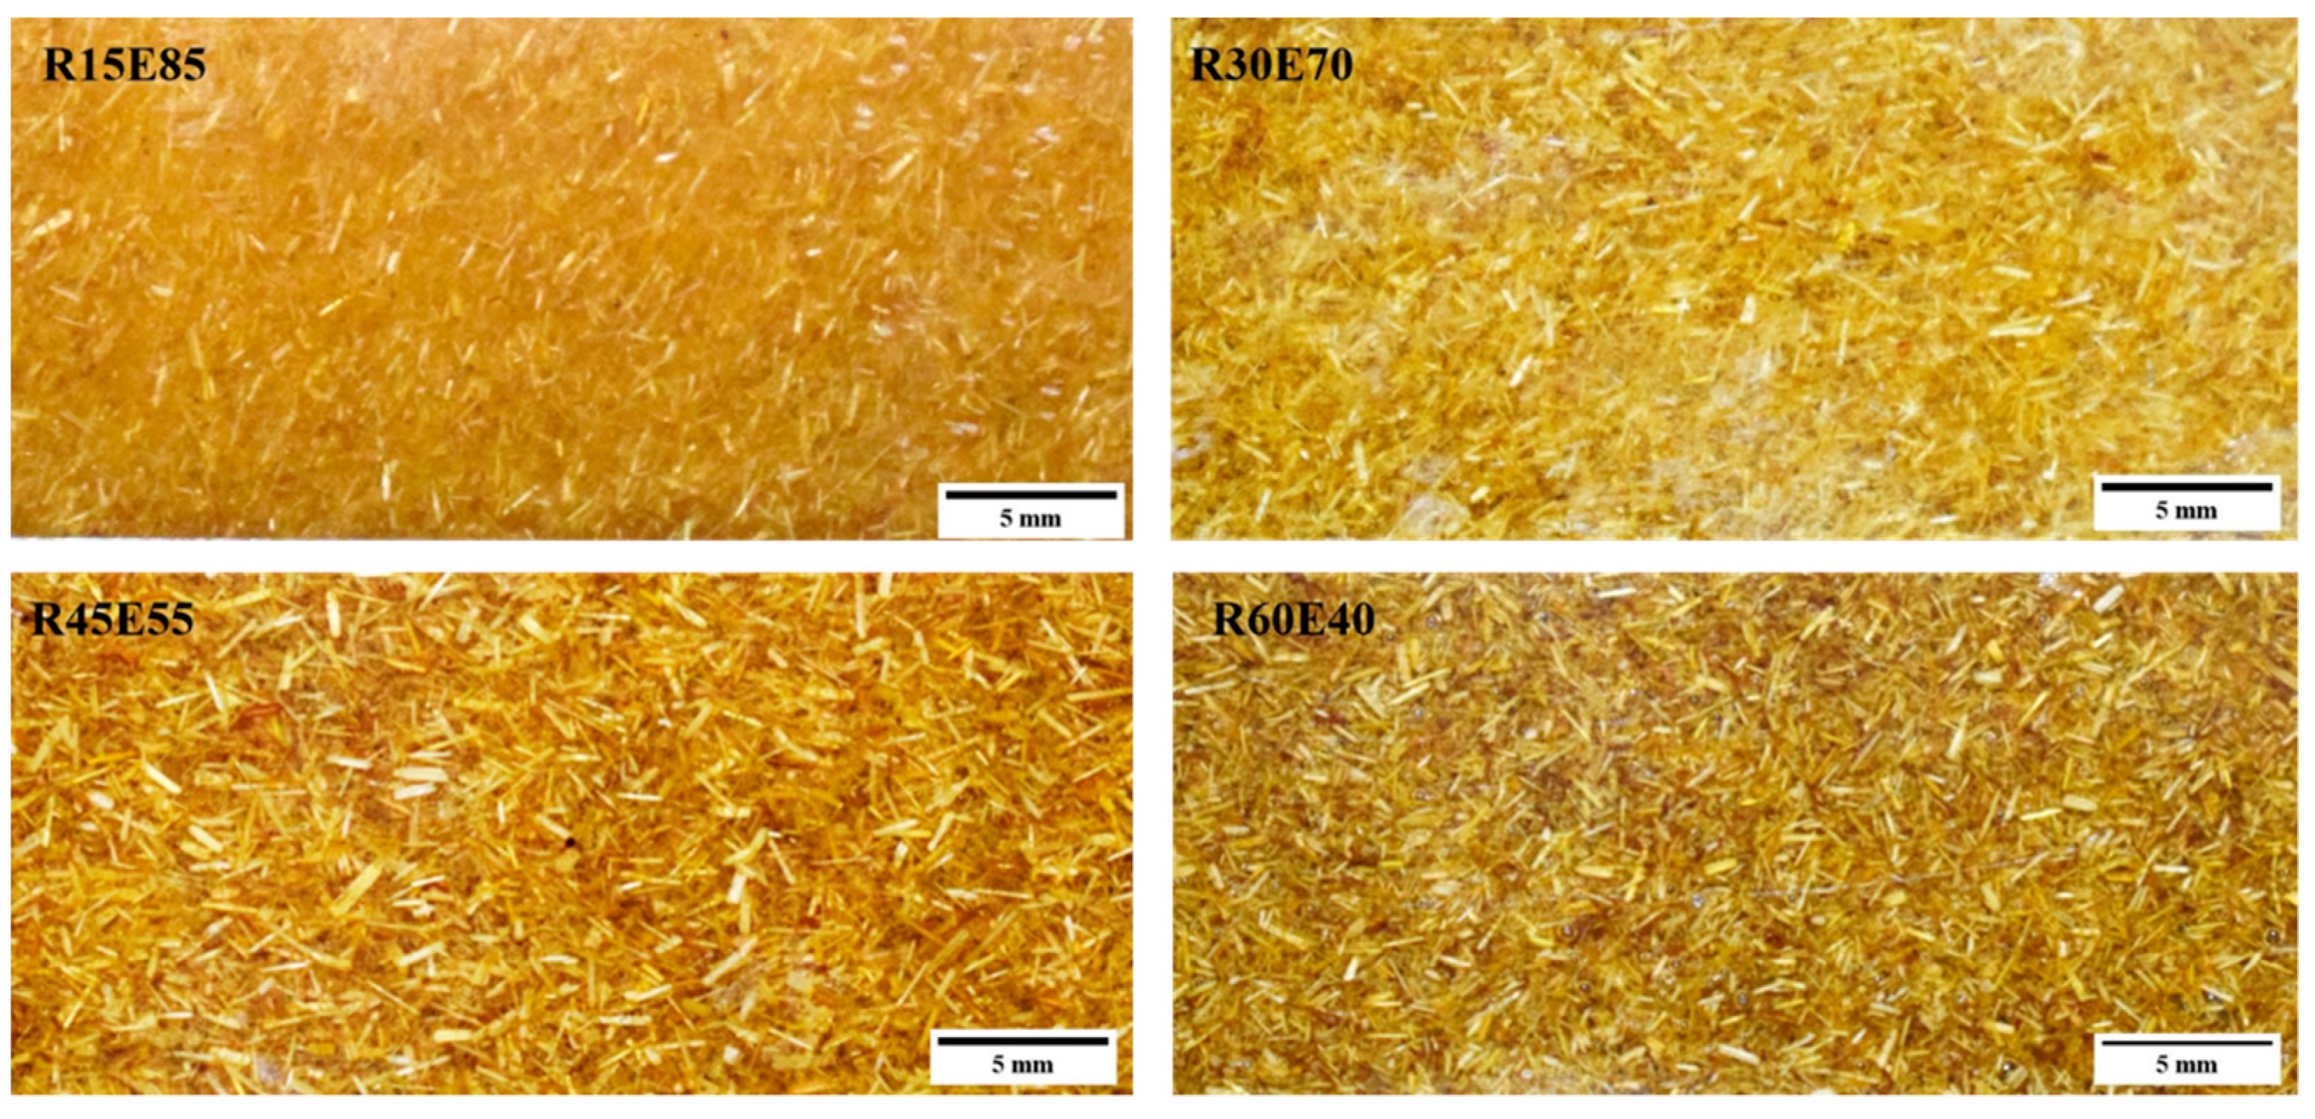
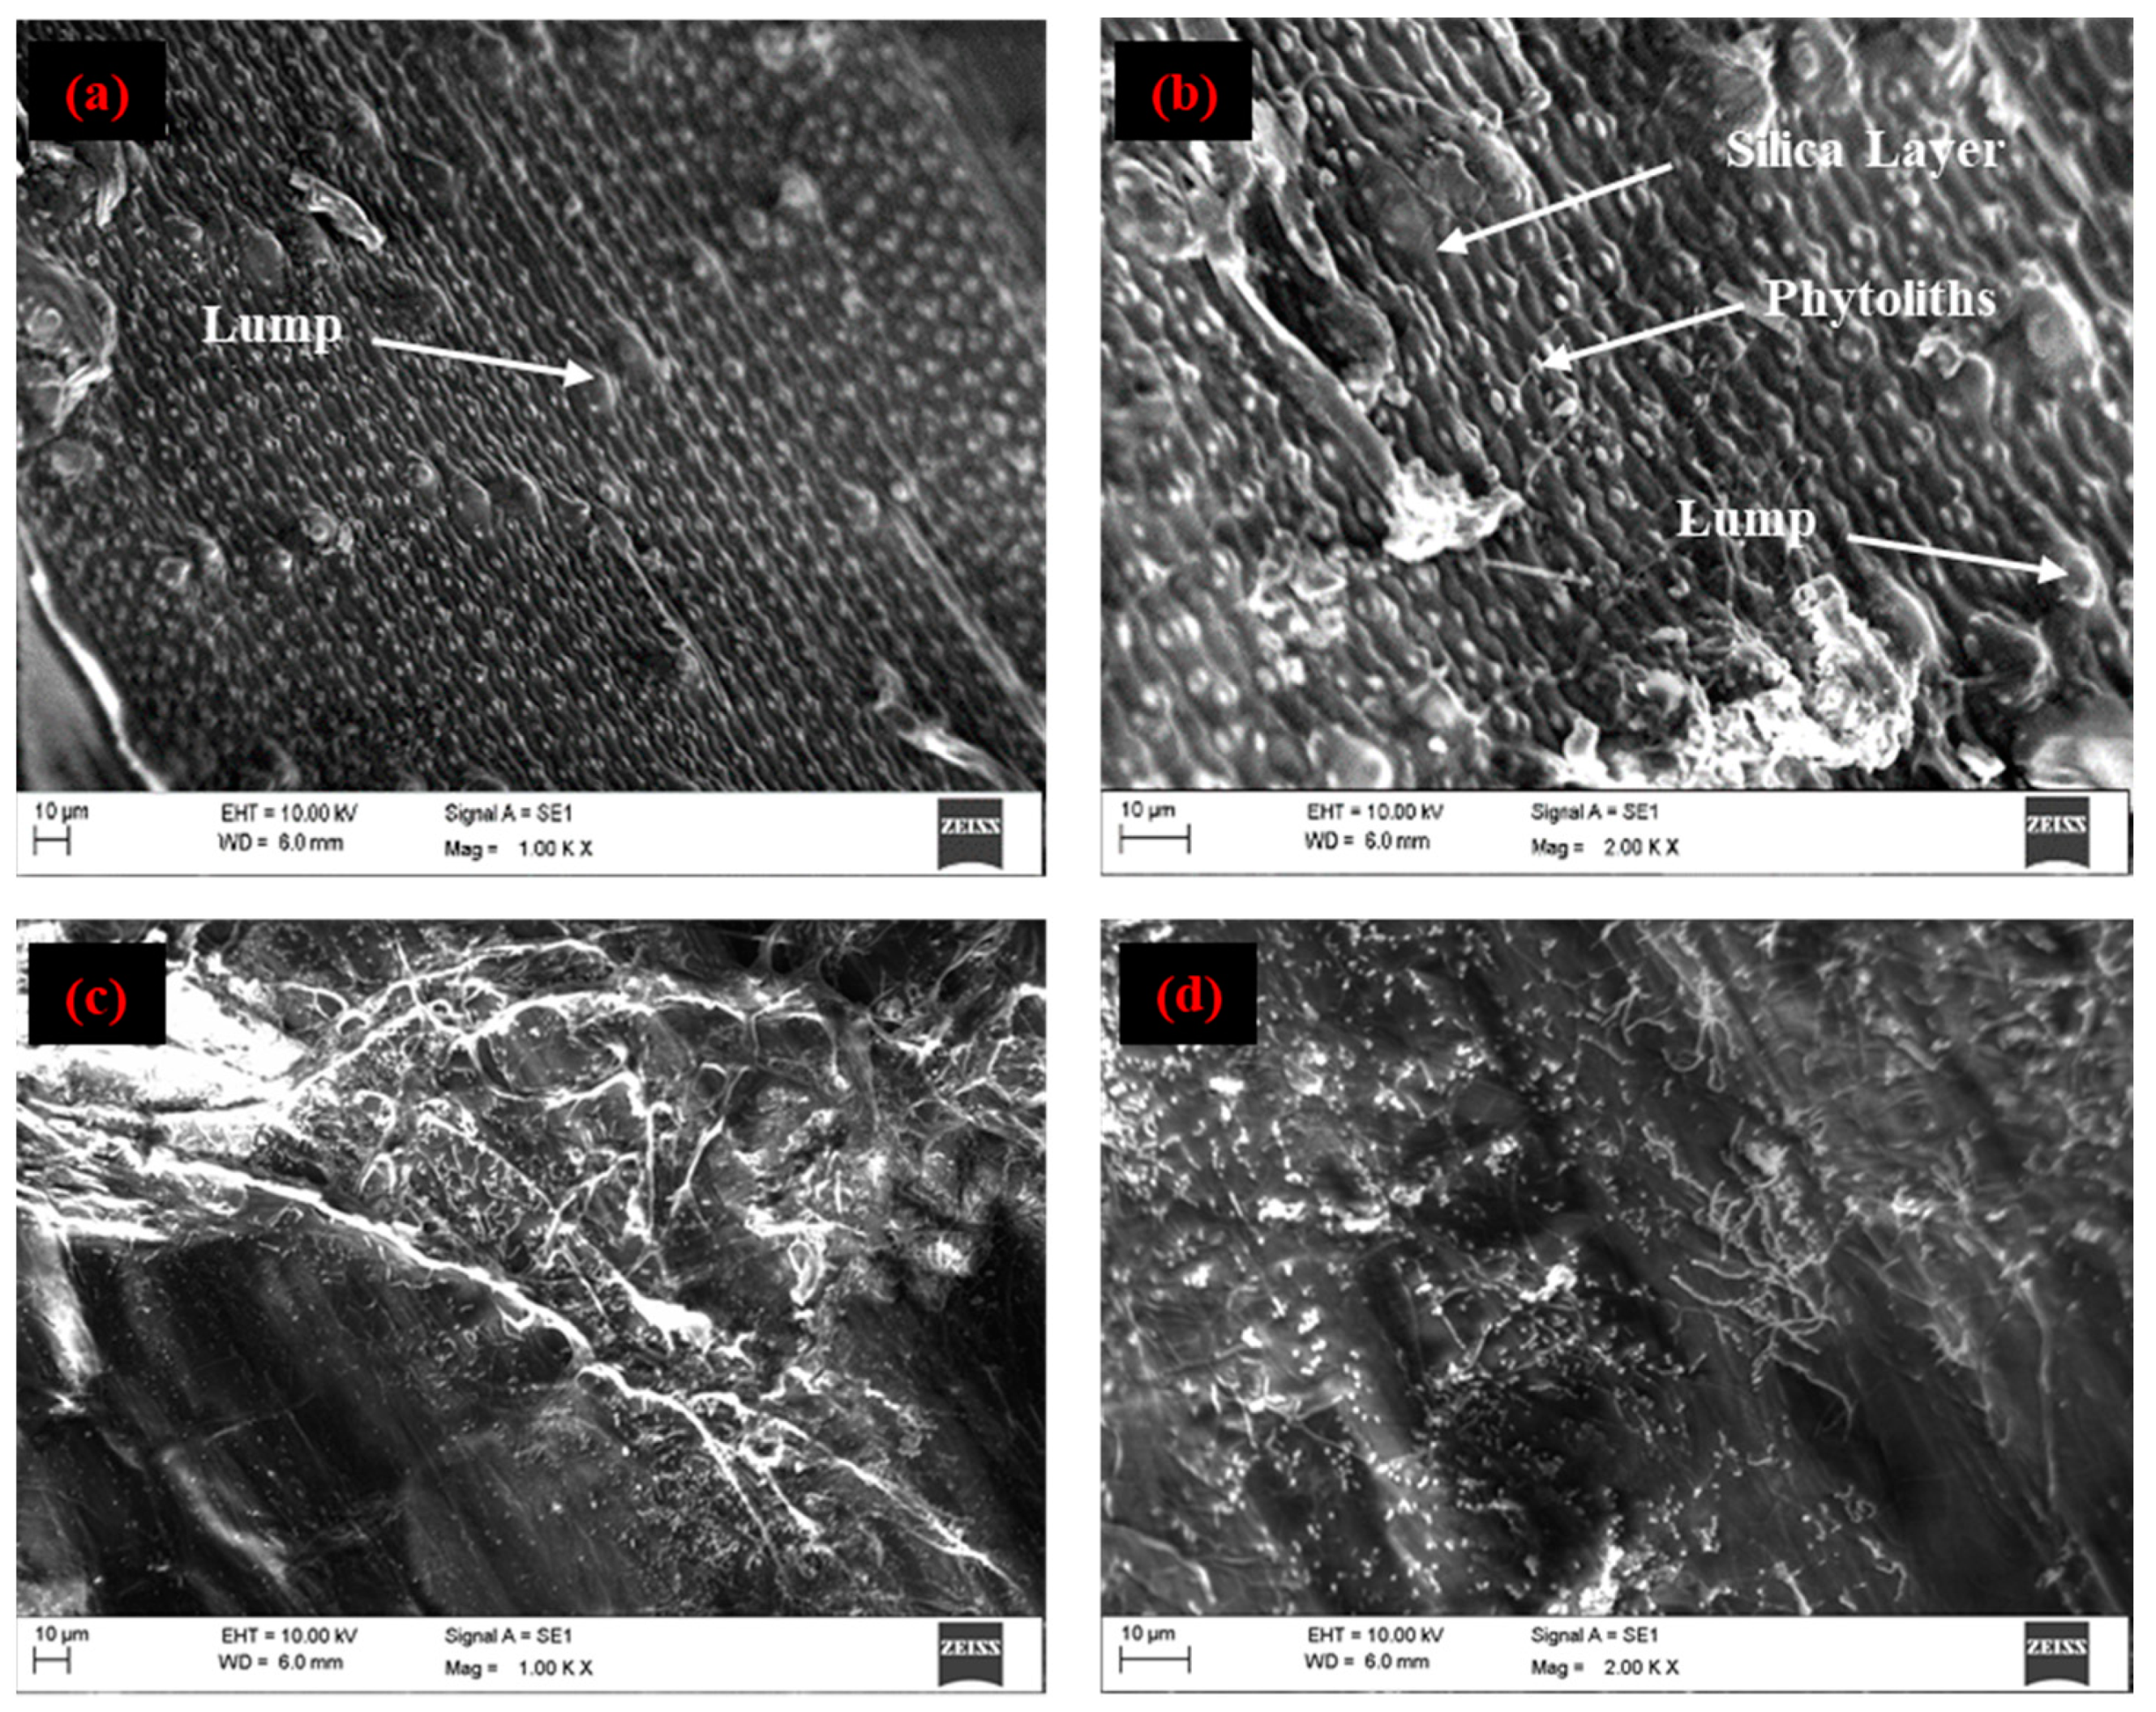
3.1. Morphological Study of Rice Straw
3.2. Density
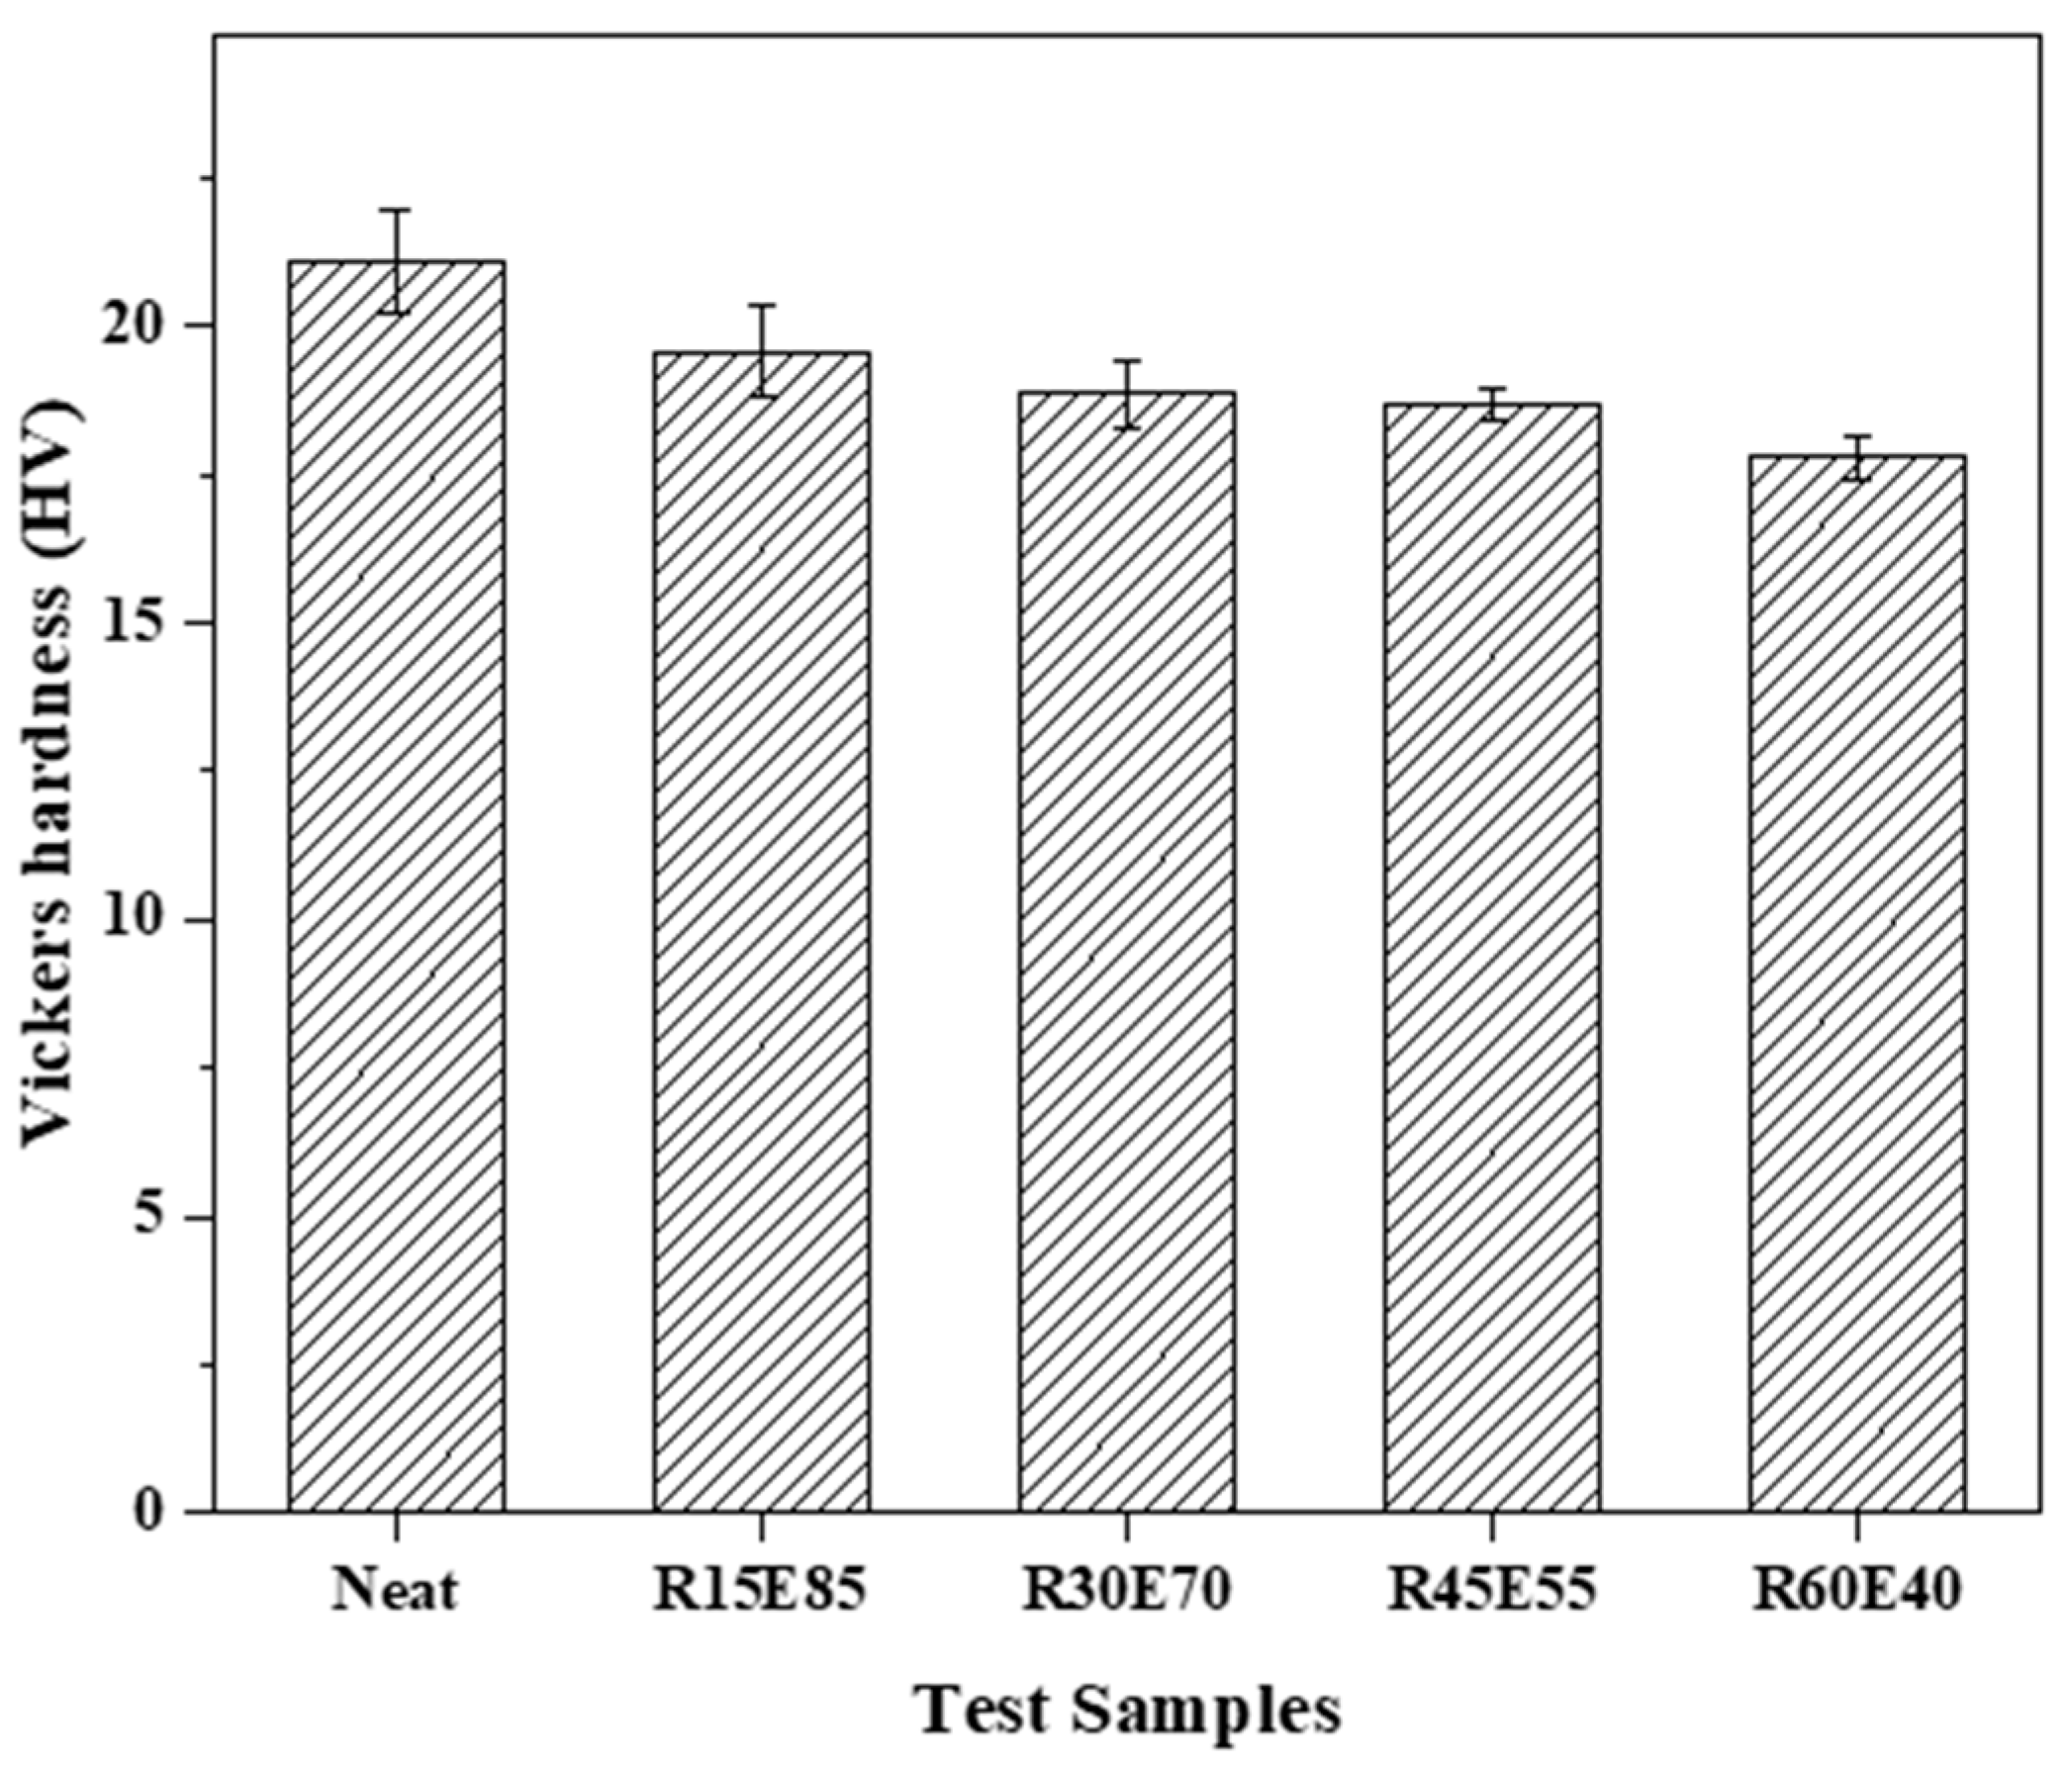
3.3. Microhardness
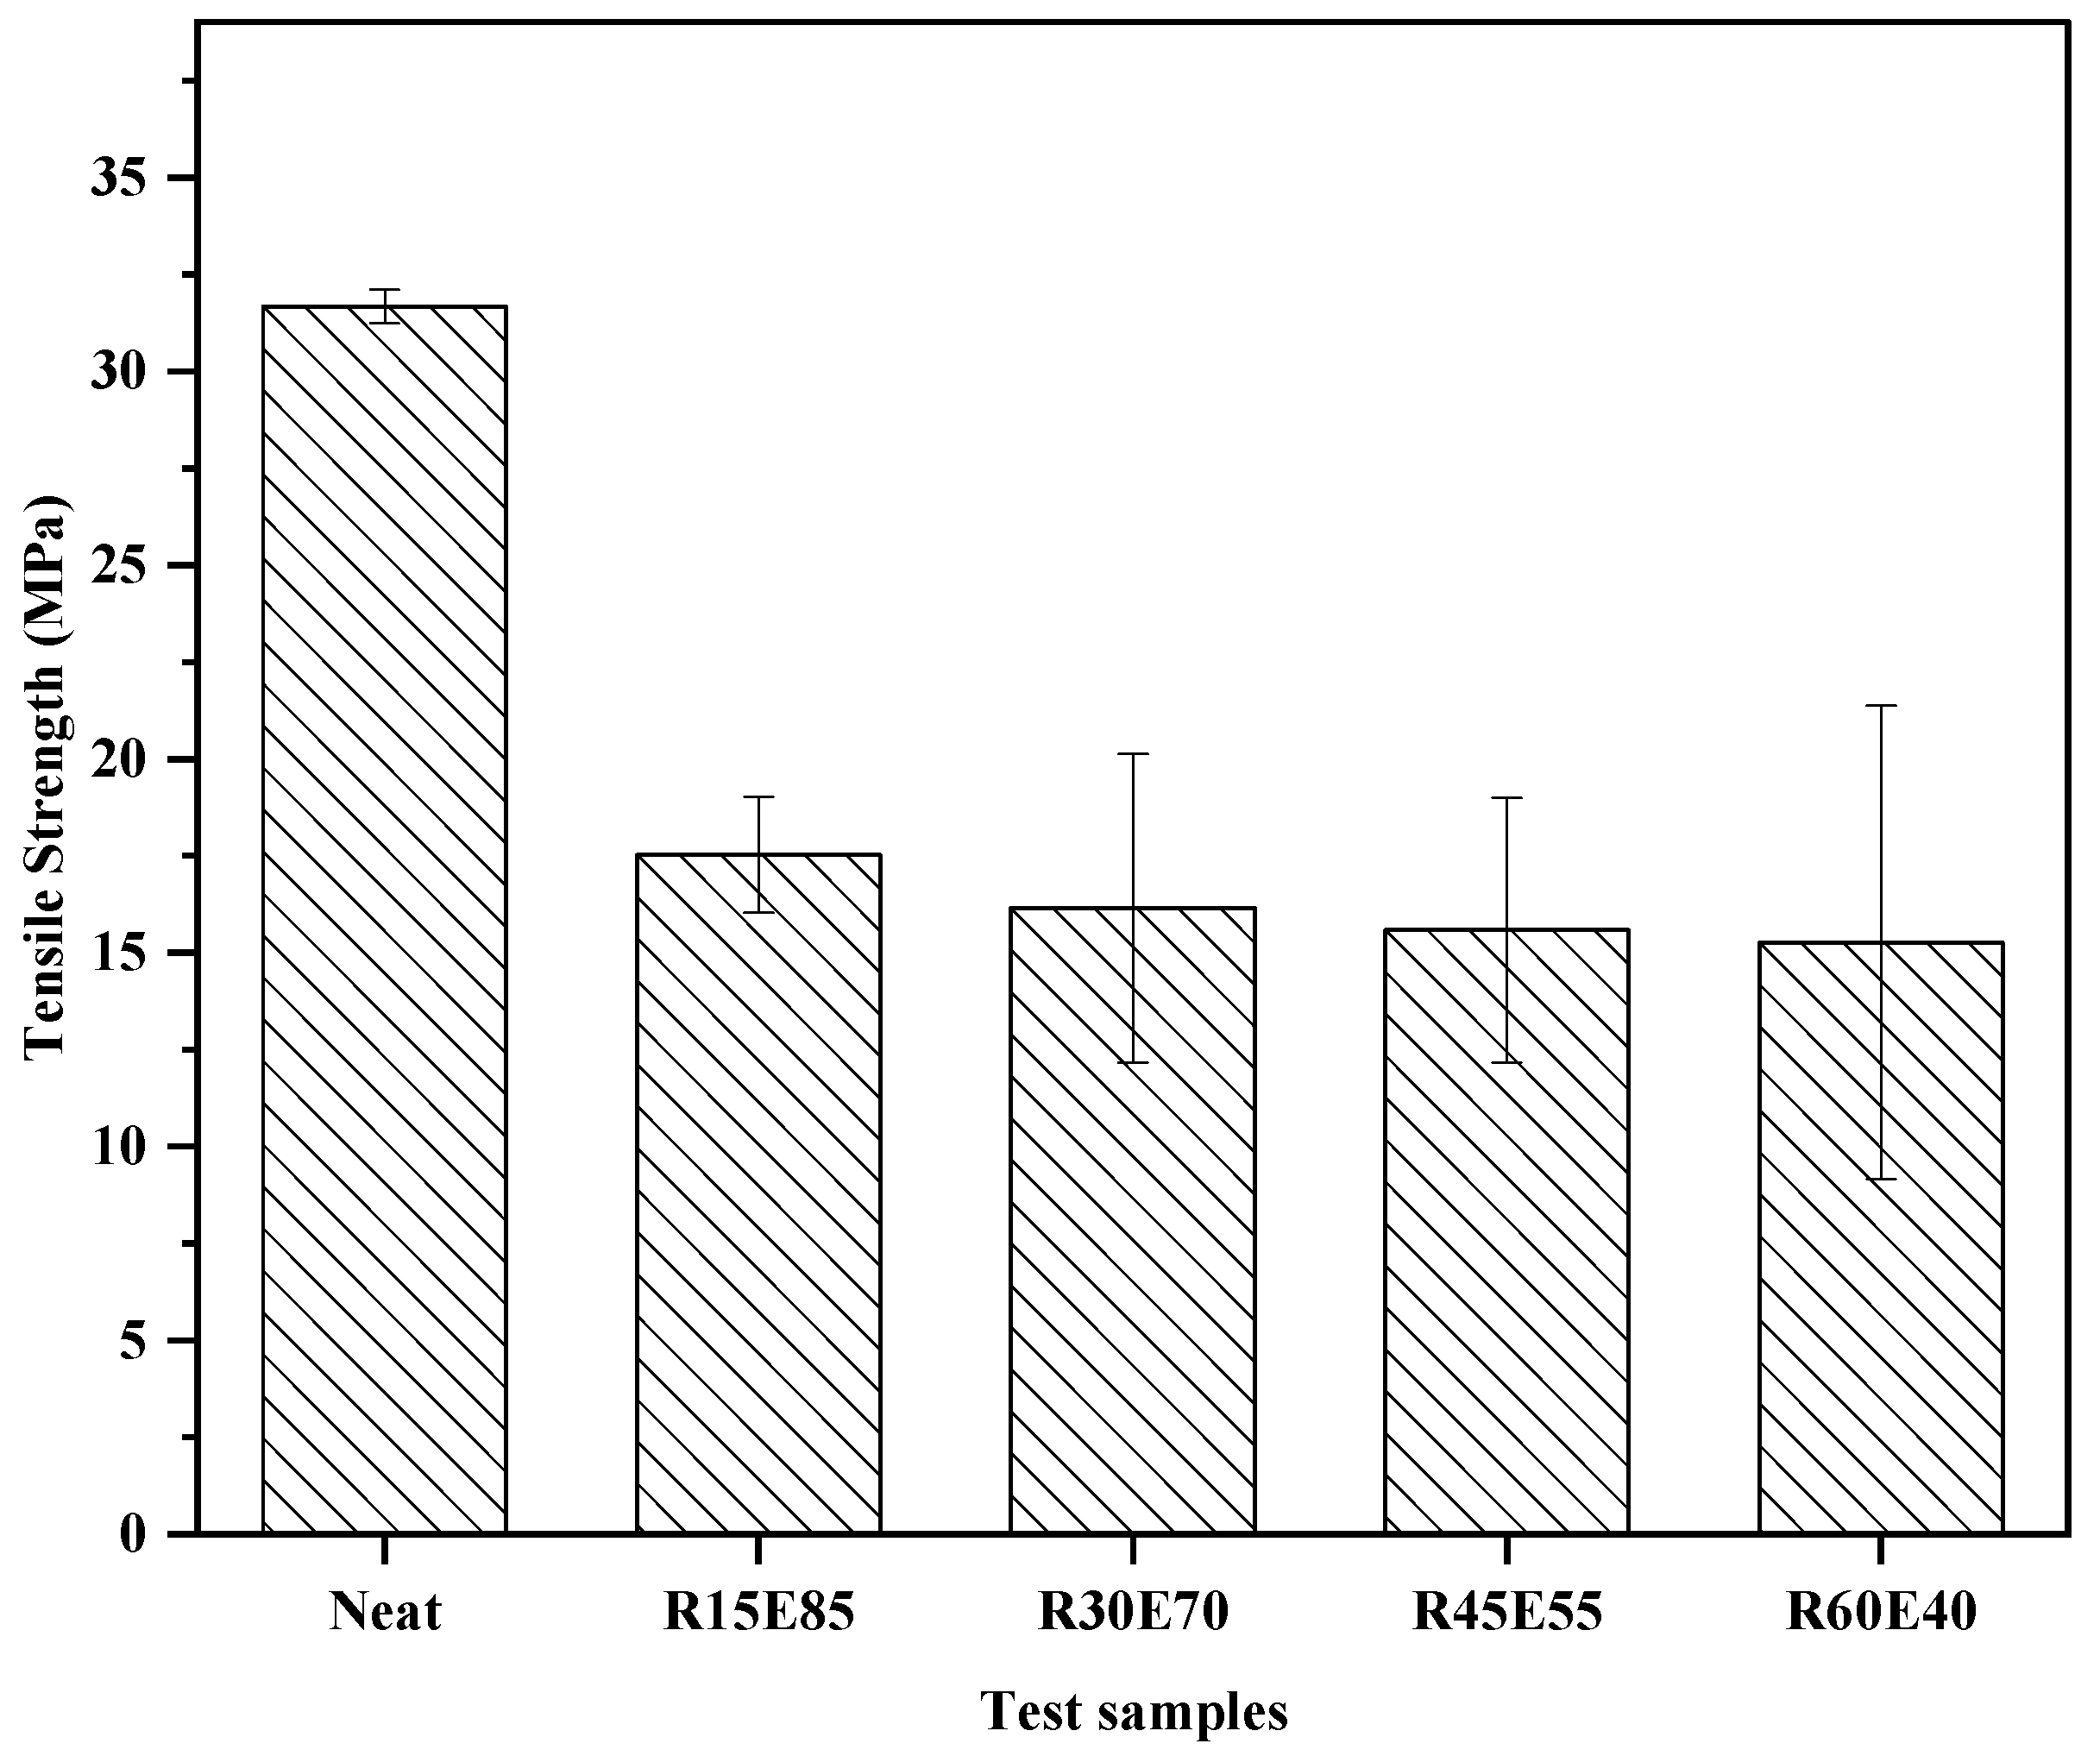
3.4. Tensile Properties
3.5. Flexural Properties
3.6. Fractural Analysis of Tensile and Flexural Test-Failed Specimens
3.7. Liquid Absorption Study
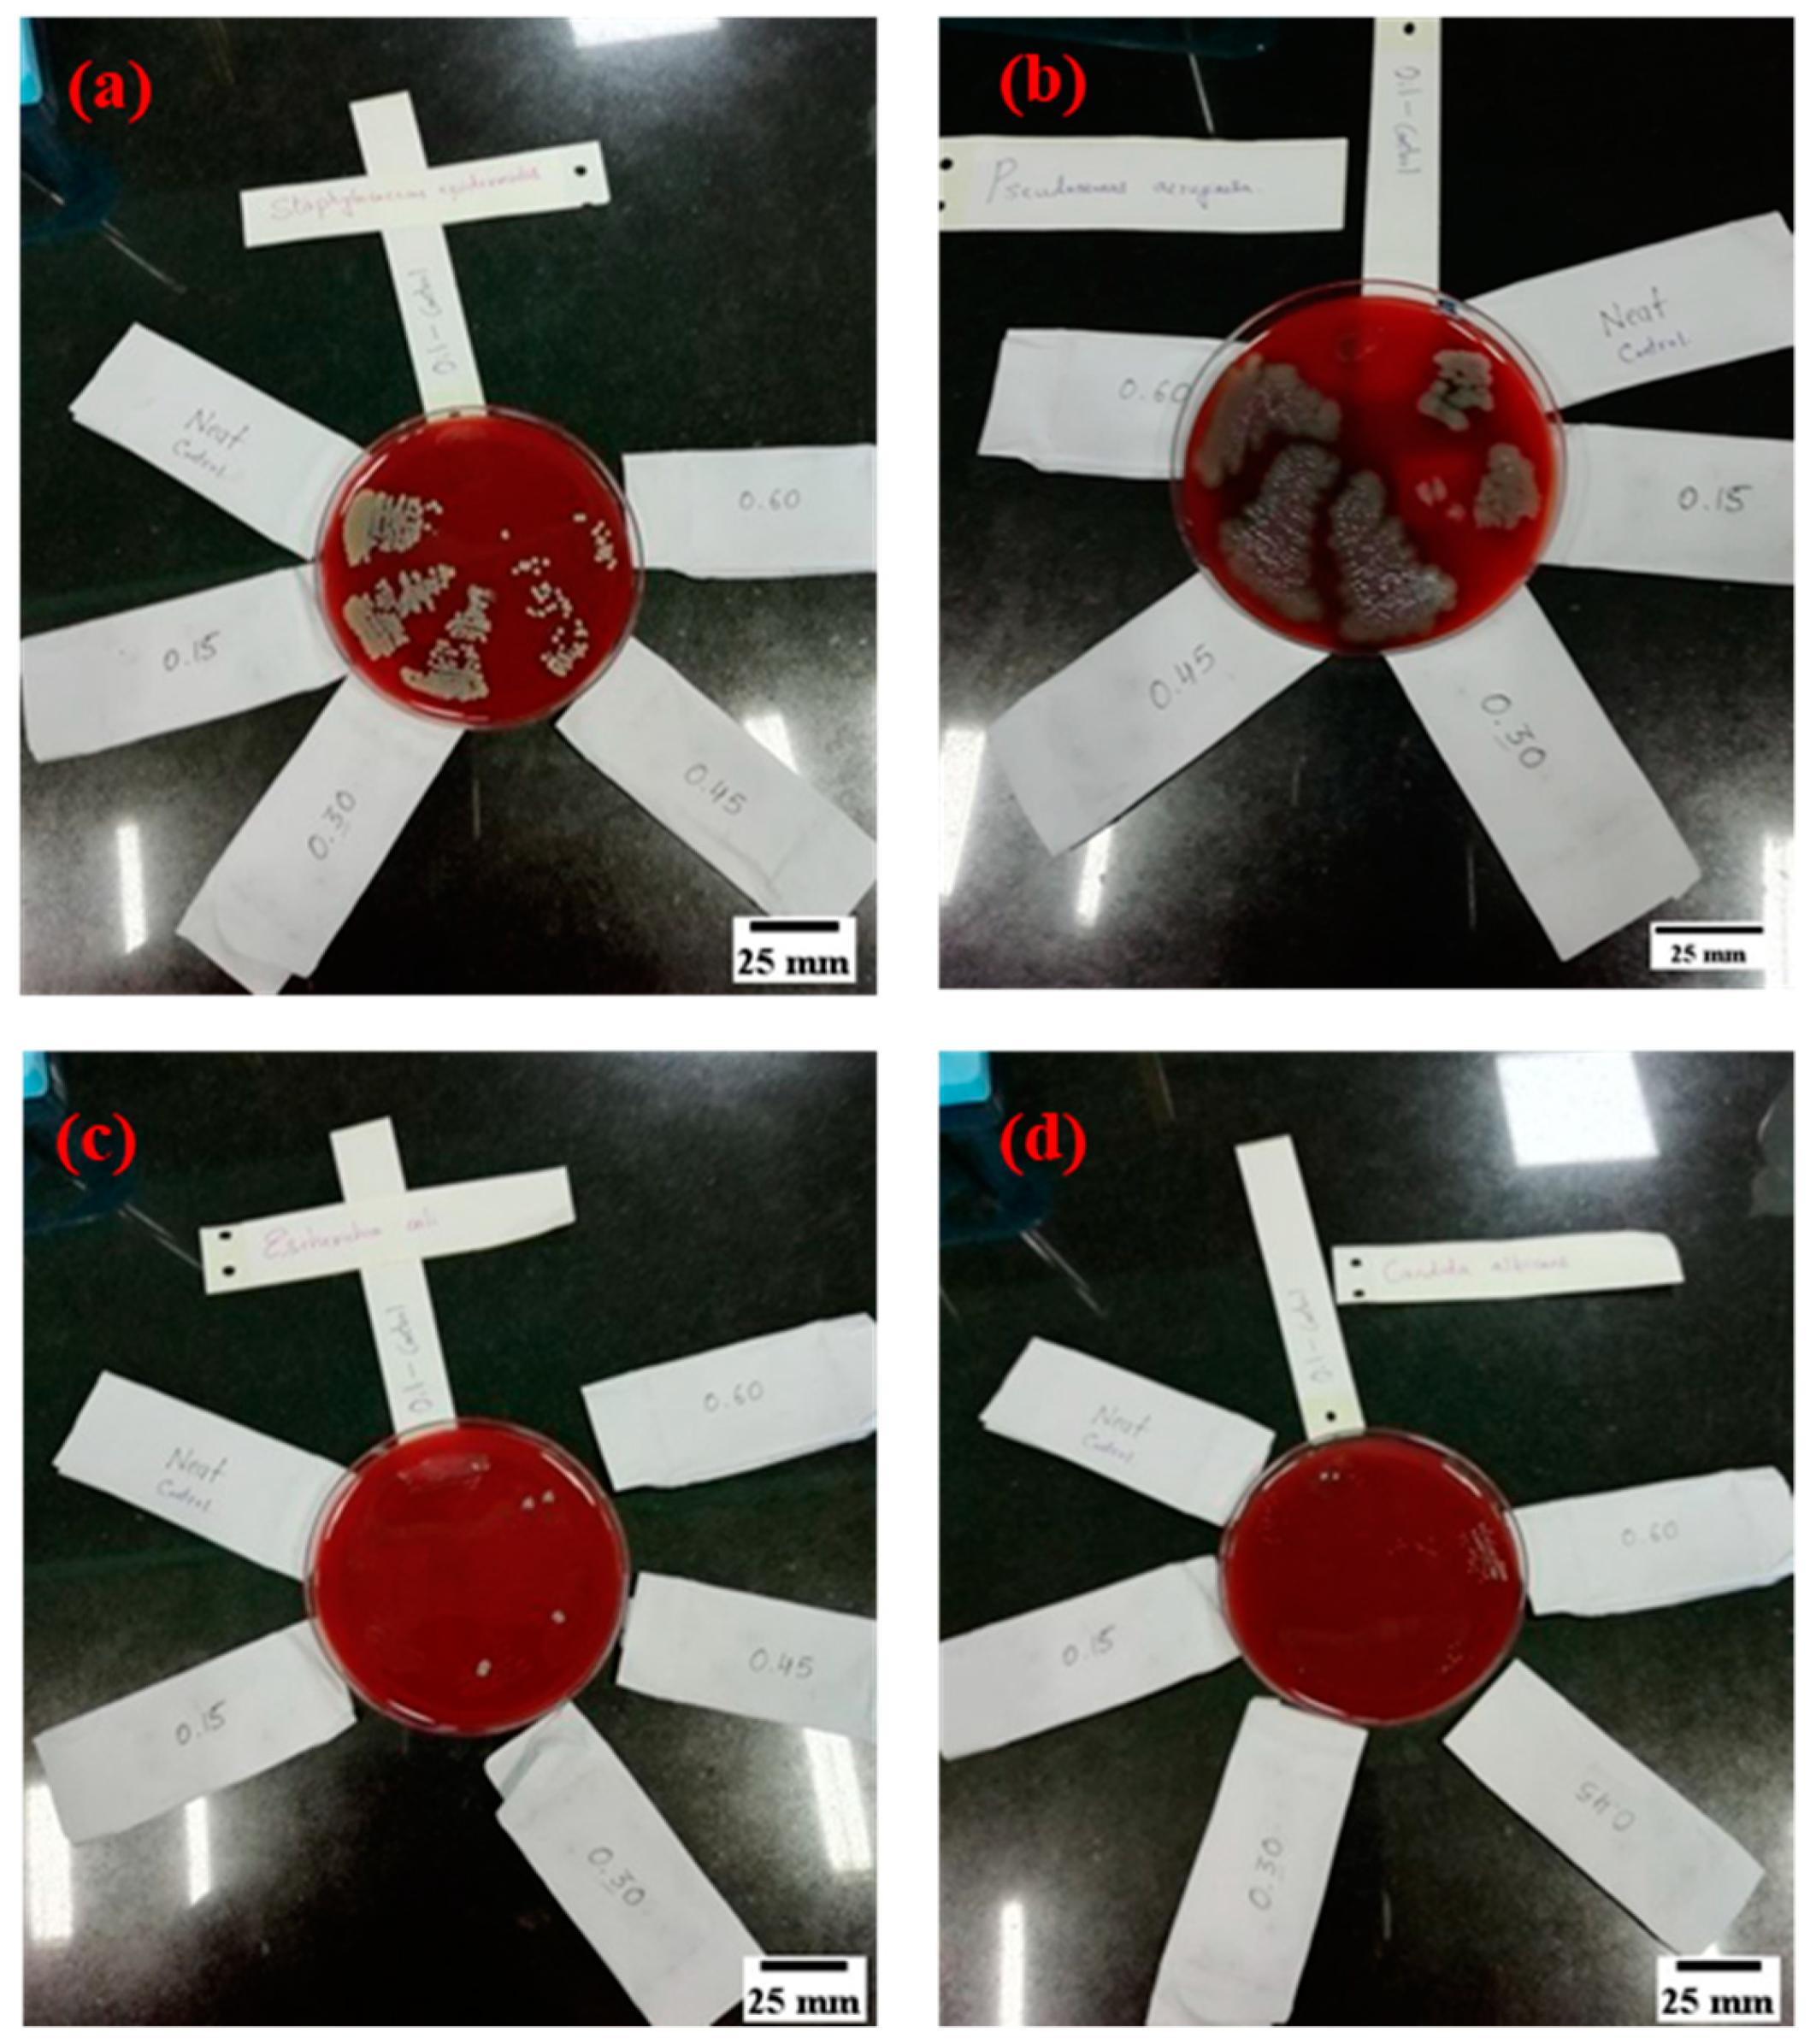
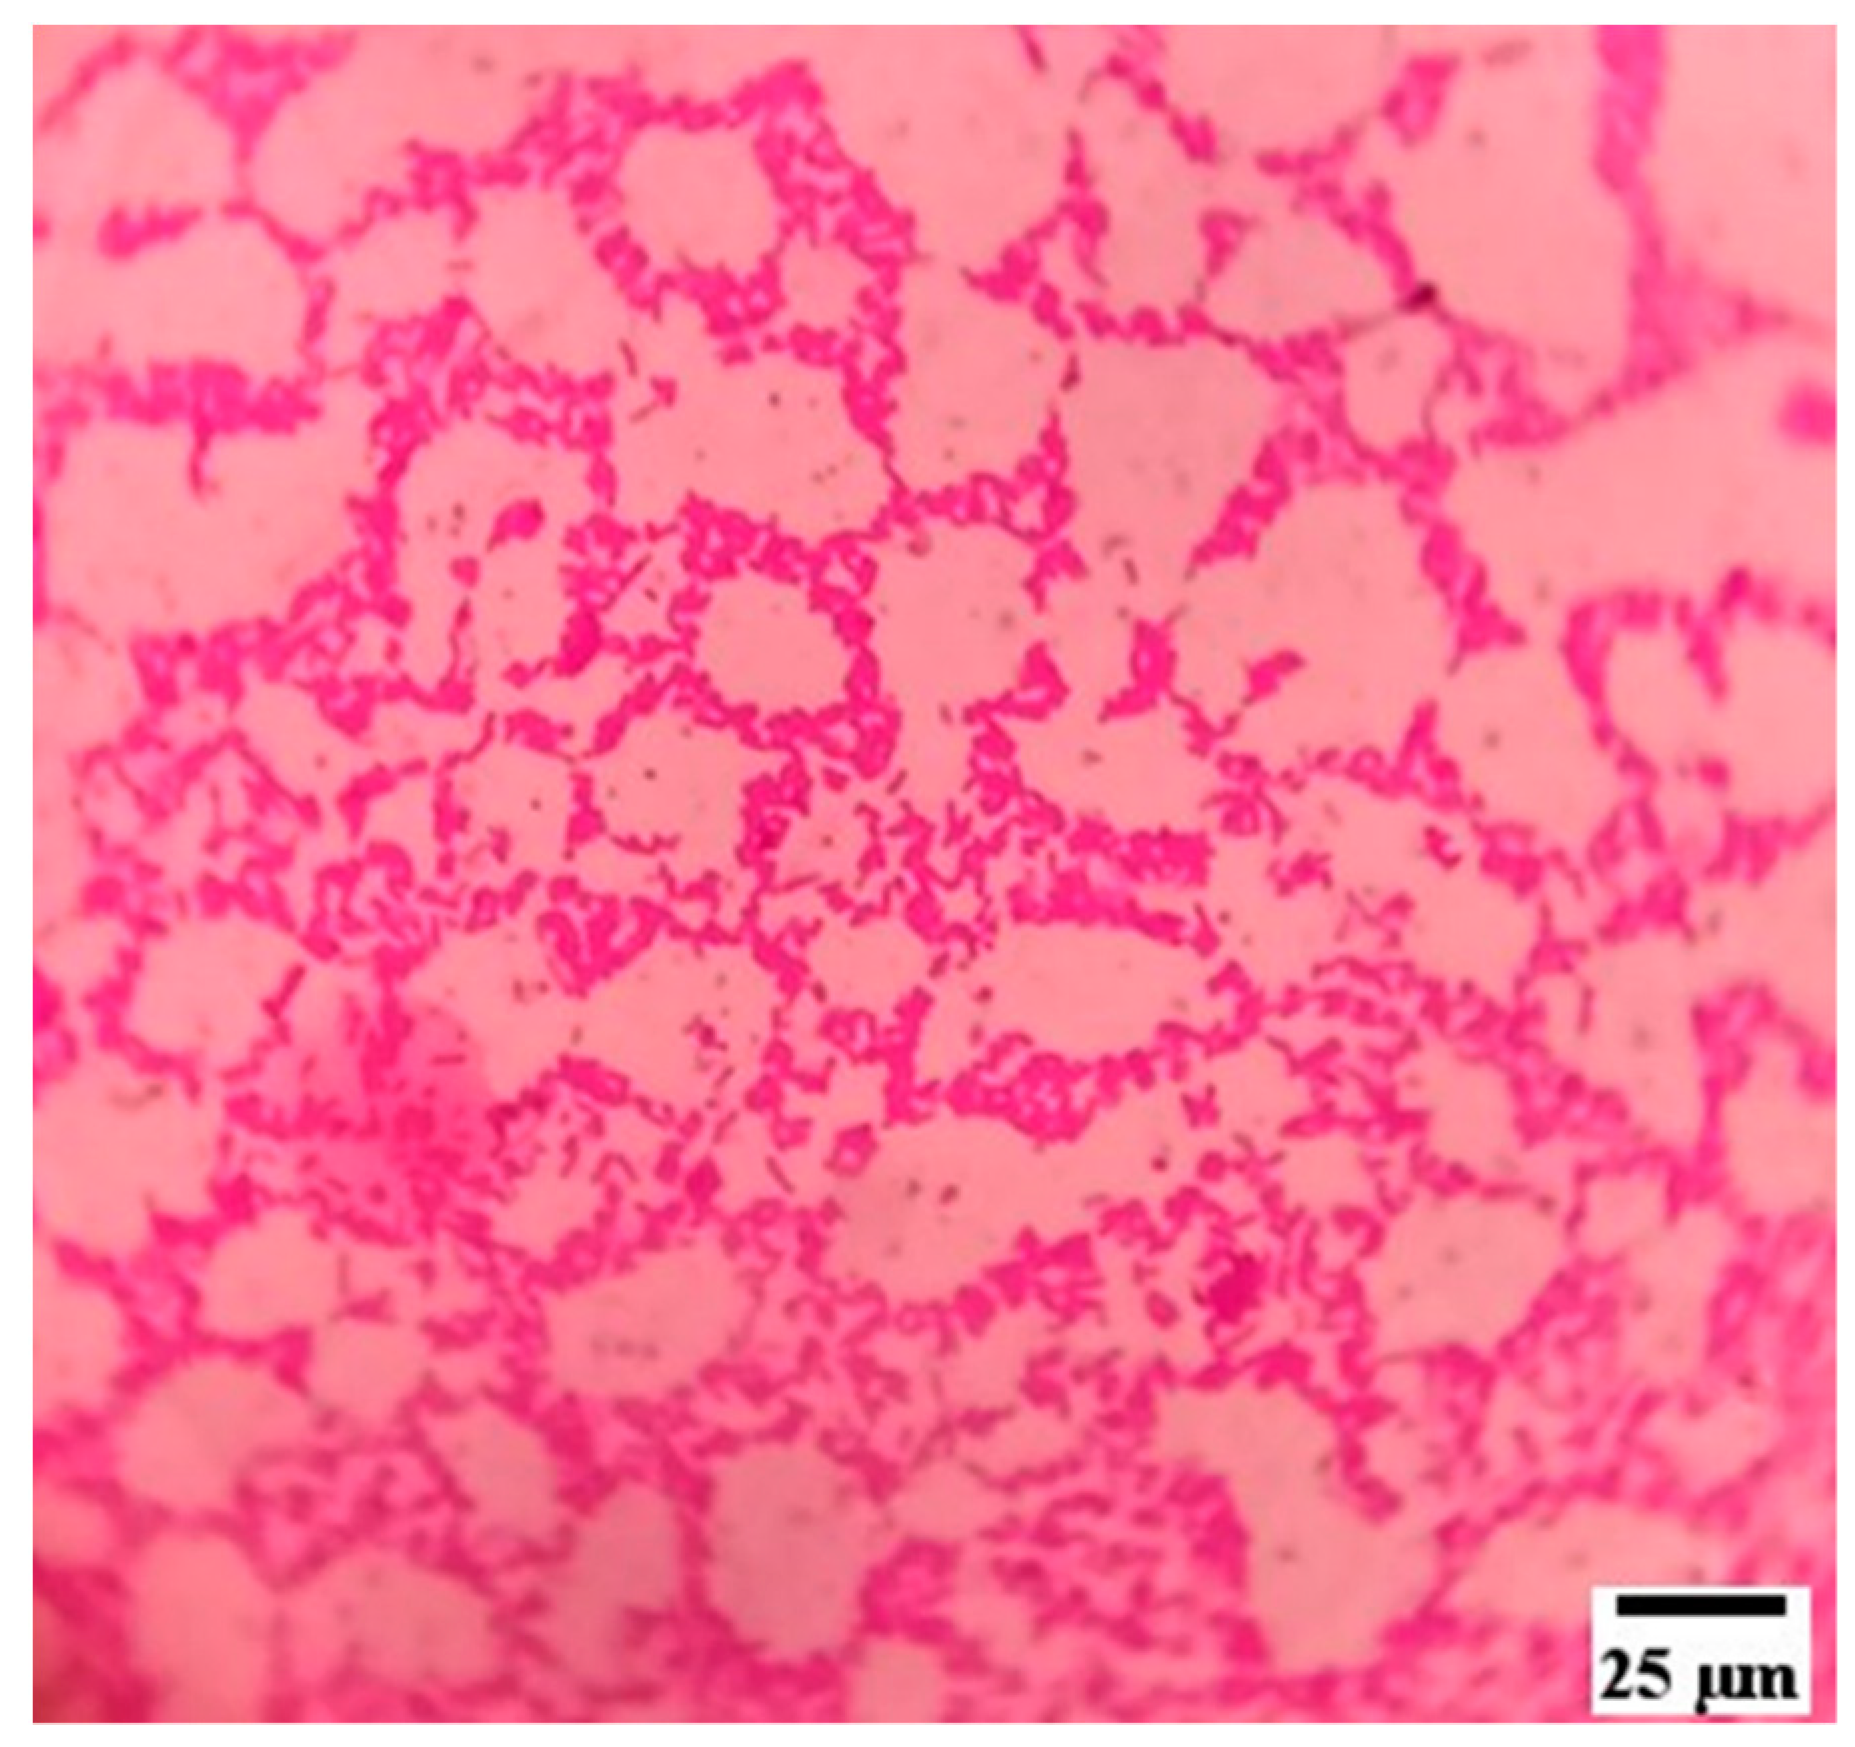
3.8. Microbial Study of RSp Test Samples
4. Conclusions
- The composites with RSp volume of 15% and 45% had the highest σT (17.53 MPa) and σT (43.24 MPa), respectively. The addition of RSp at 60% reduced the density by 54.59%, hardness by 15.63%, tensile strength by 51.78%, and flexural strength by 63.04% compared to properties of the neat epoxy material.
- The tensile and flexural test failed specimens showed brittle fracture behavior, and the failures were observed to occur prominently near the locations of voids. Interestingly, fiber pull-outs were not found on the fractured surface. The fiber was split at the location of the crack, and the split fibers were intact with the matrix.
- The RSp composite was resistant to the exposure of water and KDT oil. Soaking of test materials for up to 696 h in KDT oil showed <2% absorption. In addition, the test samples also showed the absence of microbial growth under the exposure of water and KDT treatment oil, indicating the suitability of the material for making ayurvedic treatment tables and accessories.
Author Contributions
Funding
Institutional Review Board Statement
Informed Consent Statement
Data Availability Statement
Conflicts of Interest
References
- Shiv, K.L.; Jat, H.S.; Arvind, K.Y.; Sidhu, H.S.; Jat, M.L.; Madhu, C.; Jyotsna, K.P.; Sharma, P.C. Burning issues of paddy residue management in north-west states of India. Renew. Sustain. Energy Rev. 2018, 81, 693–706. [Google Scholar] [CrossRef]
- Abdurrahman, M.I.; Chaki, S.; Saini, G. Stubble burning: Effects on health & environment, regulations and management practices. Environ. Adv. 2020, 2, 100011. [Google Scholar] [CrossRef]
- Asdrubali, F.; D’Alessandro, F.; Schiavoni, S. A review of unconventional sustainable building insulation materials. Sustain. Mater. Technol. 2015, 4, 1–17. [Google Scholar] [CrossRef]
- Binici, H.; Eken, M.; Dolaz, M.; Aksogan, O. An environmentally friendly thermal insulation material from sunflower stalk, textile waste and stubble fibres. Constr. Build. Mater. 2014, 51, 24–33. [Google Scholar] [CrossRef]
- Binici, H.; Gemci, R.; Kucukonder, A.; Solak, H.H. Investigating sound insulation, thermal conductivity and radioactivity of chipboards produced with cotton waste, fly ash and barite. Constr. Build. Mater. 2012, 30, 826–832. [Google Scholar] [CrossRef]
- Binici, H.; Gemci, R.; Aksogan, O.; Kaplan, H. Insulation properties of bricks made with cotton and textile ash wastes. Int. J. Mater. Res. 2010, 101, 894–899. [Google Scholar] [CrossRef]
- El, H.R.; Khalaf, Y.; Lacoste, C.; Nakhl, M.; Lacroix, P. A flame retarded chitosan binder for insulating miscanthus/recycled textile fibers reinforced bio composites. J. Appl. Polym. Sci. 2019, 136, 47306. [Google Scholar] [CrossRef]
- Hassanin, A.H.; Candan, Z.; Demirkir, C.; Hamouda, T. Thermal insulation properties of hybrid textile reinforced biocomposites from food packaging waste. J. Ind. Text. 2016, 47, 1024–1037. [Google Scholar] [CrossRef]
- Ingrao, C.; Lo Giudice, A.; Tricase, C.; Rana, R.; Mbohwa, C.; Siracusa, V. Recycled PET fibre-based panels for building thermal insulation: Environmental impact and improvement potential assessment for a greener production. Sci. Total Environ. 2014, 493, 914–929. [Google Scholar] [CrossRef]
- Lacoste, C.; El Hage, R.; Bergeret, A.; Corn, S.; Lacroix, P. Sodium alginate adhesives as binders in wood fibers/textile waste fibers bio composites for building insulation. Carbohydr. Polym. 2018, 184, 1–8. [Google Scholar] [CrossRef]
- Zen, L.D.; Ocacia, G.; Sadhu, D.P. Prospect of an environmentally balanced energy system from rice husk and wind. Renew. Energy 1993, 3, 885–889. [Google Scholar]
- Lin, Z. Reduction of energy consumption by enhancing the thermal resistance of cold storage building. Energy Resour. Environ. 1982, 1982, 413–424. [Google Scholar] [CrossRef]
- Ismail, M.R.; Yassen, A.A.M.; Afify, M.S. Mechanical properties of rice straw fiber-reinforced polymer composites. Fibers Polym. 2011, 12, 648–656. [Google Scholar] [CrossRef]
- Saidah, A.; Susilowati, S.E.; Nofendri, Y. Effect of fiber loading and alkali treatment on rice straw fiber reinforced composite for automotive bumper beam application. Int. J. Adv. Sci. Eng. Inf. Technol. 2019, 9, 1865–1870. [Google Scholar] [CrossRef]
- Yu, W.; Dong, L.; Lei, W.; Zhou, Y.; Pu, Y.; Zhang, X. Effects of rice straw powder (RSP) size and pretreatment on properties of FDM 3D-printed RSP/Poly (lactic acid) bio composites. Molecules 2021, 26, 3234. [Google Scholar] [CrossRef]
- Mahesh, M.; Bejagam, N.R.; Tirumala, K. Evaluation of mechanical properties of rice straw fibre polypropylene composites. SSRG Int. J. Mech. Eng. (SSRG-IJME)–Spec. Issue ICETST 2018, 1, 10–14. [Google Scholar]
- Mohammadi, H.; Mirmehdi, S. Rice straw/thermoplastic composite: Effect of filler loading, polymer type and moisture absorption on the performance. Cerne 2016, 22, 449–456. [Google Scholar] [CrossRef] [Green Version]
- Mutlu, I. Investigation of tribological properties of brake pads by using rice straw and rice husk dust. J. Appl. Sci. 2009, 9, 377–381. [Google Scholar] [CrossRef]
- Nasir, R.M. Water-lubricated pin-on-disc tests with natural fibre reinforced matrix. J. Mech. Eng. 2014, 11, 41–51. [Google Scholar]
- Neeraj, R.; Prakash, C.G.; Nisha, R. Rice husk as a fibre in composites: A review. J. Mech. Behav. Mater. 2020, 29, 147–162. [Google Scholar]
- Patwardhan, B.; Warude, D.; Pushpangadan, P.; Bhatt, N. Ayurveda and traditional Chinese medicine: A comparative overview. Evid. Complem. Altern. Med. 2005, 2, 465–473. [Google Scholar] [CrossRef] [PubMed] [Green Version]
- Soliman, S.; Ali-Eldin, S.M.; Abd, M.M.; Waleed, S.A. Study of Hybridization Effect of New Developed Rice Straw mat/ Glass Fiber Reinforced Polyester Composite. J. Nat. Fibers 2021, 18, 1194–1206. [Google Scholar] [CrossRef]
- Witt, C.M.; Michalsen, A.; Roll, S.; Morandi, A.; Gupta, S.; Rosenberg, M.; Kronpa, L.; Stapelfeldt, E.; Hissar, S.; Müller, M.; et al. Comparative effectiveness of a complex Ayurvedic treatment and conventional standard care in osteoarthritis of the knee–study protocol for a randomized controlled trial. Trials 2013, 14, 1–10. [Google Scholar] [CrossRef] [PubMed]
- Chauhan, A.; Semwal, D.K.; Mishra, S.P.; Semwal, R.B. Ayurvedic research and methodology: Present status and future strategies. Ayu 2015, 36, 364. [Google Scholar]
- Dinesh, S.; Gopesh, M.; Rajendra, G. Ayurveda abhyanga (massage) procedure—A review. World J. Pharm. Res. 2020, 9, 16–28. [Google Scholar]
- Sharma, M.K.; Chaturvedi, S.K. A clinical evaluation of panchavalkala—A review. Unique J. Ayurvedic Herb. Med. 2014, 2, 6–9. [Google Scholar]
- Mallya, S.; Suchitra, P.; Vishwanatha, U.; Sunil, K. Anatomical atlas of Panchavalkala–effective healing five bark drugs in gynaecological disorders. J. Ayurvedic Herb. Med. 2018, 4, 6–13. [Google Scholar]
- Krishna, S.; Dinesh, K.S.; Nazeema, P.K. Globalizing ayurveda-opportunities and challenges. Int. J. Health Sci. Res. 2020, 10, 55–68. [Google Scholar]
- Atluri, R.; Prasad, V.K.; Mohana, R. Experimental Investigations of Mechanical proper- ties of Golden cane fiber reinforced Polyester Composites. Int. J. Polym. Anal. Charact. 2013, 18, 30–39. [Google Scholar] [CrossRef]
- Sakthivei, M.; Ramesh, S. Mechanical Properties of the natural fibre (Banana, Coir, Sisal) Polymer Composites. Sci. Park 2013, 1, 1–6. [Google Scholar]
- Azlina, N.; Jawaid, M.; Syams, E.; Abdul, S.; Yamani, K. Tensile, physical and morphological properties of oil palm empty fruit bunch/sugarcane bagasse fibre reinforced phenolic hybrid composites. Integr. Med. Res. 2019, 8, 3466–3474. [Google Scholar] [CrossRef]
- Mahesha, G.T.; Satish, S.B.; Vijaya, K.M.; Bhat, K.S. Preparation of Unidirectional Grewia Serrulata Fiber-Reinforced Polyester Composites and Evaluation of Tensile and Flexural Properties. J. Nat. Fibers 2016, 13, 547–554. [Google Scholar] [CrossRef]
- Sydow, Z.; Sydow, M.; Wojciechowski, L.; Bienczak, K. Tribological Performance of Composites Reinforced with the Agricultural, Industrial and Post-Consumer Wastes: A Review. Materials 2021, 14, 1863. [Google Scholar] [CrossRef]
- Shenoy, B.S.; Mahesha, G.T.; Kini, M.V.; Padmaraj, N.H. Effect of chemical treatments on hardness and toughness properties of grewia serrulata reinforced polymer composites. J. Mech. Eng. Res. Dev. 2019, 42, 228–230. [Google Scholar] [CrossRef]
- de Oliveira Filho, G.C.; de Sousa Mota, R.C.; da Conceicao, A.C.R.; Leao, M.A.; de Araujo Filho, O.O. Effects of hybridization on the mechanical properties of composites reinforced by piassava fibers tissue. Compos. Part B Eng. 2019, 162, 73–79. [Google Scholar] [CrossRef]
- Wang, L.; He, C. Characterization of rice husk fiber-reinforced polyvinyl chloride composites under accelerated simulated soil conditions. Int. J. Polym. Sci. 2019, 2019, 1–10. [Google Scholar] [CrossRef]
- Guna, V.; Manikandan, I.; Muzamil, H.R. Groundnut shell/rice husk agro-waste reinforced polypropylene hybrid biocomposites. J. Build. Eng. 2020, 27, 100991. [Google Scholar] [CrossRef]
- Radzi, A.M.; Sapuan, S.M.; Jawaid, M.; Mansor, M.R. Water absorption, thickness swelling and thermal properties of roselle/sugar palm fibre reinforced thermoplastic polyurethane hybrid composites. Integr. Med. Res. 2019, 8, 3988–3994. [Google Scholar] [CrossRef]
- Wang, S.; Li, H.; Zou, S.; Zhang, G. Experimental research on a feasible rice husk/geopolymer foam building insulation material. Energy Build. 2020, 226, 110358. [Google Scholar] [CrossRef]
- Li, F.; Hu, H.; Yao, R.; Wang, H.; Li, M. Structure and saccharification of rice straw pretreated with microwave-assisted dilute lye. Ind. Eng. Chem. Res. 2012, 51, 6270–6274. [Google Scholar] [CrossRef]
- Anala, R.; Nambisan, P. Study of morphology and chemical composition of phytoliths on the surface of paddy straw. Paddy Water Environ. 2015, 13, 521–527. [Google Scholar] [CrossRef]
- Nguyen, M.N.; Than, T.N. Applied Geochemistry Arsenic in rice straw phytoliths: Encapsulation and release properties. Appl. Geochem. 2021, 127, 104907. [Google Scholar] [CrossRef]
- Shuhaida, H.; Venkatesh, B.; Moh, S.T. Performance of AFEXTM pretreated rice straw as source of fermentable sugars: The influence of particle size. Biotechnol. Biofuels 2013, 6, 1–17. [Google Scholar]
- Kaur, K.; Phutela, U.G. Morphological and structural changes in paddy straw influenced by alkali and microbial pretreatment. Detritus 2018, 3, 30–36. [Google Scholar] [CrossRef]
- Mehdikhani, M.; Larissa, G.; Ignaas, V.; Stepan, V.L. Voids in fiber-reinforced polymer composites: A review on their formation, characteristics, and effects on mechanical performance. J. Compos. Mat. 2019, 53, 1579–1669. [Google Scholar] [CrossRef]
- Li, Y.; Li, Q.; Ma, H. The voids formation mechanisms and their effects on the mechanical properties of flax fiber reinforced epoxy composites. Compos. Part A Appl. Sci. Manuf. 2015, 72, 40–48. [Google Scholar] [CrossRef]
- Sandeep, K.; Krishan, K.S.M.; Brijesh, G.; Vinay, K.P. Synergy of rice-husk filler on physico-mechanical and tribological properties of hybrid Bauhinia-vahlii/sisal particles reinforced epoxy. J. Mater. Res. Technol. 2019, 8, 2070–2082. [Google Scholar]
- Zafar, M.F.; Siddiqui, M. Preparation and characterization of natural fiber filled polystyrene composite using in-situ polymerisation technique. Adv. Mater. Processing Technol. 2020, 6, 1–11. [Google Scholar] [CrossRef]
- Saba, N.; Othman, Y.A.; Zeyad, A.; Jawaid, M.; Waheedullah, G. Date palm reinforced epoxy composites: Tensile, impact and morphological properties. J. Mater. Res. Technol. 2019, 8, 3959–3969. [Google Scholar] [CrossRef]
- Zou, Y.; Huda, S.Y. Lightweight composites from long wheat straw and polypropylene web. Bioresour. Technol. 2010, 101, 2026–2033. [Google Scholar] [CrossRef]
- Kilinc, A.C.; Atagur, M.; Ozdemir, O.; Sen, I.; Kucukdogan, N.; Sever, K.; Seydibeyoglu, O.; Sarikanat, M.; Seki, Y. Manufacturing and characterization of vine stem reinforced high density polyethylene composites. Compos. Part B Eng. 2016, 91, 267–274. [Google Scholar] [CrossRef]
- Yussuf, A.A.; Massoumi, I.; Hassan, A. Comparison of polylactic Acid/Kenaf and polylactic Acid/Rise husk composites: The influence of the natural particles on the mechanical, thermal and biodegradability properties. J. Poly. Environ. 2010, 18, 422–429. [Google Scholar] [CrossRef]
- Pandian, A.; Manikandan, V.; Winowlin, J.T.; Marimuthu, U. Effect of moisture absorption behavior on mechanical properties of basalt fibre reinforced polymer matrix composite. J. Compos. 2014, 2014, 1–8. [Google Scholar] [CrossRef] [Green Version]
- Zafar, M.F.; Siddiqui, M.A. Effect of filler loading and size on the mechanical and morphological behaviour of natural fibre-reinforced polystyrene composites. Adv. Mater. Process. Technol. 2020, 7, 1–13. [Google Scholar] [CrossRef]
- Parizzi, S.Q.F.; Andrade, N.J.D.; Silva, C.A.D.S.; Soares, N.D.F.F.; Silva, E.A.M.D. Bacterial adherence to different inert surfaces evaluated by epifluorescence microscopy and plate count method. Braz. Arch. Biol. Technol. 2004, 47, 77–83. [Google Scholar] [CrossRef] [Green Version]
- Mann, E.E.; Manna, D.; Mettetal, M.R.; May, R.M.; Dannemiller, E.M.; Chung, K.K.; Brennan, A.B.; Reddy, S.T. Surface micropattern limits bacterial contamination. Antimicrob. Resist. Infect. Control 2014, 3, 1–9. [Google Scholar] [CrossRef] [Green Version]
- Perez-Gavilan, A.; de Castro, J.V.; Arana, A.; Merino, S.; Retolaza, A.; Alves, S.A.; Francone, A.; Kehagias, N.; Sotomayor-Torres, C.M.; Cocina, D.; et al. Antibacterial activity testing methods for hydrophobic patterned surfaces. Sci. Rep. 2021, 11, 1–10. [Google Scholar] [CrossRef]


| Properties | Range |
|---|---|
| Density of epoxy (L-12) at 25 °C | 1.1–1.2 g/cm3 |
| Density of hardener (K-6) at 25 °C | 0.95–1.1 g/cm3 |
| Tensile strength | 55–70 MPa |
| Flexural strength | 120–140 MPa |
| Impact strength | 17–20 KJ/m2 |
| Thermal conductivity | 0.211 kCal/m h °C |
| Co-efficient of thermal expansion | 64–68 × 10−6/°C |
| Water absorption (25 °C/24 h) | 0.5 w/w % (Max) |
| Sl. No | Sample Code | RSp (Vf) | Epoxy (Vm) |
|---|---|---|---|
| 1 | Neat | 0 | 1 |
| 2 | R15E85 | 0.15 | 0.85 |
| 3 | R30E70 | 0.30 | 0.70 |
| 4 | R45E55 | 0.45 | 0.55 |
| 5 | R60E40 | 0.60 | 0.40 |
Publisher’s Note: MDPI stays neutral with regard to jurisdictional claims in published maps and institutional affiliations. |
© 2022 by the authors. Licensee MDPI, Basel, Switzerland. This article is an open access article distributed under the terms and conditions of the Creative Commons Attribution (CC BY) license (https://creativecommons.org/licenses/by/4.0/).
Share and Cite
Madival, A.S.; Doreswamy, D.; Handady, S.A.; Hebbar, K.R.; Lakshminarayana, S.K. Investigation of the Mechanical and Liquid Absorption Properties of a Rice Straw-Based Composite for Ayurvedic Treatment Tables. Materials 2022, 15, 606. https://doi.org/10.3390/ma15020606
Madival AS, Doreswamy D, Handady SA, Hebbar KR, Lakshminarayana SK. Investigation of the Mechanical and Liquid Absorption Properties of a Rice Straw-Based Composite for Ayurvedic Treatment Tables. Materials. 2022; 15(2):606. https://doi.org/10.3390/ma15020606
Chicago/Turabian StyleMadival, Abhishek Sadananda, Deepak Doreswamy, Shripathi Adiga Handady, Krishna Raghava Hebbar, and Shobha Karabylu Lakshminarayana. 2022. "Investigation of the Mechanical and Liquid Absorption Properties of a Rice Straw-Based Composite for Ayurvedic Treatment Tables" Materials 15, no. 2: 606. https://doi.org/10.3390/ma15020606
APA StyleMadival, A. S., Doreswamy, D., Handady, S. A., Hebbar, K. R., & Lakshminarayana, S. K. (2022). Investigation of the Mechanical and Liquid Absorption Properties of a Rice Straw-Based Composite for Ayurvedic Treatment Tables. Materials, 15(2), 606. https://doi.org/10.3390/ma15020606