Article

Modeling the Hydrogen Redistribution at the Grain Boundary of Misoriented Bicrystals in Austenite Stainless Steel

1
School of Science, Xi’an University of Science & Technology, Xi’an 710054, China
2
School of Mechanical Engineering, Xi’an University of Science & Technology, Xi’an 710054, China
3
State Key Laboratory for Marine Corrosion and Protection, Luoyang Ship Material Research Institute (LSMRI), Qingdao 266237, China
*
Author to whom correspondence should be addressed.
Materials 2022, 15(2), 479; https://doi.org/10.3390/ma15020479
Submission received: 2 December 2021 / Revised: 5 January 2022 / Accepted: 7 January 2022 / Published: 9 January 2022
(This article belongs to the Special Issue Extreme Mechanics in Multiscale Analyses of Materials)

Abstract

:
Hydrogen embrittlement, as one of the major concerns for austenitic stainless steel, is closely linked to the diffusion of hydrogen through the grain boundary of materials. The phenomenon is still not well understood yet, especially the full interaction between hydrogen diffusion and the misorientation of the grains. This work aimed at the development of a robust numerical strategy to model the full coupling of the hydrogen diffusion and the anisotropic behavior of crystals in 316 stainless steel. A constitutive model, which allows easy incorporation of crystal orientation, various loading conditions, and arbitrary model geometries, was established by using the finite element package ABAQUS. The study focuses on three different bicrystal models composed of misoriented crystals, and the results indicate that the redistribution of hydrogen is significant closely to the grain boundary, and the redistribution is driven by the hydrostatic pressure caused by the misorientation of two neighboring grains. A higher elastic modulus ratio along the tensile direction will lead to a higher hydrogen concentration difference in the two grains equidistant from the grain boundary. The hydrogen concentration shows a high value in the crystal along the direction with stiff elastic modulus. Moreover, there exists a large hydrogen concentration gradient in a narrow region very close to the grain boundary to balance the concentration difference of the neighboring grains.

1. Introduction

The hydrogen embrittlement (HE), which is associated with the trapping and diffusion of aggressive hydrogen in metals under stress, could drastically reduce the expected ductility and toughness of steels and result in catastrophic failures [1,2]. According to the macroscopic property of HE, three main mechanisms have been proposed: (1) the hydrogen enhanced decohesion (HEDE) [3,4], (2) the hydrogen-enhanced localized plasticity (HELP) [5,6], and (3) the adsorption-induced dislocation emission (AIDE) [7,8]. Despite much research into the issue of HE [2], the topic is still widely debated. The contribution of the grain boundaries (GBs) to the diffusion and trapping of hydrogen remains a controversial point in the understanding of hydrogen embrittlement phenomena [9].
As a discontinuous region, the grain boundaries often act as barriers to plastic flow or the sources of slip and dislocation, these physical structures could affect the hydrogen diffusion. Several studies [10,11,12,13] have confirmed that hydrogen diffusion is accelerated along the GBs by a mechanism of short-circuit diffusion. Even though Louthan et al. [14] reported that the acceleration of hydrogen diffusion along GBs is caused by the geometrically necessary dislocations (GNDs) stored in these interfaces. Ladna and Birnbaum [15,16] associate the boundary energy with the diffusion, and confirmed that hydrogen diffusion is accelerated along tilt high-energy boundaries and that in low-energy boundaries the hydrogen diffusion stays the same as in the lattice.
On the contrary, suppressed diffusion of hydrogen at grain boundaries was found. Yao and Canoon [17] argued that there are more dislocations and vacancies stored in the grain boundaries as trapping sites which impedes the diffusion, and competition between the short-circuit diffusion and hydrogen trapping occurs at the grain boundary. Ichimura [18] also supported this view and pointed out that the suppressed diffusion might be remarkable for the sample with small grain size
While Mütschele and Kirchheim [19] concluded that the diffusion coefficient depends on the hydrogen concentration, the GBs impede diffusion at low concentrations, and provide a fast pathway for diffusion at high concentrations. As to the twist boundary, Szpunar et al. [20] simulated the classical dynamics of a hydrogen atom in the vicinity of twin–twist GBs, and concluded that the diffusivity is enhanced at these GBs. However, Pedersen et al. [21] argued that the twist boundary turns out to block diffusion across the boundary, only the diffusion parallel to the boundary is slightly enhanced because of the reduced configuration space.
Nagao et al. [22] have confirmed that the hydrogen diffusion and accumulation is significantly promoted by an applied stress field even in the steel with traps for hydrogen. By assuming the local equilibrium of hydrogen in traps and normal interstitial lattice sites [23], the effects of the hydrostatic stress and trapping on the hydrogen distribution in plastically deforming steel were studied [24,25,26], and the results indicate that the total hydrogen concentration and plastic strain decreases with distance from the crack tip whereas the hydrostatic stress rises.
Due to elastic anisotropy, the anisotropic elastic behavior of microstructure at grain boundaries can produce local stress concentrations [27] and strong hydrostatic stress gradients under mechanical loading even without notch or crack [28,29]. In the present work, the hydrogen diffusion at the grain boundary was investigated by a proposed hydrogen diffusion model, which is based on the elastic response of the anisotropic behavior of crystals. The effects of crystal orientation induced stress–strain heterogeneity on the hydrogen redistribution in stainless steel 316 L polycrystals was estimated

2. Governing Equations of Hydrogen Diffusion

The diffusion phase should satisfy the law of conservation of mass during diffusion, namely
V c t d V + S n J d S = 0
where c is the mass concentration of hydrogen in steel; V is any volume whose surface is S; n is the outward normal to S; J is the flux of concentration of the diffusing phase; n J is the concentration flux leaving S surface.
The diffusion of hydrogen in heterogeneous steel can be given by the extended Fick’s law, which considers that the flux is proportional to the gradient of chemical potential [30,31],
J = D c R T u
where D is the diffusivity; R is the universal gas constant, 8.3144 J·mol−1·K−1; T is the absolute temperature, K; u is the chemical potential. For a system under constant pressure and temperature, the chemical potential is given as [24],
u = u σ + R T ln ϕ + σ h V H
where μ σ is the stress dependent part of the chemical potential; σh is the hydrostatic pressure, which is calculated by the diagonal terms of the stress tensor, σh = −∑σii/3; VH represents the partial molar volume of hydrogen; ϕ is the hydrogen concentration in steel normalized by its solubility s with ϕ = c / s .
By substituting Equation (3) into (2) and considering the normalized concentration, the hydrogen flux is derived as
J = s D ϕ s D k σ σ h
where kσ represents the pressure stress factor, which governs the mass diffusion driven by the gradient of the equivalent pressure stress. It is defined as a function of concentration and temperature,
k σ = V H ϕ R T
According to Equation (4), there are two driving forces of hydrogen transport. The hydrogen concentration drives the hydrogen diffuse from the high concentration region to the low, and the hydrostatic pressure will drive the hydrogen diffuse from the low pressure region to high.

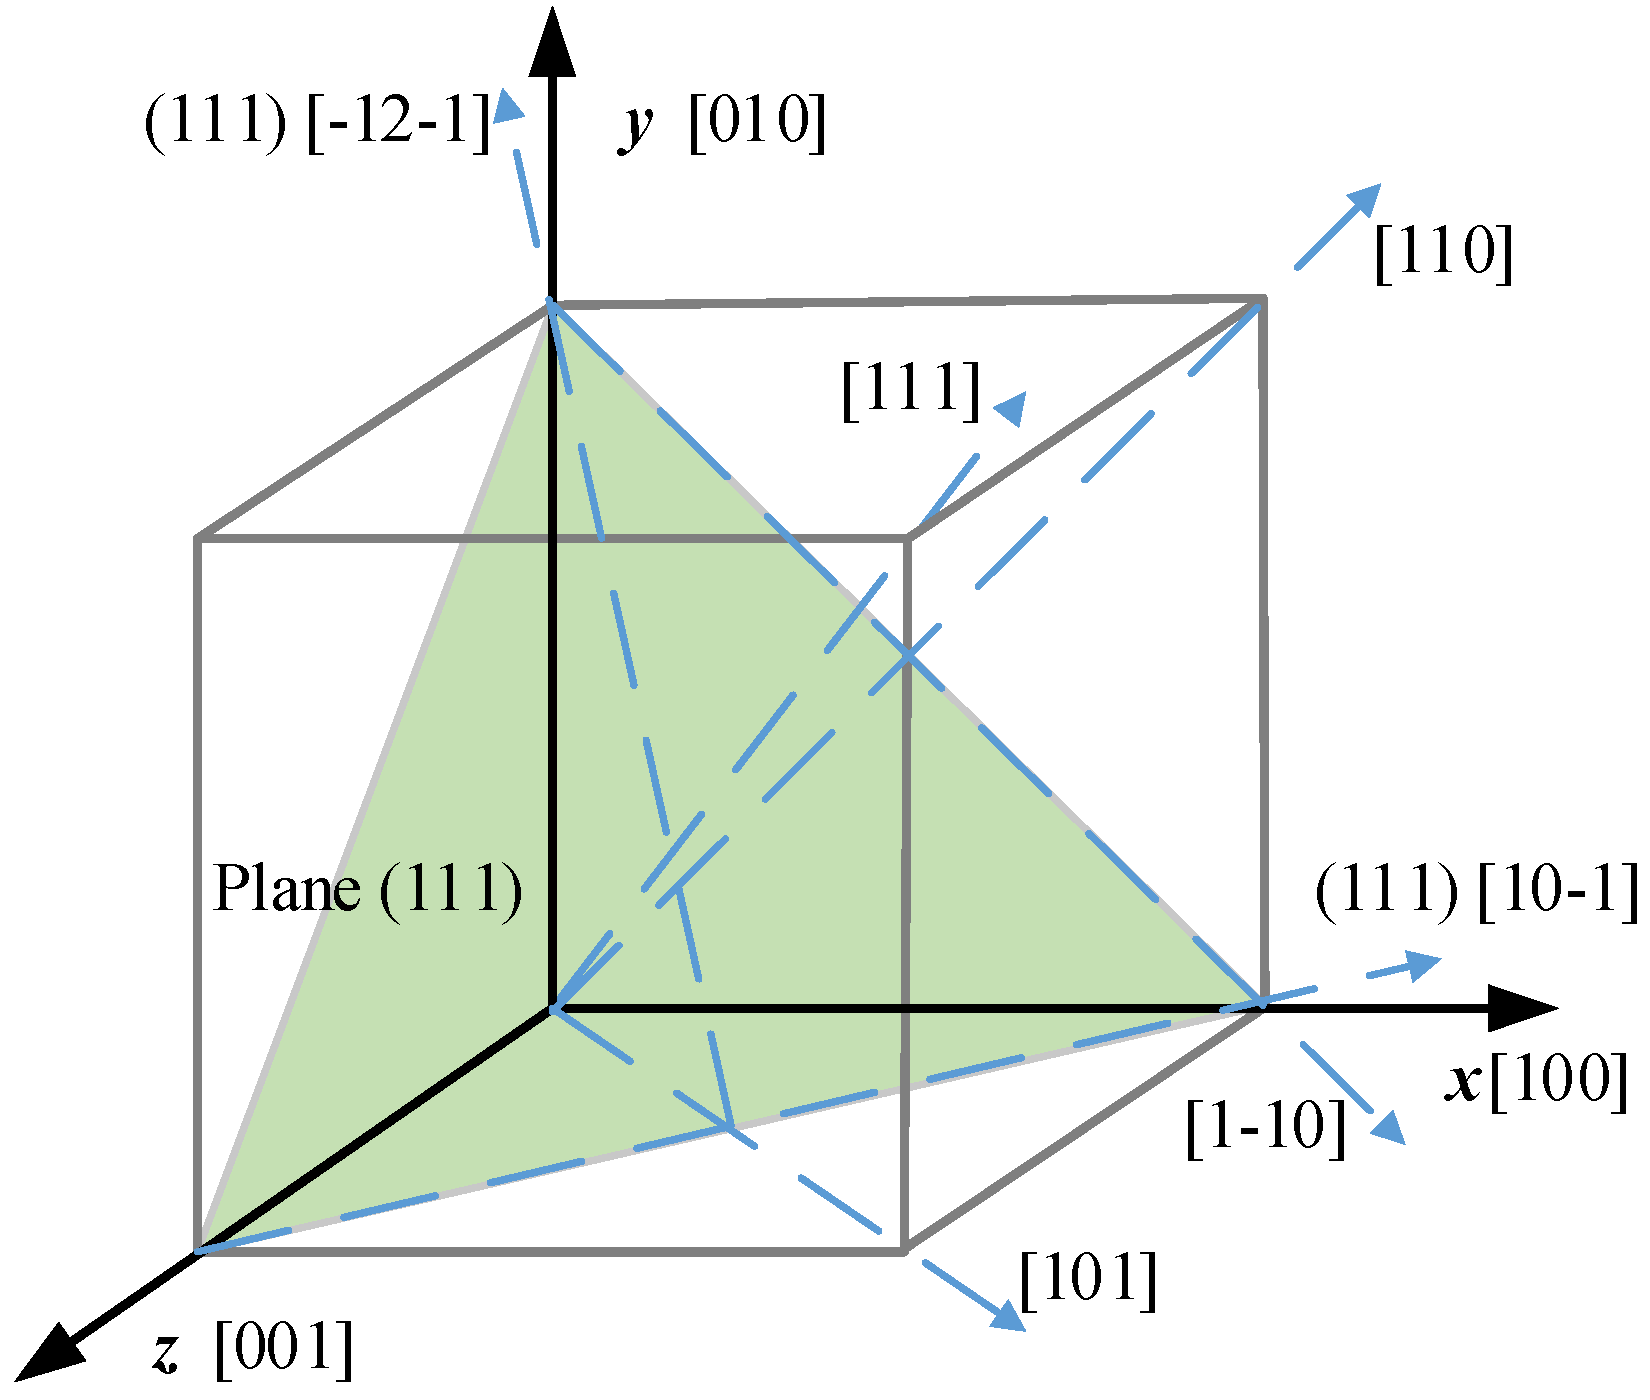
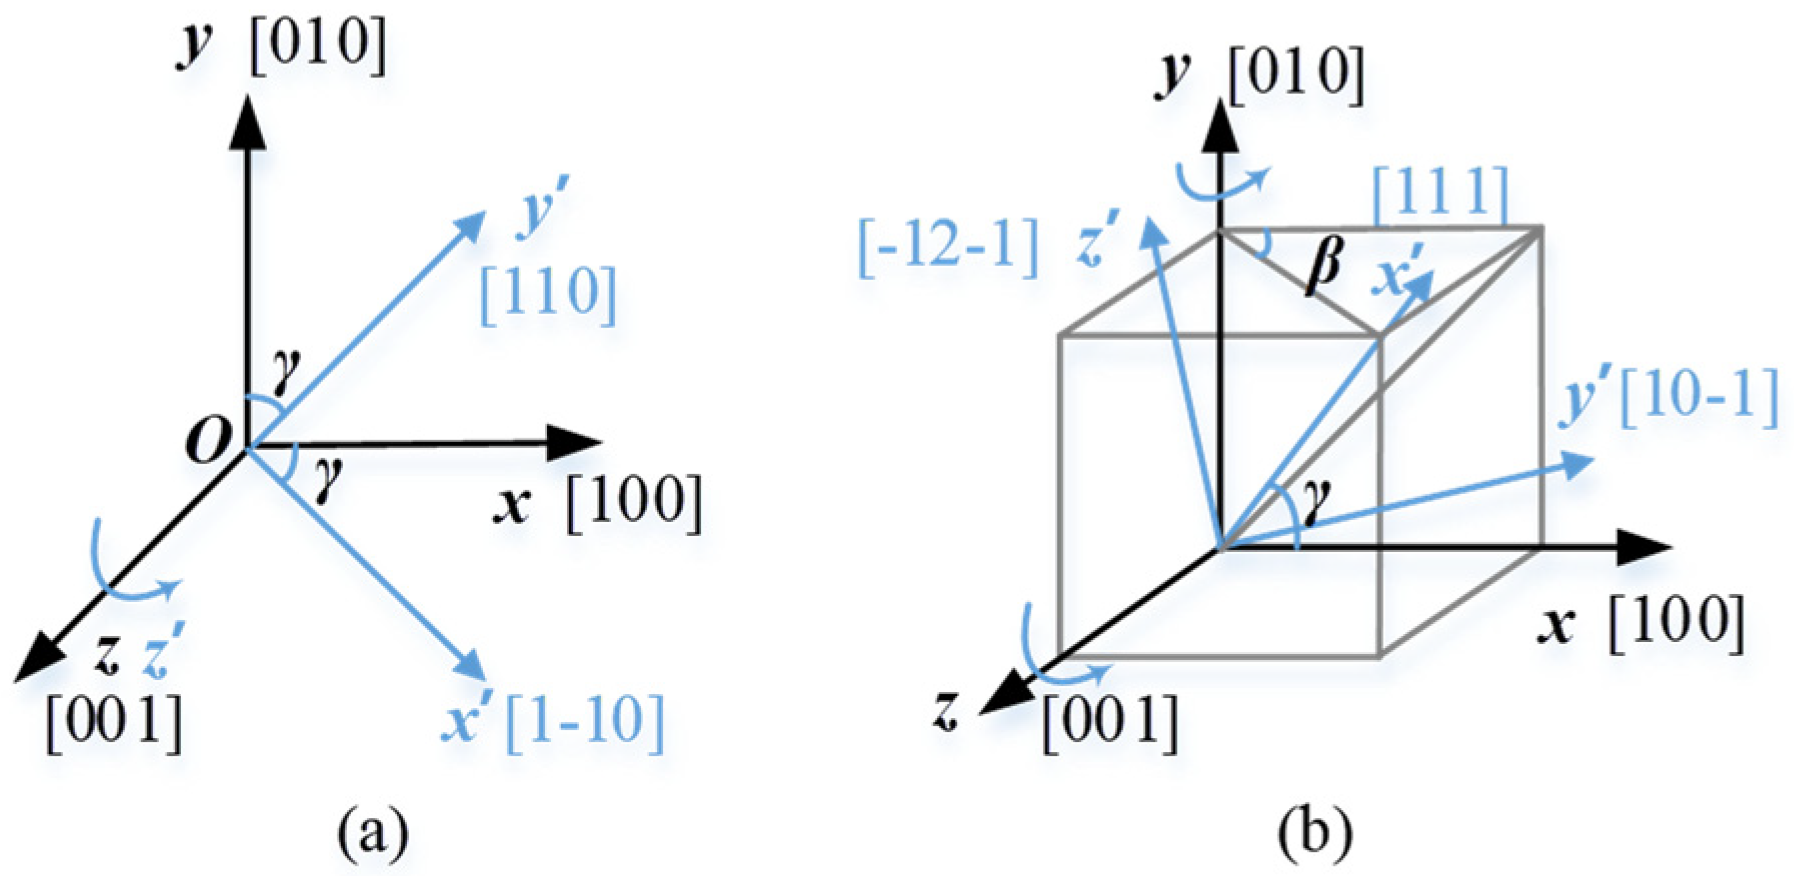
3. Crystallographic Constitutive Model

The relationship between stress and strain of a polycrystalline material, in which the elastic properties of a material depend on its orientation, could be described by the generalized Hooke’s law [32],
σ i = C i j ε j
ε i = S i j σ j
where σi and εj represent the stress components and strain components, respectively; Cij and Sij are the stiffness and compliance matrices, with S i j = C i j 1 (i, j = 1, 2, …, 6).
As the different crystal systems can be characterized exclusively by their symmetries, the elastic constants could be reduced. In a cubic system, there are three mutually perpendicular axes of symmetry, and the elastic constants could be reduced to three along different axes, and the stiffness matrices is,
C = [ c 11 c 12 c 13 c 21 c 22 c 23 c 31 c 32 c 33 c 44 c 55 c 66 ]
in which the elastic constants are C11 = C22 = C33, C44 = C55 = C66, and C12 = C13 = C23 = C21 = C31 = C32.
The elastic modulus E, Poisson’s ratio v, and shear modulus G in a cubic crystal could be achieved as [32],
E = 1 S 11
ν = - S 12 S 11
G = 1 S 44
where,
S 11 = C 11 + C 12 ( C 11 C 12 ) ( C 11 + 2 C 12 )
S 12 = C 12 ( C 11 C 12 ) ( C 11 + 2 C 12 )
S 44 = 1 C 44
In a cubic material, the elastic moduli can be determined along any orientation, from the elastic constants, by application of the following equation,
1 E i j k = S 11 2 k ( S 11 S 12 1 2 S 44 )
k = l i 1 2 l j 2 2 + l j 2 2 l k 3 2 + l k 3 2 l i 1 2
where Eijk is the Young’s modulus, respectively, in the [ijk] direction; k is the orientation coefficient; li1, lj2, and lk3 are the direction cosines of the direction [ijk].

4. Finite Element Model
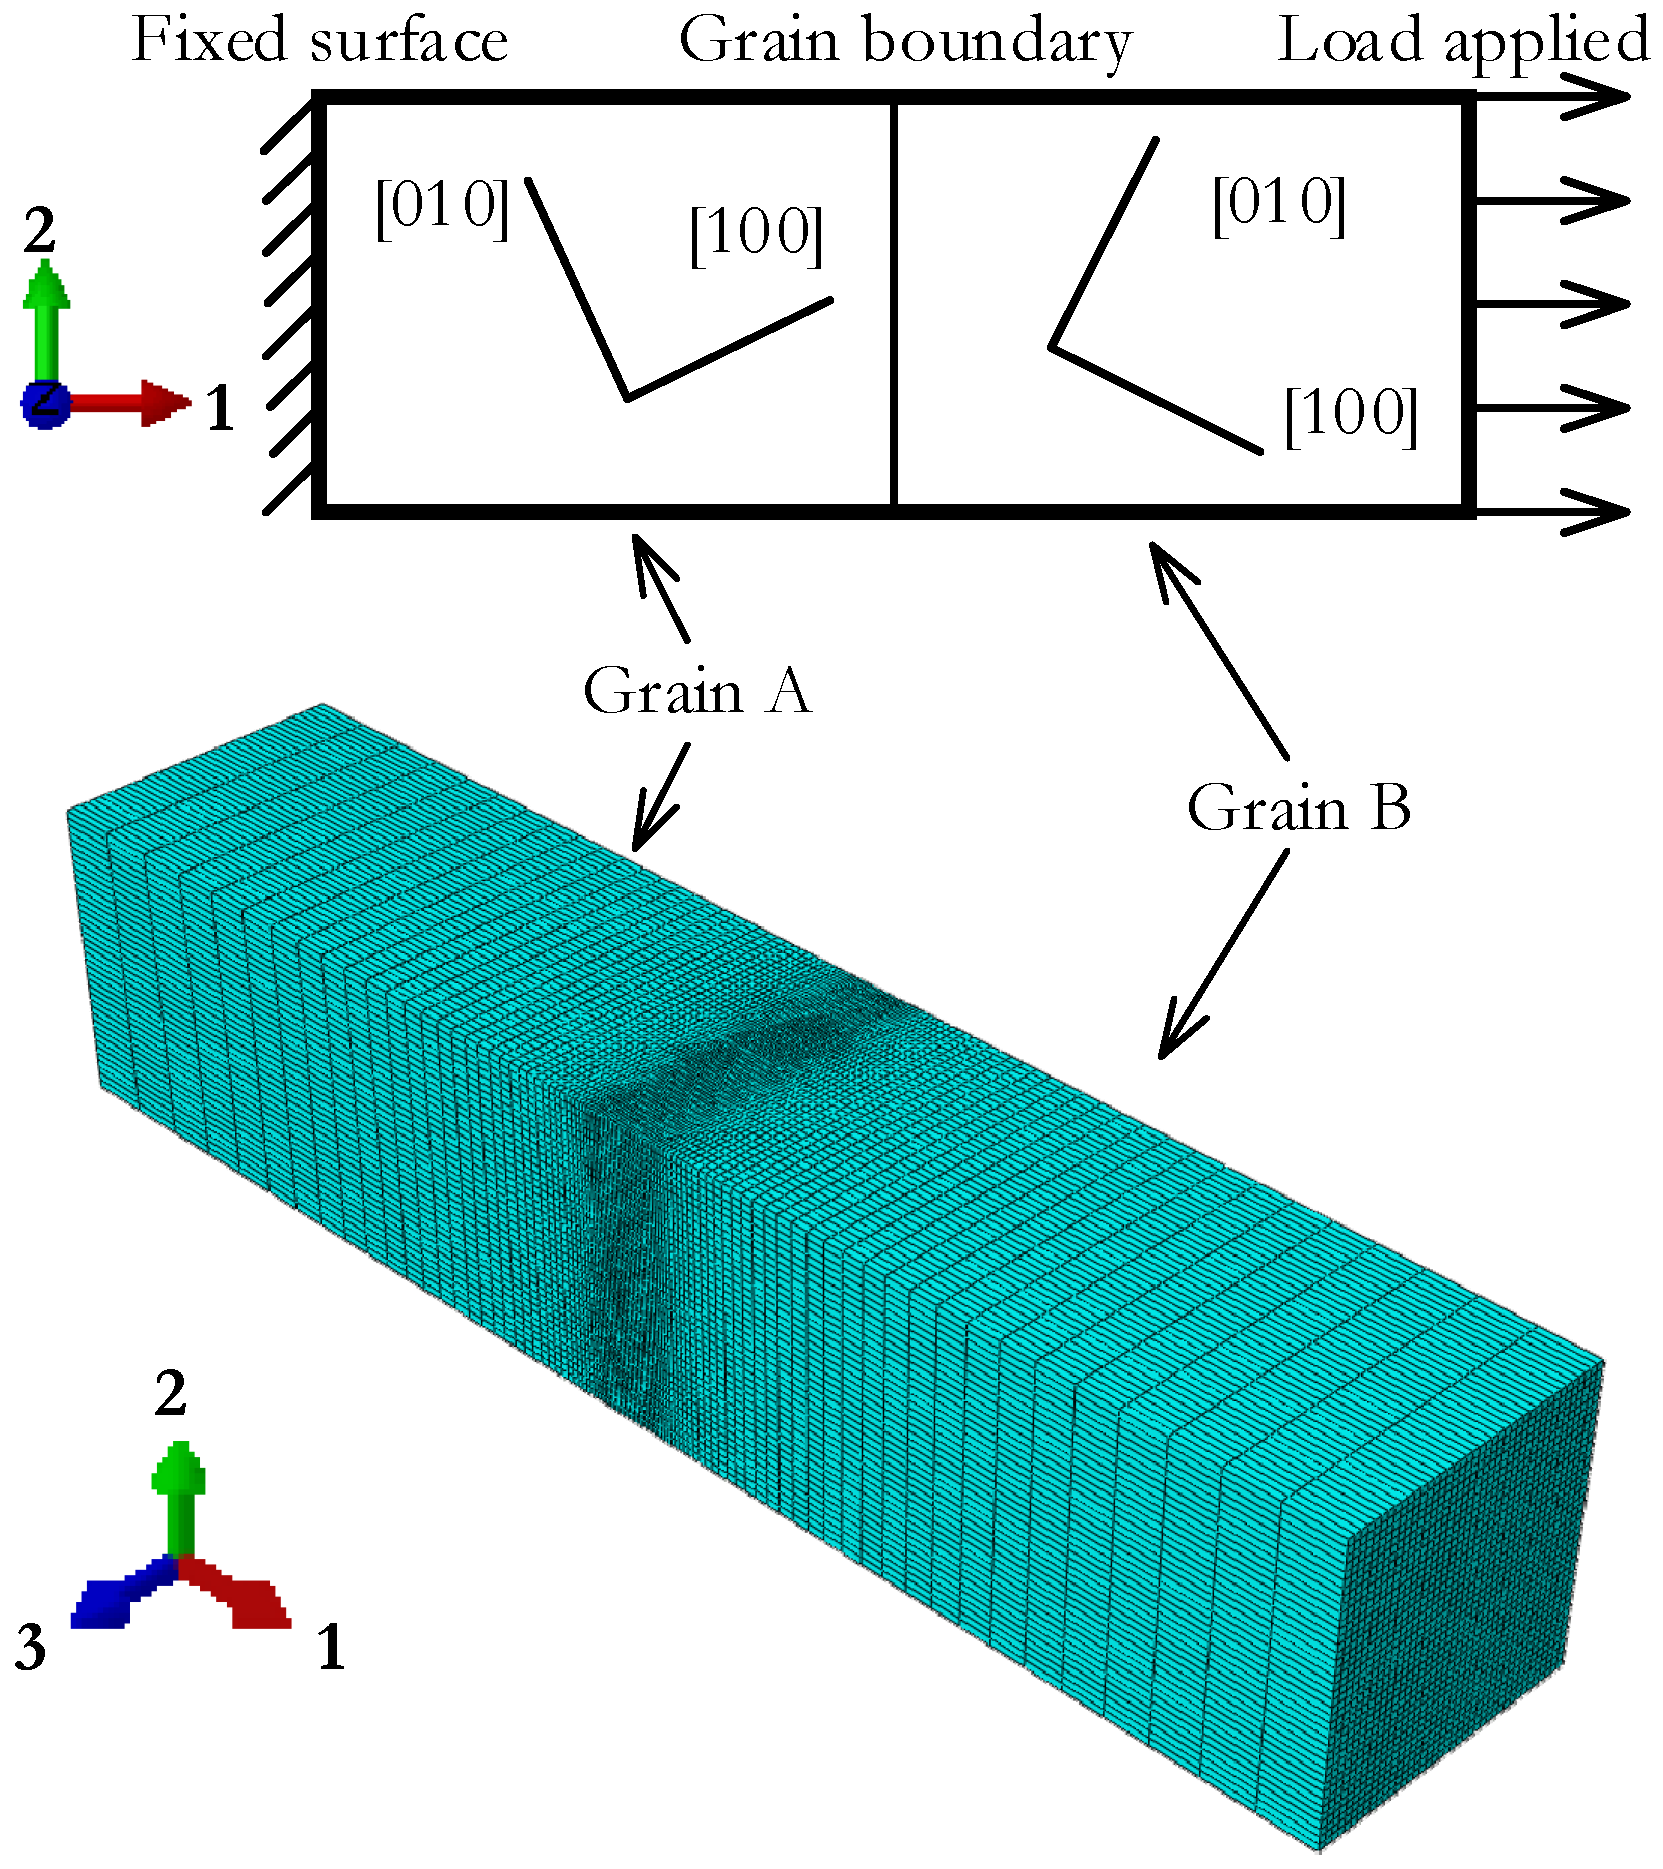
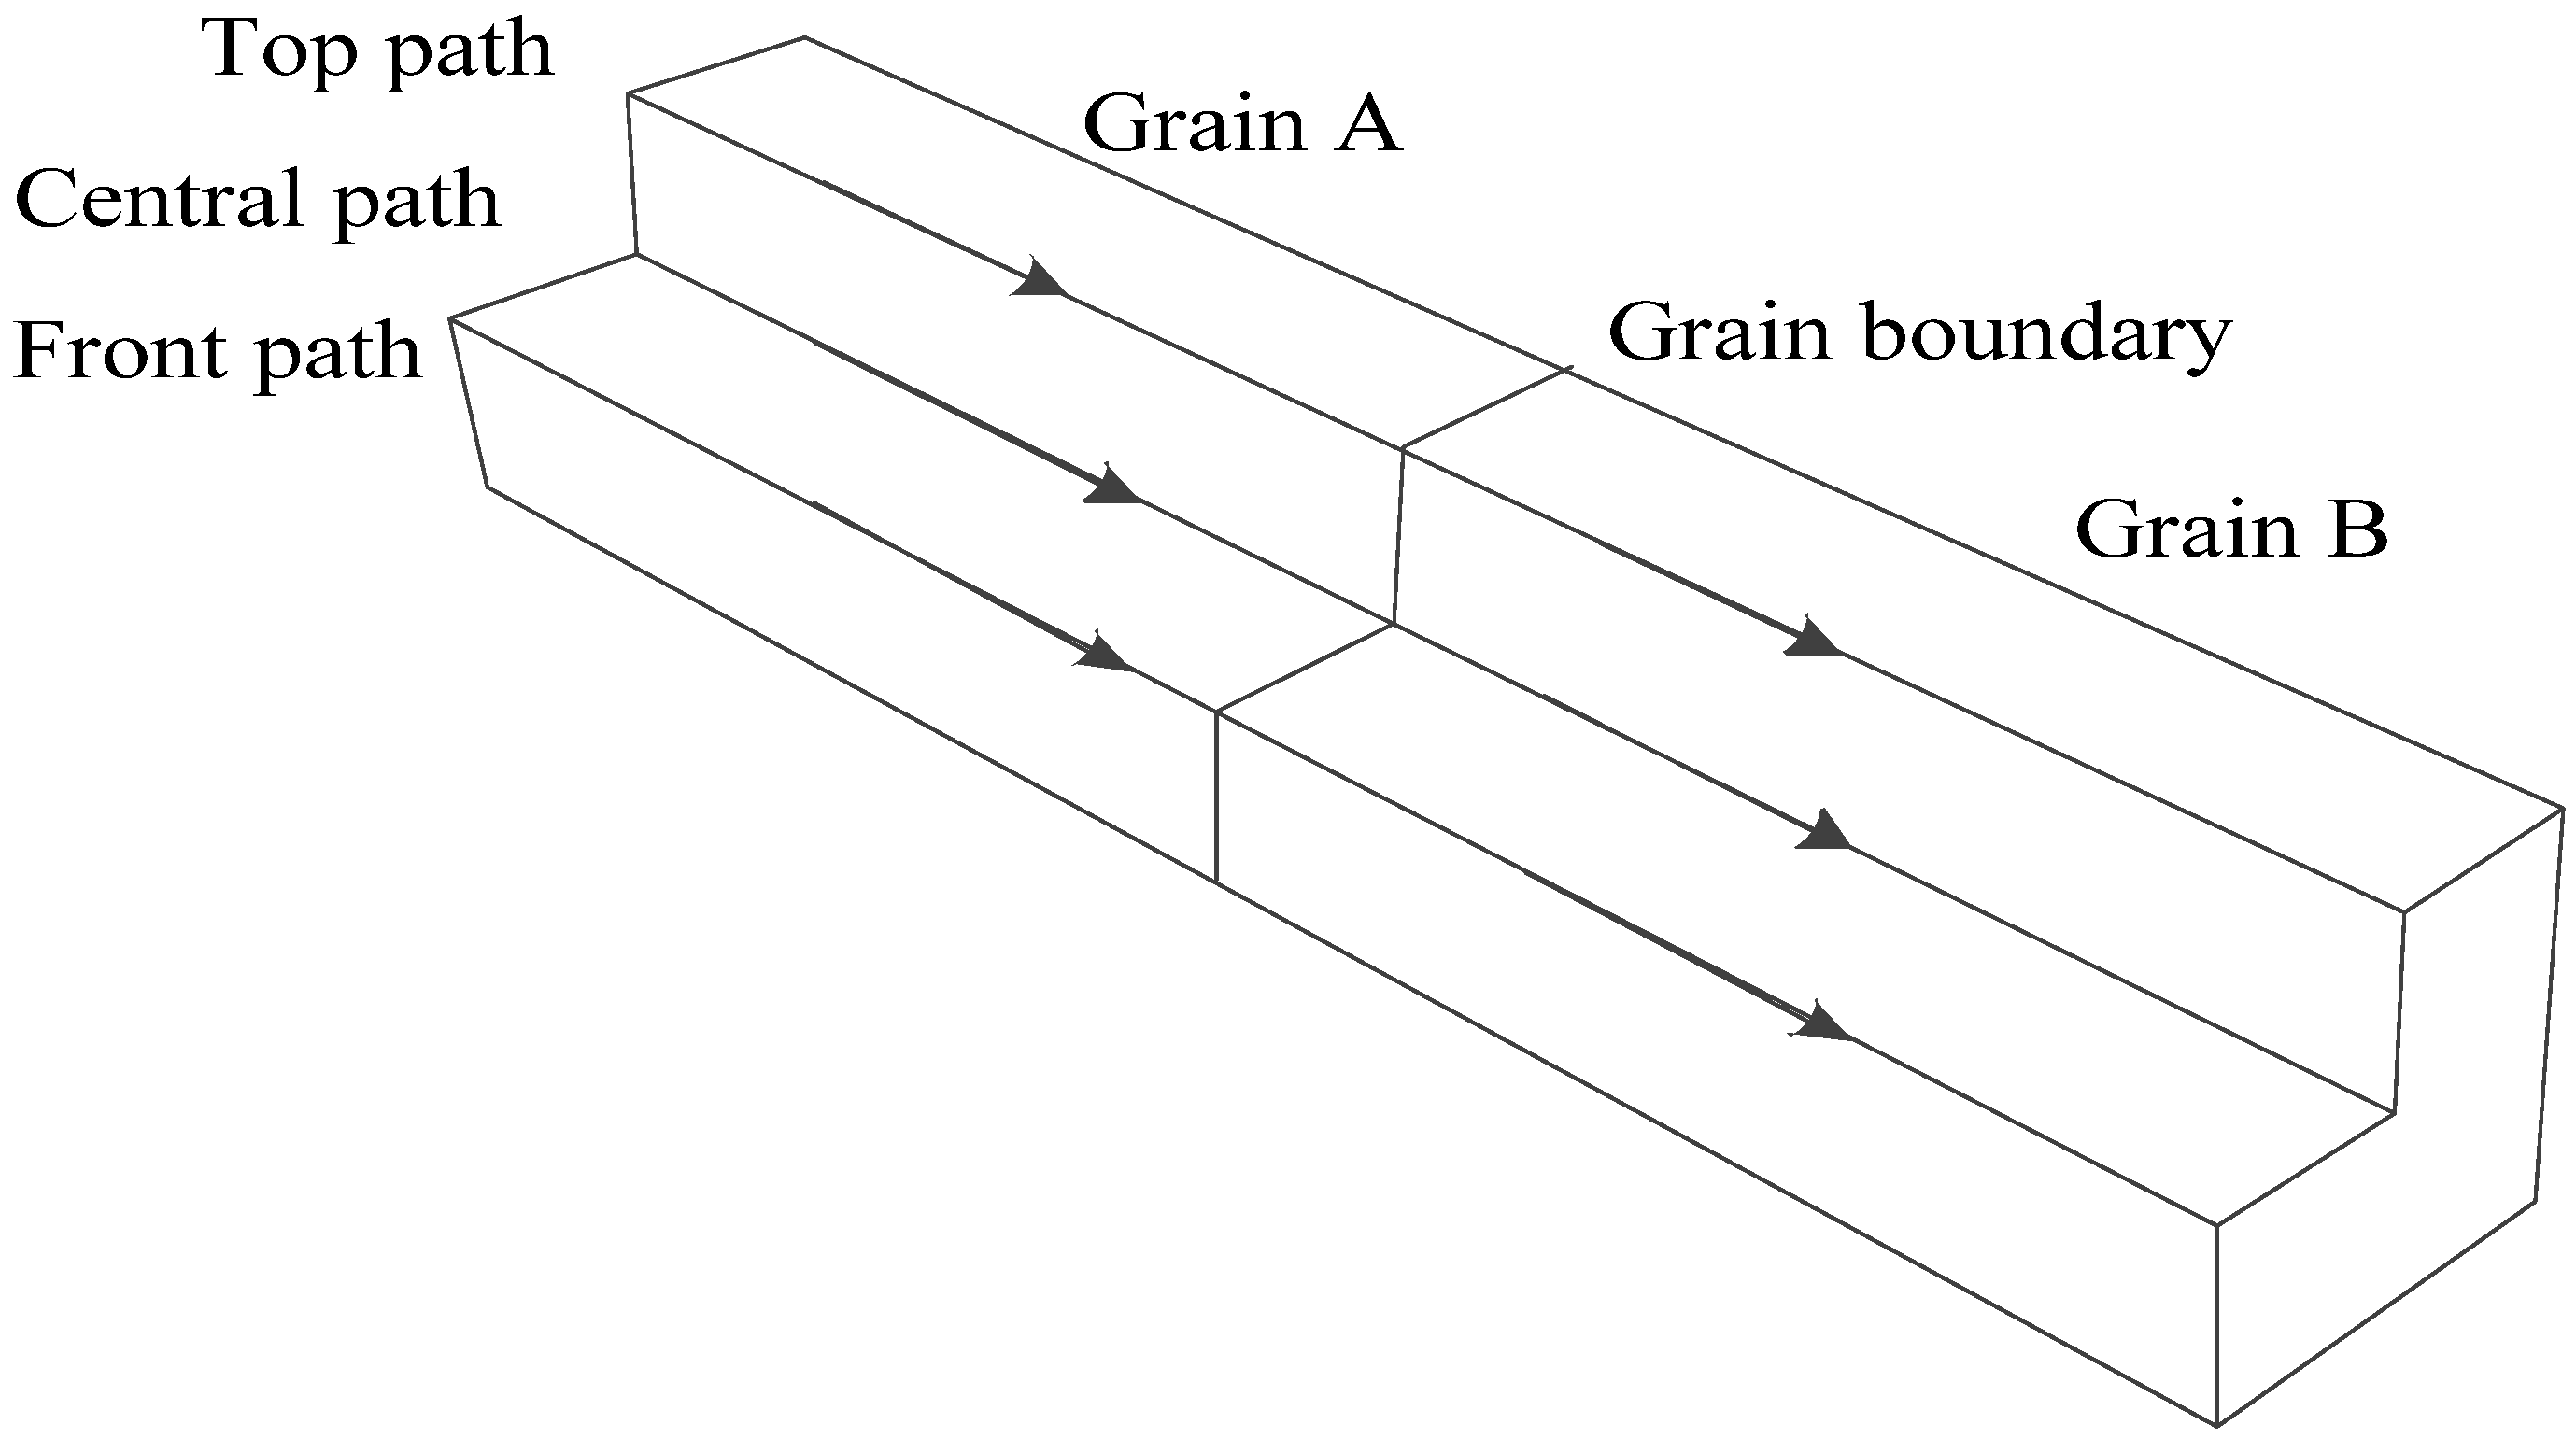
4.1. Geometry Model

A bicrystal model was constructed with different grain orientations, as shown in Figure 1. The average grain size of 316 L stainless steel varies from 17 μm to 200 μm with different aging time, temperatures, and other factors in the literature [33,34,35]; the dimension of each component grain in the model is assumed to be 20 μm × 20 μm × 50 μm.

4.2. Material Model

316 stainless steel is a polycrystalline aggregate and is randomly oriented, the material is macroscopically isotropic. However, the individual grain has a face-centered cubic (FCC) structure and exhibits crystalline anisotropy and symmetry. The elastic constants of a 316 stainless steel crystal are C11 = 204.6 GPa, C12  = 137.7 GPa, and C44 = 126.2 GPa [36]. Substituting the elastic constants into Equations (9)~(14), the elastic modulus E, shear modulus G, and Poisson’s ratio ν are 93.8 GPa, 126.2 GPa, and 0.40 respectively. According to Equations (16) and (17), the elastic modulus along the <110> and <111> directions are 193.6 GPa and 299.8 GPa, respectively. The <100> direction is softer whereas the <111> direction is stiffer, and E111 > E110 > E100 = E, as shown in Figure 2.
Considering the relationship between the [100], [110], and [111] orientations and the stretching axis, three types of crystals with different orientations were modeled [28], as shown in Table 1. The most compliant grain (MC) has the coordinate axes x′, y′, and z′ of the local coordinates, which represent the crystal orientations [100], [010], and [001] respectively, and it is consistent with the global coordinate o-xyz. As shown in Figure 3a, the local coordinate of the intermediate stiffness grain (MID) has the (001)-[1-10] direction as the axis x′ and the (001)-[110] direction as y′, by rotating the grain about the [001] direction with angle γ, the MID grain has its local coordinate consistent with the global coordinate. By defining the (111)-[10-1] and (111)-[-12-1] directions as the crystal axes y′ and z′, the stiffness grain (ST) has the [111] direction as the axes x′, and the local coordinate of the ST grain will coincide with the global coordinate by rotating the local coordinate about the axis y and z with angle β and γ in sequence. Among the three different grain types, the planes perpendicular to the global coordinate axis x are the (100), (110), and (111) planes in the MC, MID, and ST grains, respectively.
As shown in Figure 3, to ensure the material coordinate o-x′y′z′ coincide with the global coordinate o-xyz, the material coordinate o-x′y′z′ should be rotated. The rotation matrices of material coordinate o-x′y′z′ with respect to the global coordinate o-xyz are [37],
R x ( α ) = [ 1 0 0 0 cos α sin α 0 sin α cos α ]
R y ( β ) = [ cos β 0 sin β 0 1 0 sin β 0 cos β ]
R z ( γ ) = [ cos γ sin γ 0 sin γ cos γ 0 0 0 1 ]
where α, β, and γ are the rotation angles about the axis x, y, and z, respectively, with counter-clockwise positive.
Thus, a vector having a composition rotation about the axes x, y, and z in sequence could be expressed as,
p new = R p old
where p new is the new vector of p old after the composition rotation, both of them are in the same coordination frame of o-xyz; R is the composition rotation matrix as,
R = R z ( γ ) R y ( β ) R x ( α )
With the three different types of single crystal, three incompatible bicrystal models were constructed, as shown in Table 2.
Besides the mechanical properties, the diffusivity and solubility of hydrogen in steel are given by Fujii et al. as [38],
s = 4300 e 3261 / T
D = 7611 × 10 5 e 1157 / T 1 + ( 1.05 × 10 3 e 3573 / T )

4.3. Boundary Conditions, Loading Process, and Meshing

In the finite element model, the surface perpendicular to direction 1 of grain A is fixed initially, and then a constant displacement U1 equal to 0.5 is applied to the right surface of grain B. The simulation temperature is assumed to be 325 K, and the diffusivity and solubility of hydrogen in steel are calculated as 3.4096 × 10⁻⁵ mm2·s−1 and 0.1887 ppm mm·N−1/2. With a partial molar volume of hydrogen VH in the iron-based metal equals 2.0 × 103 mm3·mol−1, the pressure stress factor kσ is 3.92189. It is assumed that the initial hydrogen concentration in the whole model is 50 ppm, which corresponds to a normalized concentration of 265 N1/2·mm−1.
When establishing a finite element model that can be directly used in simulation calculations, the quality of the finite element mesh is the main consideration in determining the calculation scale and calculation accuracy. The focus of this paper is the distribution of hydrogen concentration near the grain boundary. To balance the calculation scale and calculation accuracy during grid division, a denser grid is divided near the grain boundary and a sparse grid is divided in other places to ensure a short calculation time and good calculating accuracy. The element type used is DC3D8R.

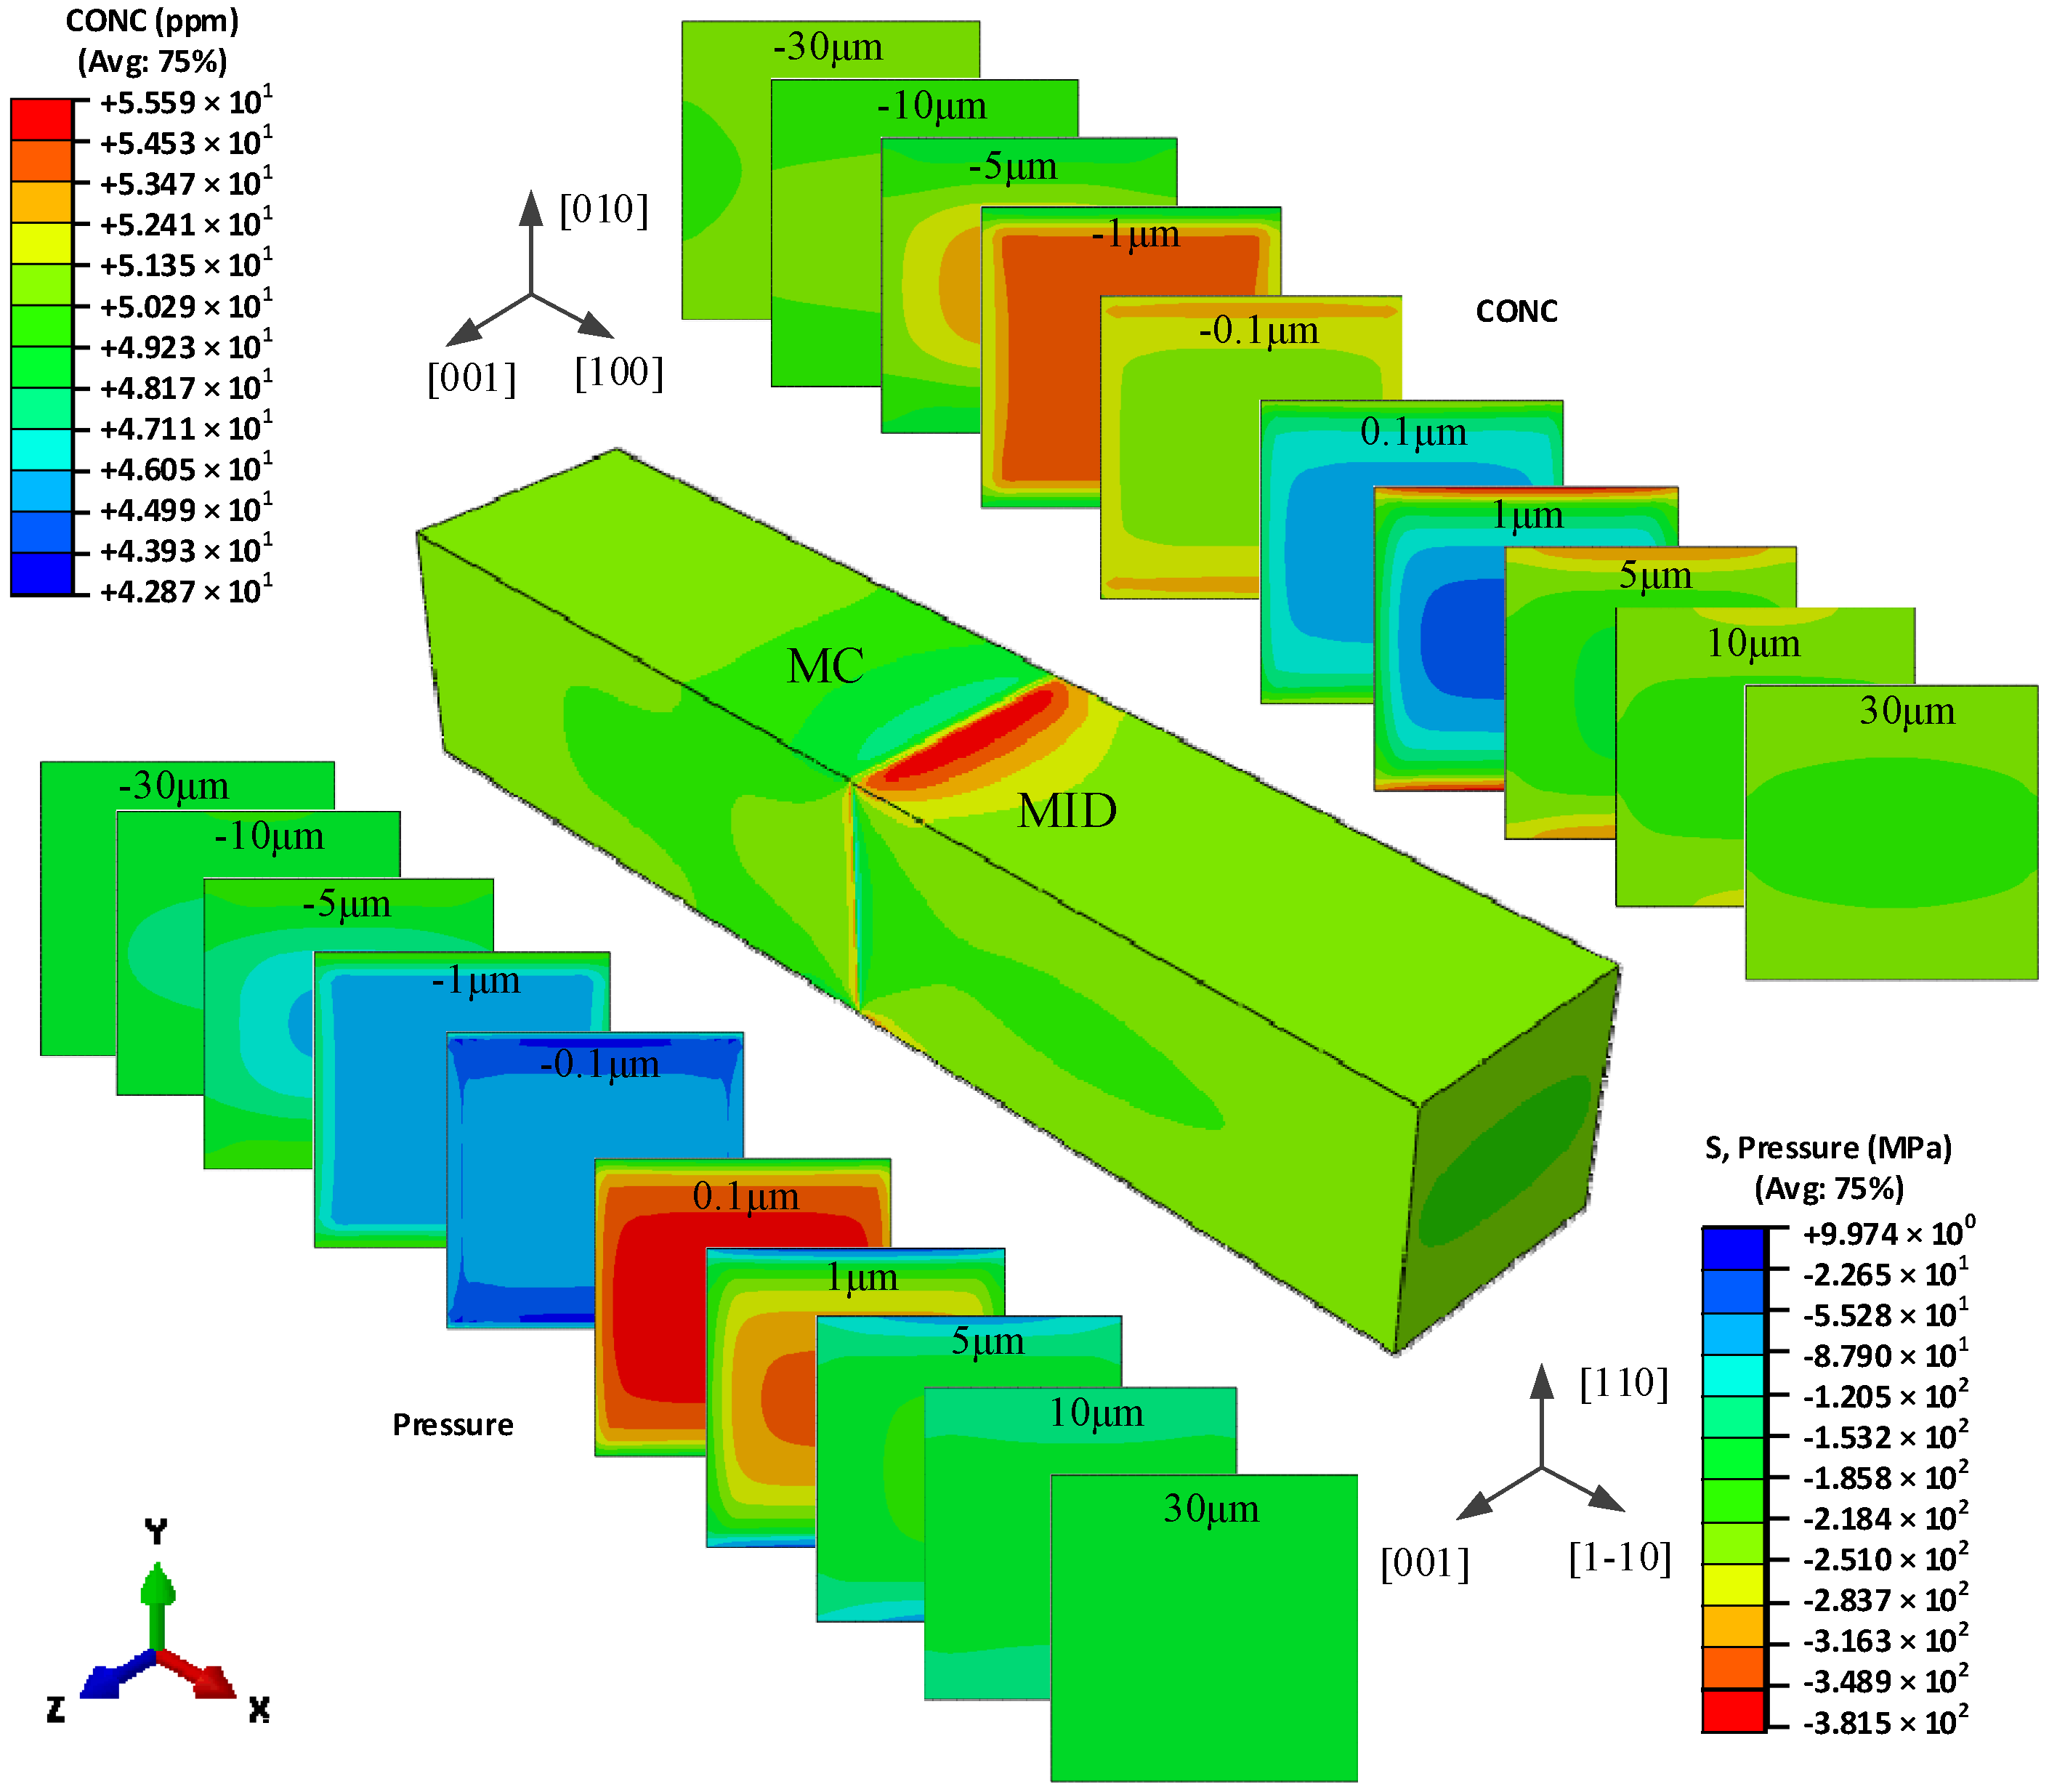
5. Results and Discussion

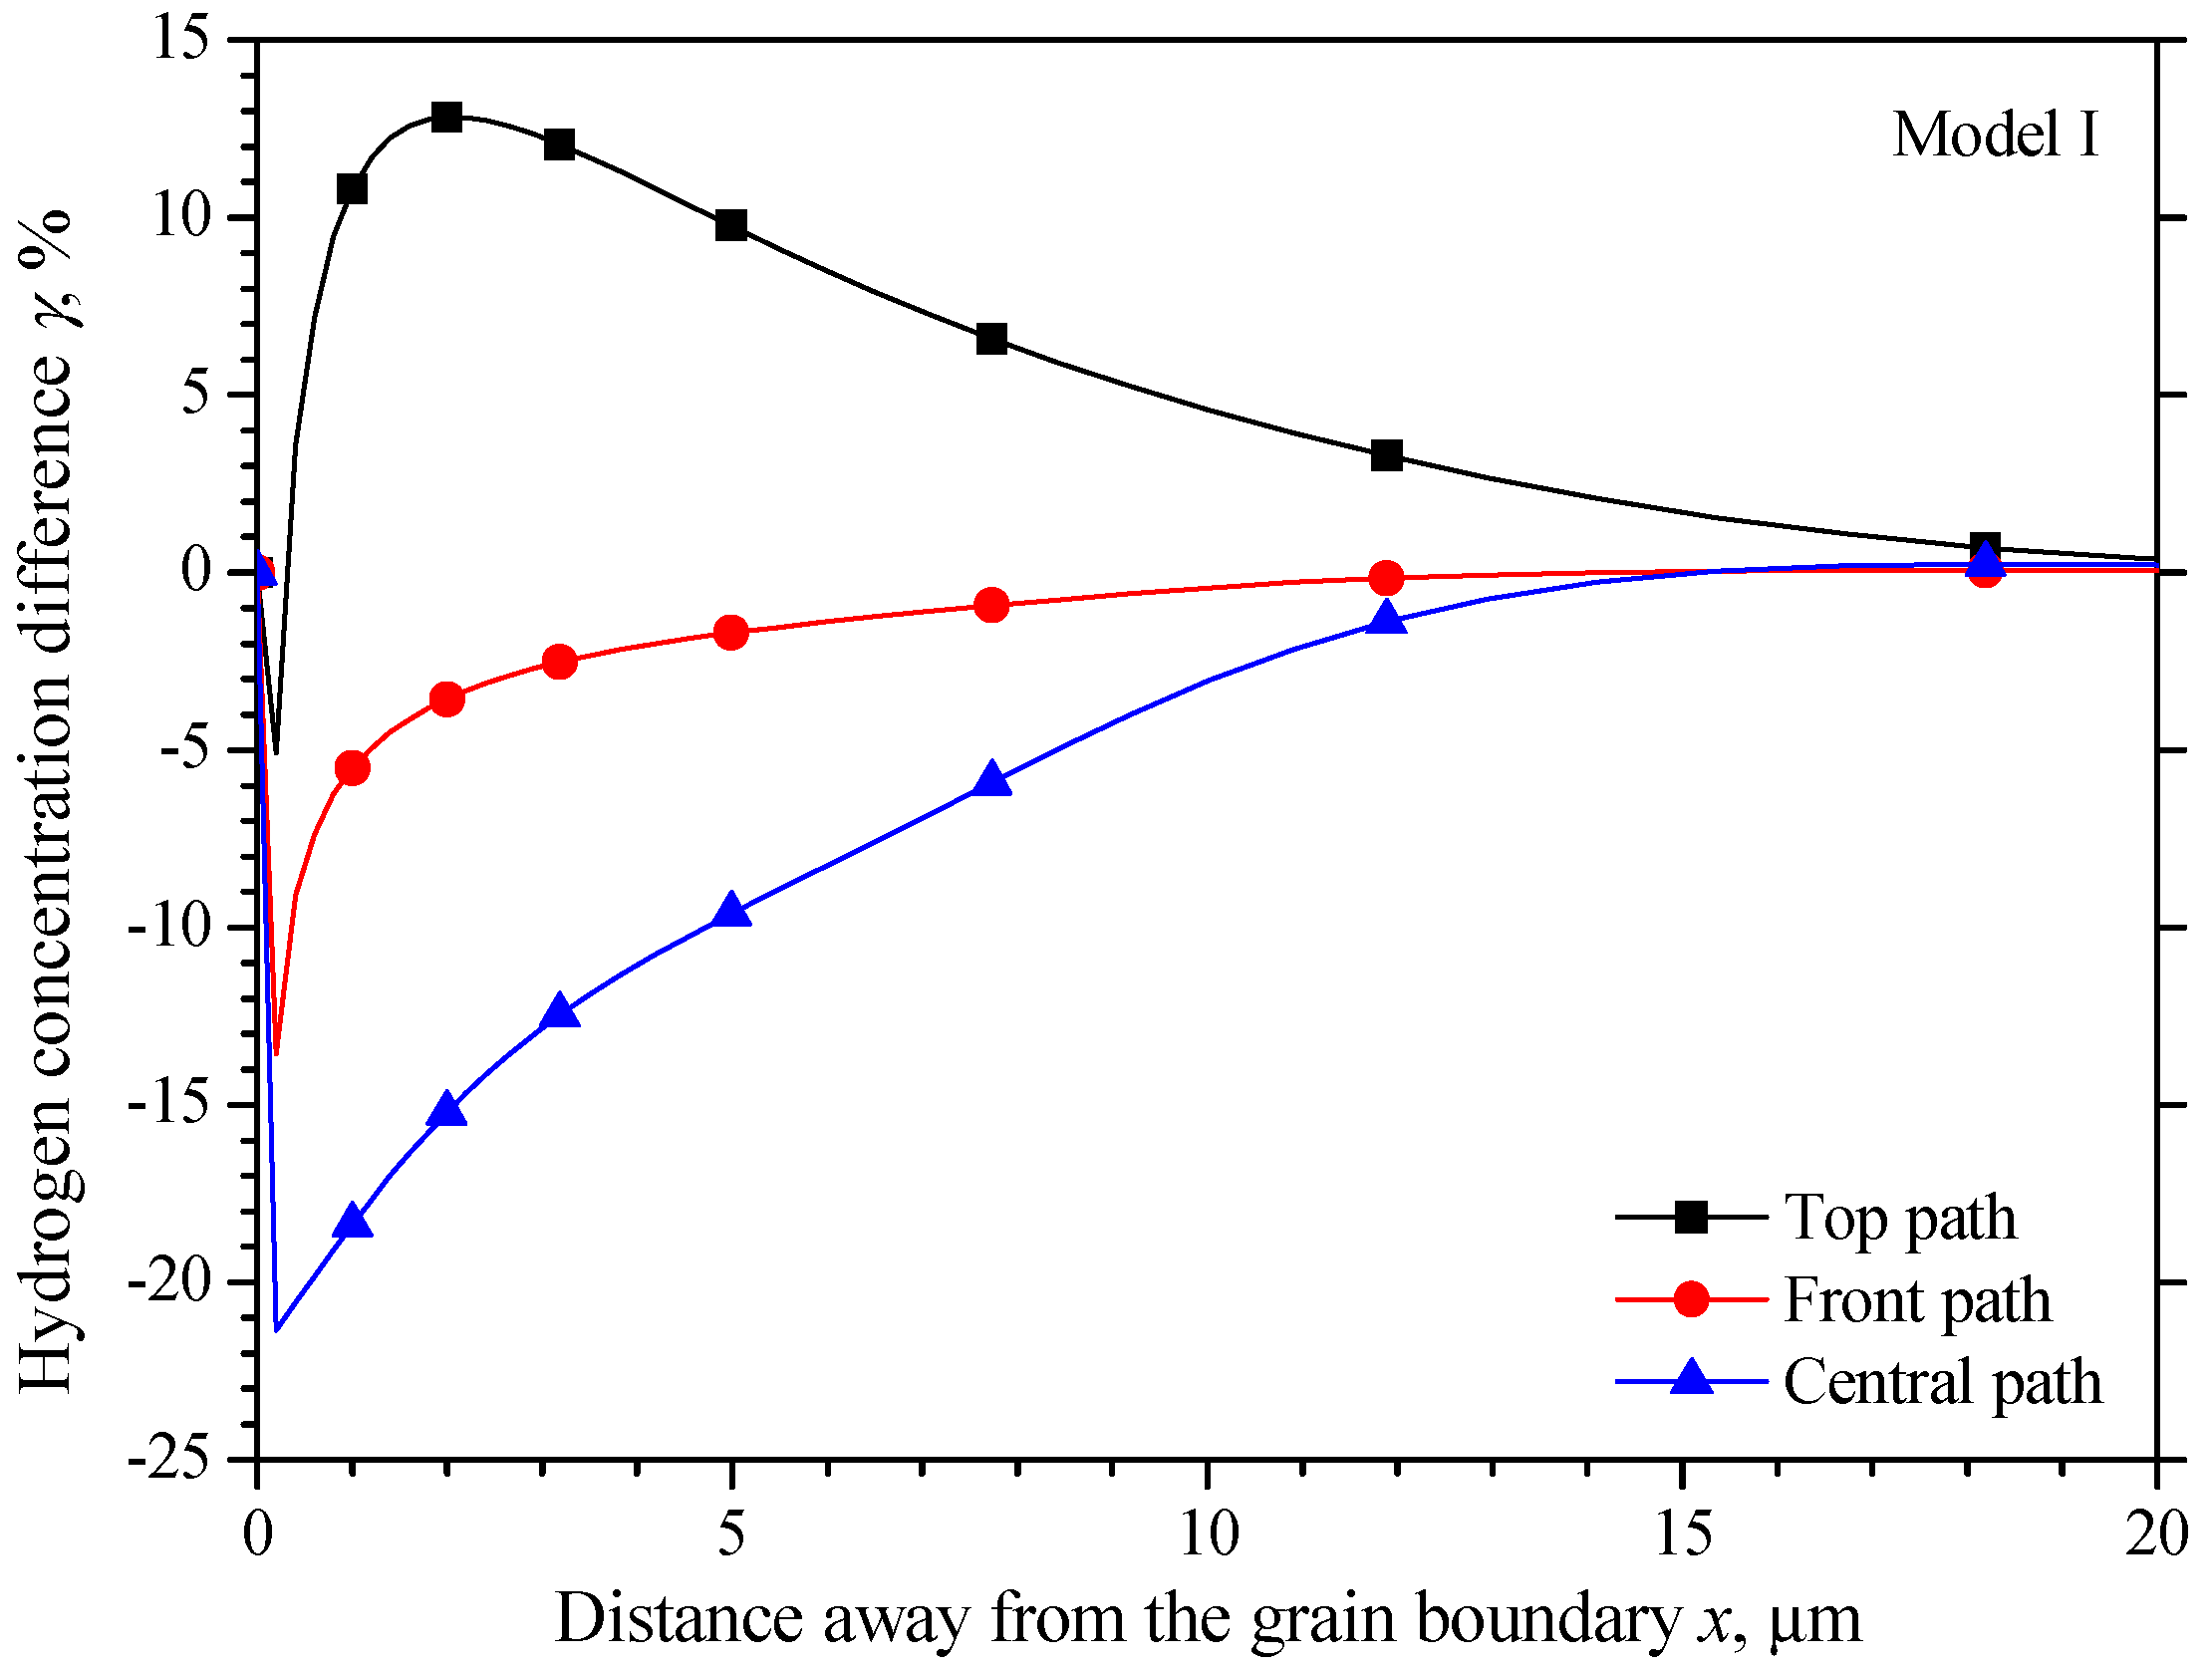
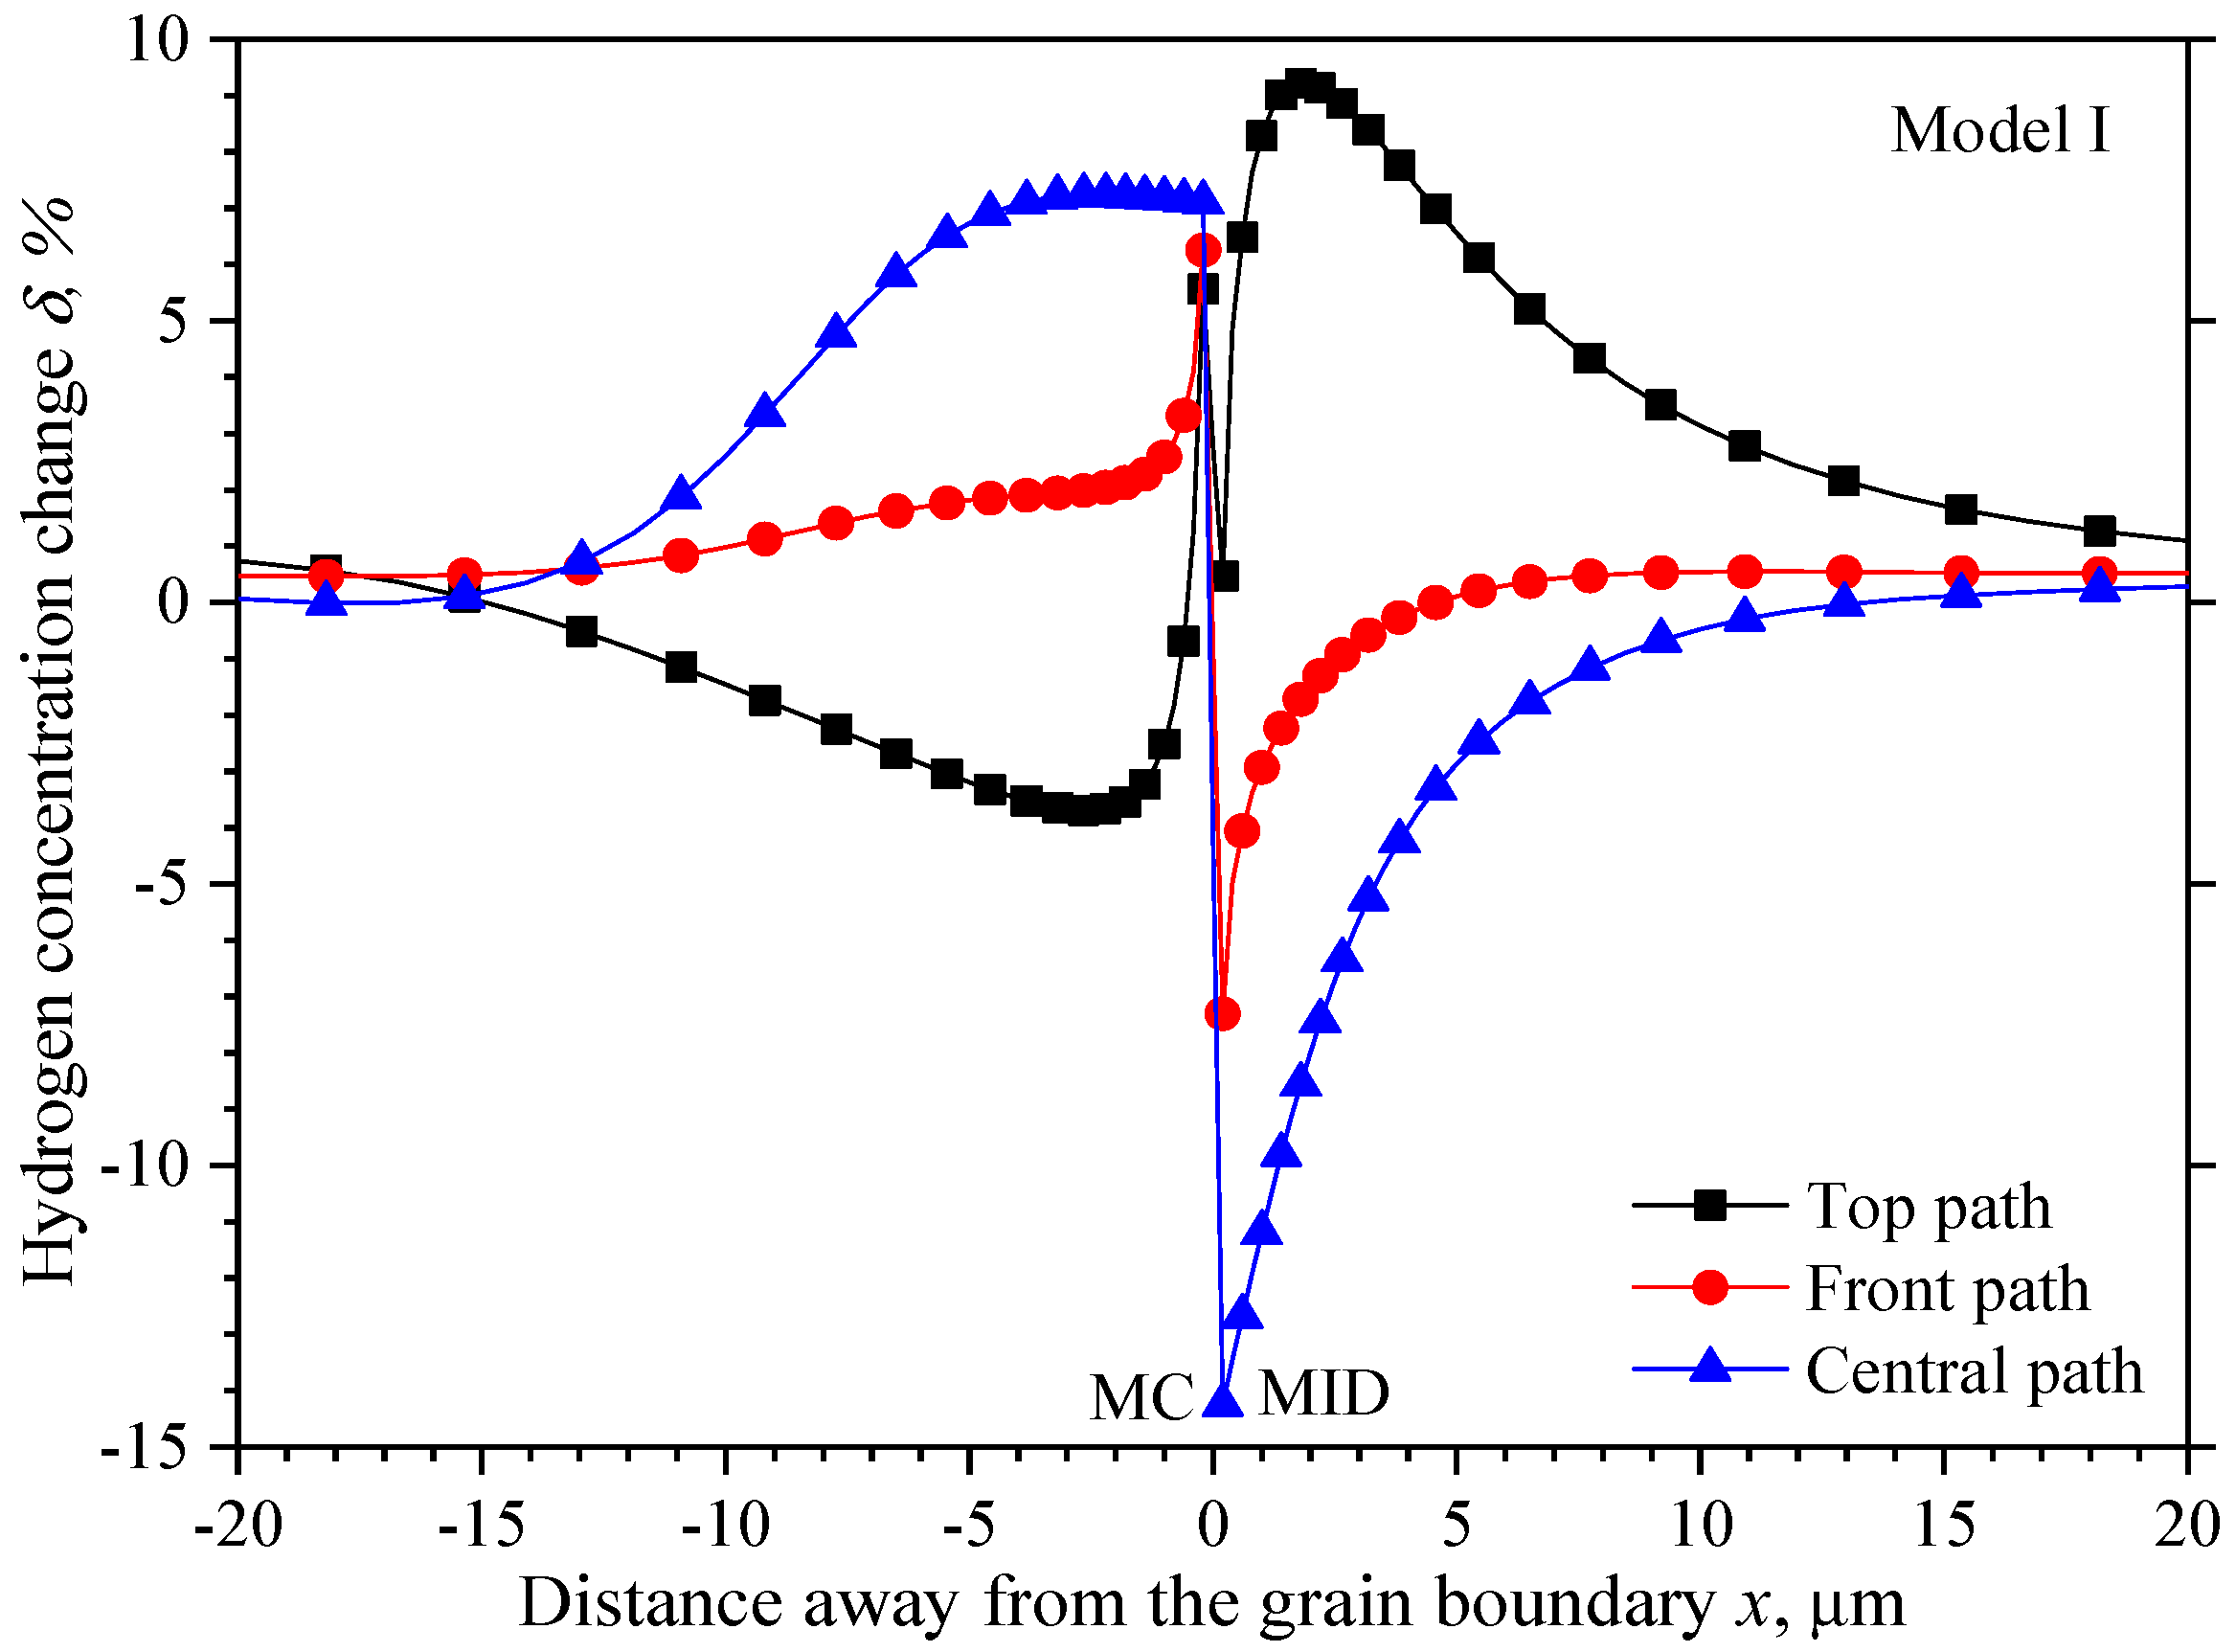
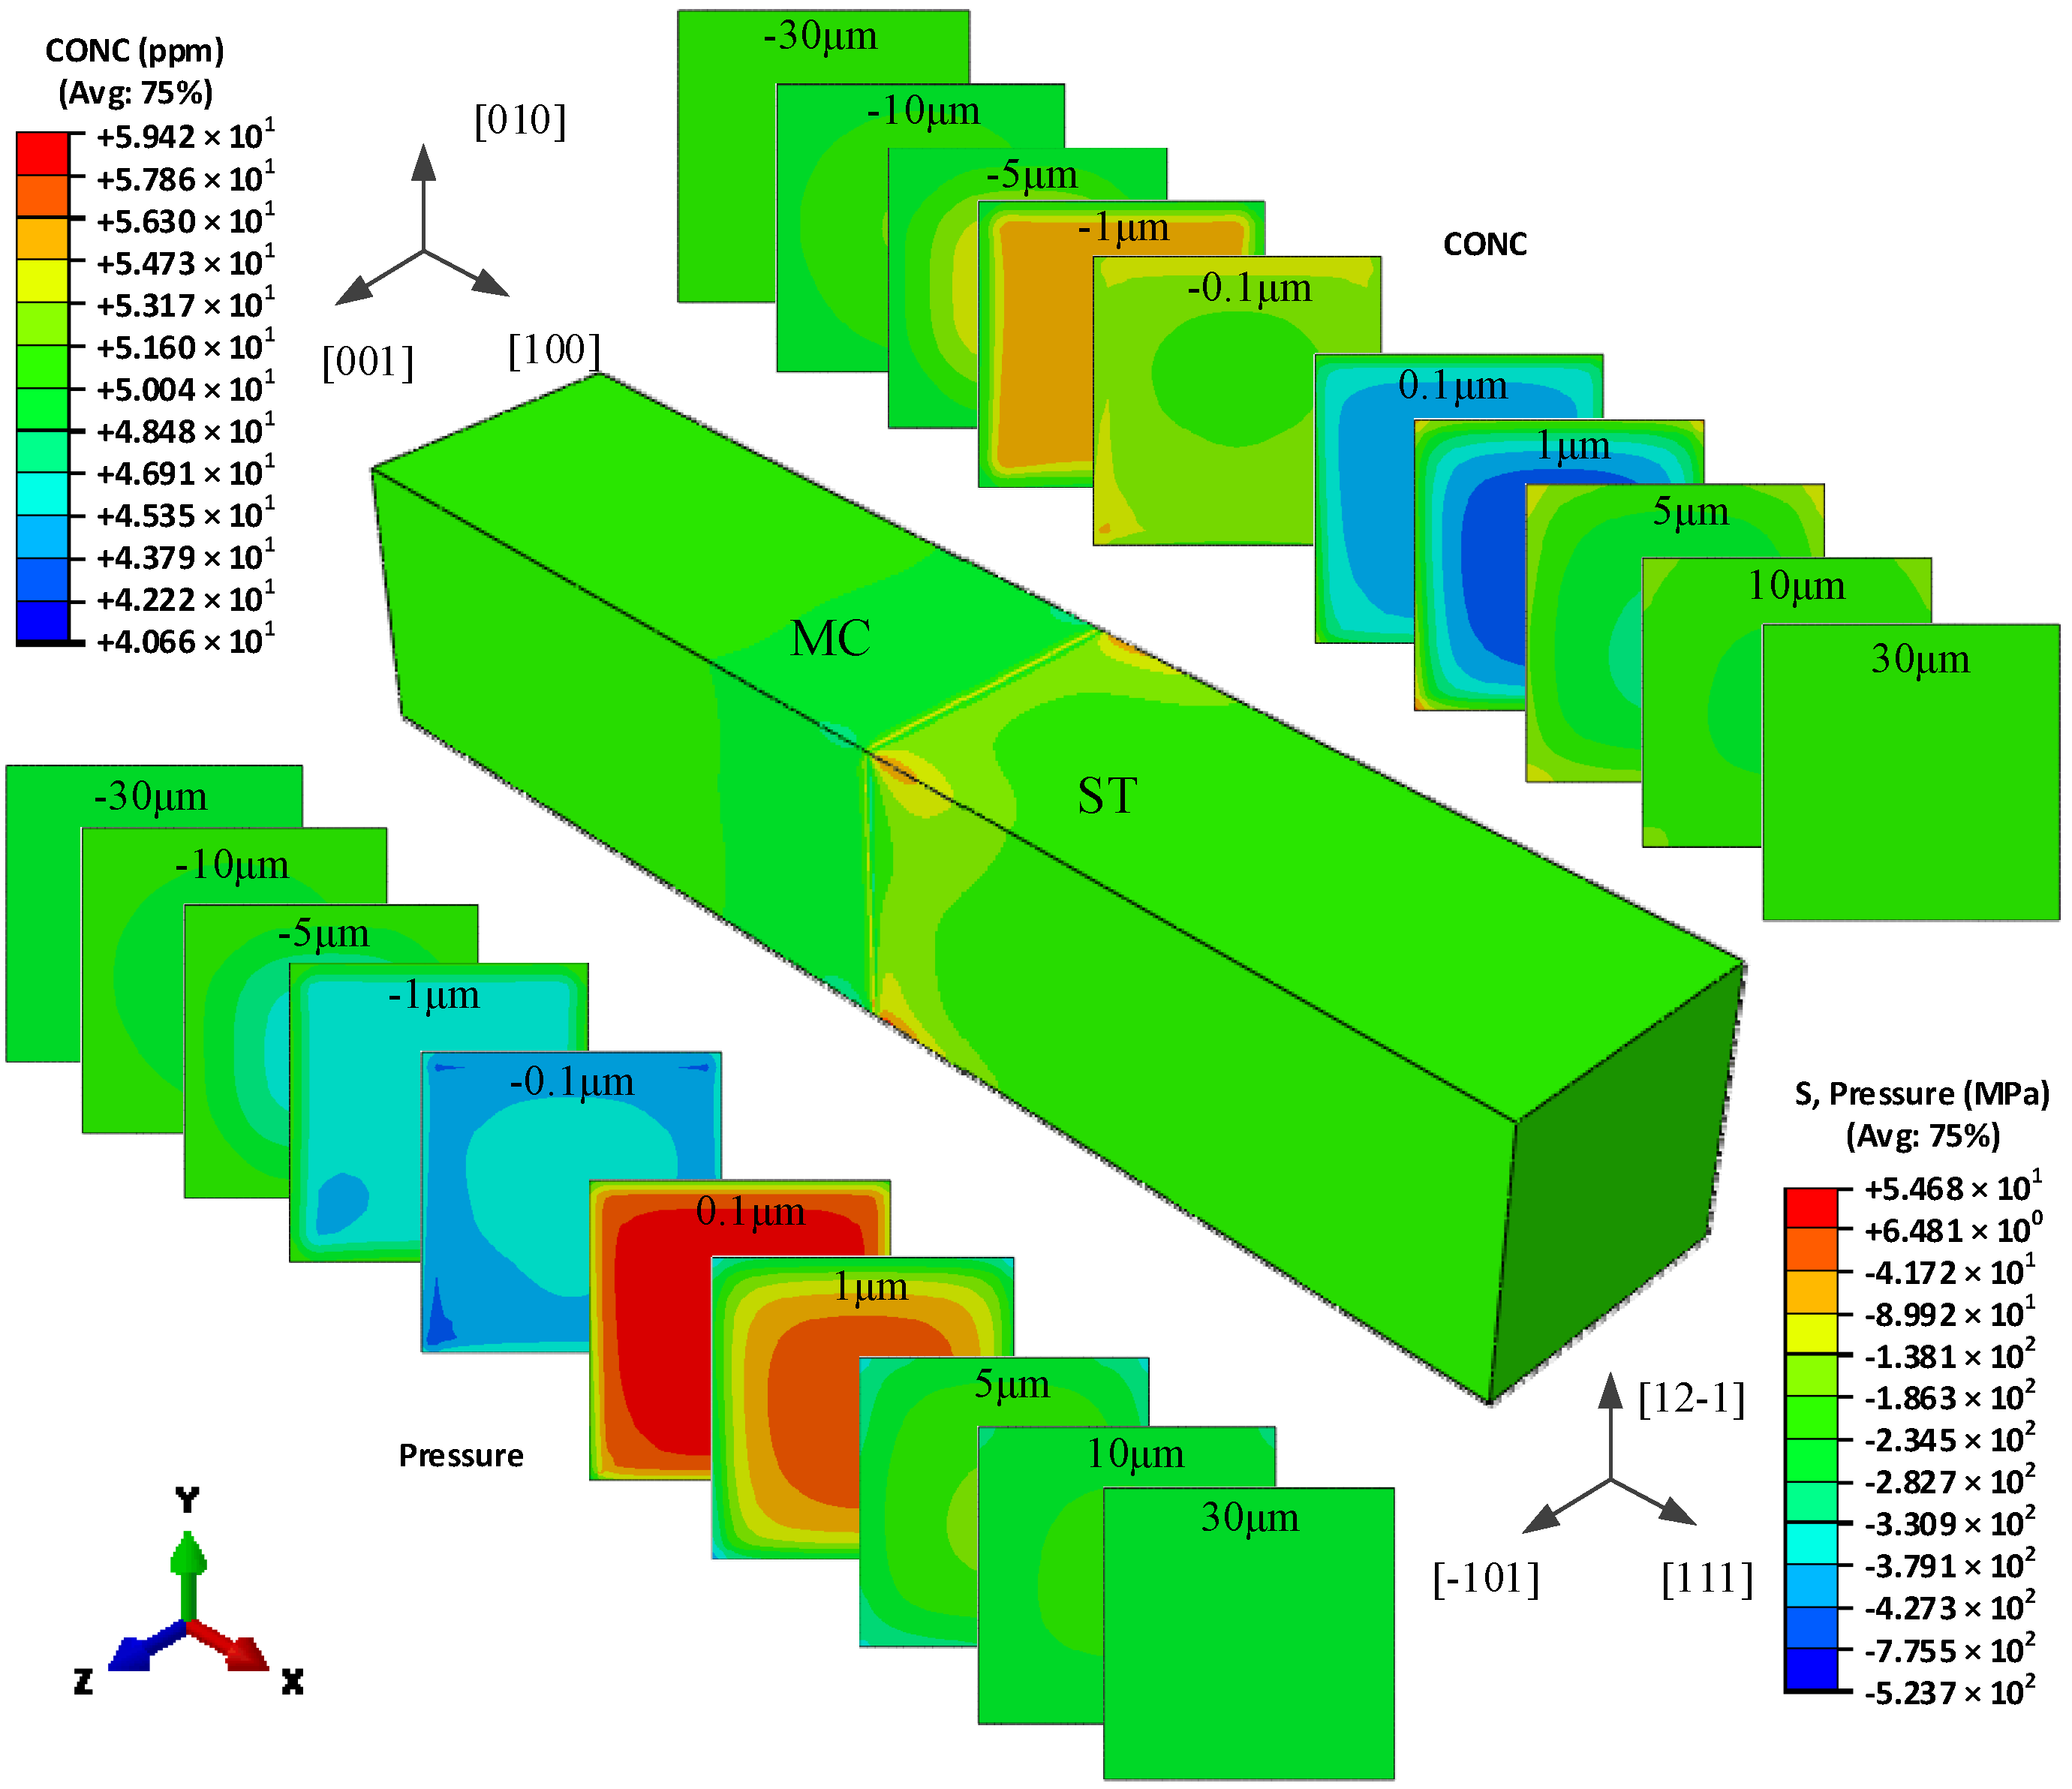
5.1. The Hydrogen Concentration Distribution in the Model I Crystal

Figure 4 shows the redistribution of hydrogen in the global model of type I bicrystal, and the hydrogen concentration distribution in different cross-sections of the two different grains. The orientation mismatch of the two grains causes a significant hydrogen difference near the grain boundary. The cross-sections of the two grains, which respect the (100) plane and (1-10) plane in MC grain and MID grain, respectively, have different hydrogen concentration distributions.
On the cross-section 0.1 μm apart from the GB in the MID grain, the hydrogen shows a plateau in the middle of the cross-section with low concentration, and increases towards the surface. When the distance increases to 1 μm, the hydrogen concentration decreases a little in the middle and increases at the surface, especially in the y-direction, which represents the [110] orientation. With the cross-section having an increased distance from the grain boundary, the hydrogen concentration decreases at the surface and increases in the middle, and eventually has little difference.
In MC grains, the hydrogen concentration is also lower in the middle, larger and increasing toward the surface, however, the maximum concentration seems to be located near the surface in the y direction, representing the [010] orientation. When the distance is increased to −1 μm, the concentration has a larger value, the middle platform is larger, and the surface value is smaller. The hydrogen has an opposite distribution on the cross-section of −0.1 μm and −1 μm away from the grain boundary. With an increased distance from the grain boundary, the hydrogen concentration increases on the surface and decreases in the middle, and eventually has little difference. Whether the distribution of hydrogen in the MC grain or the MID grain, it is symmetrical about the X-Y plane and X-Z plane, and it is similar to the hydrostatic pressure distribution, which proves that the redistribution of hydrogen is driven by the unequal hydrostatic pressure induced by the misorientation of the two grains.
A more intuitive hydrogen concentration change δ relative to the initial concentration caused by the unequal hydrostatic pressure is observed along the three paths shown in Figure 5, and the results are shown in Figure 6. The research has shown that the stress distribution near grain boundaries depends strongly on the crystal orientation, and the stress is discontinuous in the two misoriented grains on the grain boundary [23]. However, the step hydrogen concentration differences will not happen on the grain boundary due to the identical hydrogen solubility in the two misoriented grains. When the distance is very close to the grain boundary, about ±0.2 μm, the hydrogen concentration differences are apparent in the two grains equidistant from the grain boundary, and a larger gradient exists in the narrow region to ensure the same concentration on the boundary.
Beyond the narrow region, the lowest hydrogen concentration in the MID grain is 0.5%, −7.3%, and −14.3% on the top, front, and central path, respectively. The hydrogen concentration along the front path and central path increases continuously to the initial value when the distance away from the grain boundary, while the hydrogen concentration along the top path increases to the highest value of 9.2% at 2 μm apart from the grain boundary, and then decreases gradually to the initial value. The vertical distance between each two curves presents the hydrogen concentration difference, so the hydrogen away has the highest concentration on the top path and the lowest concentration on the central path. The hydrogen concentration has a larger gradient from the center towards the top than the front. In contrast to the hydrogen concentration in the MID grain, the highest value will be first achieved as 5.6%, 6.3%, and 7.1% on the top, middle, and front path respectively beyond the narrow region. With the distance away from the grain boundary, the hydrogen concentration decreases gradually along the middle path; a short concentration platform with small fluctuations extends to about −4 μm exists on the front path, and then decreases gradually close to the initial value. While the hydrogen concentration will decrease to the lowest value of −3.9% at 2.7 μm, and then increases gradually close to the initial value.
Figure 7 compares the hydrogen concentration difference γ in the two different grains equidistant from the grain boundary,
γ = δ R δ L
where δR and δL respect the hydrogen concentration change in the right and left grains equidistant from the grain boundary, respectively. The maximum hydrogen concentration difference on the middle and front path is −13.6% and −21.4% at 0.2 μm equidistant from the grain boundary, and it is 12.8% on the top path at 2 μm equidistant from the grain boundary. The hydrogen concentration difference γ decreases from the highest value to about 0 when far from the grain boundary.

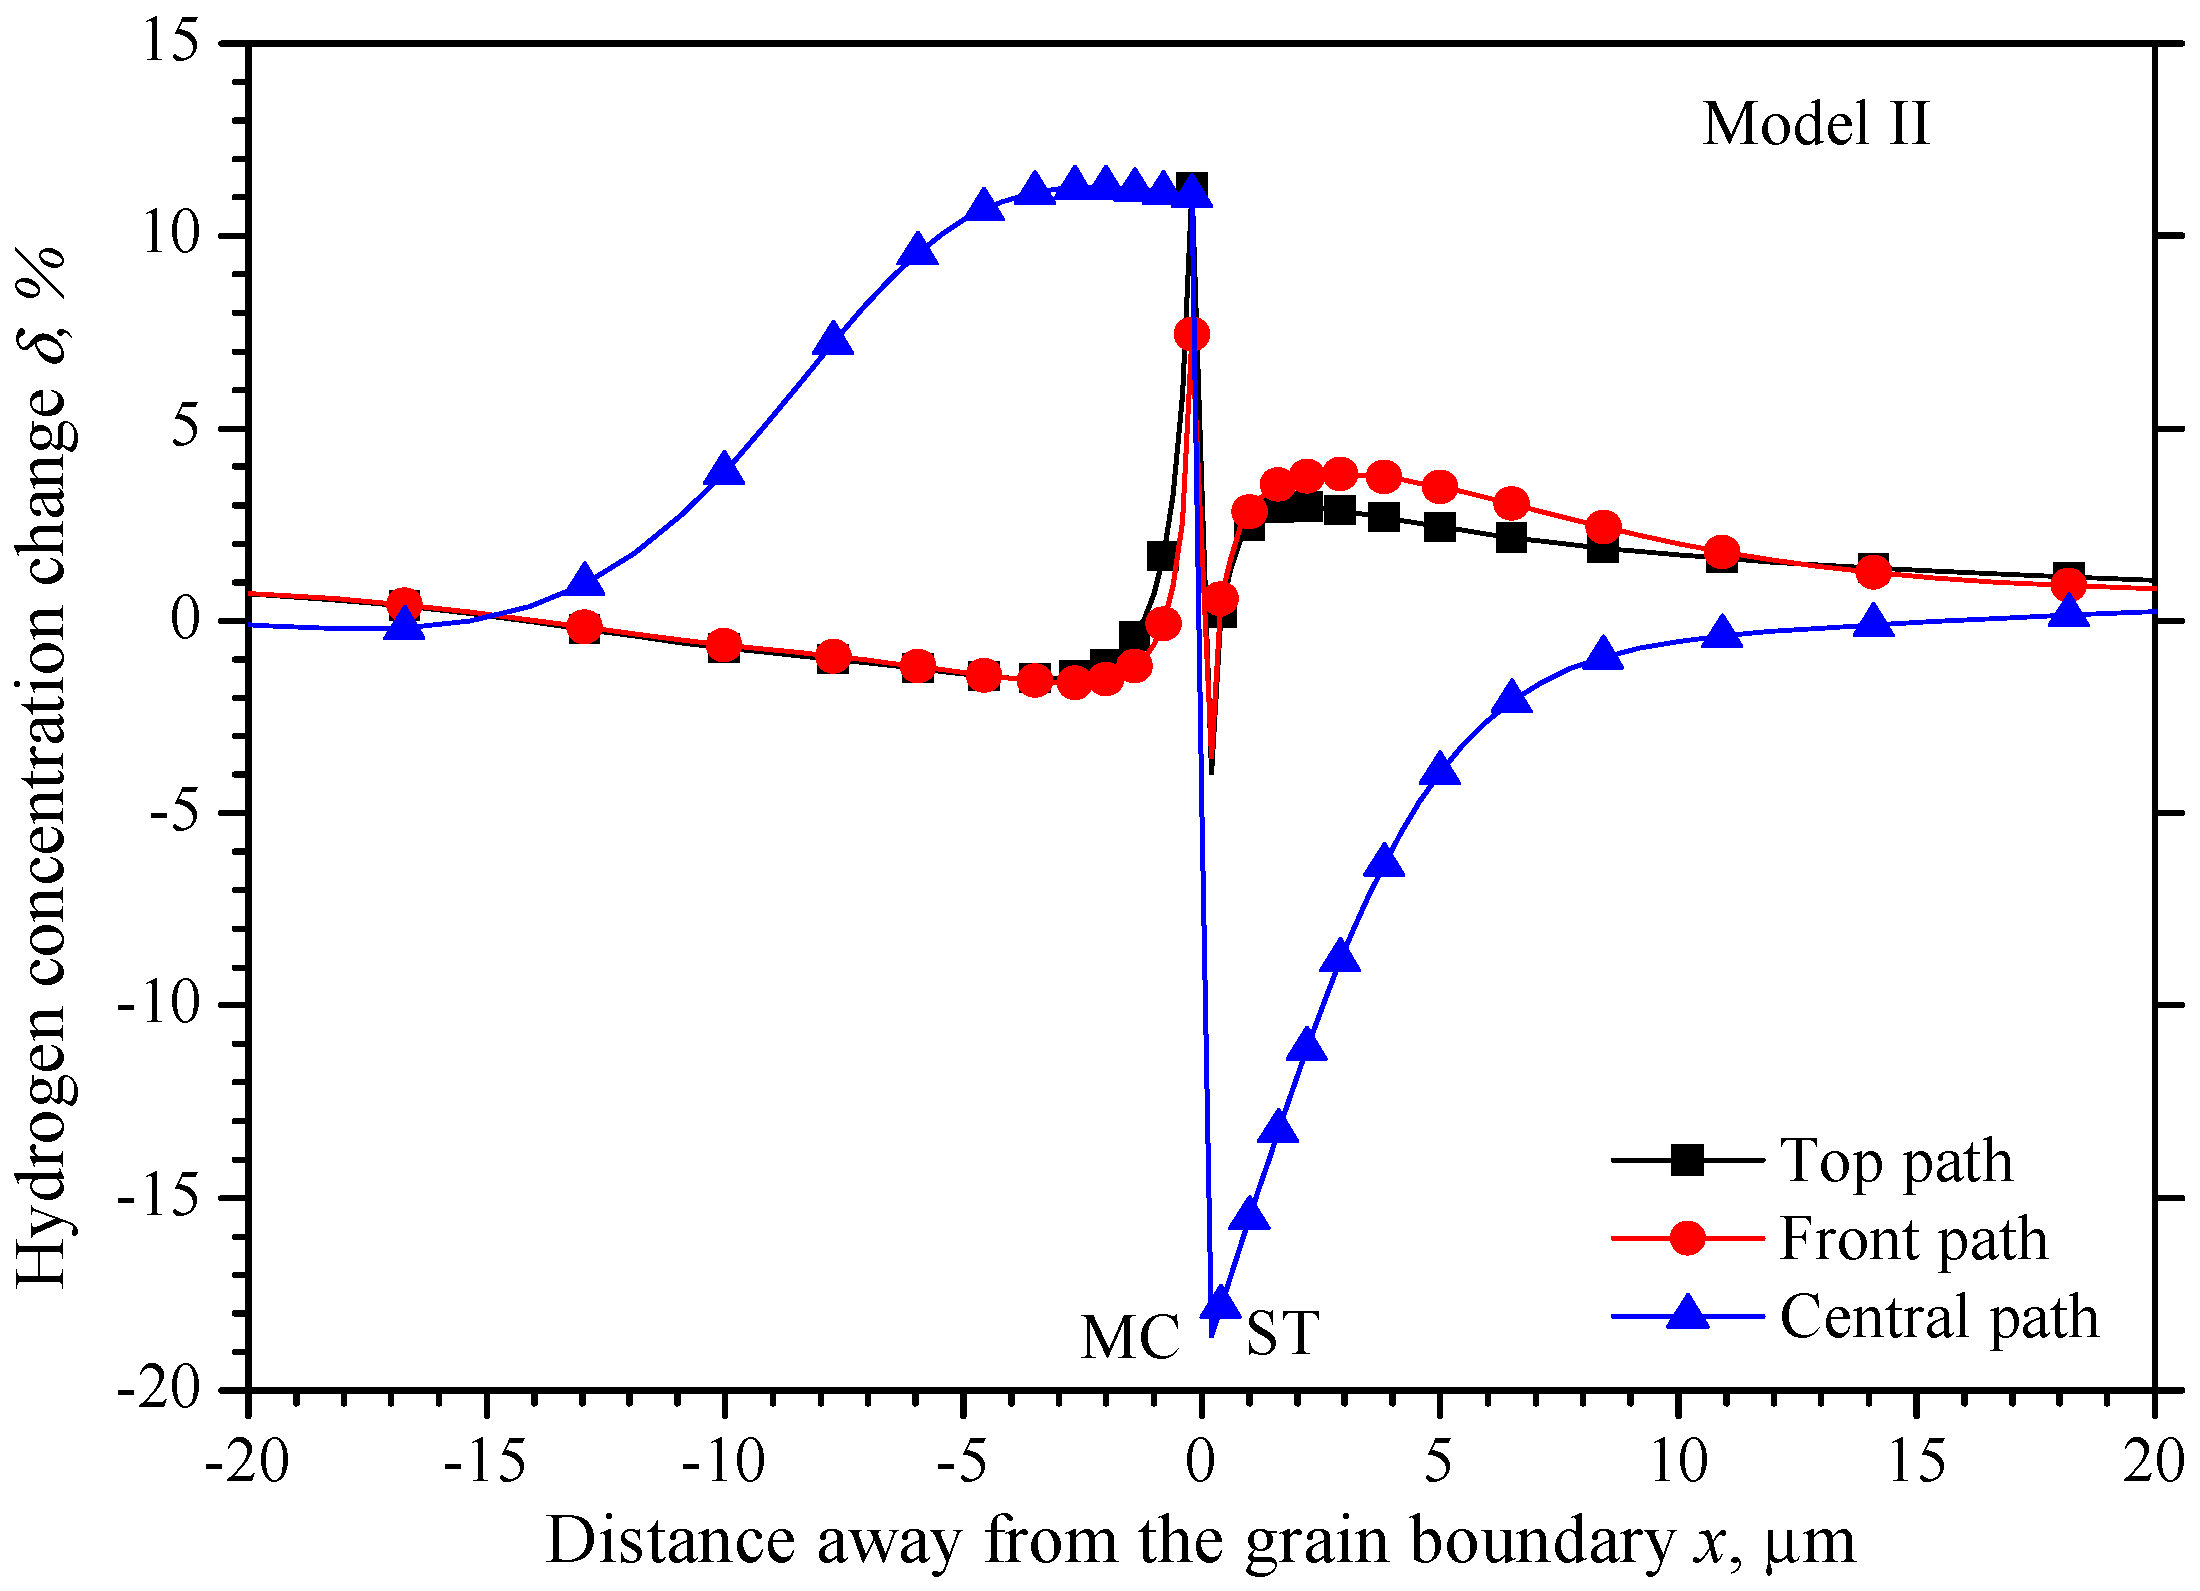
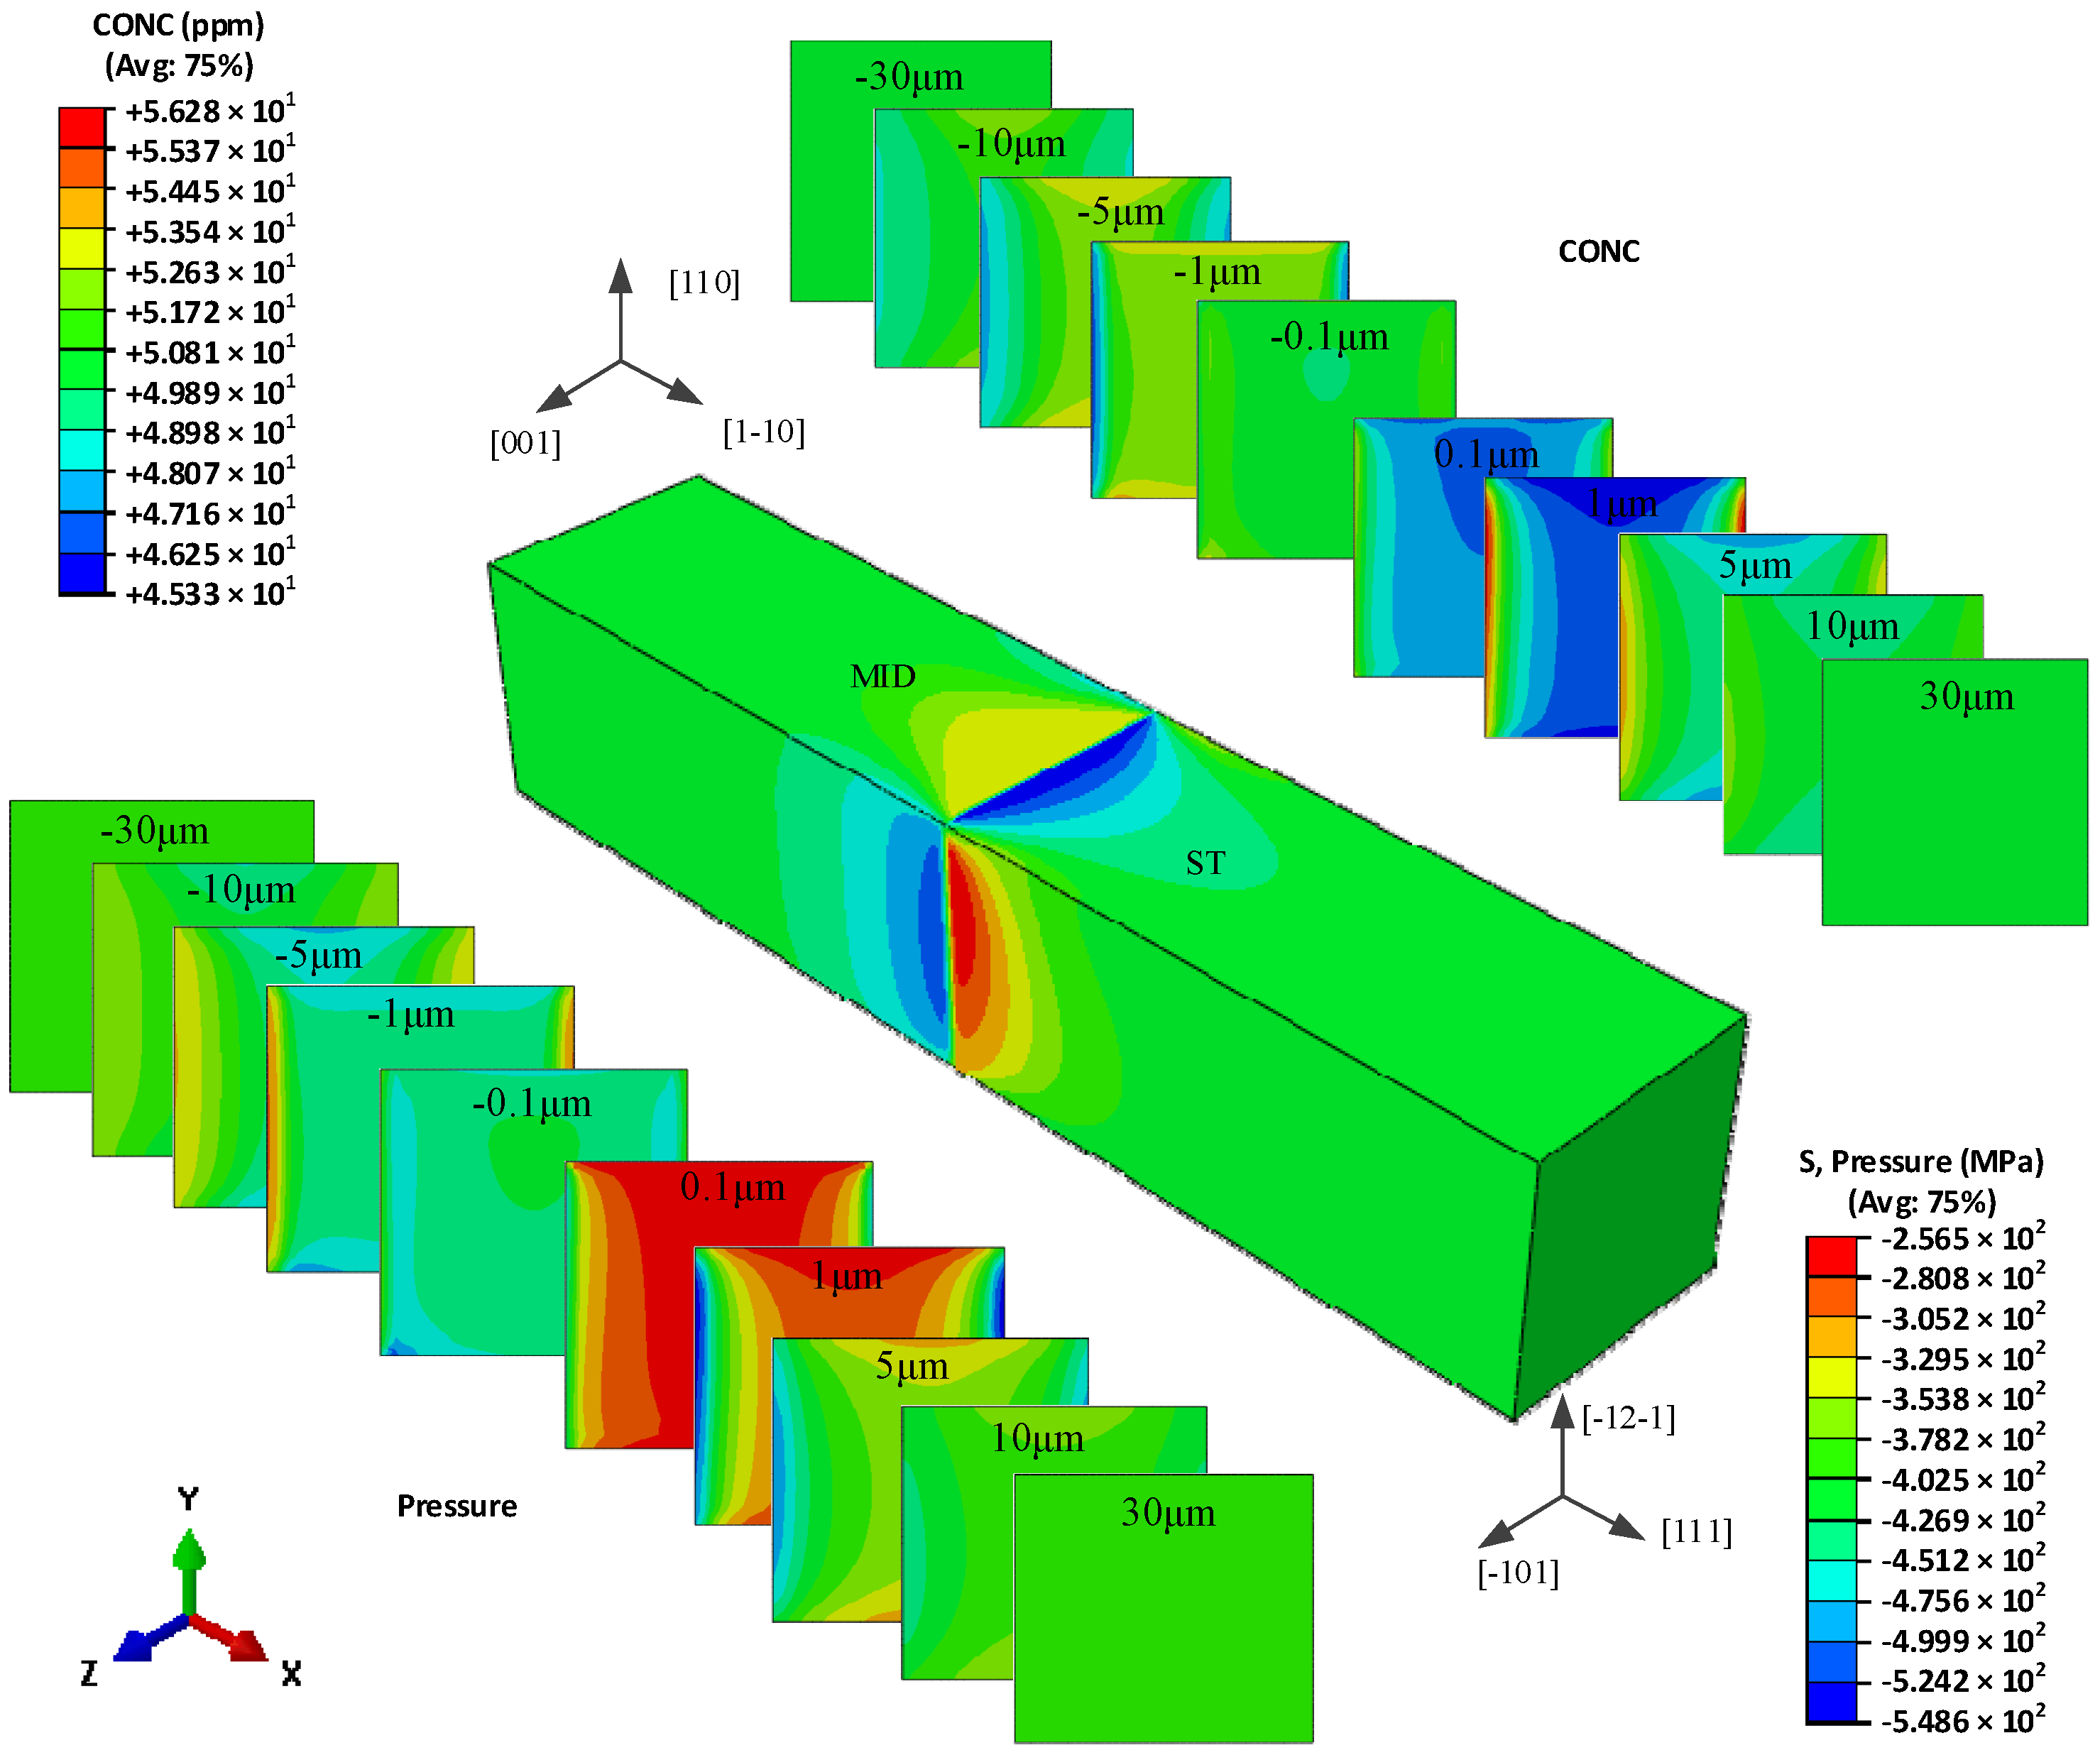
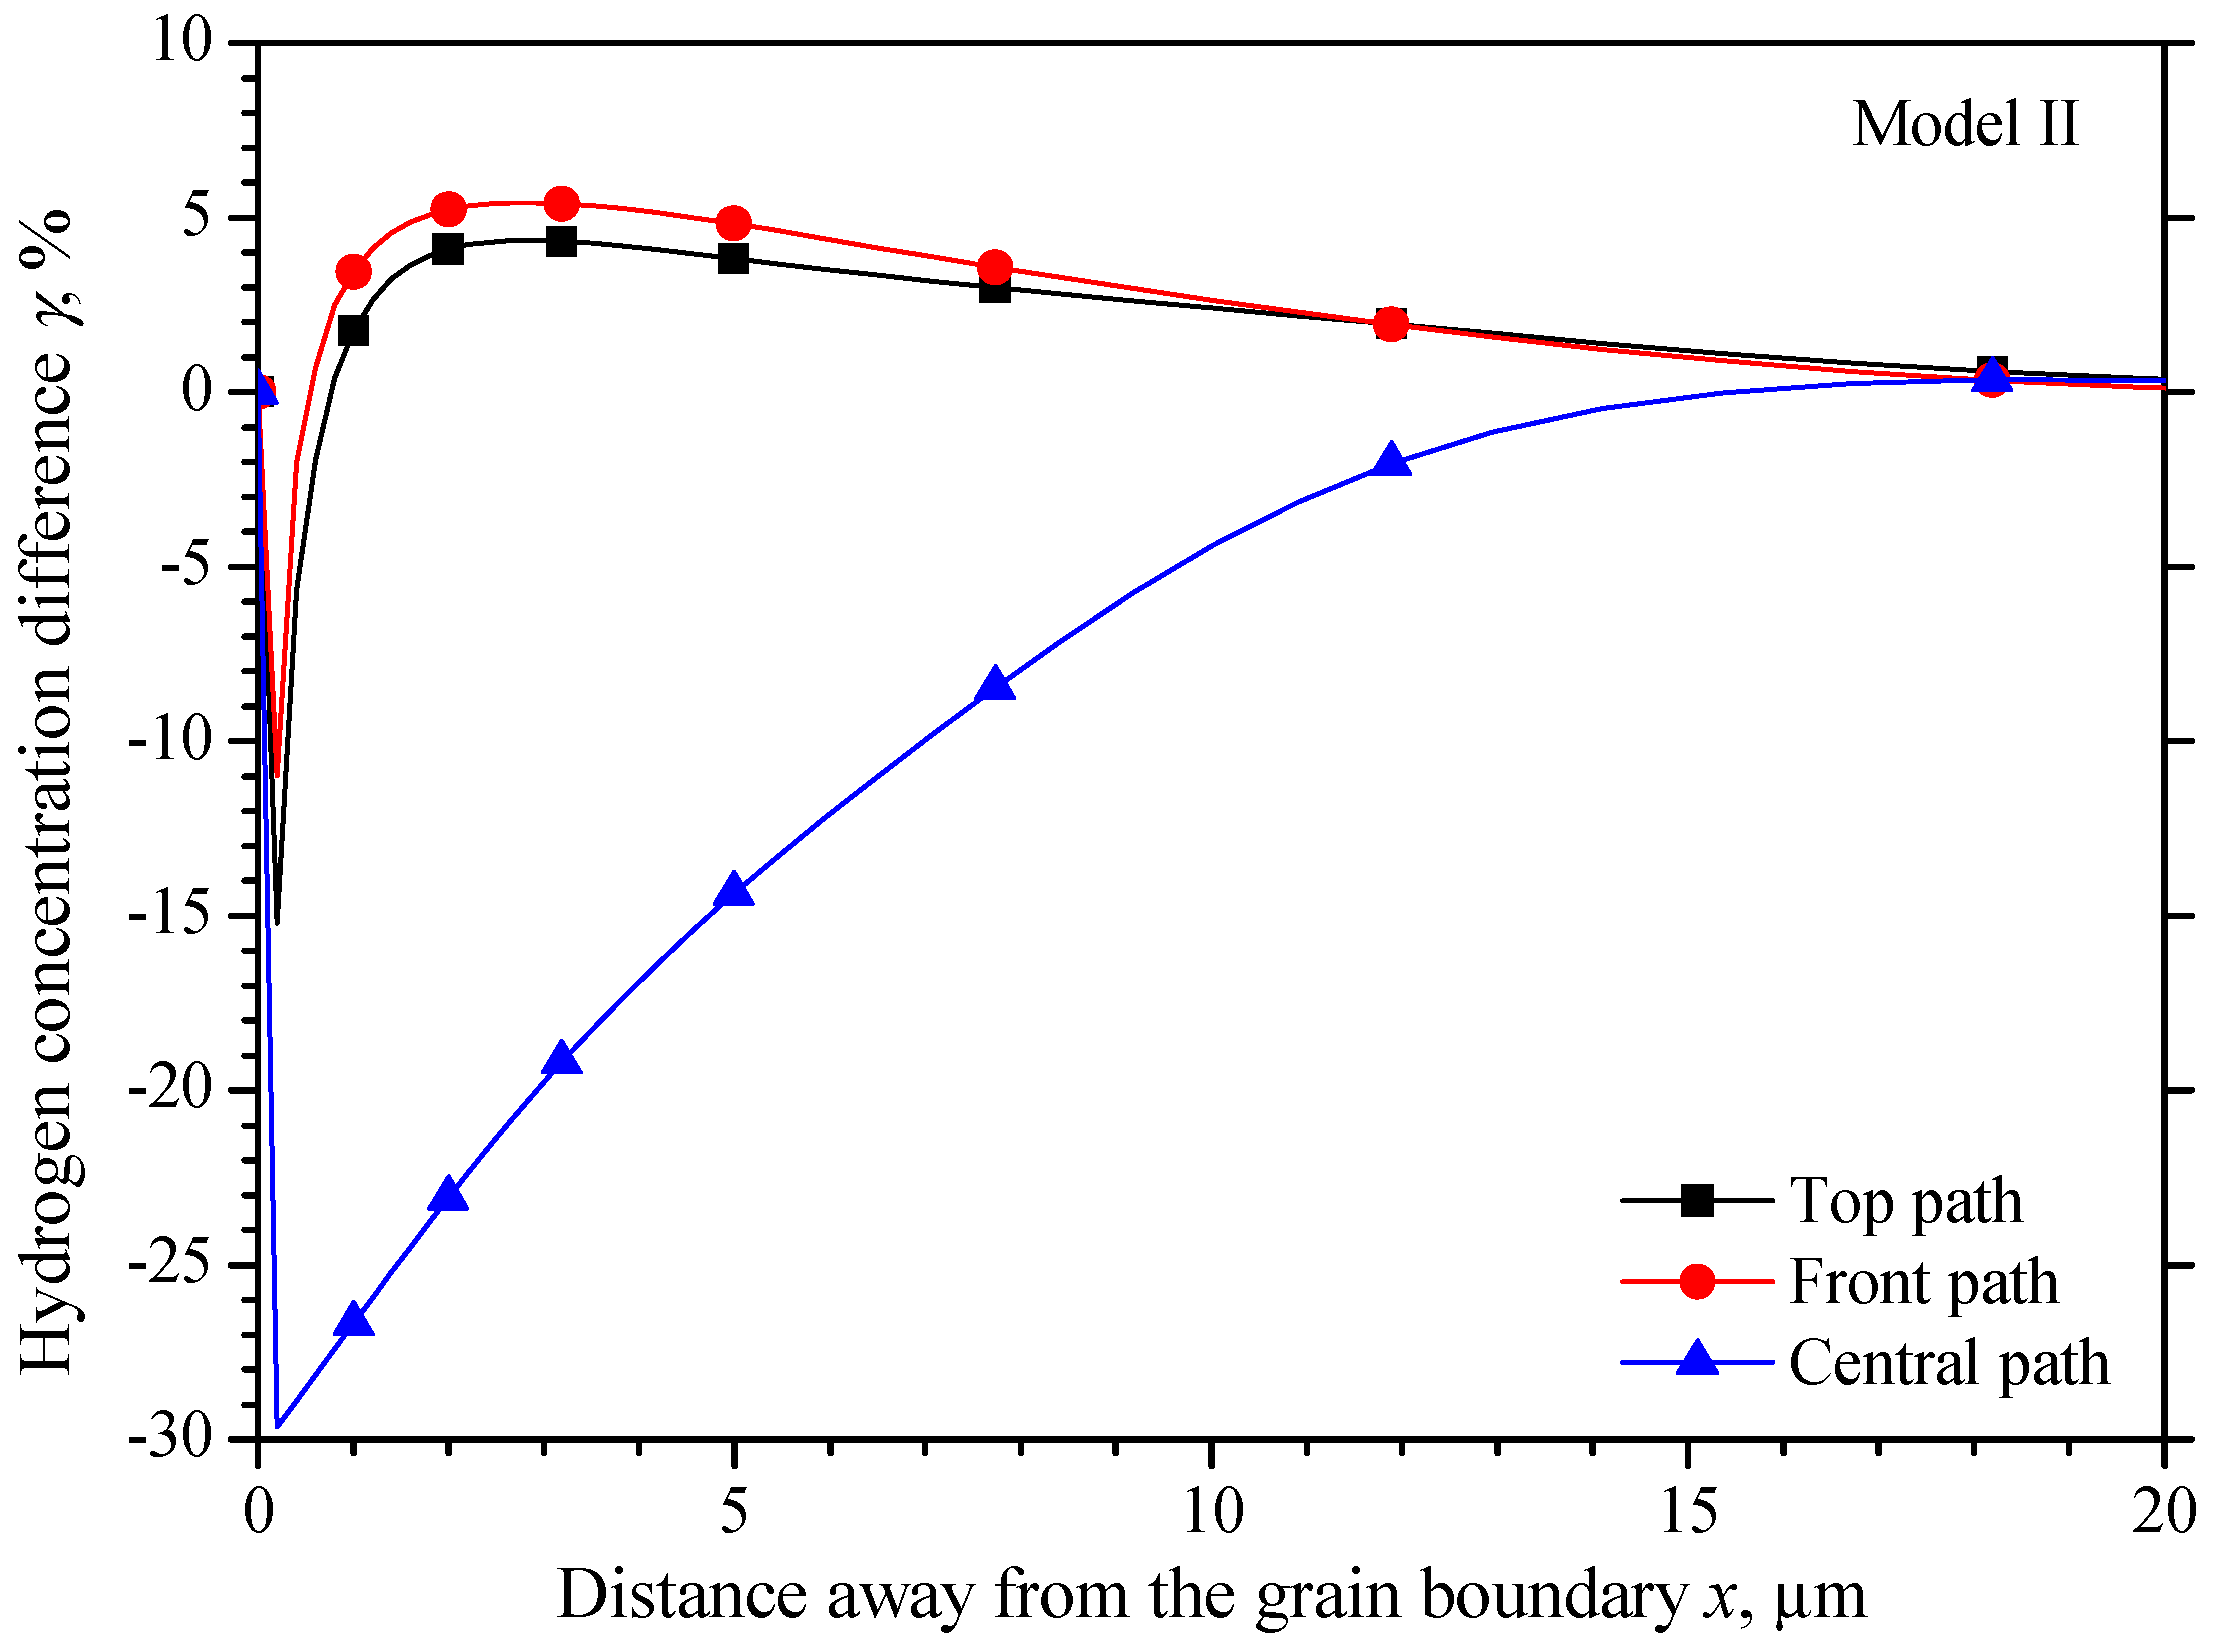
5.2. The Hydrogen Concentration Distribution in Model II Crystal

Figure 8 shows the redistribution of hydrogen in the global model of type II t bicrystal, and the hydrogen concentration distribution in different cross-sections. The highest value seems to locate on the four edges parallel to the x-axis in the ST grain. The cross-sections represent the (100) planes in the MC grain, and (-12-1) planes in the ST grain. On the cross-section of both grains, the hydrogen is almost symmetrical about the X-Y plane and X-Z plane, and has the same gradient from the center towards the surface along the y-axis and z-axis. The obvious distribution could be found on the cross-section within ±5 μm away from the grain boundary, and the differences disappear far from the grain boundary.
Figure 9 shows a more intuitive hydrogen concentration change δ along the three observing paths shown in Figure 5. There also exists a narrow region about ±0.2 μm from the grain boundary, in which the hydrogen concentration has a larger gradient from the MC grain to the ST grain. Beyond the narrow region, the lowest hydrogen concentration in the ST grain is −3.9%, −3.5%, and −5.1% on the top, front and central paths, respectively. The hydrogen concentrations on the top path and the front path almost coincide with each other, and they increase to the highest concentration close to 4.5% at 3 μm away from the grain boundary, and then decrease close to the initial value. While the hydrogen increases gradually close to the initial value. The hydrogen concentration distribution on the three paths in the MC grain is similar to that in the ST grain with an opposite trend. The hydrogen concentration on the top path and the front path coincide with each other, but they decrease to the lowest value of −1.5% at 3 μm away from the grain boundary from 2.5%, and then increase close to the initial concentration gradually. On the central path, the hydrogen concentration fluctuates around 11% until −4 μm away from the grain boundary and then decreases close to the initial concentration.
As shown in Figure 10, the maximum hydrogen concentration difference γ on the three paths all locate 0.2 μm equidistant from the grain boundary, the values are −15.2%, −10.98%, and −29.6% on the top, front, and central path, respectively.

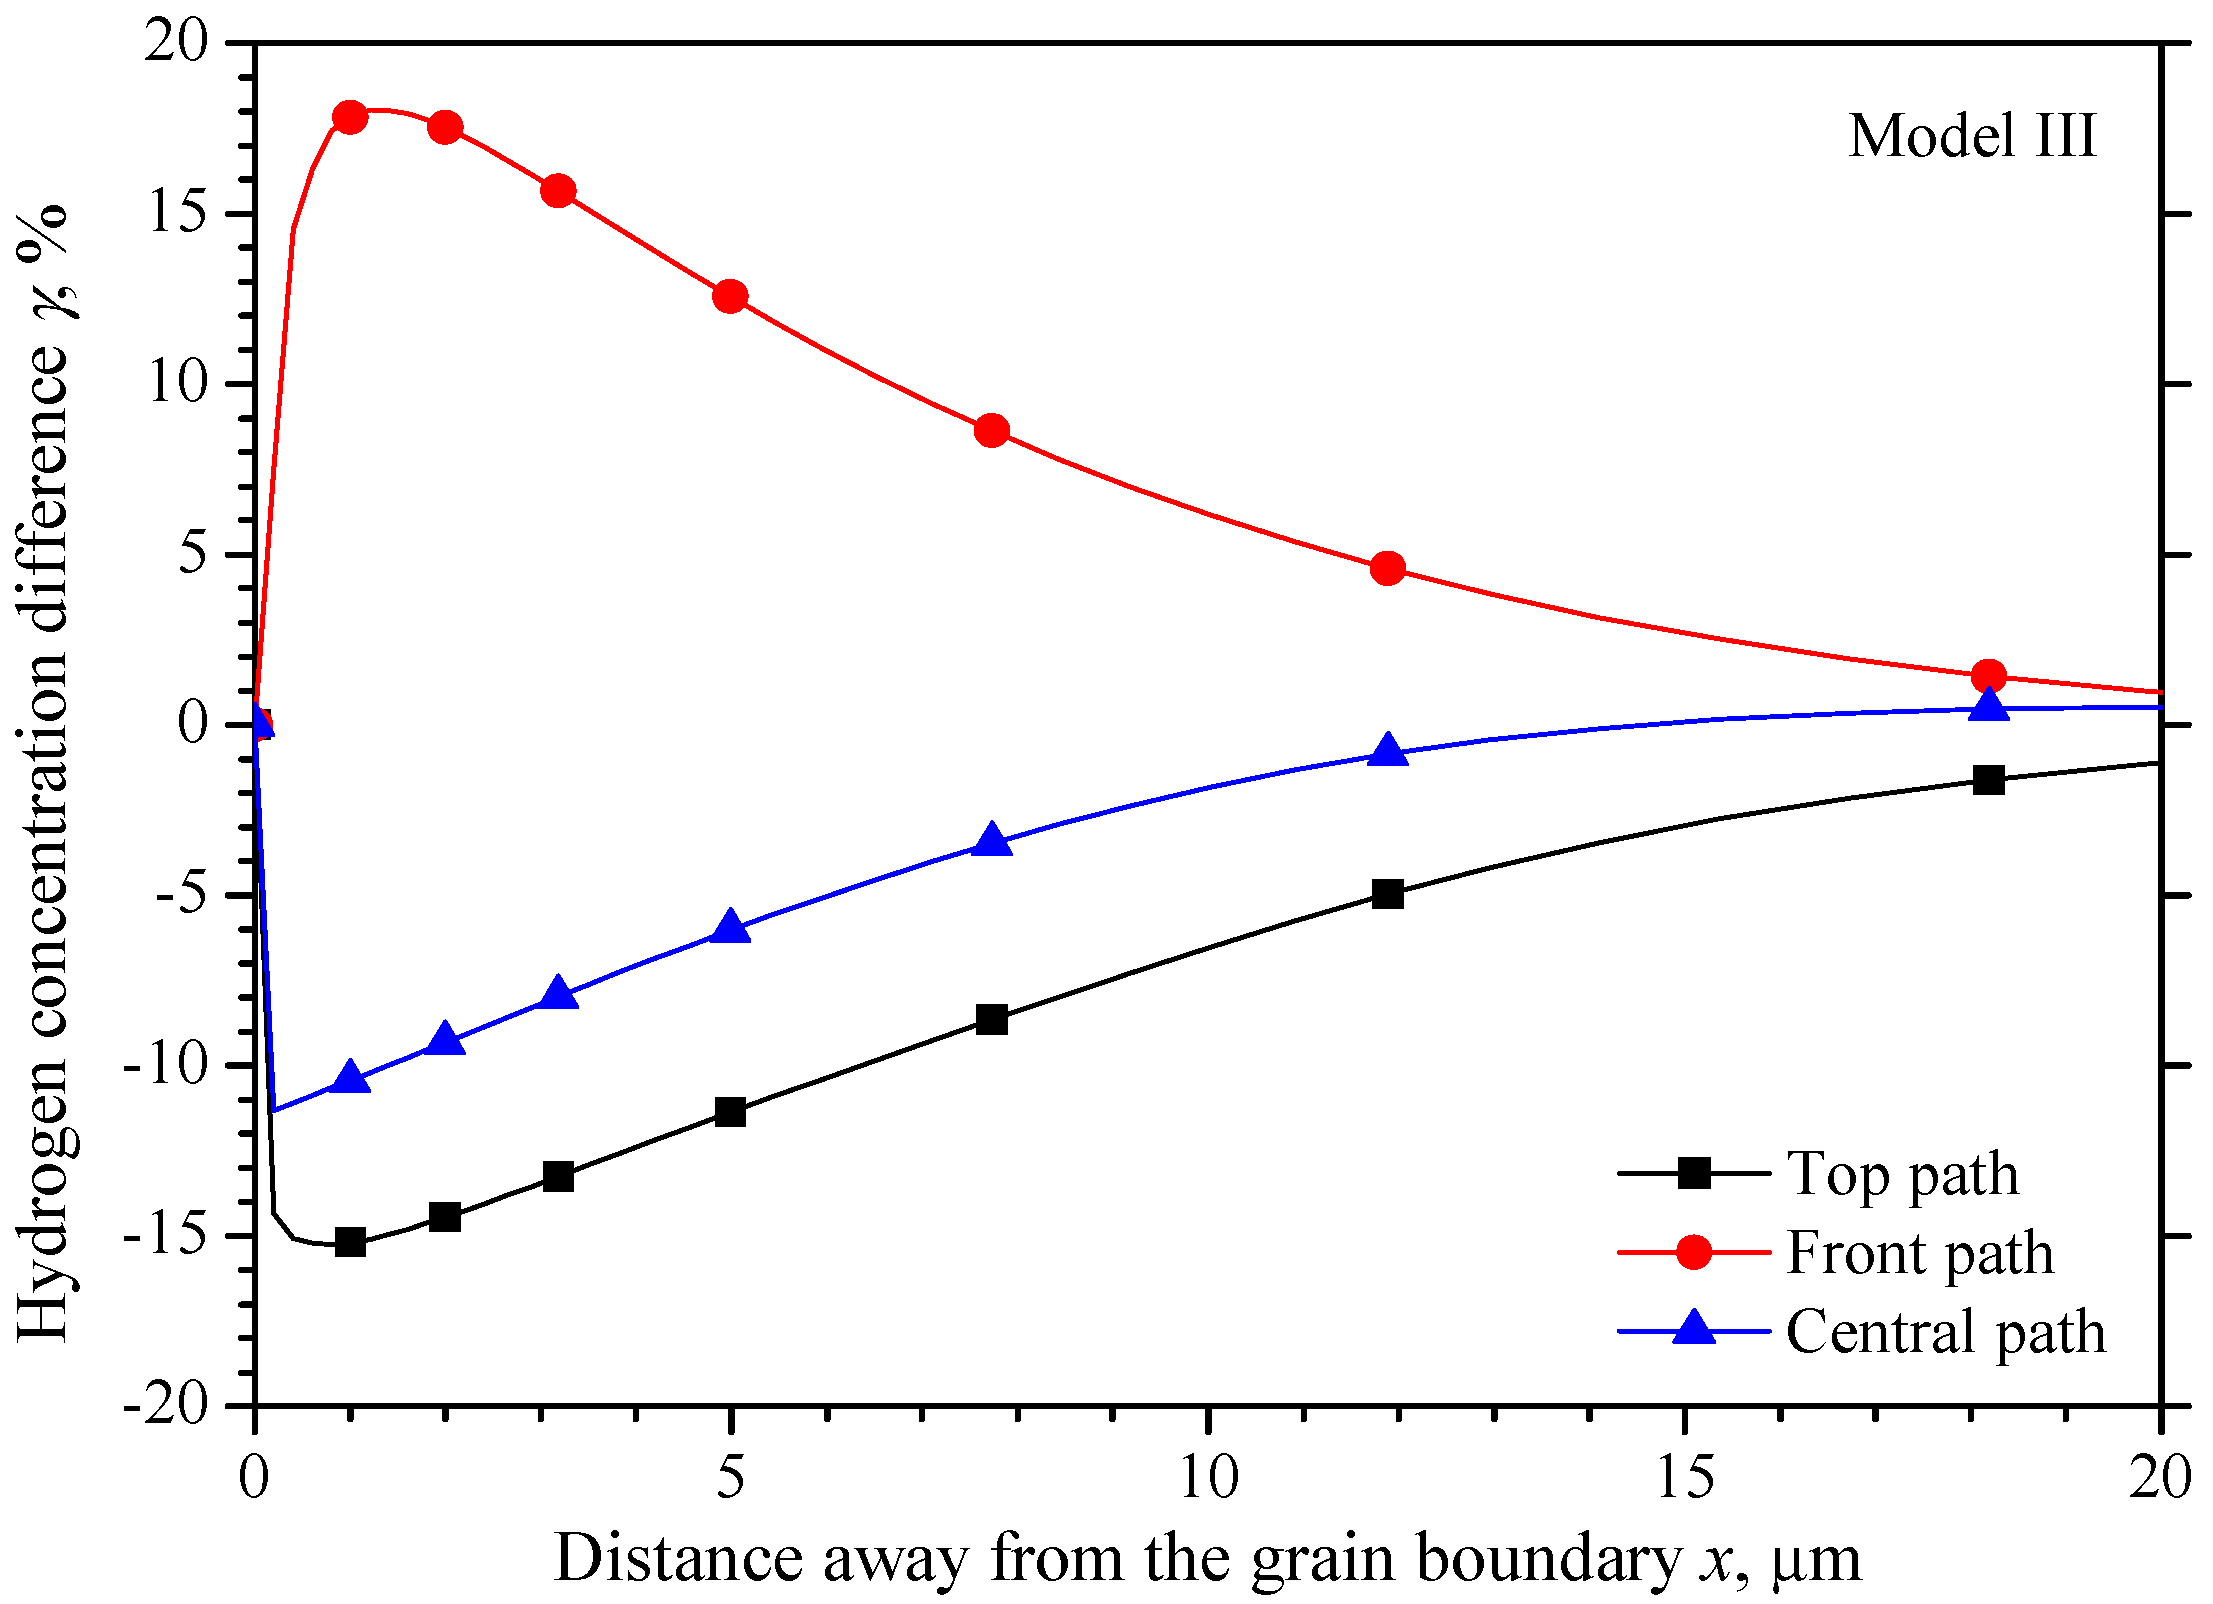
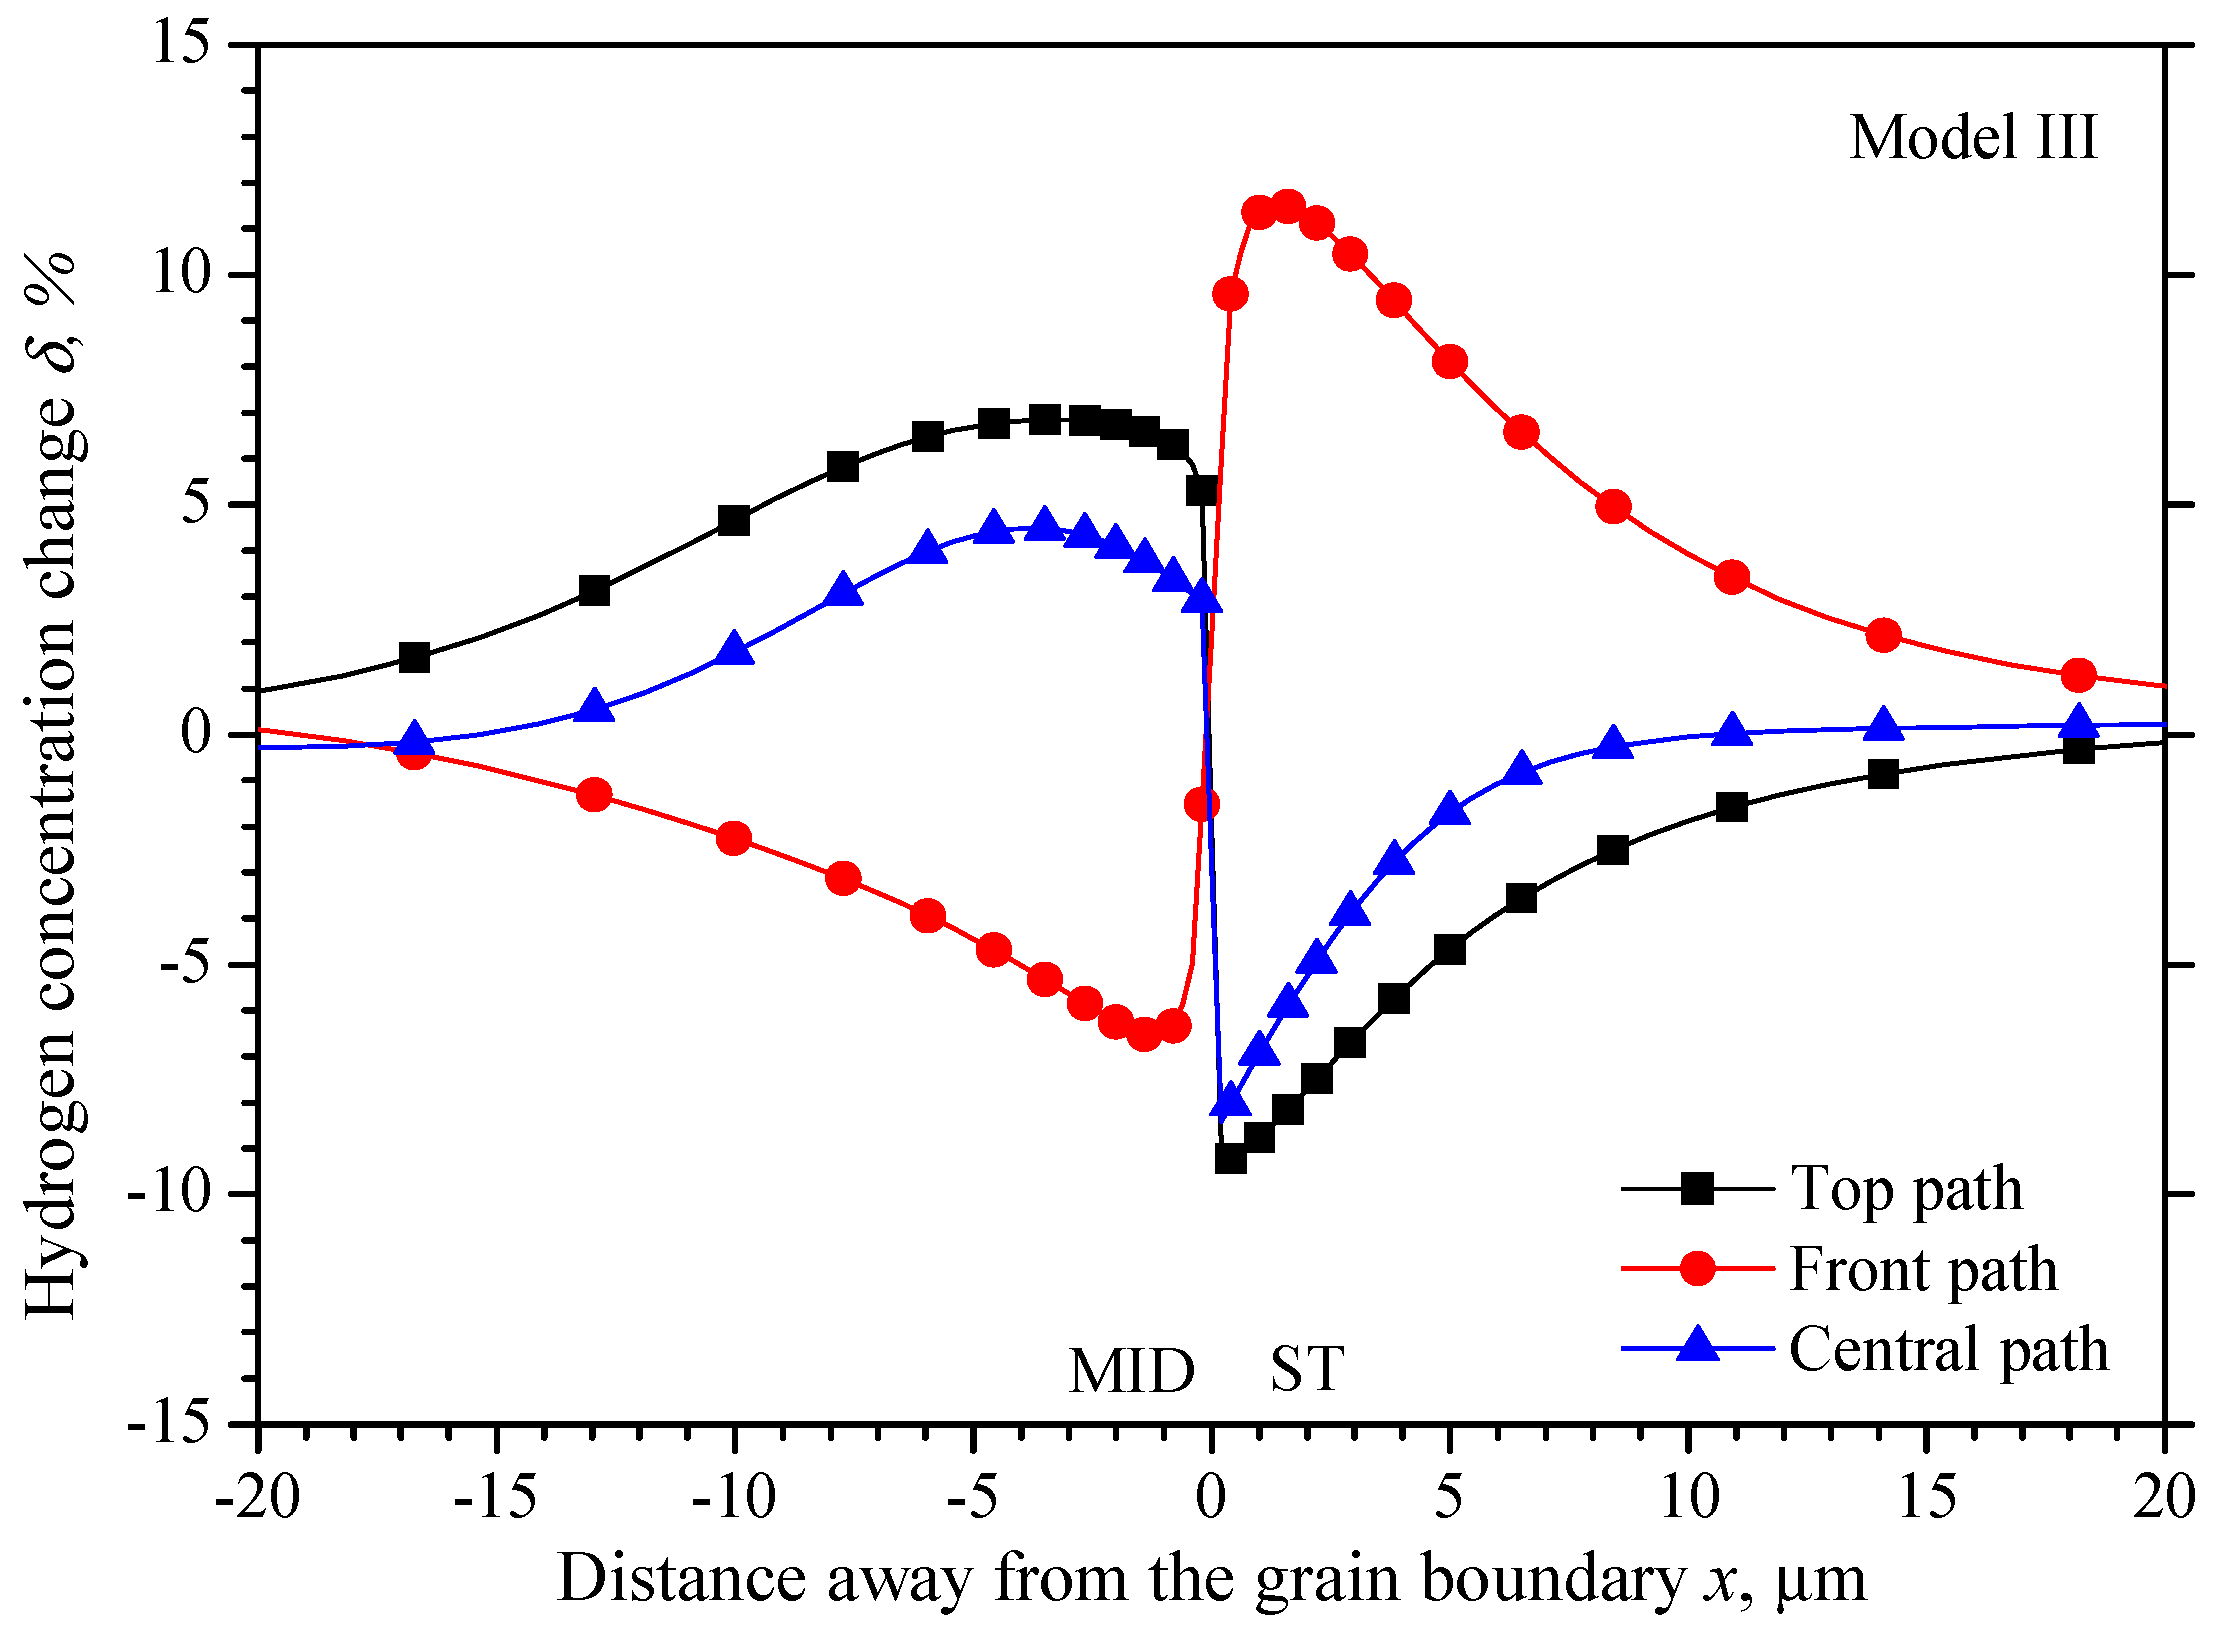
5.3. The Hydrogen Concentration Distribution in Model III Crystal

Figure 11 shows the redistribution of hydrogen in the global model of type III bicrystal, and the hydrogen concentration distribution in different cross-sections. The cross-sections represent the (1-10) planes in the MID grain and (-12-1) planes in the ST grain. On the cross-section of both grains, the hydrogen is almost symmetrical about the X-Y plane and X-Z plane. The obvious distribution could be found on the cross-section within ±5 μm away from the grain boundary, and the differences disappear far from the grain boundary.
Figure 12 shows the hydrogen concentration change δ along the three observing paths shown in Figure 5. A larger hydrogen concentration gradient locates within the ±0.2 μm over the grain boundary to ensure the two grains have consistent hydrogen concentration. In the ST grain, the hydrogen concentration on the top path and the central path increases gradually from −9.0% and −8.4% at 0.2 μm to the initial value with the increasing distance. While the hydrogen concentration on the front path will increase from 6.0% at 0.2 μm to the highest value of 11.5% at 1.4 μm, and then decrease gradually to the initial value. In the MID grain −0.2 μm beyond the grain boundary, the hydrogen concentration will increase firstly from 5.3% and 2.9% to 6.8% and 4.5% at −4 μm away from the grain boundary on the top and central path, then decreases gradually. While the hydrogen concentration on the front path decreases from −1.5% to the lowest value of −6.5% at −1.4 μm away from the grain boundary and then increases gradually to the initial value.
In Figure 13, the maximum hydrogen concentration difference γ on the central path locates 0.2 μm equidistant from the grain boundary, with a value of −11.3%, while the maximum differences on the top path and the front path are −15% and 18% within 1 μm away from the grain boundary.

5.4. Comparison of the Three Models

Unlike the other two models, the hydrogen distribution in MC-ST bicrystal is symmetric about the x-axis, the hydrogen concentration has the same gradient from center to the surface in both y-direction and z-direction. This is the result of an identic elastic modulus for the MC grain in the y-direction and z-direction, so as the ST grain. It is obvious that the elastic modulus equals E100 in both the y-direction and z-direction in the MC grain. The crystal orientation along y-direction and z-direction are <121> and <110> respectively in the ST grain. However, the orientation coefficients k110 and k121 are both 0.25 according to Equation (16), which leads to an identic elastic module of 193.6 GPa for both E110 and E121. So, a similar hydrogen concentration distribution could be found on the top path and the front path in Figure 9.
The MC-MID grain is composed of two misoriented crystals, of which the MC grain has an identic elastic modulus equal to E100 along the y-axis and z-axis, while the MID grain has a different elastic modulus of E110 and E100 in y and z directions, respectively. Firstly, focus on the top surface perpendicular to the y-axis (top path in Figure 4 and Figure 5), the maximum hydrogen concentration appears in the MID grain with E110 in the y-direction, while the minimum hydrogen concentration locates in the MC grain with E100 in the y-direction. An opposite hydrogen concentration trend could be found with the distance away from the grain boundary, beside the narrow region close to the grain boundary, the hydrogen is higher in the MID grain than the MC grain equidistant from the grain boundary. Moreover, the average hydrogen concentration is 4.50% in the MID grain and −1.24% in the MC grain with 2.73% on the grain boundary. Concerning the surface perpendicular to the z-axis (front path in Figure 4 and Figure 5), the hydrogen concentration also has an opposite trend when distance away from the grain boundary. However, the hydrogen concentration in MC grains is much higher than that in MID grains. The average concentration in MC grains is 1.47%, the average concentration in MID grains is −0.52%, and the grain boundaries are −0.91%. By comparing the hydrogen on the top path and front path in the MID grain, the hydrogen concentration is away higher on the top path, which has a larger elastic modulus perpendicular to the surface.
The relationship between the elastic modulus and the hydrogen distribution is not unique in the MC-MID grain, but also the MID-ST grain. The highest hydrogen concentration located on the front surface in the ST grain (on the front path in Figure 11 and Figure 12), and along the z-axis perpendicular to the front surface, the elastic modulus of the ST grain is E110, which is larger than that in the MID grain of E100. The hydrogen concentration is higher in the ST grain than the MID grain equidistant from the grain boundary, and the average hydrogen concentration is 5.73% and −2.85% respectively with 2.24% on the grain boundary. The elastic modulus is E110 along the y-axis in both grains of the MID-ST grain, but the hydrogen concentration is always lower in the ST grain than in MID grain equidistant from the grain boundary along the top path, with the average hydrogen concentration of −3.71% and 4.17% respectively, and the hydrogen concentration is −2.23% on the grain boundary. Moreover, the hydrogen concentration is away higher on the front path than the top path in the ST grain, which has a larger elastic modulus perpendicular to the surface than its neighbor.
Of all the three misorientation bicrystals along y-axis and z-axis, no matter the different elastic modulus is caused by the two neighboring grains, or the two directions of one grain, the difference is caused by E100 and E111 along the two directions. Now focus on the x-direction of the tensile direction, by defining the elastic modulus mismatch ratio as the elastic modulus ratio of the stiff and the softer grains, the elastic modulus ratios are 2.06, 3.20, and 1.55 in the MC-MID, MC-ST, and MID-ST grain respectively. The highest hydrogen concentration differences γ in the three models are 21.4%, 29.6%, and 18.0% respectively. A higher elastic modulus ratio will lead to higher hydrogen concentration differences could be found.
Even the hydrogen concentration is quite different equidistant from the grain boundary, they will tend to have a balance value on the grain boundary to keep the continuity of concentration, so there is a large hydrogen concentration gradient very close to the grain boundary, and it is about ±0.2 μm within the grain boundary in this study.

6. Conclusions

By establishing a constitutive model of 316 stainless steel crystal anisotropic elastic response, the hydrogen diffusion influenced by crystal orientation near the grain boundary is determined. The results show that hydrogen diffusion near the grain boundary has a great relationship with the grain orientation.
(1) The redistribution of the hydrogen near the grain boundary is driven by the hydrostatic pressure caused by the misorientation of two neighboring grains, the influence is obviously close to the grain boundary, and tends to disappear far from the grain boundary. The hydrogen concentration has a large gradient in a narrow region very close to the grain boundary to balance the concentration difference caused by the misorientation of two neighboring grains.
(2) A higher elastic modulus ratio along the tensile direction will lead to a higher hydrogen concentration difference in the two grains equidistant from the grain boundary.
(3) Beyond the tensile direction, if the elastic modulus is identical along the other two directions in both grains, the hydrogen concentration distribution will be axisymmetric about the tensile direction. If two adjacent crystals have the same elastic modulus in a direction other than the stretching direction, the surface with a larger elastic modulus along the third direction will have a higher hydrogen concentration.
Finally, the proposed constitutive model has a certain guiding significance for the hydrogen diffusion of 316 stainless steel in the grain boundary region; this method will become a general method for studying the hydrogen diffusion between the grains of different kinds of materials.

Author Contributions

Conceptualization, F.Y. and T.Y.; methodology, F.Y.; software, T.Y. and W.Z.; validation, F.Y., L.Z. and H.Z.; formal analysis, F.Y.; investigation, T.Y. and W.Z.; resources, H.Z. and L.Z.; data curation, T.Y.; writing—original draft preparation, F.Y. and T.Y.; writing—review and editing, F.Y.; visualization, T.Y.; supervision, F.Y.; project administration, L.Z. and H.Z.; funding acquisition, H.Z. and L.Z. All authors have read and agreed to the published version of the manuscript.

Funding

This work was supported by the National Natural Science Foundation of China grant number: 52175145; the Research Fund of State Key Laboratory for Marine Corrosion and Protection of Luoyang Ship Material Research Institute (LSMRI) grant number: 6142901180101; the Natural Science Basic Research Plan in Shaanxi Province of China grant numbers: 2020JM-523, 2021JM-389.

Institutional Review Board Statement

Not applicable.

Informed Consent Statement

Not applicable.

Data Availability Statement

All data contained within the article.

Conflicts of Interest

The authors declare no conflict of interest.

References

  1. Khanzhin, V.G.; Turilina, V.Y.; Rogachev, S.O.; Nikitin, A.V.; Belov, V.A. Effect of various factors on hydrogen embrittlement of structural steels. Met. Sci. Heat Treat. 2015, 57, 197–204. [Google Scholar] [CrossRef]
  2. Findley, K.O.; Lawrence, S.K.; O’Brien, M.K. Engineering challenges associated with hydrogen embrittlement in steels. Encycl. Mater. Met. Alloy. 2022, 2, 235–249. [Google Scholar]
  3. Gangloff, R.P. Hydrogen-assisted Cracking. Compr. Struct. Integr. 2003, 6, 31–101. [Google Scholar]
  4. Oriani, R.A. Hydrogen embrittlement of steels. Annu. Rev. Mater. Sci. 1978, 8, 327–357. [Google Scholar] [CrossRef]
  5. Birnbaum, H.K.; Sofronis, P. Hydrogen-enhanced localized plasticity—A mechanism for hydrogen-related fracture. Mater. Sci. Eng. A 1994, 176, 191–202. [Google Scholar] [CrossRef]
  6. Robertson, I.M. The effect of hydrogen on dislocation dynamics. Eng. Fract. Mech. 2001, 68, 671–692. [Google Scholar] [CrossRef]
  7. Lynch, S.P. Environmentally assisted cracking: Overview of evidence for an adsorption-induced localised-slip process. Acta Metall. 1988, 36, 2639–2661. [Google Scholar] [CrossRef]
  8. Merson, E.; Vinogradov, A.; Merson, D.L. Application of acoustic emission method for investigation of hydrogen embrittlement mechanism in the low-carbon steel. J. Alloys Compd. 2015, 645, S460–S463. [Google Scholar] [CrossRef]
  9. Oudriss, A.; Creus, J.; Bouhattate, J.; Savall, C.; Peraudeau, B.; Feaugas, X. The diffusion and trapping of hydrogen along the grain boundaries in polycrystalline nickel. Scr. Mater. 2012, 66, 37–40. [Google Scholar] [CrossRef]
  10. Tsuru, T.; Latanision, R.M. Grain boundary transport of hydrogen in nickel. Scr. Metall. 1982, 16, 575–578. [Google Scholar] [CrossRef]
  11. Brass, A.M.; Chanfreau, A. Accelerated diffusion of hydrogen along grain boundaries in nickel. Acta Mater. 1996, 44, 3823–3831. [Google Scholar] [CrossRef]
  12. Oudriss, A.; Creus, J.; Bouhattate, J.; Conforto, E.; Berziou, C.; Savall, C.; Feaugas, X. Grain size and grain boundary effects on diffusion and trapping of hydrogen in pure nickel. Acta Mater. 2012, 60, 6814–6828. [Google Scholar] [CrossRef]
  13. Mine, Y.; Tachibana, K.; Horita, Z. Grain-boundary diffusion and precipitate trapping of hydrogen in ultrafine-grained austenitic stainless steels processed by high-pressure torsion. Mater. Sci. Eng. 2011, 528, 8100–8105. [Google Scholar] [CrossRef]
  14. Louthan, M.R.; Donovan, J.A.; Caskey, G.R. Hydrogen diffusion and trapping in nickel. Acta Metall. 1975, 23, 745–749. [Google Scholar] [CrossRef]
  15. Ladna, B.; Birnbaum, H.K. SIMS study of hydrogen at the surface and grain boundaries of nickel bicrystals. Acta Mater. 1987, 35, 2537–2542. [Google Scholar] [CrossRef]
  16. Birnbaum, H.; Ladna, B.; Kimura, A. Hydrogen segregation and diffusion at grain boundaries. J. Phys. Colloq. 1988, 49, c5-397–c5-401. [Google Scholar] [CrossRef]
  17. Yao, J.; Cahoon, J.R. Experimental studies of grain boundary diffusion of hydrogen in metals. Acta Metall. Mater. 1991, 39, 119–126. [Google Scholar] [CrossRef]
  18. Ichimura, M.; Sasajima, Y.; Imabayashi, M. Grain Boundary Effect on Diffusion of Hydrogen in Pure Aluminum. Acta Mater. 1991, 32, 1109–1114. [Google Scholar] [CrossRef] [Green Version]
  19. Mütschele, T.; Kirchheim, R. Segregation and diffusion of hydrogen in grain boundaries of palladium. Scr. Metall. 1987, 21, 135–140. [Google Scholar] [CrossRef]
  20. Szpunar, B.; Lewis, L.J.; Swainson, I.; Erb, U. Thermal expansion and hydrogen diffusion in nanocrystalline nickel. Phys. Rev. B 1999, 60, 10107–10113. [Google Scholar] [CrossRef]
  21. Pedersen, A.; Jonsson, H. Simulations of hydrogen diffusion at grain boundaries in aluminum. Acta Mater. 2009, 57, 4036–4045. [Google Scholar] [CrossRef]
  22. Nagao, A.; Kuramoto, S.; Ichitani, K.; Kanno, M. Visualization of hydrogen transport in high strength steels affected by stress fields and hydrogen trapping. Scr. Mater. 2001, 45, 1227–1232. [Google Scholar] [CrossRef]
  23. Oriani, R.A. The diffusion and trapping of hydrogen in steel. Acta Metall. 1970, 18, 147–157. [Google Scholar] [CrossRef]
  24. Sofronis, P.; McMeeking, R.M. Numerical analysis of hydrogen transport near a blunting crack tip. J. Mech. Phys. Solids 1989, 37, 317–350. [Google Scholar] [CrossRef]
  25. Krom, A.H.M.; Koers, R.W.J.; Bakker, A. Hydrogen transport near a blunting crack tip. J. Mech. Phys. Solids 1999, 47, 971–992. [Google Scholar] [CrossRef]
  26. Yang, F.Q.; Zhang, W.J.; Yan, T.; Zhang, H.B.; Fang, X.R. Numerical analysis of the coupling between hydrogen diffusion and mechanical behavior near the crack tip of titanium. Math. Probl. Eng. 2020, 2020, 3618589. [Google Scholar] [CrossRef]
  27. Fallahi, A.; Ataeeb, A. Effects of crystal orientation on stress distribution near the triple junction in a tricrystal γ-TiAl. Mater. Sci. Eng. A 2010, 527, 4576–4581. [Google Scholar] [CrossRef]
  28. Yang, F.Q.; Xue, H.; Zhao, L.Y.; Fang, X.R. Effects of grain orientation on stress state near grain boundary of austenitic stainless steel bicrystals. Adv. Mater. Sci. Eng. 2018, 2018, 9409868. [Google Scholar] [CrossRef] [Green Version]
  29. Yang, F.Q.; Xue, H.; Zhao, L.Y.; Fang, X.R.; Zhang, H.B. Effects of crystal orientation and grain boundary inclination on stress distribution in bicrystal interface of austenite stainless steel 316L. Adv. Mater. Sci. Eng. 2019, 2019, 2468487. [Google Scholar] [CrossRef] [Green Version]
  30. An, Y.H.; Jiang, H.Q. A finite element simulation on transient large deformation and mass diffusion in electrodes for lithium ion batteries. Model. Simul. Mater. Sci. Eng. 2013, 21, 074007. [Google Scholar] [CrossRef]
  31. Dassault Systèmes Simulia Corp. Abaqus Analysis User’s Manual 6.12; Simulia: Johnston, RI, USA, 2012. [Google Scholar]
  32. Meyers, M.A.; Chawla, K.K. Mechanical Behavior of Materials, 2nd ed.; Cambridge University Press: Cambridge, UK, 2008; pp. 52–86. [Google Scholar]
  33. Xue, H.; Wang, Z.; Wang, S.; He, J.; Yang, H. Characterization of mechanical heterogeneity in dissimilar metal welded joints. Materials 2021, 14, 4145. [Google Scholar] [CrossRef] [PubMed]
  34. Kobayashi, S.; Kobayashi, R.; Watanabe, T. Control of grain boundary connectivity based on fractal analysis for improvement of intergranular corrosion resistance in SUS316L austenitic stainless steel random boundaries. Acta Mater. 2016, 2, 397–405. [Google Scholar] [CrossRef]
  35. Jeong, C.Y.; Kim, K.J.; Hong, H.U.; Nam, S.W. Effects of aging temperature and grain size on the formation of serrated grain boundaries in an AISI 316 stainless steel. Mater. Chem. Phys. 2013, 139, 27–33. [Google Scholar] [CrossRef]
  36. Ledbetter, H.M. Monocrystal-polycrystal elastic constants of a stainless steel. Appl. Mater. Sci. 2010, 85, 89–96. [Google Scholar]
  37. Siciliano, B.; Sciavicco, L.; Villani, L.; Oriol, G. Robotics Modelling, Planning and Control, 1st ed.; Springer: London, UK, 2009; pp. 303–361. [Google Scholar]
  38. Fujii, T.; Hazama, T.; Nakajima, H.; Horita, R. A safety analysis on overlay disbonding of pressure vessels for hydrogen service. In Proceedings of the First International Conference on Current Solutions to Hydrogen Problems in Steels, Washington, DC, USA, 1–5 November 1982; pp. 361–368. [Google Scholar]
Figure 1. Geometry model of the bicrystal.
Materials 15 00479 g001
Figure 2. The selected crystallographic direction.
Materials 15 00479 g002
Figure 3. Grain formation process: (a) MID grain, and (b) ST grain.
Materials 15 00479 g003
Figure 4. The hydrogen concentration distribution in the model I bicrystal.
Materials 15 00479 g004
Figure 5. Observation paths.
Materials 15 00479 g005
Figure 6. Hydrogen concentration change along observation paths in model I.
Materials 15 00479 g006
Figure 7. Hydrogen concentration difference equidistant from the grain boundary of model I.
Materials 15 00479 g007
Figure 8. The hydrogen concentration distribution in model II bicrystal.
Materials 15 00479 g008
Figure 9. Hydrogen concentration change along observation paths in model II.
Materials 15 00479 g009
Figure 10. Hydrogen concentration difference equidistant from the grain boundary of model II.
Materials 15 00479 g010
Figure 11. The hydrogen concentration distribution in model III bicrystal.
Materials 15 00479 g011
Figure 12. Hydrogen concentration change along observation paths in model III.
Materials 15 00479 g012
Figure 13. Hydrogen concentration difference equidistant from the grain boundary of model III.
Materials 15 00479 g013
Table 1. Crystal orientations considered for grains.
Grain Typex′y′z′
Most compliant (MC)[100][010][001]
Middle (MID)[1-10][110][001]
Stiffness (ST)[111][-12-1][-101]
Table 2. Incompatibility bicrystal models with three types of GBs.
Incompatibility ModelGrain AGrain B
Model IMCMID
Model IIMCST
Model IIIMIDST
Publisher’s Note: MDPI stays neutral with regard to jurisdictional claims in published maps and institutional affiliations.

