
An Investigation of a New Parameter Based on the Plastic Strain Gradient to Characterize Composite Constraint around the Crack Front at a Low Temperature


Abstract
:1. Introduction
2. Theory and Methods
3. The Finite Element Model
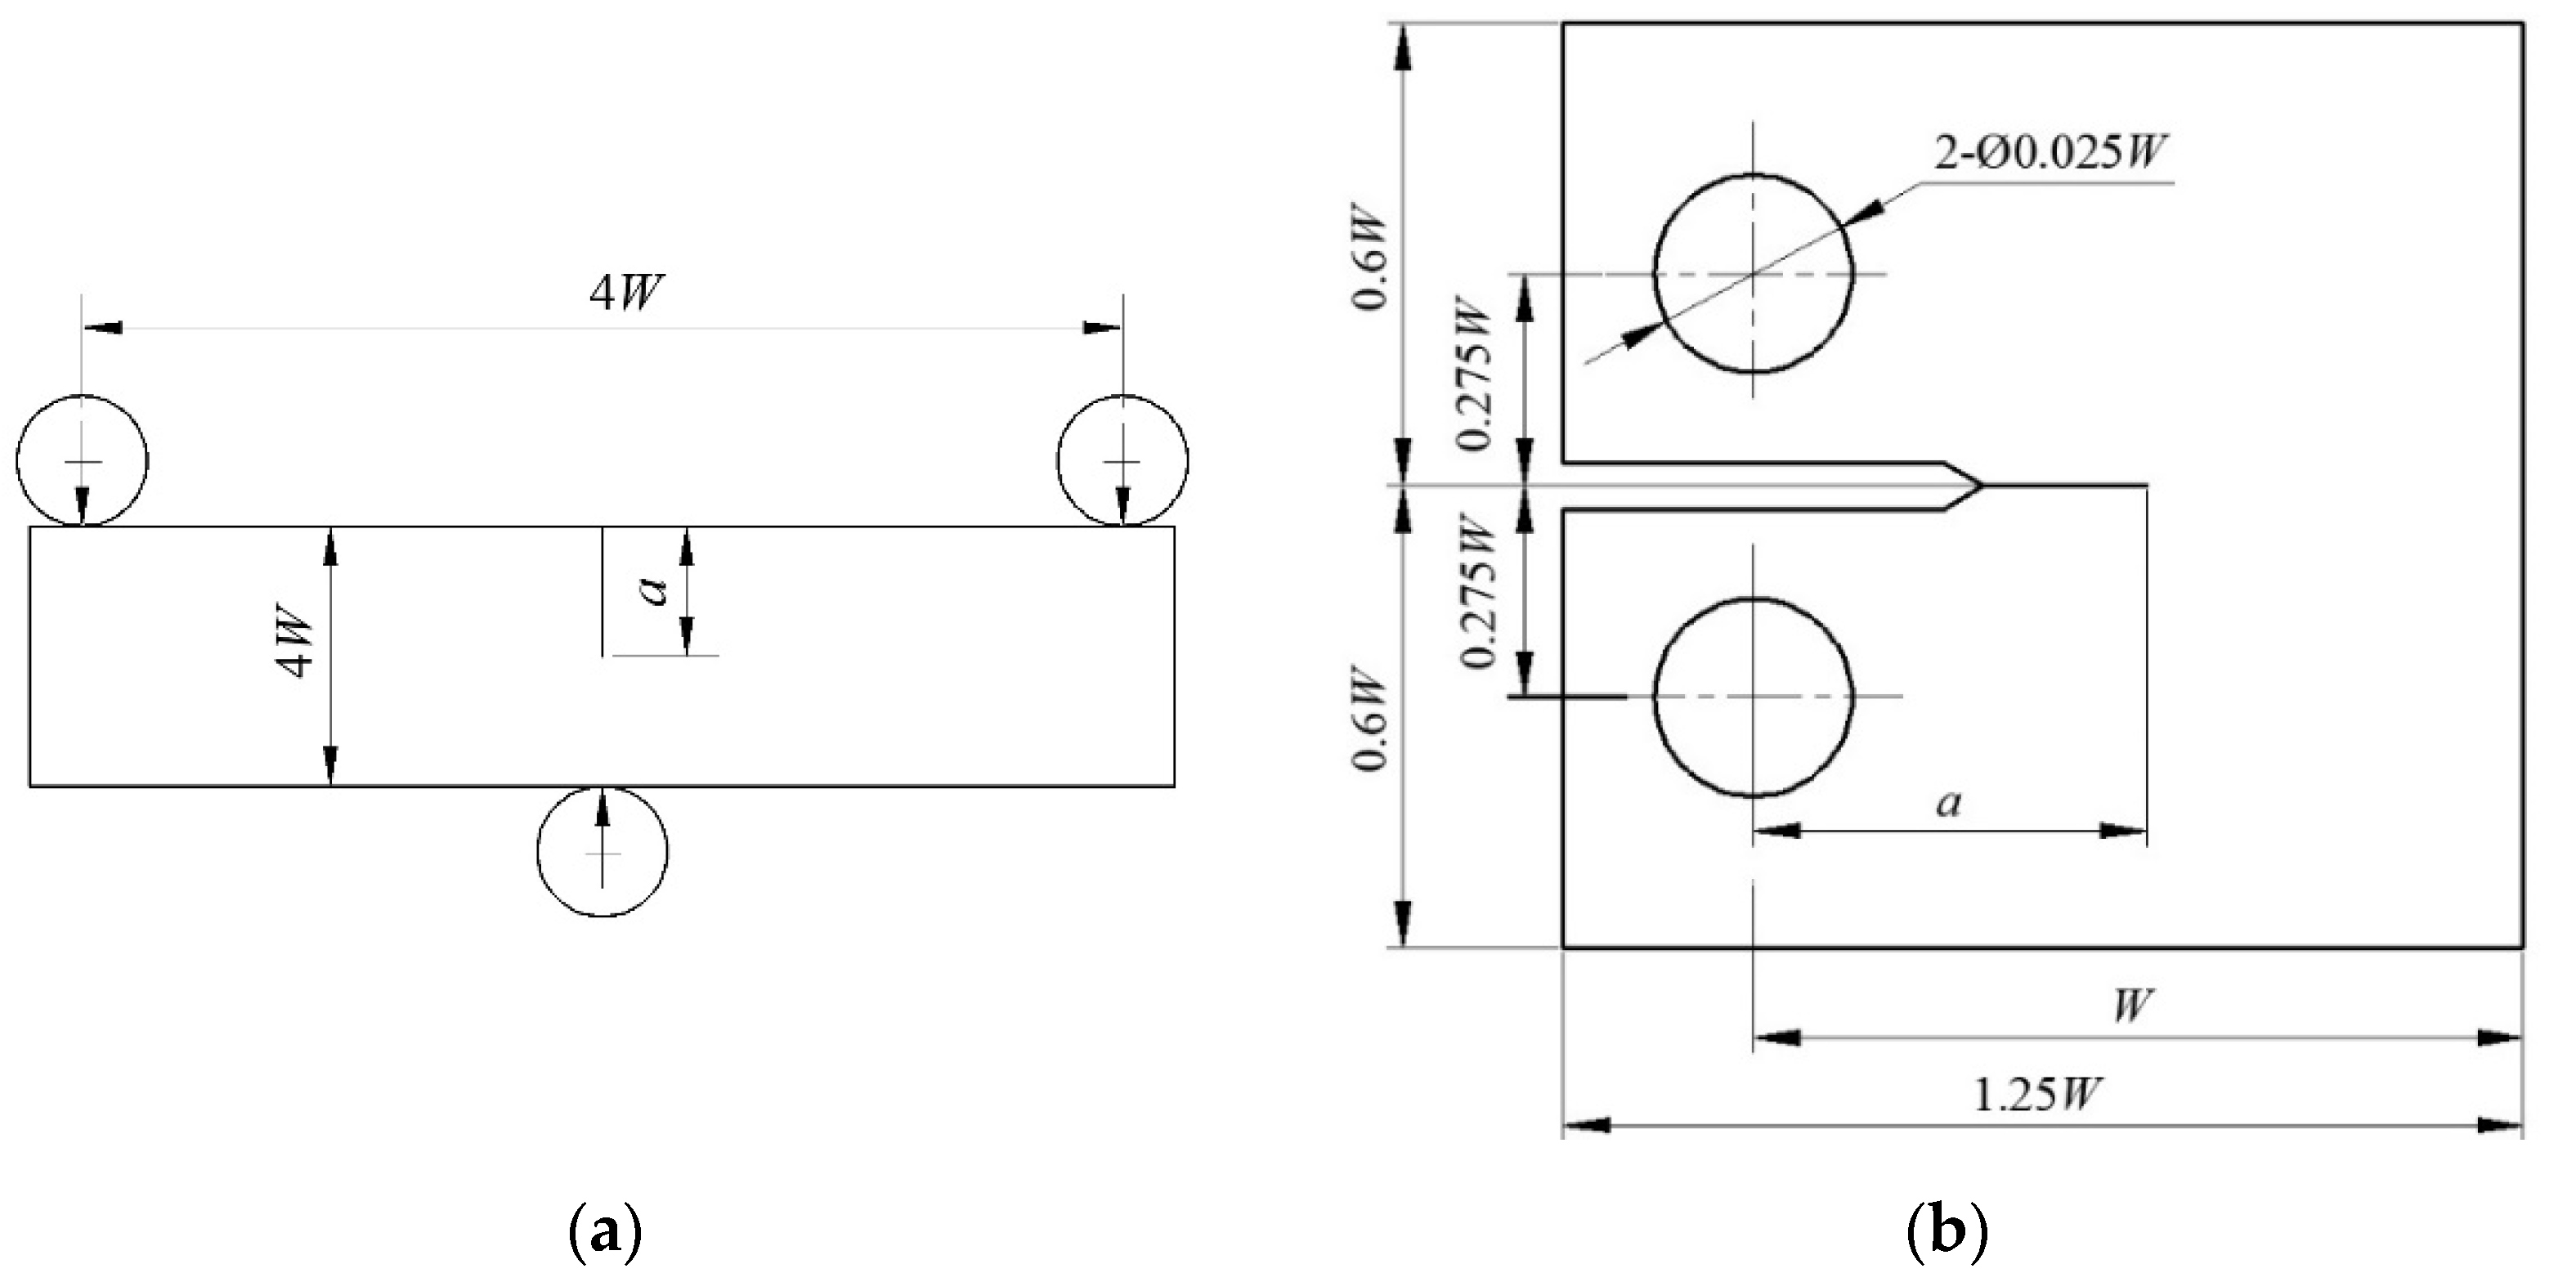
3.1. Geometry Model
3.2. Material Properties
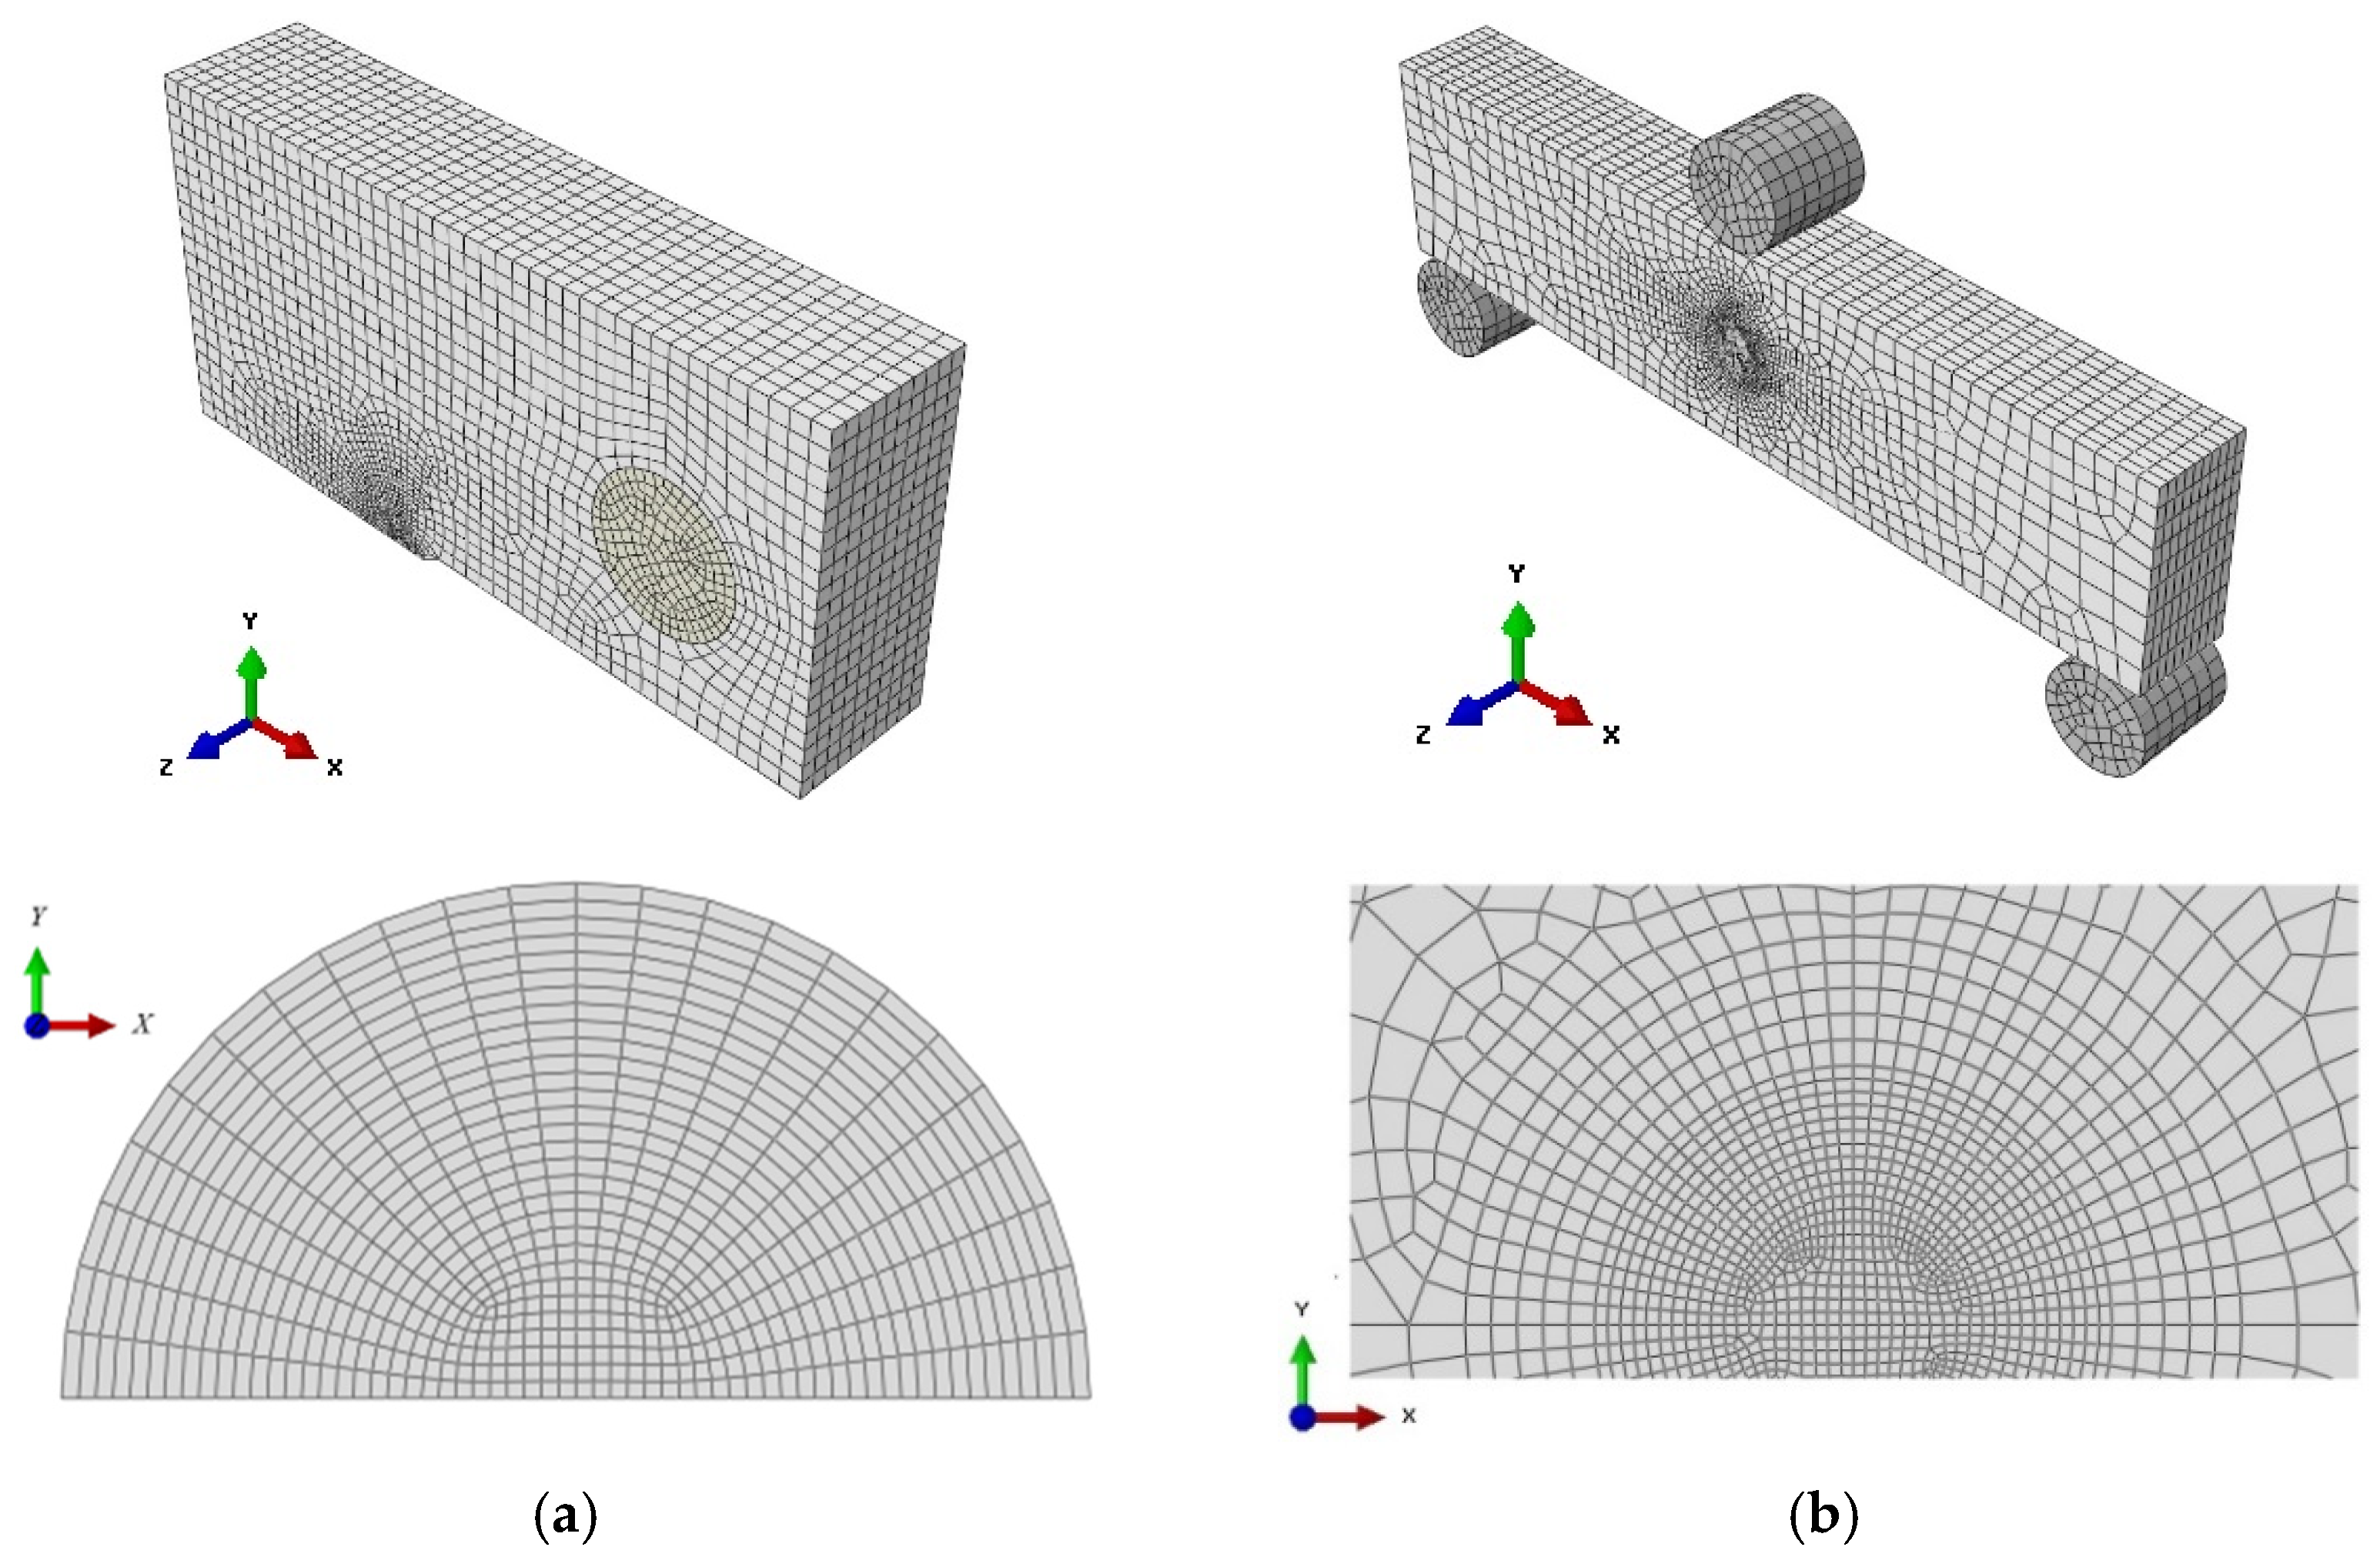
3.3. The Finite Element Model
4. Results
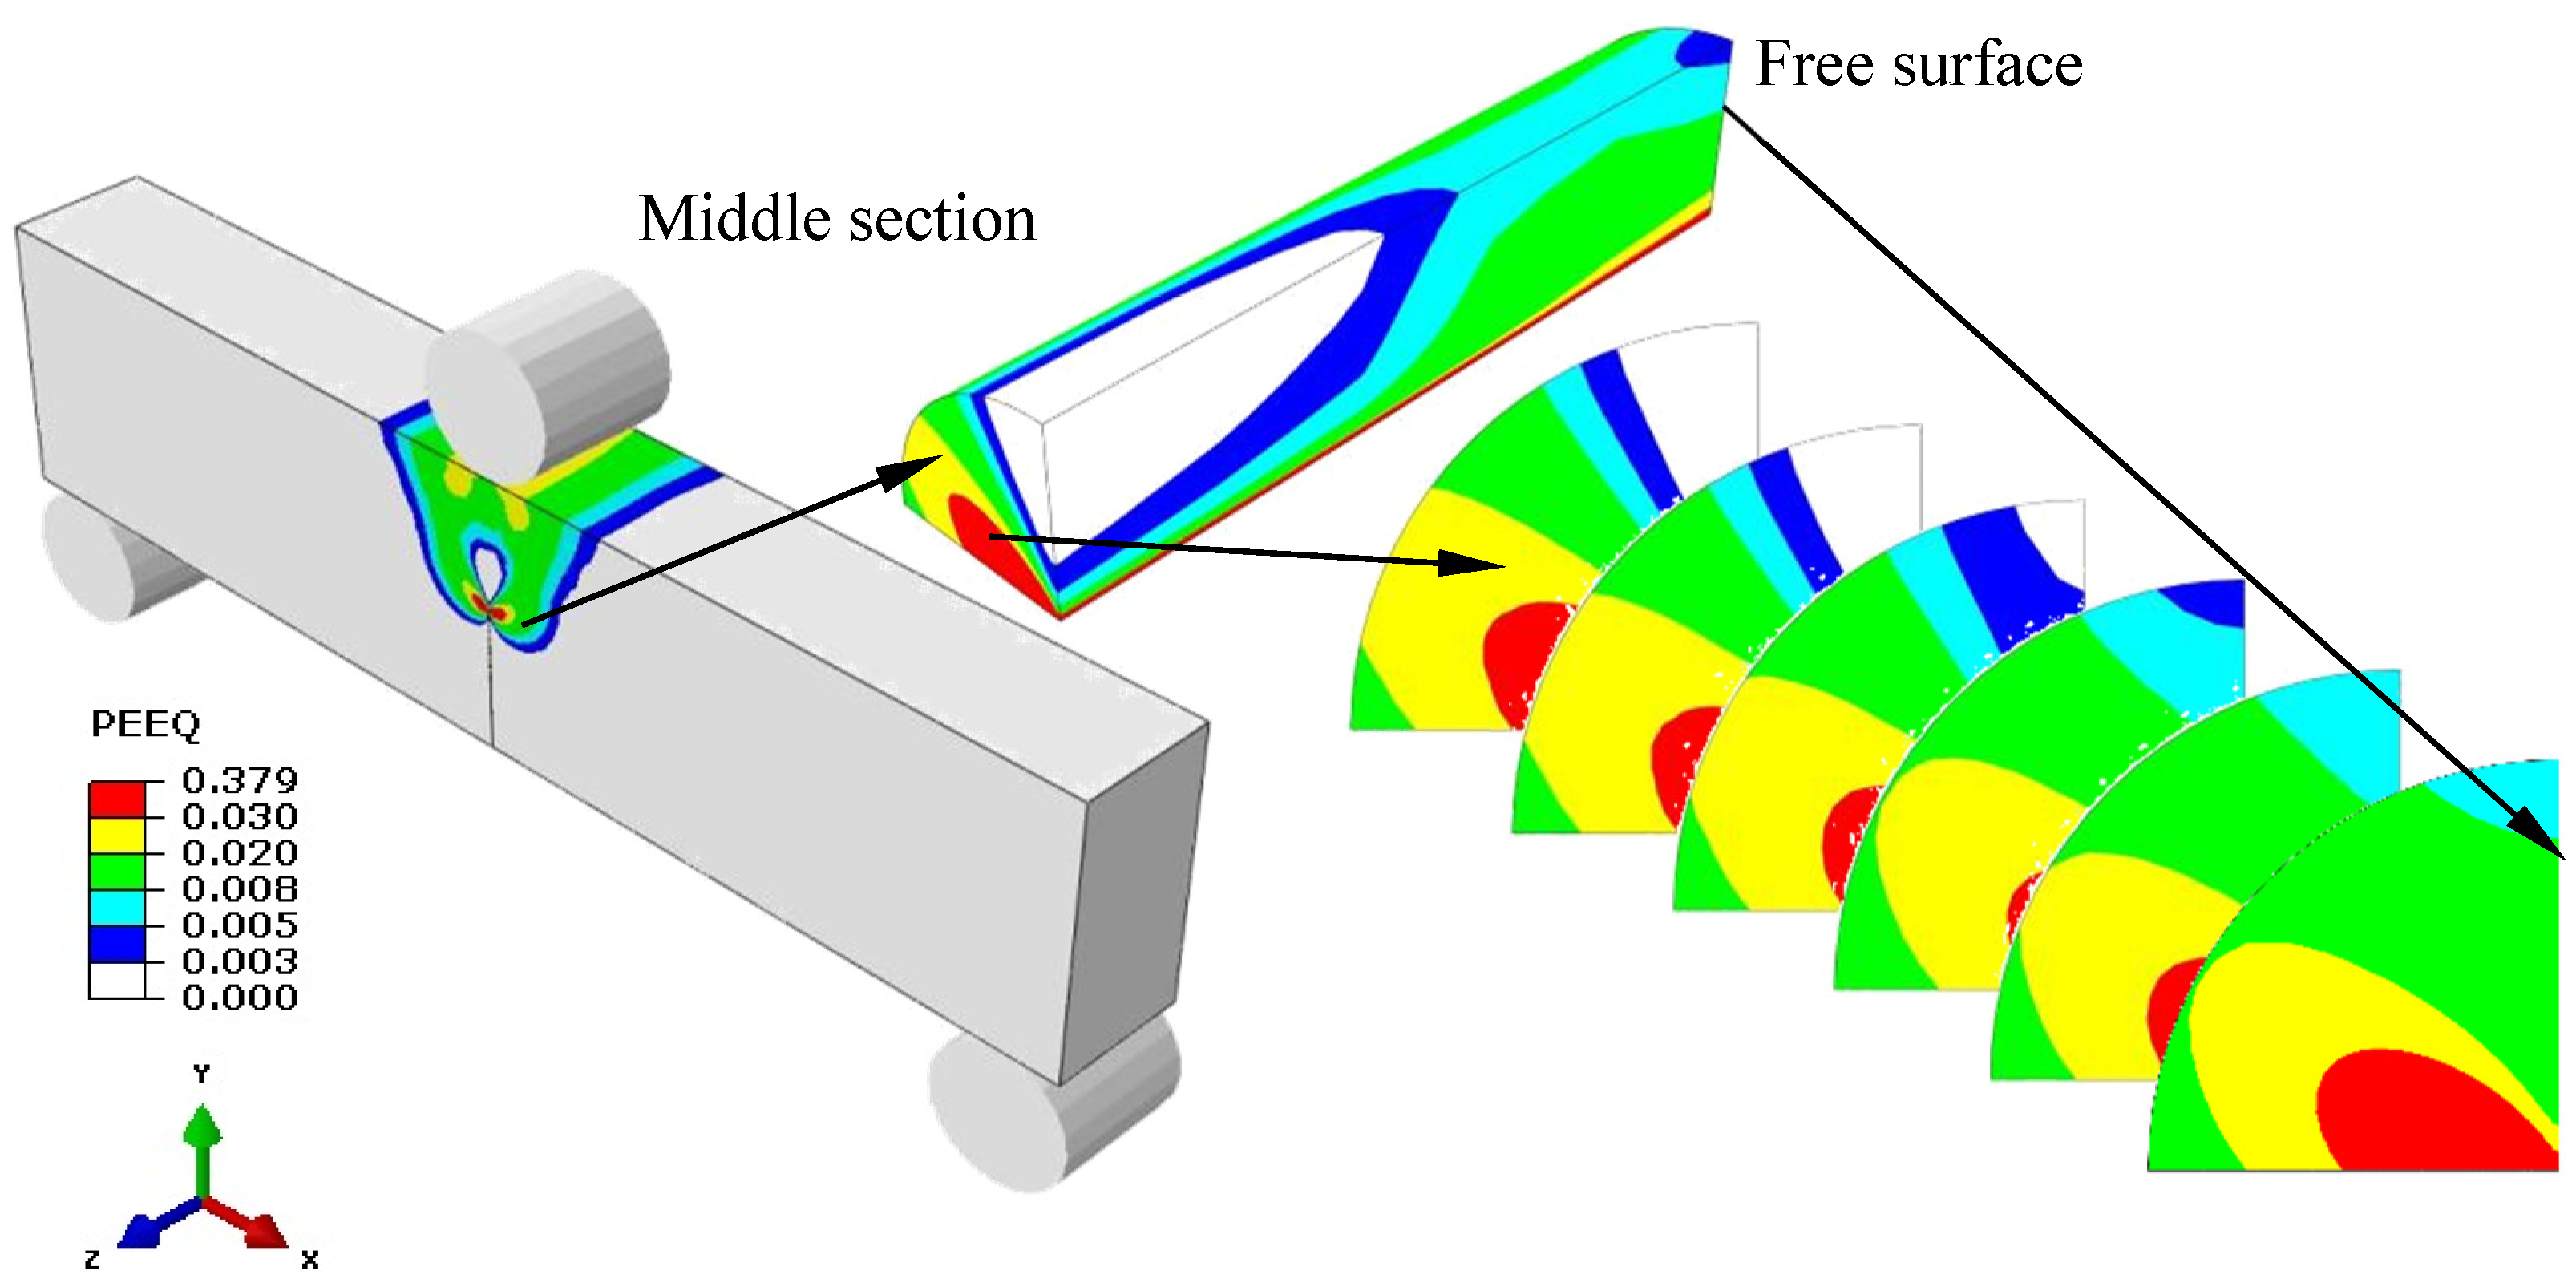
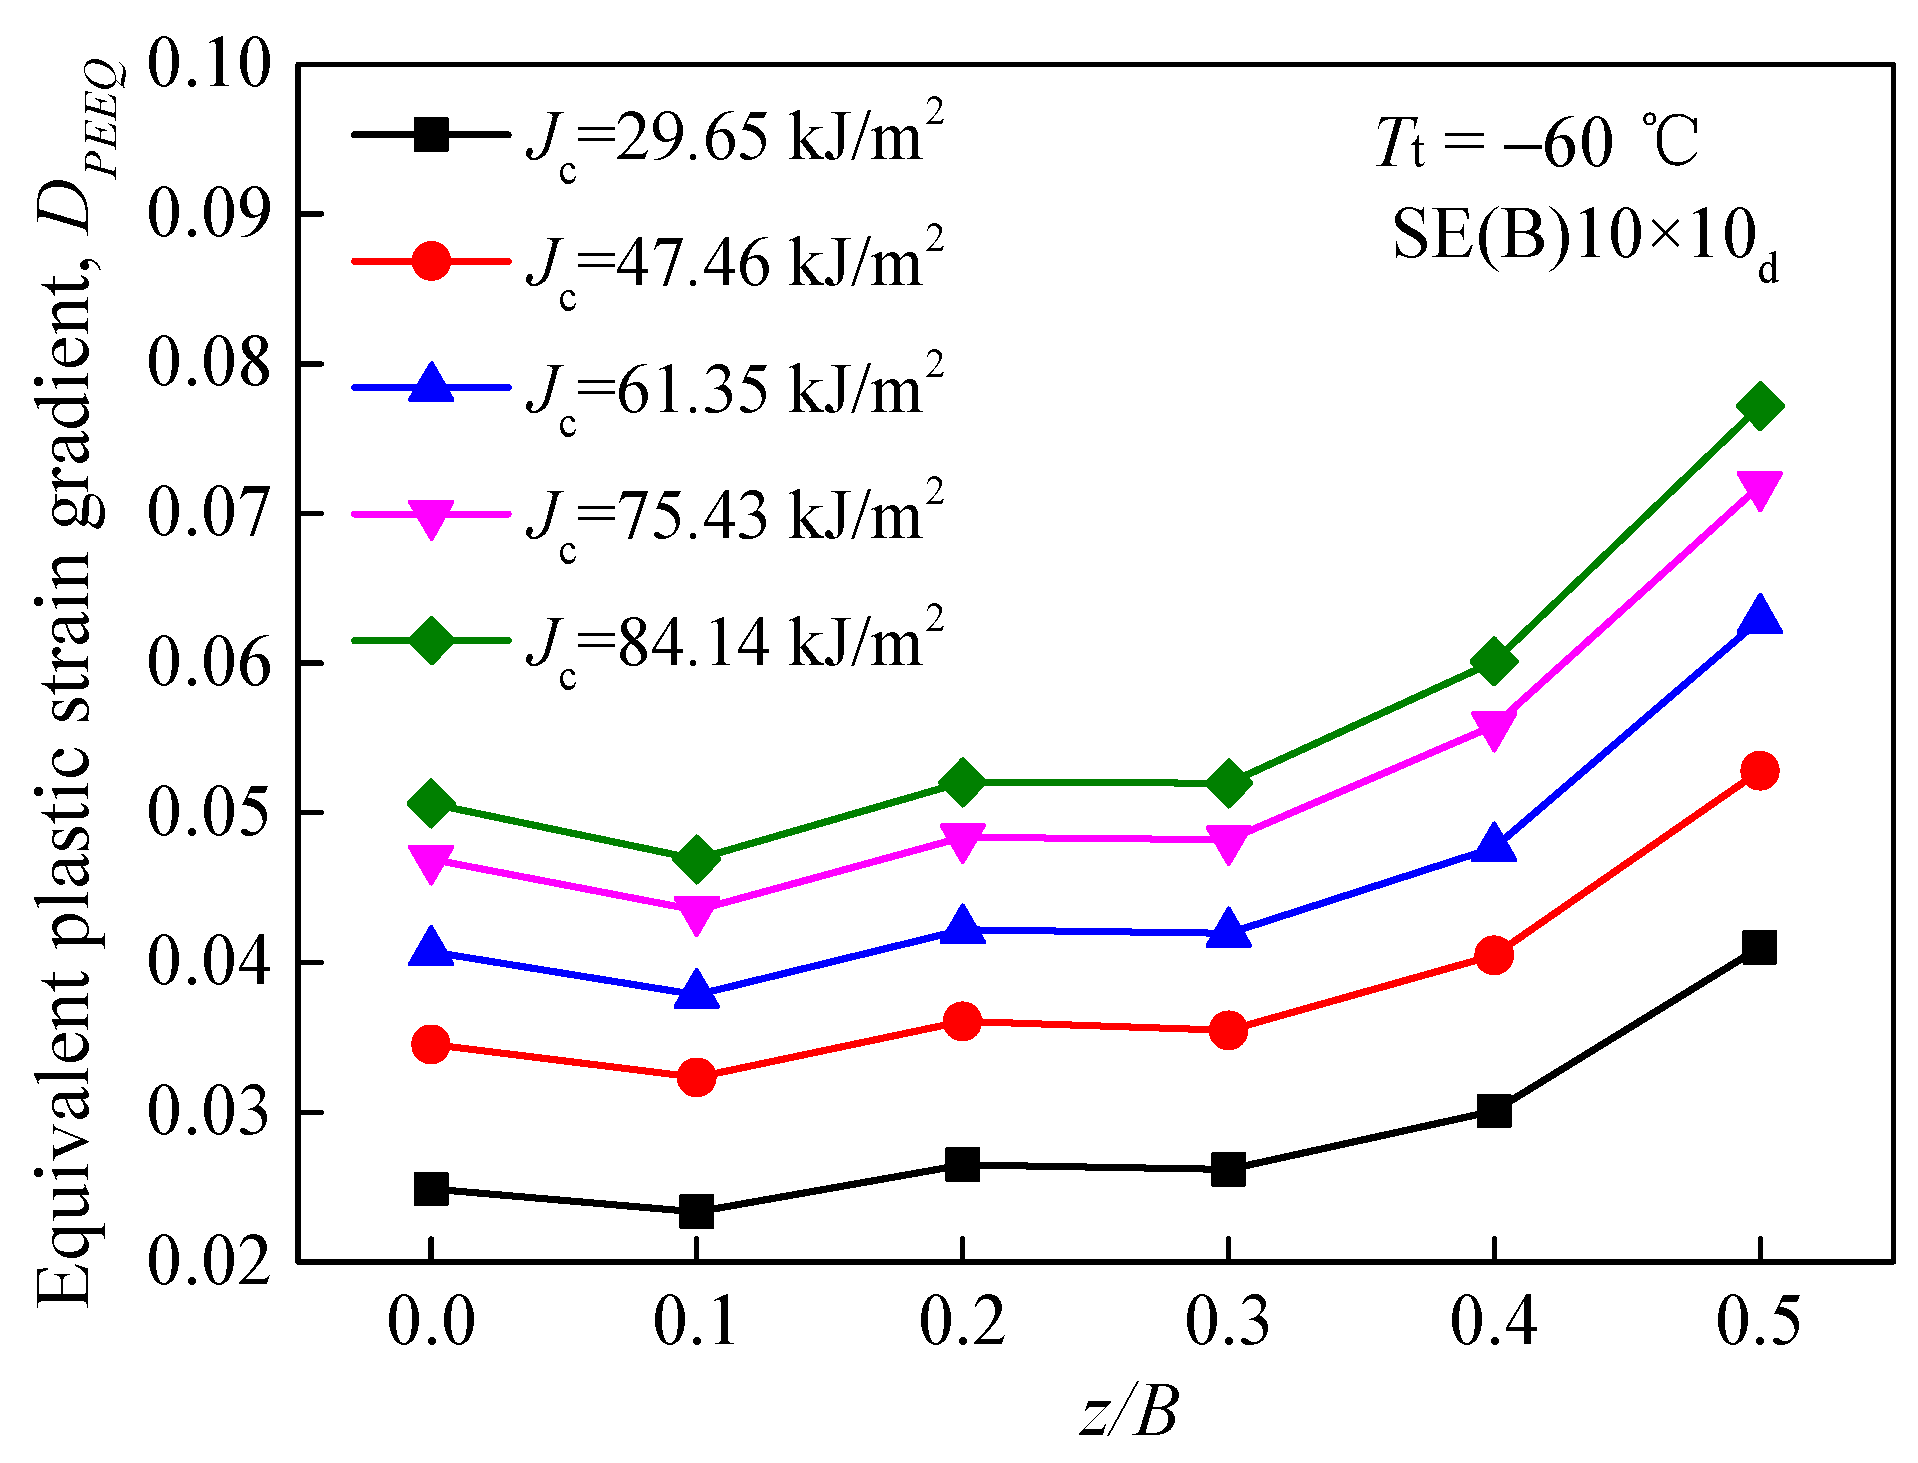
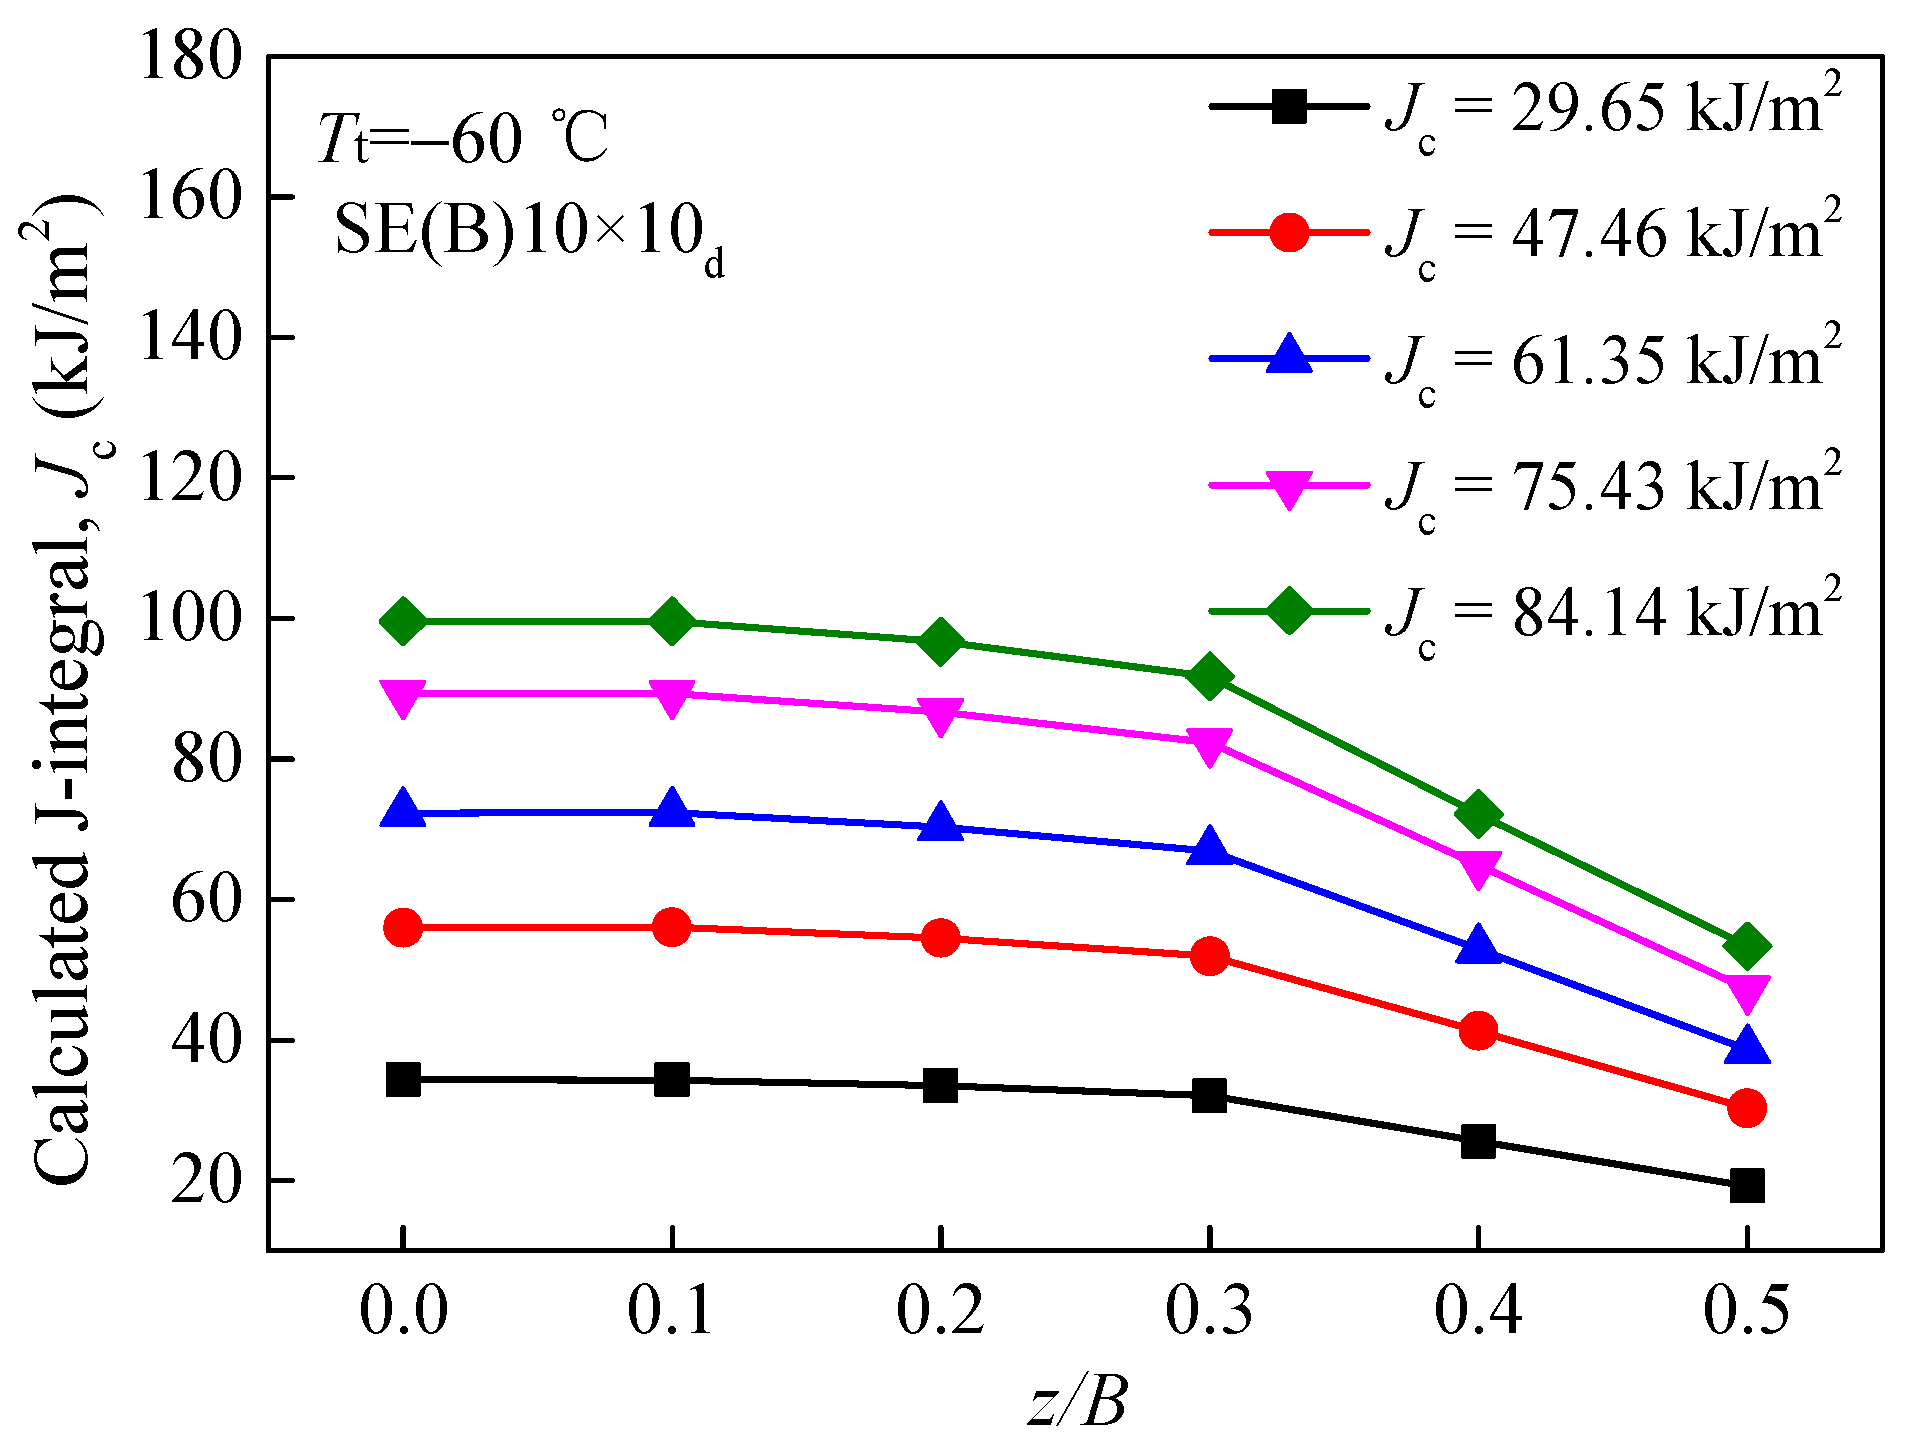
4.1. Equivalent Plastic Strain and its Gradient
4.2. Characterization of Composite Constraint
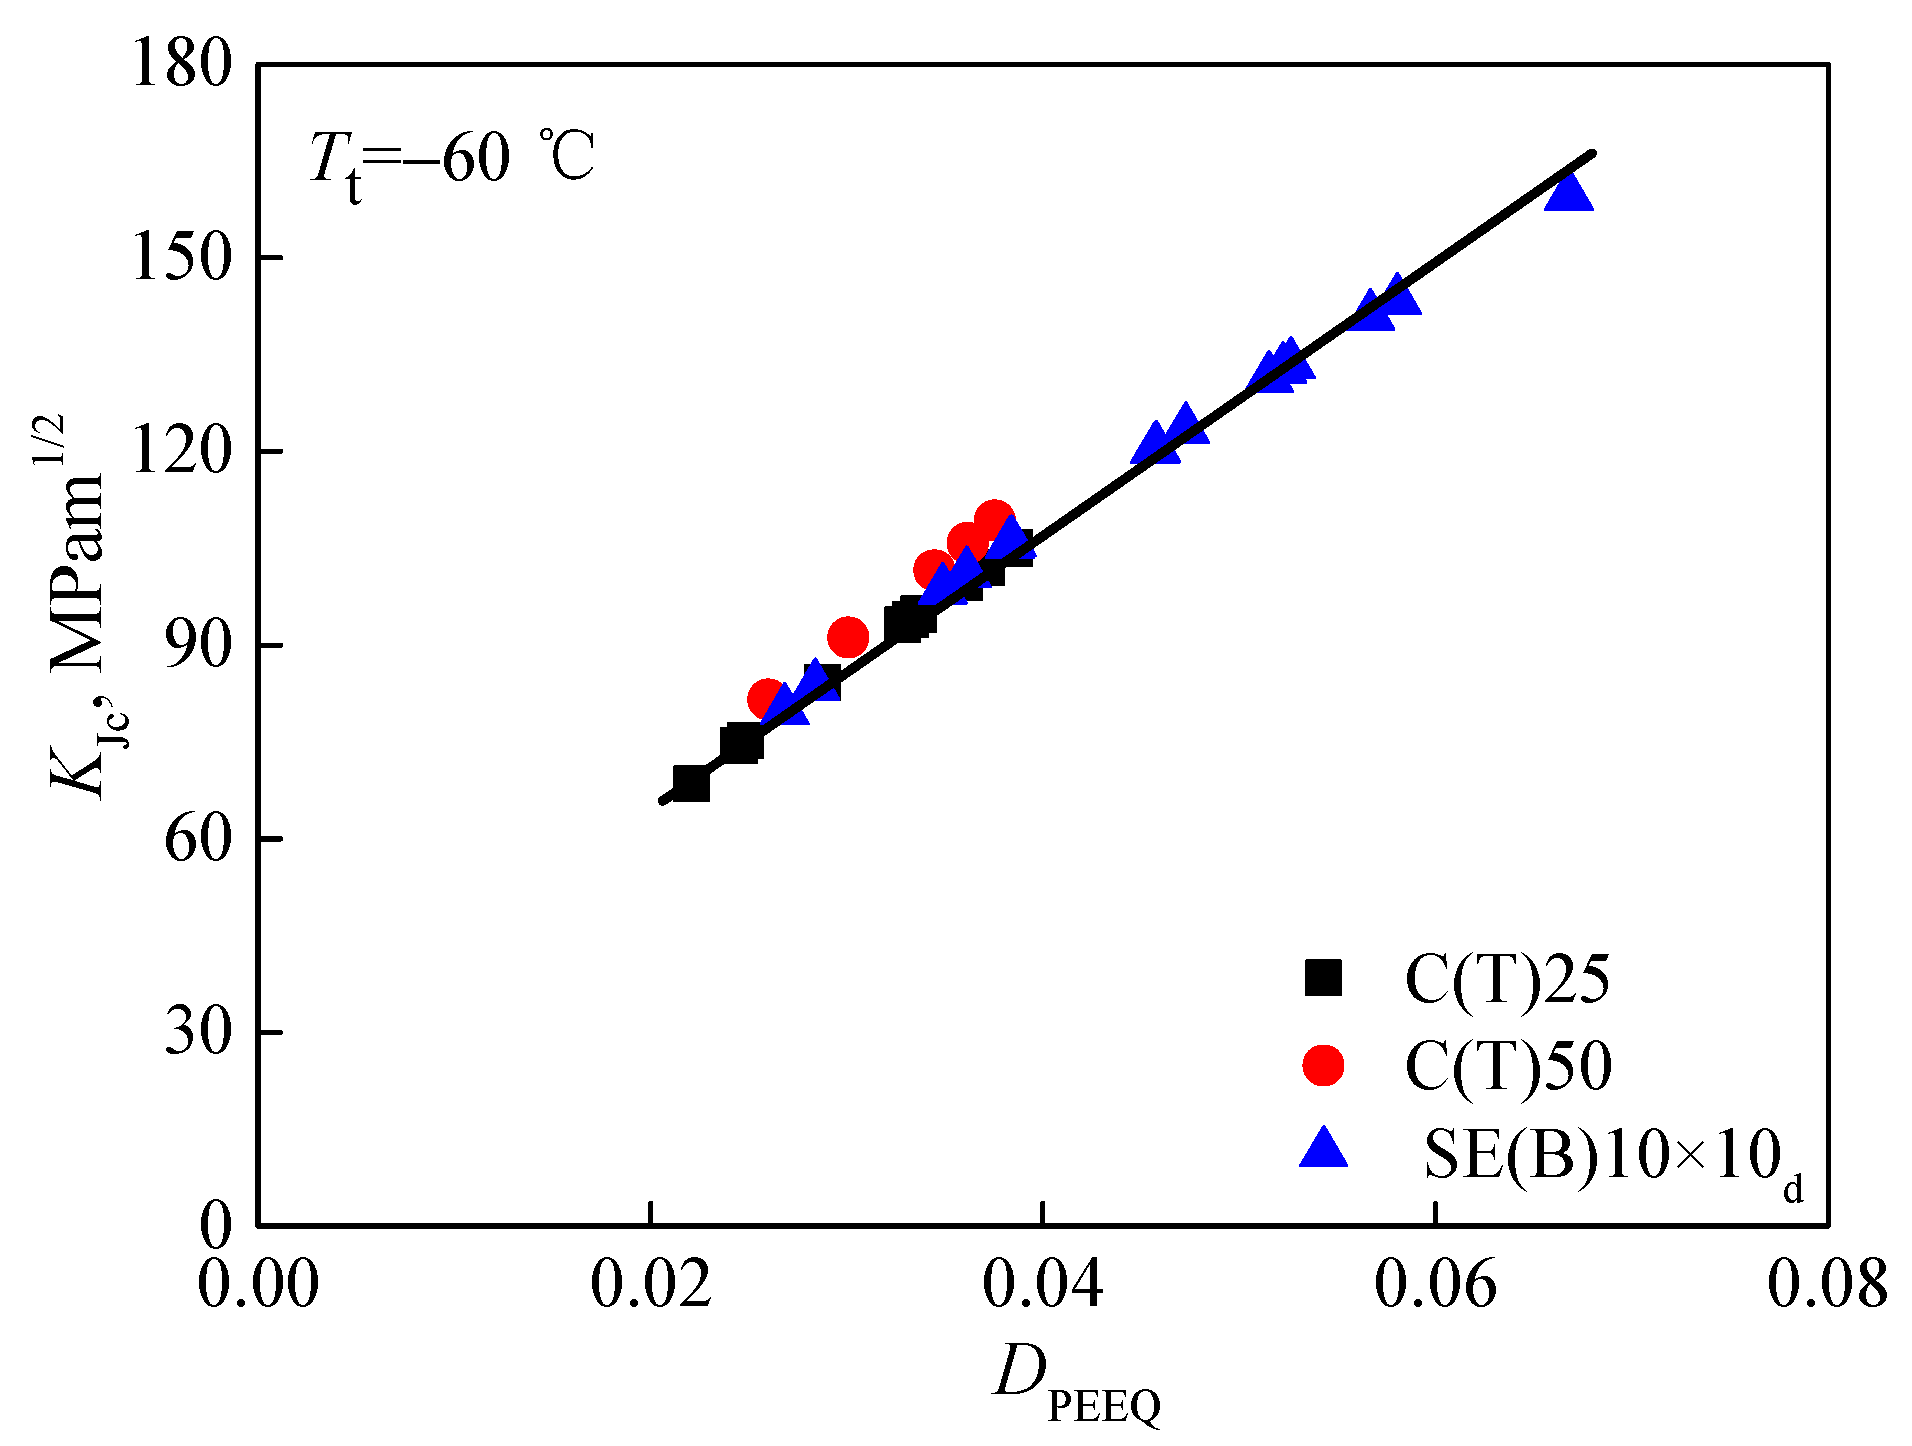
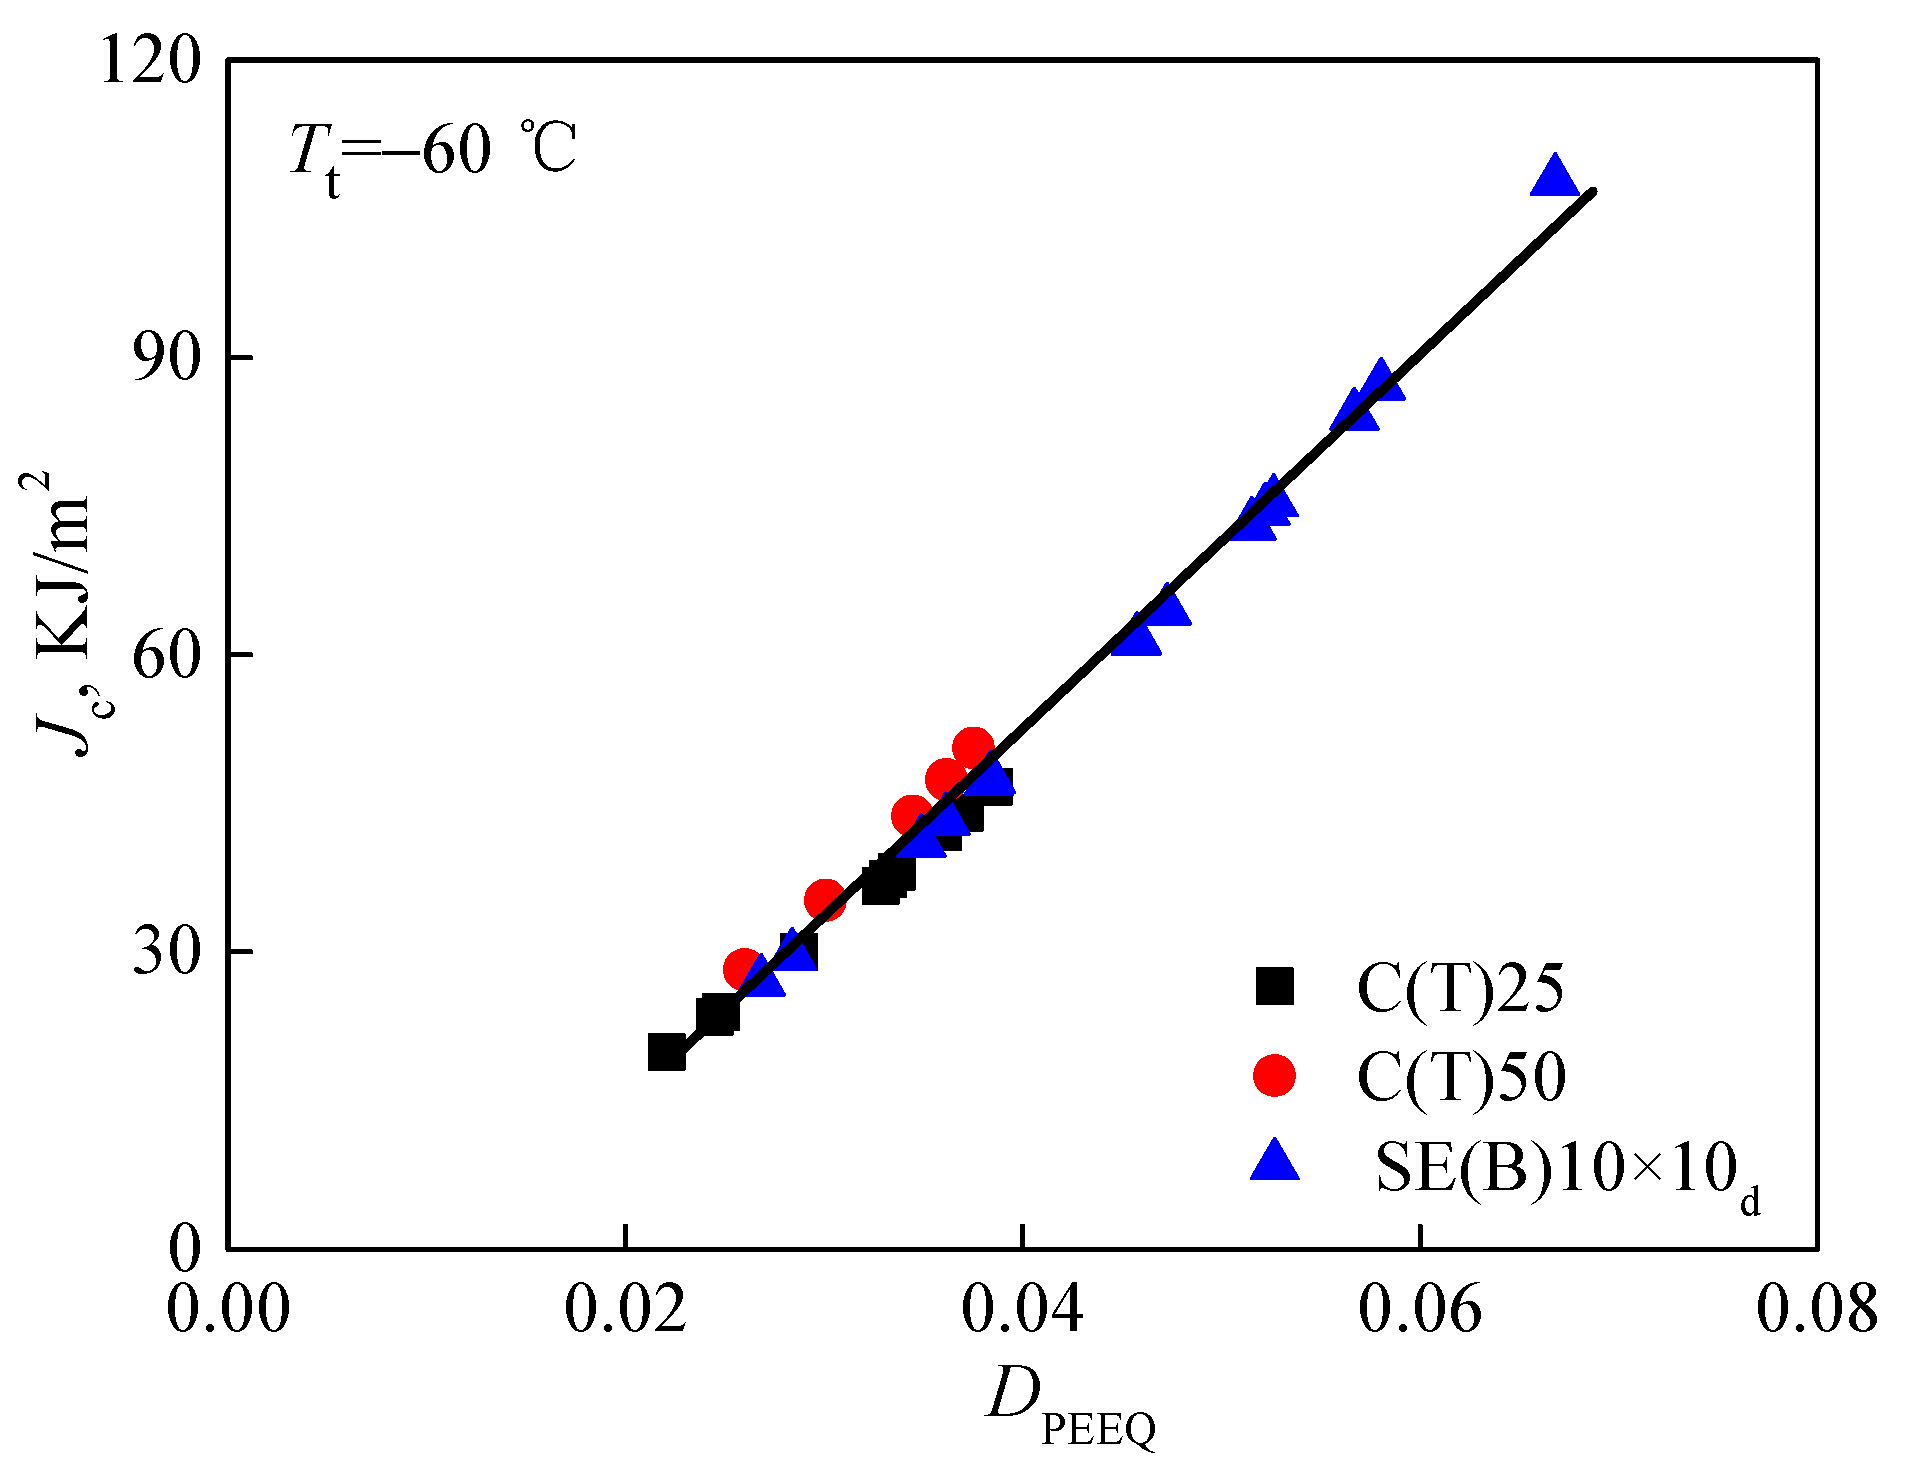
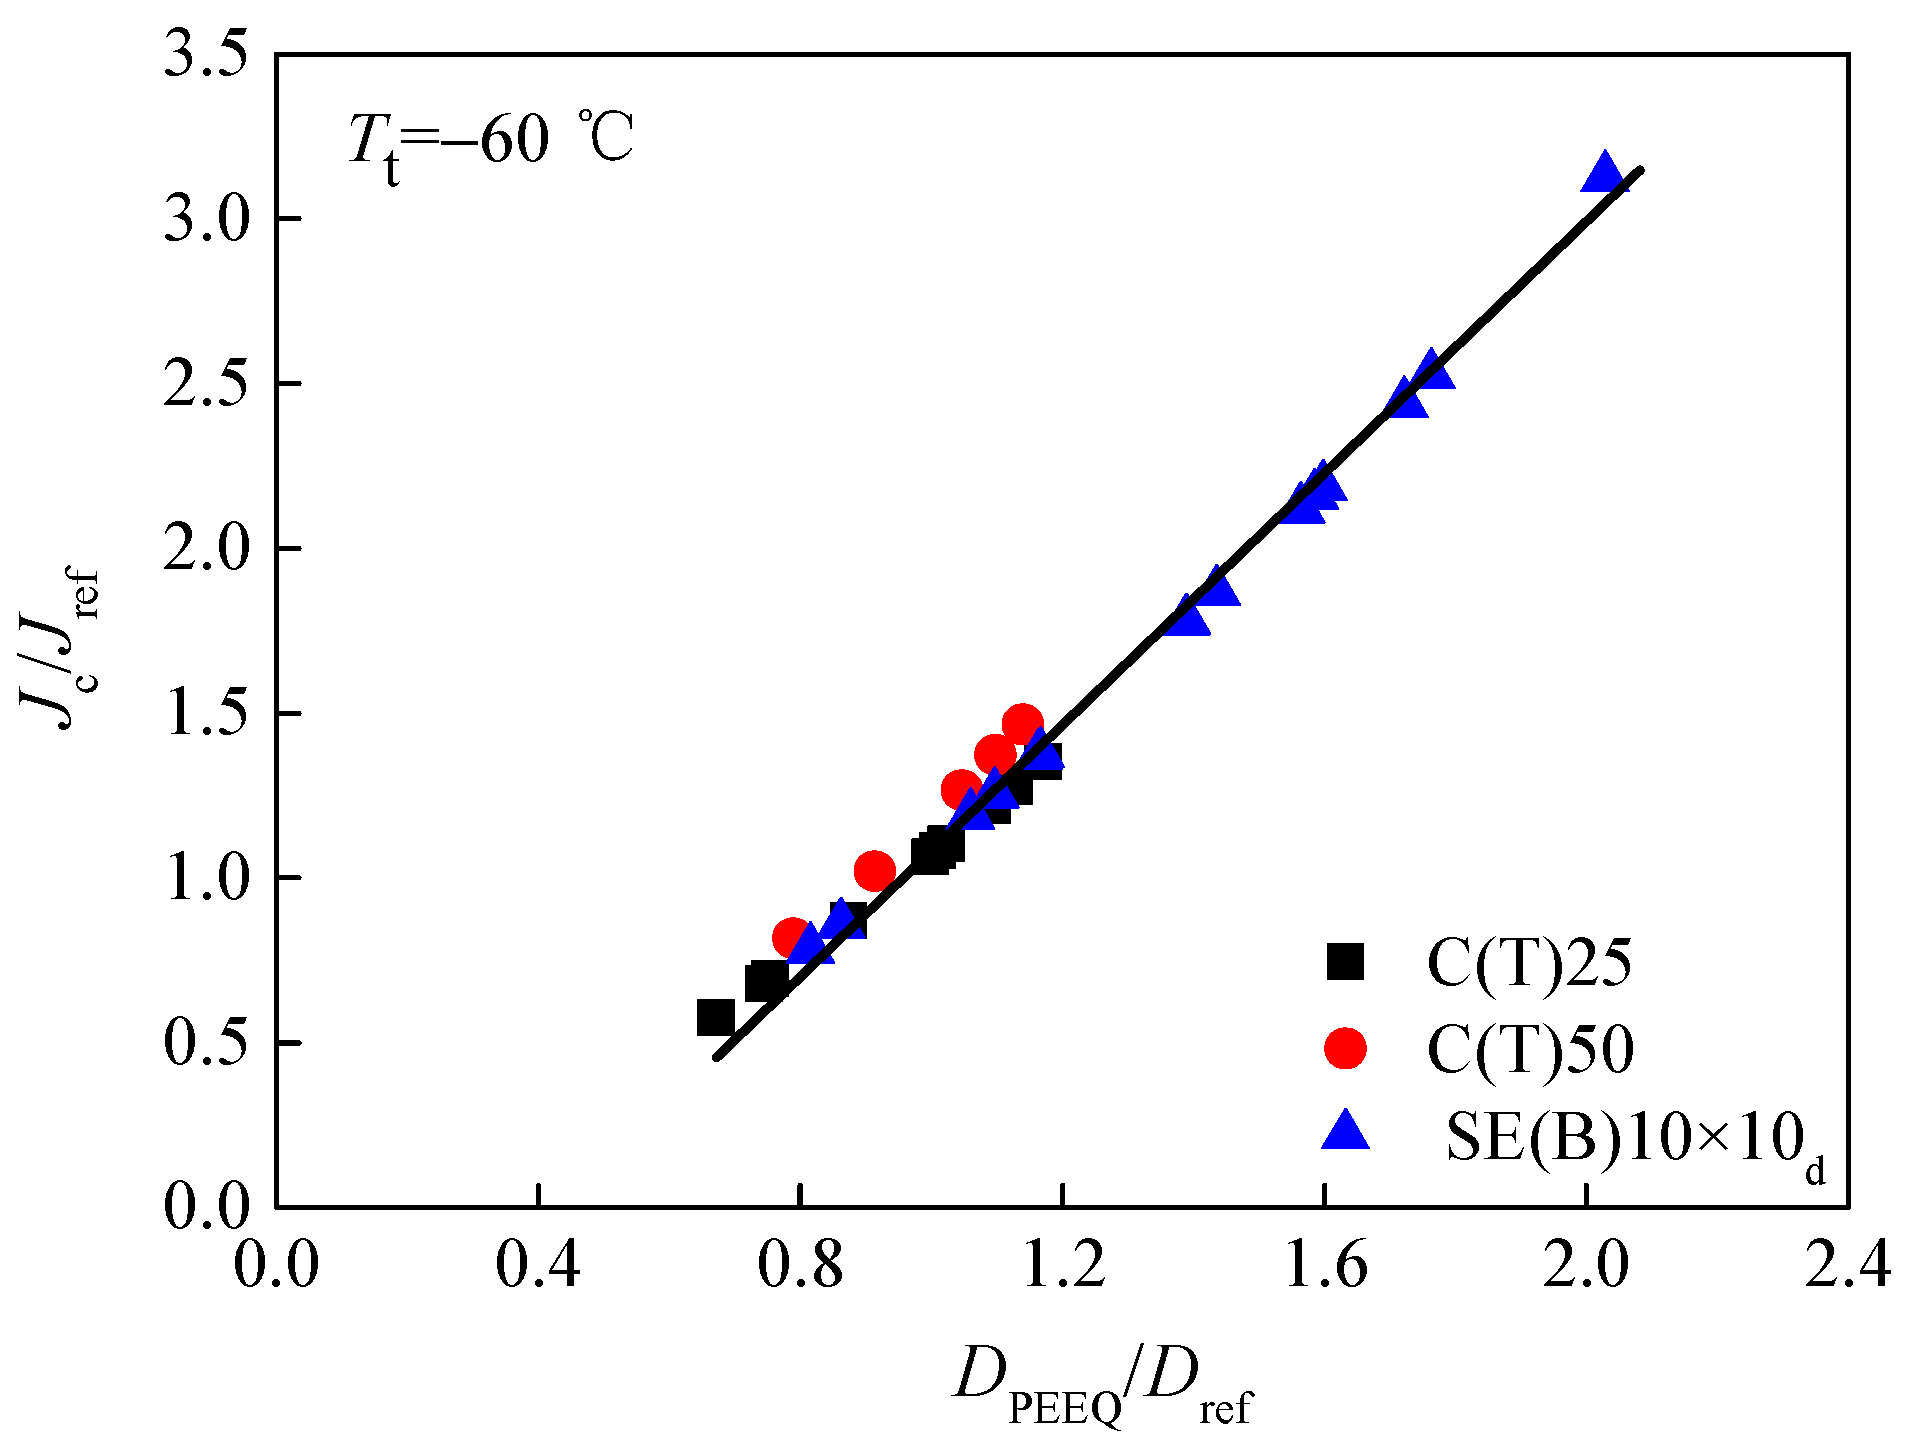
4.3. Correlation of Dp between Composite Constraint
5. Conclusions
Author Contributions
Funding
Institutional Review Board Statement
Informed Consent Statement
Data Availability Statement
Conflicts of Interest
Nomenclature
| a | Crack length |
| APEEQ | Area surrounded by the equivalent plastic strain isoline |
| Ap | A new constraint parameter |
| A2 | A constraint parameter |
| B | Specimen thickness |
| DP | Normalized parameter of the equivalent plastic strain gradient |
| DPEEQ | Equivalent plastic strain gradient |
| Dref | Average gradient of equivalent plastic strain at r0 of a reference standard specimen |
| E | Young’s modulus |
| F | Faraday’s constant |
| h | Stress triaxiality |
| J | J integral |
| Jc | Average of calculated J integrals |
| Jref | Average of calculated J integrals for a reference standard specimen |
| KJc | Measured fracture toughness |
| Kref | Fracture toughness of a reference standard specimen |
| Mmol | Molecular weight of the metal atomic |
| m | Oxidation current decay curve |
| N | Hardening exponent in the Ramberg–Osgood equation |
| Q | A constraint parameter |
| r | Distance along the crack front |
| r0 | Characteristic distance |
| Tt | Test temperature |
| Tstress | Intensity of the crack tip’s stress field |
| Time before the current decay onset | |
| W | Specimen width |
| z | Thickness coordinate at the crack front |
| zc | Charge change caused by oxidation process |
| α | Offset coefficient of the material |
| σ0 | Yield stress |
| dεp/dr | Equivalent plastic strain gradient at a fixed distance ahead of the crack tip |
| ε0 | Yield strain |
| εf | Oxide film’s degradation strain |
| Strain rate at a fixed distance ahead of the crack tip | |
| εp | Equivalent plastic strain |
| Constant of oxidation rate | |
| ρ | Density of the metal |
| ν | Poisson’s ratio |
References
- Meng, F.M.; Wang, J.Q.; Han, E.H.; Shoji, T.; Ke, W. Microstructure near scratch on alloy 690tt and stress corrosion induced by scratching. Acta Metall. Sin. 2011, 47, 839–846. [Google Scholar]
- Xue, H.; Ogawa, K.; Shoji, T. Effect of welded mechanical heterogeneity on local stress and strain ahead of stationary and growing crack tips. Nucl. Eng. Des. 2009, 239, 628–640. [Google Scholar] [CrossRef]
- Zhao, L.Y.; Cui, Y.H.; Yang, F.Q.; Xue, H. Analysis on crack driving force at stress corrosion cracking tip induced by scratch in Nickel-based alloy. Rare Met. Mater. Eng. 2018, 47, 1399–1406. [Google Scholar] [CrossRef]
- Horn, R.M.; Gordon, G.M.; Ford, F.P.; Cowan, R.L. Experience and assessment of stress corrosion cracking in L-grade stainless steel BWR internals. Nucl. Eng. Des. 1997, 174, 313–325. [Google Scholar] [CrossRef]
- Hohe, J.; Hebel, J.; Friedmann, V.; Siegele, D. Probabilistic failure assessment of ferritic steels using the master curve approach including constraint effects. Eng. Fract. Mech. 2007, 74, 1274–1292. [Google Scholar] [CrossRef]
- Neimitz, A. Fracture toughness of structural elements: The influence of the in-and out-of-plane constraints on fracture toughness. Mater. Sci. 2006, 42, 61–77. [Google Scholar] [CrossRef]
- Guo, W. Elastoplastic three dimensional crack border field—II. Asymptotic solution for the field. Eng. Fract. Mech. 1993, 46, 105–113. [Google Scholar] [CrossRef]
- Guo, W. Elasto-plastic three-dimensional crack border field-III. Fracture parameters. Eng. Fract. Mech. 1995, 51, 51–71. [Google Scholar] [CrossRef] [Green Version]
- She, C.; Guo, W. The out-of-plane constraint of mixed-mode cracks in thin elastic plates. Int. J. Solids Struct. 2007, 44, 3021–3034. [Google Scholar] [CrossRef] [Green Version]
- Chao, Y.J.; Yang, S.; Sutton, M.A. On the fracture of solids characterized by one or two parameters: Theory and practice. J. Mech. Phys. Solids 1994, 42, 629–647. [Google Scholar] [CrossRef]
- O’Dowd, N.; Shih, C. Family of crack-tip fields characterized by a triaxiality parameter—I. Structure of fields. J. Mech. Phys. Solids 1991, 39, 989–1015. [Google Scholar] [CrossRef]
- Clausmeyer, H.; Kussmaul, K.; Roos, E. Influence of stress state on the failure behavior of cracked components made of steel. Appl. Mech. Rev. 1991, 44, 77–92. [Google Scholar] [CrossRef]
- Hebel, J.; Hohe, J.; Friedmann, V.; Siegele, D. Experimental and numerical analysis of in-plane and out-of-plane crack tip constraint characterization by secondary fracture parameters. Int. J. Fract. 2007, 146, 173–188. [Google Scholar] [CrossRef]
- Yang, J.; Wang, G.Z.; Xuan, F.Z.; Yu, S.D. Unified characterisation of in-plane and out-of-plane constraint based on crack-tip equivalent plastic strain. Fatigue Fract. Eng. Mater. Struct. 2013, 36, 504–514. [Google Scholar] [CrossRef]
- Yang, J.; Wang, G.Z.; Xuan, F.Z.; Tu, S.T. Unified correlation of in-plane and out-of-plane constraint with fracture resistance of a dissimilar metal welded joint. Eng. Fract. Mech. 2014, 115, 296–307. [Google Scholar] [CrossRef]
- Mu, M.Y.; Wang, G.Z.; Xuan, F.Z.; Tu, S.T. Unified parameter of in-plane and out-of-plane constraint effects and its correlation with brittle fracture toughness of steel. Int. J. Fract. 2014, 190, 87–98. [Google Scholar] [CrossRef]
- Andresen, P.L.; Ford, F. Fundamental modeling of environmental cracking for improved design and lifetime evaluation in BWRs. Int. J. Press. Vessel. Pip. 1994, 59, 61–70. [Google Scholar] [CrossRef]
- Shoji, T.; Lu, Z.; Murakami, H. Formulating stress corrosion cracking growth rates by combination of crack tip mechanics and crack tip oxidation kinetics. Corros. Sci. 2010, 52, 769–779. [Google Scholar] [CrossRef]
- Yang, F.Q.; Xue, H.; Zhao, L.Y.; Fang, X.R. A quantitative prediction model of SCC rate for nuclear structure materials in high temperature water based on crack tip creep strain rate. Nucl. Eng. Des. 2014, 278, 686–692. [Google Scholar] [CrossRef]
- Zaferani, S.H.; Miresmaeili, R.; Pourcharmi, M.K. Mechanistic models for environmentally-assisted cracking in sour service. Eng. Fail. Anal. 2017, 79, 672–703. [Google Scholar] [CrossRef]
- Xue, H.; Shoji, T. Quantitative prediction of EAC crack growth rate of sensitized type 304 stainless steel in boiling water reactor environments based on EPFEM. J. Press. Vessel. Technol. 2006, 129, 460–467. [Google Scholar] [CrossRef]
- Ford, F.P. Quantitative prediction of environmentally assisted cracking. Corrosion. 1996, 52, 375–395. [Google Scholar] [CrossRef] [Green Version]
- Lu, Z.; Shoji, T.; Meng, F.; Xue, H.; Qiu, Y.; Takeda, Y.; Negishi, K. Characterization of microstructure and local deformation in 316NG weld heat-affected zone and stress corrosion cracking in high temperature water. Corros. Sci. 2011, 53, 1916–1932. [Google Scholar] [CrossRef]
- Peng, Q.; Kwon, J.; Shoji, T. Development of a fundamental crack tip strain rate equation and its application to quantitative prediction of stress corrosion cracking of stainless steels in high temperature oxygenated water. J. Nucl. Mater. 2004, 324, 52–61. [Google Scholar] [CrossRef]
- Koshiishi, M.; Hashimoto, T.; Obata, R. Application of the FRI crack growth model for neutron-irradiated stainless steels in high-temperature water of a boiling water reactor environment. Corros. Sci. 2017, 123, 278–288. [Google Scholar] [CrossRef]
- Panter, J.; Viguier, B.; Cloué, J.-M.; Foucault, M.; Combrade, P.; Andrieu, E. Influence of oxide films on primary water stress corrosion cracking initiation of alloy 600. J. Nucl. Mater. 2006, 348, 213–221. [Google Scholar] [CrossRef] [Green Version]
- Xue, H.; Wang, Z.; Wang, S.; He, J.; Yang, H. Characterization of mechanical heterogeneity in dissimilar metal welded joints. Mater. 2021, 14, 4145. [Google Scholar] [CrossRef]


| Name | Type | Tt (°C) | Number | W (mm) | B (mm) | a/W |
|---|---|---|---|---|---|---|
| C(T)25 | C(T) | −60 | 10 | 50 | 25 | 0.5162 |
| C(T)50 | C(T) | −60 | 5 | 100 | 50 | 0.5104 |
| SE(B)10 × 10d | SE(B) | −67/−70 | 15 | 10 | 10 | 0.5245 |
| Young’s Modulus E (MPa) | Poison’s Ratio ν | Yield Stress σ0 (MPa) | Hardening Exponent n | Offset Coefficient α |
|---|---|---|---|---|
| 215 000 | 0.3 | 517 | 3.7 | 6.2 |
| Specimen Types | KJc (MPa m1/2) | Jc (kJ/m2) | DPEEQ | Dp |
|---|---|---|---|---|
| C(T)25 | 68.5 | 19.86022 | 0.02210 | 0.67100 |
| 74.4 | 23.42873 | 0.02451 | 0.74417 | |
| 75.2 | 23.93529 | 0.02484 | 0.75419 | |
| 84.2 | 30.00731 | 0.02877 | 0.87351 | |
| 93.1 | 36.68616 | 0.03287 | 0.99800 | |
| 93.9 | 37.31935 | 0.03325 | 1.00953 | |
| 94.8 | 38.03817 | 0.03367 | 1.02229 | |
| 99.7 | 42.07201 | 0.03601 | 1.09333 | |
| 102 | 44.03553 | 0.03711 | 1.12673 | |
| 105 | 46.66395 | 0.03856 | 1.17076 | |
| C(T)50 | 81.6 | 28.18274 | 0.02600 | 0.78941 |
| 91.2 | 35.20405 | 0.03009 | 0.91359 | |
| 101.6 | 43.69084 | 0.03447 | 1.04658 | |
| 105.8 | 47.37773 | 0.03617 | 1.09819 | |
| 109.3 | 50.56421 | 0.03755 | 1.14009 | |
| SE(B)10 × 10d | 79.9 | 27.02069 | 0.02685 | 0.81522 |
| 83.7 | 29.65199 | 0.02839 | 0.86197 | |
| 98.5 | 41.06534 | 0.03489 | 1.05963 | |
| 101.1 | 43.26187 | 0.03612 | 1.09667 | |
| 105.7 | 47.28821 | 0.03832 | 1.16347 | |
| 105.9 | 47.46734 | 0.03841 | 1.16620 | |
| 120.4 | 61.35584 | 0.04571 | 1.38784 | |
| 120.5 | 61.4578 | 0.04576 | 1.38936 | |
| 123.4 | 64.45153 | 0.04727 | 1.43521 | |
| 131.4 | 73.07918 | 0.05151 | 1.56394 | |
| 132.7 | 74.53234 | 0.05221 | 1.58519 | |
| 133.5 | 75.43371 | 0.05264 | 1.59825 | |
| 141.0 | 84.14749 | 0.05669 | 1.72152 | |
| 143.5 | 87.1579 | 0.05806 | 1.76281 | |
| 159.6 | 107.8124 | 0.06681 | 2.02848 |
Publisher’s Note: MDPI stays neutral with regard to jurisdictional claims in published maps and institutional affiliations. |
© 2022 by the authors. Licensee MDPI, Basel, Switzerland. This article is an open access article distributed under the terms and conditions of the Creative Commons Attribution (CC BY) license (https://creativecommons.org/licenses/by/4.0/).
Share and Cite
Zhao, L.; Shi, Z.; Wang, Z.; Yang, F. An Investigation of a New Parameter Based on the Plastic Strain Gradient to Characterize Composite Constraint around the Crack Front at a Low Temperature. Materials 2022, 15, 881. https://doi.org/10.3390/ma15030881
Zhao L, Shi Z, Wang Z, Yang F. An Investigation of a New Parameter Based on the Plastic Strain Gradient to Characterize Composite Constraint around the Crack Front at a Low Temperature. Materials. 2022; 15(3):881. https://doi.org/10.3390/ma15030881
Chicago/Turabian StyleZhao, Lingyan, Zheren Shi, Zheng Wang, and Fuqiang Yang. 2022. "An Investigation of a New Parameter Based on the Plastic Strain Gradient to Characterize Composite Constraint around the Crack Front at a Low Temperature" Materials 15, no. 3: 881. https://doi.org/10.3390/ma15030881
APA StyleZhao, L., Shi, Z., Wang, Z., & Yang, F. (2022). An Investigation of a New Parameter Based on the Plastic Strain Gradient to Characterize Composite Constraint around the Crack Front at a Low Temperature. Materials, 15(3), 881. https://doi.org/10.3390/ma15030881