
A Systematic Characterization Approach for Vacuum Bag Only Prepregs towards an Accurate Process Design

 , , and
Abstract
:1. Introduction
2. Materials and Methods
2.1. Materials
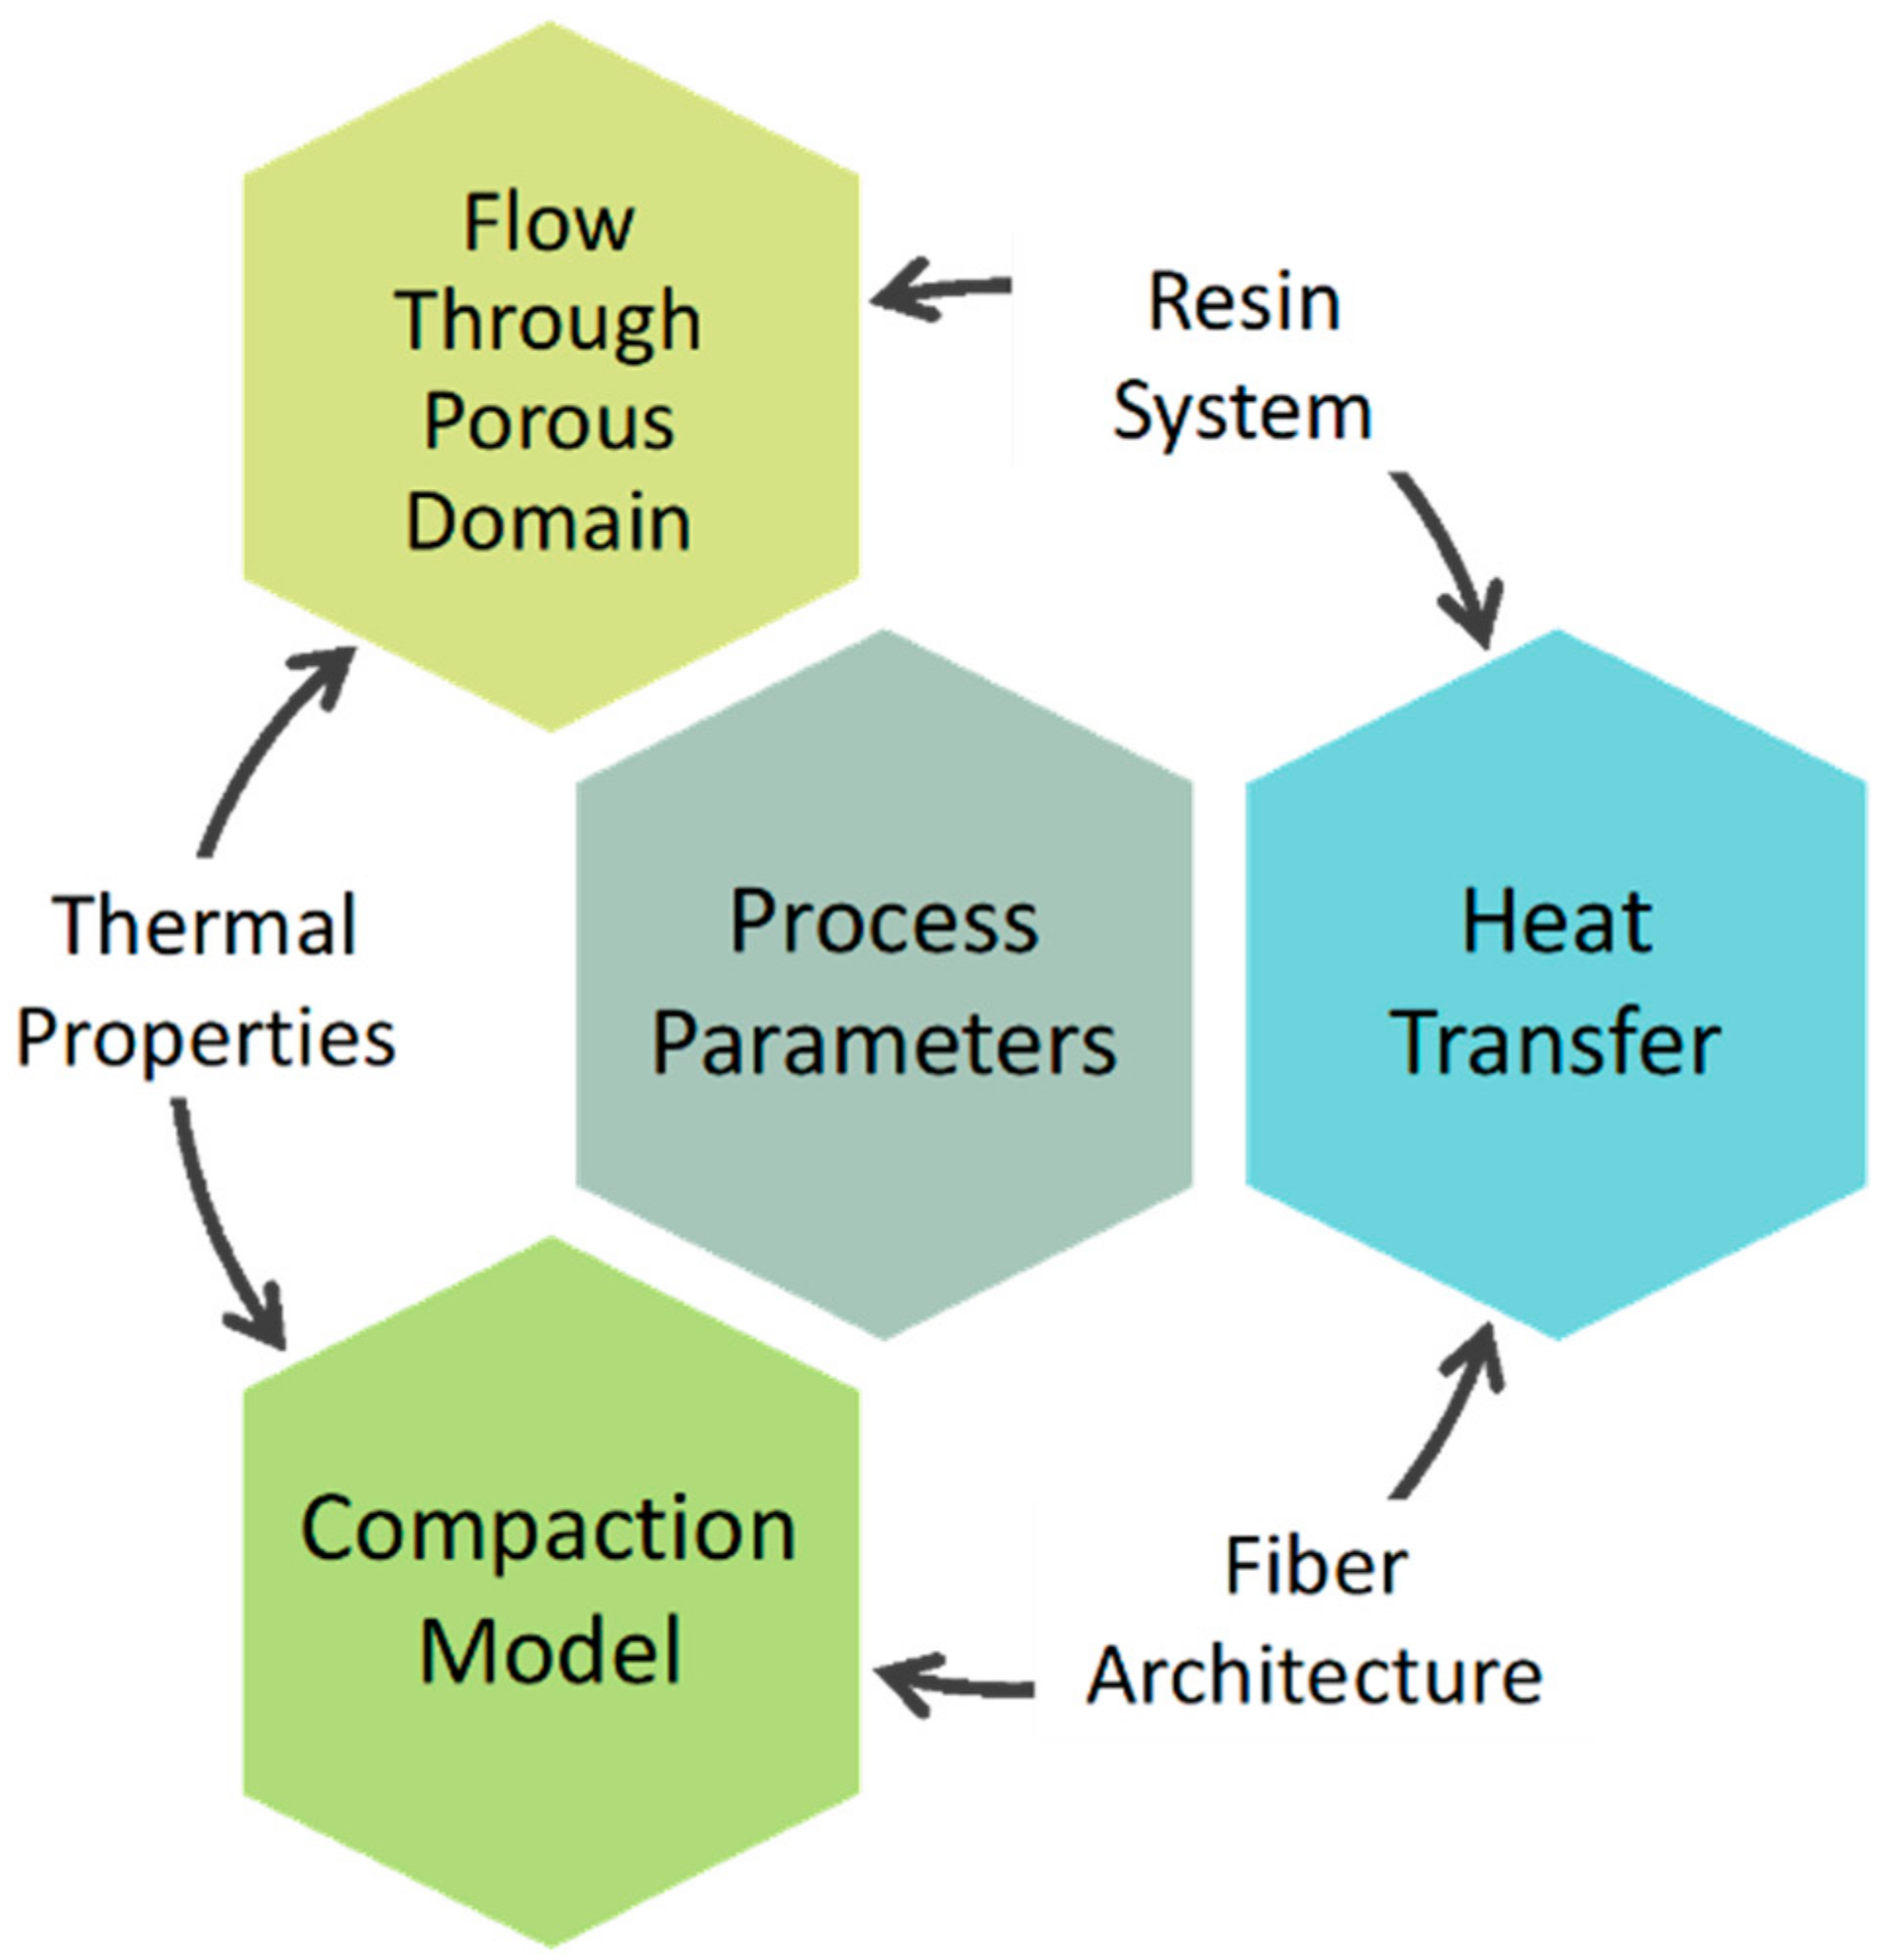
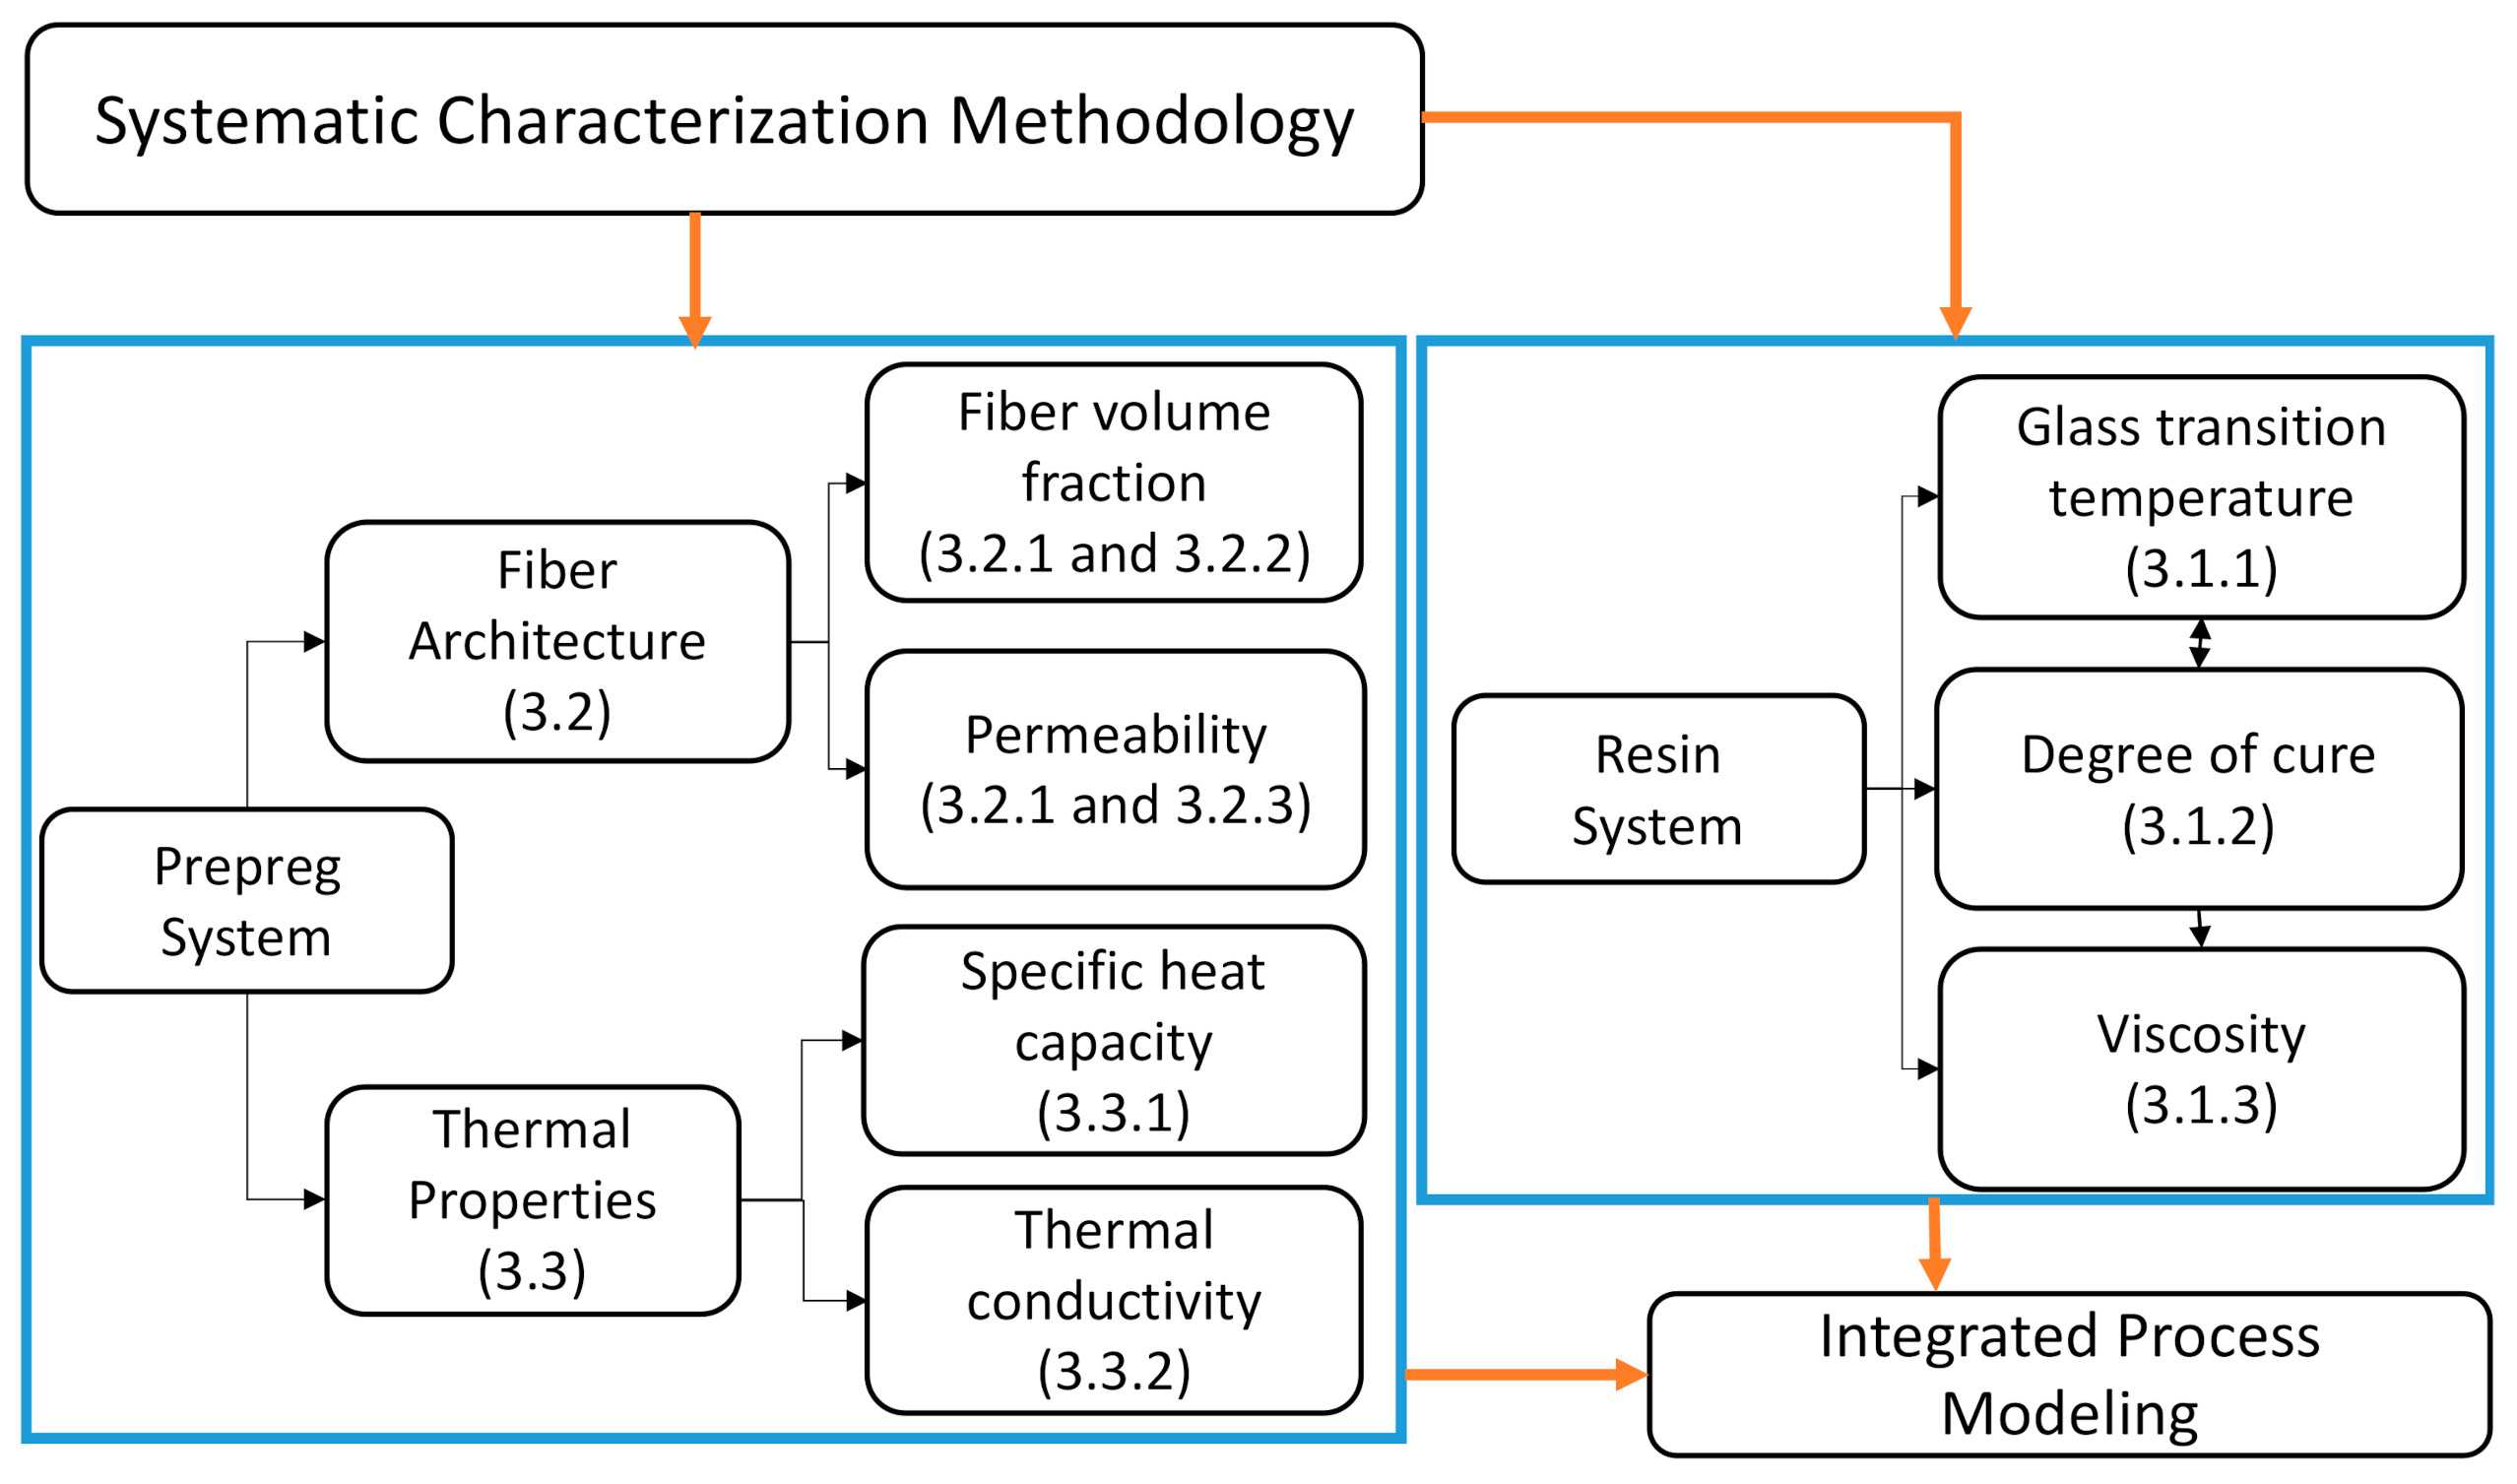
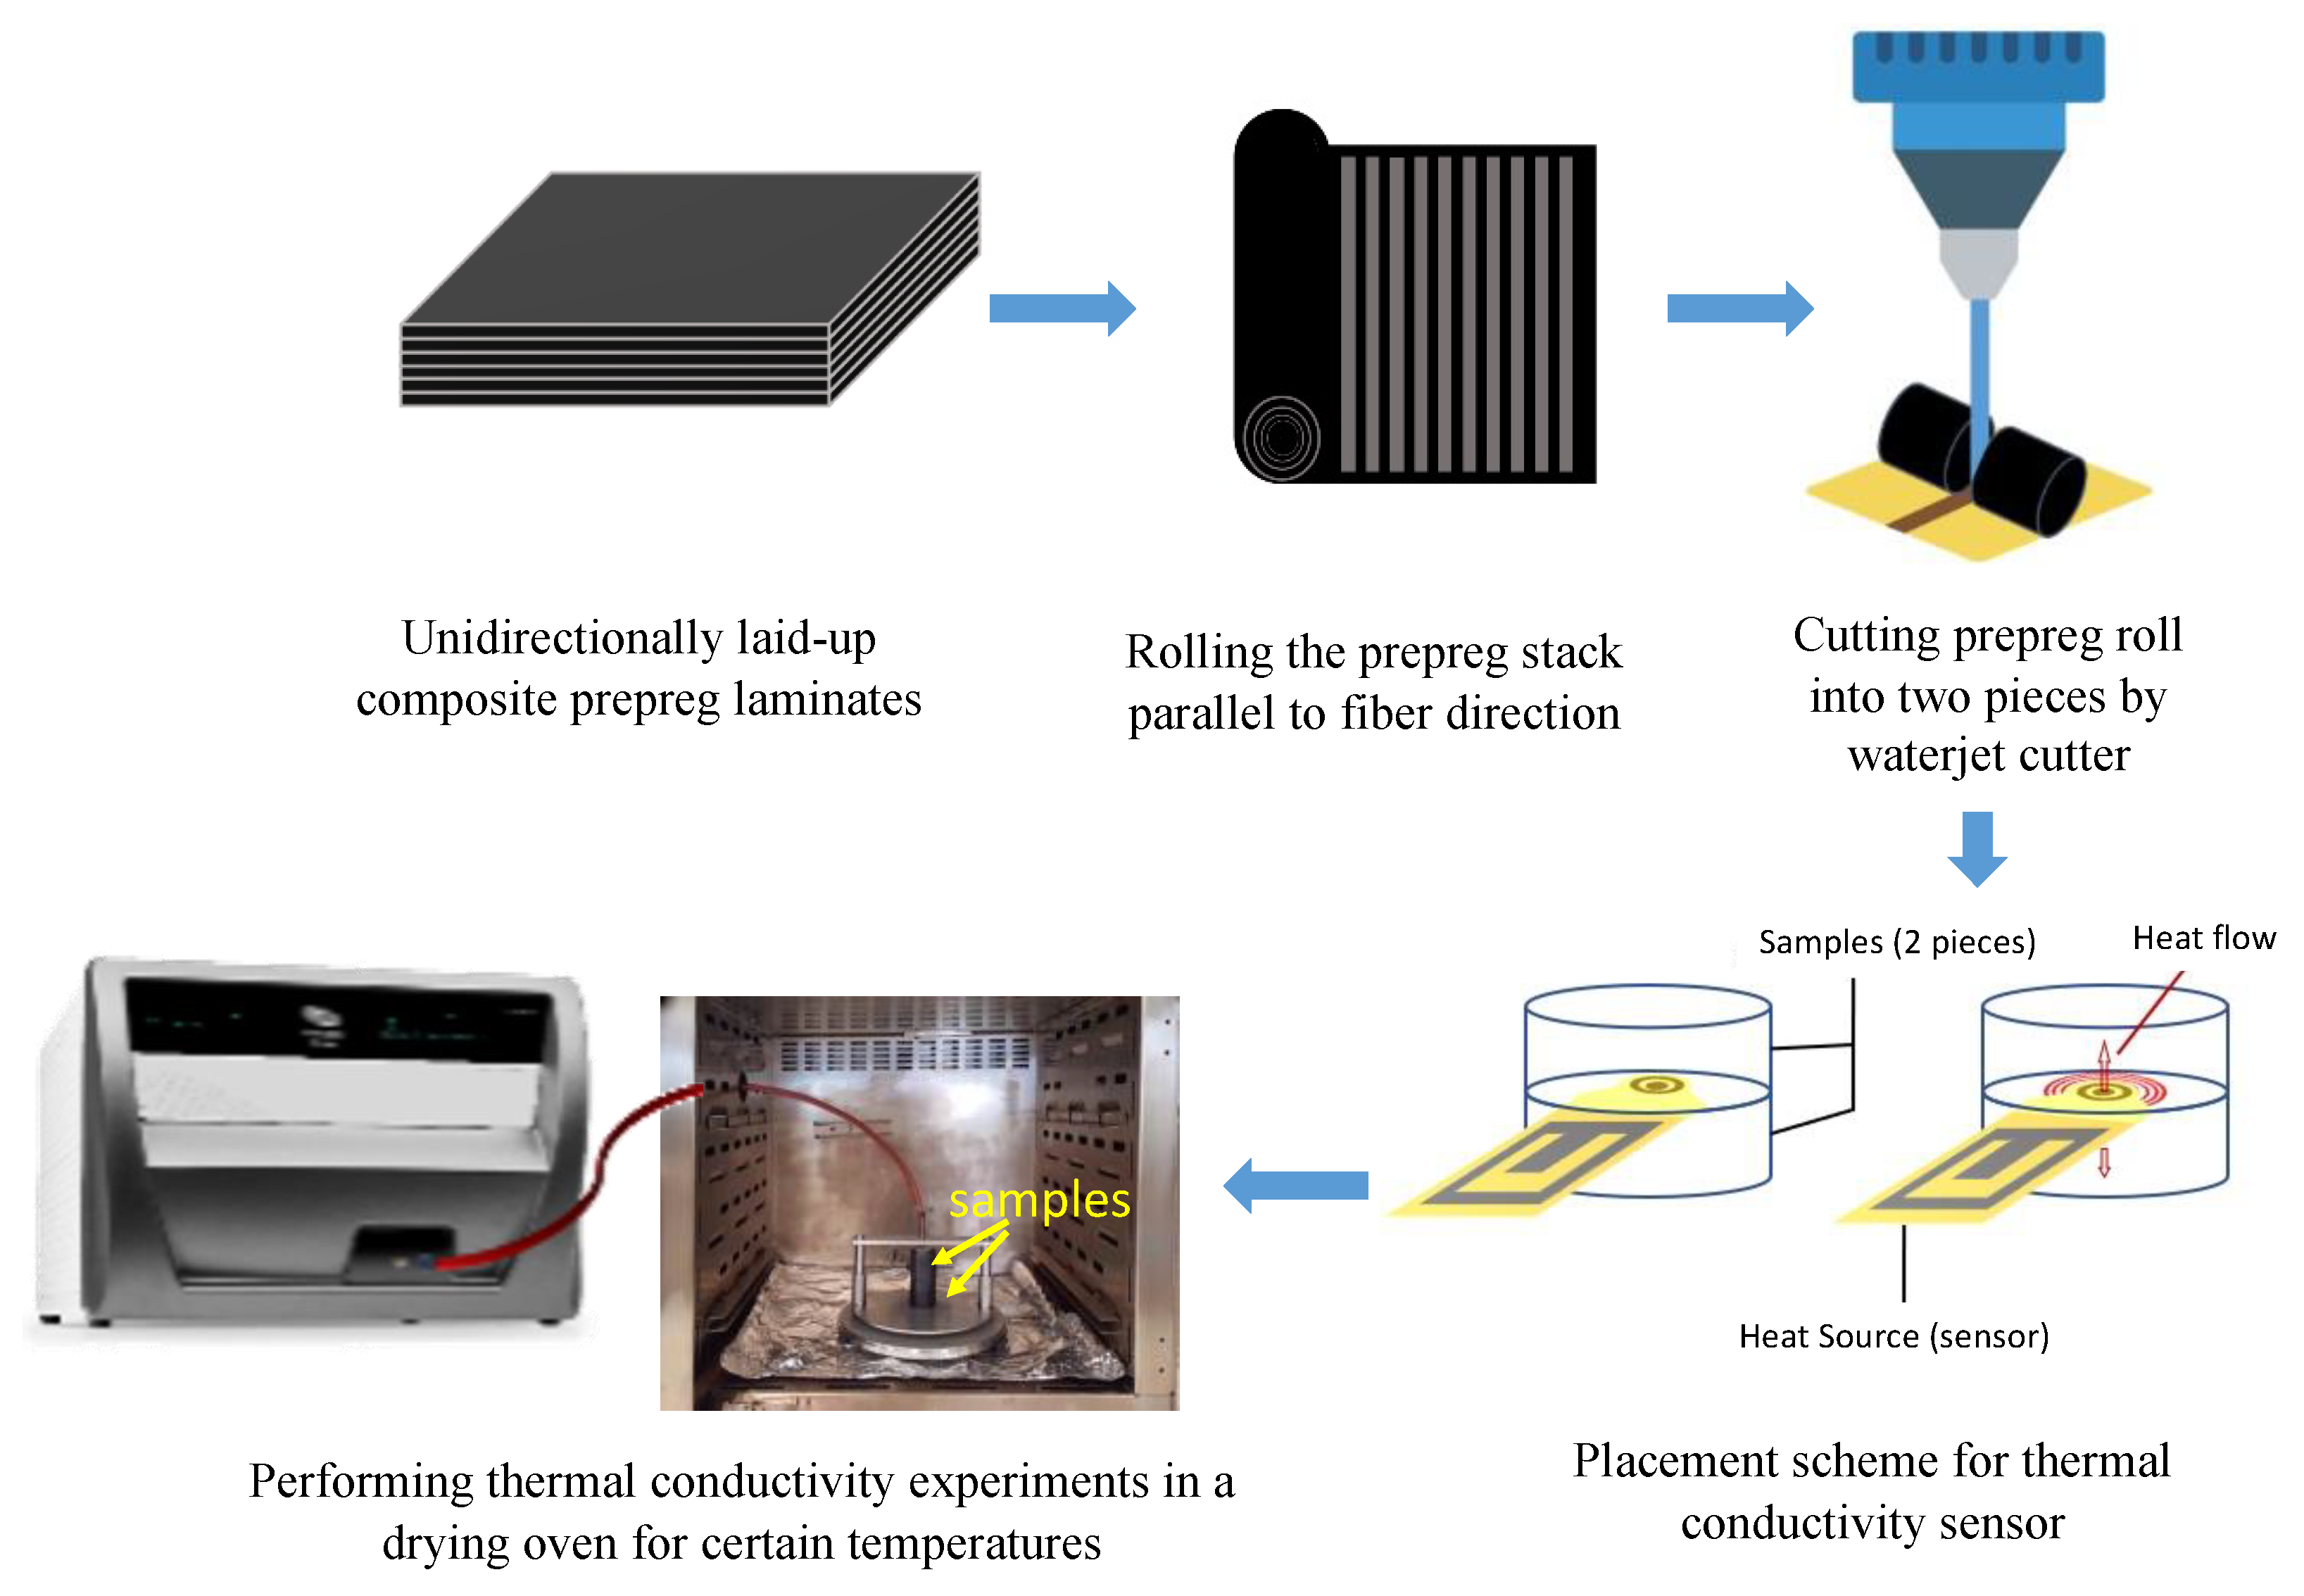
2.2. Methodology
3. Characterization Studies
3.1. Resin System
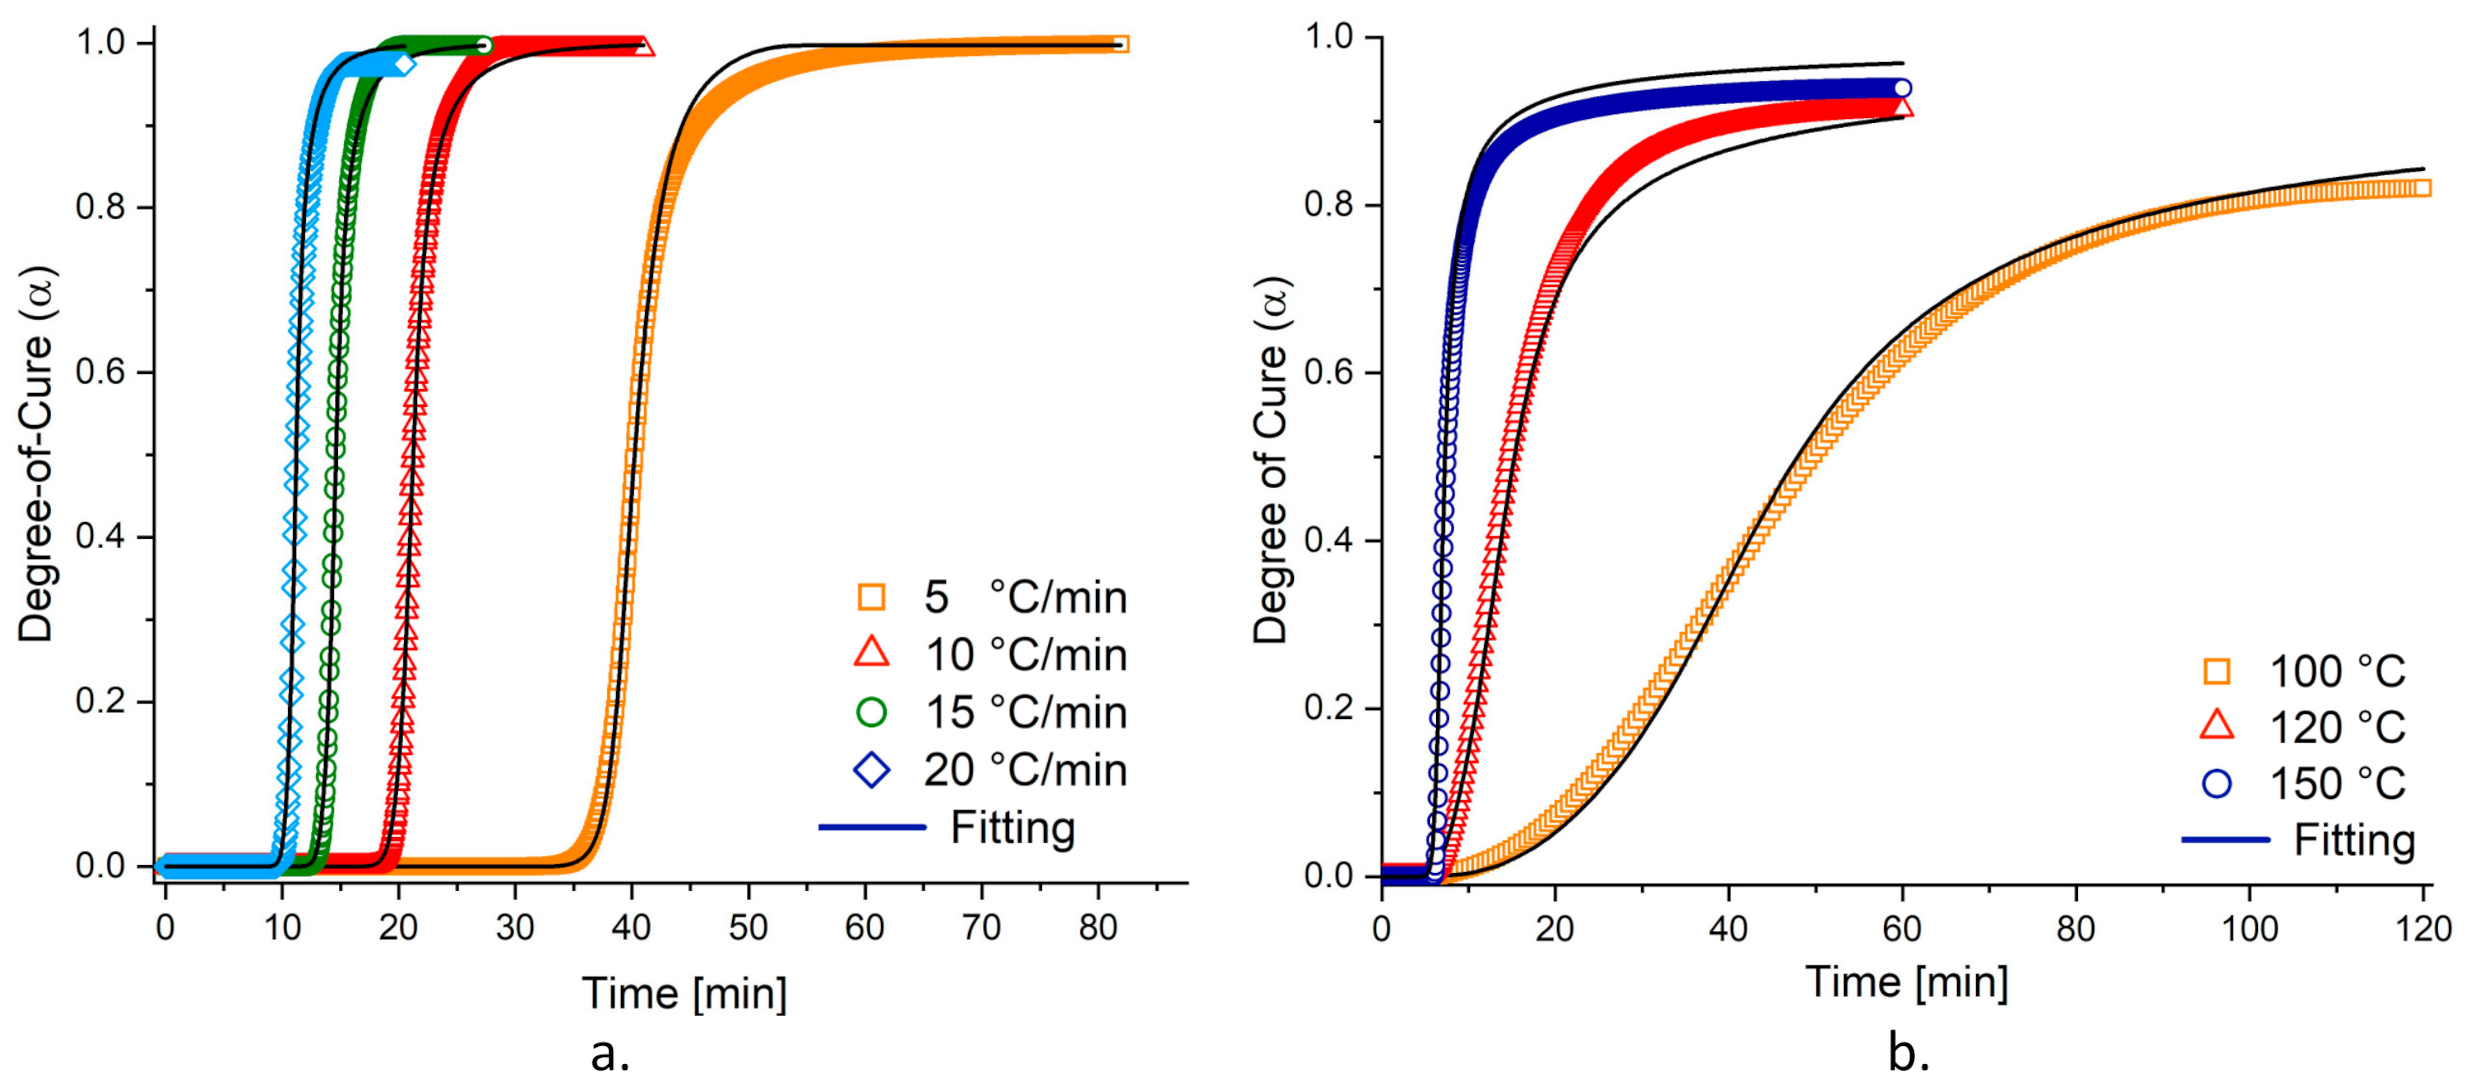
3.1.1. Cure Kinetics
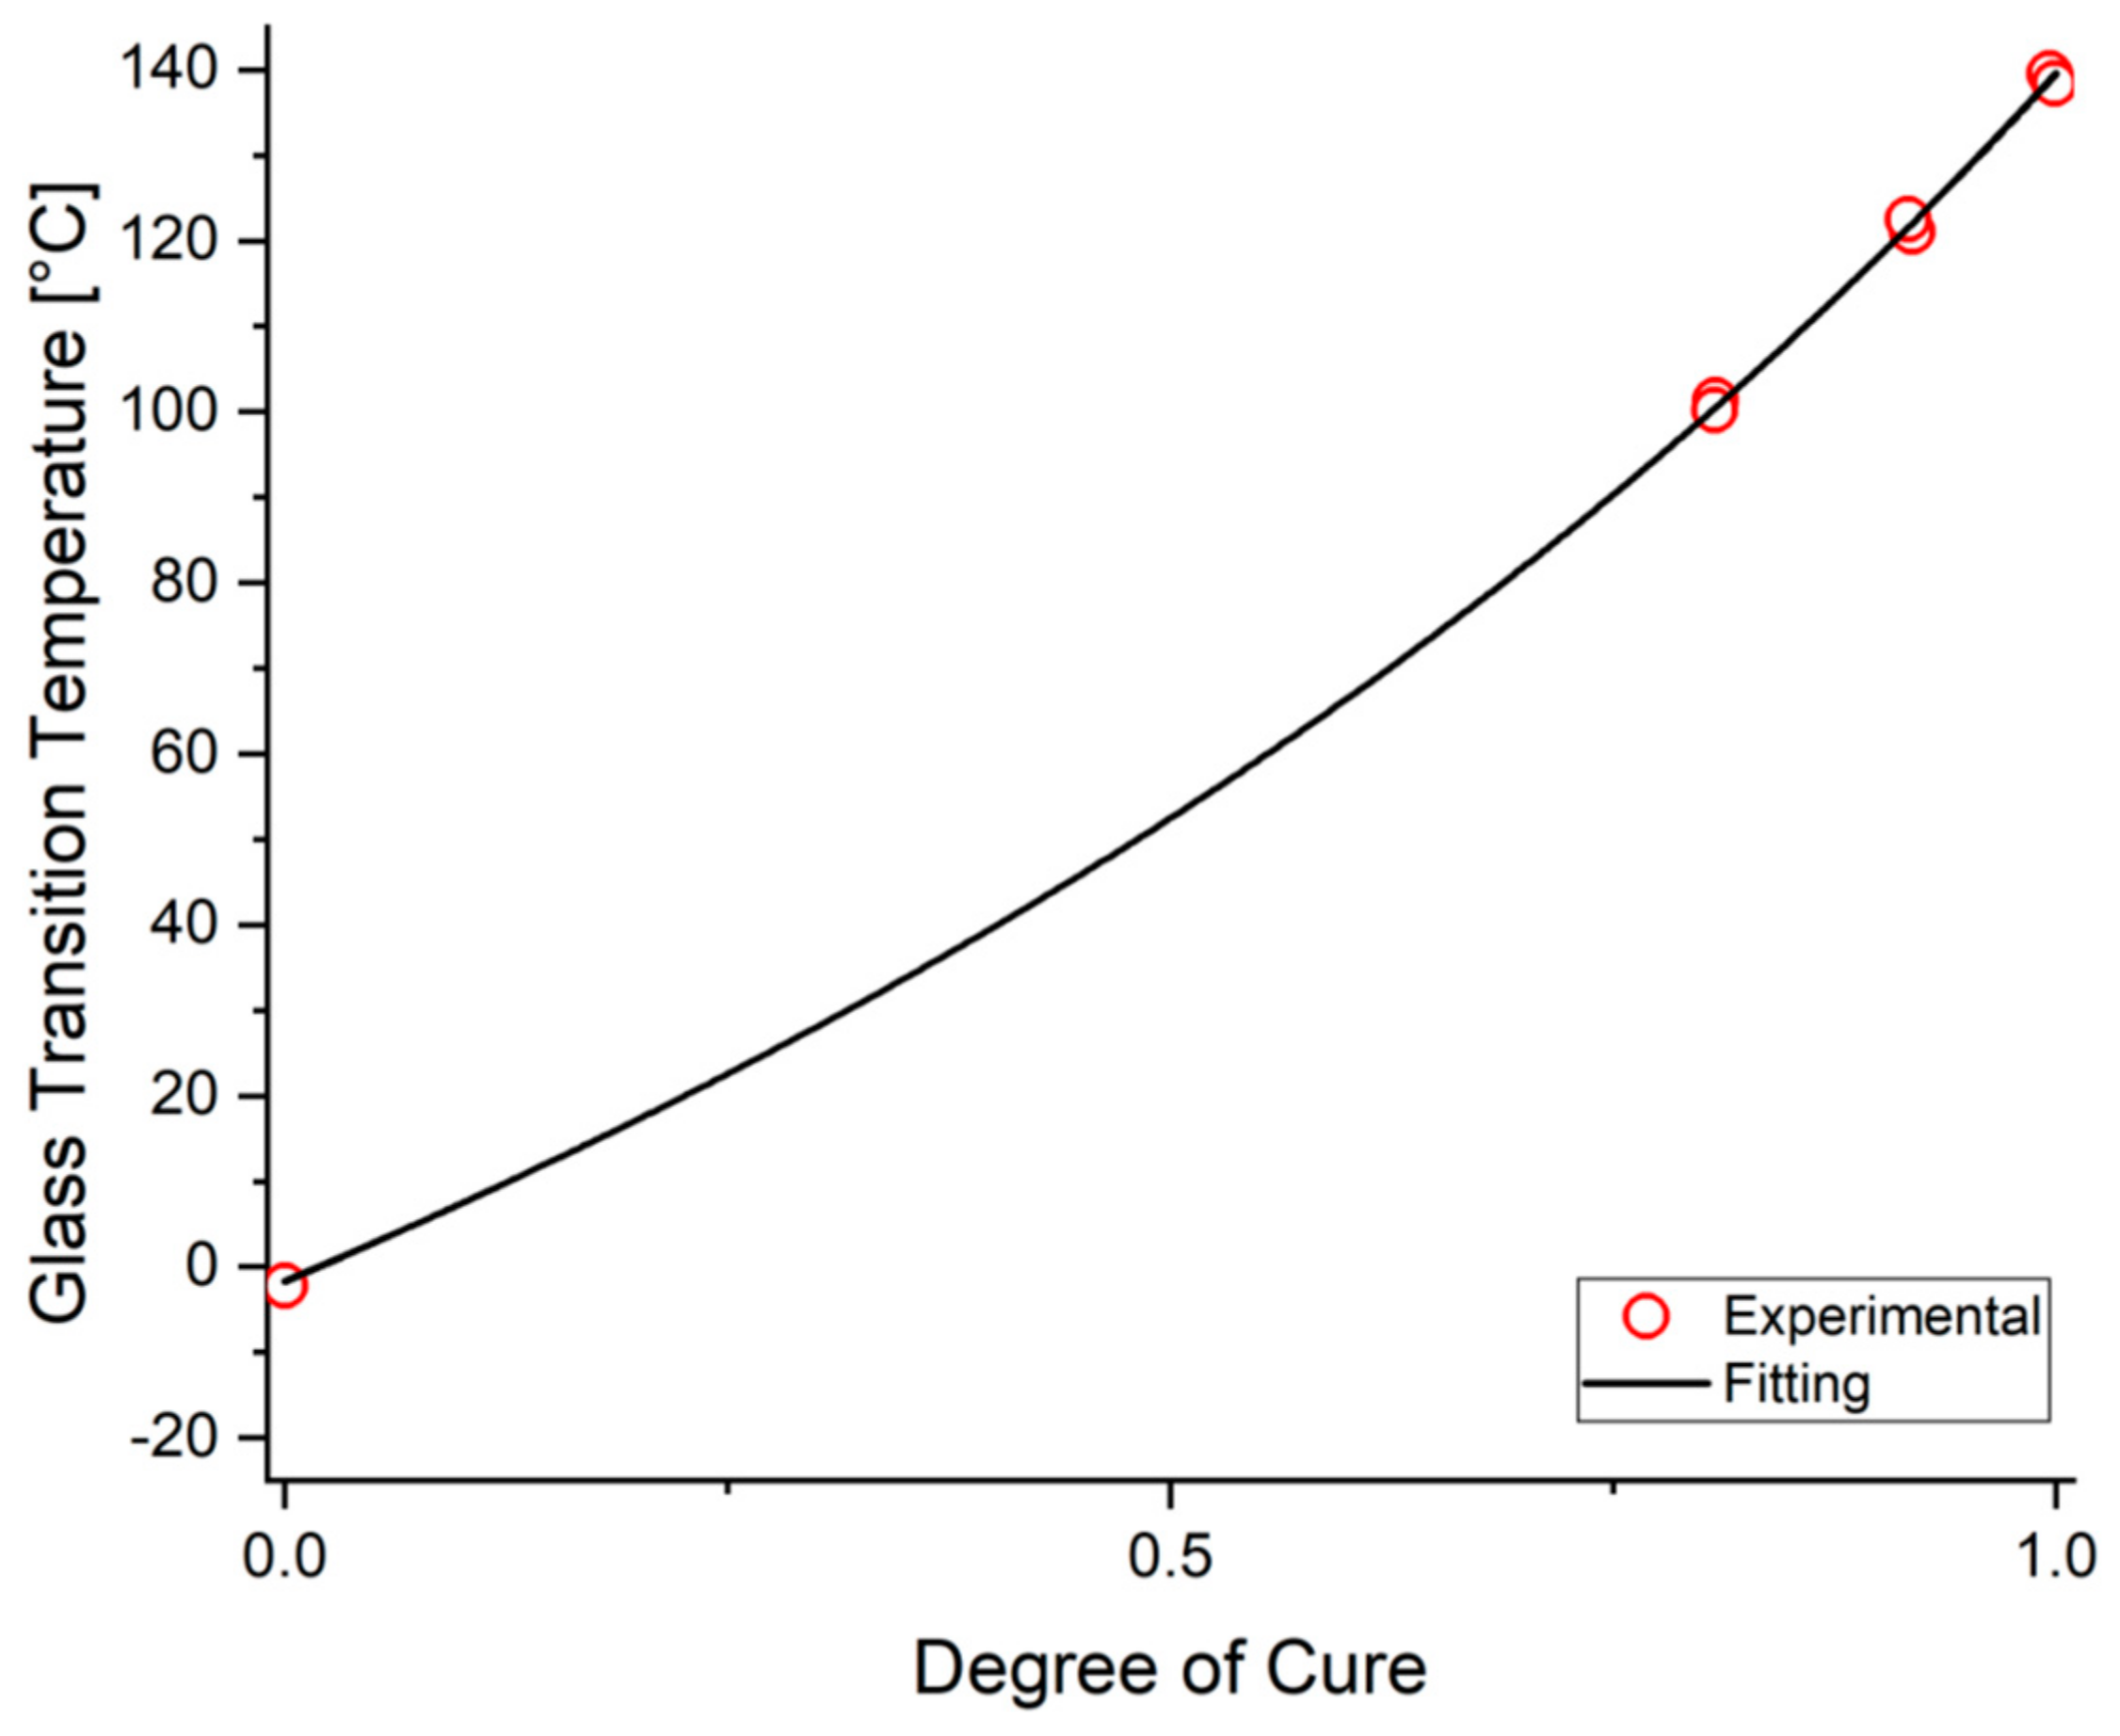
3.1.2. Glass Transition Temperature
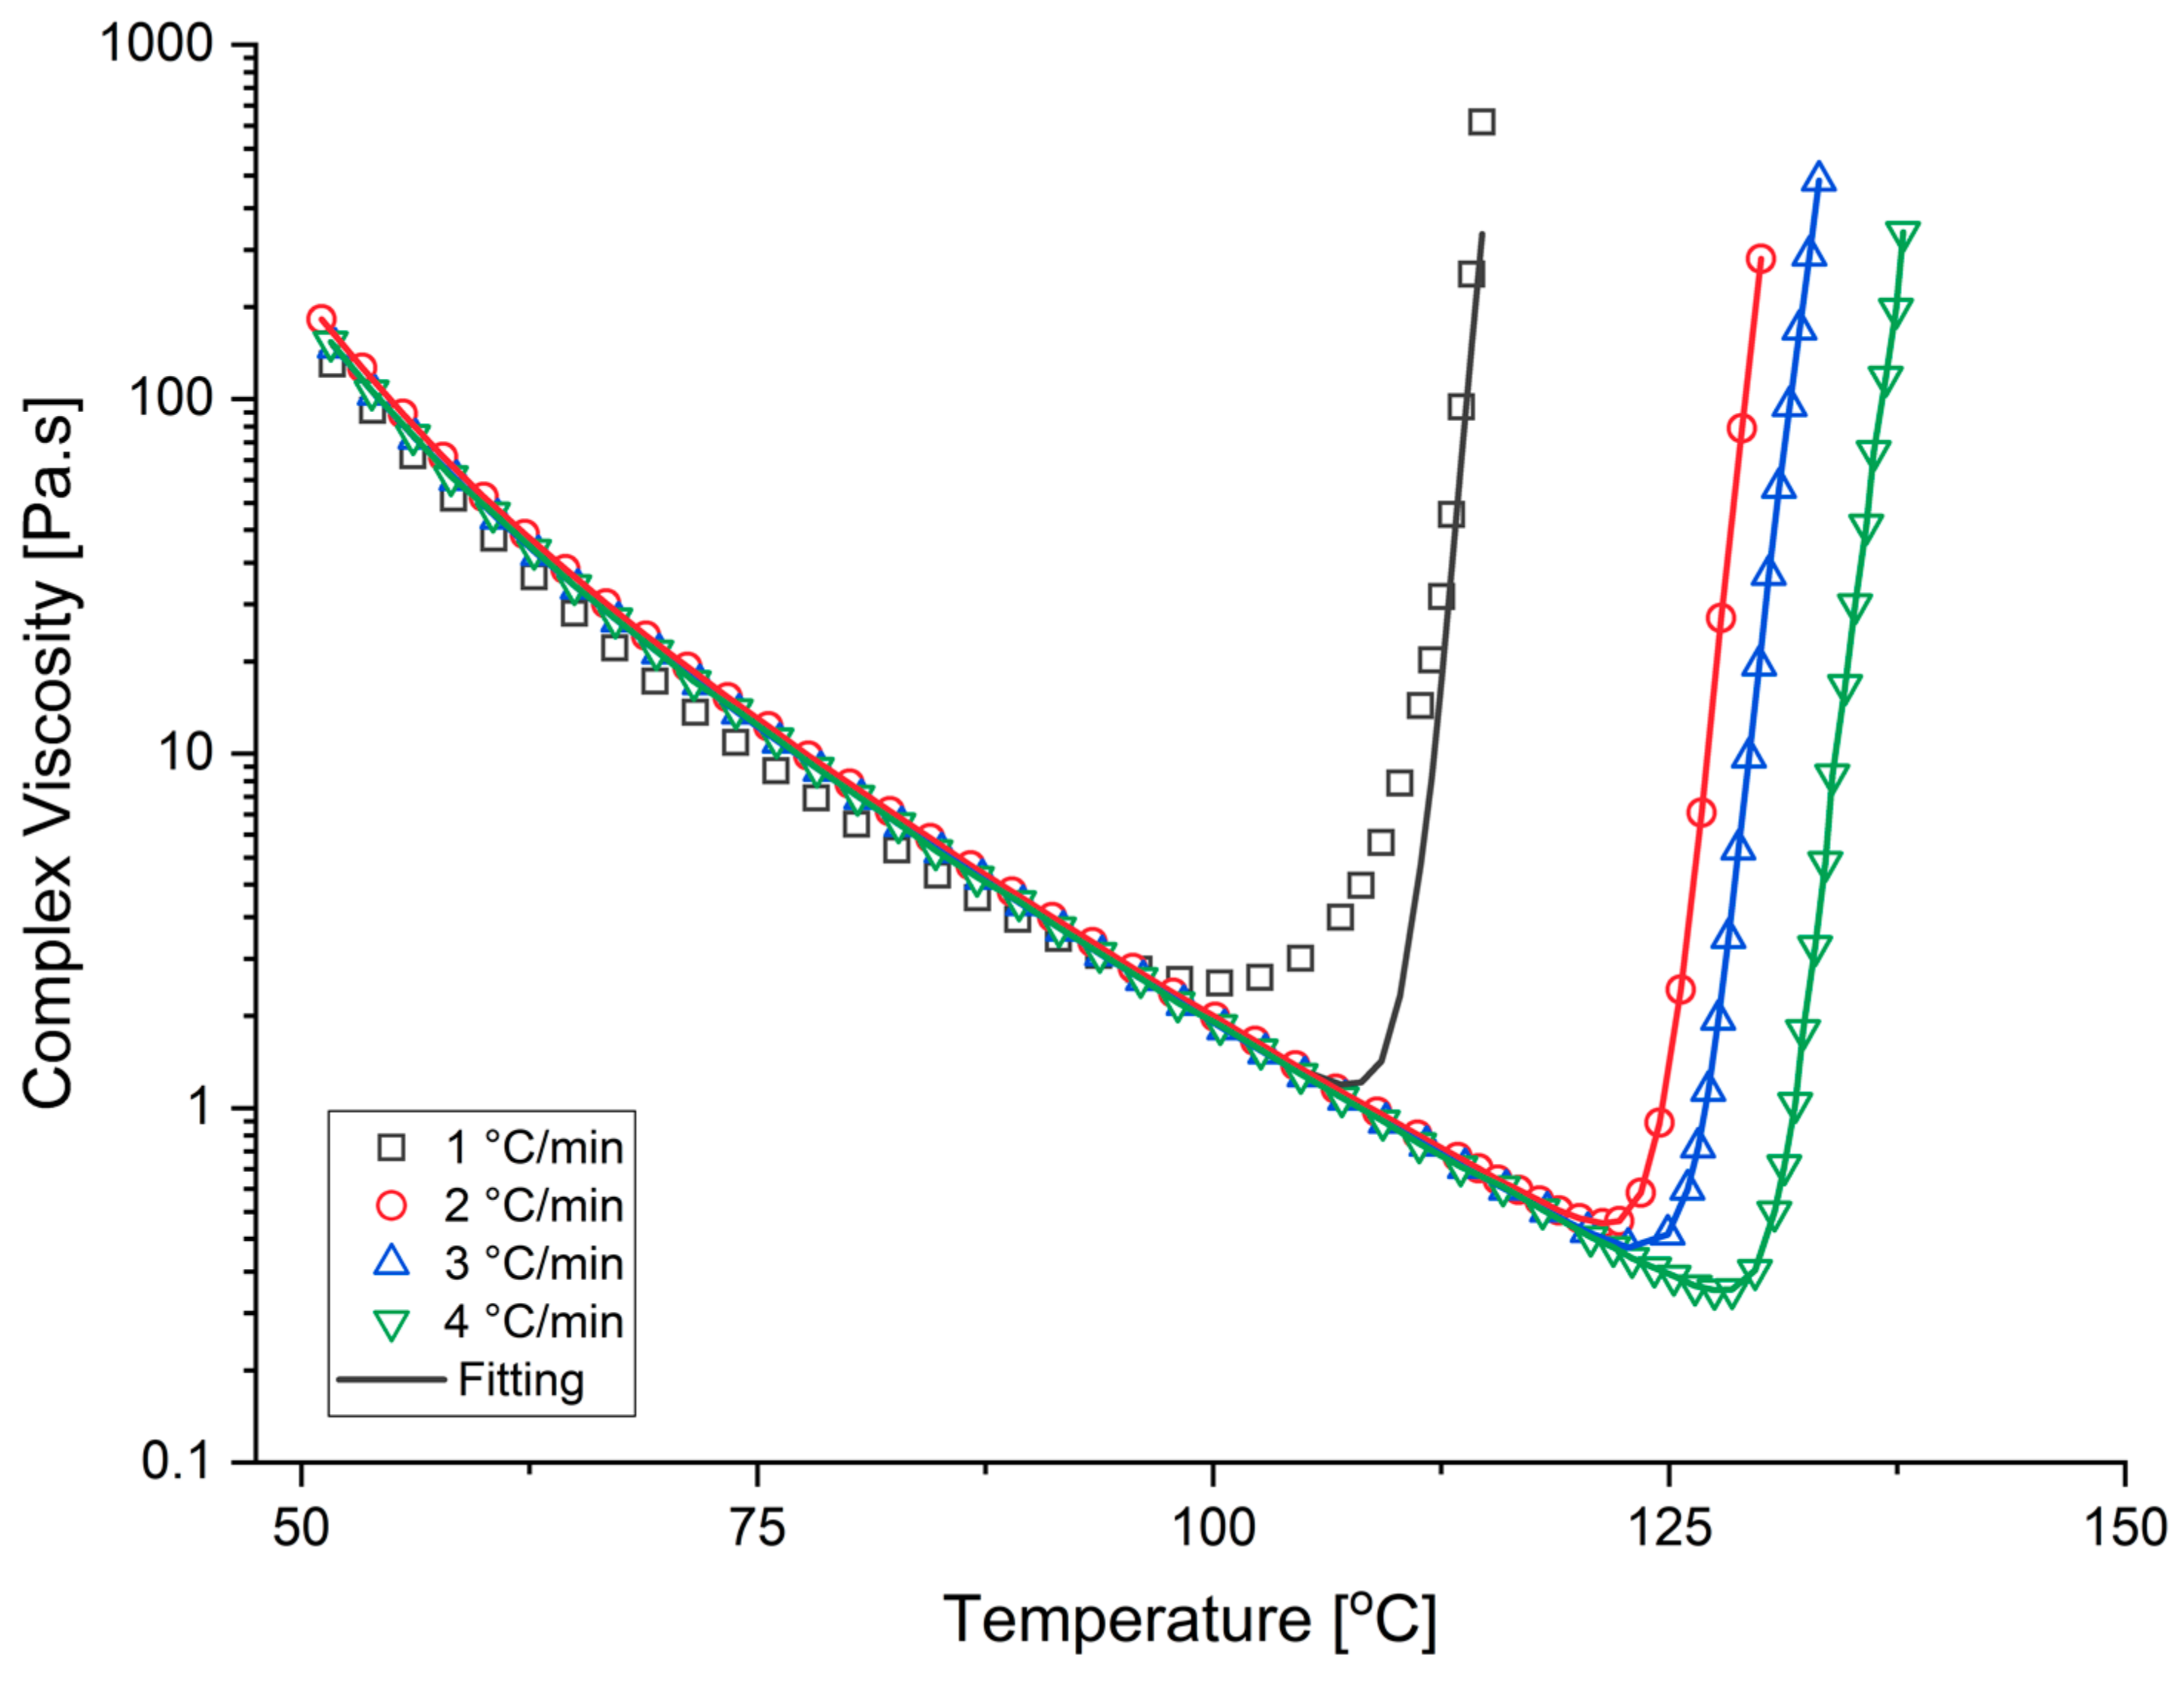
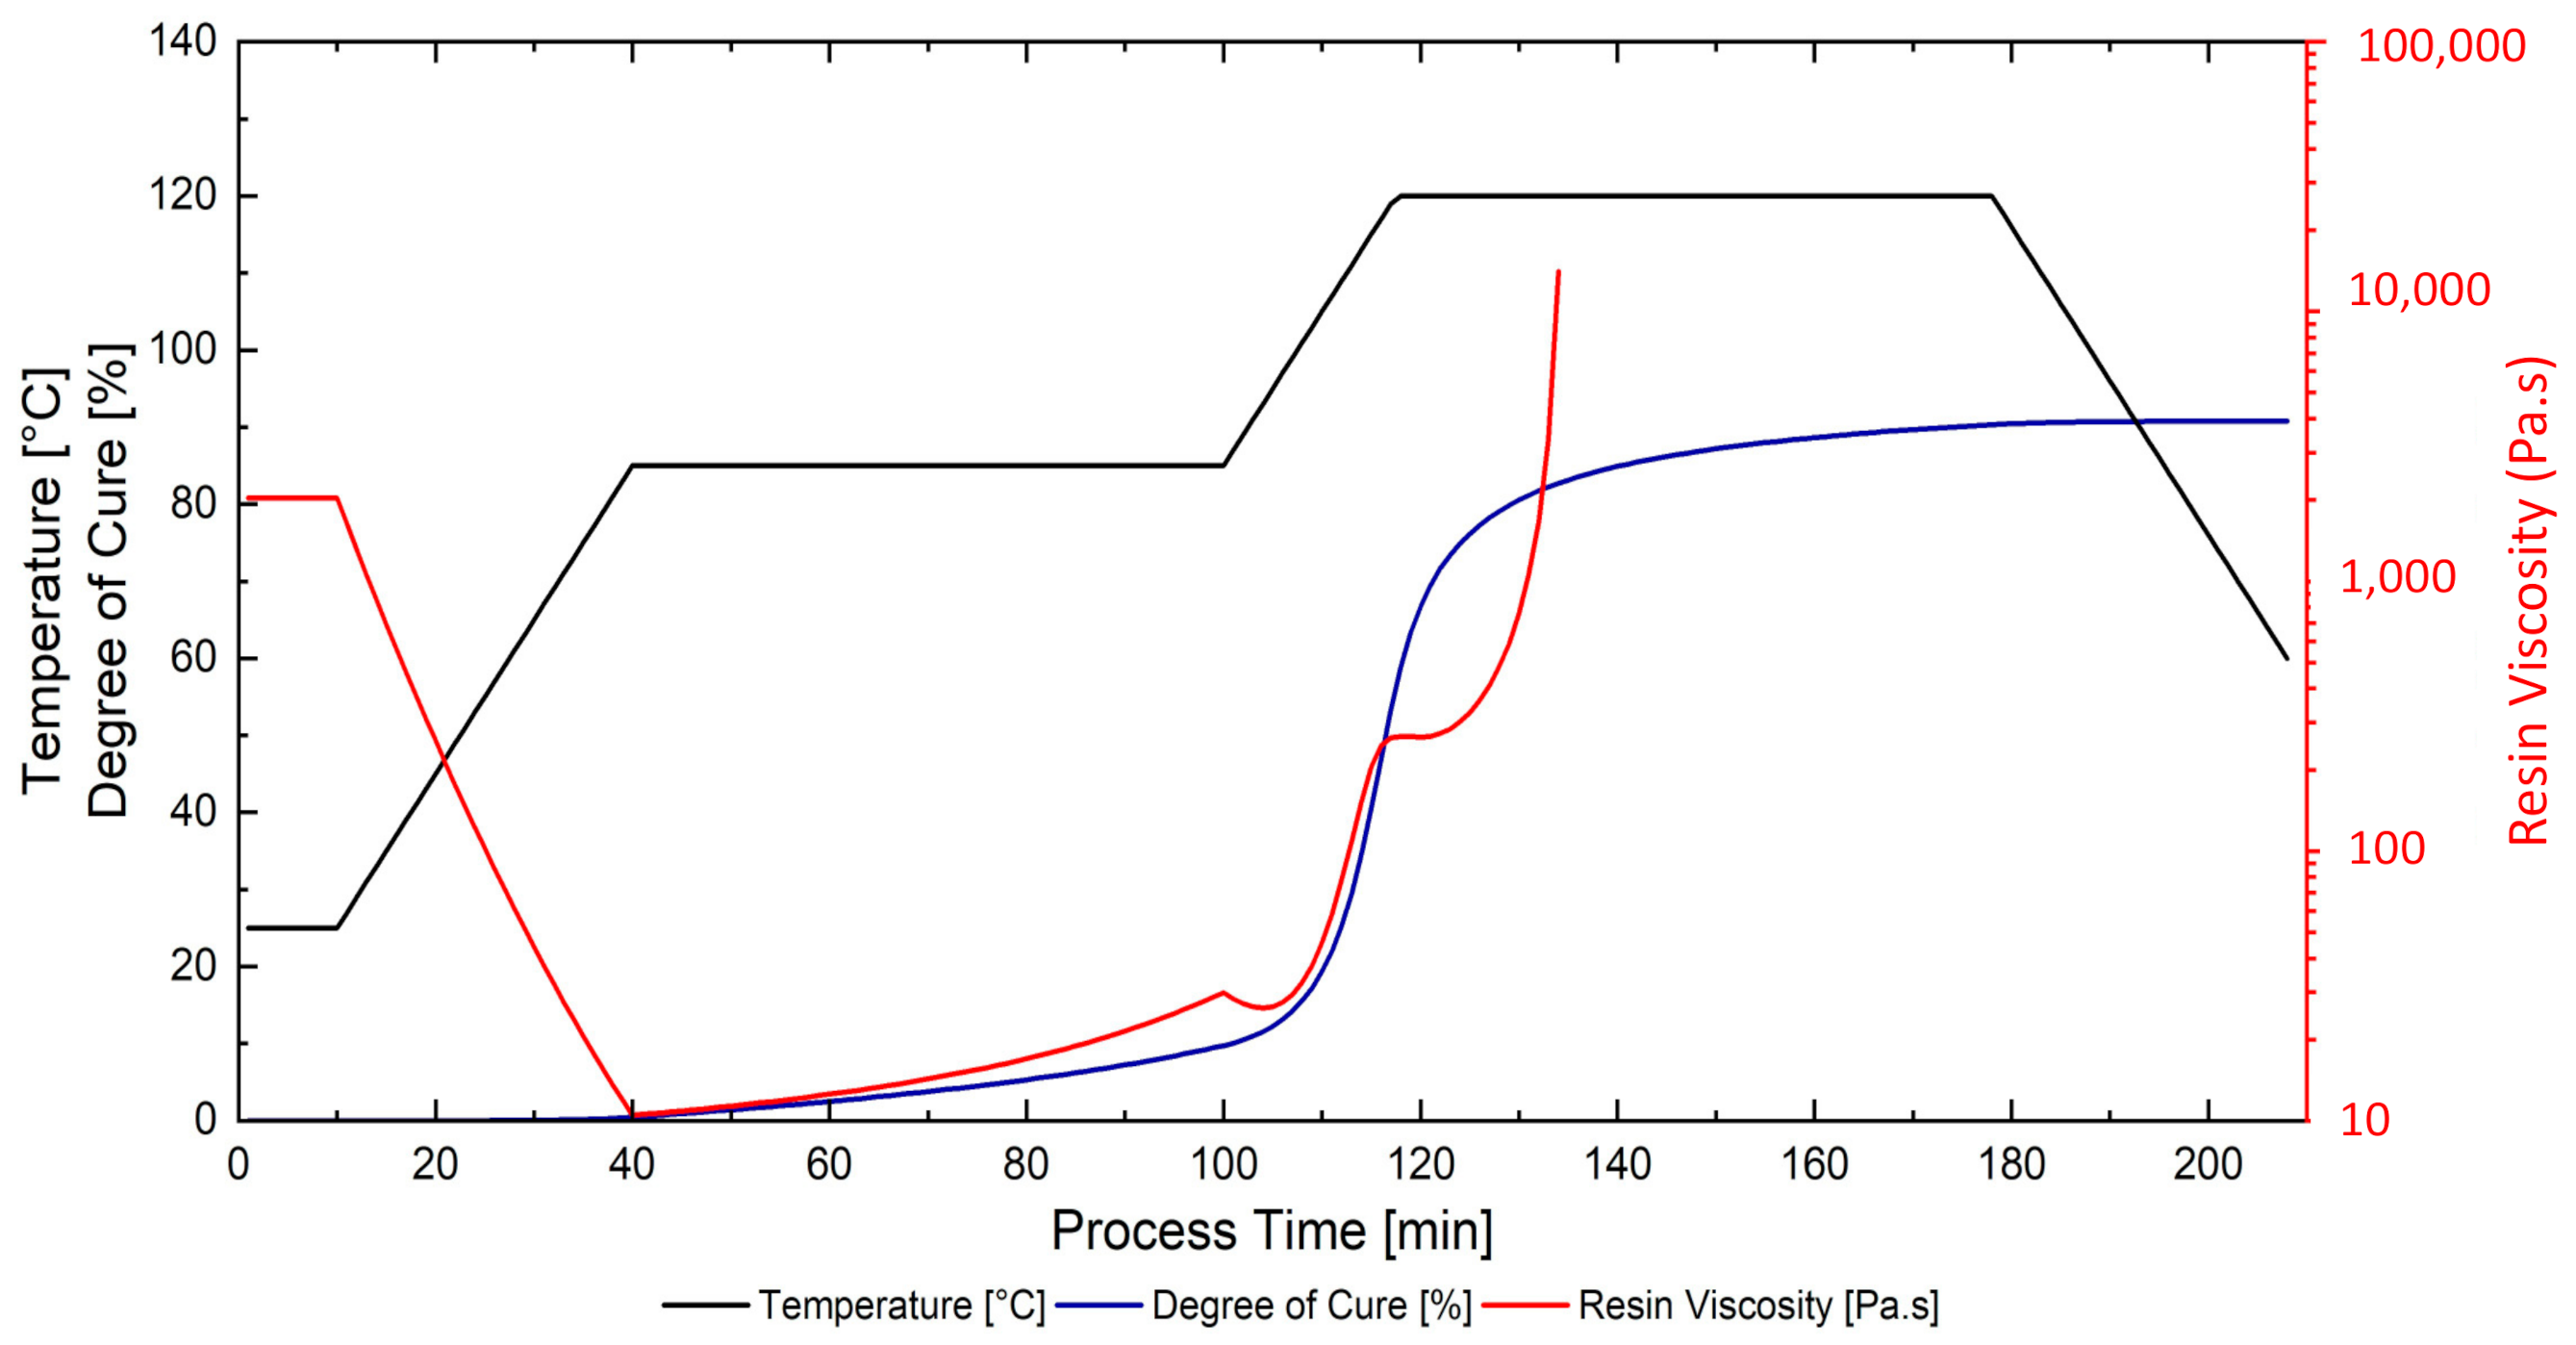
3.1.3. Viscosity
3.2. Fiber Architecture
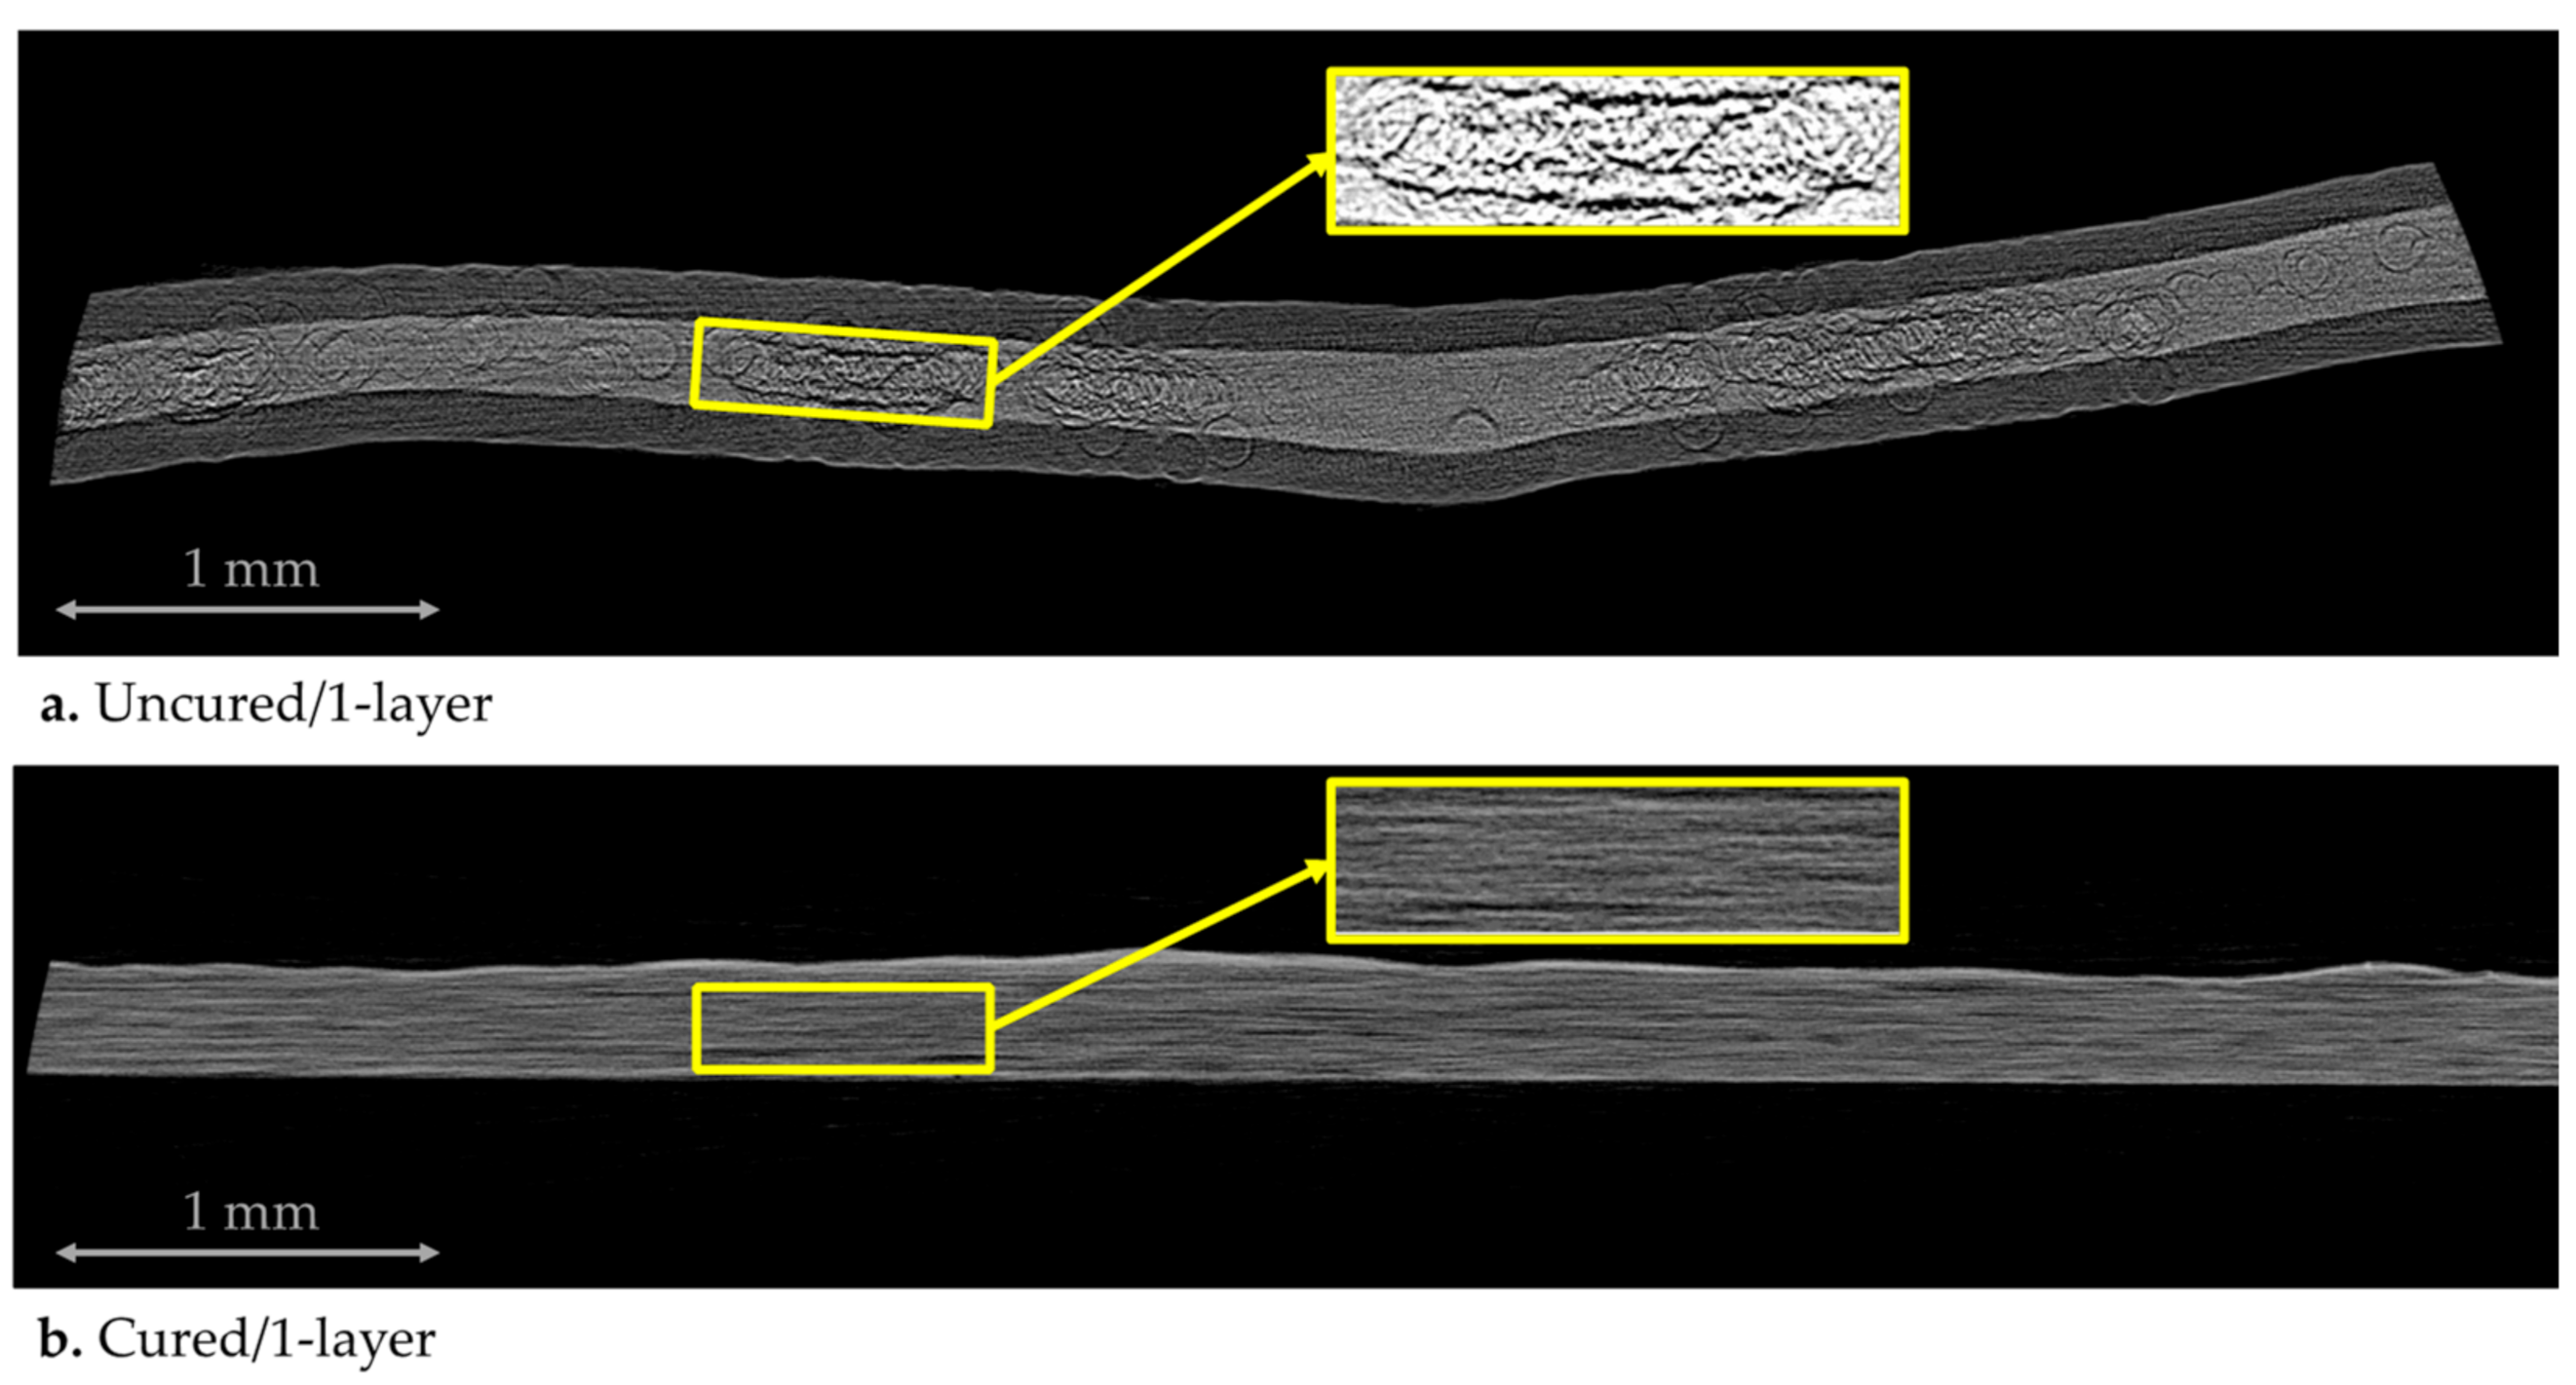
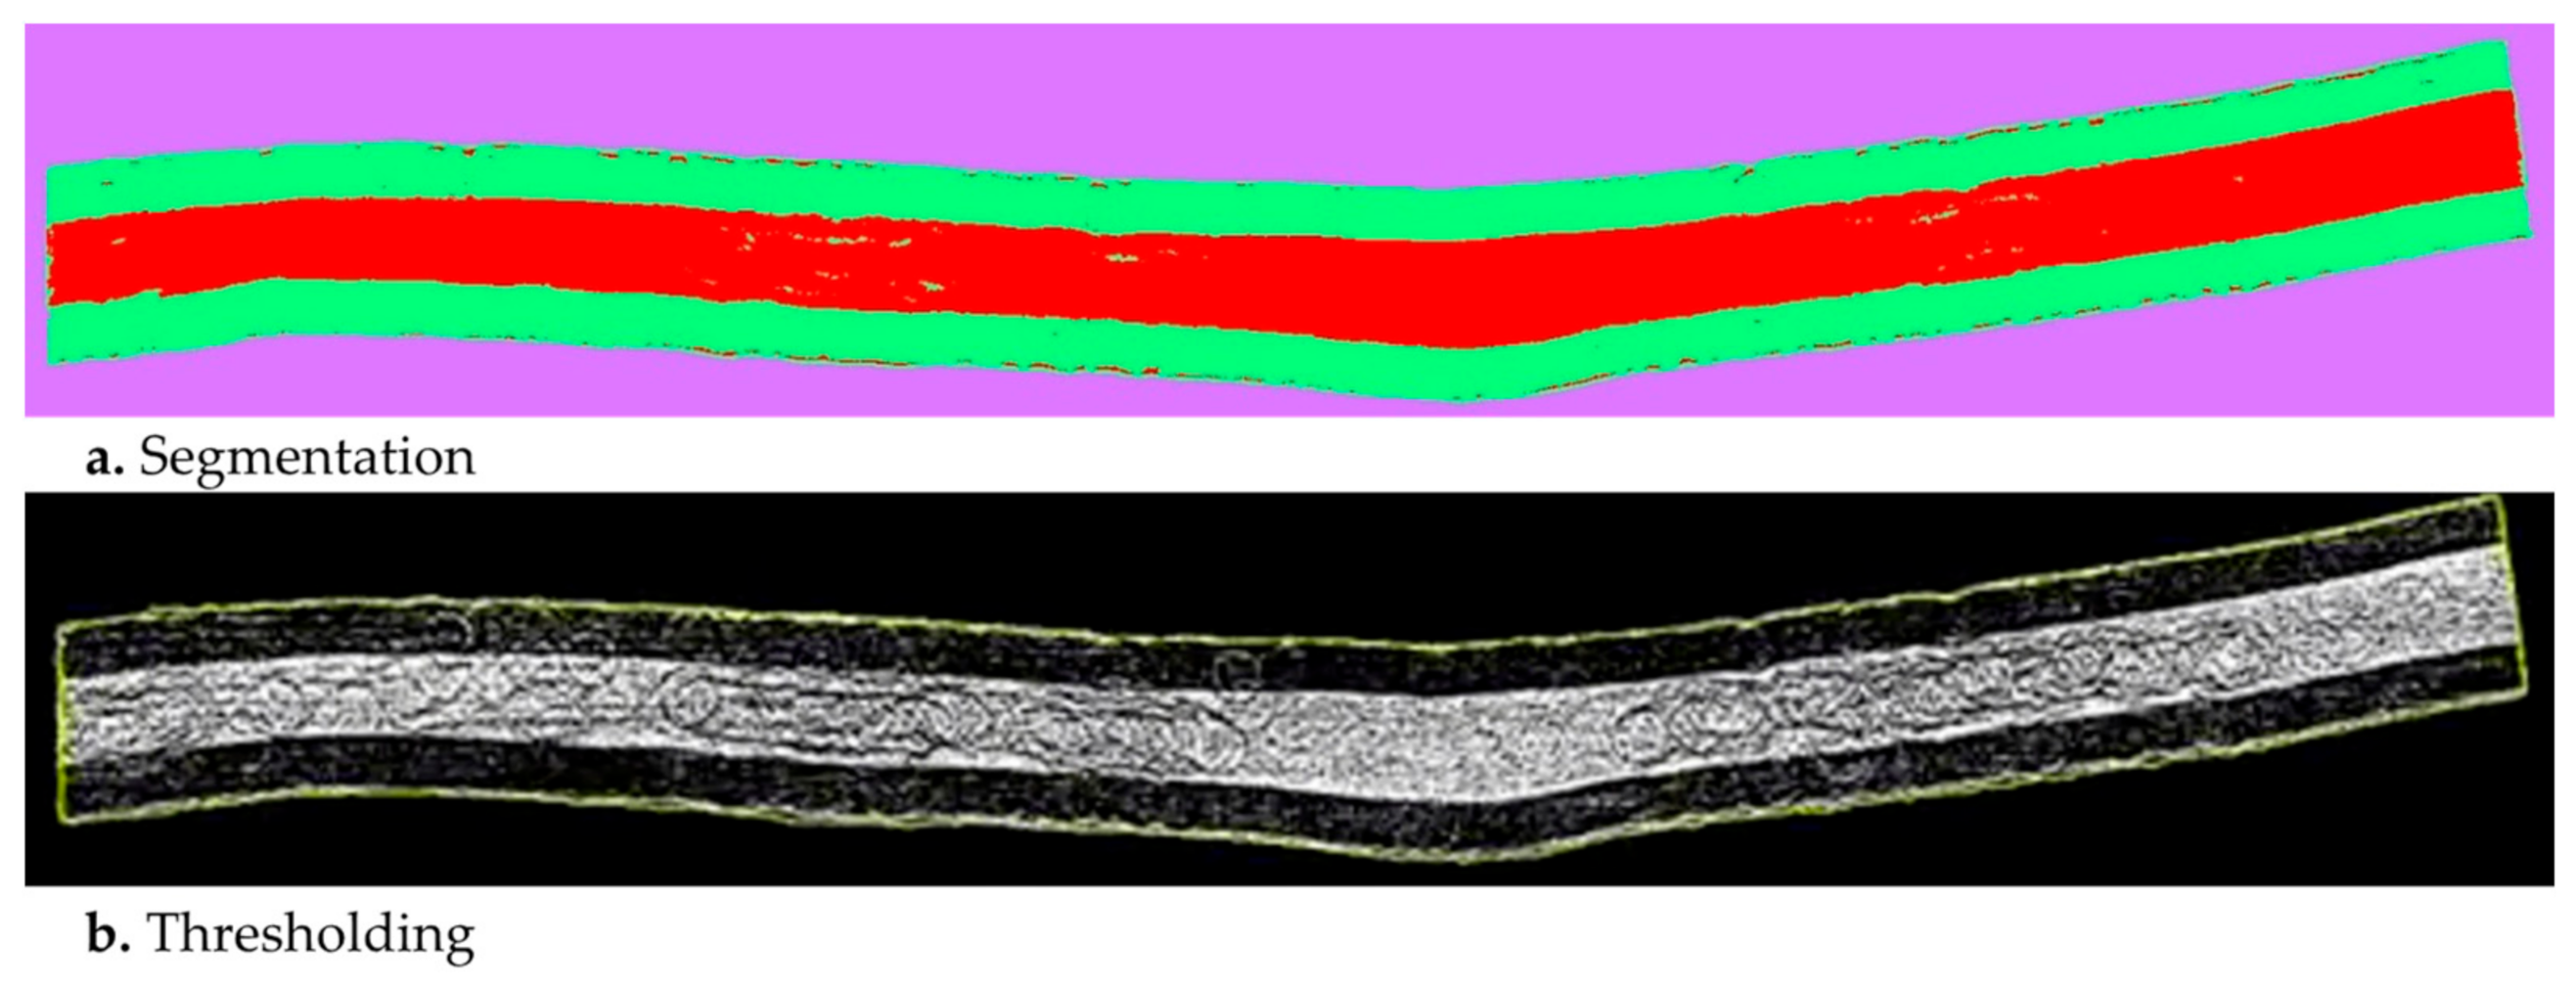
3.2.1. Micro-CT Analysis
3.2.2. Fiber Volume Fraction Measurements
3.2.3. Numerical Permeability Characterization
3.3. Thermal Behavior
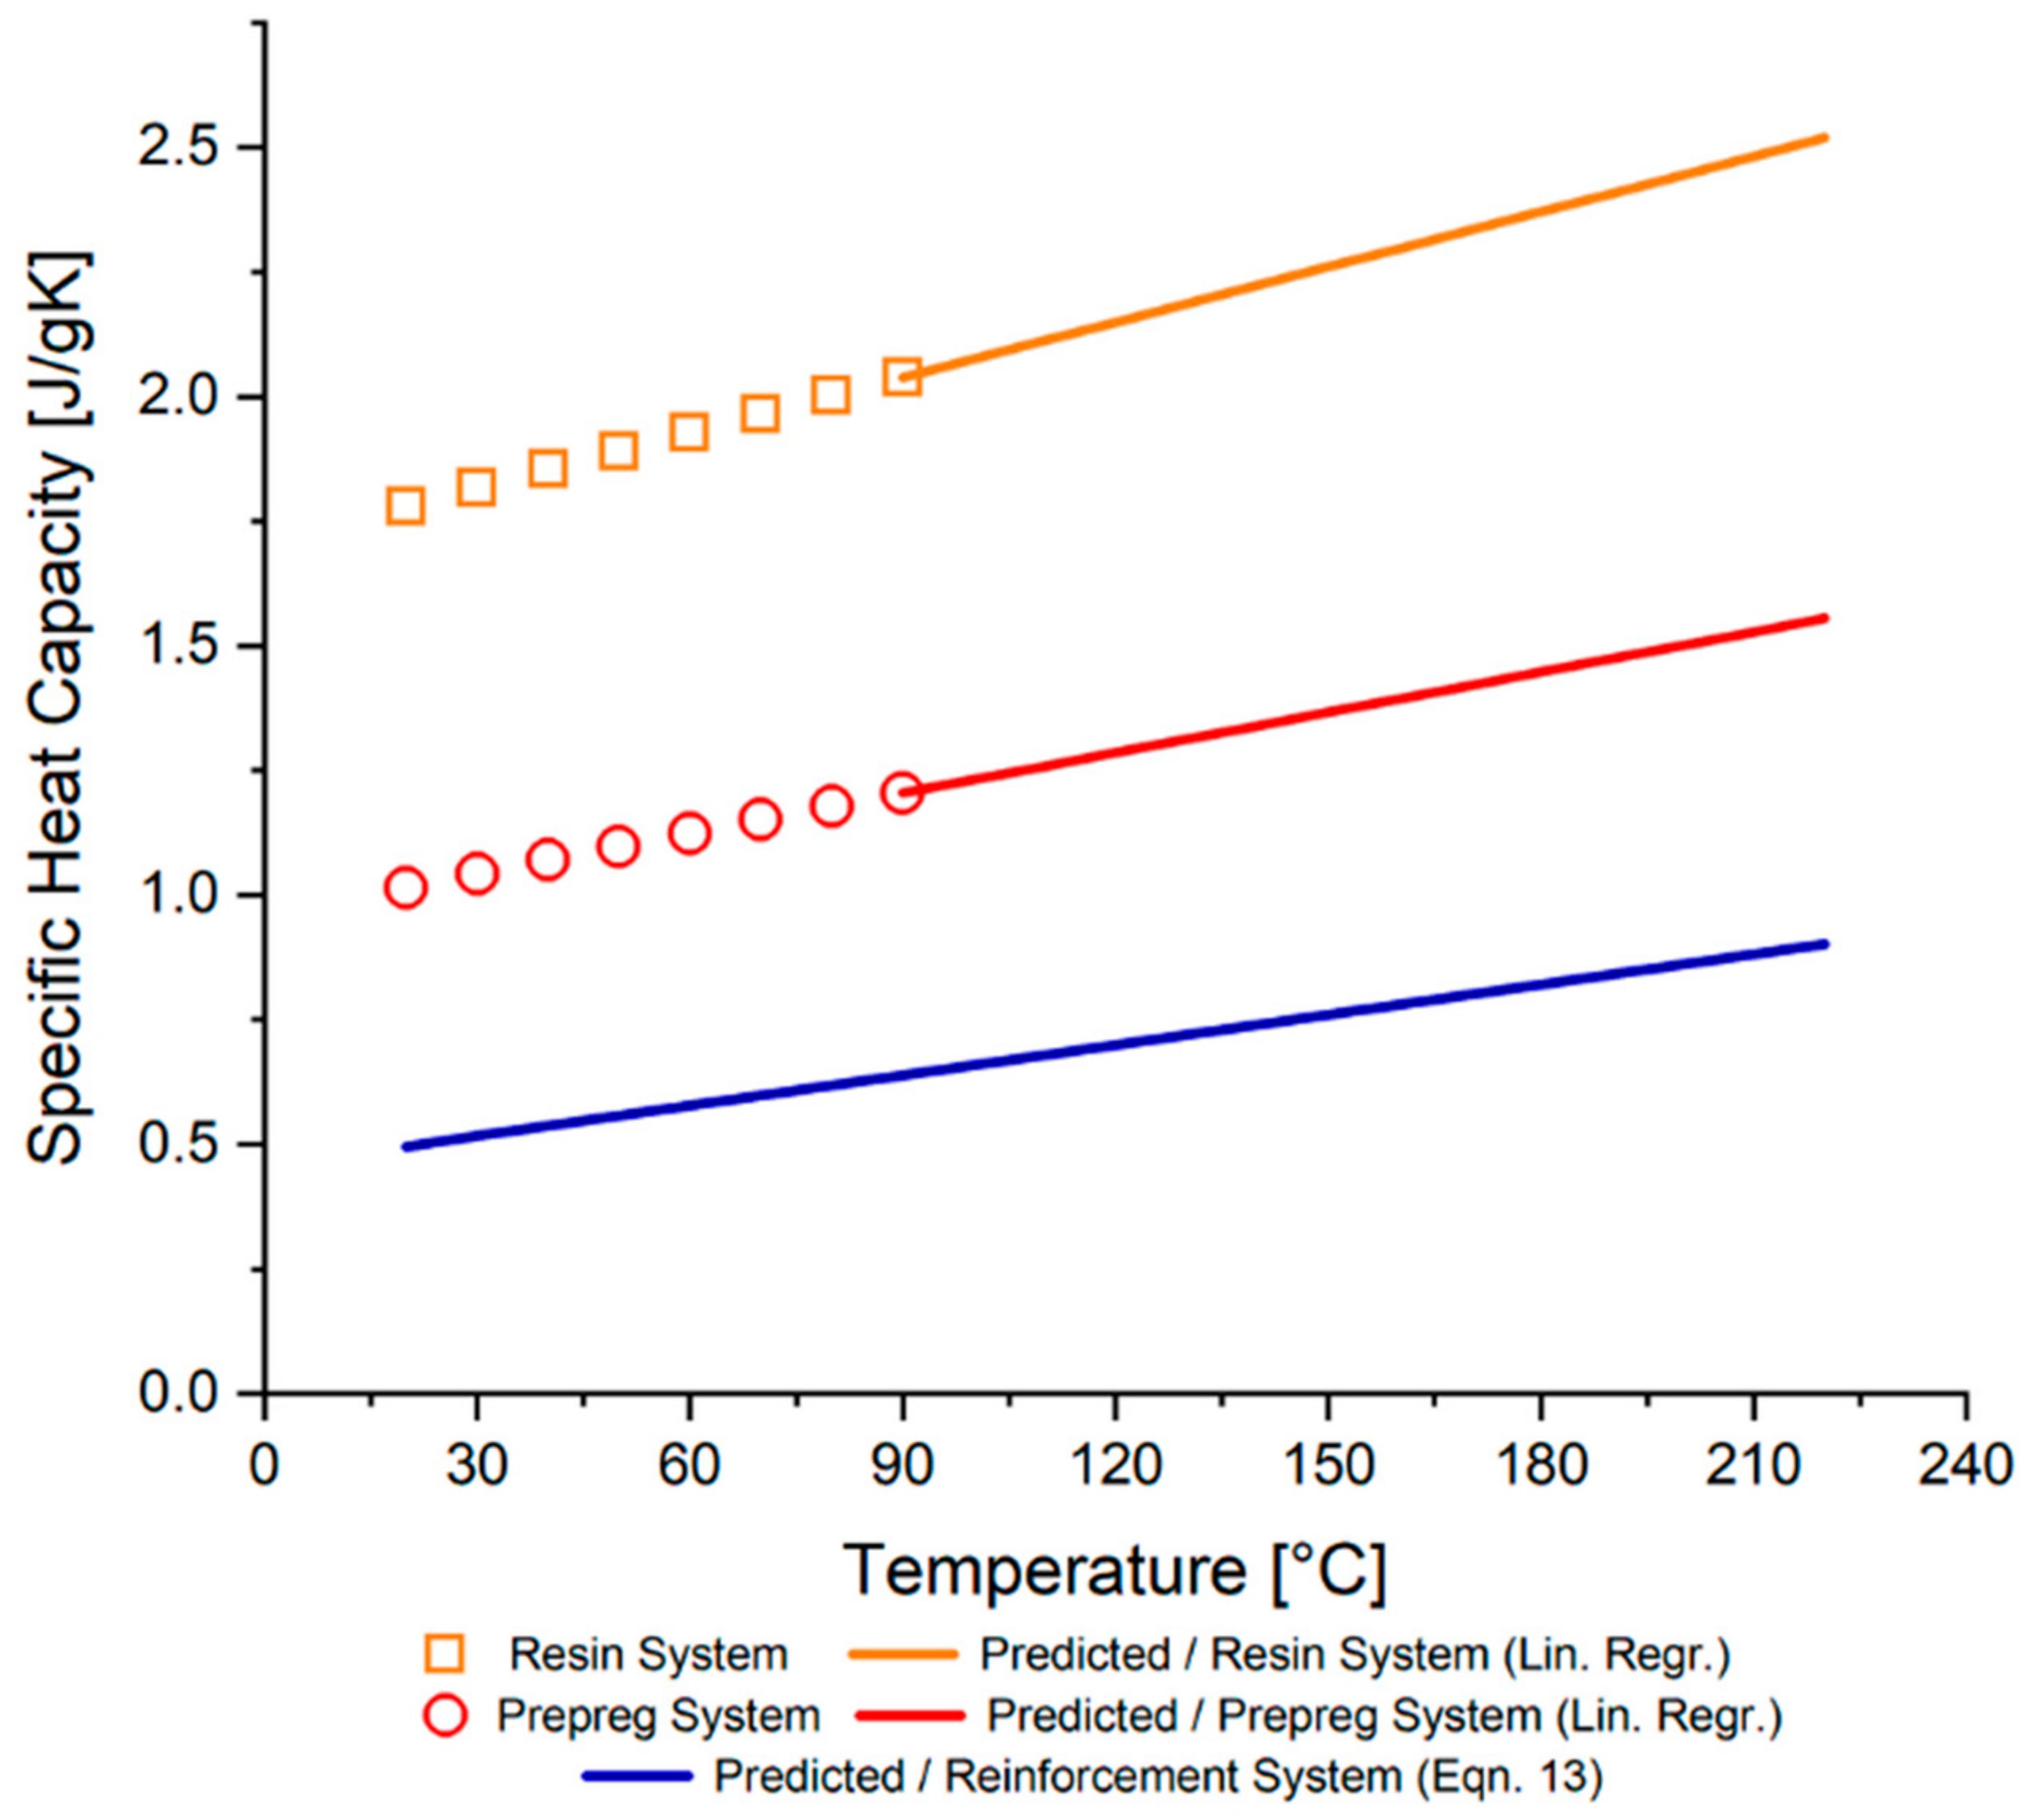
3.3.1. Specific Heat Capacity
3.3.2. Thermal Conductivity
4. Conclusions
Author Contributions
Funding
Institutional Review Board Statement
Informed Consent Statement
Data Availability Statement
Acknowledgments
Conflicts of Interest
References
- Campbell, F.C. Manufacturing Processes for Advanced Composites; Elsevier: Amsterdam, The Netherlands, 2003; pp. 1–517. [Google Scholar]
- Centea, T.; Grunenfelder, L.K.; Nutt, S.R. A review of out-of-autoclave prepregs–Material properties, process phenomena, and manufacturing considerations. Compos. Part A Appl. Sci. Manuf. 2015, 70, 132–154. [Google Scholar] [CrossRef]
- Grunenfelder, L.K.; Nutt, S.R. Void formation in composite prepregs–Effect of dissolved moisture. Compos. Sci. Technol. 2010, 70, 2304–2309. [Google Scholar] [CrossRef]
- Bernet, N.; Michaud, V.; Bourban, P.-E.; Månson, J.-A. Commingled yarn composites for rapid processing of complex shapes. Compos. Part A Appl. Sci. Manuf. 2001, 32, 1613–1626. [Google Scholar] [CrossRef]
- Liu, L.; Zhang, B.-M.; Wang, D.-F.; Wu, Z.-J. Effects of cure cycles on void content and mechanical properties of composite laminates. Compos. Struct. 2006, 73, 303–309. [Google Scholar] [CrossRef]
- Centea, T.; Hubert, P. Measuring the impregnation of an out-of-autoclave prepreg by micro-CT. Compos. Sci. Technol. 2011, 71, 593–599. [Google Scholar] [CrossRef]
- Kourkoutsaki, T.; Comas-Cardona, S.; Masania, K.; Upadhyay, R.K.; Hinterhölzl, R. A Process Modeling Toolkit Developed to Address Scale-Up Challenges of Out-of-Autoclave Manufacturing. Available online: https://www.researchgate.net/publication/286934688_A_process_modeling_toolkit_developed_to_address_scale-up_challenges_of_Out-of-Autoclave_manufacturing (accessed on 20 October 2021).
- Khoun, L.; Centea, T.; Hubert, P. Characterization Methodology of Thermoset Resins for the Processing of Composite Materials—Case Study: CYCOM 890RTM Epoxy Resin. J. Compos. Mater. 2010, 44, 1397–1415. [Google Scholar] [CrossRef]
- Kratz, J.; Hsiao, K.; Fernlund, G.; Hubert, P. Thermal models for MTM45-1 and Cycom 5320 out-of-autoclave prepreg resins. J. Compos. Mater. 2013, 47, 341–352. [Google Scholar] [CrossRef]
- Gangloff, J.; Cender, T.A.; Eskizeybek, V.; Simacek, P.; Advani, S.G. In Situ Flow Visualization of Void Migration during Out-of –Autoclave Thermoset Prepreg Processing. Available online: https://avesis.comu.edu.tr/yayin/0e89bffc-262a-4e1a-8a44-2bf733278094/in-situ-flow-visualization-of-void-migration-during-out-of-autoclave-thermoset-prepreg-processing (accessed on 20 October 2021).
- Gangloff, J.J.; Hwang, W.R.; Advani, S.G. Characterization of bubble mobility in channel flow with fibrous porous media walls. Int. J. Multiph. Flow 2014, 60, 76–86. [Google Scholar] [CrossRef]
- Gangloff, J.J.; Cender, T.A.; Eskizeybek, V.; Simacek, P.; Advani, S.G. Entrapment and venting of bubbles during vacuum bag prepreg processing. J. Compos. Mater. 2017, 51, 2757–2768. [Google Scholar] [CrossRef]
- Hwang, S.-S.; Park, S.Y.; Kwon, G.-C.; Choi, W.J. Cure kinetics and viscosity modeling for the optimization of cure cycles in a vacuum-bag-only prepreg process. Int. J. Adv. Manuf. Technol. 2018, 99, 2743–2753. [Google Scholar] [CrossRef]
- Cole, K.C.; Hechler, J.J.; Noel, D. A new approach to modeling the cure kinetics of epoxy/amine thermosetting resins. 2. Application to a typical system based on bis[4-(diglycidylamino)phenyl]methane and bis(4-aminophenyl) sulfone. Macromolecules 1991, 24, 3098–3110. [Google Scholar] [CrossRef] [Green Version]
- Kamal, M.R.; Sourour, S. Kinetics and thermal characterization of thermoset cure. Polym. Eng. Sci. 1973, 13, 59–64. [Google Scholar] [CrossRef]
- Centea, T.; Hubert, P. Modelling the effect of material properties and process parameters on tow impregnation in out-of-autoclave prepregs. Compos. Part A Appl. Sci. Manuf. 2012, 43, 1505–1513. [Google Scholar] [CrossRef]
- Grunenfelder, L.K.; Centea, T.; Hubert, P.; Nutt, S.R. Effect of room-temperature out-time on tow impregnation in an out-of-autoclave prepreg. Compos. Part A Appl. Sci. Manuf. 2013, 45, 119–126. [Google Scholar] [CrossRef]
- Shi, L. Heat Transfer in the Thick Thermoset Composites. Ph.D. Thesis, Delft University of Technology (TU Delft), Delft, The Netherlands, 2016. [Google Scholar]
- Weidenfeller, B.; Höfer, M.; Schilling, F.R. Thermal conductivity, thermal diffusivity, and specific heat capacity of particle filled polypropylene. Compos. Part A Appl. Sci. Manuf. 2004, 35, 423–429. [Google Scholar] [CrossRef]
- Kalogiannakis, G.; Van Hemelrijck, D.; Van Assche, G. Measurements of Thermal Properties of Carbon/Epoxy and Glass/Epoxy using Modulated Temperature Differential Scanning Calorimetry. J. Compos. Mater. 2004, 38, 163–175. [Google Scholar] [CrossRef]
- Helmus, R.; Hinterhölzl, R.; Hubert, P. A stochastic approach to model material variation determining tow impregnation in out-of-autoclave prepreg consolidation. Compos. Part A Appl. Sci. Manuf. 2015, 77, 293–300. [Google Scholar] [CrossRef]
- Centea, T.; Hubert, P. Out-of-autoclave prepreg consolidation under deficient pressure conditions. J. Compos. Mater. 2014, 48, 2033–2045. [Google Scholar] [CrossRef]
- Kordsa Technical Data Sheet–KCF12KUD300. Istanbul. Available online: https://composite.kordsa.com/en/images/pdf/product/OM12.pdf (accessed on 7 January 2021).
- Hubert, P.; Johnston, A.; Poursartip, A.; Nelson, K. Cure kinetics and Viscosity Models for Hexcel 8552 Epoxy Resin. Available online: https://www.researchgate.net/publication/283605150_Cure_kinetics_and_viscosity_models_for_Hexcel_8552_epoxy_resin (accessed on 20 October 2021).
- Castro, J.; Macosko, C. Kinetics and Rheology of Typical Polyurethane Reaction Injection Molding Systems. Soc. Plast. Eng. 1980, 38, 434–438. [Google Scholar]
- DiBenedetto, A.T. Prediction of the glass transition temperature of polymers: A model based on the principle of corresponding states. J. Polym. Sci. Part B Polym. Phys. 1987, 25, 1949–1969. [Google Scholar] [CrossRef]
- O’Brien, D.J.; White, S.R. Cure kinetics, gelation, and glass transition of a bisphenol F epoxide. Polym. Eng. Sci. 2003, 43, 863–874. [Google Scholar] [CrossRef]
- Torres, J.J.; Simmons, M.; Sket, F.; González, C. An analysis of void formation mechanisms in out-of-autoclave prepregs by means of X-ray computed tomography. Compos. Part A Appl. Sci. Manuf. 2019, 117, 230–242. [Google Scholar] [CrossRef]
- Karaki, M.; Hallal, A.; Younes, R.; Trochu, F.; Lafon, P.; Hayek, A.; Kobaissy, A.A.-H.; Fayad, A. A Comparative Analytical, Numerical and Experimental Analysis of the Microscopic Permeability of Fiber Bundles in Composite Materials. Int. J. Compos. Mater. 2017, 7, 82–102. [Google Scholar]
- Ali, M.A.; Umer, R.; Khan, K.A. A virtual permeability measurement framework for fiber reinforcements using micro CT generated digital twins. Int. J. Light. Mater. Manuf. 2020, 3, 204–216. [Google Scholar] [CrossRef]
- Naresh, K.; Khan, K.A.; Umer, R.; Cantwell, W.J. The use of X-ray computed tomography for design and process modeling of aerospace composites: A review. Mater. Des. 2020, 190, 108553. [Google Scholar] [CrossRef]
- Straumit, I.; Hahn, C.; Winterstein, E.; Plank, B.; Lomov, S.V.; Wevers, M. Computation of permeability of a non-crimp carbon textile reinforcement based on X-ray computed tomography images. Compos. Part A Appl. Sci. Manuf. 2016, 81, 289–295. [Google Scholar] [CrossRef]
- Sas, H.S.; Abu-Obaid, A.; Simacek, P.; Gillespie, J.W., Jr.; Advani, S.G. Thermoset Pultrusion Process: Modeling and Experimental Characterization. In Proceedings of the CAMX–The Composites and Advanced Materials Expo, Orlando, FL, USA, 13 October 2014. [Google Scholar]
- Amico, S.; Lekakou, C. Mathematical modelling of capillary micro-flow through woven fabrics. Compos. Part A Appl. Sci. Manuf. 2000, 31, 1331–1344. [Google Scholar] [CrossRef]
- Parker, M.J. Test Methods for Physical Properties. In Comprehensive Composite Materials; Elsevier: Amsterdam, The Netherlands, 2000; pp. 183–226. [Google Scholar]
- Tekce, H.S.; Kumlutas, D.; Tavman, I.H. Effect of Particle Shape on Thermal Conductivity of Copper Reinforced Polymer Composites. J. Reinf. Plast. Compos. 2007, 26, 113–121. [Google Scholar] [CrossRef]
- Springer, G.S.; Tsai, S.W. Thermal Conductivities of Unidirectional Materials. J. Compos. Mater. 1967, 1, 166–173. [Google Scholar] [CrossRef]


| Model Parameters | Units | Value |
|---|---|---|
| Heat of Reaction () | J/g | |
| Pre-exponential cure rate coefficient of reaction I (A1) | ||
| Activation energy of reaction I (EA1) | J/mol | |
| Pre-exponential cure rate coefficient of reaction II (A2) | ||
| Activation energy of reaction II (EA2) | J/mol | |
| First exponential constant (m1) | - | |
| Second exponential constant (m2) | - | |
| Third exponential constant (n1) | - | |
| Fourth exponential constant (n2) | - | |
| Diffusion Constant (D) | - | |
| Critical degree of cure at absolute zero temperature (αC0) | - | |
| Increase in critical resin degree of cure with temperature (αCT) |
| Final Parameters | Units | Value |
|---|---|---|
| °C | ||
| °C | ||
| - |
| Model Parameters | Units | Value |
|---|---|---|
| Pre-exponential viscosity coefficient I () | ||
| Activation energy of reaction I () | ||
| Pre-exponential viscosity coefficient II () | ||
| Activation energy of reaction II () | ||
| First exponential constant () | - | |
| Second exponential constant () | - | |
| Third exponential constant () | - | |
| Degree of cure at gel point () | - |
| Parameter | Unit | Value |
|---|---|---|
| Filter | - | None |
| X-ray voltage | kV | 62 |
| X-ray intensity | µA | 161 |
| Resolution | µm/pixel | 1.75–3 |
| Image size | pixels | 4000 × 2096 |
| Parameters\Samples | Uncured/1-Layer | Cured/1-Layer |
|---|---|---|
| Void content (%) | 17.60 | 0.88 |
| Average ply thickness (mm) | 0.5 (0.125 for each resin film and 0.25 for dry fiber bed) | 0.30 |
| Fiber volume fraction (%) | 33.5 (micro-CT) 31.4 (Soxhlet) | 67.59 |
| Parameter | Value |
|---|---|
| Viscosity, | |
| Fiber orientation | Hexagonal packing |
| Fiber diameter | |
| Unit cell dimensions | |
| Cylinder boundary conditions | No-slip () |
| Outer boundary conditions (left–right) | Slip () |
| Pressure drop (top–bottom) |
| Samples/Parameters | Ambient Temperature (°C) | (W/mK) | (W/mK) |
|---|---|---|---|
| KOM12 Prepreg System | 25 | 5.5444 | 0.44439 |
| 60 | 6.5199 | 0.41319 | |
| OM12 Epoxy Resin System | 25 | 0.1934 | |
| 60 | 0.1549 | ||
Publisher’s Note: MDPI stays neutral with regard to jurisdictional claims in published maps and institutional affiliations. |
© 2022 by the authors. Licensee MDPI, Basel, Switzerland. This article is an open access article distributed under the terms and conditions of the Creative Commons Attribution (CC BY) license (https://creativecommons.org/licenses/by/4.0/).
Share and Cite
Arikan, M.H.; Eroglu, F.; Eskizeybek, V.; Sukur, E.F.; Yildiz, M.; Sas, H.S. A Systematic Characterization Approach for Vacuum Bag Only Prepregs towards an Accurate Process Design. Materials 2022, 15, 451. https://doi.org/10.3390/ma15020451
Arikan MH, Eroglu F, Eskizeybek V, Sukur EF, Yildiz M, Sas HS. A Systematic Characterization Approach for Vacuum Bag Only Prepregs towards an Accurate Process Design. Materials. 2022; 15(2):451. https://doi.org/10.3390/ma15020451
Chicago/Turabian StyleArikan, Muhammed H., Fatih Eroglu, Volkan Eskizeybek, Emine Feyza Sukur, Mehmet Yildiz, and Hatice S. Sas. 2022. "A Systematic Characterization Approach for Vacuum Bag Only Prepregs towards an Accurate Process Design" Materials 15, no. 2: 451. https://doi.org/10.3390/ma15020451
APA StyleArikan, M. H., Eroglu, F., Eskizeybek, V., Sukur, E. F., Yildiz, M., & Sas, H. S. (2022). A Systematic Characterization Approach for Vacuum Bag Only Prepregs towards an Accurate Process Design. Materials, 15(2), 451. https://doi.org/10.3390/ma15020451