
Rheological Characterization and Accumulation Tests for Strong Thixotropic Engineering Slurry


Abstract
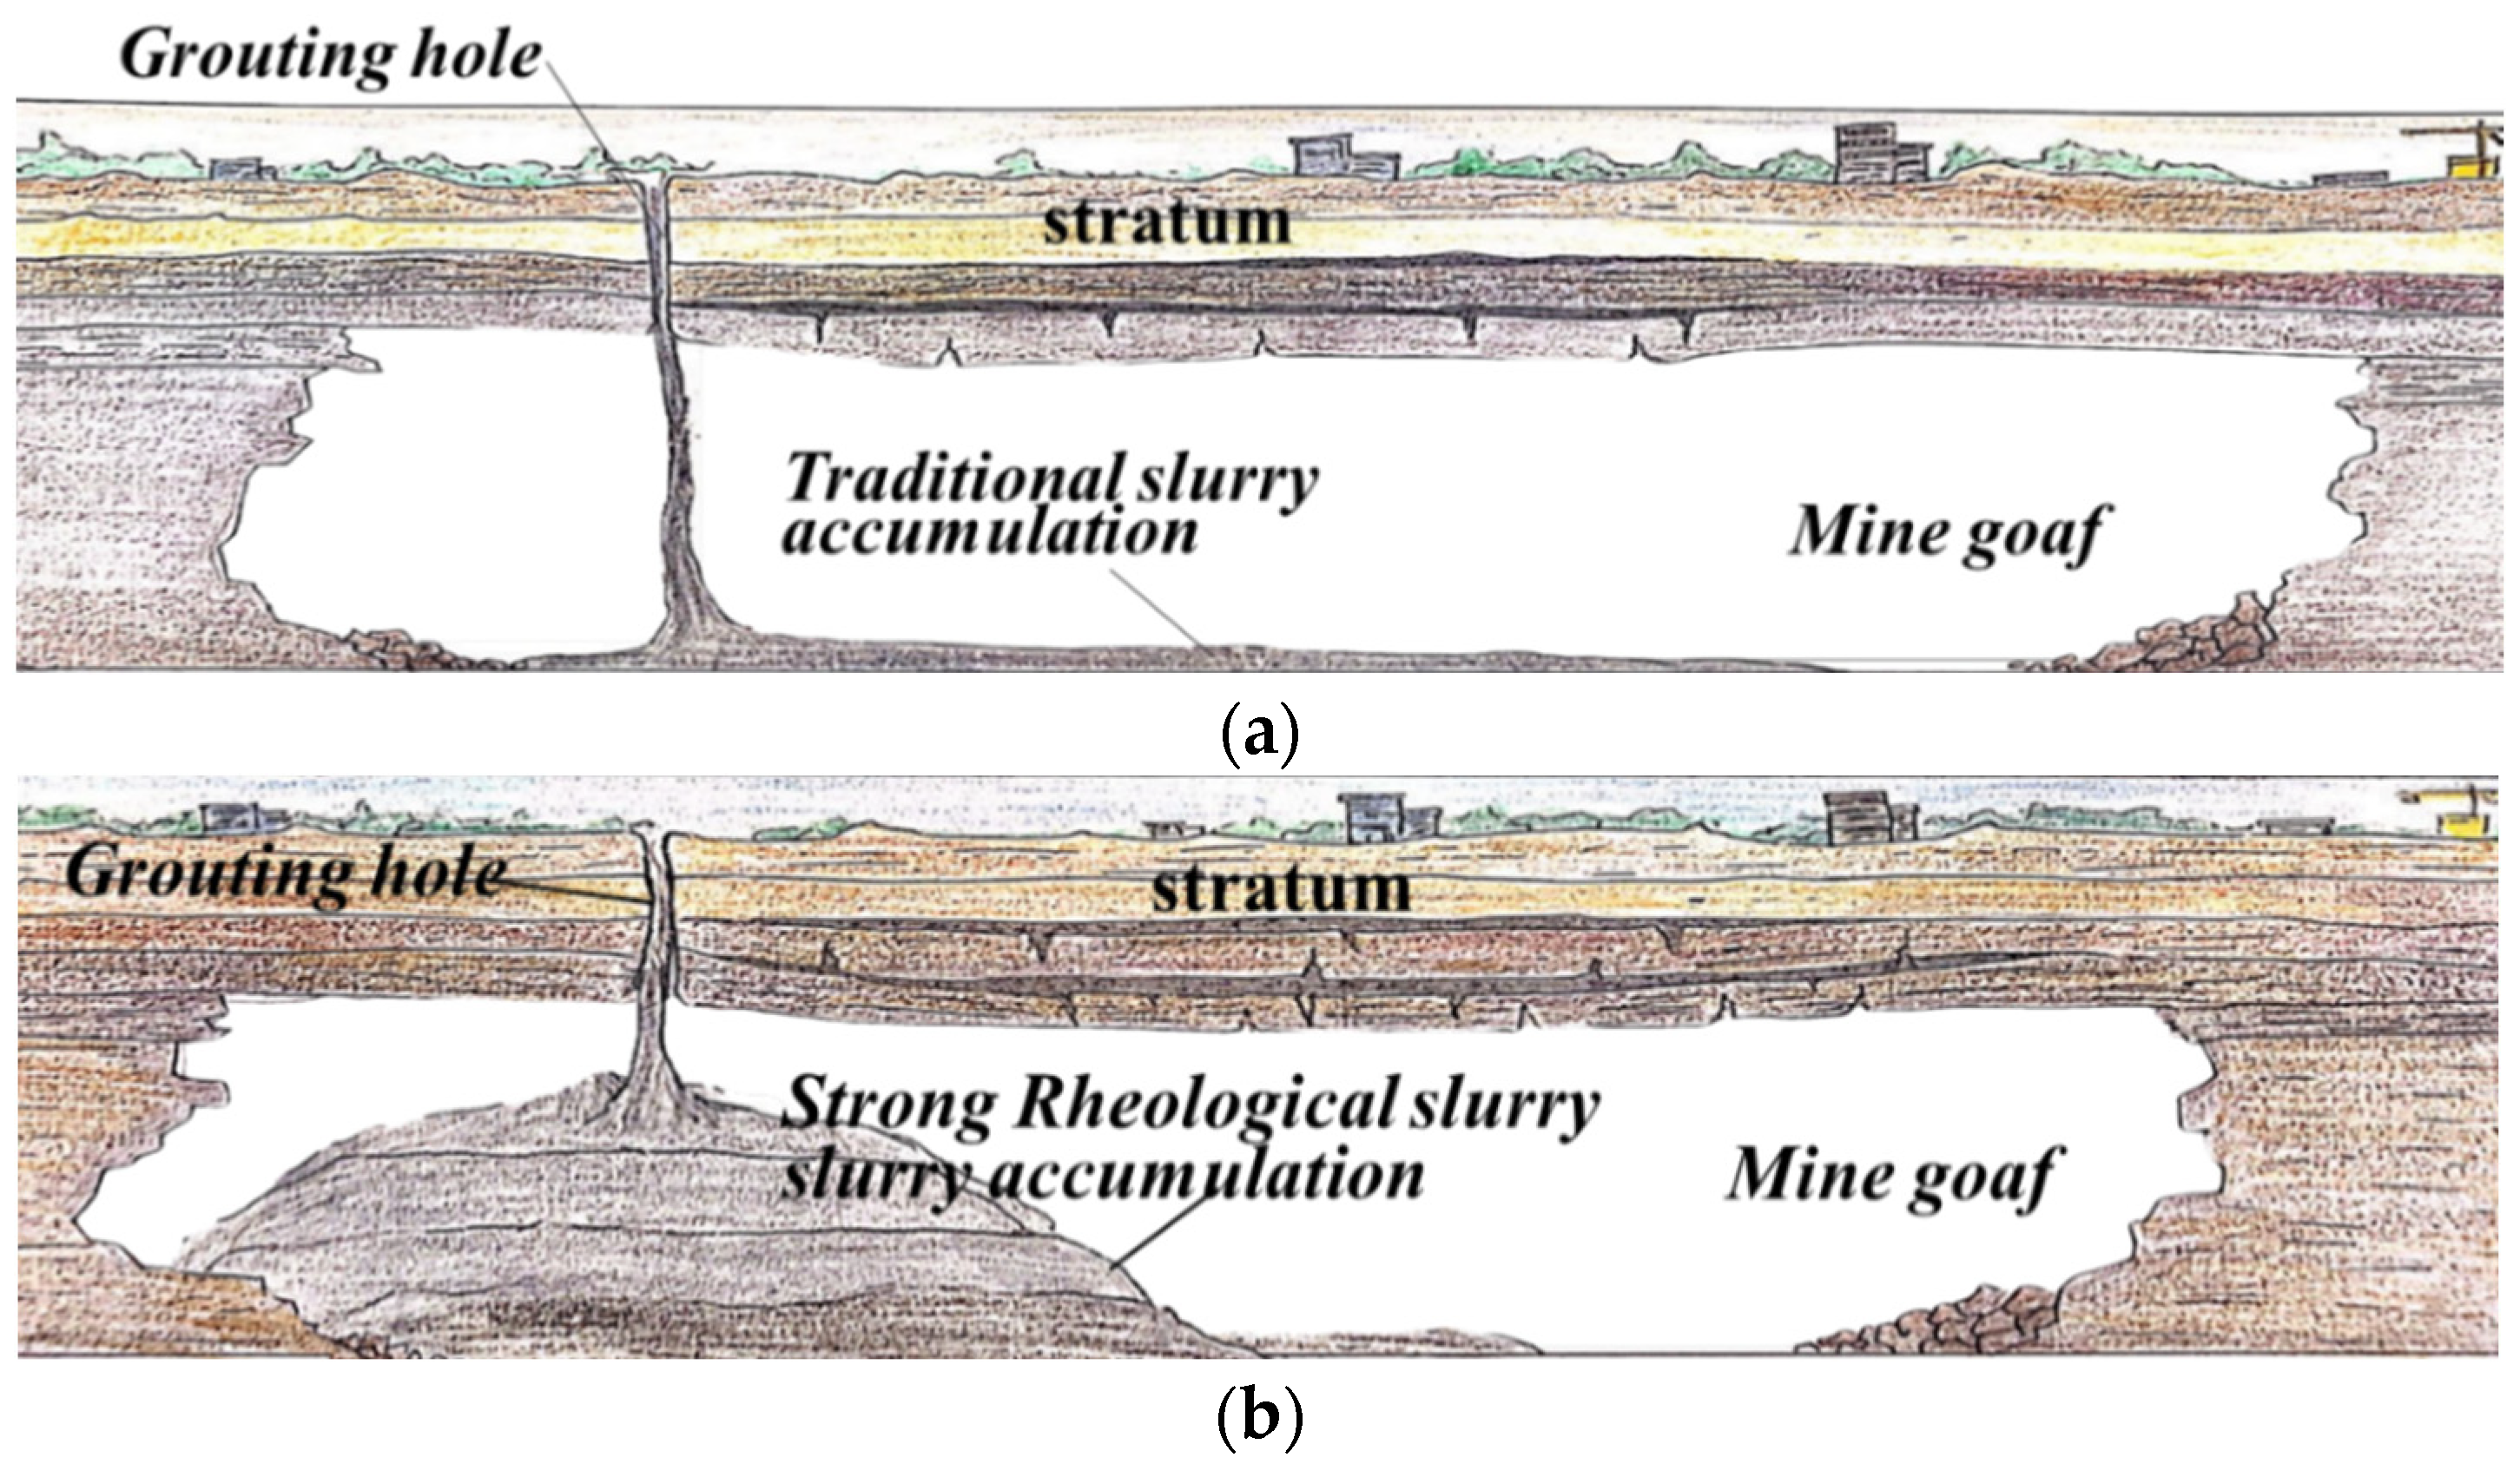
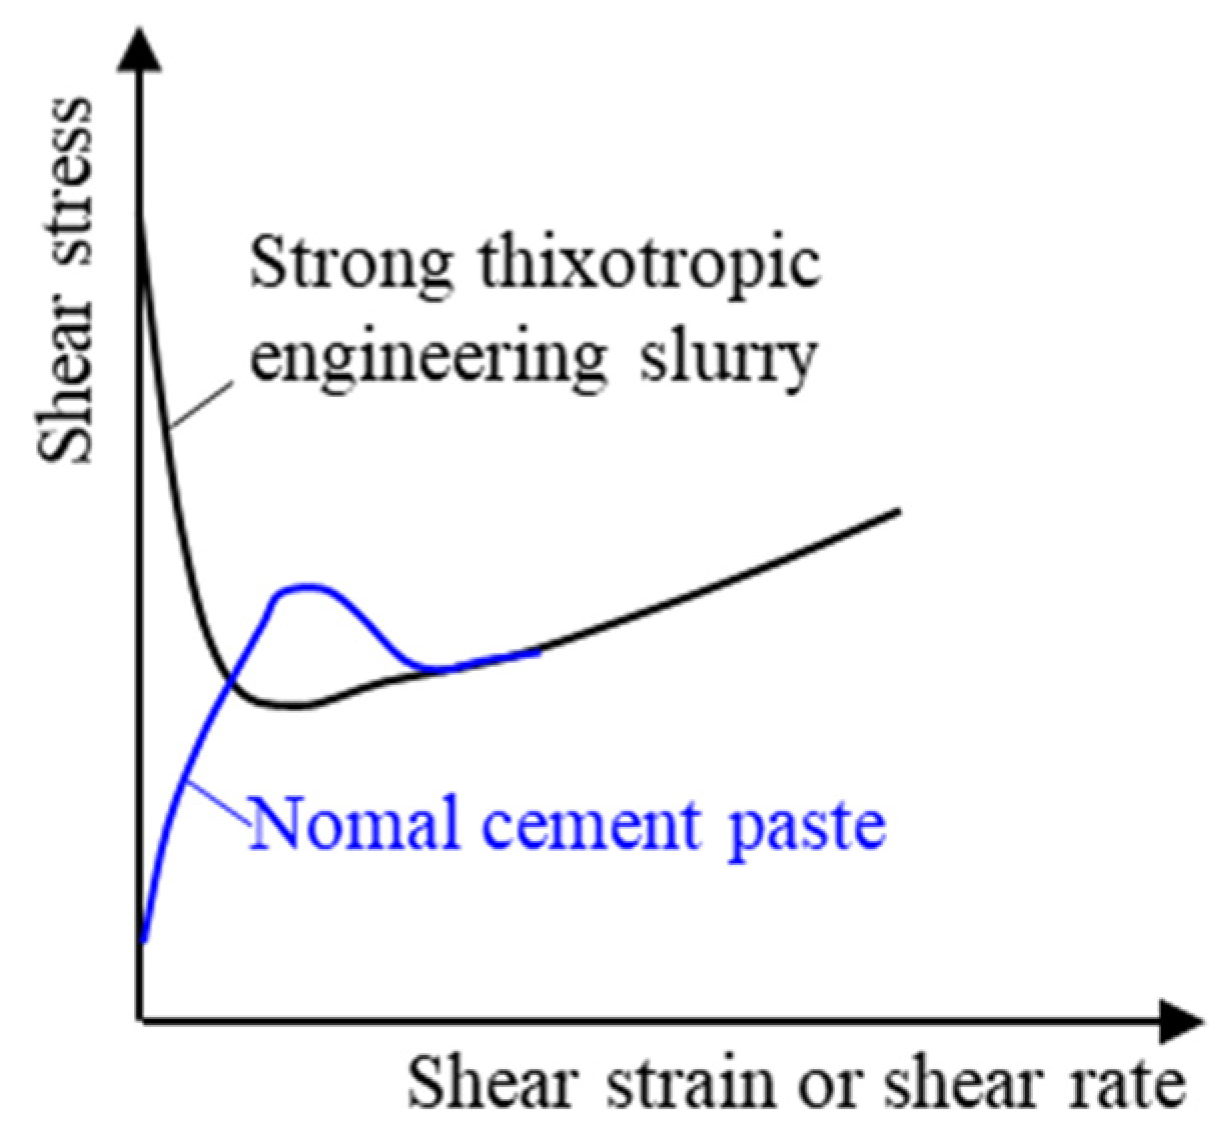
1. Introduction
2. Materials and Methods
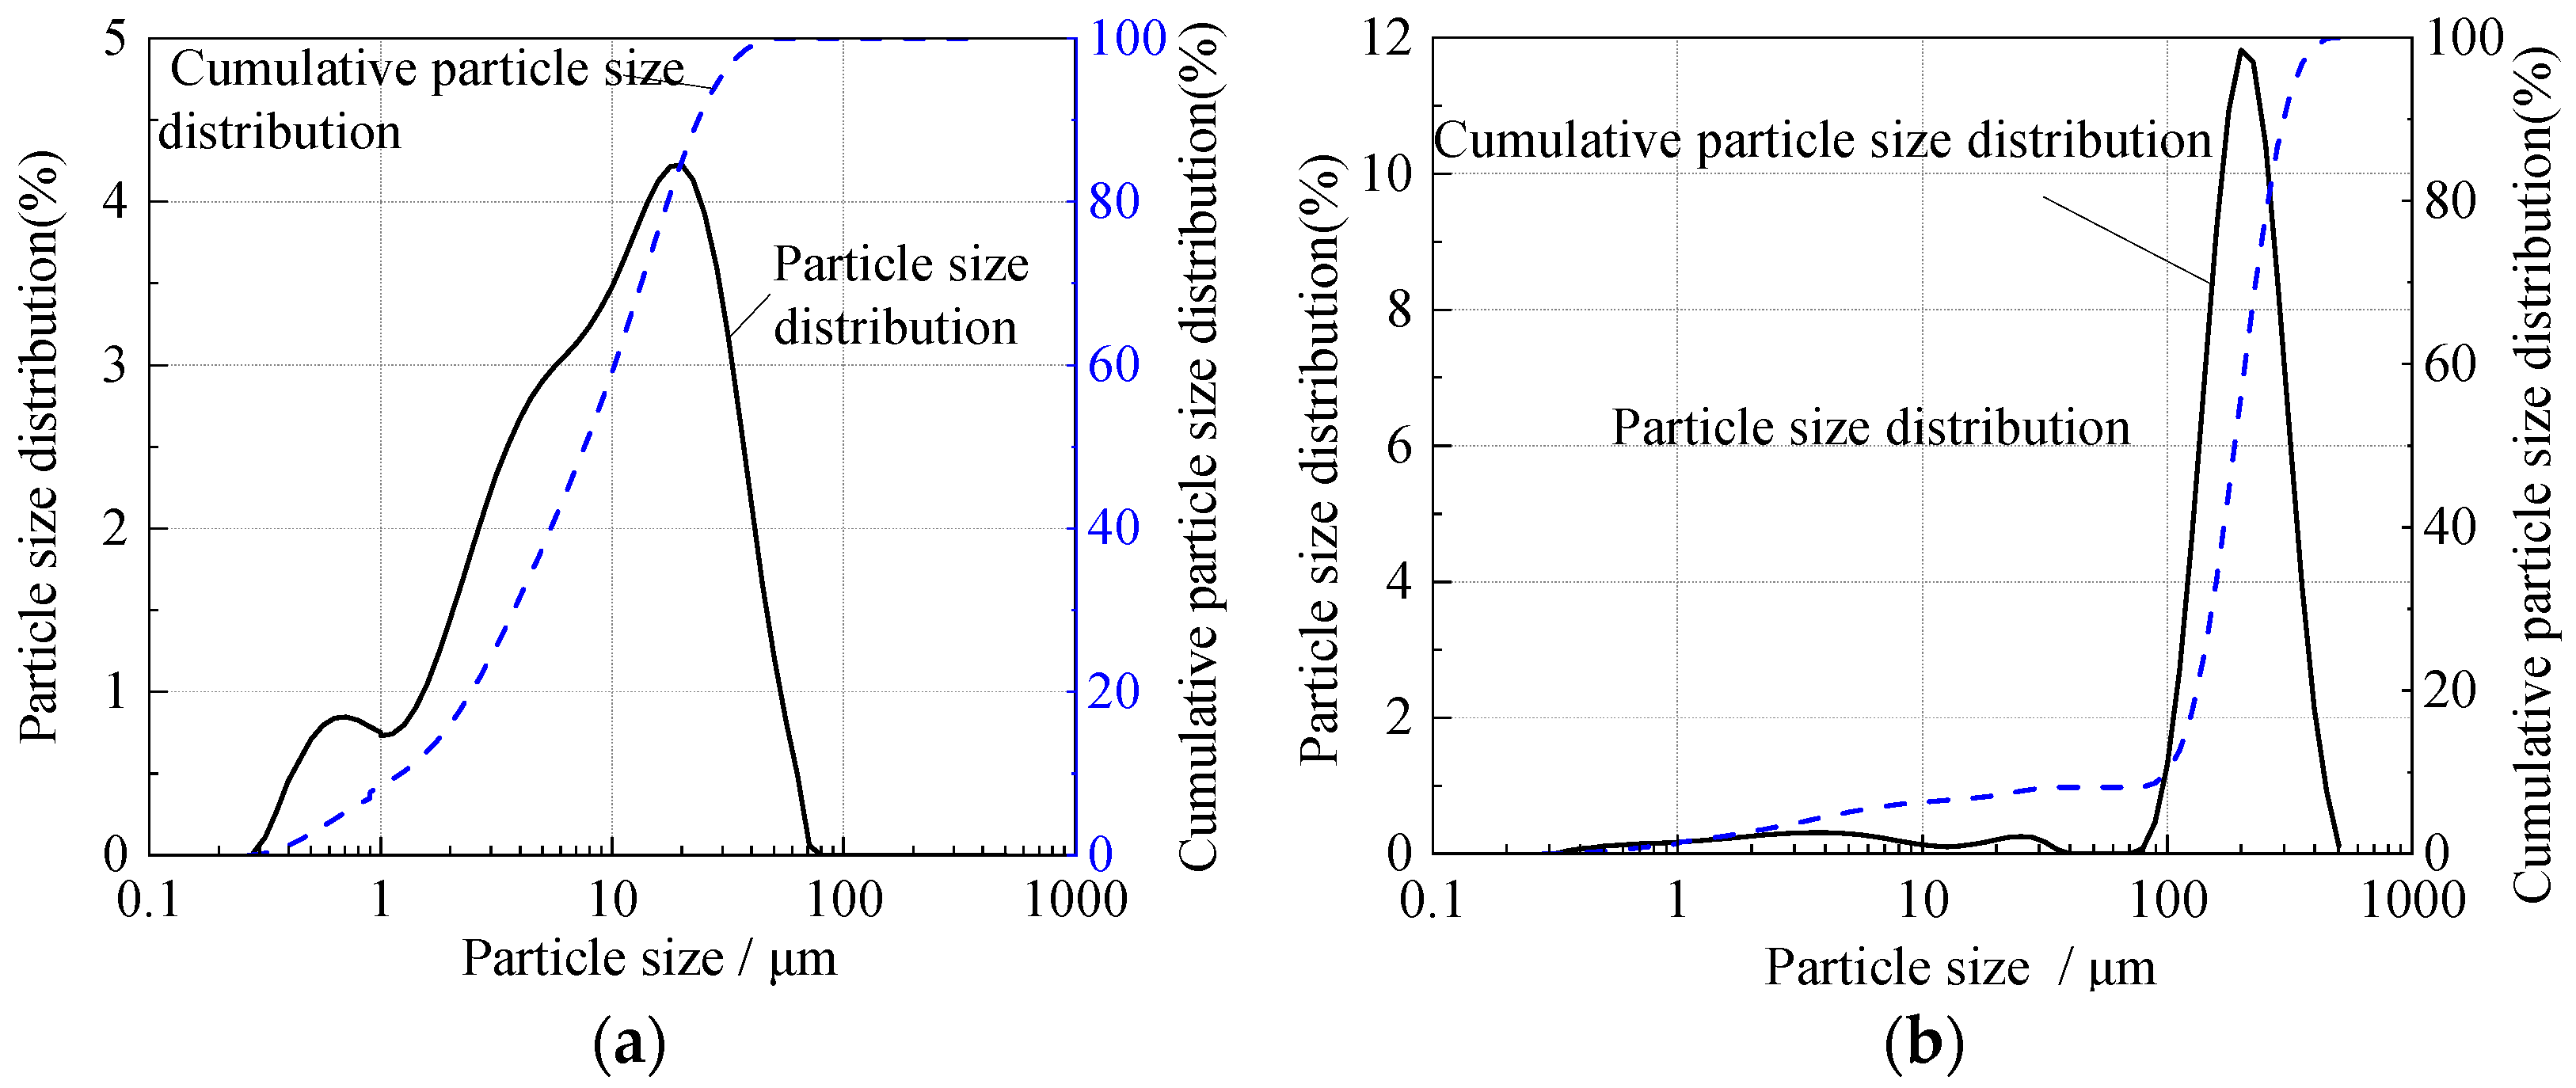
2.1. Materials
2.2. Instruments
2.3. Methods
2.3.1. Sample Preparation
2.3.2. Experimental Design and Procedures
- (1)
- Rheological characterization for a strong thixotropic cement slurry
- (2)
- Rheological characterization of a strong thixotropic cement mortar
- (3)
- Flow accumulation test
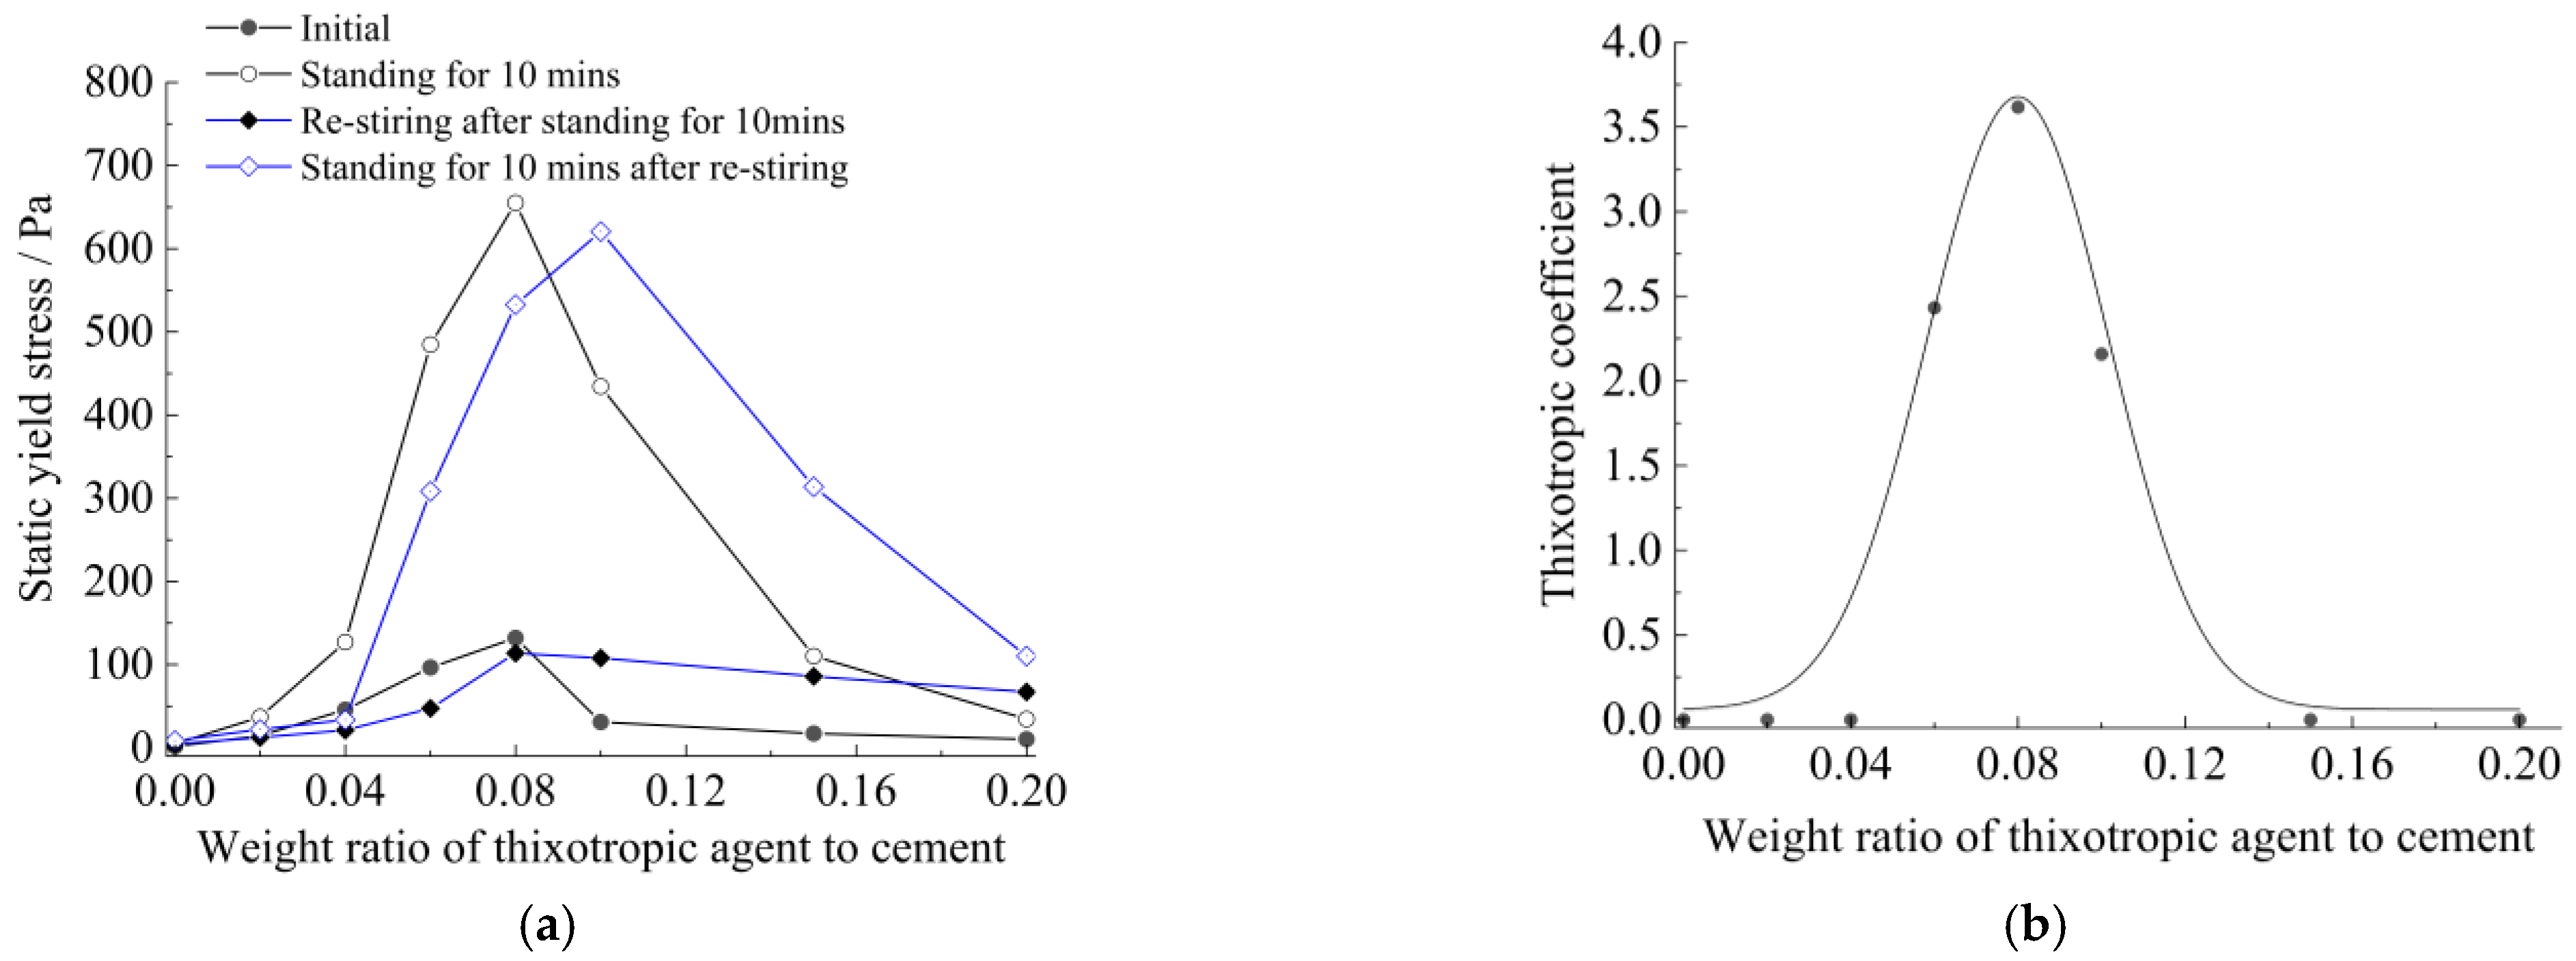
2.4. Evaluation Method for Thixotropic Performance
3. Results
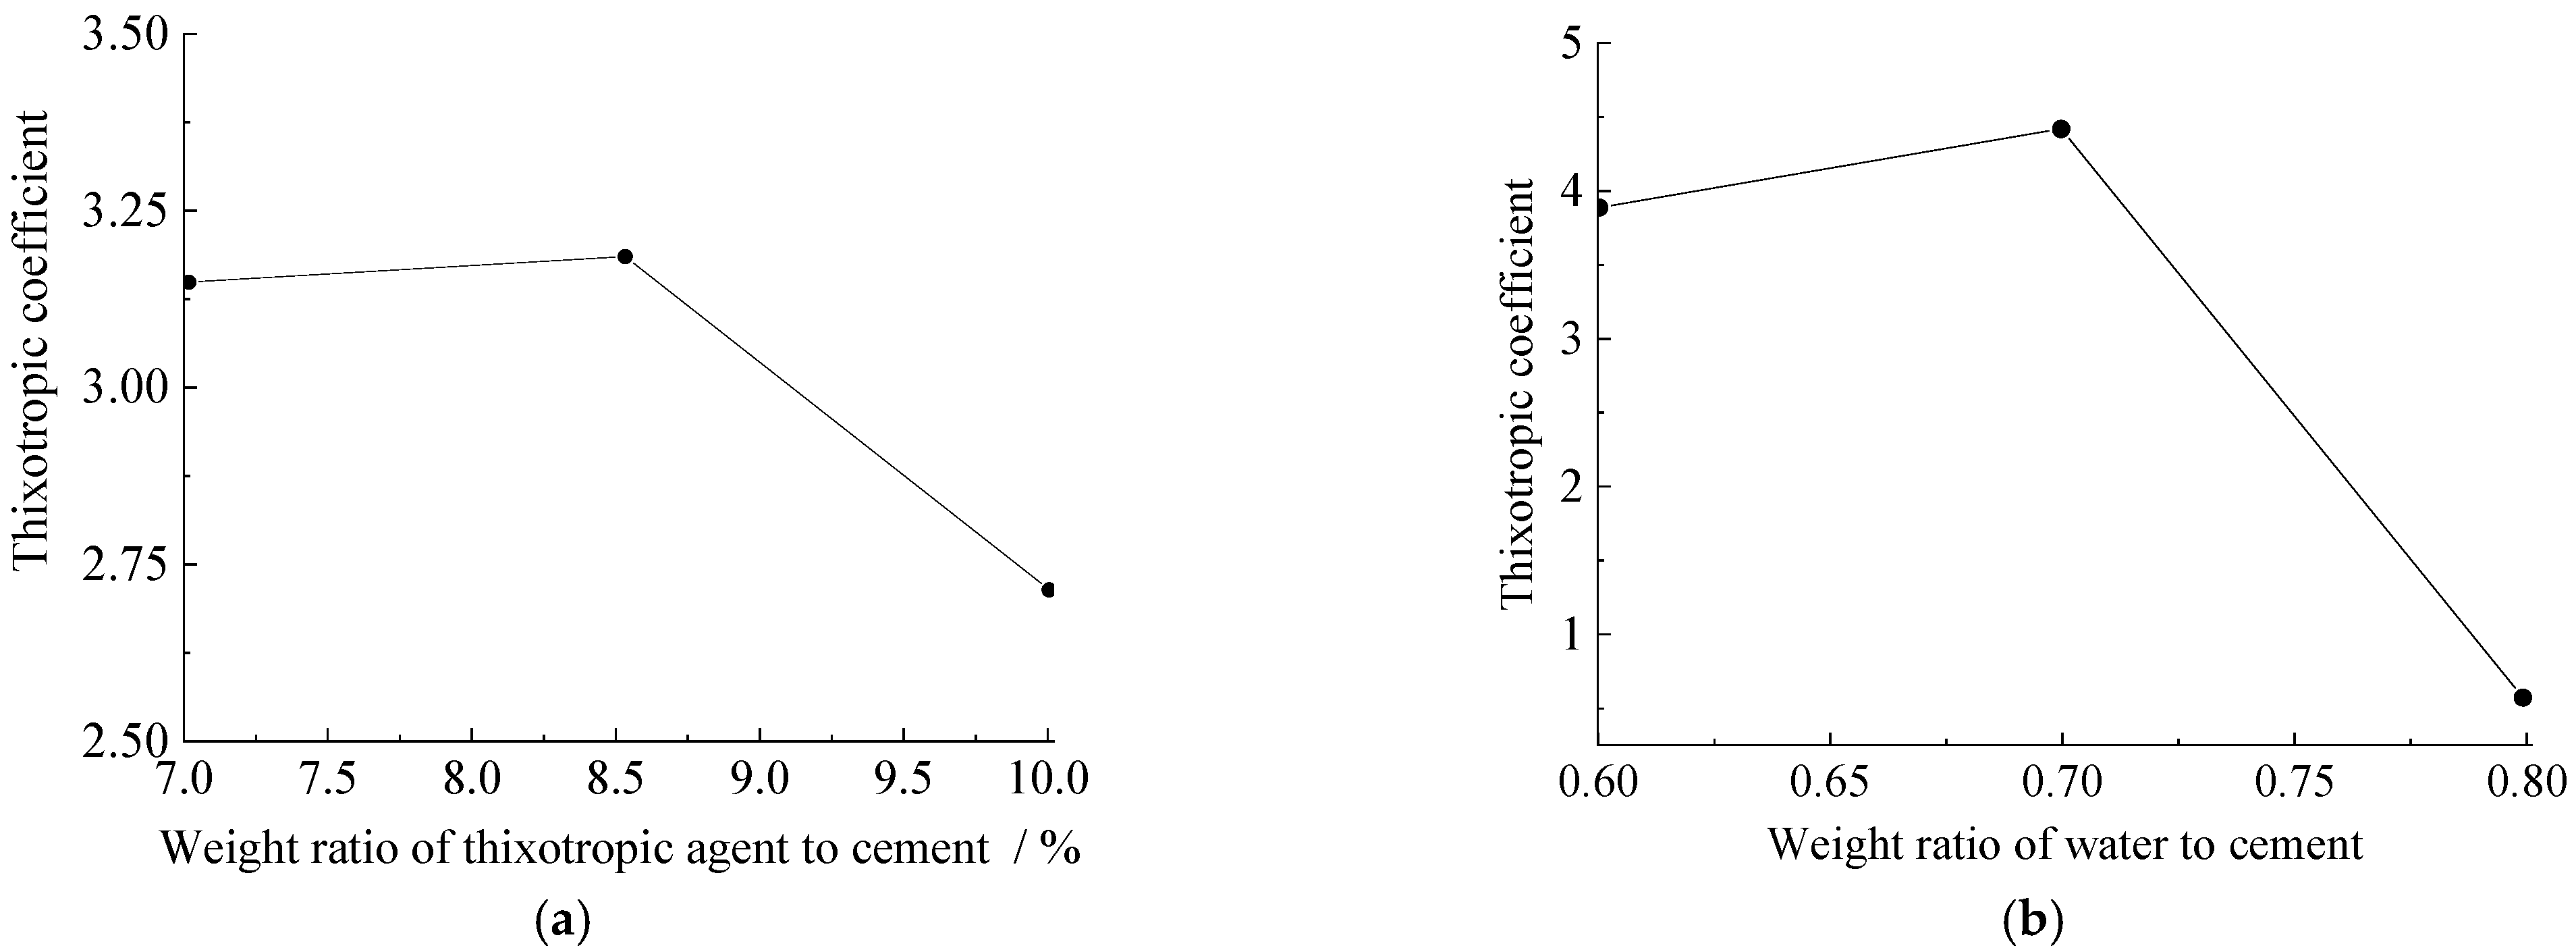
3.1. The Optimal Agent Ratio for Thixotropic Cement Slurry
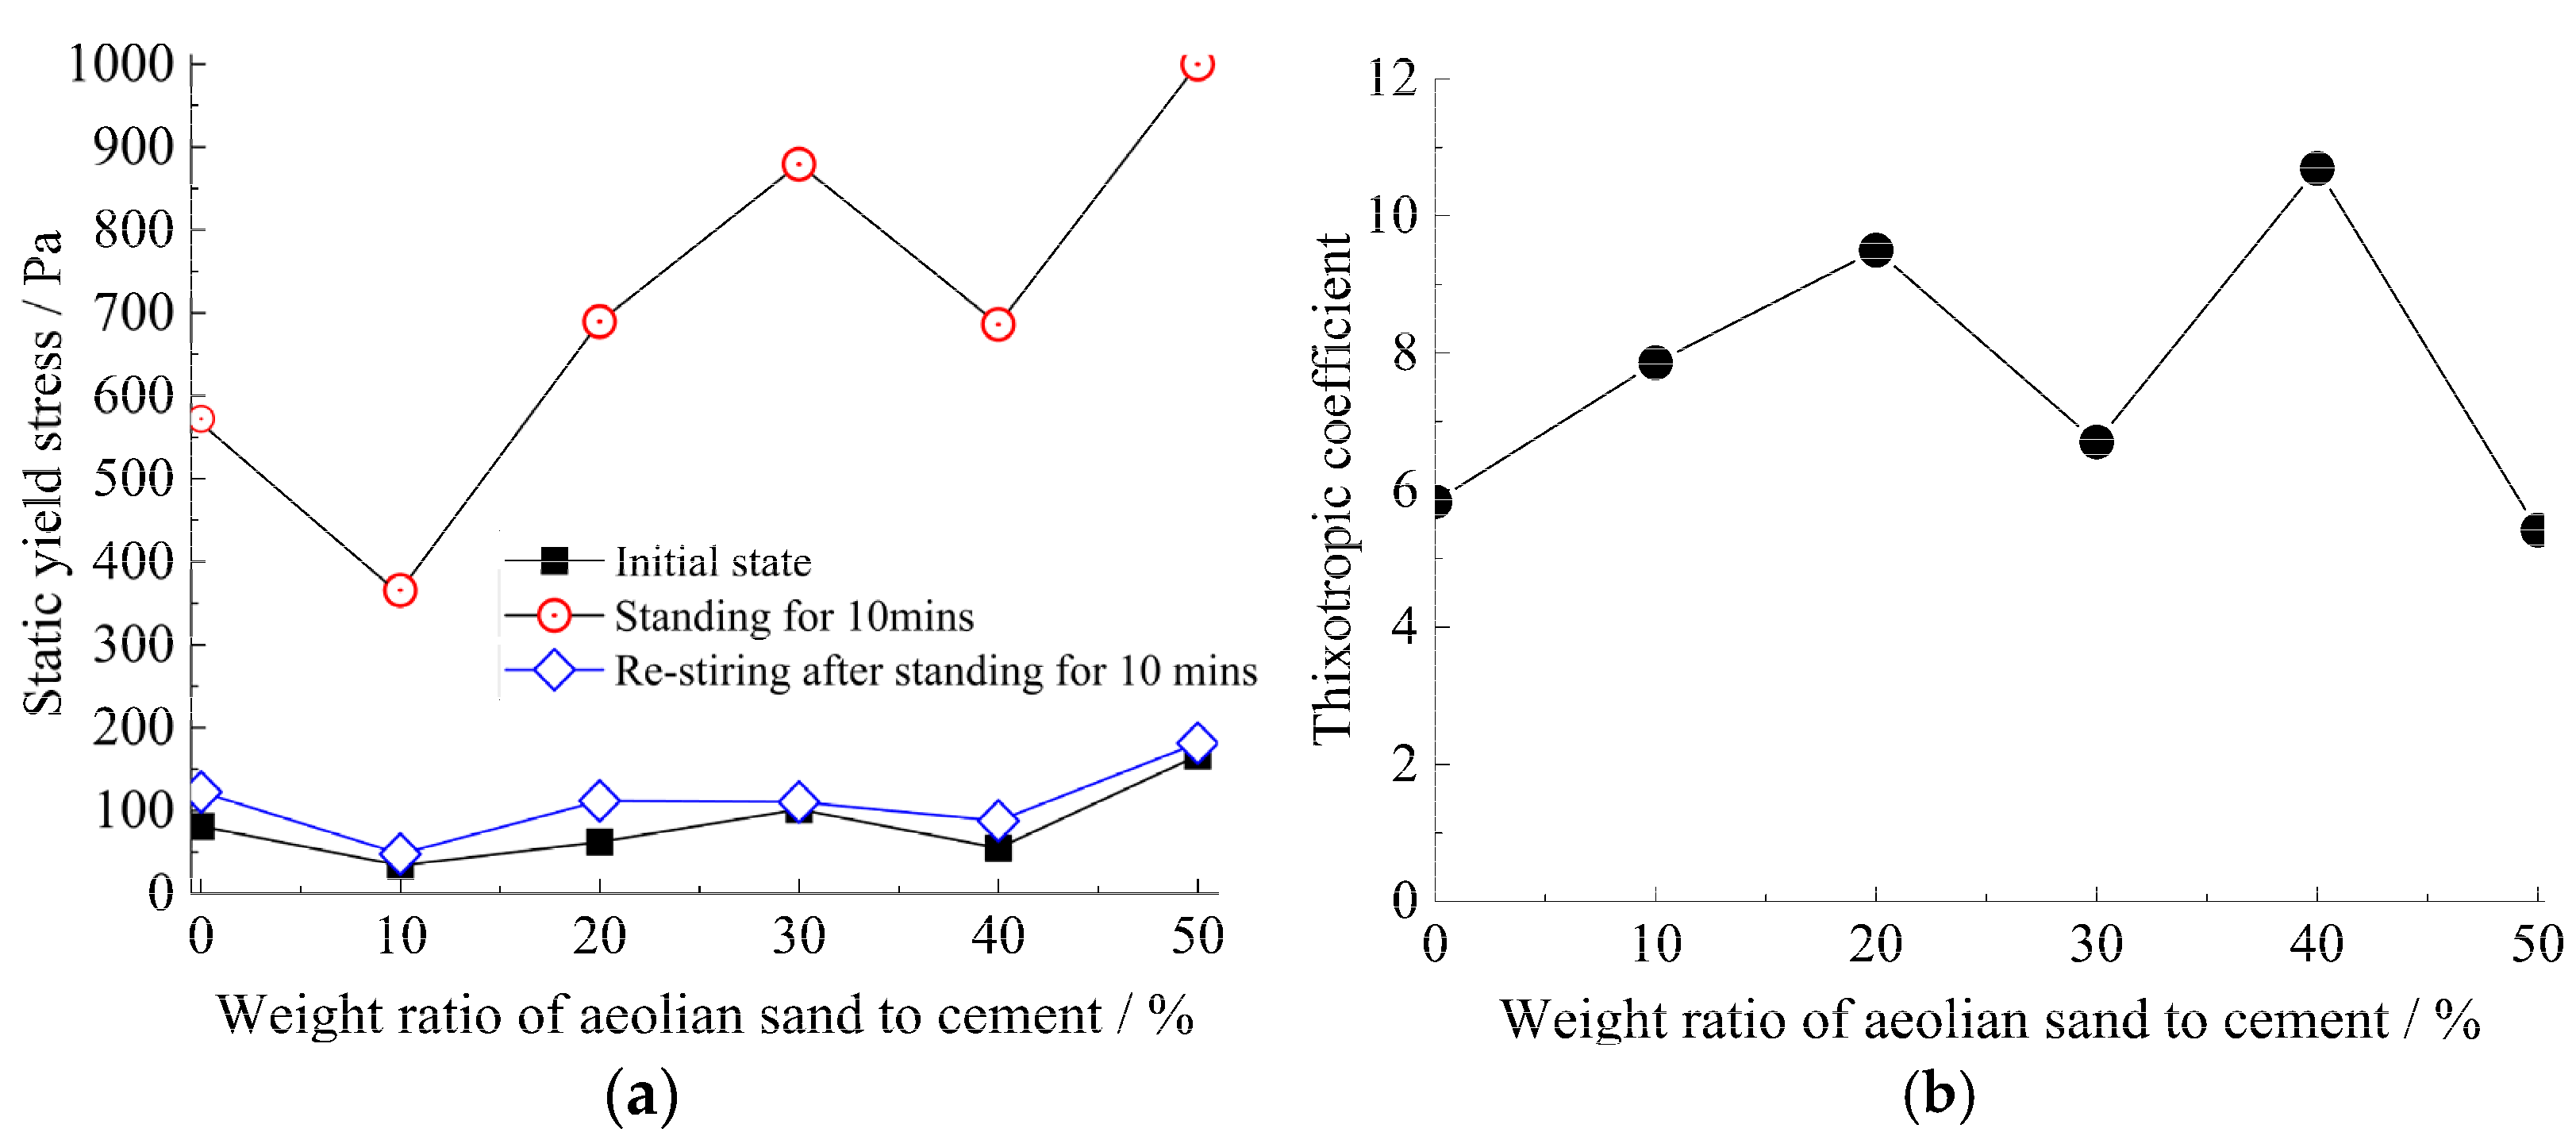
3.2. The Optimal Agent Ratio for a Strong Thixotropic Cement Mortar
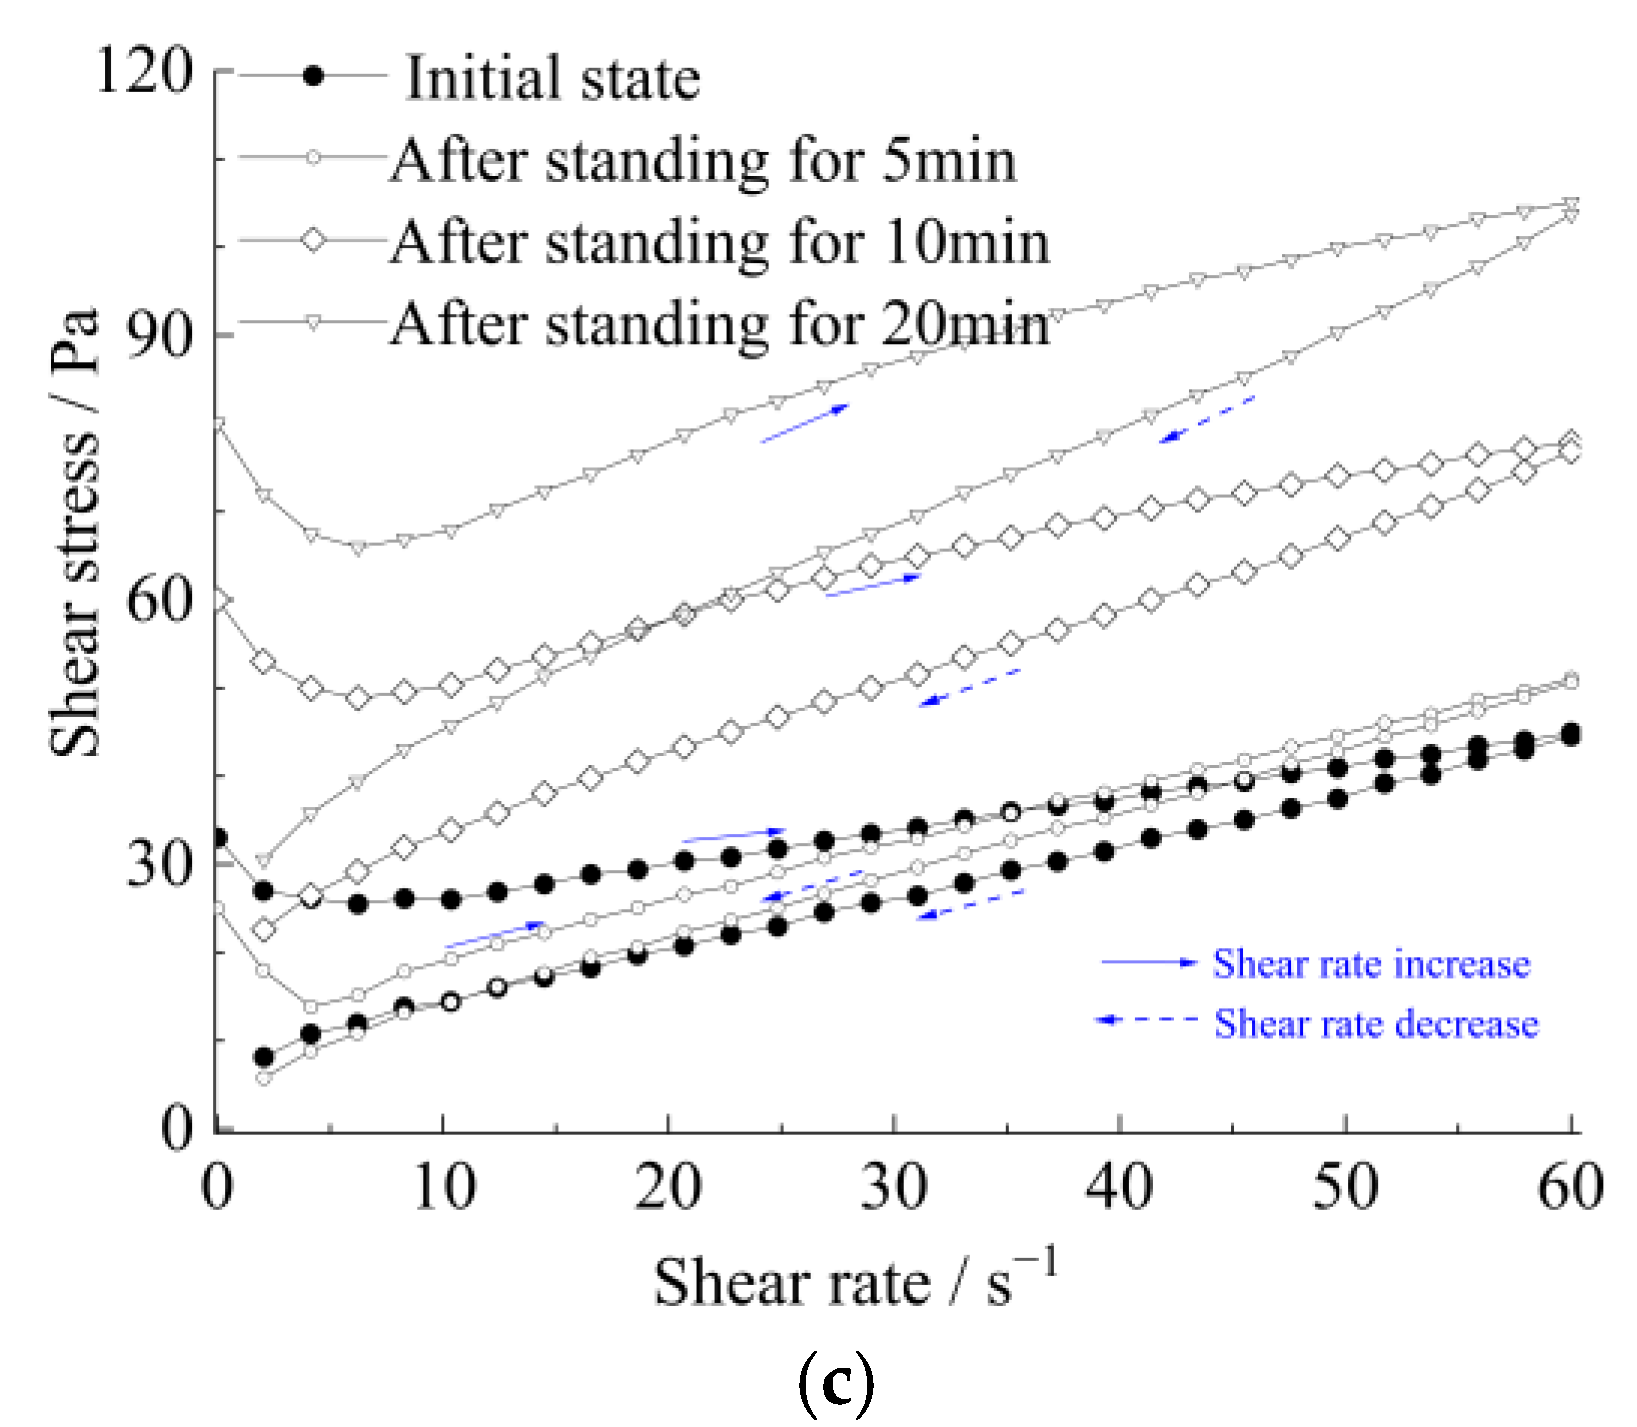
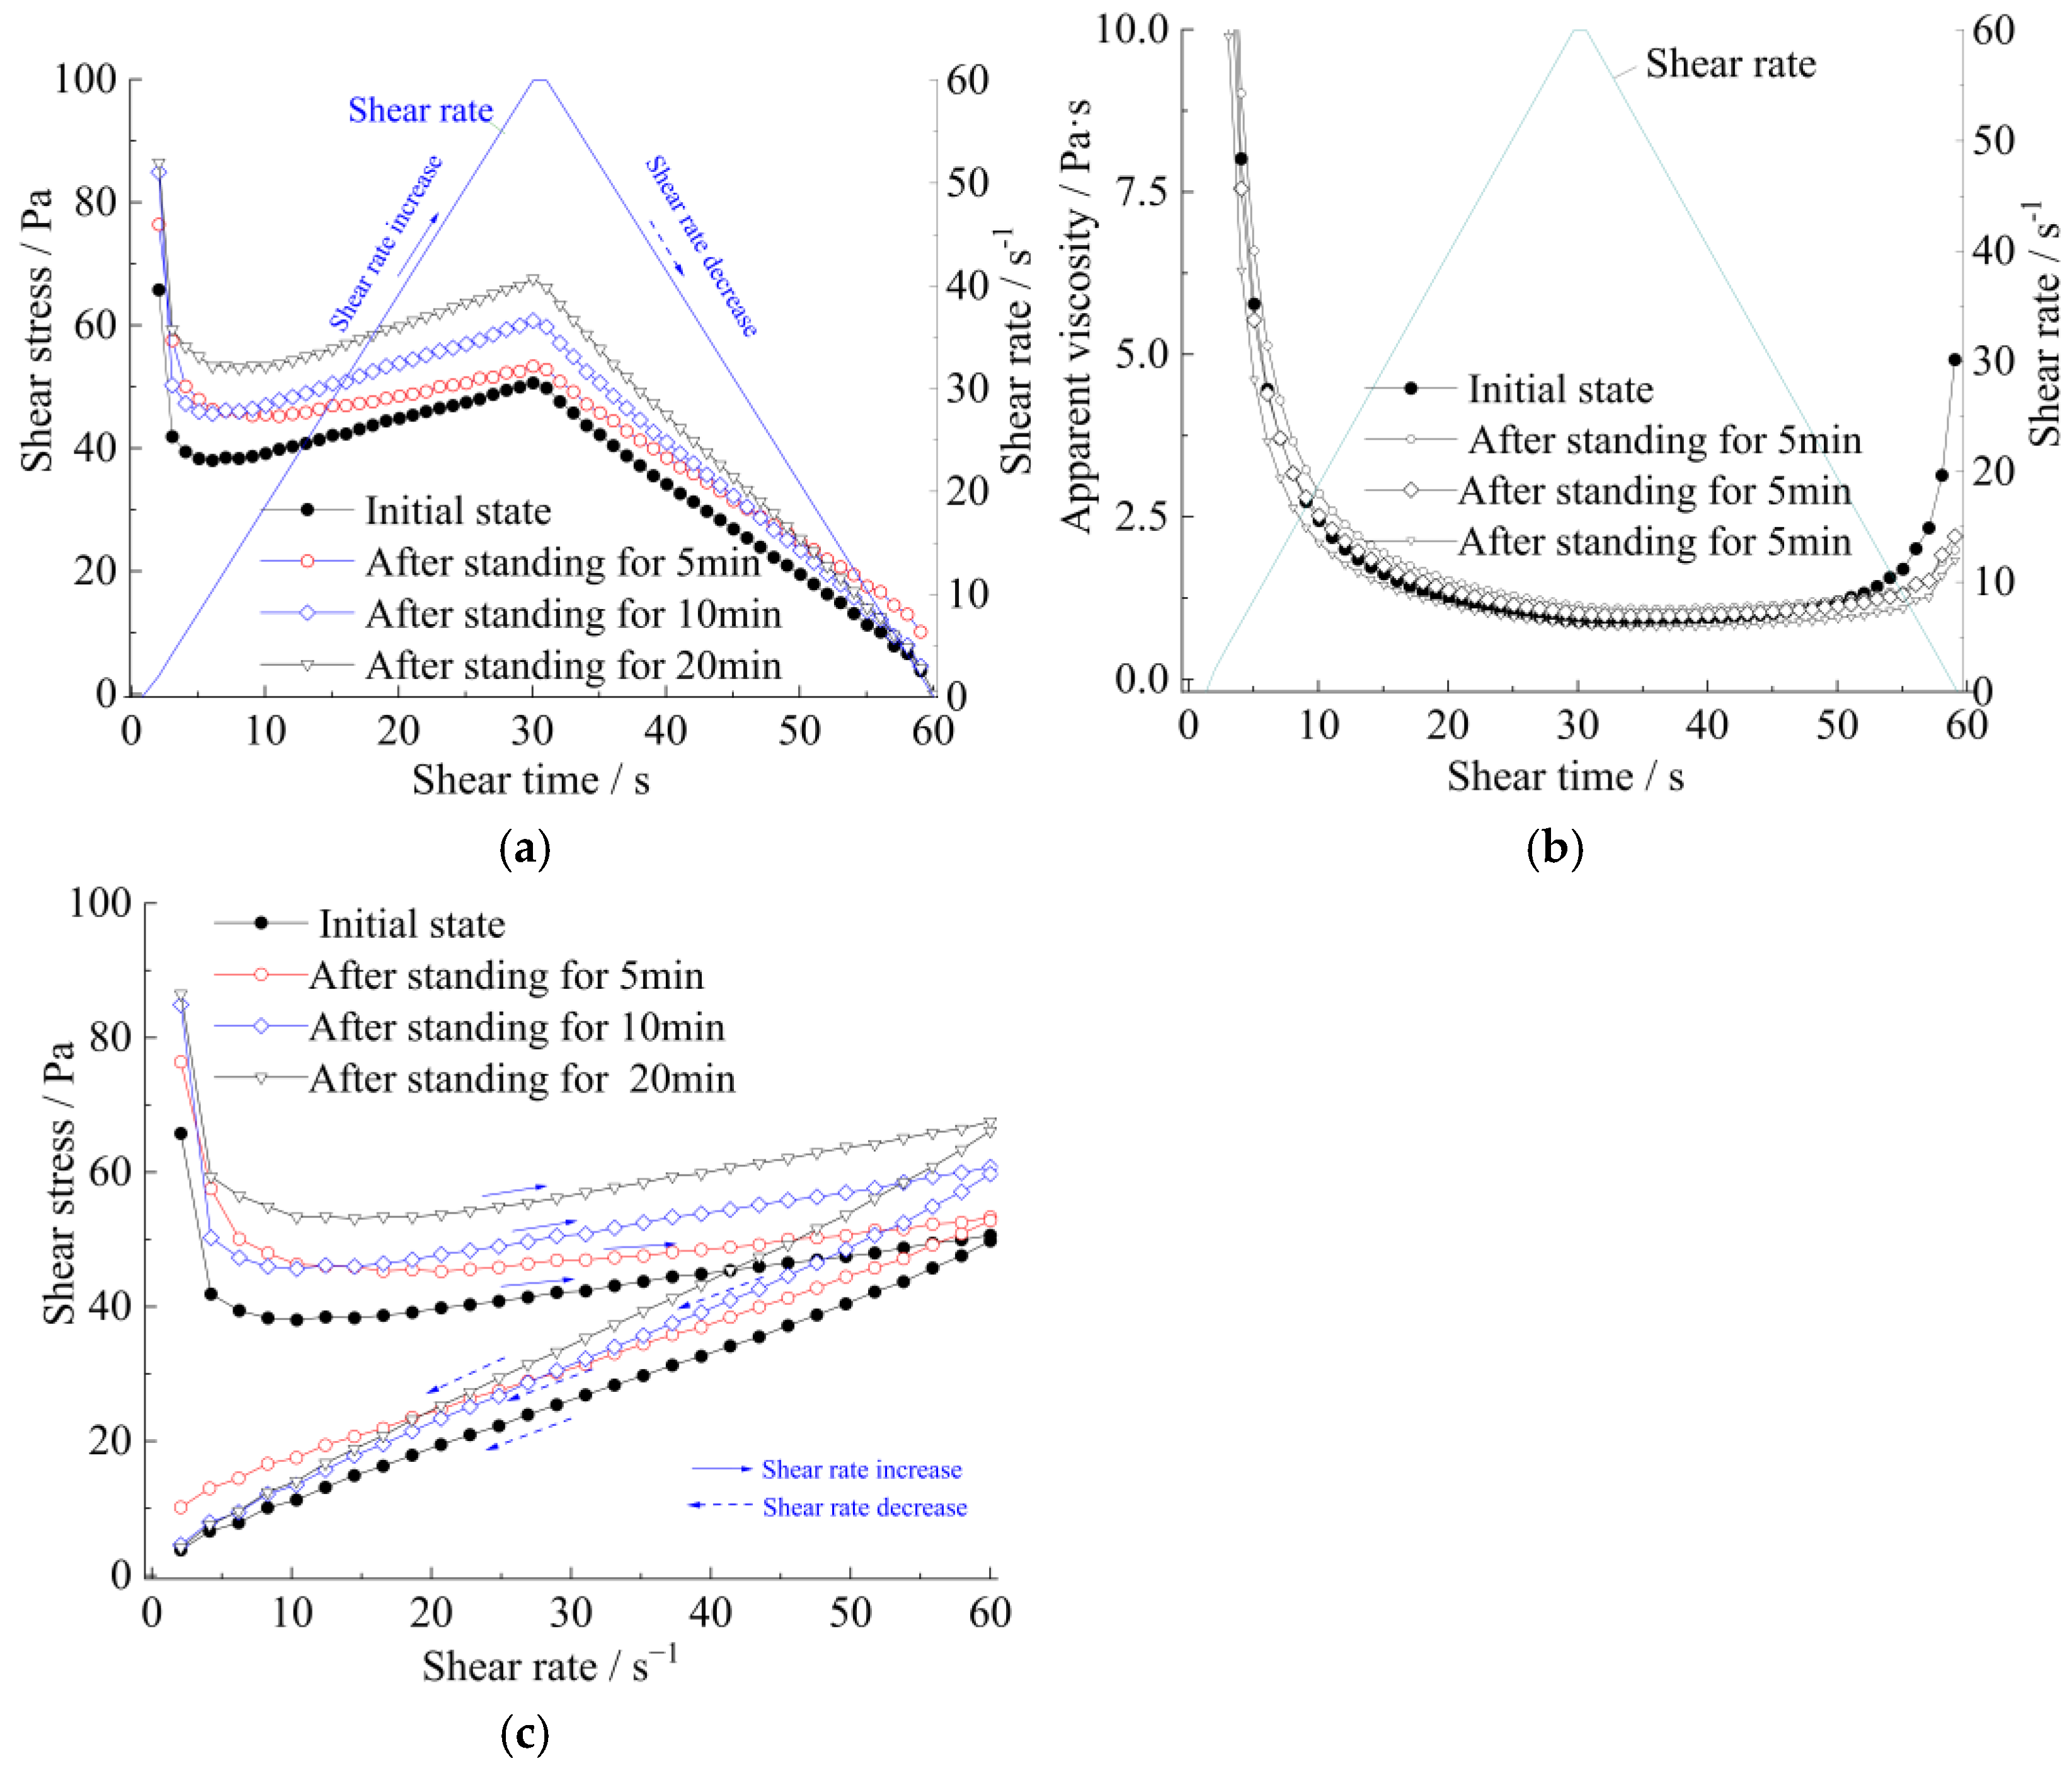
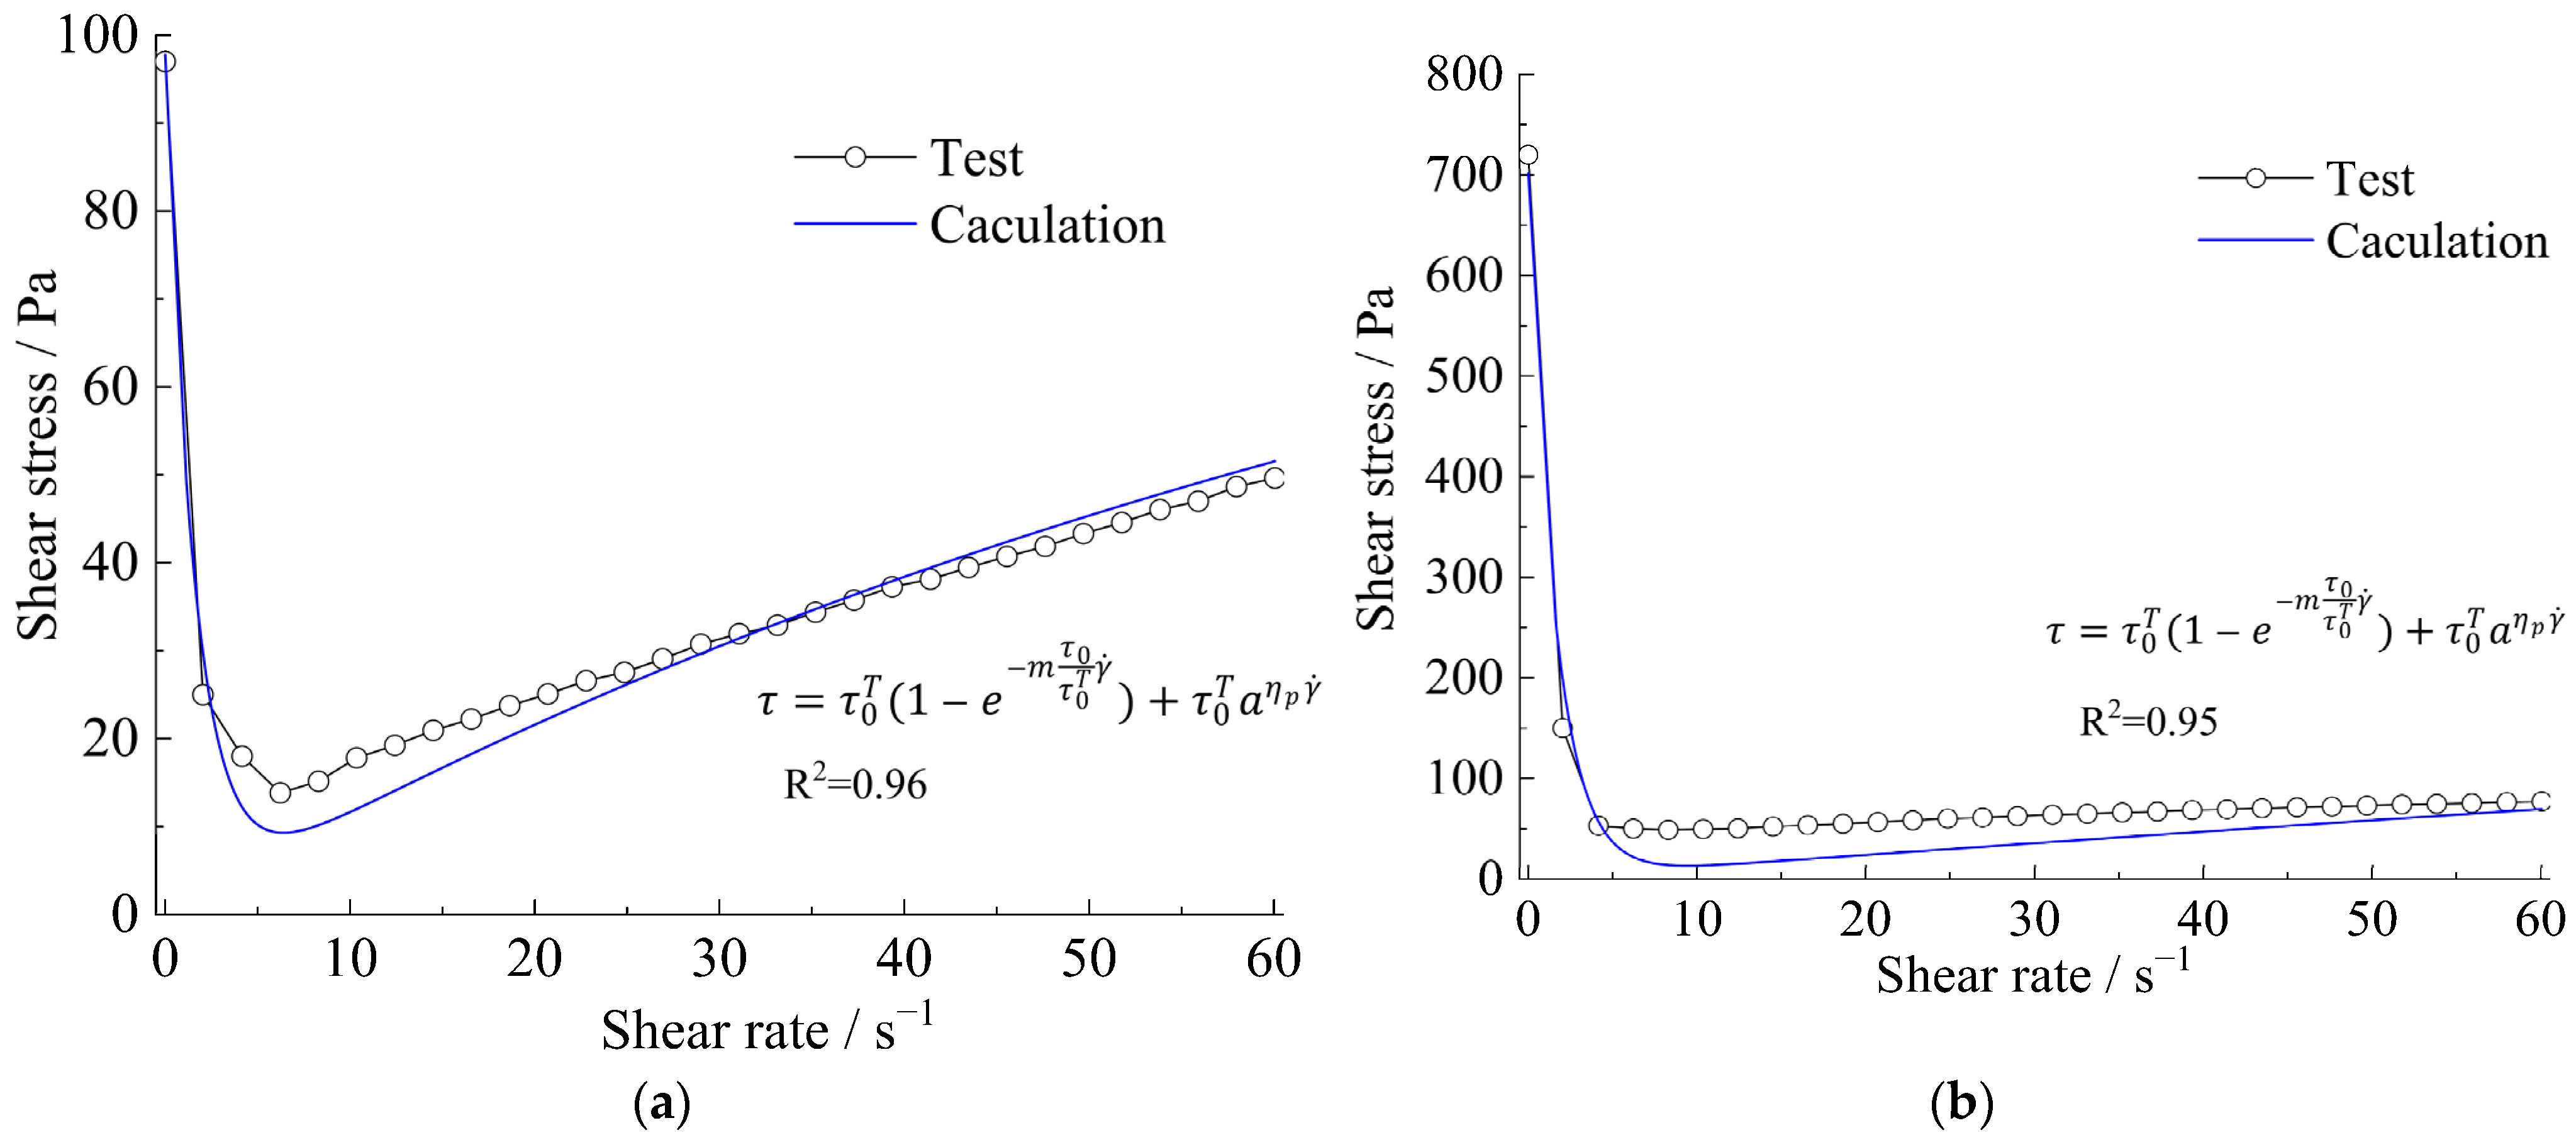
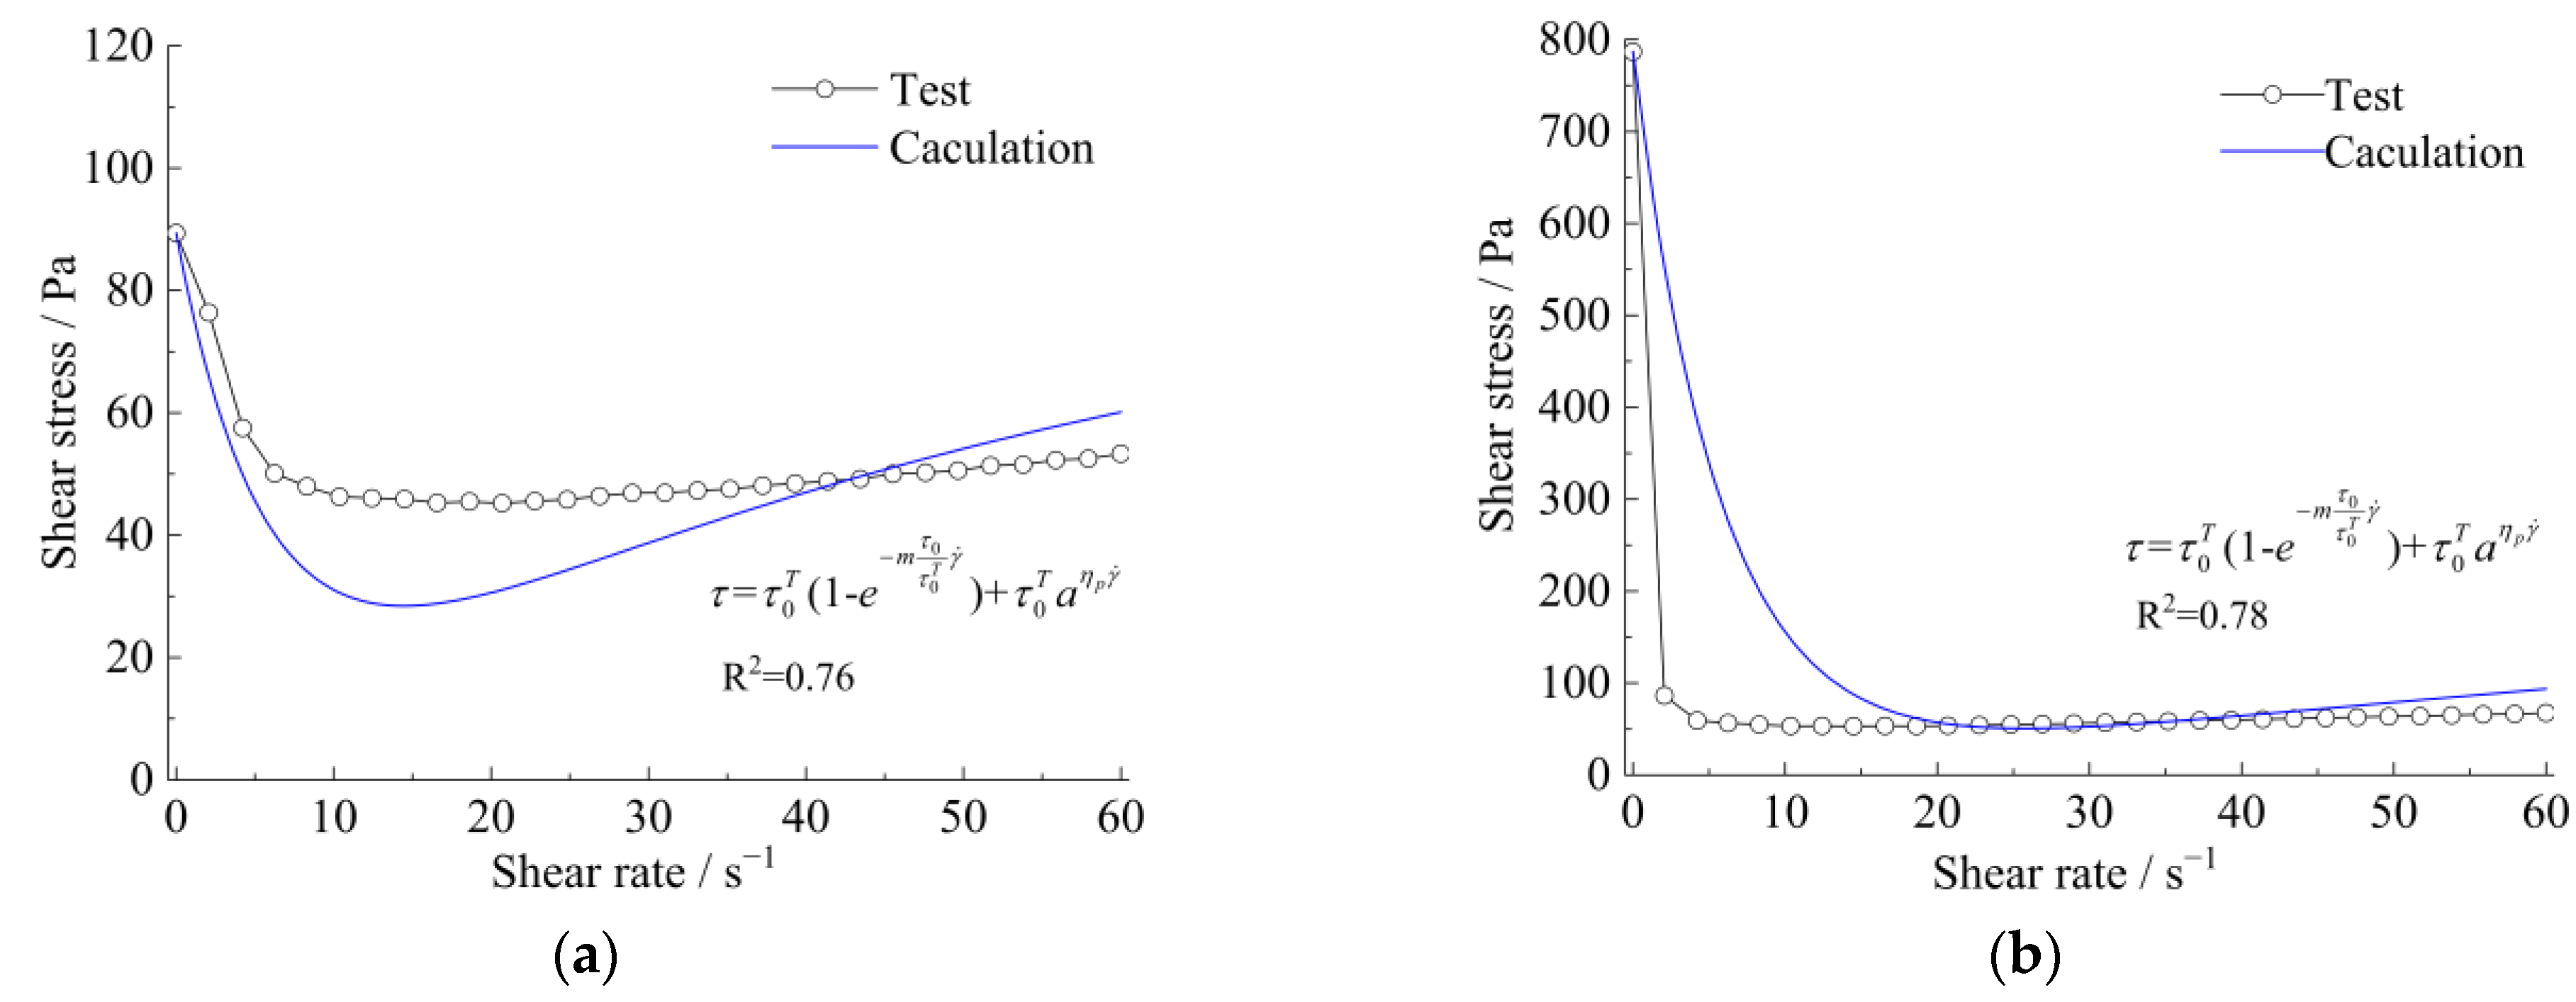
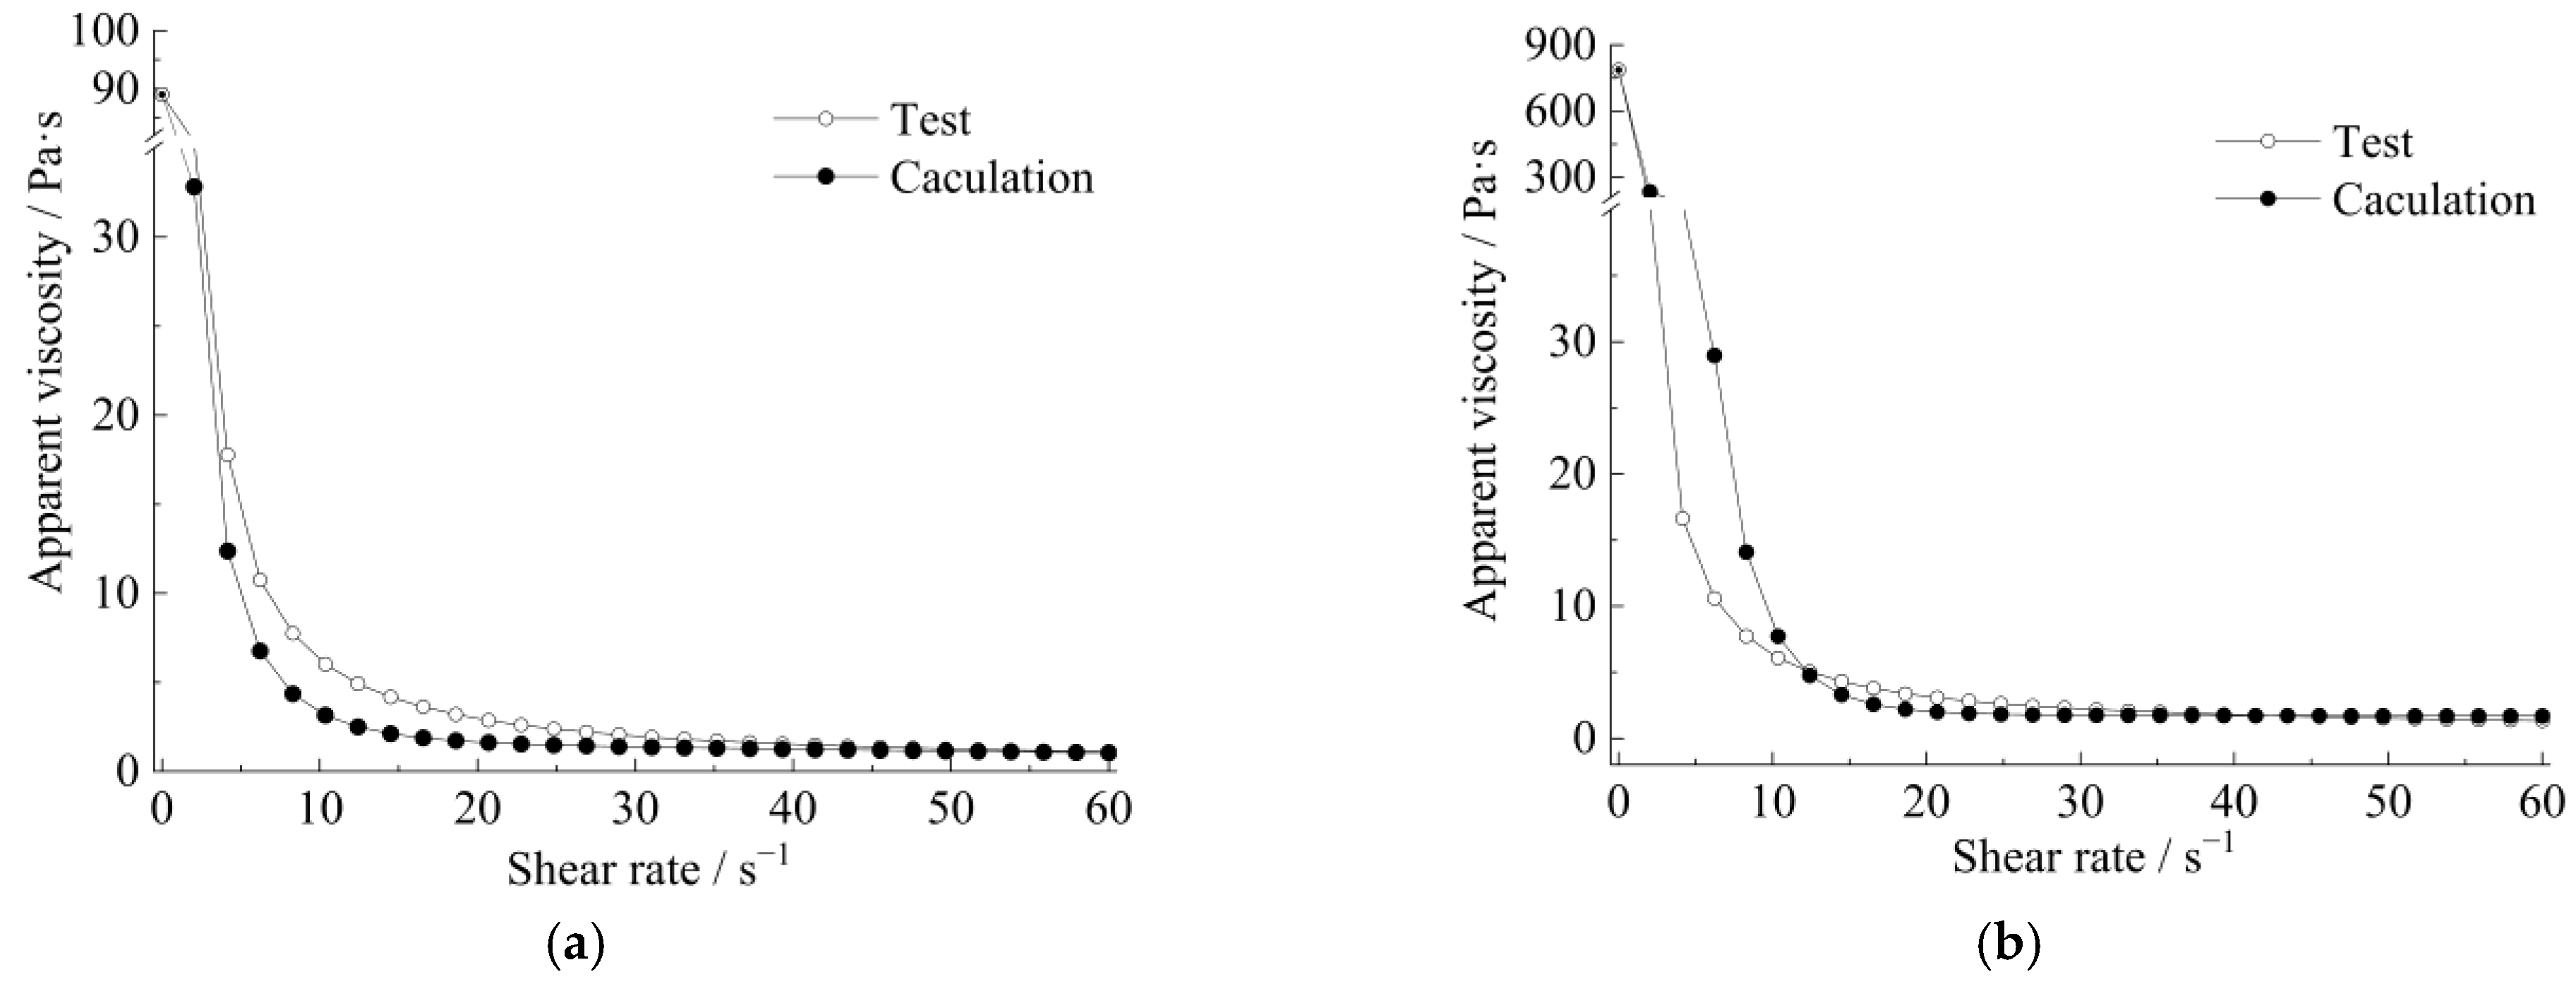
3.3. The Rheological Properties of Slurry and Mortar
3.4. Flow Accumulation Properties
4. Conclusions
Author Contributions
Funding
Institutional Review Board Statement
Informed Consent Statement
Data Availability Statement
Acknowledgments
Conflicts of Interest
References
- Bai, C.; Yun, M.X.; Wang, J.M. Hazards of Environmental Disruption in Mine Goafs and Stability Evaluation in Gao feng Mining Area. Nat. Environ. Pollut. Technol. 2020, 19, 949–956. [Google Scholar] [CrossRef]
- Xu, J.L.; You, Q.; Zhu, W.B.; Li, X.S.; Lai, W.Q. Theoretical study of strip-filling to control mining subsidence. J. China Coal Soc. 2007, 149, 119–122. [Google Scholar] [CrossRef]
- Wang, Z.S.; Deng, K.Z. Multi-scale analysis of time-varying characteristics of residual subsidence in abandoned goaf. Coal Sci. Technol. 2010, 38, 97–100. [Google Scholar] [CrossRef]
- Cao, W.; Wang, X.; Li, P.; Zhang, D.; Sun, C.; Qin, D. Wide Strip Backfill Mining for Surface Subsidence Control and Its Application in Critical Mining Conditions of a Coal Mine. Sustainability 2018, 10, 700. [Google Scholar] [CrossRef]
- Zhang, L.; Wang, H.; Wu, A.; Klein, B.; Zhang, X. A constitutive model for thixotropic cemented tailings backfill pastes. J. Non-Newton. Fluid Mech. 2021, 295, 104548. [Google Scholar] [CrossRef]
- Tong, L.Y.; Liu, S.Y.; Fang, L.; Qiu, Y. Discussion on design and calculation methods of grouting treatment in goaf under coal roadbed. Chin. J. Geotech. Eng. 2003, 25, 374–376. [Google Scholar]
- Feng, G.M.; Jia, K.J.; Shang, B.B. Application and prospect of super-high-water packing material in mining engineering. Coal Sci. Technol. 2015, 43, 5–9. [Google Scholar] [CrossRef]
- Li, M.; Zhang, J.; Liu, Z.; Zhao, X.; Huang, P. Mechanical analysis of roof stability under nonlinear compaction of solid backfill body. Int. J. Min. Sci. Technol. 2016, 26, 863–868. [Google Scholar] [CrossRef]
- Mehra, P.; Naveen, D. A comparative study on behavior of different superplasticizers with fly ash added ordinary Portland cement. Mater. Today Proc. 2022, 65, 1390–1398. [Google Scholar] [CrossRef]
- Shao, X.; Sun, J.; Xin, J.; Zhao, B.; Sun, W.; Li, L.; Tang, R.; Tian, C.; Xu, B. Experimental study on mechanical properties, hydration kinetics, and hydration product characteristics of aeolian sand paste-like materials. Constr. Build. Mater. 2021, 303, 124601. [Google Scholar] [CrossRef]
- Chen, M.; Yang, L.; Zheng, Y.; Huang, Y.; Li, L.; Zhao, P.; Wang, S.; Lu, L.; Cheng, X. Yield stress and thixotropy control of 3D-printed calcium sulfoaluminate cement composites with metakaolin related to structural build-up. Constr. Build. Mater. 2020, 252, 119090. [Google Scholar] [CrossRef]
- Yuan, B.; Yang, Y.; Tang, X.; Xie, Y. A starting pressure prediction of thixotropic cement slurry: Theory, model and example. J. Pet. Sci. Eng. 2015, 133, 108–113. [Google Scholar] [CrossRef]
- Ulrich, D.; Arabi, A.; Machado, M.B.; Martin, T.W.; Sanders, R.S.; Kresta, S.M. A method to quantify time-dependent yield stress build-up in mineral slurries. Miner. Eng. 2022, 187, 107802. [Google Scholar] [CrossRef]
- Dolz, M.; González, F.; Delegido, J.; Hernández, M.J.; Pellicer, J. A Time-Dependent Expression for Thixotropic Areas. Application to Aerosil 200 Hydrogels. J. Pharm. Sci. 2000, 89, 790–797. [Google Scholar] [CrossRef]
- Mahaut, F.; Mokéddem, S.; Chateau, X.; Roussel, N.; Ovarlez, G. Effect of coarse particle volume fraction on the yield stress and thixotropy of cementitious materials. Cem. Concr. Res. 2008, 38, 1276–1285. [Google Scholar] [CrossRef]
- Ahari, R.S.; Erdem, T.K.; Ramyar, K. Thixotropy and structural breakdown properties of self consolidating concrete containing various supplementary cementitious materials. Cem. Concr. Compos. 2015, 59, 26–37. [Google Scholar] [CrossRef]
- Roussel, N.; Ovarlez, G.; Garrault, S.; Brumaud, C. The origins of thixotropy of fresh cement pastes. Cem. Concr. Res. 2012, 42, 148–157. [Google Scholar] [CrossRef]
- Nachbaur, L.; Mutin, J.; Nonat, A.; Choplin, L. Dynamic mode rheology of cement and tricalcium silicate pastes from mixing to setting. Cem. Concr. Res. 2001, 31, 183–192. [Google Scholar] [CrossRef]
- Kolawole, J.T.; Combrinck, R.; Boshoff, W.P. Measuring the thixotropy of conventional concrete: The influence of viscosity modifying agent, superplasticiser and water. Constr. Build. Mater. 2019, 225, 853–867. [Google Scholar] [CrossRef]
- Tuyan, M.; Ahari, R.S.; Erdem, T.K.; Çakır, A.; Ramyar, K. Influence of thixotropy determined by different test methods on formwork pressure of self-consolidating concrete. Constr. Build. Mater. 2018, 173, 189–200. [Google Scholar] [CrossRef]
- Kumar, L.; Skjæraasen, O.; Hald, K.; Paso, K.; Sjöblom, J. Nonlinear rheology and pressure wave propagation in a thixotropic elasto-viscoplastic fluids, in the context of flow restart. J. Non-Newton. Fluid Mech. 2016, 231, 11–25. [Google Scholar] [CrossRef]
- Vinay, G.; Wachs, A.; Agassant, J.-F. Numerical simulation of weakly compressible Bingham flows: The restart of pipeline flows of waxy crude oils. J. Non-Newton. Fluid Mech. 2006, 136, 93–105. [Google Scholar] [CrossRef]


| Items | Index |
|---|---|
| Appearance | White powder |
| Electric potential/mV | ≥35 |
| Sieve residue (aperture 0.25 mm) | ≤5 |
| Acid solubility % | ≥95 |
| Mix No. | Cement/g | Thixotropic Agent/g | Aeolian Sand/g | Water/g | Note |
|---|---|---|---|---|---|
| S1 | 300 | 0 | 0 | 210 | thixotropic cement slurry |
| S2 | 300 | 6 | 0 | 214.2 | |
| S3 | 300 | 12 | 0 | 218.4 | |
| S4 | 300 | 18 | 0 | 222.6 | |
| S5 | 300 | 24 | 0 | 226.8 | |
| S6 | 300 | 30 | 0 | 231 | |
| S7 | 300 | 45 | 0 | 241.5 | |
| S8 | 300 | 60 | 0 | 252 | |
| m1 | 300 | 25.5 | 30 | 248.85 | thixotropic cement mortar under w/s = 0.7 |
| m2 | 300 | 25.5 | 60 | 269.85 | |
| m3 | 300 | 25.5 | 90 | 290.85 | |
| m4 | 300 | 25.5 | 120 | 311.85 | |
| m5 | 300 | 25.5 | 150 | 332.85 | |
| m6 | 300 | 25.5 | 180 | 404.4 | thixotropic cement mortar under w/s = 0.8 |
| m7 | 300 | 25.5 | 210 | 428.4 | |
| m8 | 300 | 25.5 | 240 | 452.4 | |
| m9 | 300 | 25.5 | 270 | 476.4 | |
| m10 | 300 | 25.5 | 300 | 500.4 |
| Level | 1 | 2 | 3 |
|---|---|---|---|
| Factor | |||
| Thixotropic agent amount/% | 7 | 8.5 | 10 |
| Water−solid ratio | 0.6 | 0.7 | 0.8 |
| Parameters | Plastic Viscosity | Static Yield Stress at the Time of Initial Mixing | A | m | a | Yield Stress Pa after Standing for 10 Min | |
|---|---|---|---|---|---|---|---|
| Value | slurry | 0.586 | 97.76 | 251.62 | 0.0125 | 0.3441 | 701.11 |
| Mortar | 0.672 | 89.38 | 283.61 | 0.0176 | 0.873 | 786.86 | |
| Parameter | h0/m | B | C |
|---|---|---|---|
| Test | |||
| 1 | 0.37 | −0.394 | −7.85 |
| 2 | 0.56 | ||
| 3 | 0.71 |
Publisher’s Note: MDPI stays neutral with regard to jurisdictional claims in published maps and institutional affiliations. |
© 2022 by the authors. Licensee MDPI, Basel, Switzerland. This article is an open access article distributed under the terms and conditions of the Creative Commons Attribution (CC BY) license (https://creativecommons.org/licenses/by/4.0/).
Share and Cite
Yuan, K.; Lu, Y.; Li, W.; Yu, H.; Gao, S. Rheological Characterization and Accumulation Tests for Strong Thixotropic Engineering Slurry. Materials 2022, 15, 6891. https://doi.org/10.3390/ma15196891
Yuan K, Lu Y, Li W, Yu H, Gao S. Rheological Characterization and Accumulation Tests for Strong Thixotropic Engineering Slurry. Materials. 2022; 15(19):6891. https://doi.org/10.3390/ma15196891
Chicago/Turabian StyleYuan, Kekuo, Yating Lu, Wanlu Li, Hongdan Yu, and Shan Gao. 2022. "Rheological Characterization and Accumulation Tests for Strong Thixotropic Engineering Slurry" Materials 15, no. 19: 6891. https://doi.org/10.3390/ma15196891
APA StyleYuan, K., Lu, Y., Li, W., Yu, H., & Gao, S. (2022). Rheological Characterization and Accumulation Tests for Strong Thixotropic Engineering Slurry. Materials, 15(19), 6891. https://doi.org/10.3390/ma15196891