


Equilibrium and Kinetic Modeling of Crystal Violet Dye Adsorption by a Marine Diatom, Skeletonema costatum

 ,
,  ,
, 
Abstract
1. Introduction
2. Materials and Methods
2.1. Materials
2.1.1. Skeletonema costatum
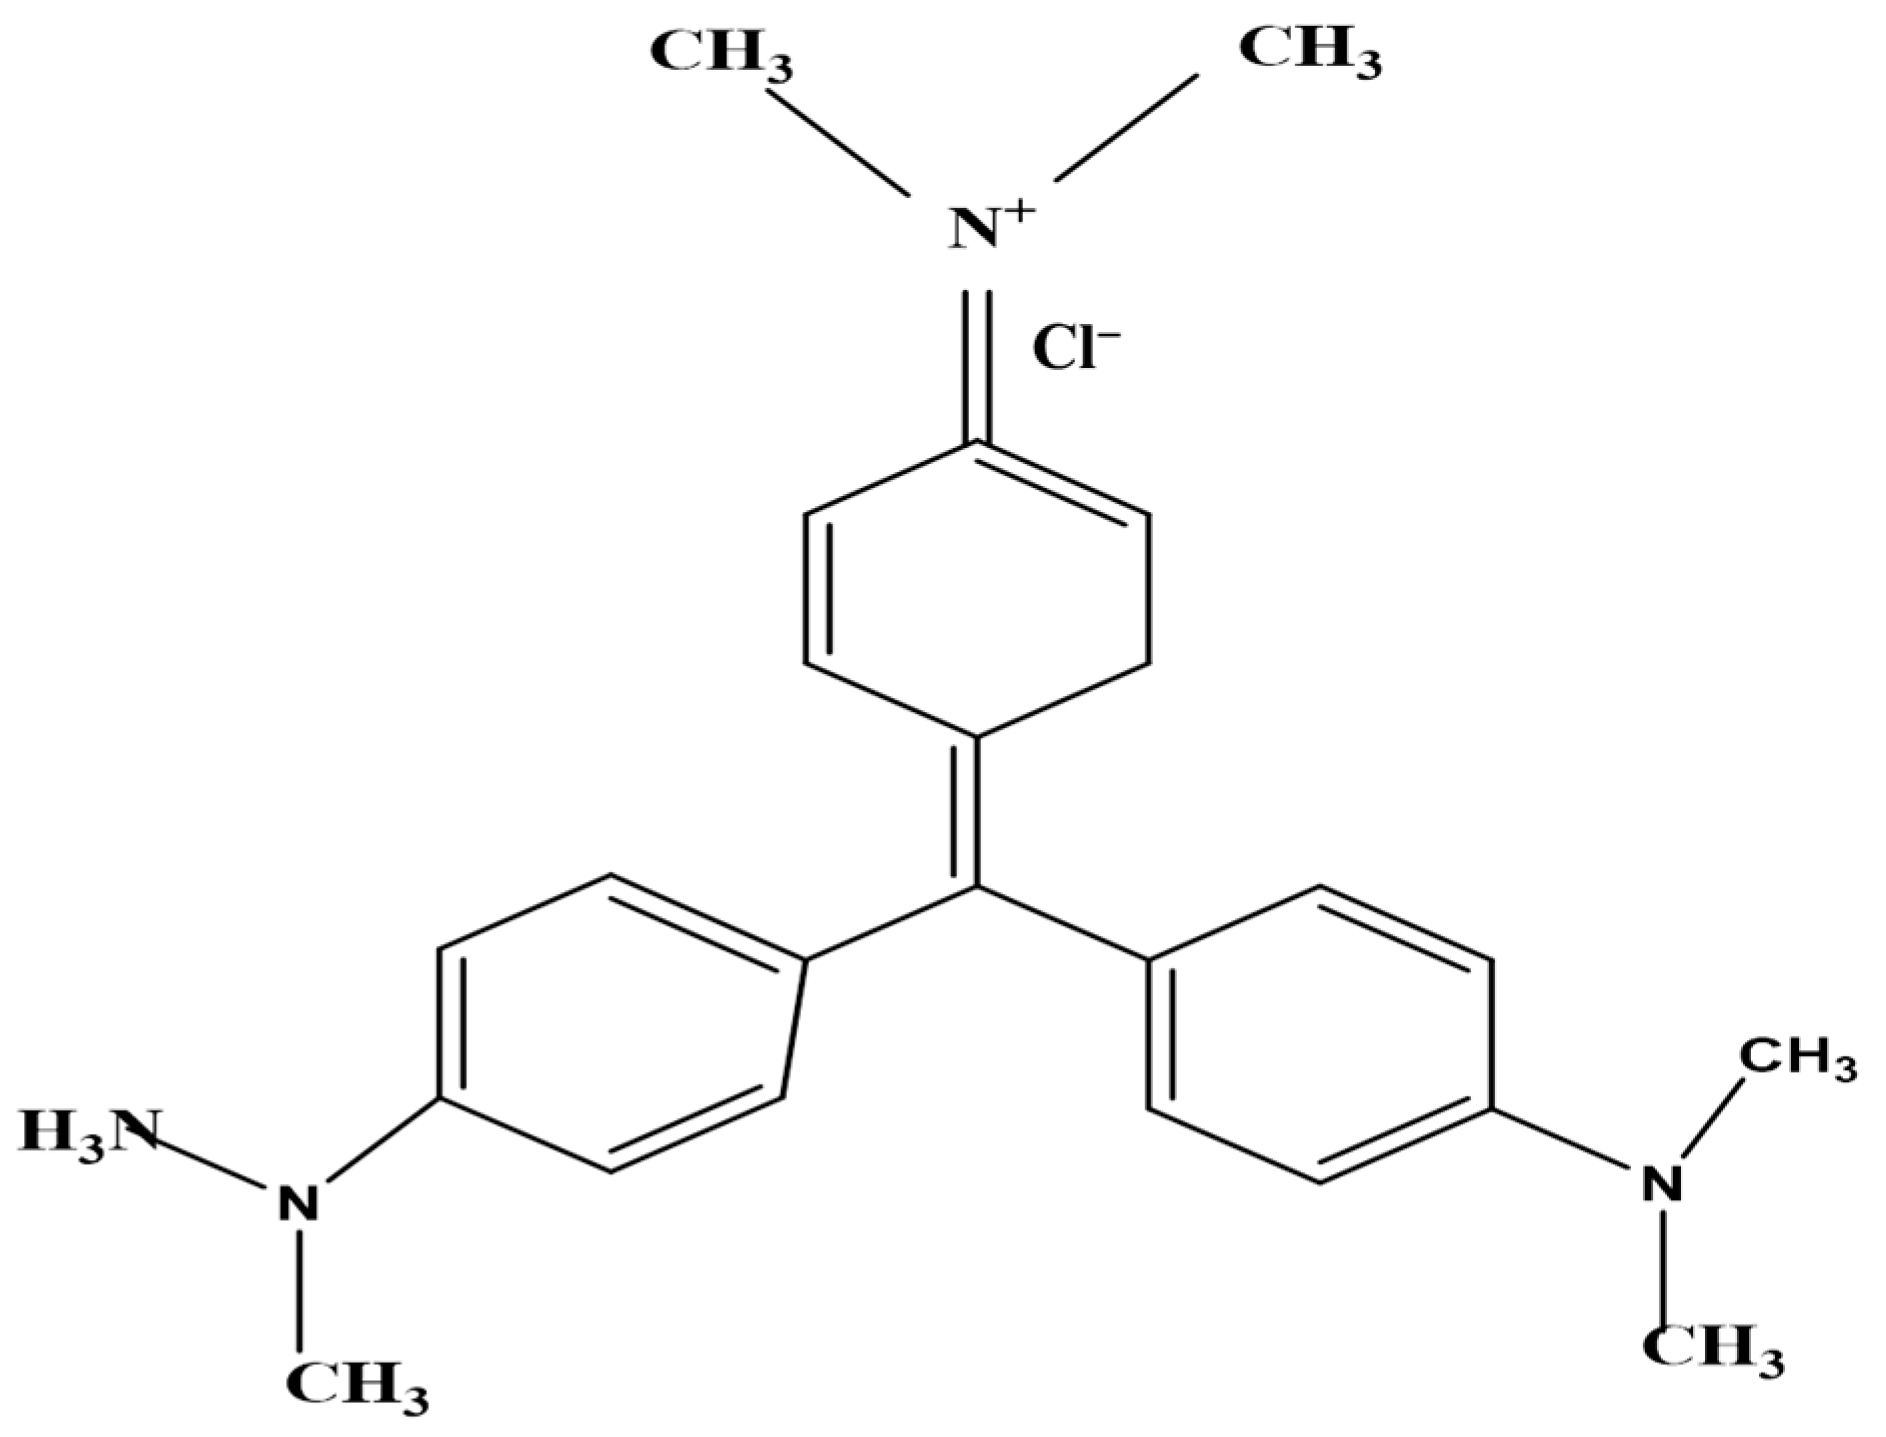
2.1.2. Crystal Violet Dye (CVD)
2.1.3. Chemical and Reagents
2.2. Methods
Batch Adsorption Process
2.3. Characterizations
2.4. Data Analysis
3. Results and Discussion
3.1. S. costatum (Adsorbent) Characterization
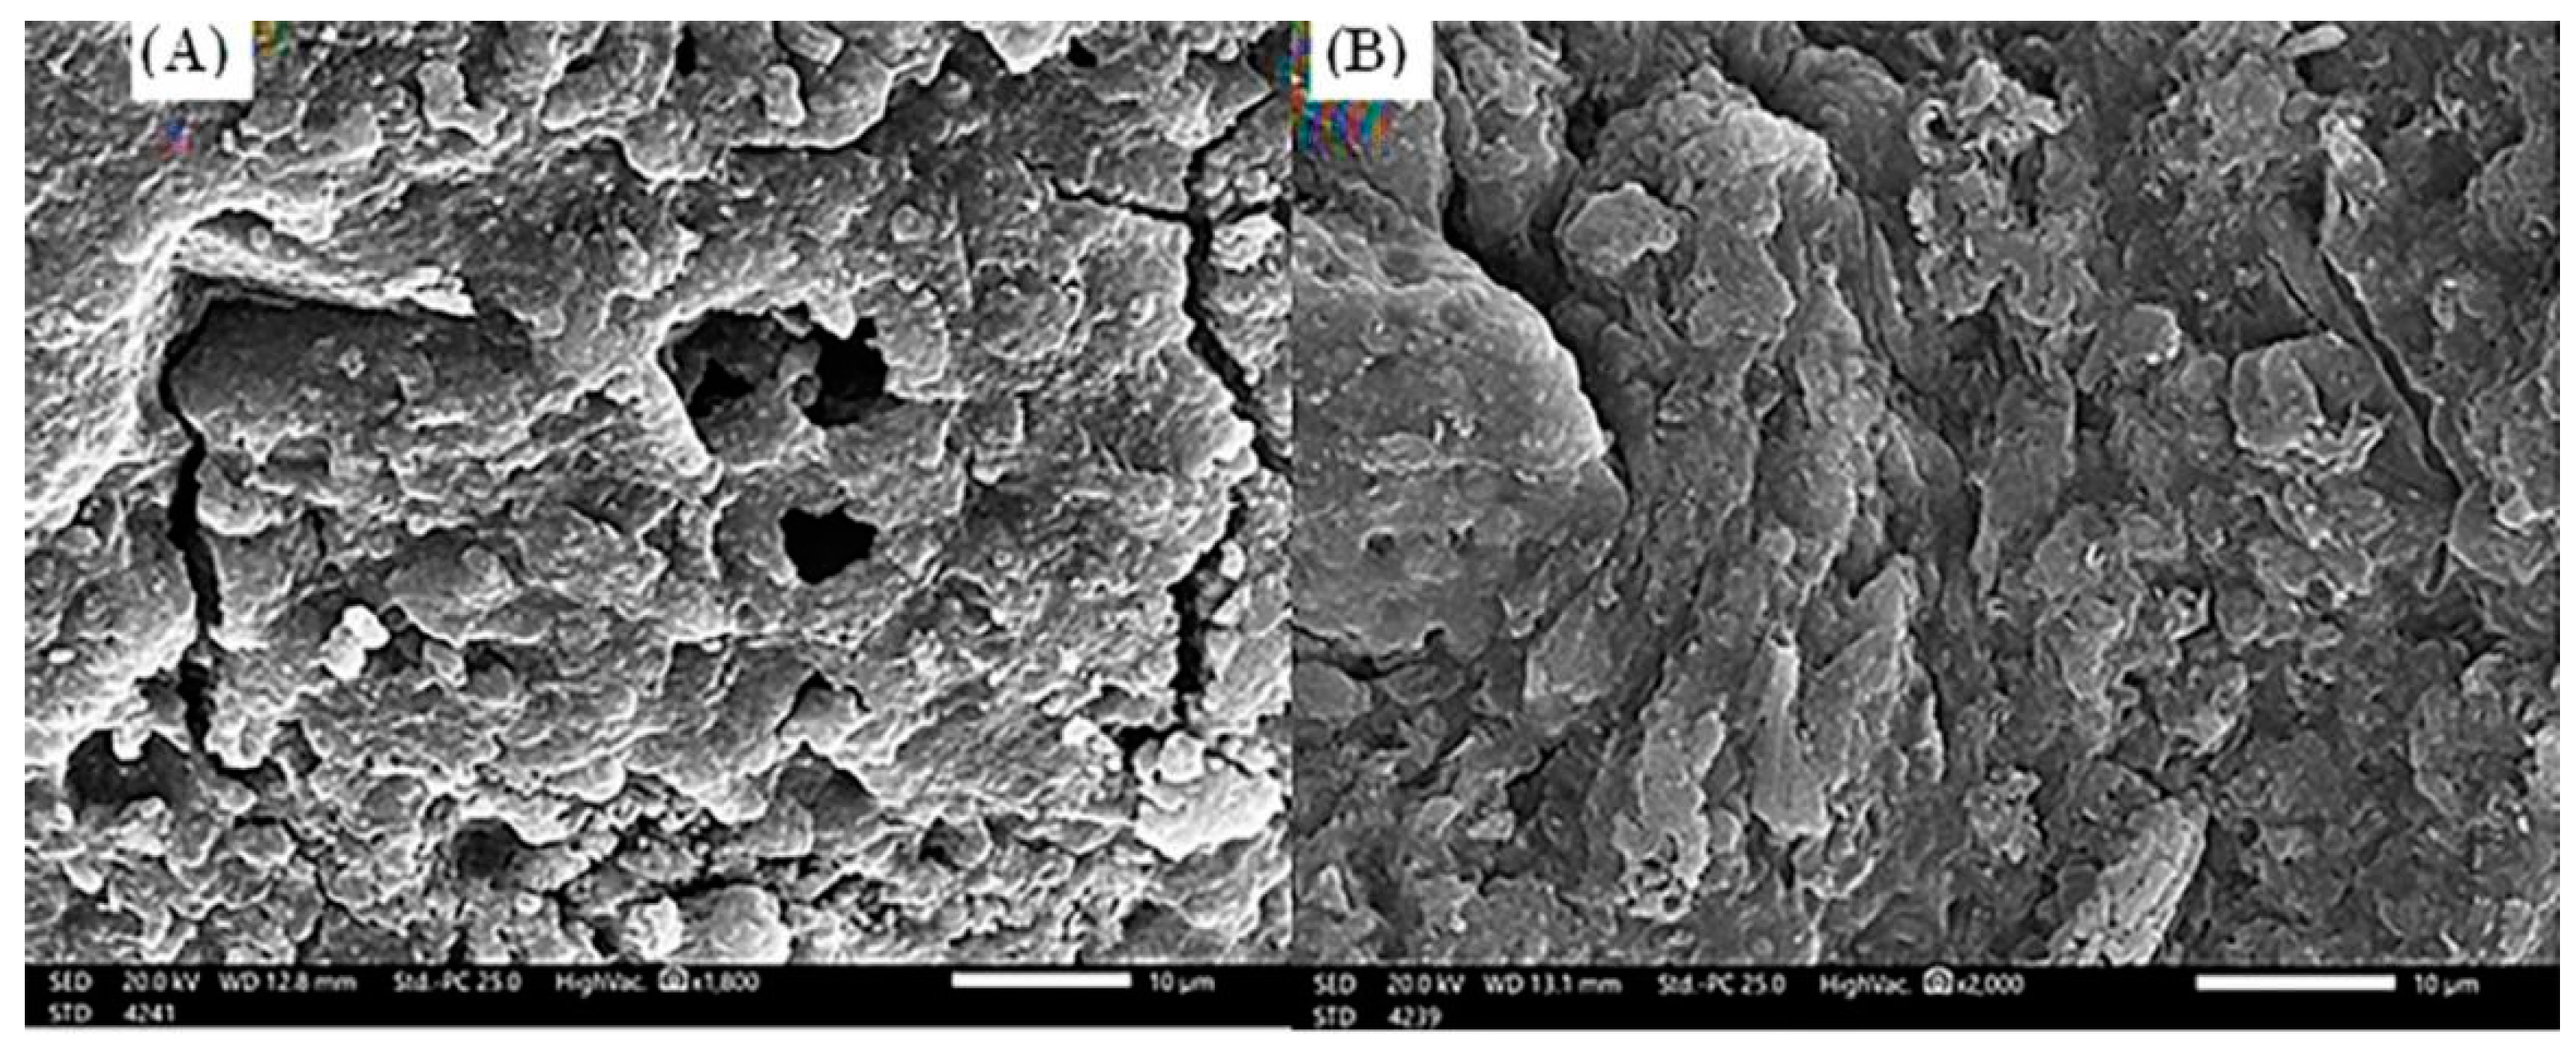
3.1.1. SEM
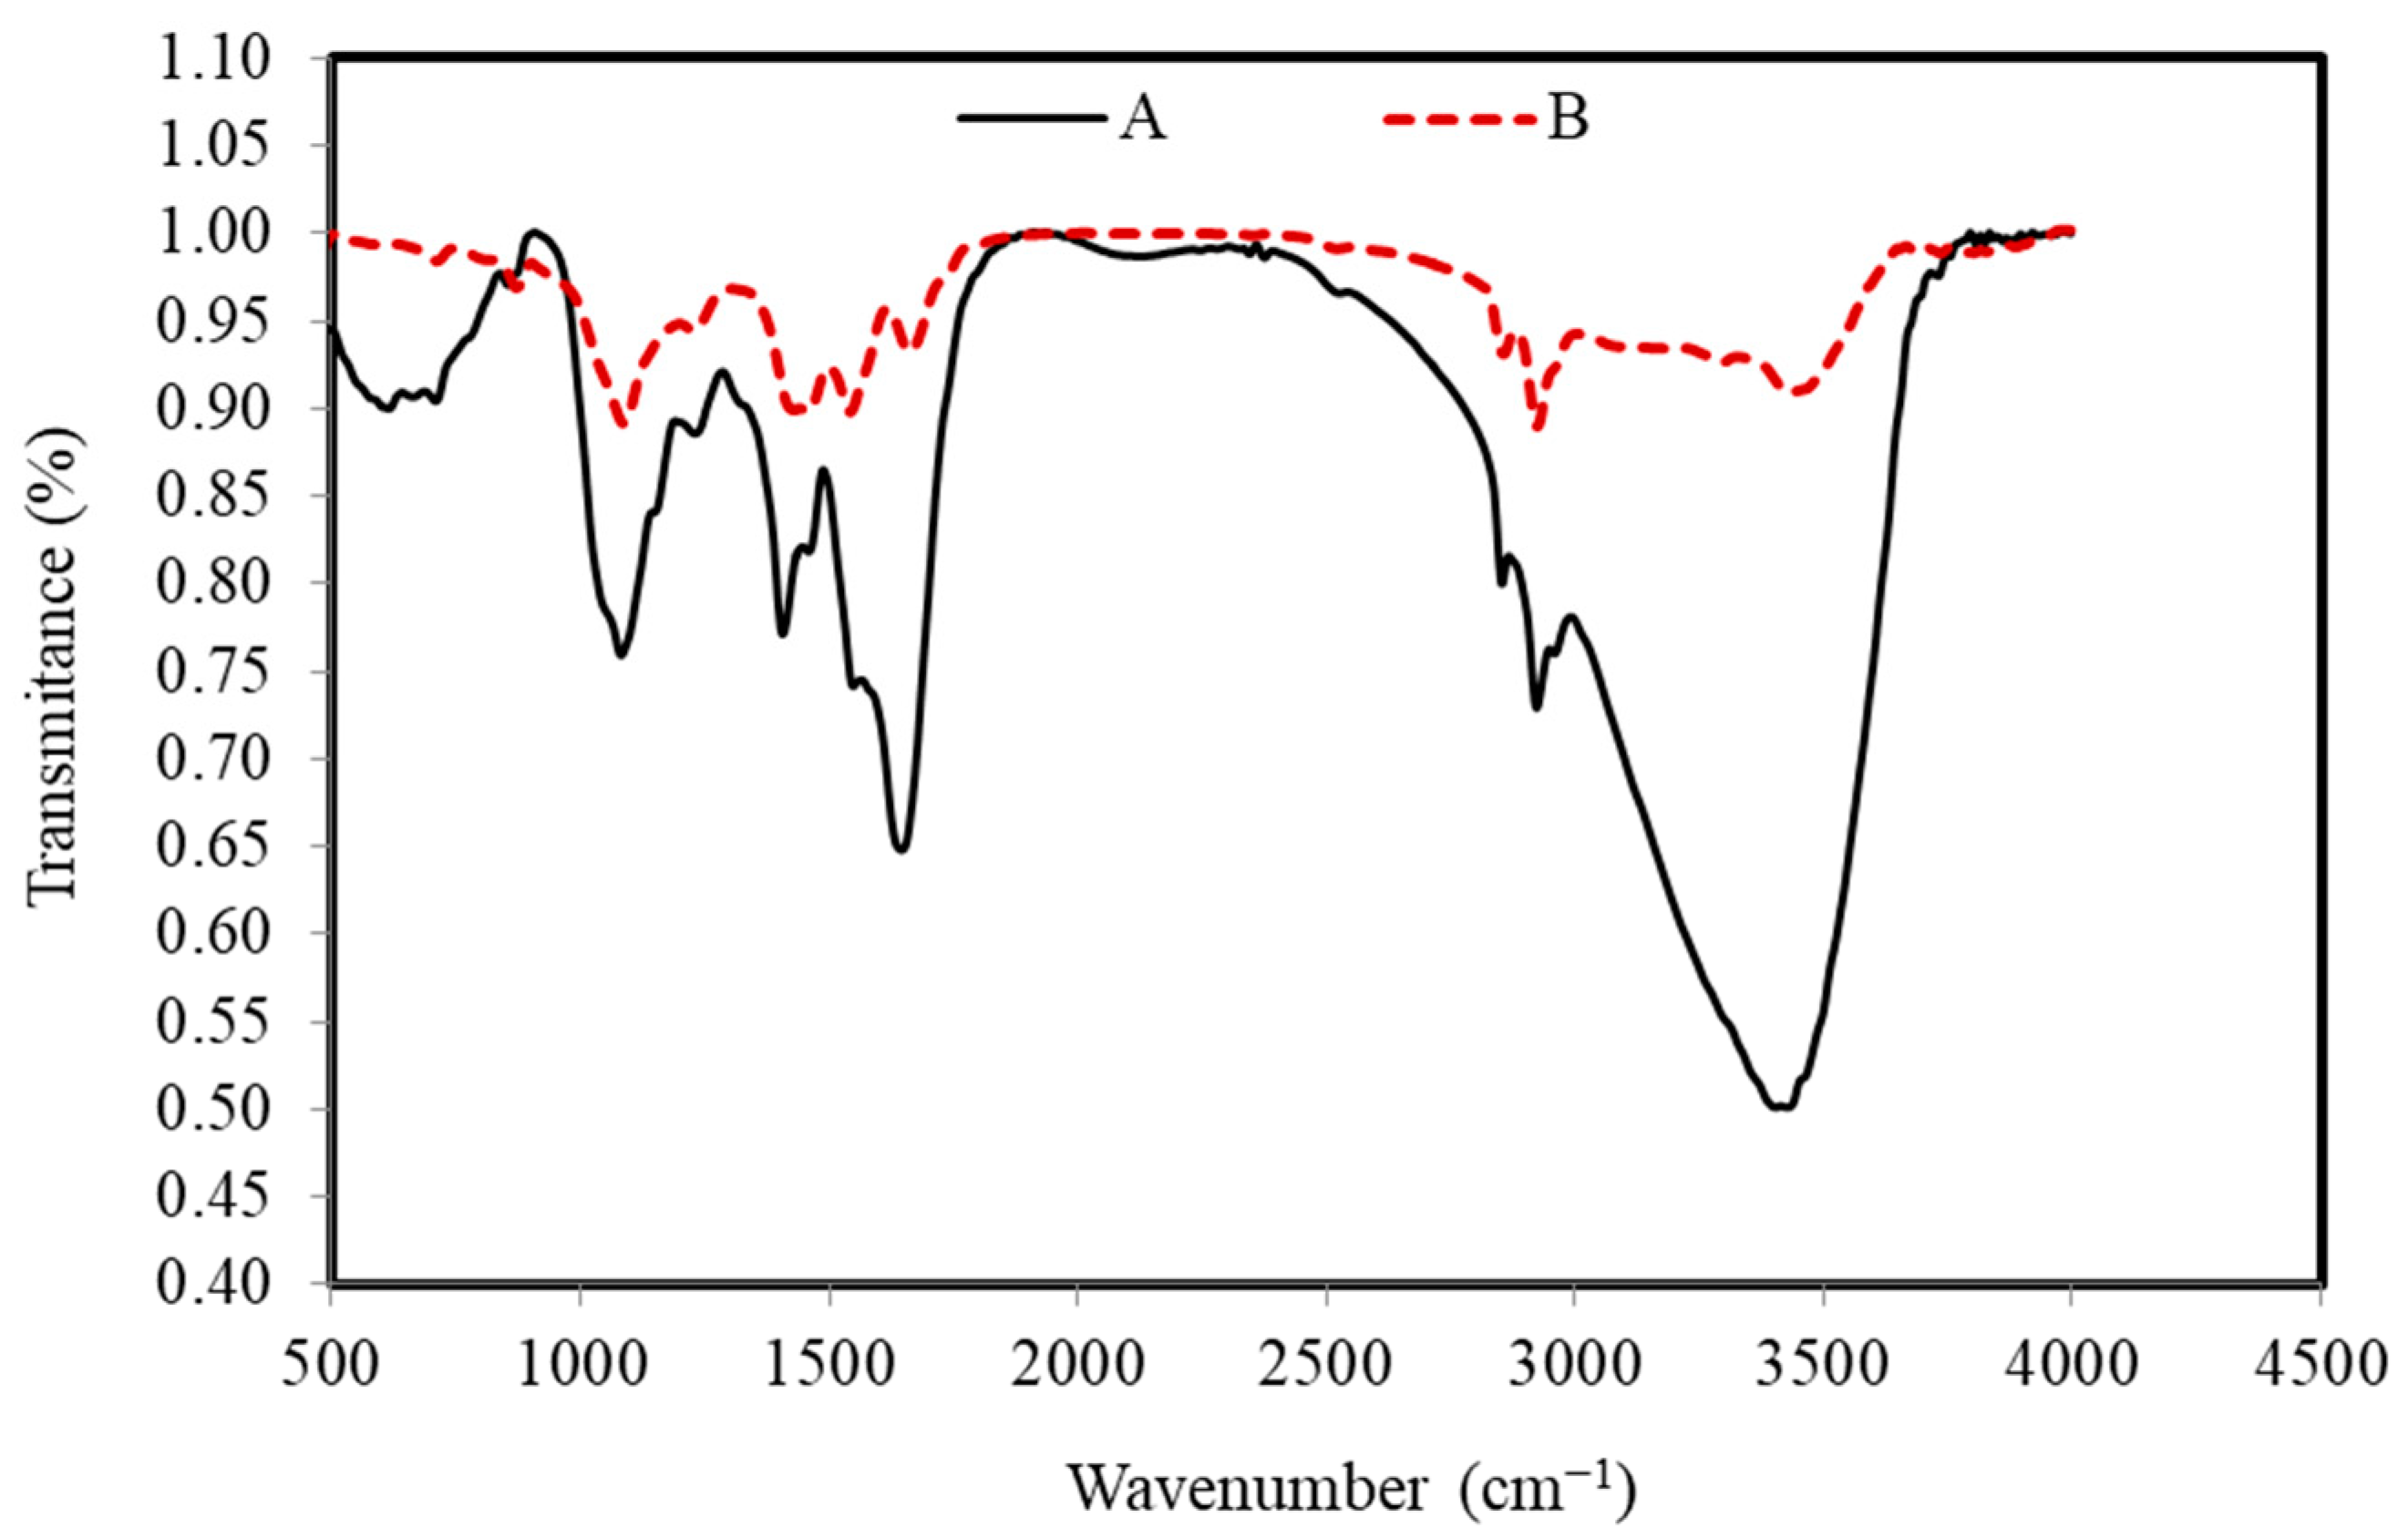
3.1.2. FTIR
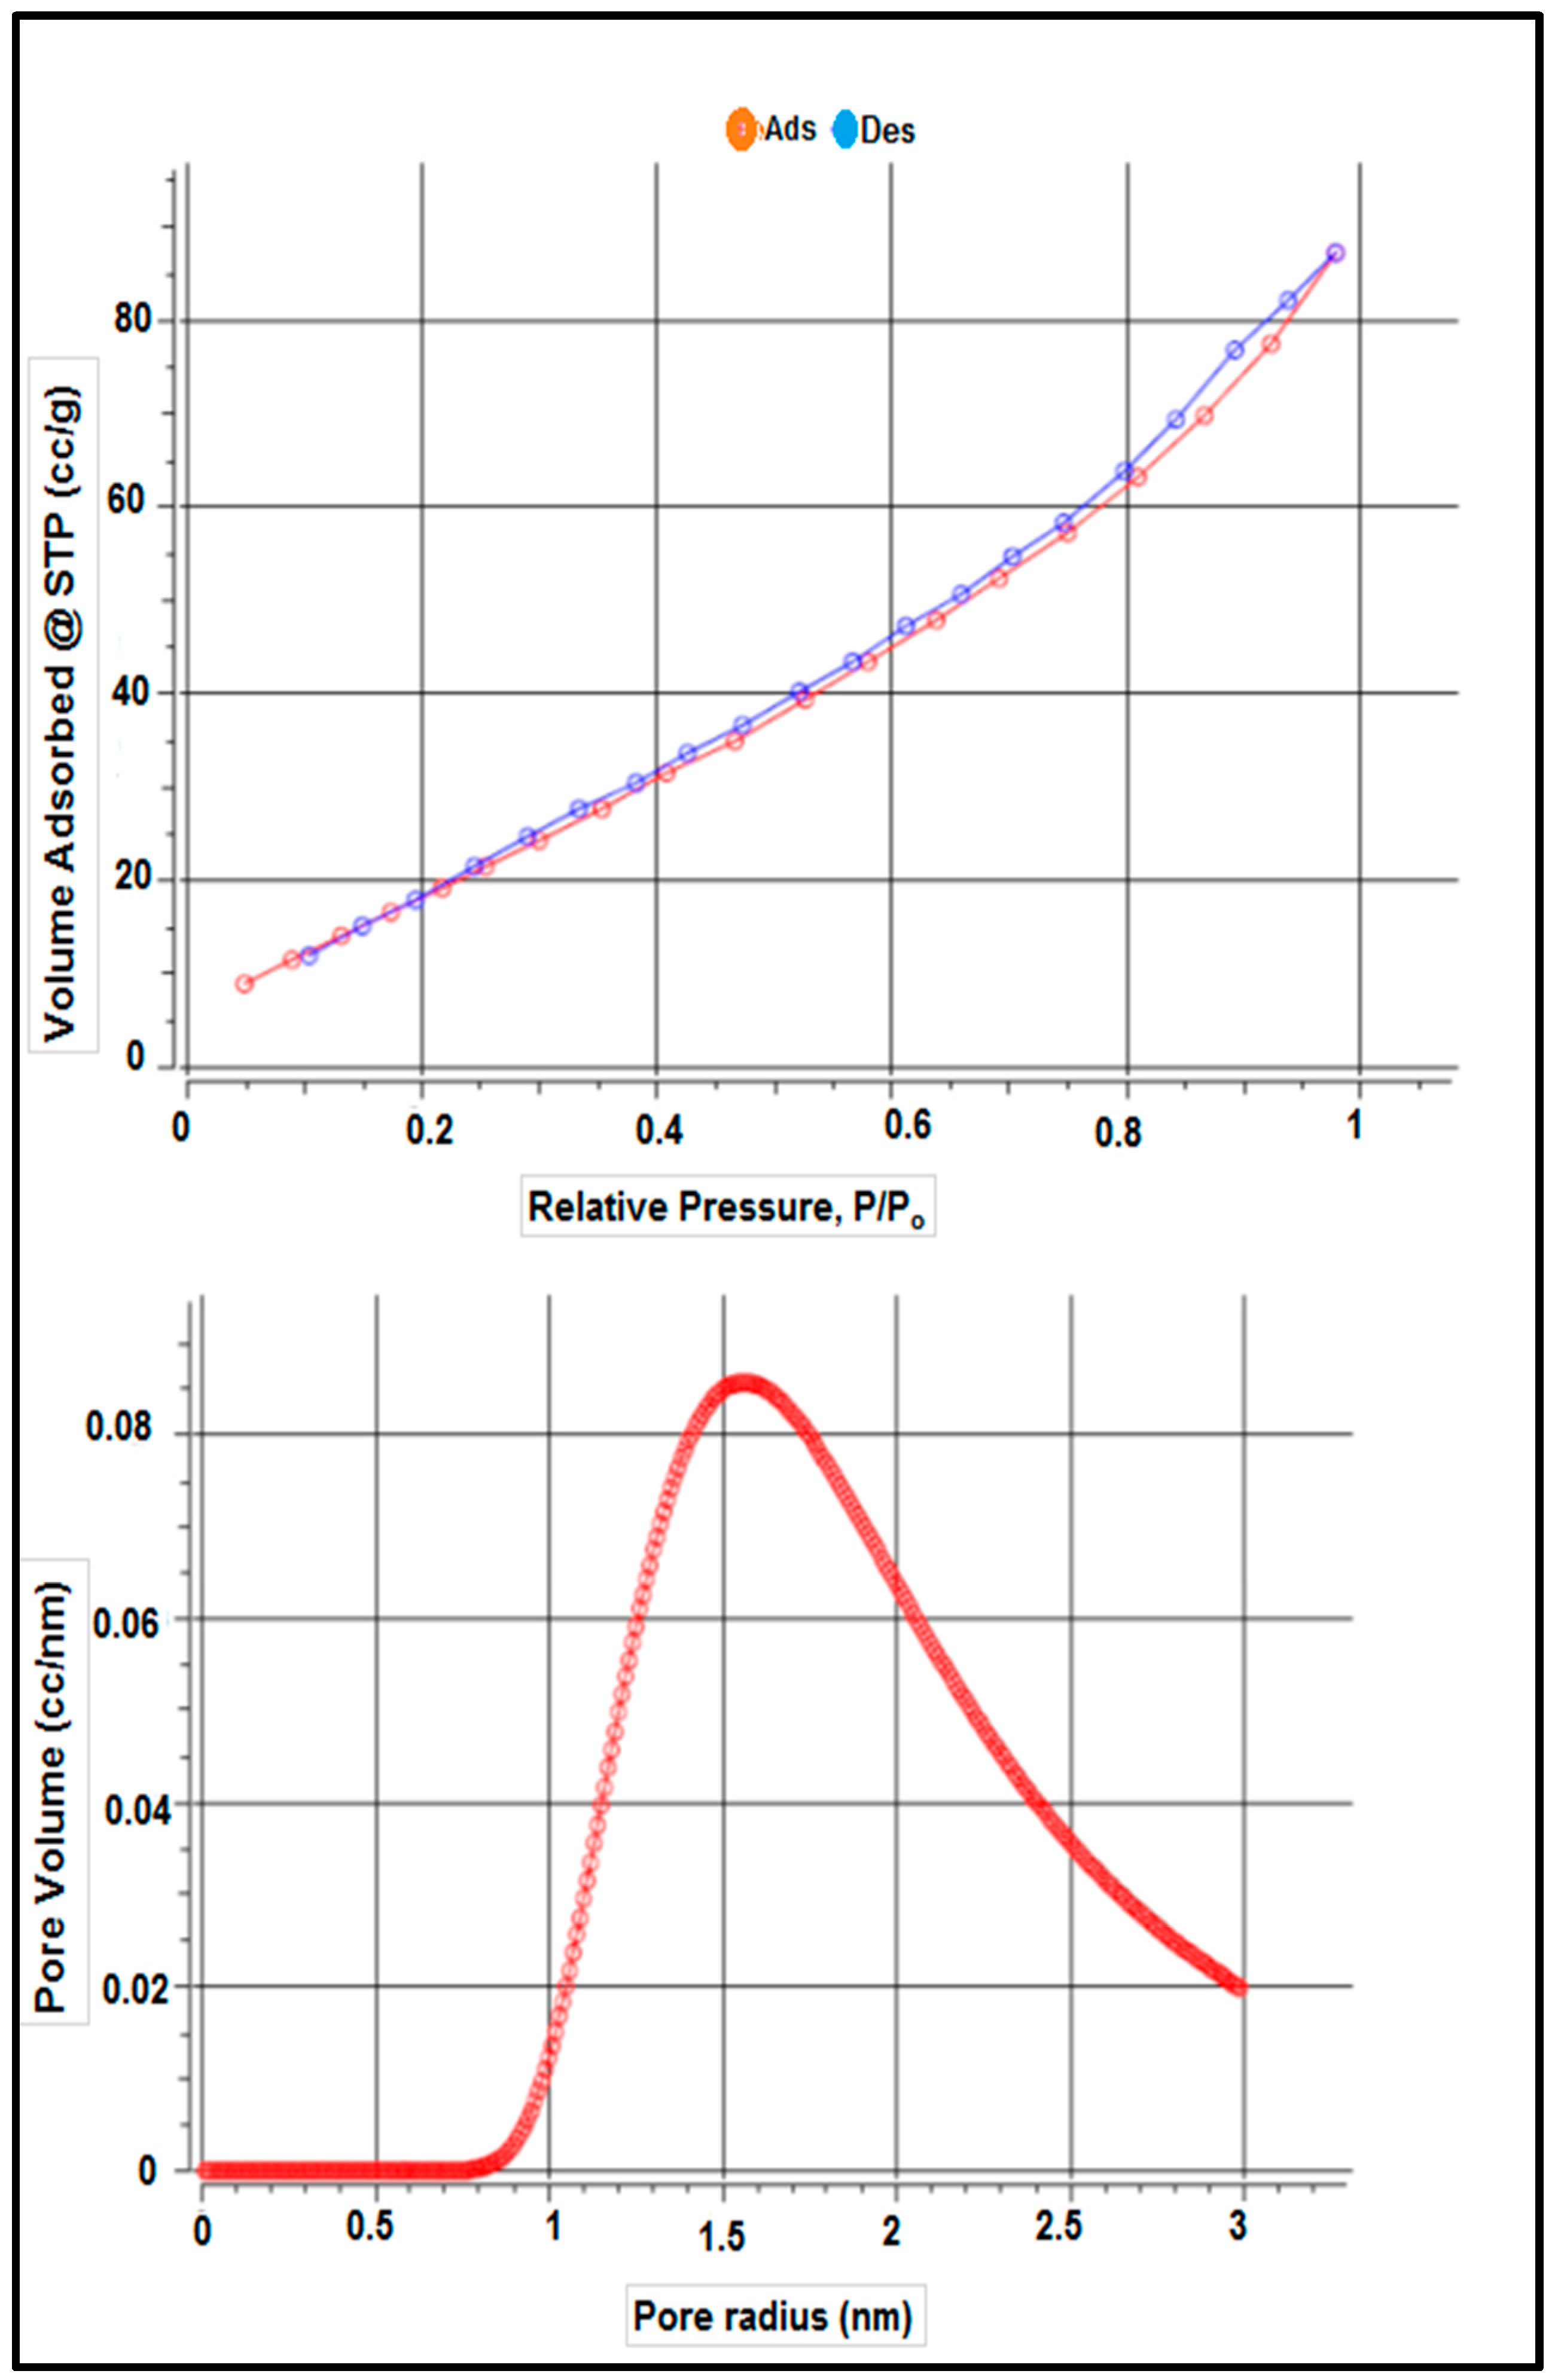
3.1.3. BET
3.2. Adsorption Studies
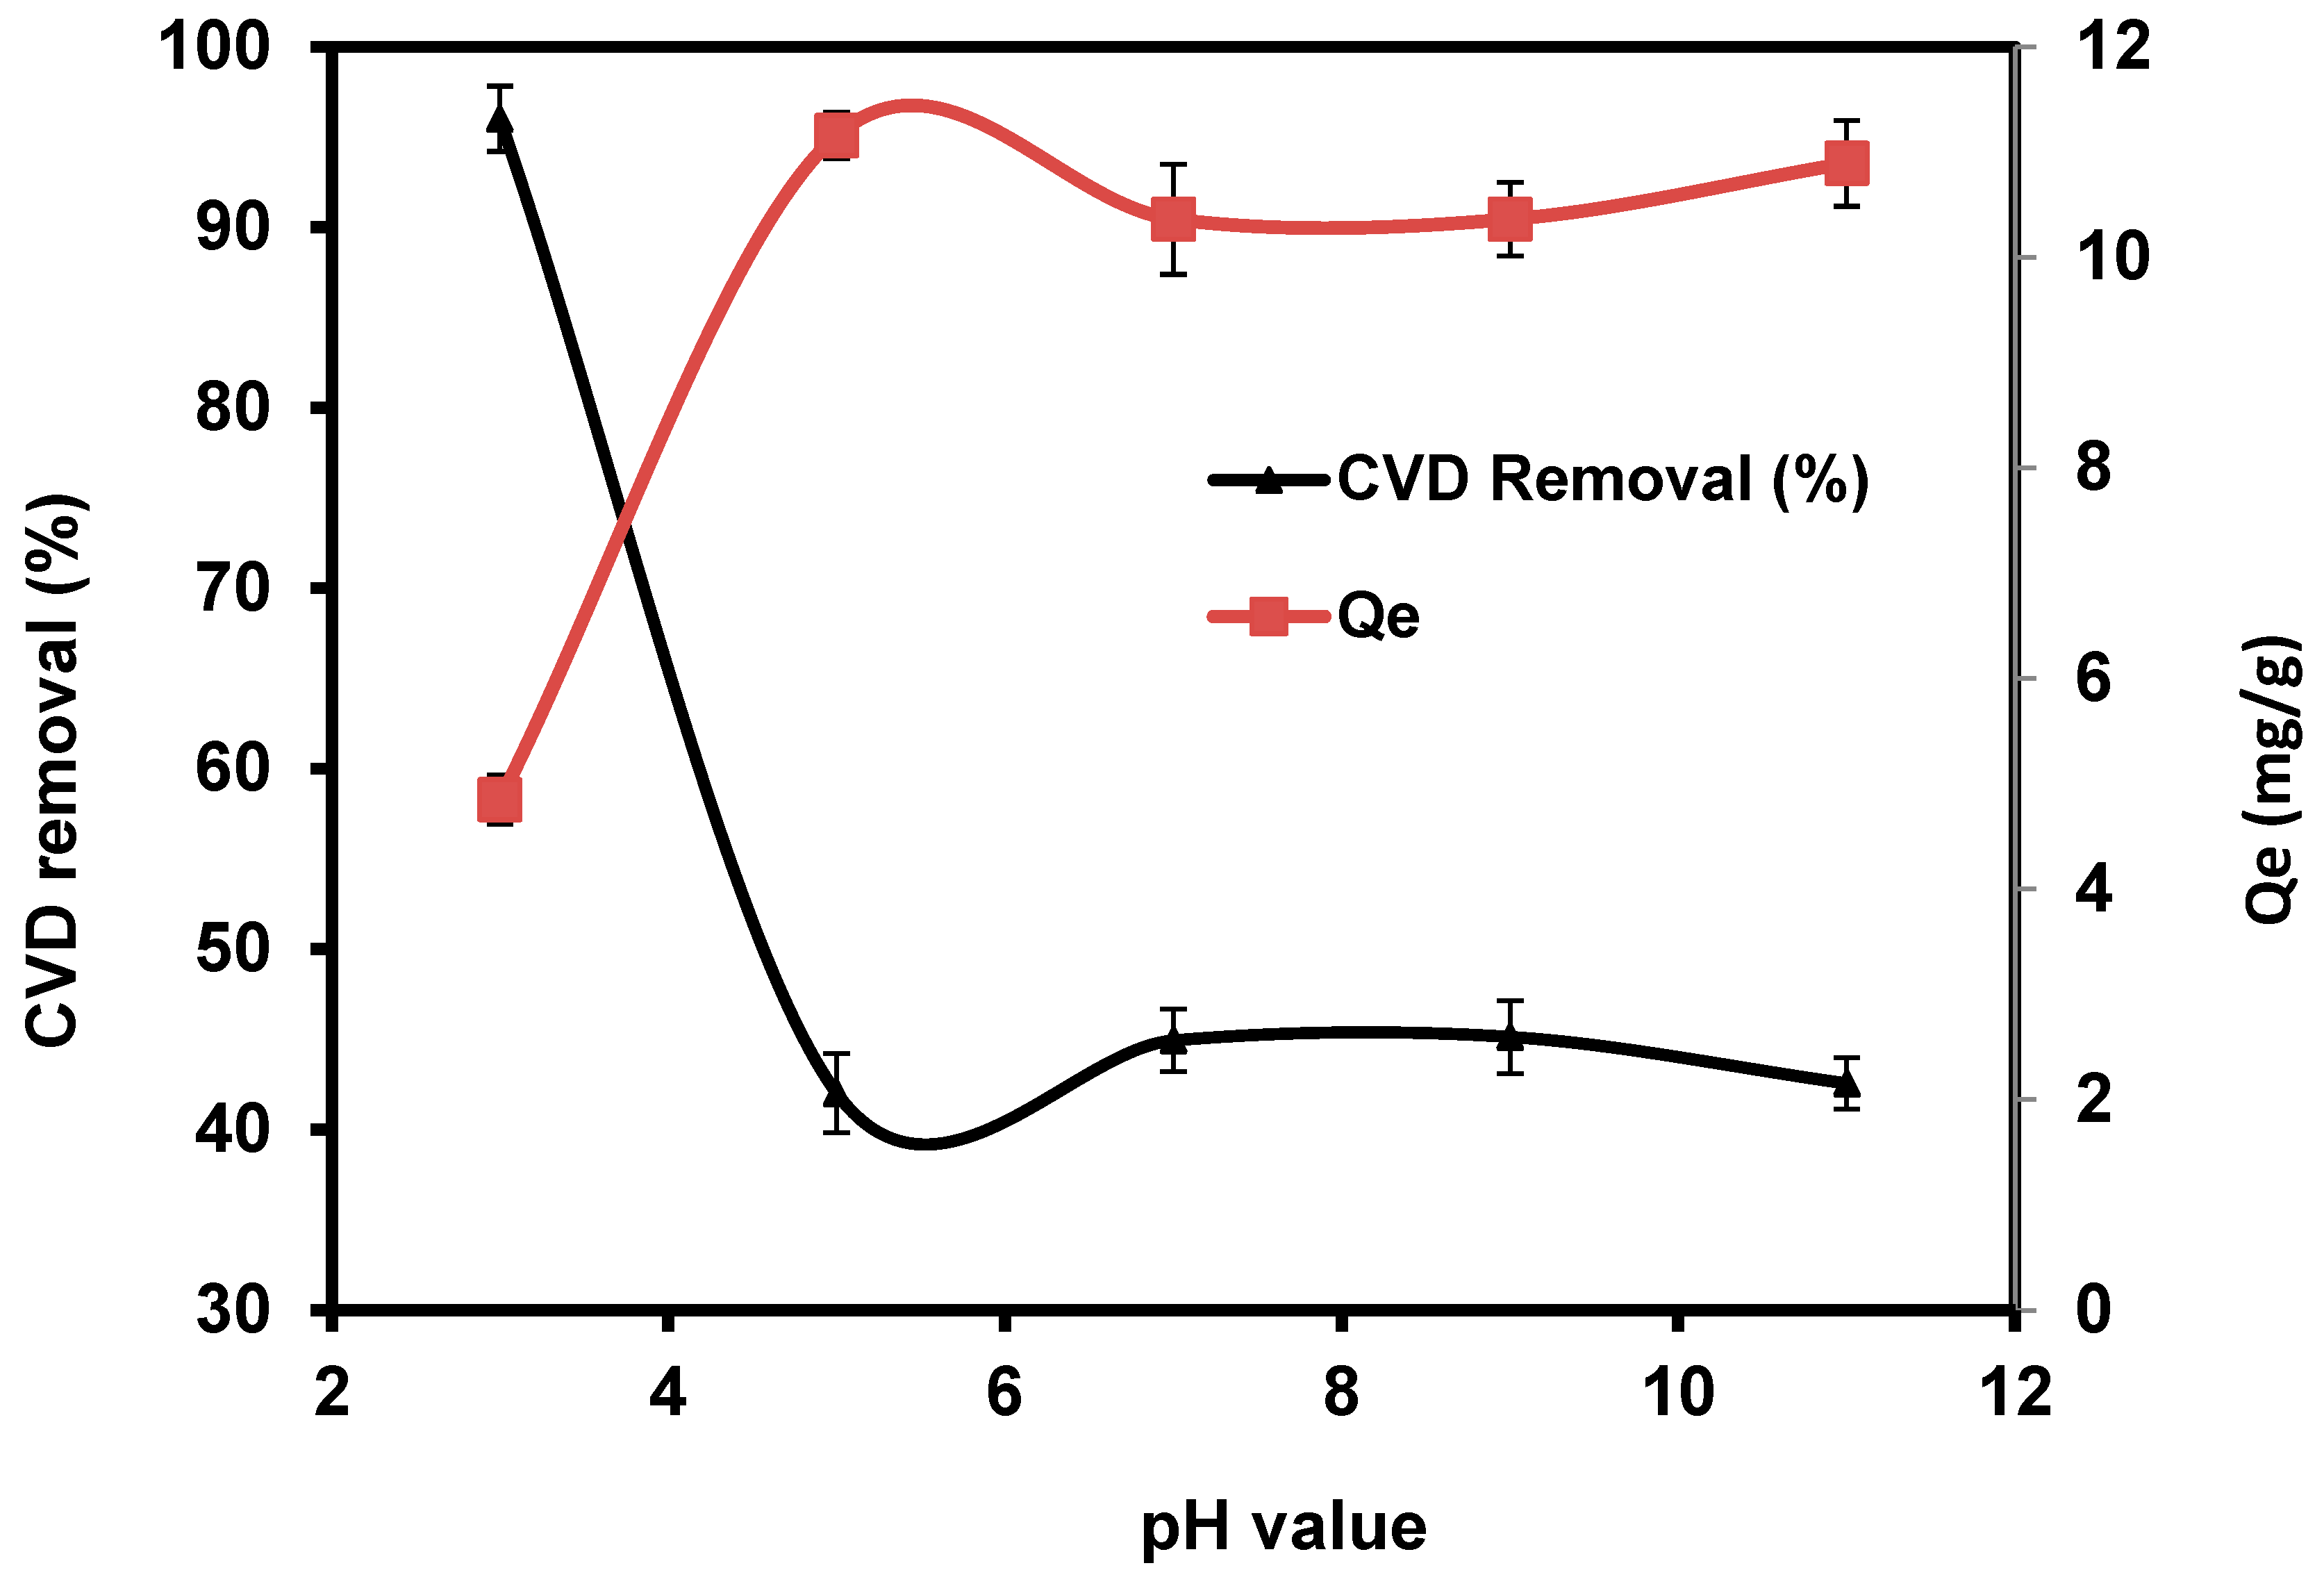
3.2.1. pH
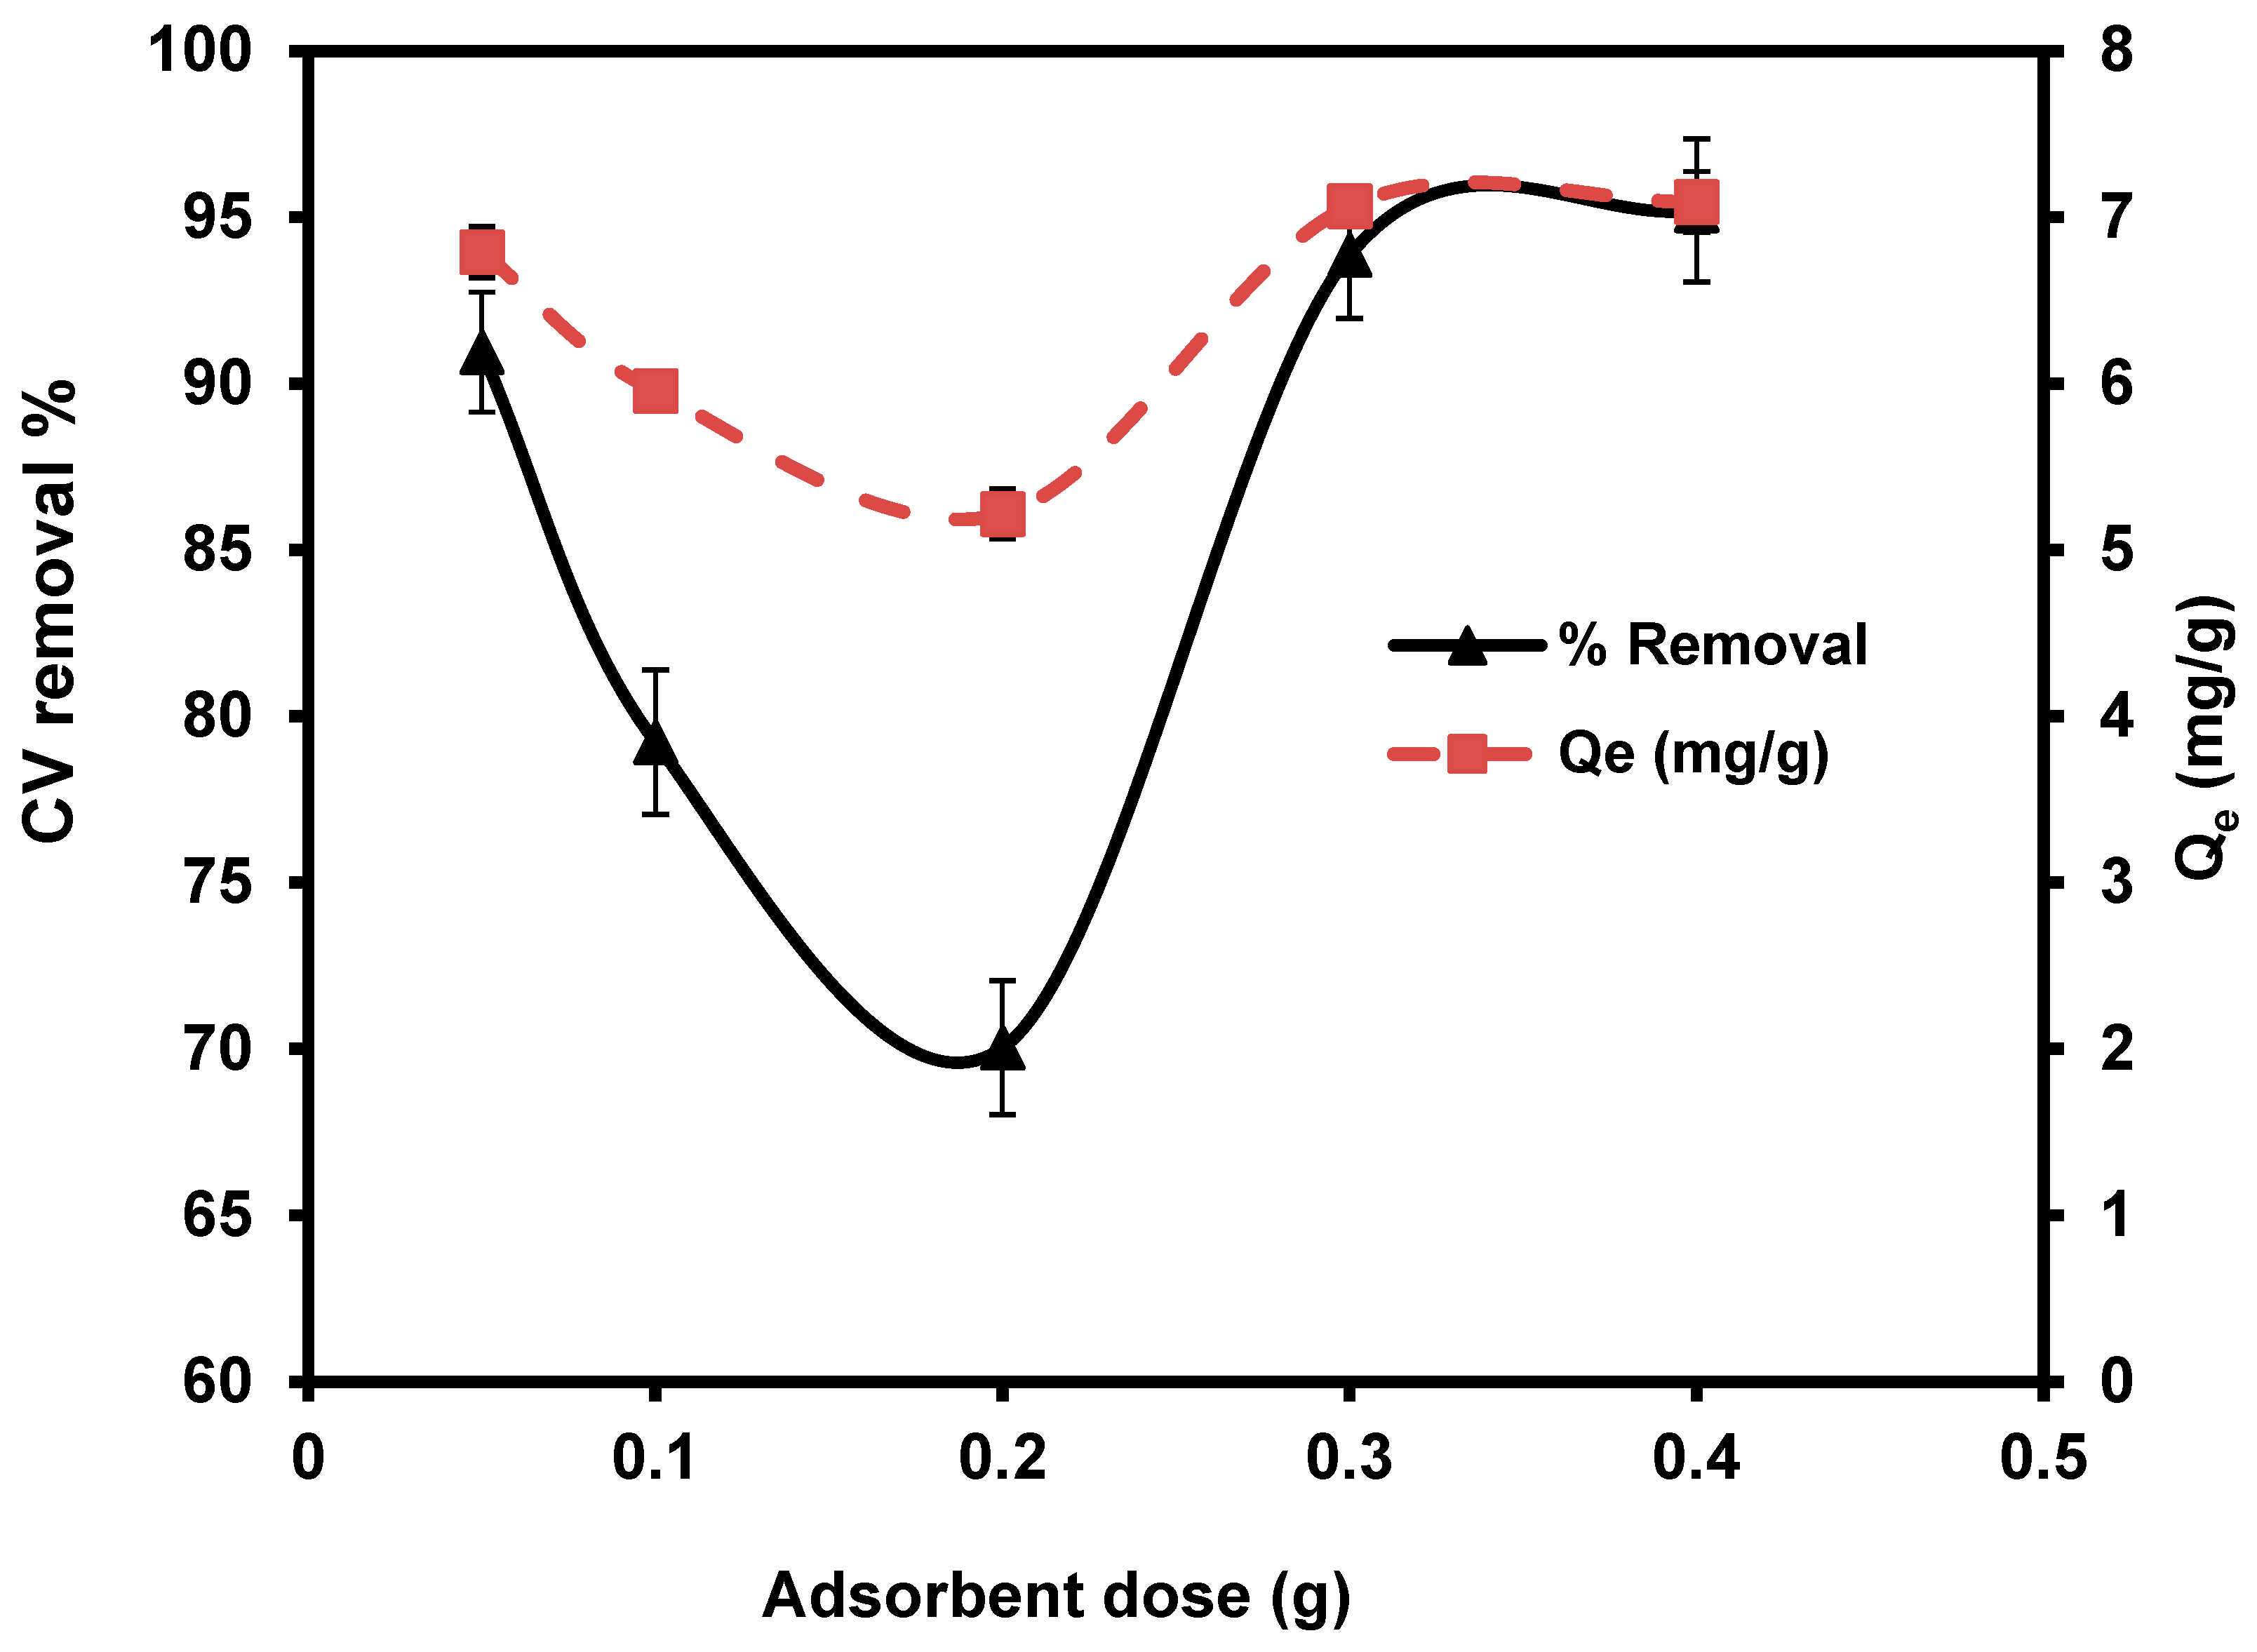
3.2.2. Adsorbent Dose of S. costatum
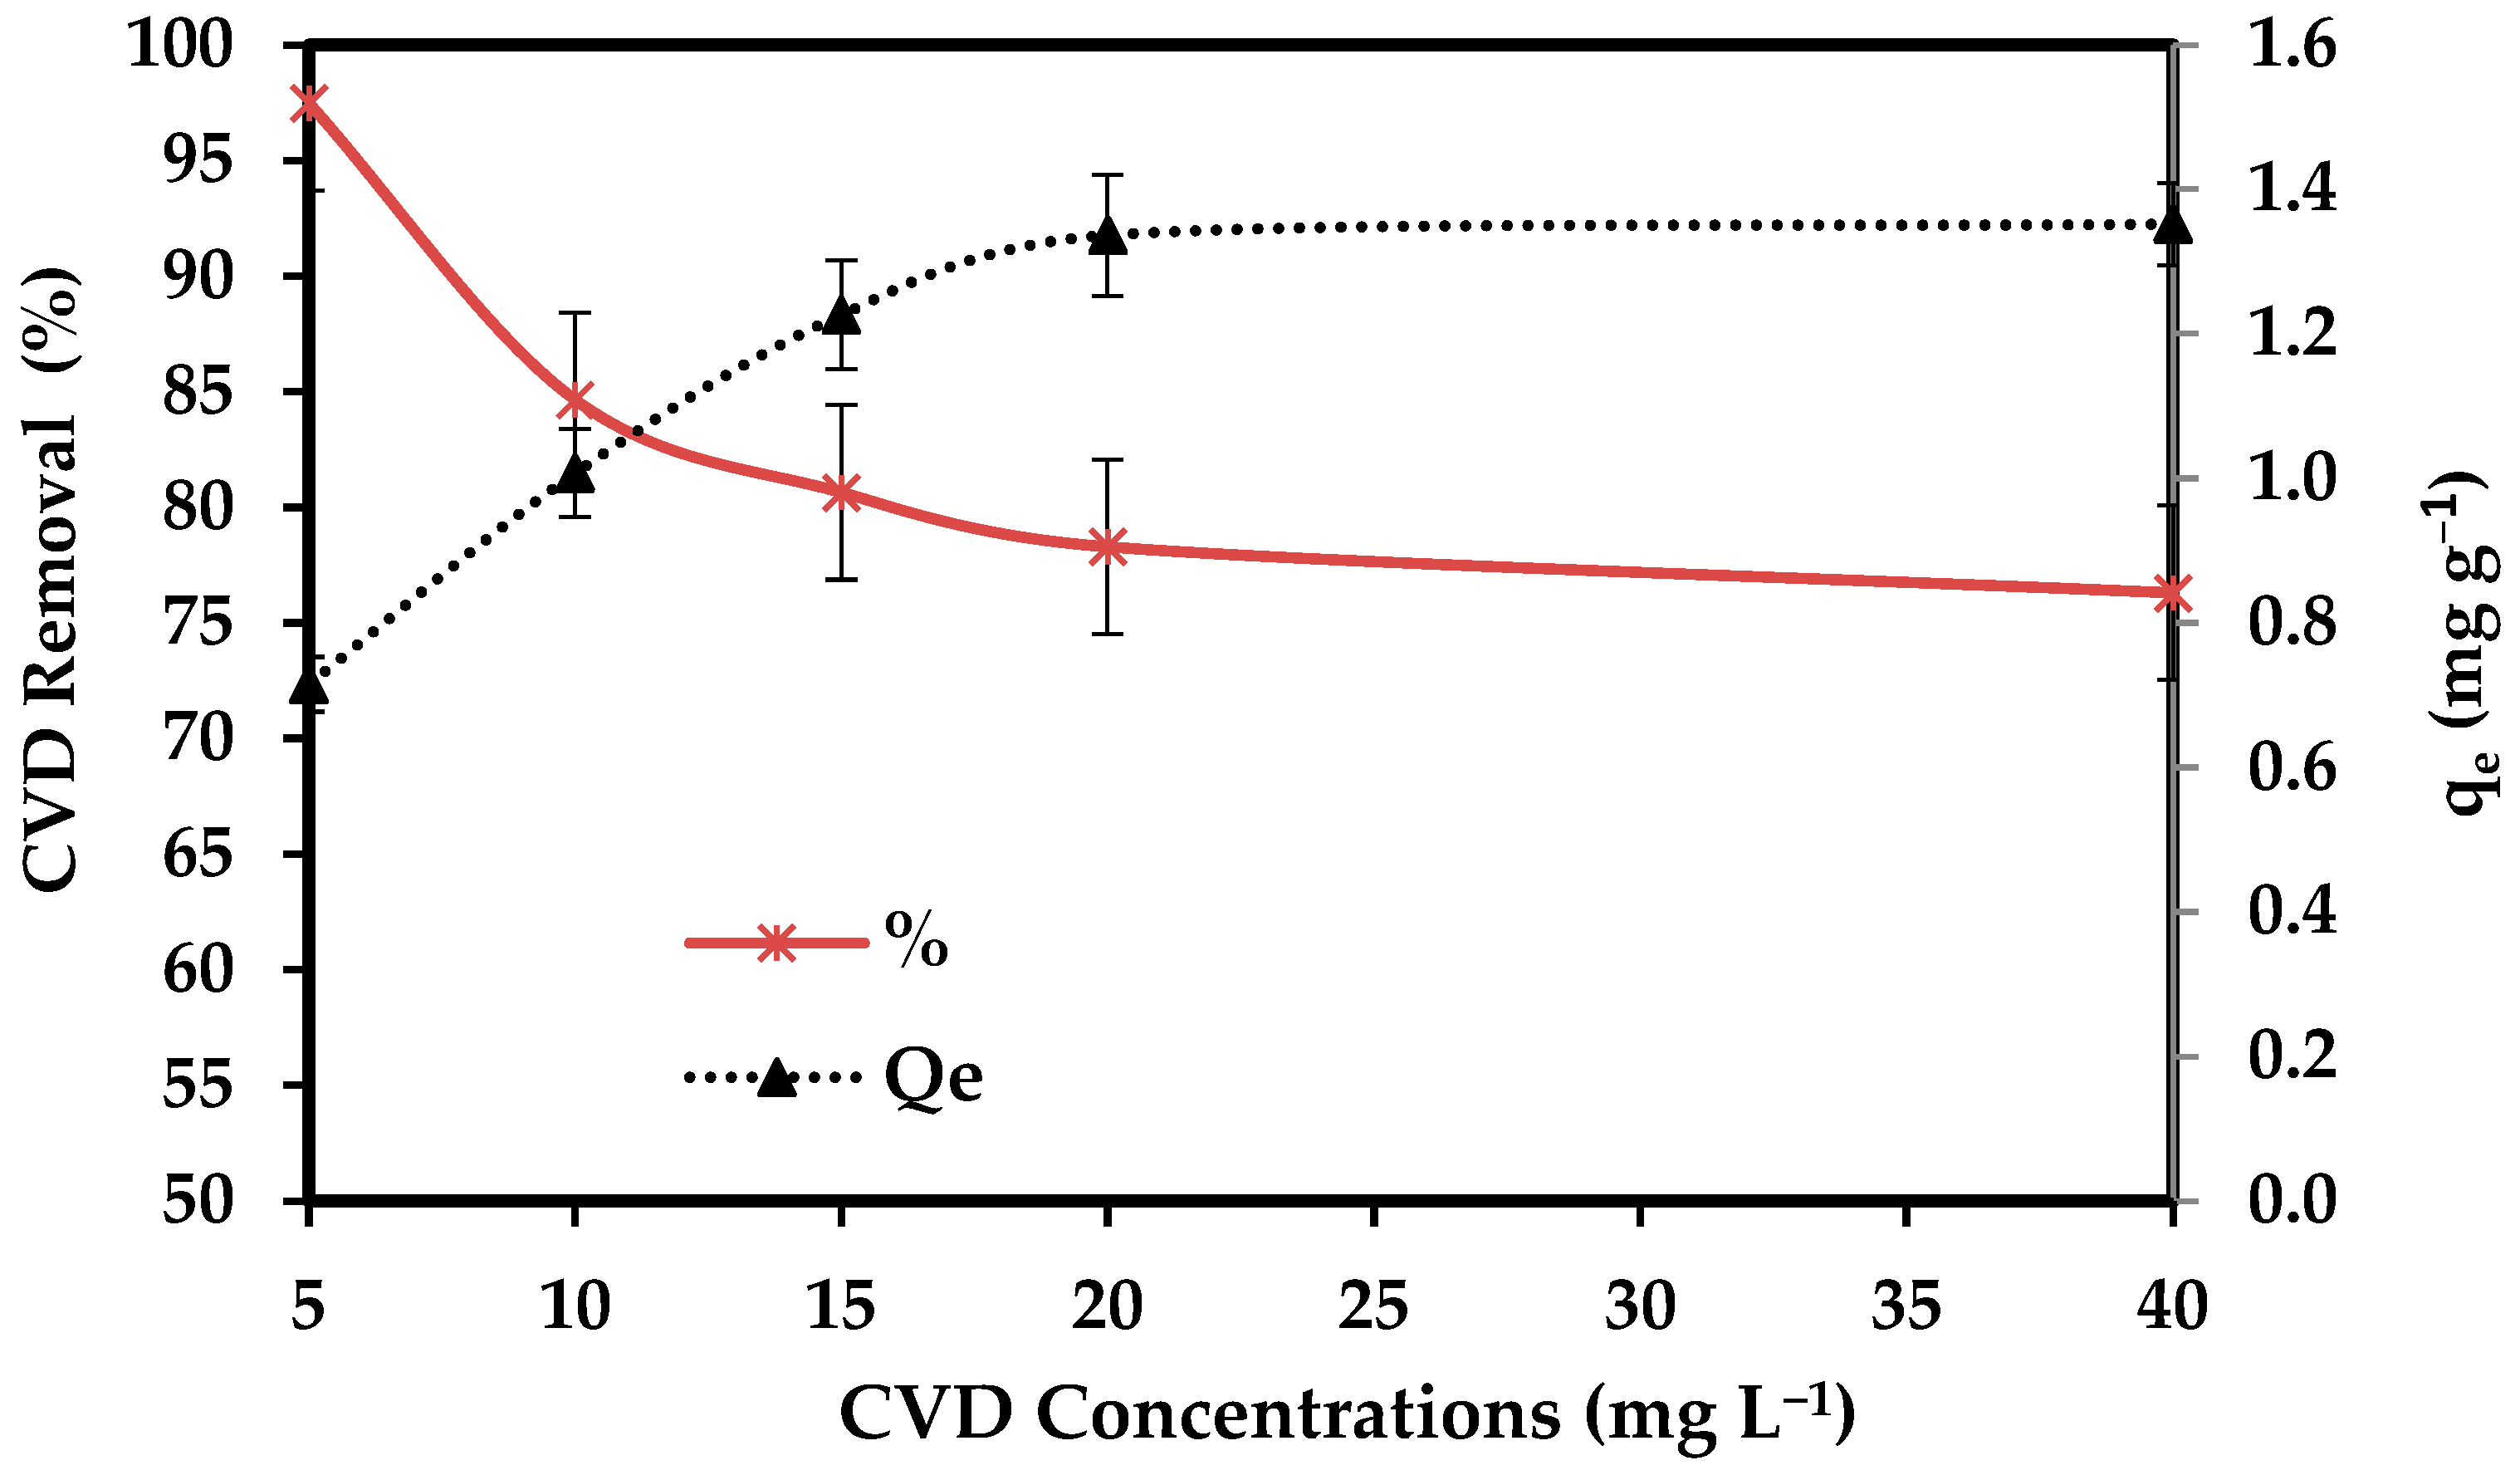
3.2.3. CVD Concentrations
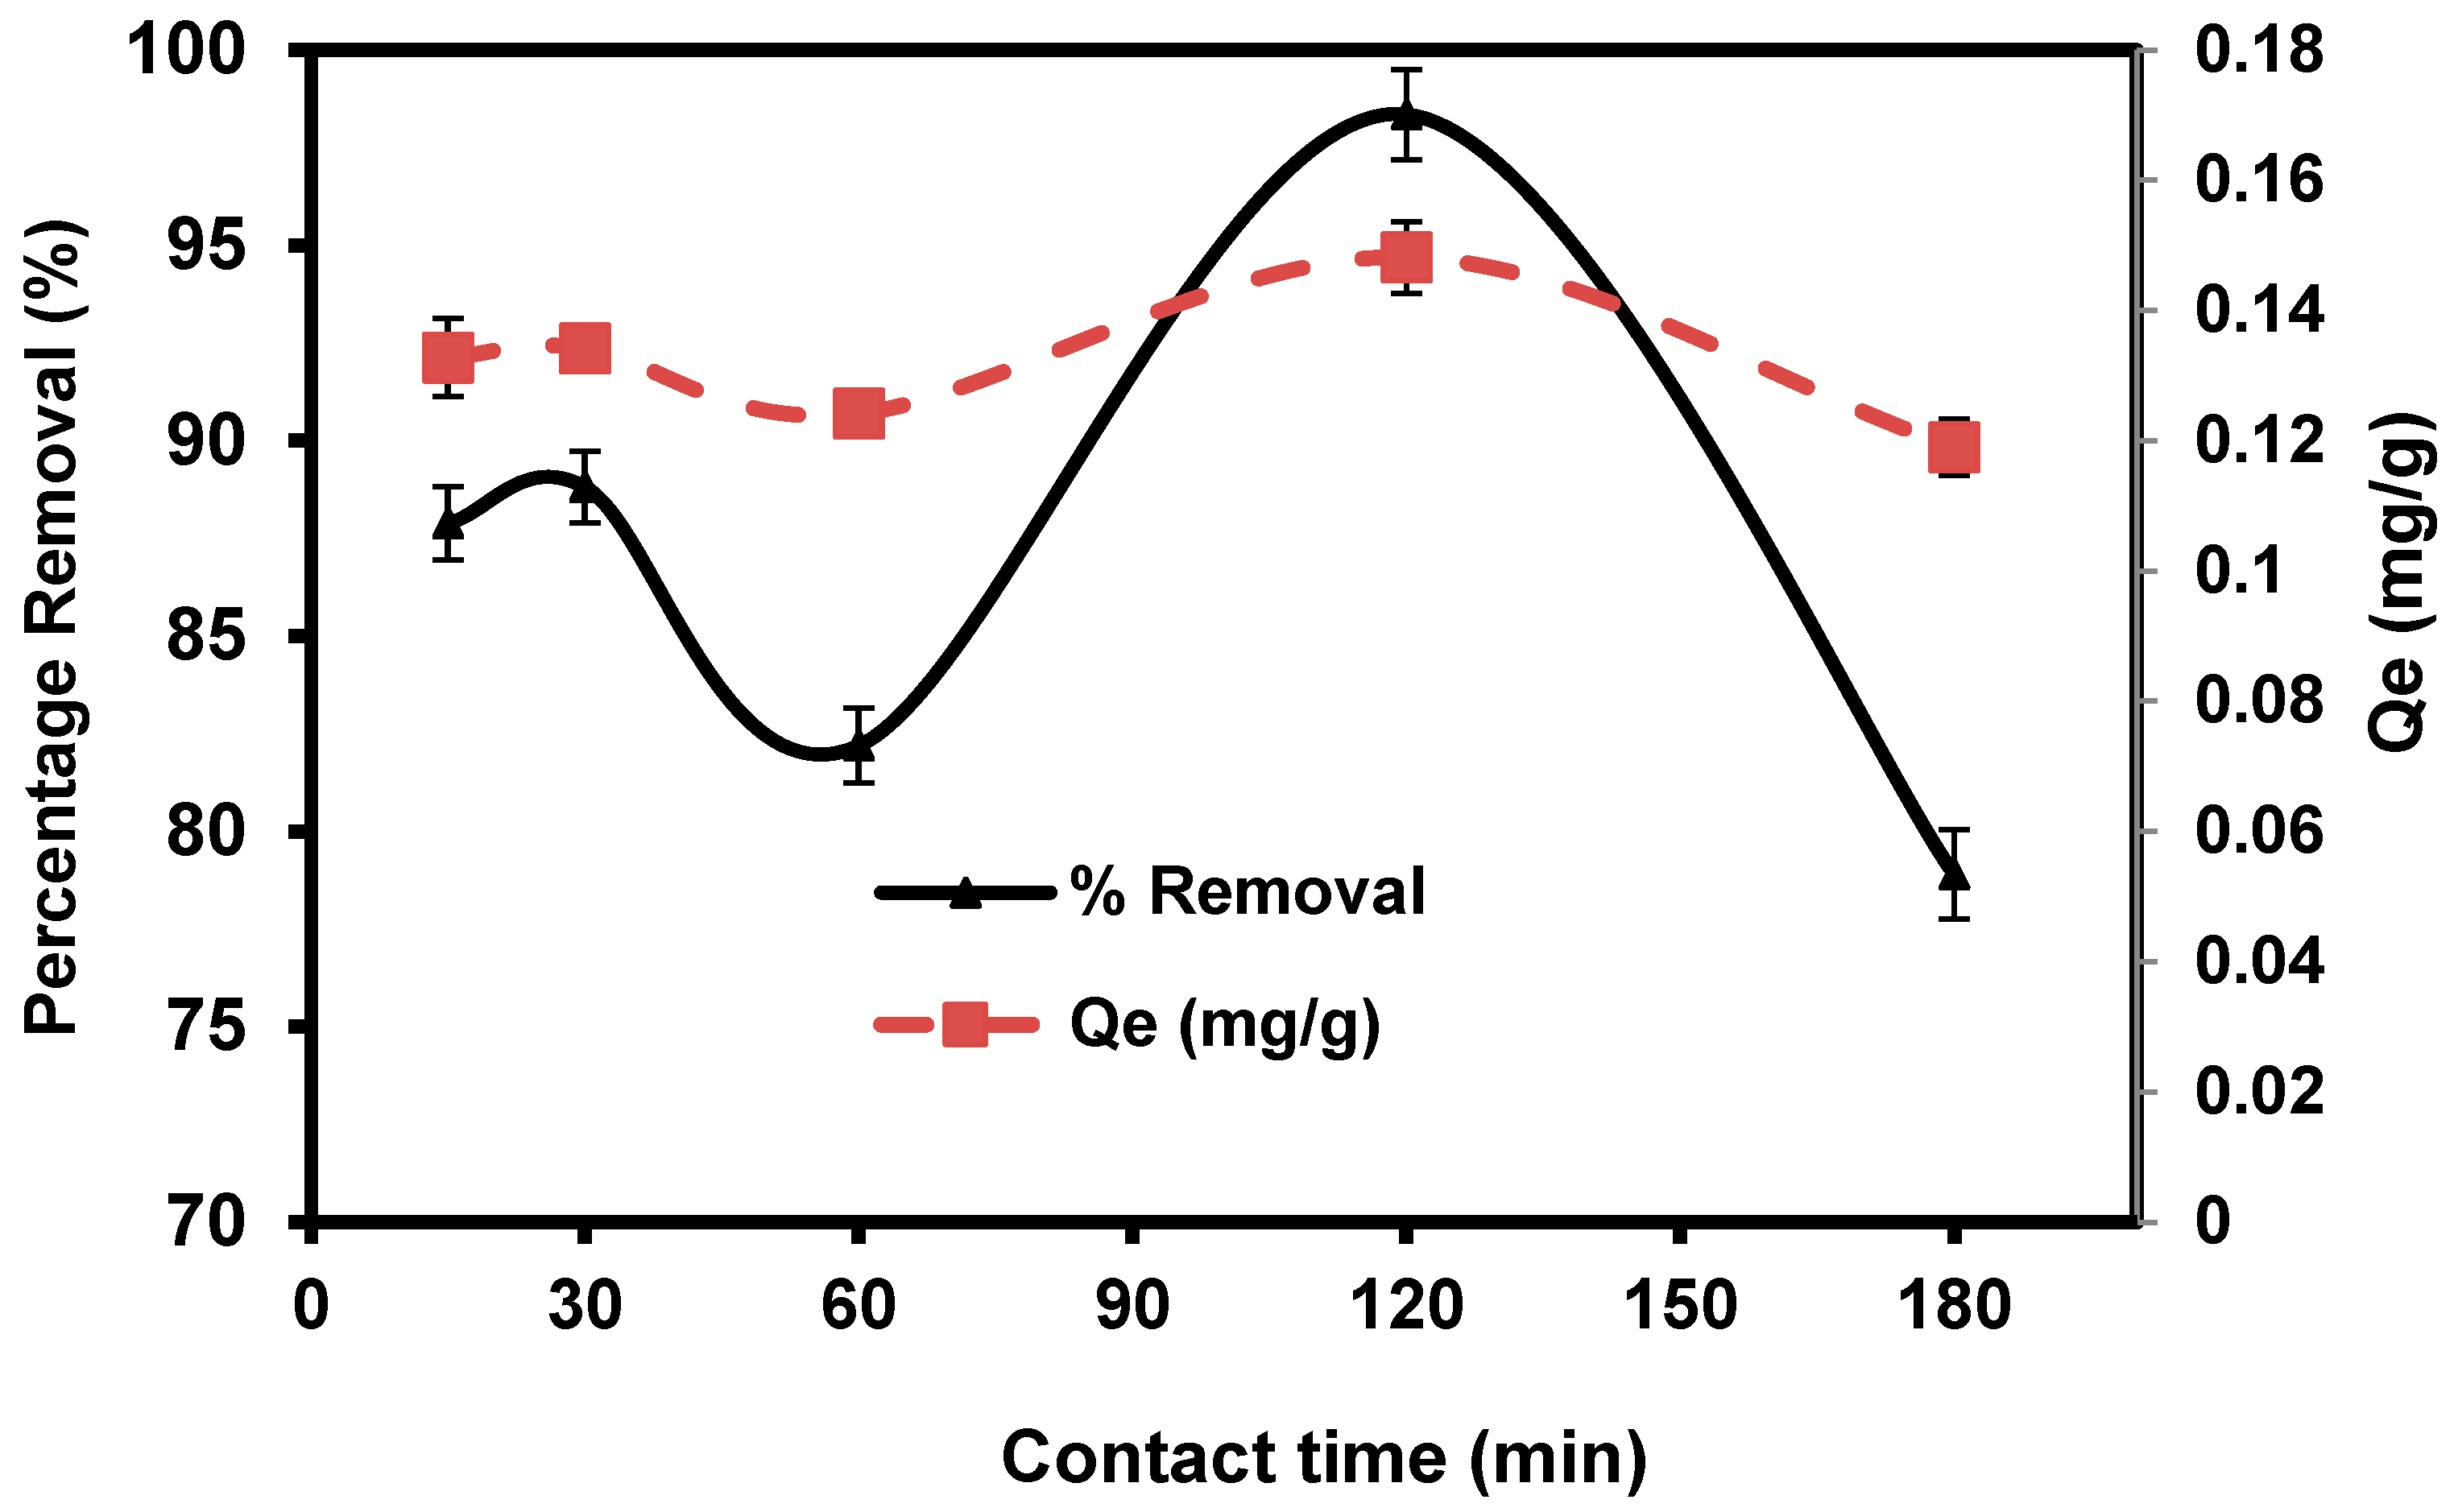
3.2.4. Contact Times
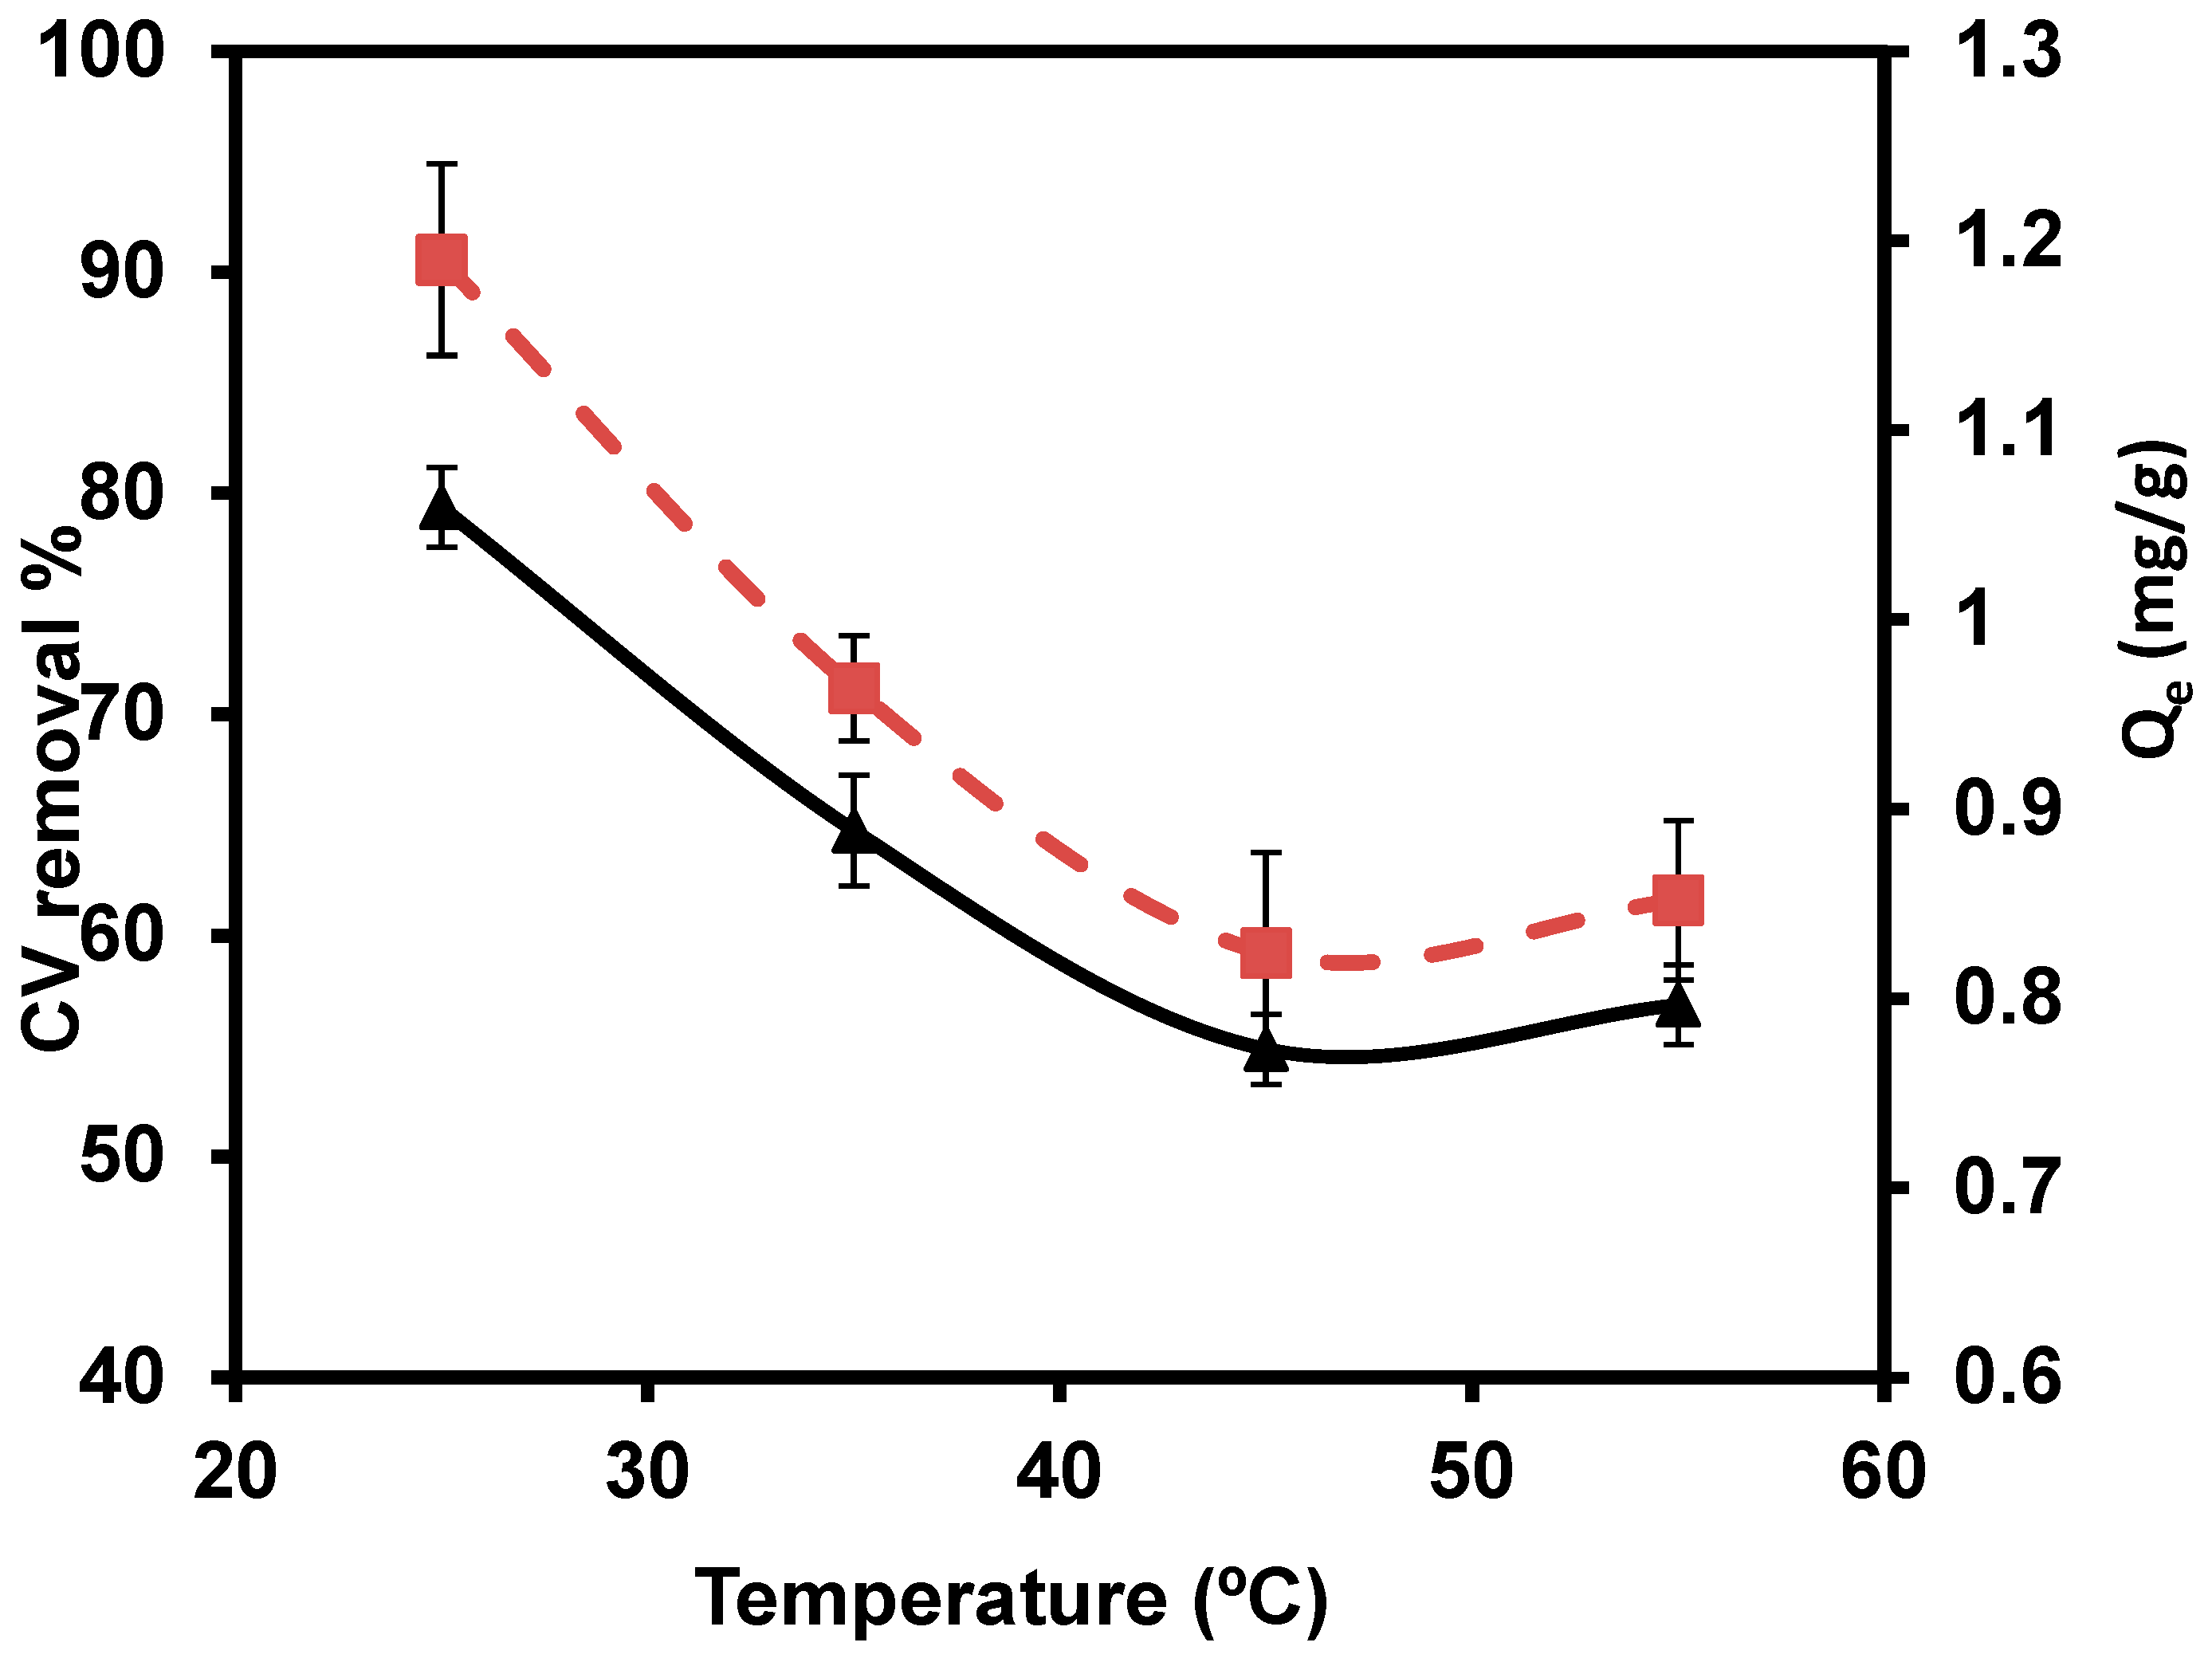
3.2.5. Temperature
3.3. Thermodynamics Properties
3.4. Equilibrium Adsorption Isotherm
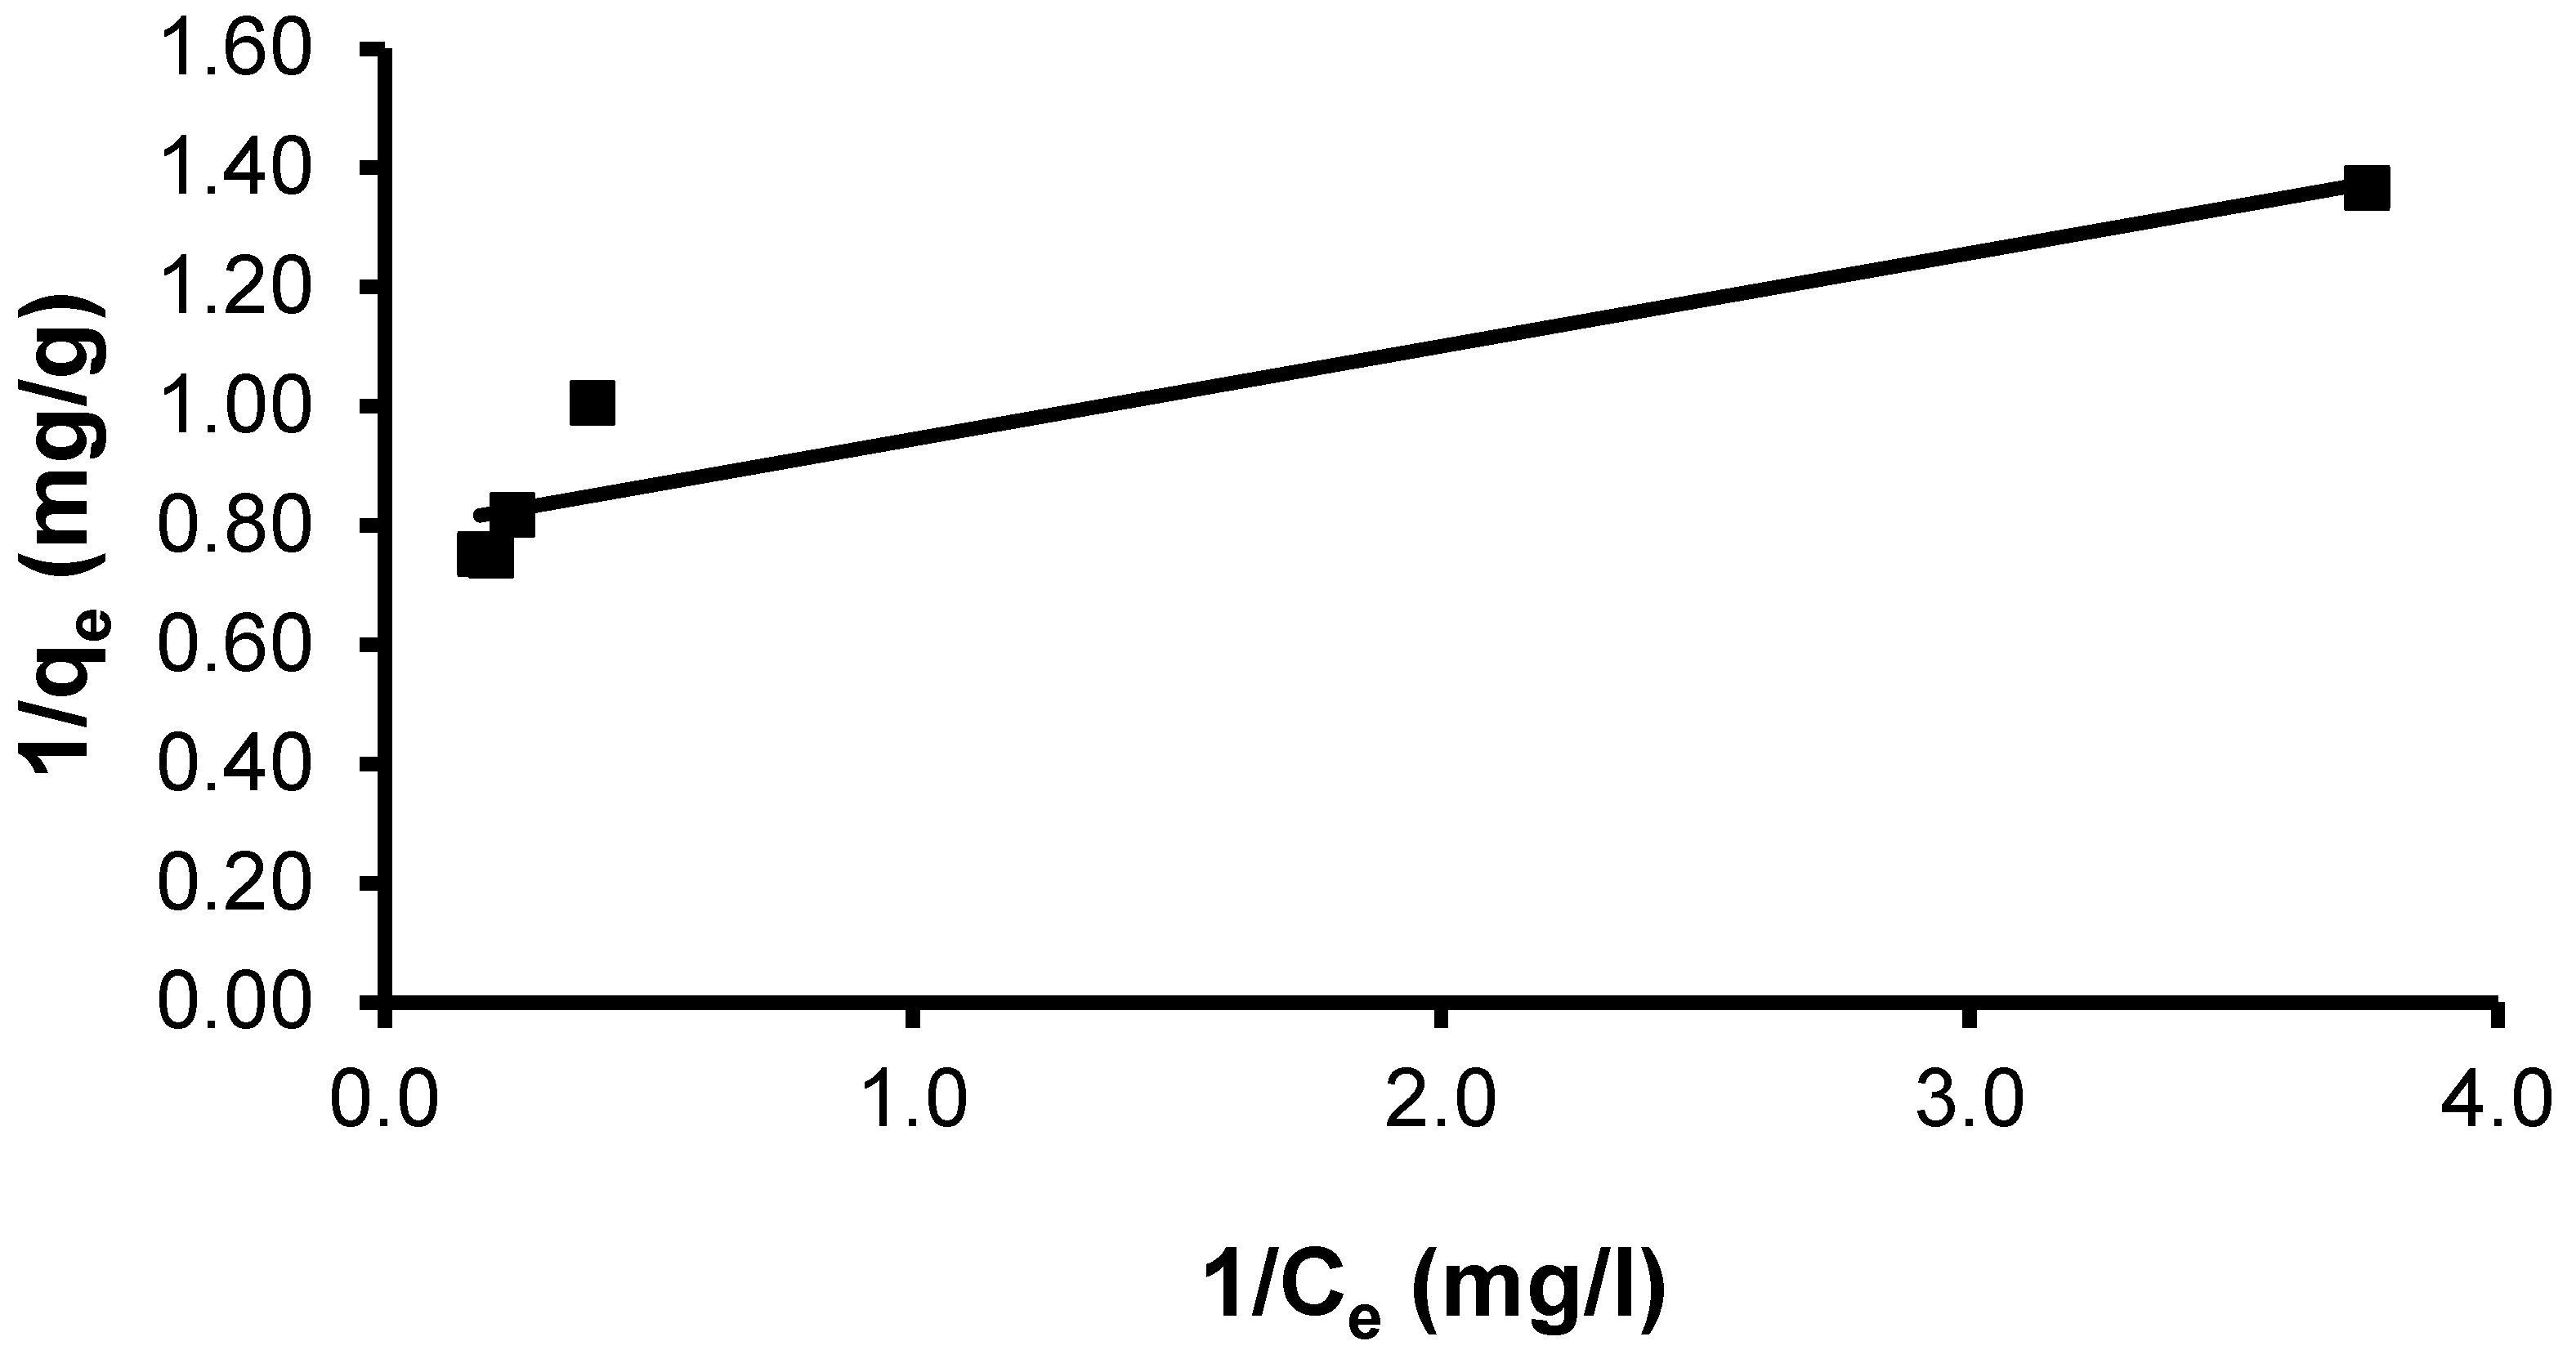
3.4.1. Langmuir Isotherm
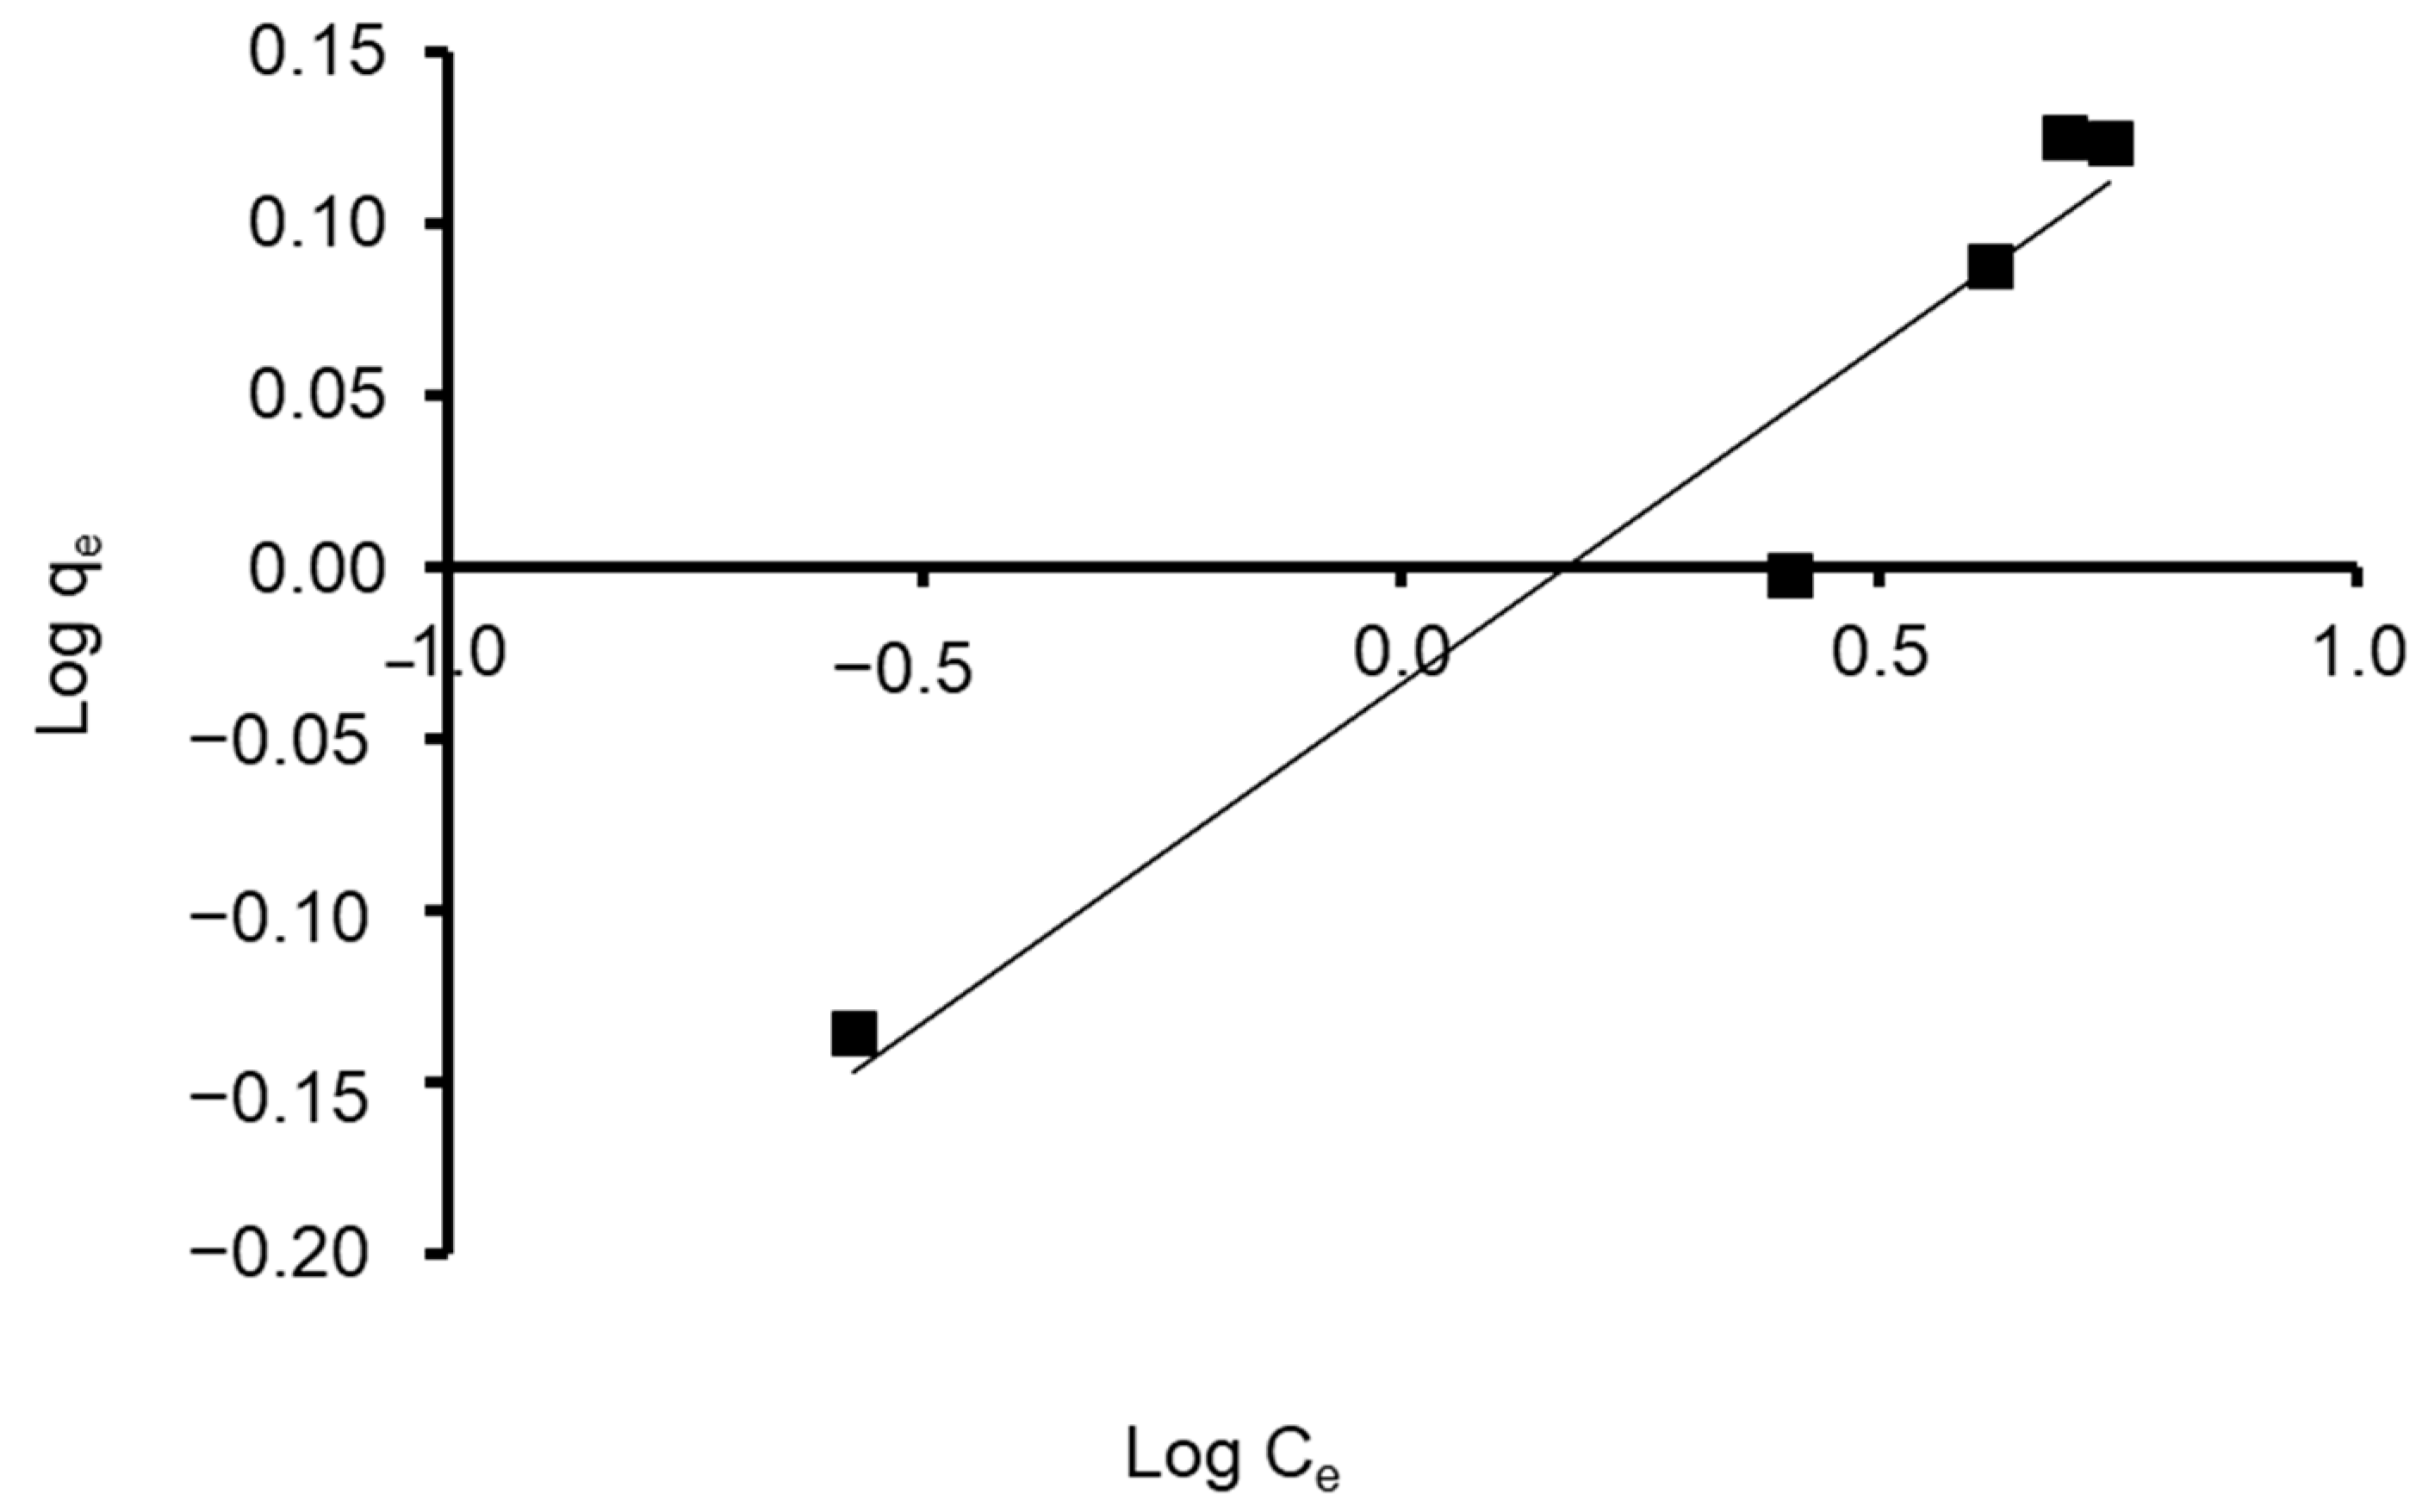
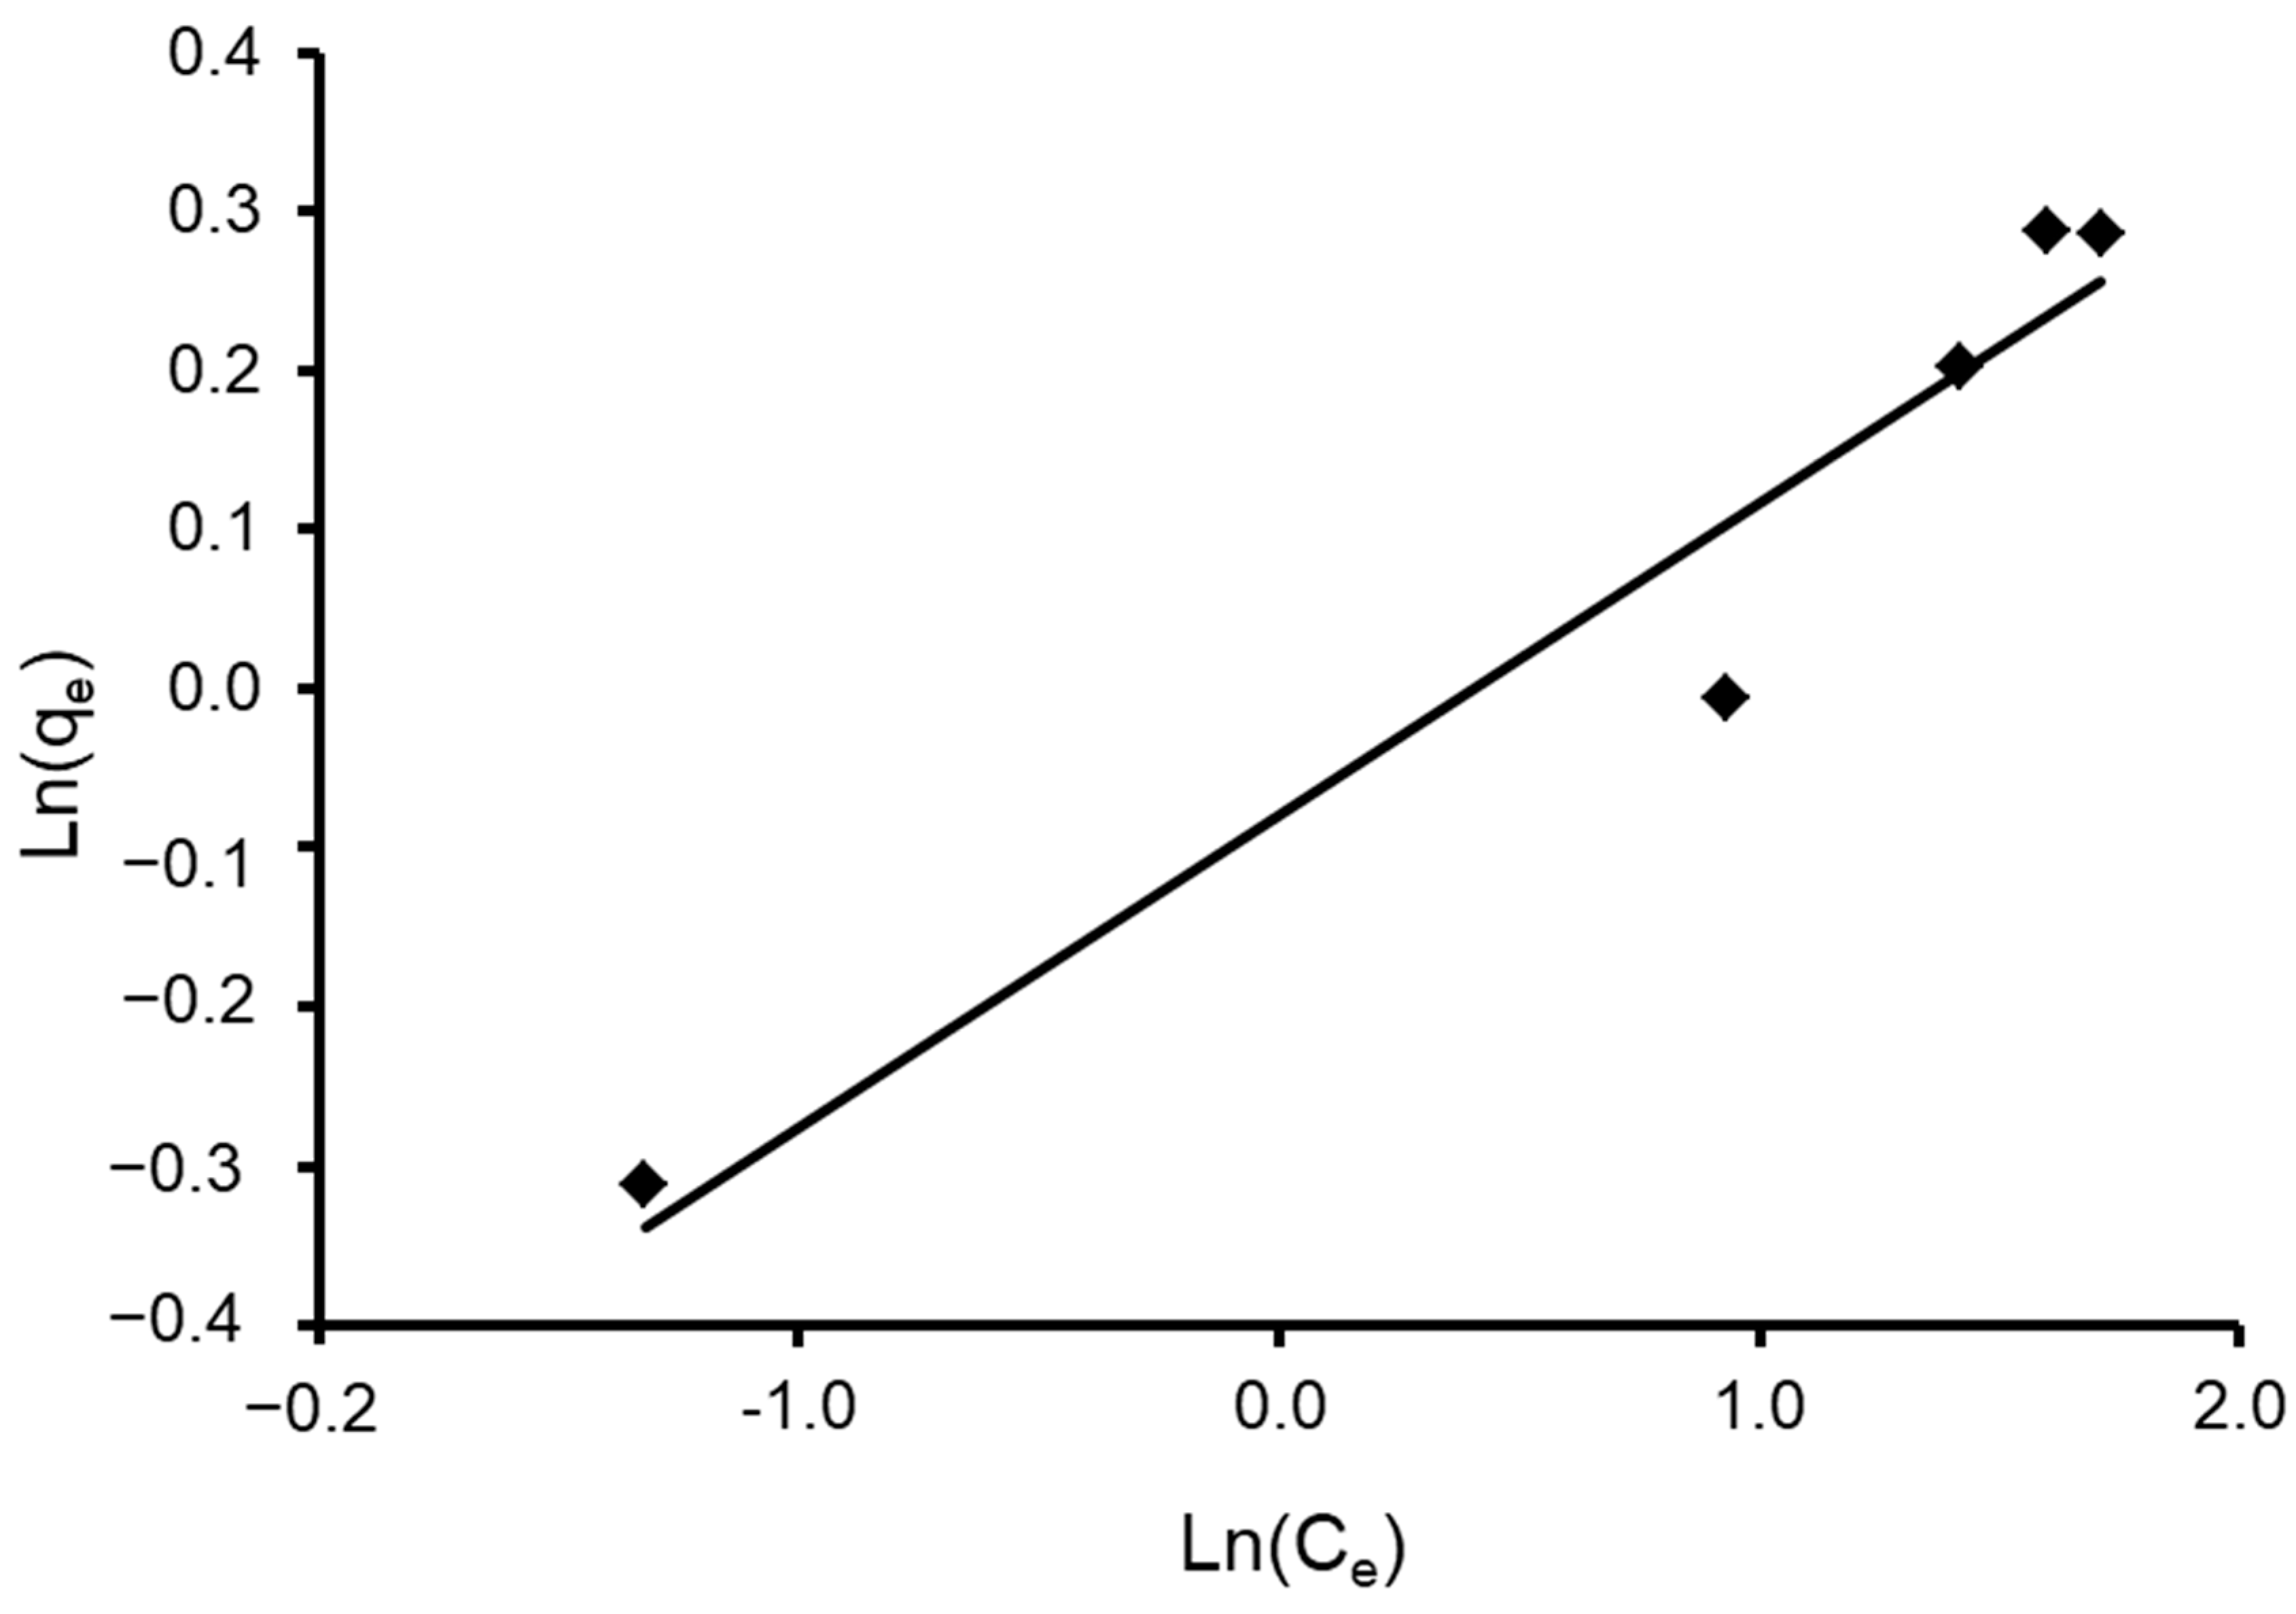
3.4.2. Freundlich Isotherm
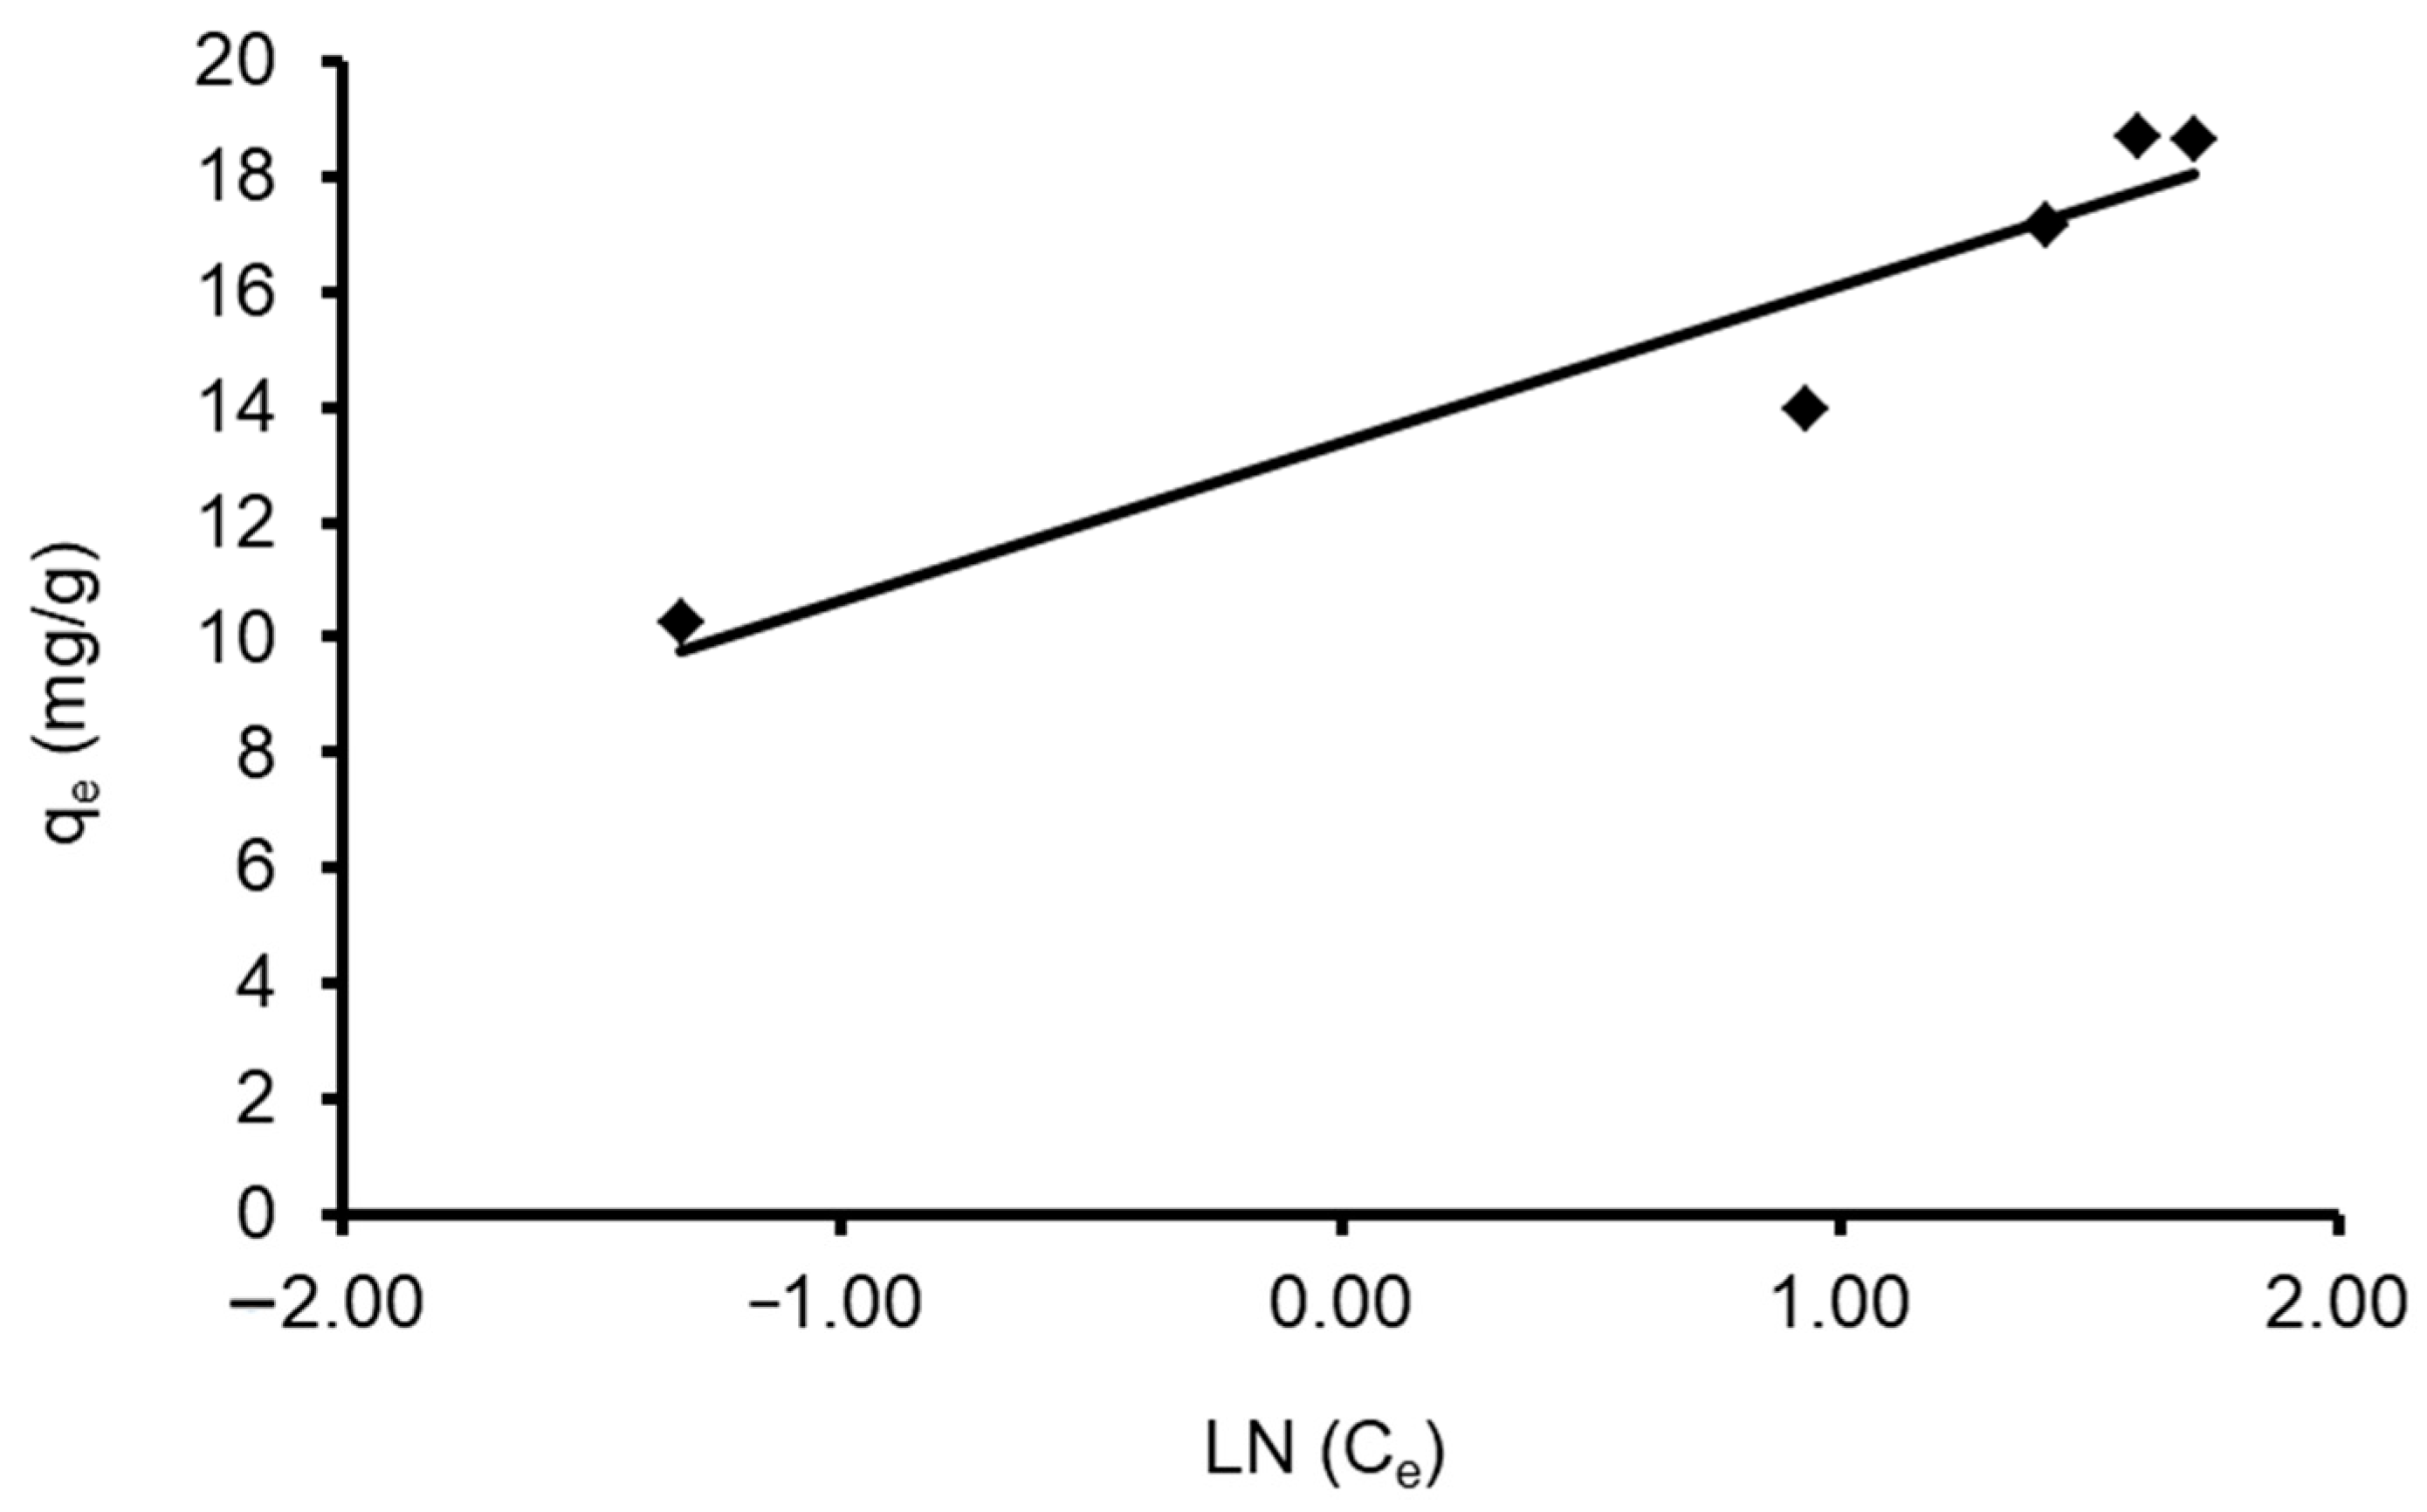
3.4.3. Tempkin Isotherm
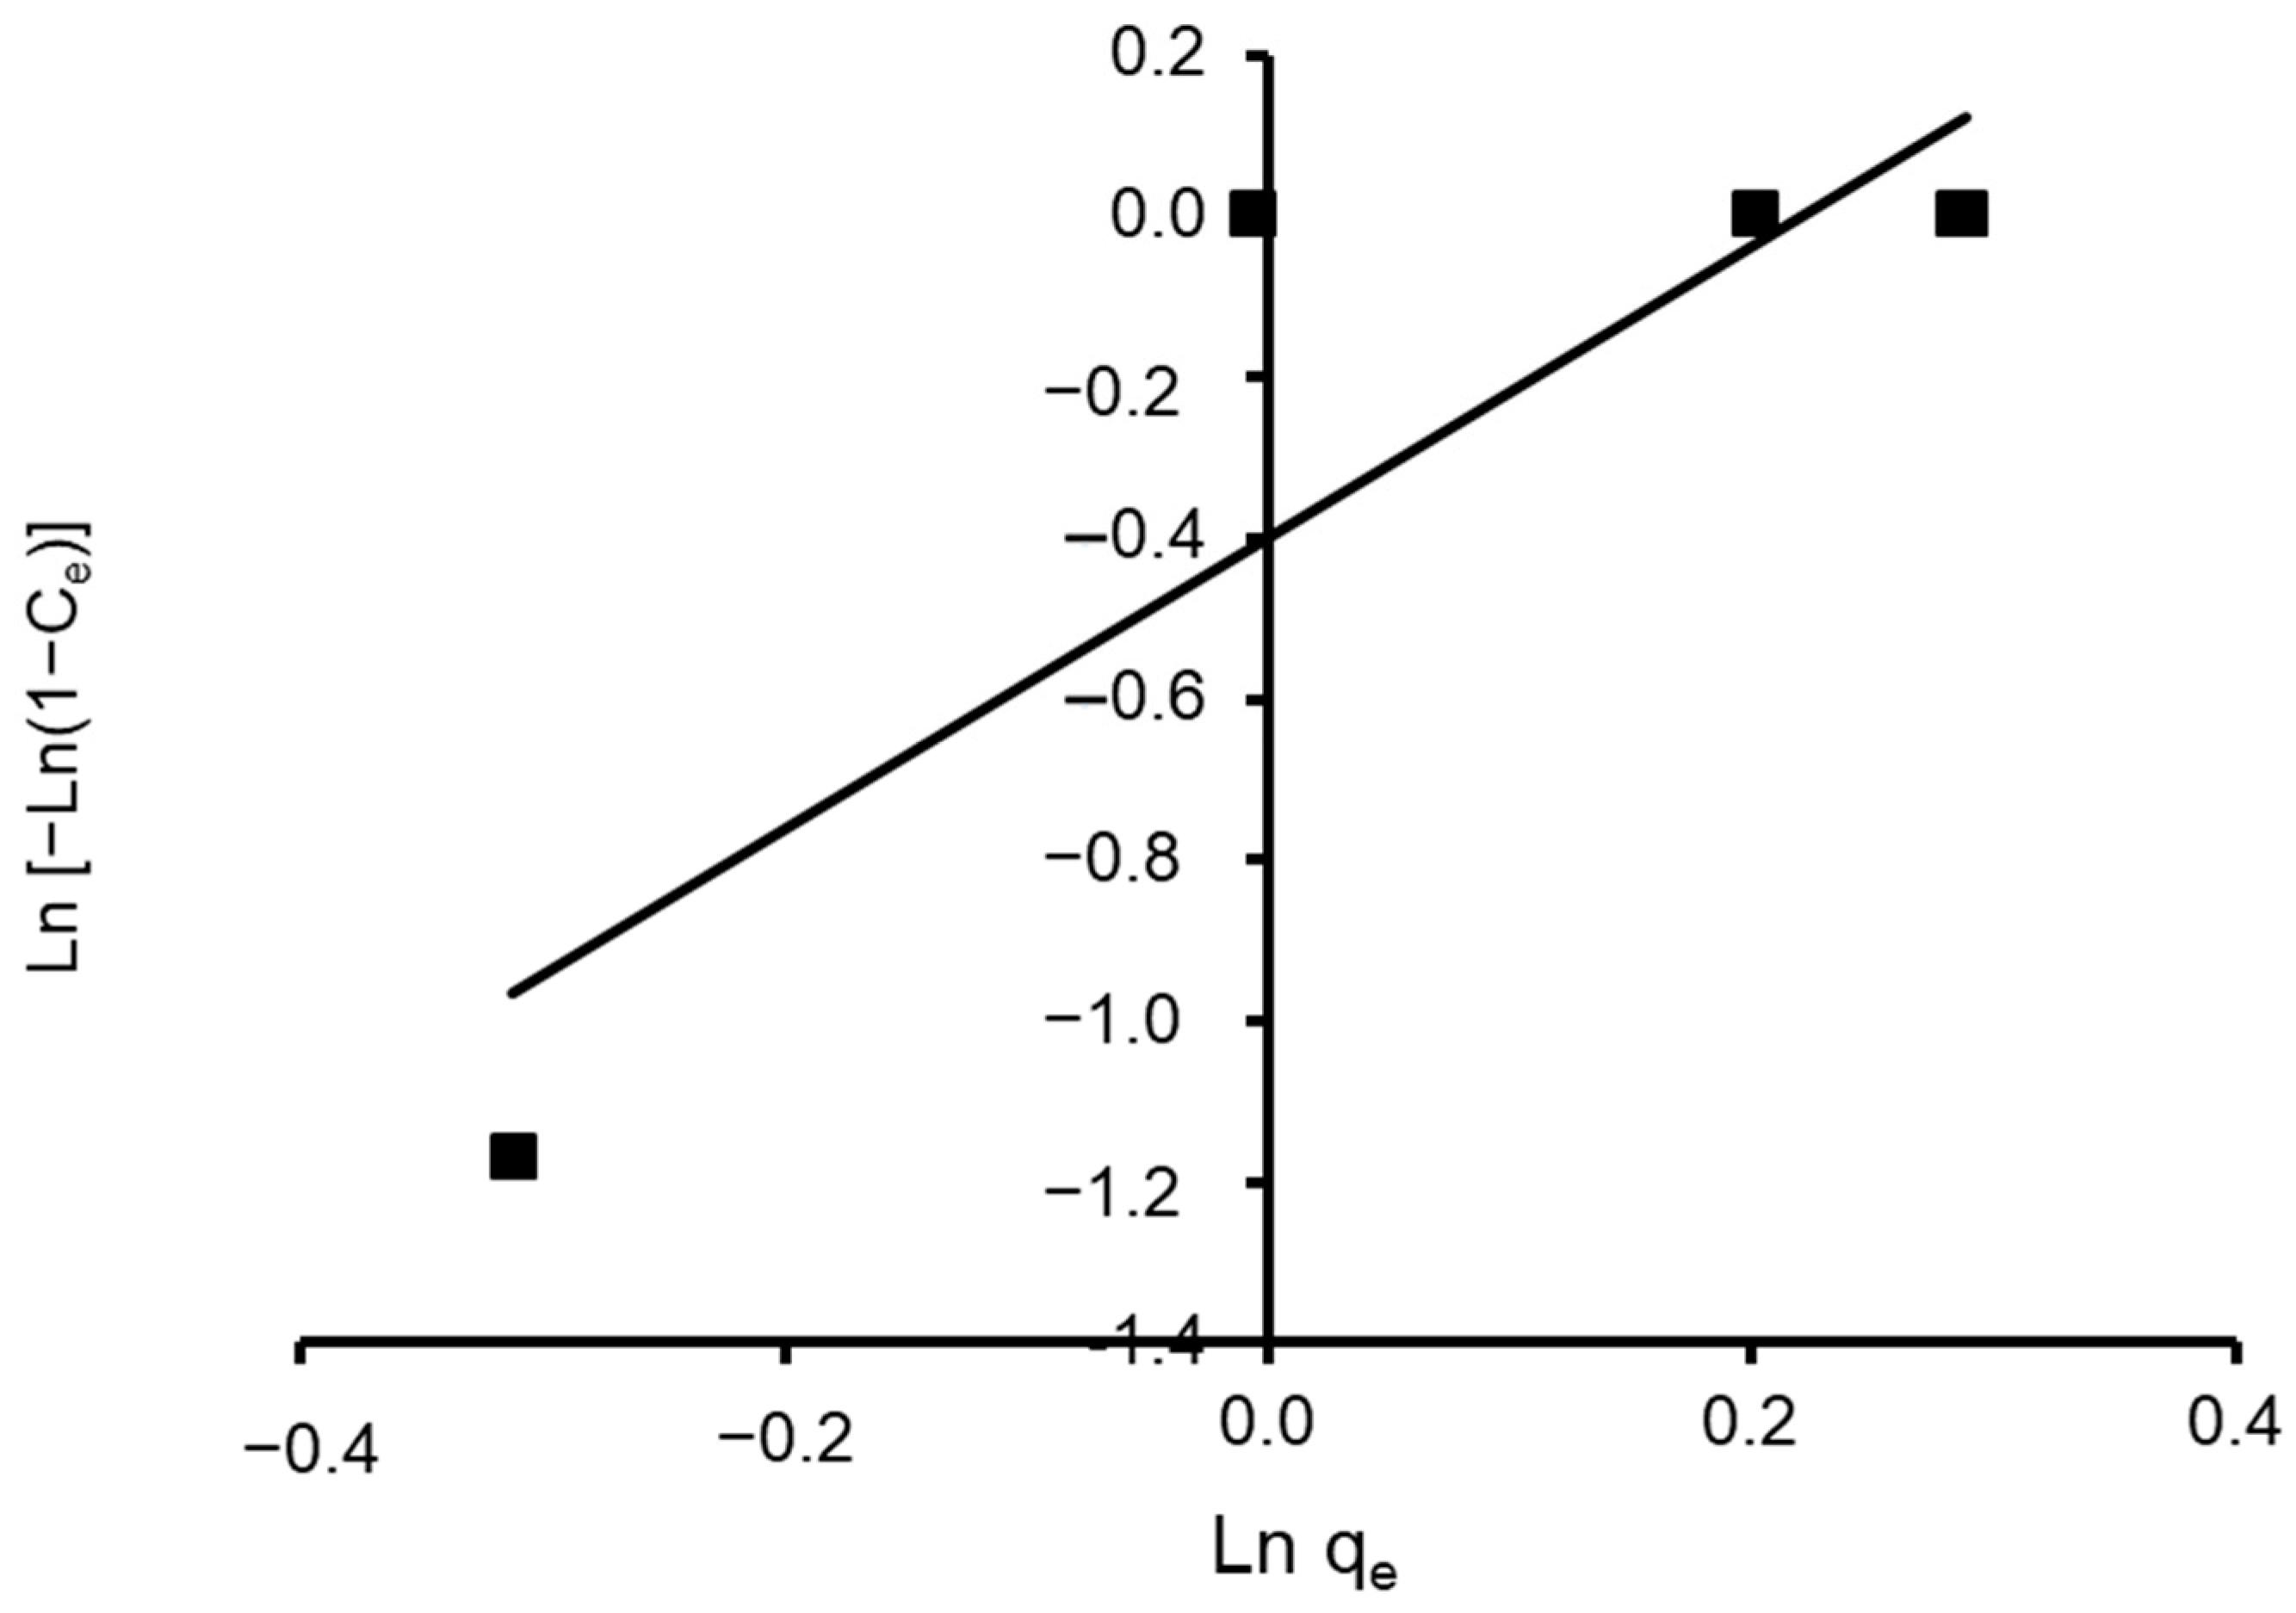
3.4.4. Halsey and Henderson Isotherm
3.4.5. Error Analyses
3.5. Adsorption Kinetic
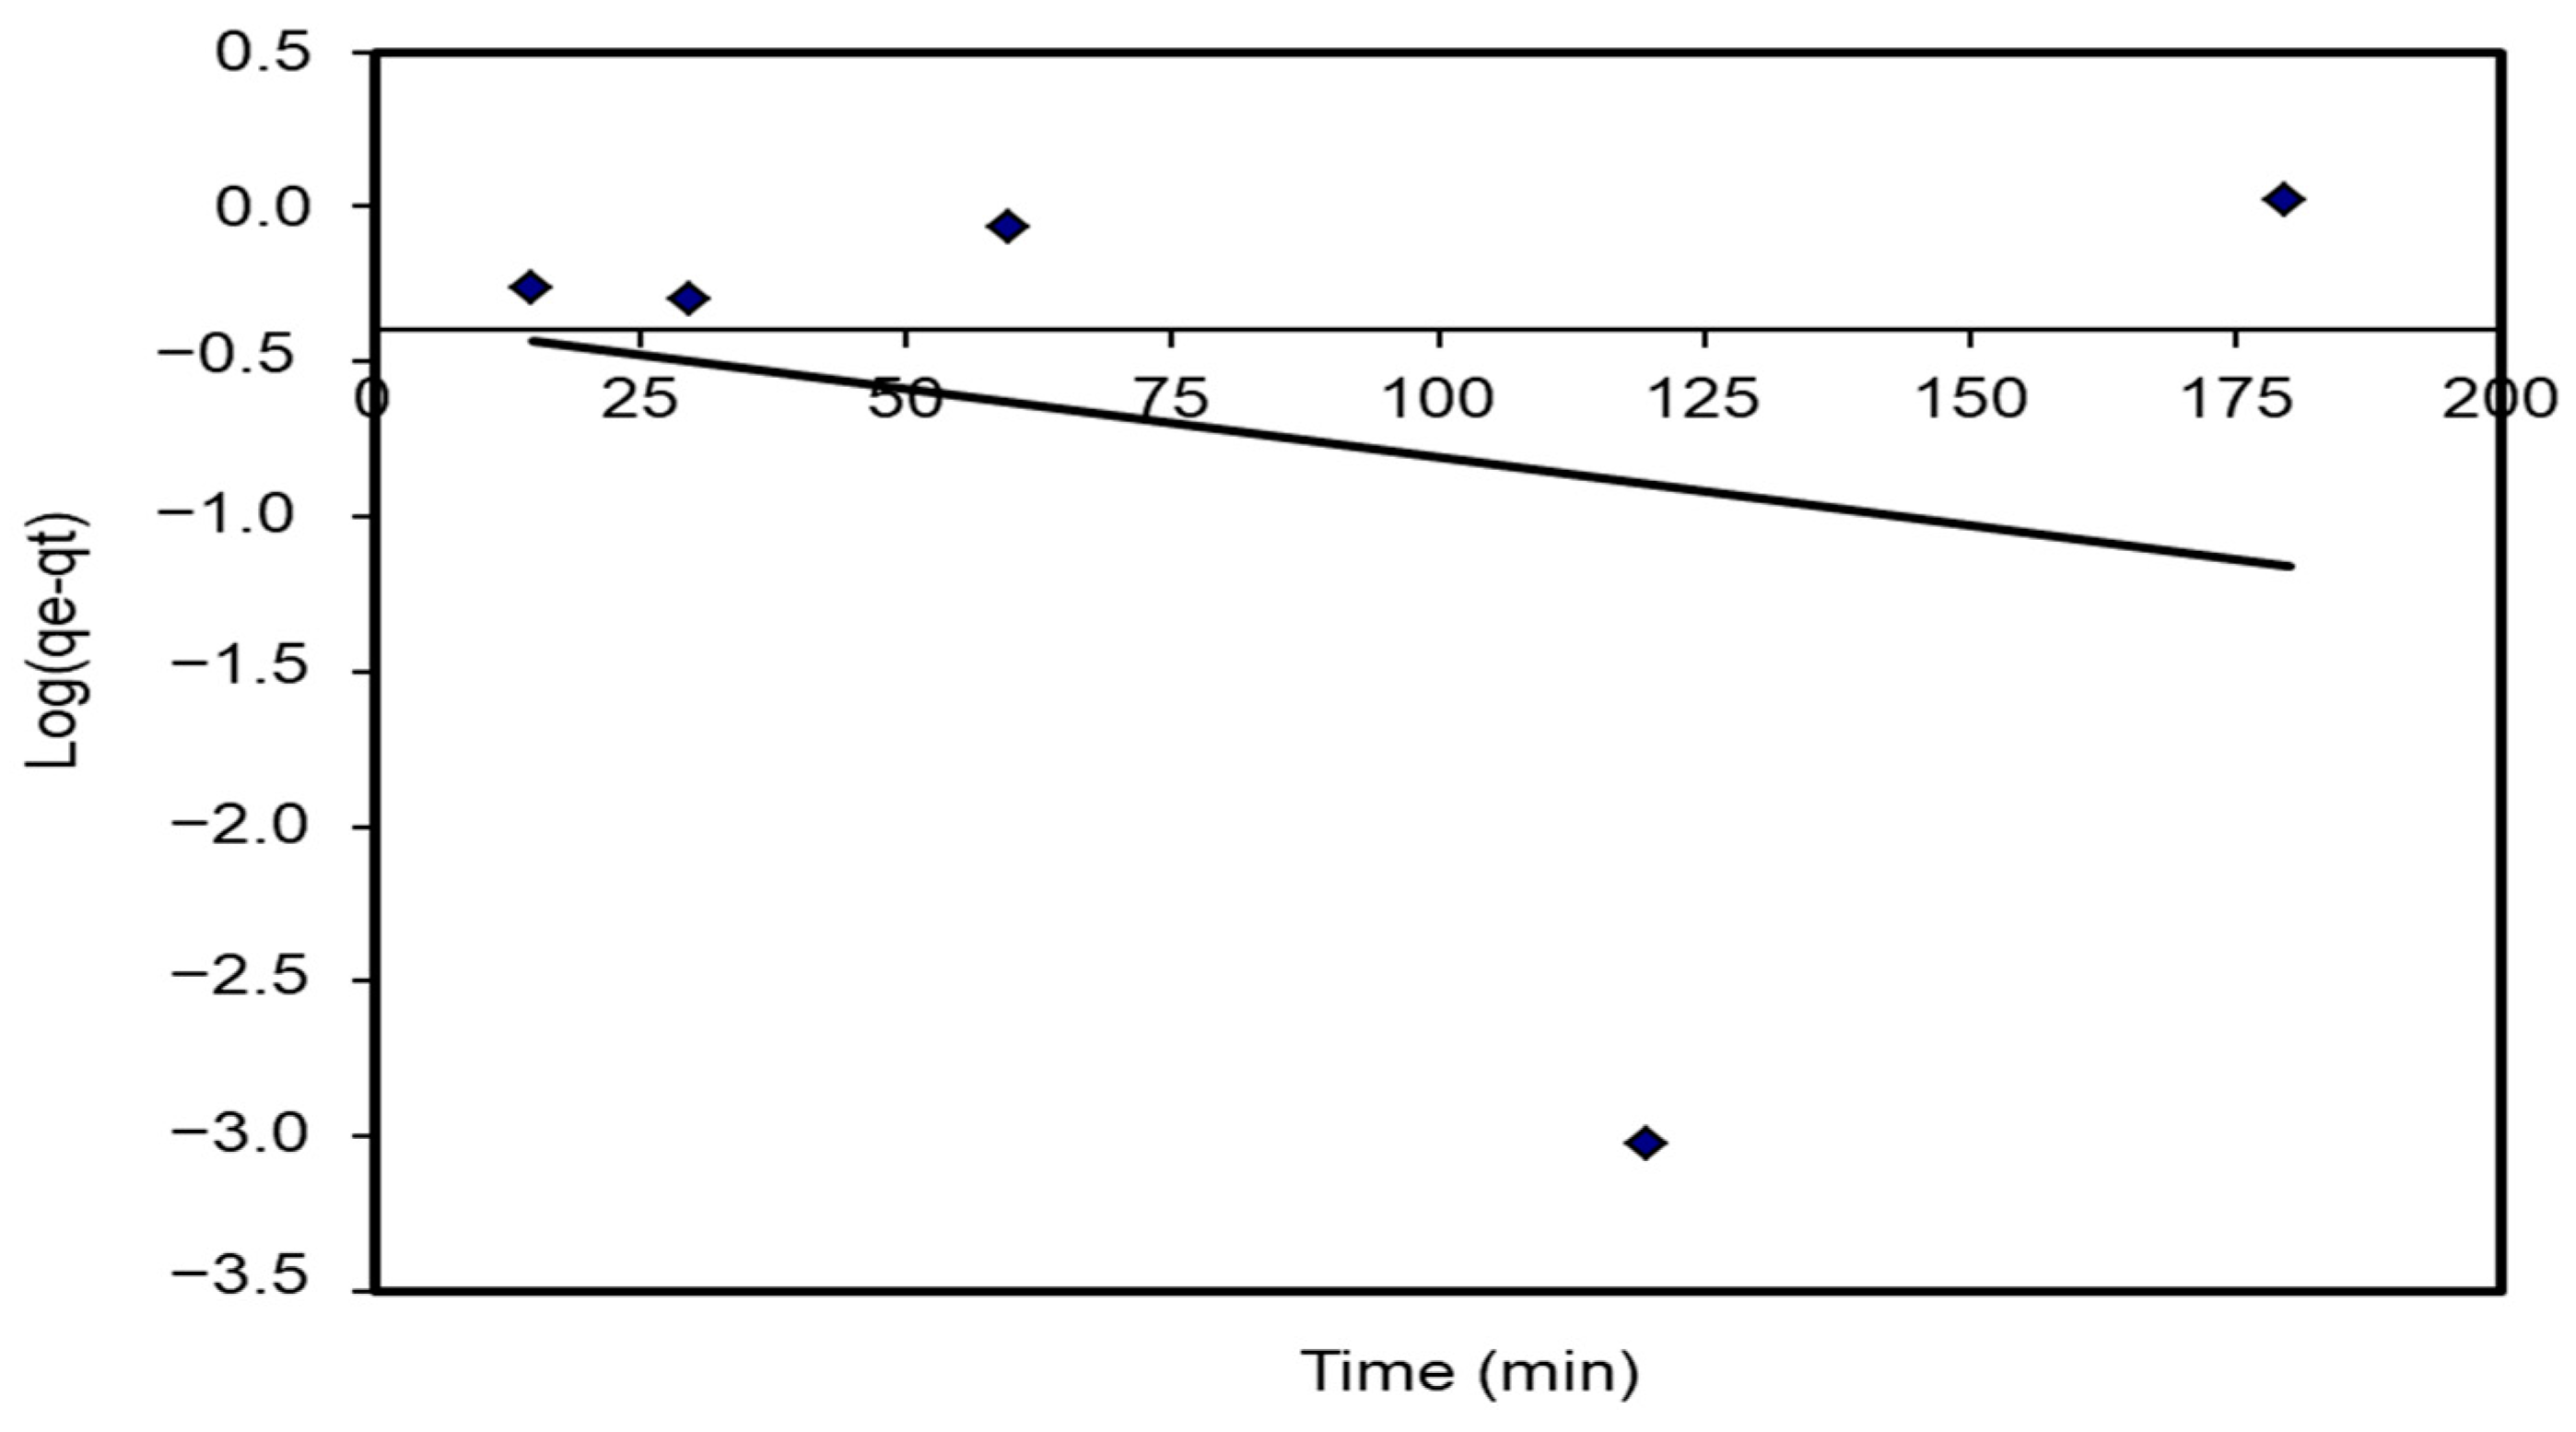
3.5.1. Pseudo-First–Order Kinetic
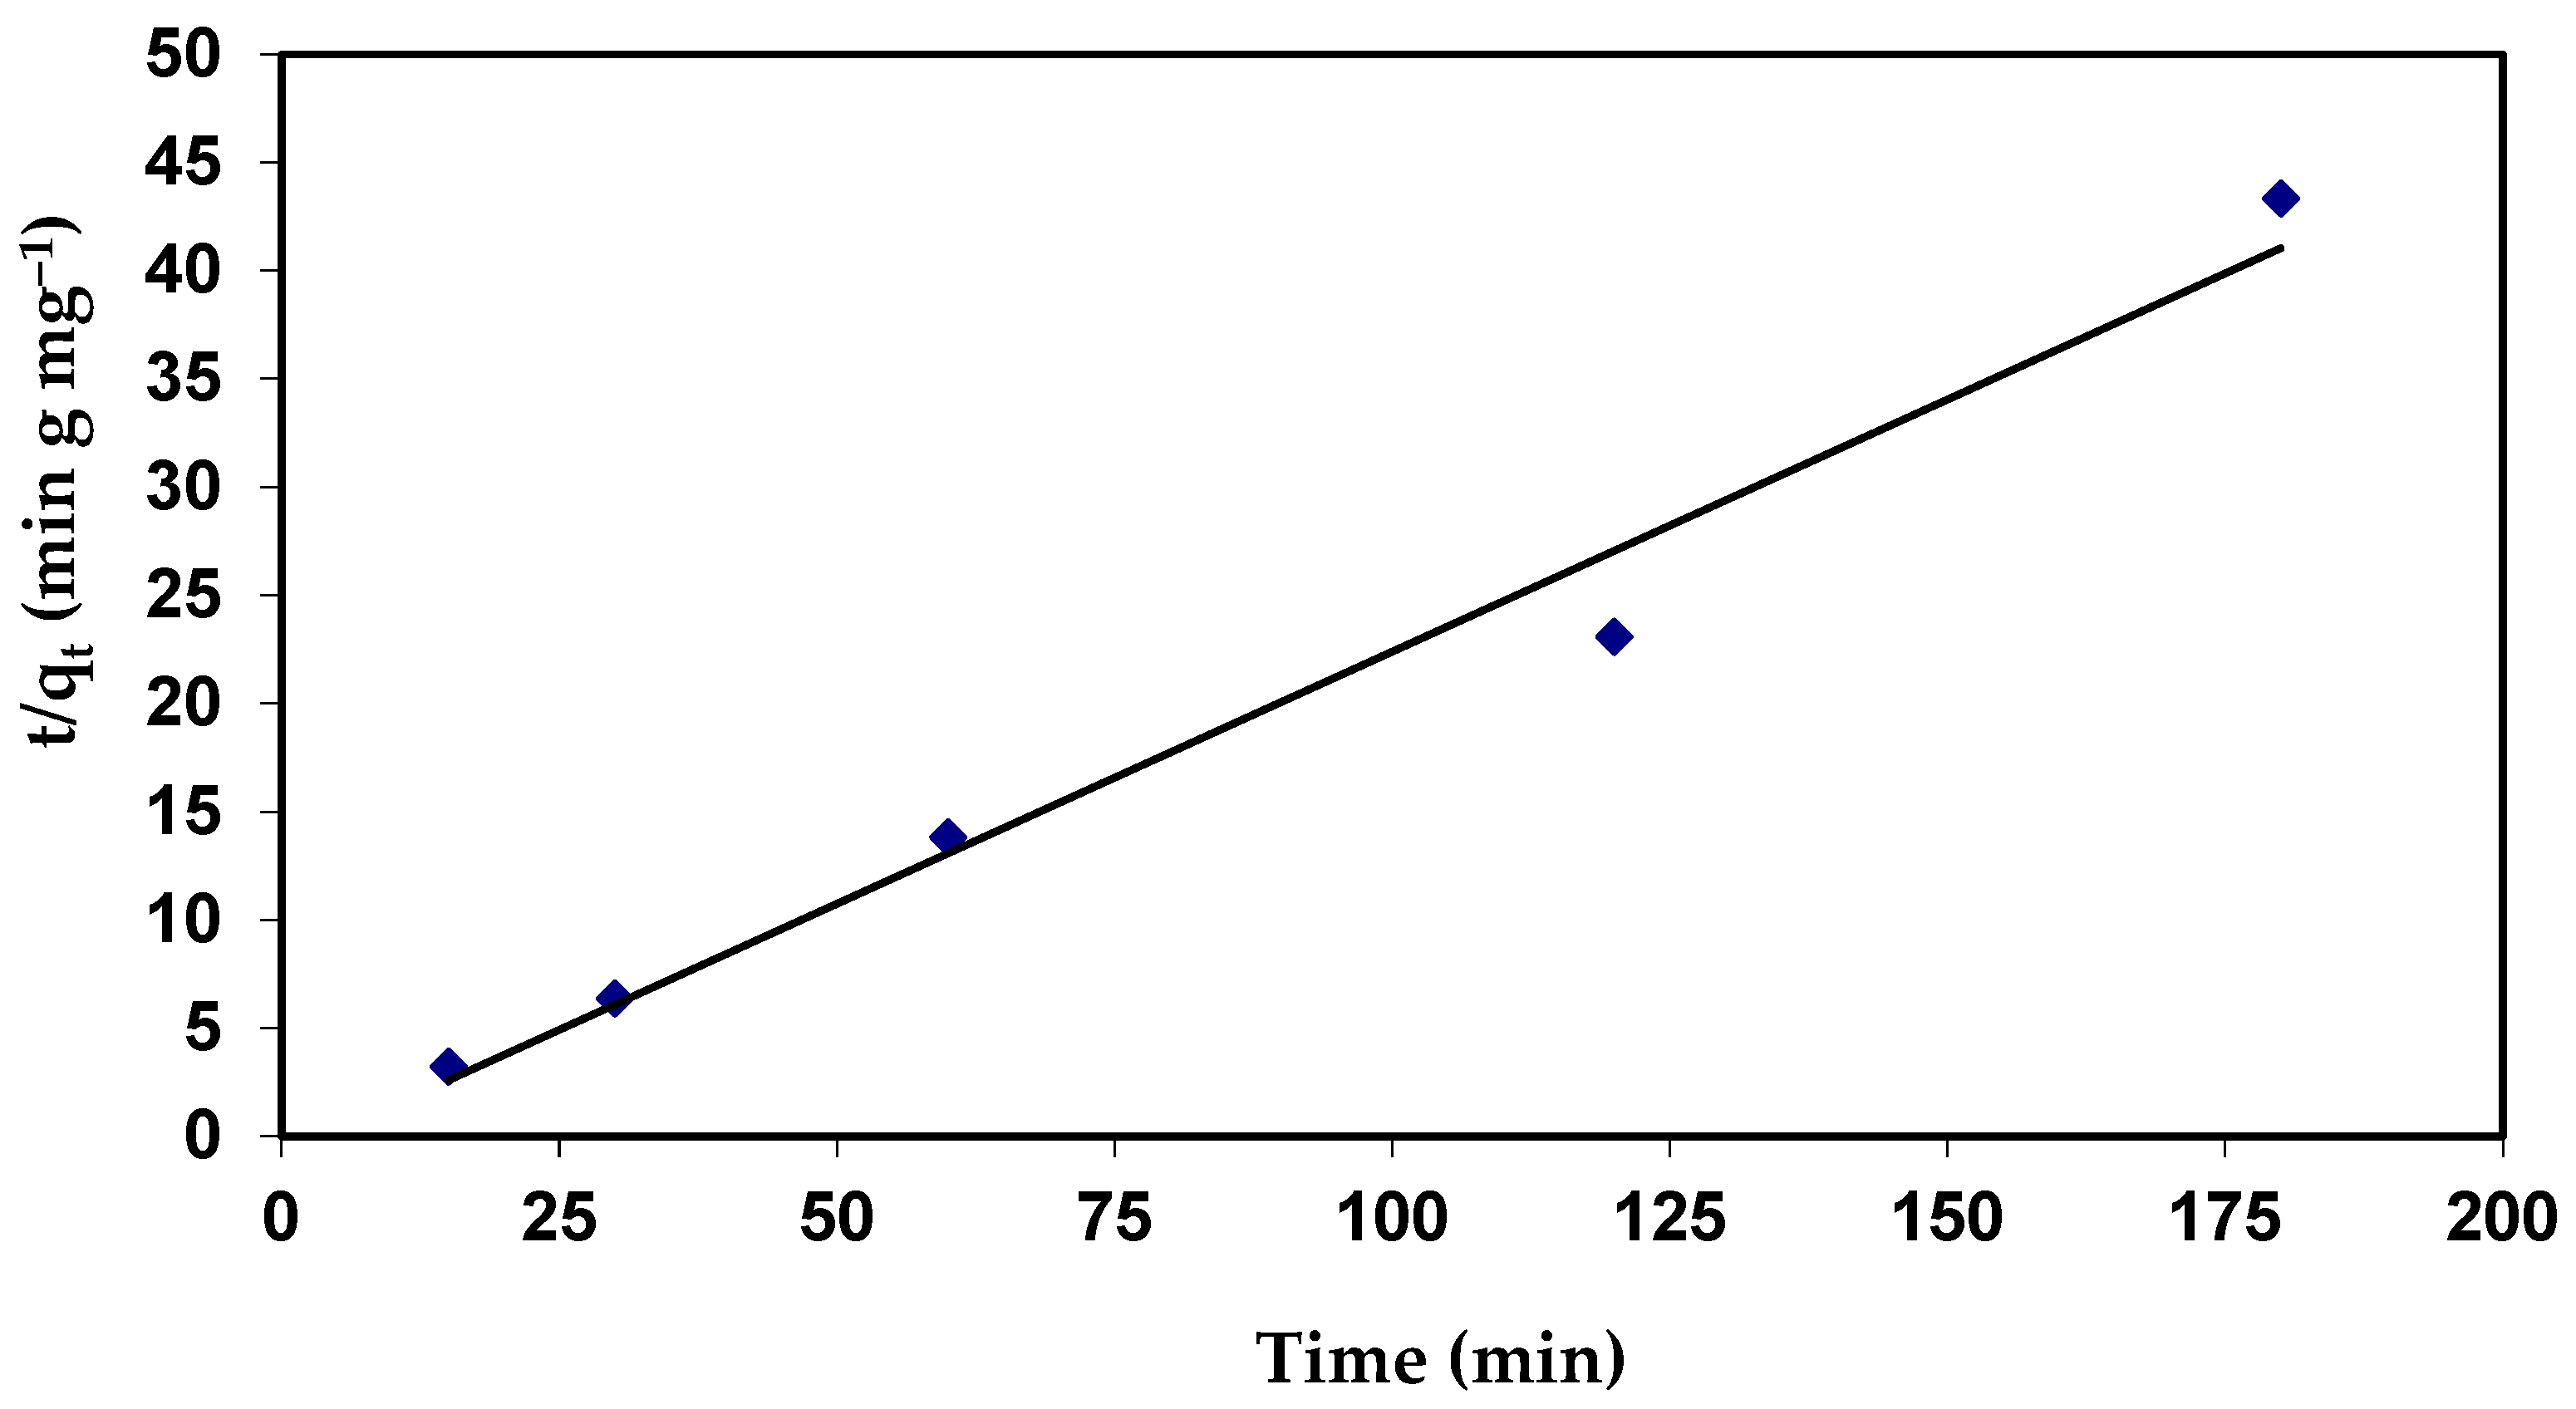
3.5.2. Pseudo-Second–Order Kinetic
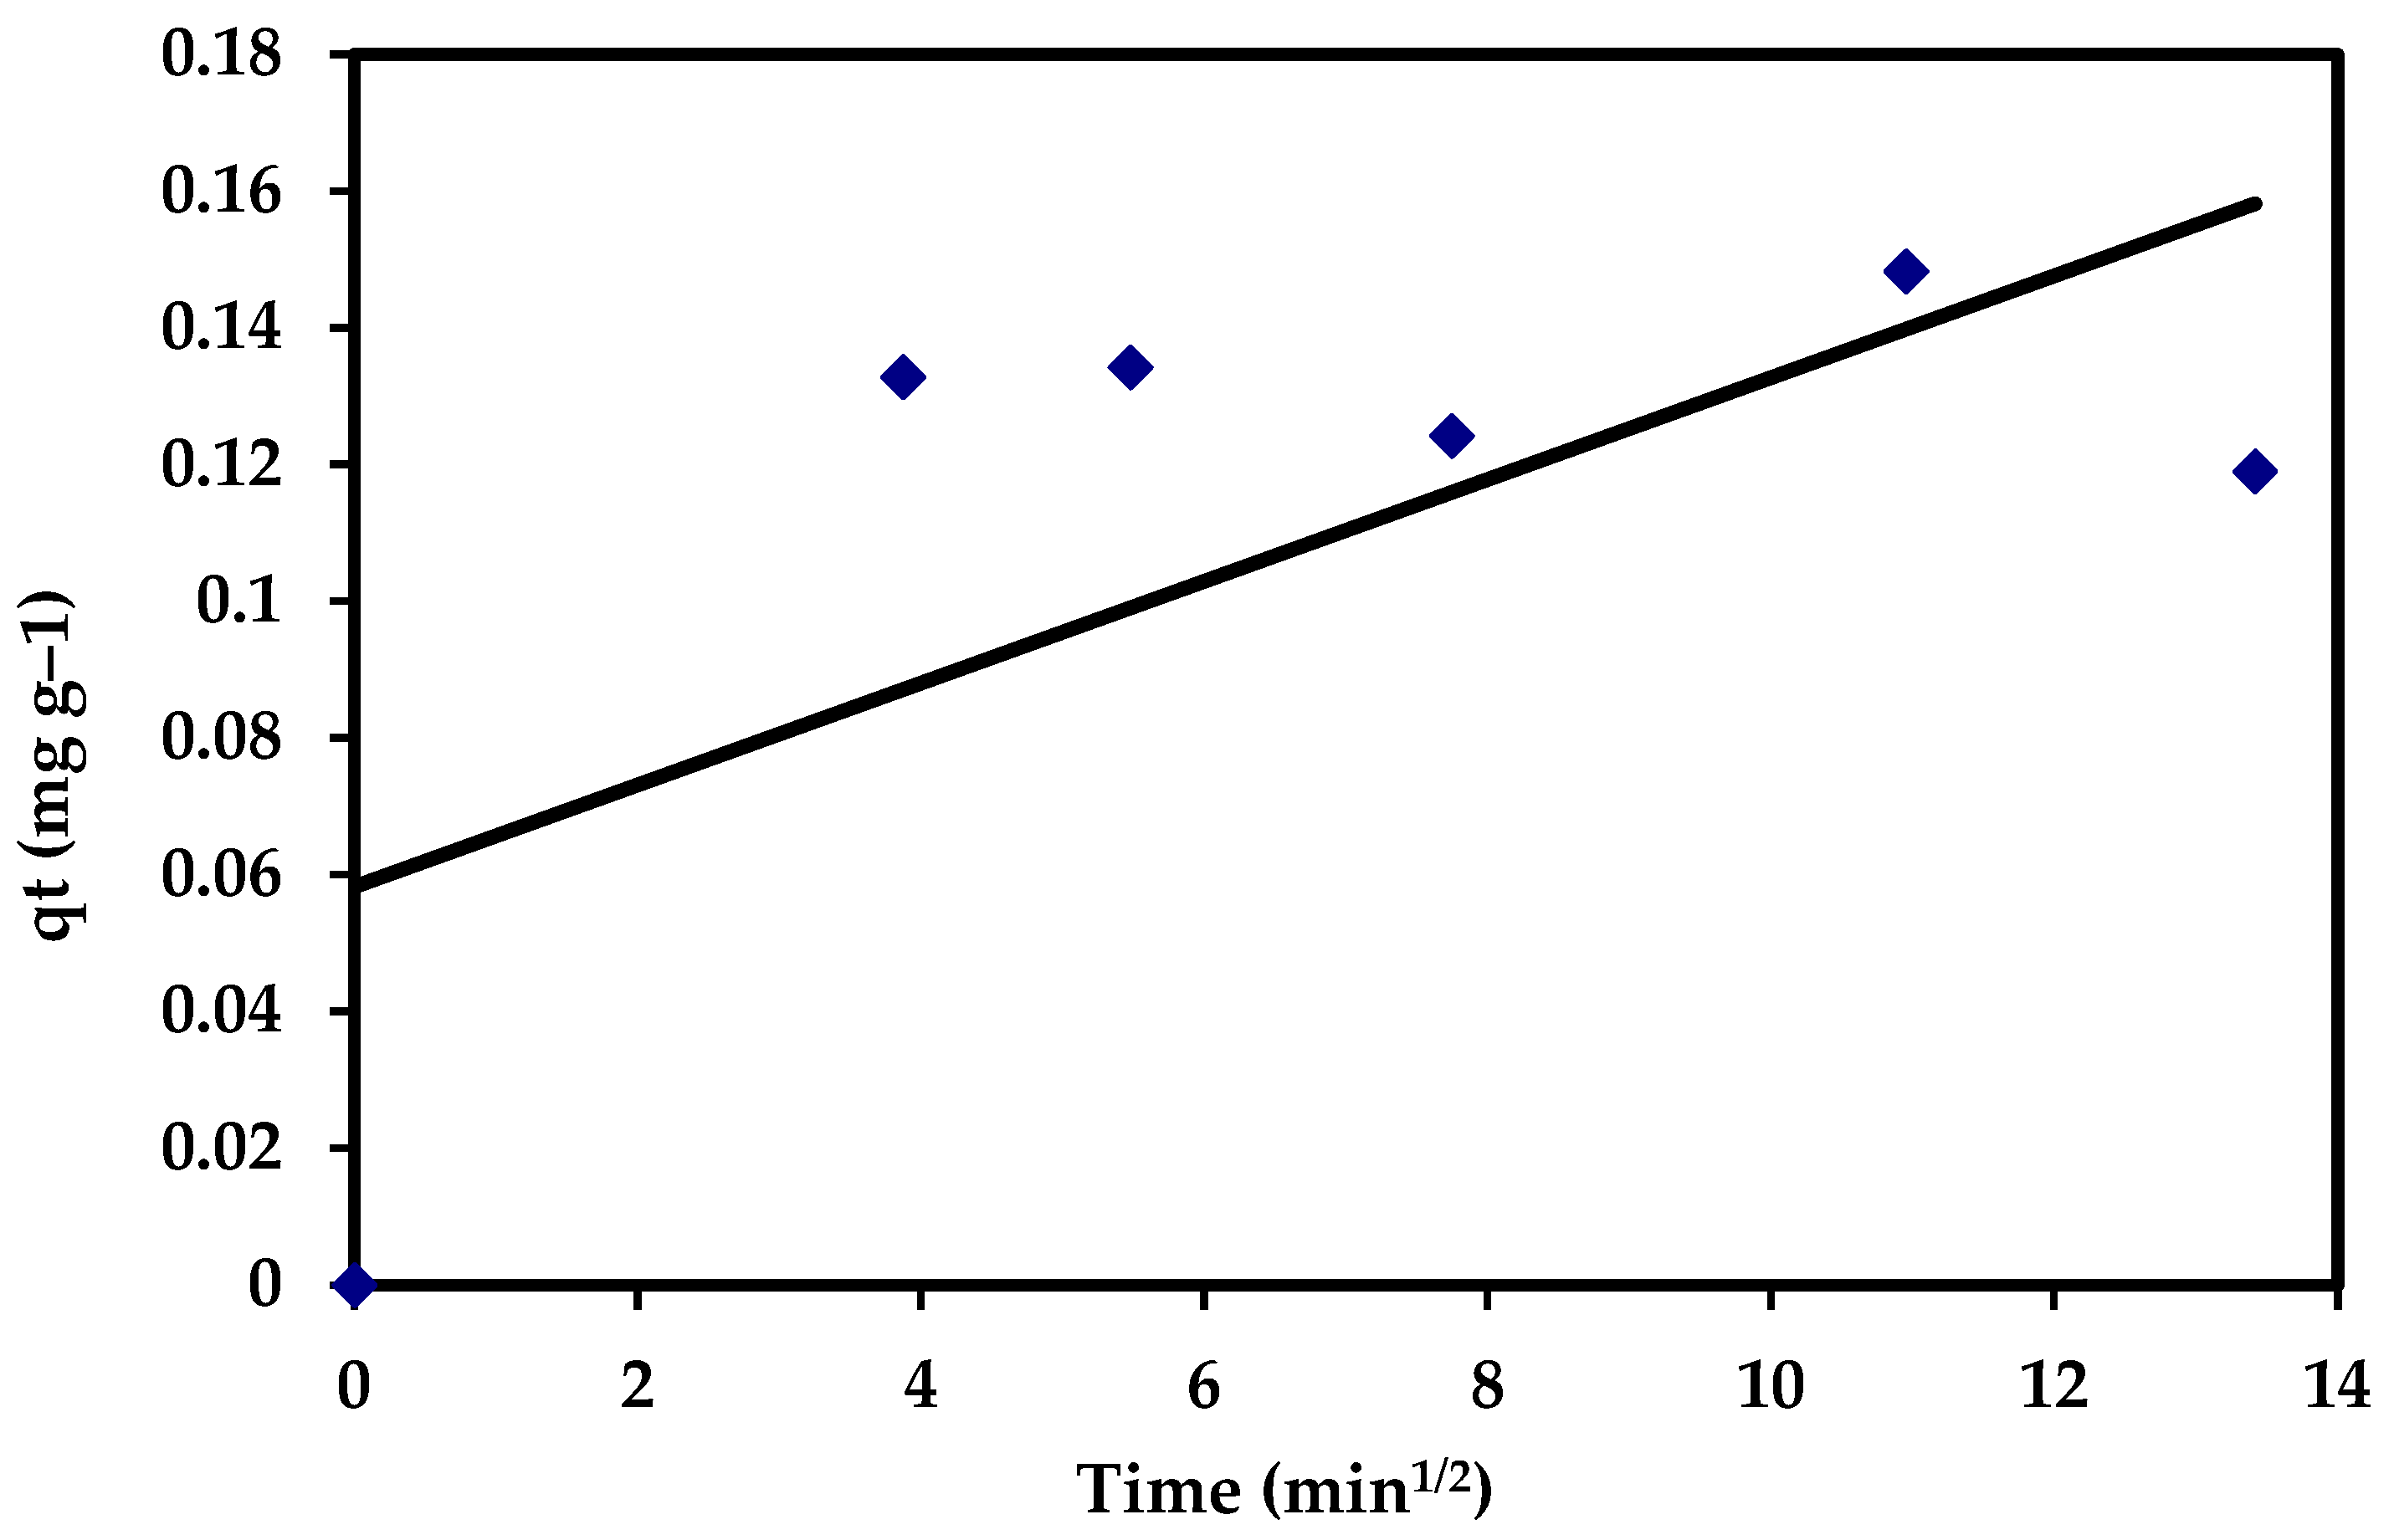
3.5.3. Intra-Particle Diffusion Equation
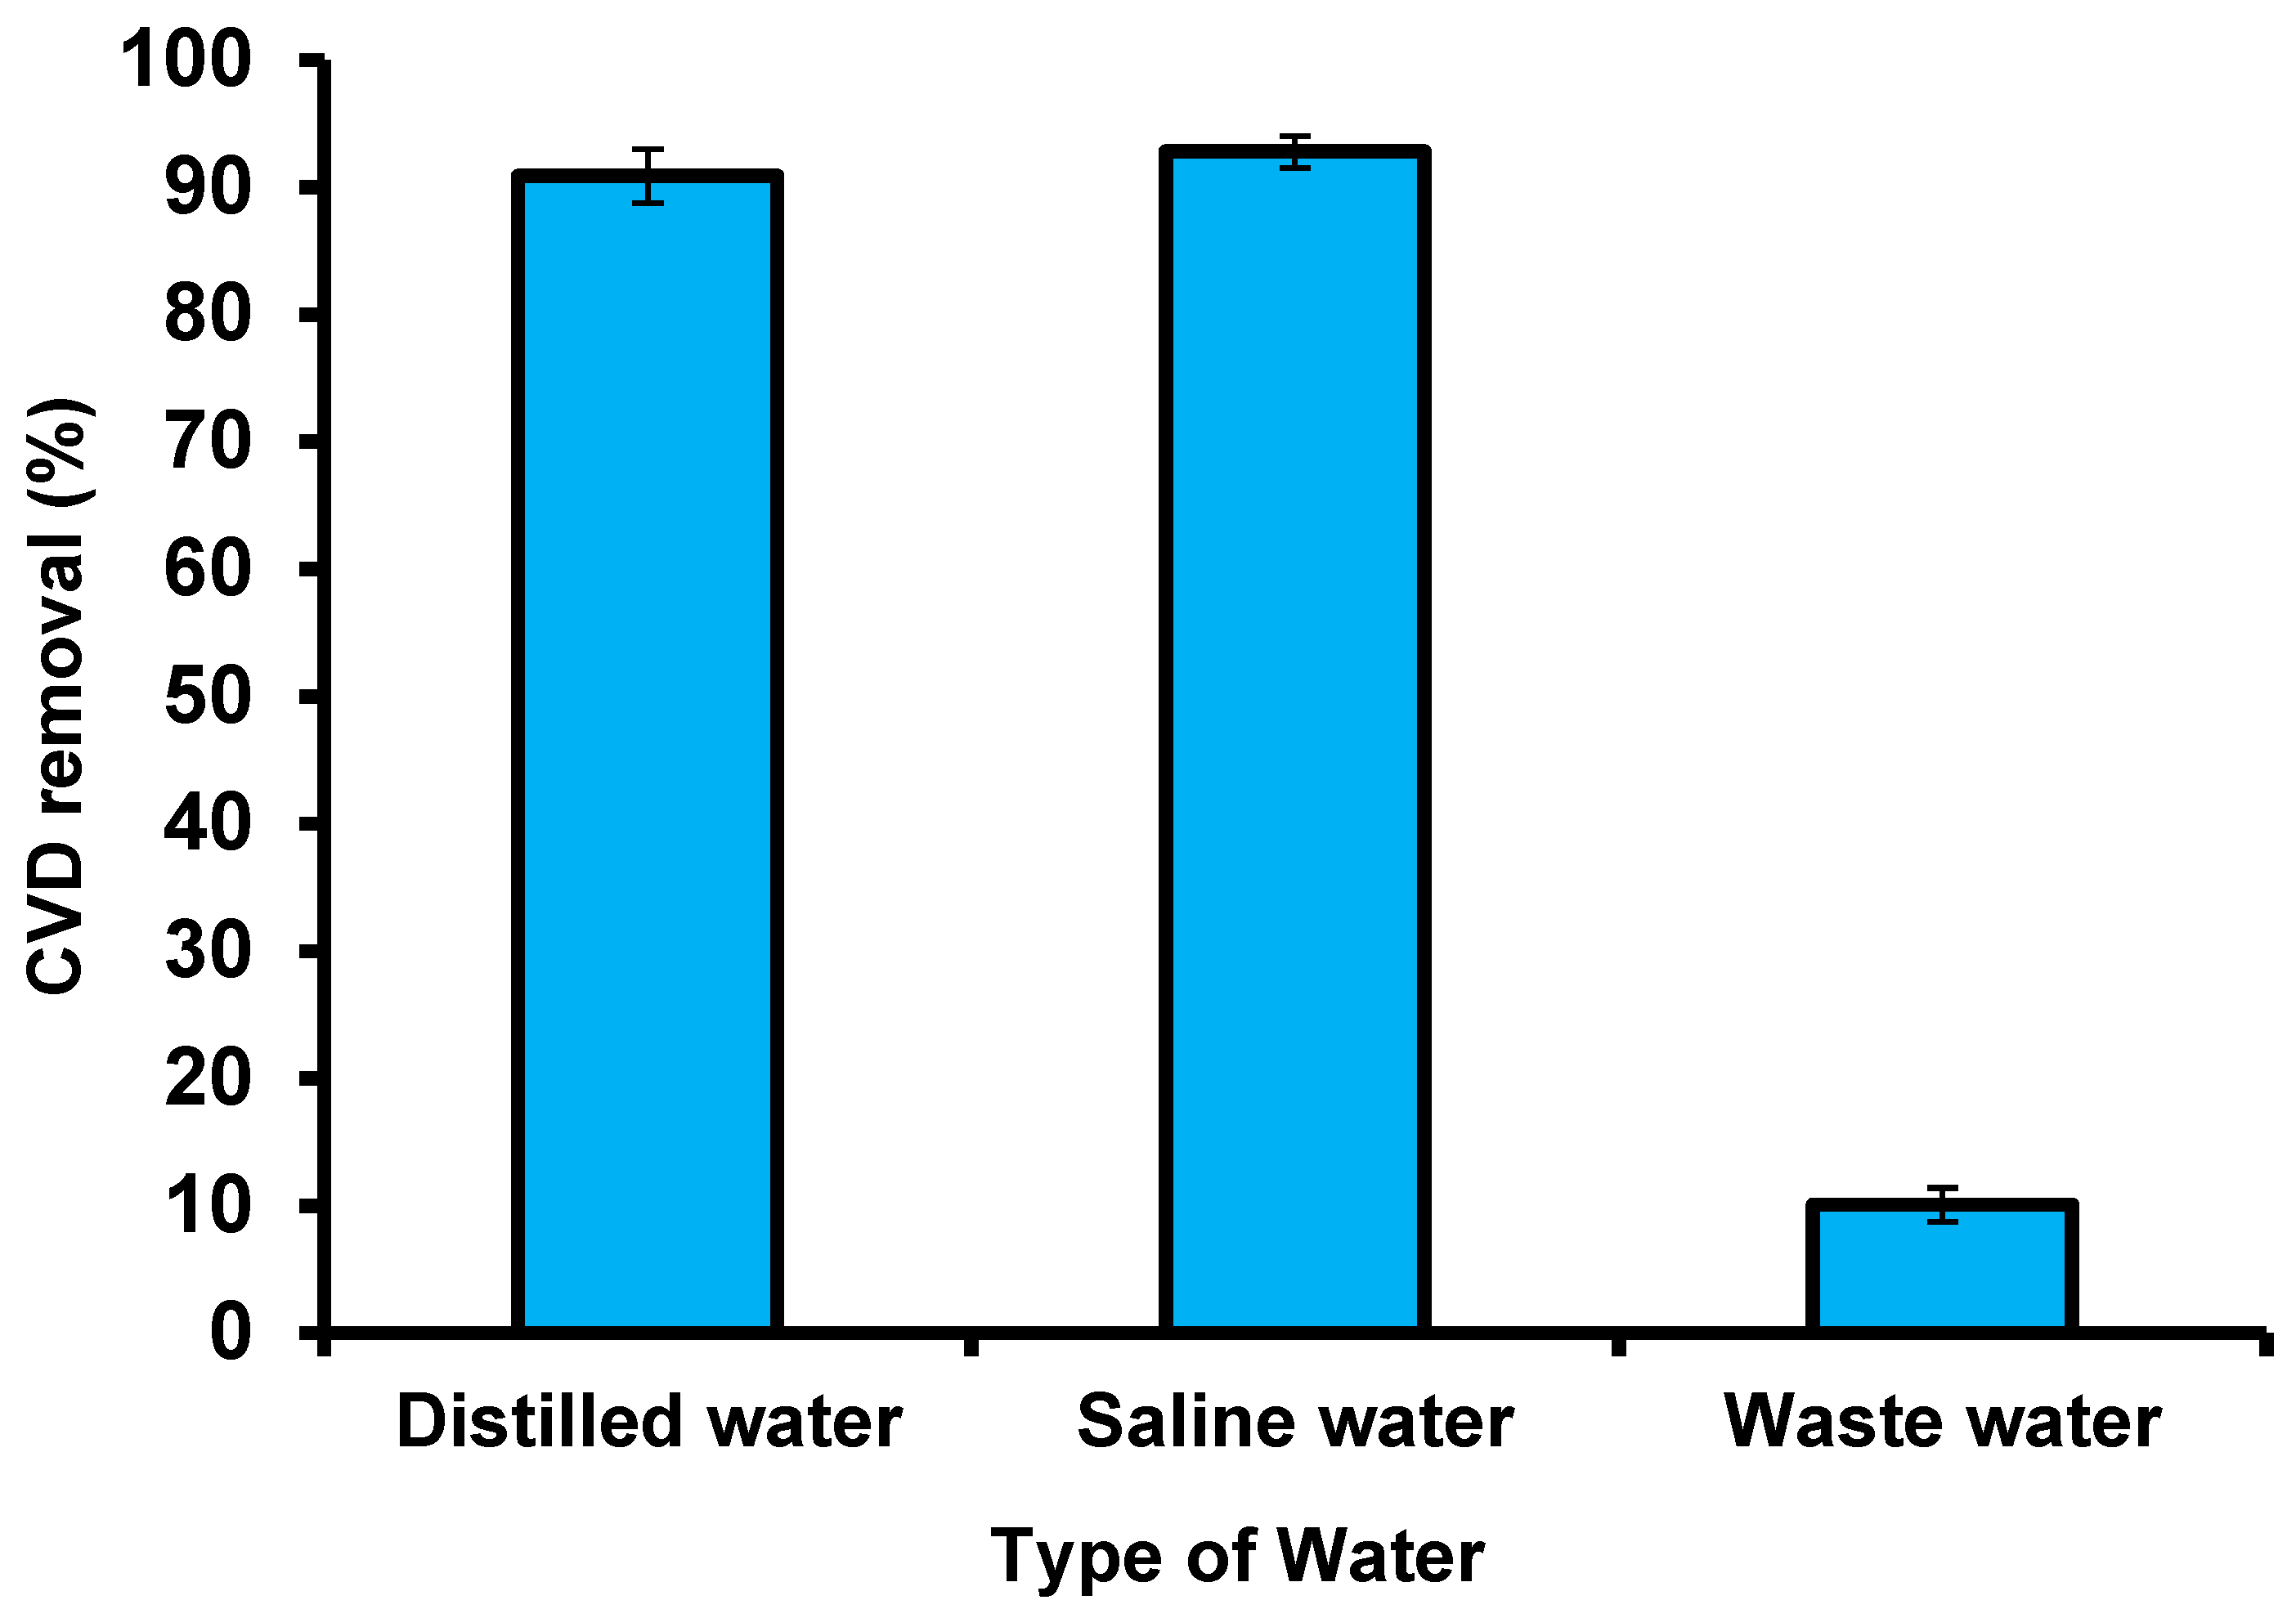
3.6. Industrial Wastewater and Seawater Applications
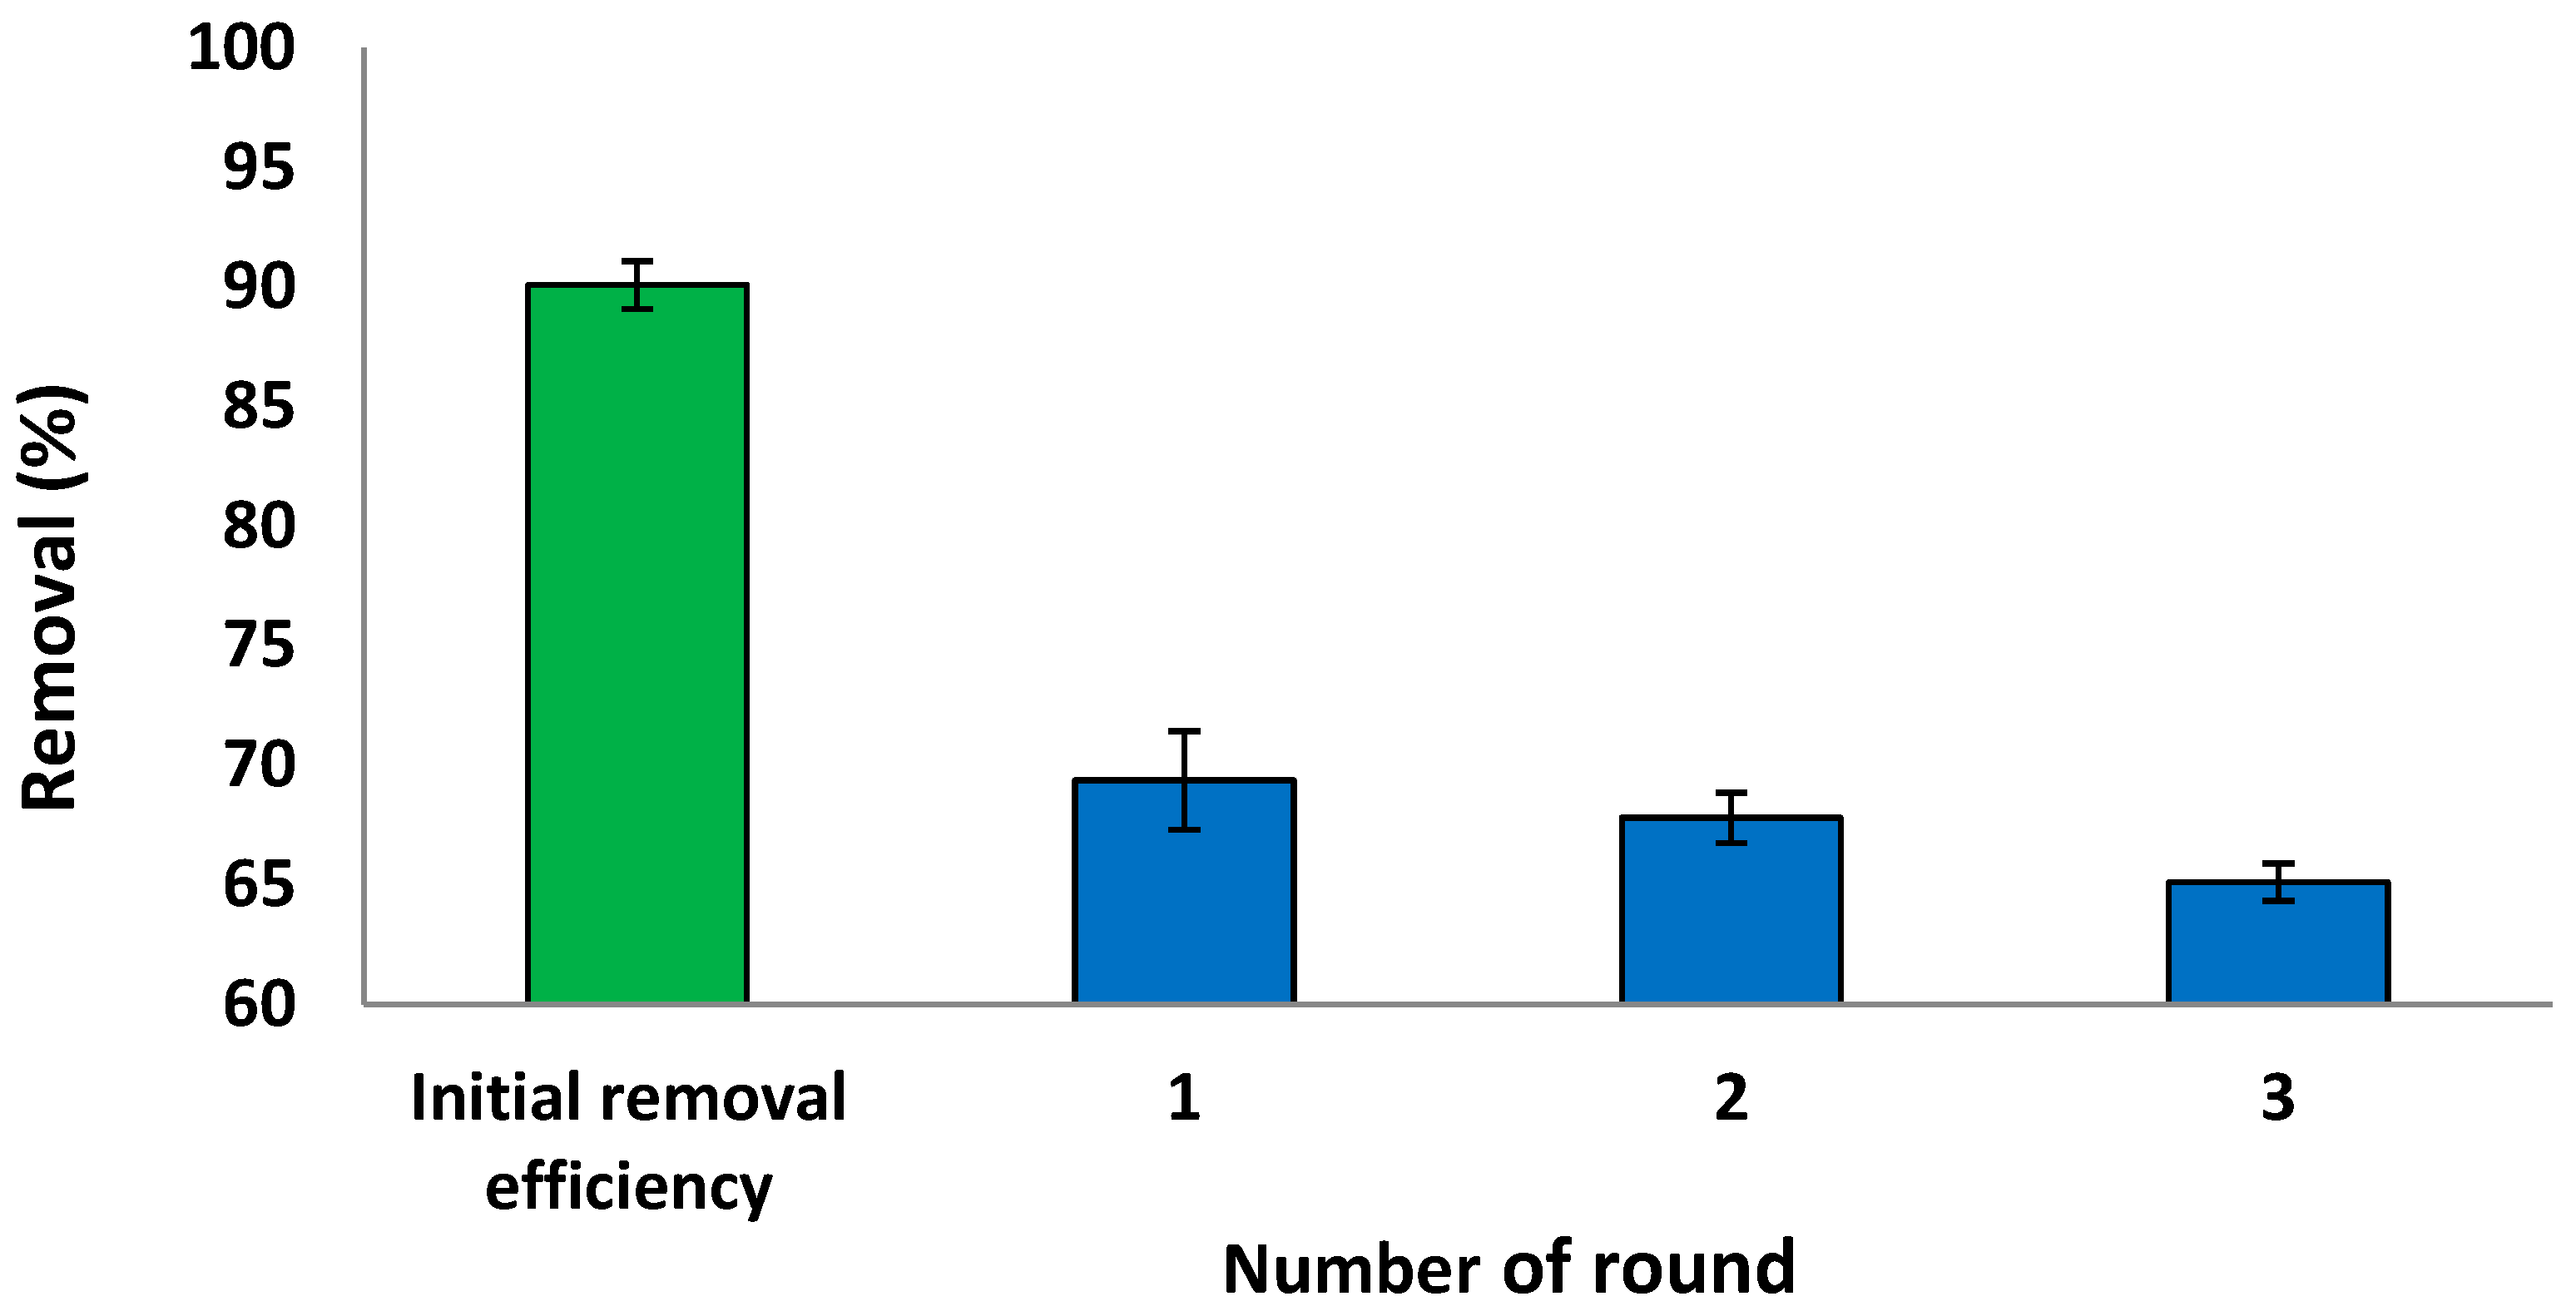
3.7. Regeneration and Reusability Study
3.8. Comparison with Other Studies
3.9. Suggested Mechanism
4. Conclusions
Author Contributions
Funding
Institutional Review Board Statement
Informed Consent Statement
Data Availability Statement
Acknowledgments
Conflicts of Interest
References
- Sharma, A.; Choudhry, A.; Rathi, G.; Tara, N.; Abdulla, N.K.; Sajid, M.; Chaudhry, S.A. Ferrite based magnetic nanocomposites for wastewater treatment through adsorption. In Contamination of Water; Elsevier: Amsterdam, The Netherlands, 2021; pp. 449–460. [Google Scholar]
- Mangla, D.; Sharma, A.; Ikram, S. Critical review on adsorptive removal of antibiotics: Present situation, challenges and future perspective. J. Hazard. Mater. 2022, 425, 127946. [Google Scholar] [CrossRef] [PubMed]
- Choudhry, A.; Sharma, A.; Khan, T.A.; Chaudhry, S.A. Flax seeds based magnetic hybrid nanocomposite: An advance and sustainable material for water cleansing. J. Water Process Eng. 2021, 42, 102150. [Google Scholar] [CrossRef]
- Jabeen, A.; Bhatti, H.N. Adsorptive removal of reactive green 5 (RG-5) and direct yellow 50 (DY-50) from simulated wastewater by Mangifera indica seed shell and its magnetic composite: Batch and Column study. Environ. Technol. Innov. 2021, 23, 101685. [Google Scholar] [CrossRef]
- Karaman, C.; Karaman, O.; Show, P.-L.; Orooji, Y.; Karimi-Maleh, H. Utilization of a double-cross-linked amino-functionalized three-dimensional graphene networks as a monolithic adsorbent for methyl orange removal: Equilibrium, kinetics, thermodynamics and artificial neural network modeling. Environ. Res. 2022, 207, 112156. [Google Scholar] [CrossRef] [PubMed]
- El-Bindary, A.A.; Hussien, M.A.; Diab, M.A.; Eessa, A.M. Adsorption of Acid Yellow 99 by polyacrylonitrile/activated carbon composite: Kinetics, thermodynamics and isotherm studies. J. Mol. Liq. 2014, 197, 236–242. [Google Scholar] [CrossRef]
- Abualnaja, K.M.; Alprol, A.E.; Abu-Saied, M.A.; Ashour, M.; Mansour, A.T. Removing of Anionic Dye from Aqueous Solutions by Adsorption Using of Multiwalled Carbon Nanotubes and Poly (Acrylonitrile-styrene) Impregnated with Activated Carbon. Sustainability 2021, 13, 7077. [Google Scholar] [CrossRef]
- Abualnaja, K.M.; Alprol, A.E.; Abu-Saied, M.A.; Mansour, A.T.; Ashour, M. Studying the Adsorptive Behavior of Poly(Acrylonitrile-co-Styrene) and Carbon Nanotubes (Nanocomposites) Impregnated with Adsorbent Materials towards Methyl Orange Dye. Nanomaterials 2021, 11, 1144. [Google Scholar] [CrossRef]
- Abualnaja, K.M.; Alprol, A.E.; Ashour, M.; Mansour, A.T. Influencing Multi-Walled Carbon Nanotubes for the Removal of Ismate Violet 2R Dye from Wastewater: Isotherm, Kinetics, and Thermodynamic Studies. Appl. Sci. 2021, 11, 4786. [Google Scholar] [CrossRef]
- Hunge, Y.M.; Uchida, A.; Tominaga, Y.; Fujii, Y.; Yadav, A.A.; Kang, S.-W.; Suzuki, N.; Shitanda, I.; Kondo, T.; Itagaki, M. Visible light-assisted photocatalysis using spherical-shaped bivo4 photocatalyst. Catalysts 2021, 11, 460. [Google Scholar] [CrossRef]
- Zhang, M.; Sun, X.; Wang, C.; Wang, Y.; Tan, Z.; Li, J.; Xi, B. Photocatalytic degradation of rhodamine B using Bi4O5Br2-doped ZSM-5. Mater. Chem. Phys. 2022, 278, 125697. [Google Scholar] [CrossRef]
- Yadav, A.; Kang, S.-W.; Hunge, Y. Photocatalytic degradation of Rhodamine B using graphitic carbon nitride photocatalyst. J. Mater. Sci. Mater. Electron. 2021, 32, 15577–15585. [Google Scholar] [CrossRef]
- Gupta, V.; Agarwal, A.; Singh, M.; Singh, N. Removal of Red RB dye from aqueous solution by belpatra bark charcoal (BBC) adsorbent. J. Mater. Environ. Sci. 2017, 8, 3654–3665. [Google Scholar]
- Alprol, A.E. Study of environmental concerns of dyes and recent textile effluents treatment technology: A Review. Asian J. Fish. Aquat. Res. 2019, 3, 1–18. [Google Scholar] [CrossRef]
- Karimi-Maleh, H.; Darabi, R.; Shabani-Nooshabadi, M.; Baghayeri, M.; Karimi, F.; Rouhi, J.; Alizadeh, M.; Karaman, O.; Vasseghian, Y.; Karaman, C. Determination of D&C Red 33 and Patent Blue V Azo dyes using an impressive electrochemical sensor based on carbon paste electrode modified with ZIF-8/g-C3N4/Co and ionic liquid in mouthwash and toothpaste as real samples. Food Chem. Toxicol. 2022, 162, 112907. [Google Scholar] [PubMed]
- Alprol, A.E.; Heneash, A.M.M.; Soliman, A.M.; Ashour, M.; Alsanie, W.F.; Gaber, A.; Mansour, A.T. Assessment of Water Quality, Eutrophication, and Zooplankton Community in Lake Burullus, Egypt. Diversity 2021, 13, 268. [Google Scholar] [CrossRef]
- Khan, M.M.; Khan, A.; Bhatti, H.N.; Zahid, M.; Alissa, S.; El-Badry, Y.A.; Hussein, E.E.; Iqbal, M. Composite of polypyrrole with sugarcane bagasse cellulosic biomass and adsorption efficiency for 2,4-dicholrophonxy acetic acid in column mode. J. Mater. Res. Technol. 2021, 15, 2016–2025. [Google Scholar] [CrossRef]
- Noreen, S.; Tahira, M.; Ghamkhar, M.; Hafiz, I.; Bhatti, H.N.; Nadeem, R.; Murtaza, M.A.; Yaseen, M.; Sheikh, A.A.; Naseem, Z. Treatment of textile wastewater containing acid dye using novel polymeric graphene oxide nanocomposites (GO/PAN, GO/PPy, GO/PSty). J. Mater. Res. Technol. 2021, 14, 25–35. [Google Scholar] [CrossRef]
- Yadav, A.; Hunge, Y.; Kang, S.-W. Porous nanoplate-like tungsten trioxide/reduced graphene oxide catalyst for sonocatalytic degradation and photocatalytic hydrogen production. Surf. Interfaces 2021, 24, 101075. [Google Scholar] [CrossRef]
- Khan, M.A.N.; Siddique, M.; Wahid, F.; Khan, R. Removal of reactive blue 19 dye by sono, photo and sonophotocatalytic oxidation using visible light. Ultrason. Sonochem. 2015, 26, 370–377. [Google Scholar] [CrossRef]
- Tahir, N.; Bhatti, H.N.; Iqbal, M.; Noreen, S. Biopolymers composites with peanut hull waste biomass and application for Crystal Violet adsorption. Int. J. Biol. Macromol. 2017, 94, 210–220. [Google Scholar] [CrossRef]
- Saeed, A.; Sharif, M.; Iqbal, M. Application potential of grapefruit peel as dye sorbent: Kinetics, equilibrium and mechanism of crystal violet adsorption. J. Hazard. Mater. 2010, 179, 564–572. [Google Scholar] [CrossRef] [PubMed]
- Ferreira, B.C.S.; Teodoro, F.S.; Mageste, A.B.; Gil, L.F.; de Freitas, R.P.; Gurgel, L.V.A. Application of a new carboxylate-functionalized sugarcane bagasse for adsorptive removal of crystal violet from aqueous solution: Kinetic, equilibrium and thermodynamic studies. Ind. Crops Prod. 2015, 65, 521–534. [Google Scholar] [CrossRef]
- Gopi, S.; Pius, A.; Thomas, S. Enhanced adsorption of crystal violet by synthesized and characterized chitin nano whiskers from shrimp shell. J. Water Process Eng. 2016, 14, 1–8. [Google Scholar] [CrossRef]
- Alprol, A.E.; Abd El Azzem, M.; Amer, A.; El-Metwally, M.E.; Abd El-Hamid, H.T.; El-Moselhy, K.M. Adsorption of cadmium (II) ions from aqueous solution onto mango leaves. Asian J. Phys. Chem. Sci. 2017, 2, 1–11. [Google Scholar] [CrossRef]
- Sharma, A.; Chaudhry, S.A. Adsorption of Pharmaceutical Pollutants Using Lignocellulosic Materials. In Green Materials for Wastewater Treatment; Springer: Berlin/Heidelberg, Germany, 2020; pp. 277–289. [Google Scholar]
- Abbas, E.M.; Ali, F.S.; Desouky, M.G.; Ashour, M.; El-Shafei, A.; Maaty, M.M.; Sharawy, Z.Z. Novel Comprehensive Molecular and Ecological Study Introducing Coastal Mud Shrimp (Solenocera Crassicornis) Recorded at the Gulf of Suez, Egypt. J. Mar. Sci. Eng. 2020, 9, 9. [Google Scholar] [CrossRef]
- Metwally, A.S.; El-Naggar, H.A.; El-Damhougy, K.A.; Bashar, M.A.E.; Ashour, M.; Abo-Taleb, H.A.H. GC-MS analysis of bioactive components in six different crude extracts from the Soft Coral (Sinularia maxim) collected from Ras Mohamed, Aqaba Gulf, Red Sea, Egypt. Egypt. J. Aquat. Biol. Fish. 2020, 24, 425–434. [Google Scholar] [CrossRef]
- Ashour, M.; Mabrouk, M.M.; Abo-Taleb, H.A.; Sharawy, Z.Z.; Ayoub, H.F.; Van Doan, H.; Davies, S.J.; El-Haroun, E.; Goda, A.M.S.A. A liquid seaweed extract (TAM®) improves aqueous rearing environment, diversity of zooplankton community, whilst enhancing growth and immune response of Nile tilapia, Oreochromis niloticus, challenged by Aeromonas hydrophila. Aquaculture 2021, 543, 736915. [Google Scholar] [CrossRef]
- Wang, S.; Hu, S.; Shang, H.; Barati, B.; Gong, X.; Hu, X.; Abomohra, A.E.-F. Study on the co-operative effect of kitchen wastewater for harvest and enhanced pyrolysis of microalgae. Bioresour. Technol. 2020, 317, 123983. [Google Scholar] [CrossRef]
- Tu, R.; Jin, W.; Xi, T.; Yang, Q.; Han, S.-F.; Abomohra, A.E.-F. Effect of static magnetic field on the oxygen production of Scenedesmus obliquus cultivated in municipal wastewater. Water Res. 2015, 86, 132–138. [Google Scholar] [CrossRef]
- Han, S.; Jin, W.; Chen, Y.; Tu, R.; Abomohra, A.E.-F. Enhancement of lipid production of Chlorella pyrenoidosa cultivated in municipal wastewater by magnetic treatment. Appl. Biochem. Biotechnol. 2016, 180, 1043–1055. [Google Scholar] [CrossRef]
- Tadda, M.A.; Li, C.; Gouda, M.; Abomohra, A.E.-F.; Shitu, A.; Ahsan, A.; Zhu, S.; Liu, D. Enhancement of nitrite/ammonia removal from saline recirculating aquaculture wastewater system using moving bed bioreactor. J. Environ. Chem. Eng. 2021, 9, 105947. [Google Scholar] [CrossRef]
- Essa, D.; Abo-Shady, A.; Khairy, H.; Abomohra, A.E.-F.; Elshobary, M. Potential cultivation of halophilic oleaginous microalgae on industrial wastewater. Egypt. J. Bot. 2018, 58, 205–216. [Google Scholar] [CrossRef]
- Ashour, M.; Hassan, S.M.; Elshobary, M.E.; Ammar, G.A.G.; Gaber, A.; Alsanie, W.F.; Mansour, A.T.; El-Shenody, R. Impact of Commercial Seaweed Liquid Extract (TAM®) Biostimulant and Its Bioactive Molecules on Growth and Antioxidant Activities of Hot Pepper (Capsicum annuum). Plants 2021, 10, 1045. [Google Scholar] [CrossRef] [PubMed]
- Battah, M.; El-Ayoty, Y.; Abomohra, A.E.-F.; El-Ghany, S.A.; Esmael, A. Optimization of growth and lipid production of the Chlorophyte Microalga Chlorella vulgaris as a feedstock for biodiesel production. World Appl. Sci. J. 2013, 28, 1536–1543. [Google Scholar]
- Cao, B.; Sun, Y.; Guo, J.; Wang, S.; Yuan, J.; Esakkimuthu, S.; Bernard Uzoejinwa, B.; Yuan, C.; Abomohra, A.E.F.; Qian, L.; et al. Synergistic effects of co-pyrolysis of macroalgae and polyvinyl chloride on bio-oil/bio-char properties and transferring regularity of chlorine. Fuel 2019, 246, 319–329. [Google Scholar] [CrossRef]
- Ebaid, R.; Elhussainy, E.; El-Shourbagy, S.; Ali, S.; Abomohra, A.E.-F. Protective effect of Arthrospira platensis against liver injury induced by copper nanoparticles. Orient. Pharm. Exp. Med. 2017, 17, 203–210. [Google Scholar] [CrossRef]
- El-Mesery, H.S.; Mao, H.; Abomohra, A.E.F. Applications of non-destructive technologies for agricultural and food products quality inspection. Sensors 2019, 19, 846. [Google Scholar] [CrossRef]
- El-Shouny, W.; Sharaf, M.; Abomohra, A.; Abo-Eleneen, M. Production enhancement of some valuable compounds of Arthrospira platensis. J. Basic Environ. Sci. 2015, 2, 74–83. [Google Scholar]
- Shao, W.; Ebaid, R.; El-Sheekh, M.; Abomohra, A.; Eladel, H. Pharmaceutical applications and consequent environmental impacts of Spirulina (Arthrospira): An overview. Grasas Y Aceites 2019, 70, 292. [Google Scholar] [CrossRef]
- Huo, S.; Basheer, S.; Liu, F.; Elshobary, M.; Zhang, C.; Qian, J.; Xu, L.; Arslan, M.; Cui, F.; Zan, X.; et al. Bacterial intervention on the growth, nutrient removal and lipid production of filamentous oleaginous microalgae Tribonema sp. Algal Res. 2020, 52, 102088. [Google Scholar] [CrossRef]
- Osman, M.E.; Abo-shady, A.M.; Elshobary, M.E. Production and characterization of antimicrobial active substance from some macroalgae collected from Abu-Qir bay (Alexandria) Egypt. Afr. J. Biotechnol. 2013, 12, 6847–6858. [Google Scholar]
- Osman, M.E.H.; Abo-shady, A.M.; Elshobary, M.E. In vitro screening of antimicrobial activity of extracts of some macroalgae collected from Abu-Qir bay Alexandria, Egypt. Afr. J. Biotechnol. 2010, 9, 7203–7208. [Google Scholar]
- Madkour, F.F.; Kamil, A.E.-W.; Nasr, H.S. Production and nutritive value of Spirulina platensis in reduced cost media. Egypt. J. Aquat. Res. 2012, 38, 51–57. [Google Scholar] [CrossRef]
- El-Kassas, H.Y.; Mohamed, L.A. Bioremediation of the textile waste effluent by Chlorella vulgaris. Egypt. J. Aquat. Res. 2014, 40, 301–308. [Google Scholar] [CrossRef]
- Yang, J.; Zhu, Q.; Chai, J.; Xu, F.; Ding, Y.; Zhu, Q.; Lu, Z.; Khoo, K.S.; Bian, X.; Wang, S. Development of environmentally friendly biological algicide and biochemical analysis of inhibitory effect of diatom Skeletonema costatum. Chin. Chem. Lett. 2021, 33, 1358–1364. [Google Scholar] [CrossRef]
- Li, H.; Xu, T.; Ma, J.; Li, F.; Xu, J. Physiological responses of Skeletonema costatum to the interactions of seawater acidification and the combination of photoperiod and temperature. Biogeosciences 2021, 18, 1439–1449. [Google Scholar] [CrossRef]
- Shabaka, S.H. Checklist of seaweeds and seagrasses of Egypt (Mediterranean Sea): A review. Egypt. J. Aquat. Res. 2018, 44, 203–212. [Google Scholar] [CrossRef]
- Fu, Y.; Viraraghavan, T. Removal of Congo Red from an aqueous solution by fungus Aspergillus niger. Adv. Environ. Res. 2002, 7, 239–247. [Google Scholar] [CrossRef]
- Sulaymon, A.H.; Ebrahim, S.E.; Abdullah, S.M.; Al-Musawi, T.J. Removal of lead, cadmium, and mercury ions using biosorption. Desalination Water Treat. 2010, 24, 344–352. [Google Scholar] [CrossRef]
- Aksu, Z. Application of biosorption for the removal of organic pollutants: A review. Process Biochem. 2005, 40, 997–1026. [Google Scholar] [CrossRef]
- Guedes, A.C.; Malcata, F.X. Nutritional value and uses of microalgae in aquaculture. Aquaculture 2012, 10, 59–78. [Google Scholar]
- Rajeswari, M.V.; Balasubramanian, T. Comparative study on growth of Skeletonema costatum: A microalga as live feed for aquaculture importance. Int. J. Res. Fish. Aquac. 2014, 4, 117–121. [Google Scholar]
- Azmi, K.; Arsad, S.; Sari, L. The effect of commercial nutrients to increase the population of Skeletonema costatum on laboratory and mass scales. In Proceedings of the IOP Conference Series: Earth and Environmental Science, Surabaya, Indonesia, 26 September 2019; p. 12039. [Google Scholar]
- Pratama, N.; Rahardja, B.; Sari, L. The effect of density as Skeletonema costatum bioremediation agent of copper (Cu) heavy metal concentration. In Proceedings of the IOP Conference Series: Earth and Environmental Science, Surabaya, Indonesia, 26 September 2019; p. 12039. [Google Scholar] [CrossRef]
- Zhang, C.; Chen, X.; Wang, J.; Tan, L. Toxic effects of microplastic on marine microalgae Skeletonema costatum: Interactions between microplastic and algae. Environ. Pollut. 2017, 220, 1282–1288. [Google Scholar] [CrossRef] [PubMed]
- Mangla, D.; Sharma, A.; Ikram, S. Synthesis of ecological chitosan/PVP magnetic composite: Remediation of amoxicillin trihydrate from its aqueous solution, isotherm modelling, thermodynamic, and kinetic studies. React. Funct. Polym. 2022, 175, 105261. [Google Scholar] [CrossRef]
- Nassiri, Y.; Mansot, J.; Wéry, J.; Ginsburger-Vogel, T.; Amiard, J. Ultrastructural and electron energy loss spectroscopy studies of sequestration mechanisms of Cd and Cu in the marine diatom Skeletonema costatum. Arch. Environ. Contam. Toxicol. 1997, 33, 147–155. [Google Scholar] [CrossRef]
- Özer, A.; Akkaya, G.; Turabik, M. The removal of Acid Red 274 from wastewater: Combined biosorption and biocoagulation with Spirogyra rhizopus. Dye. Pigment. 2006, 71, 83–89. [Google Scholar] [CrossRef]
- Mohan, S.V.; Rao, N.C.; Prasad, K.K.; Karthikeyan, J. Treatment of simulated Reactive Yellow 22 (Azo) dye effluents using Spirogyra species. Waste Manag. 2002, 22, 575–582. [Google Scholar] [CrossRef]
- Kumar, P.S.; Ramalingam, S.; Senthamarai, C.; Niranjanaa, M.; Vijayalakshmi, P.; Sivanesan, S. Adsorption of dye from aqueous solution by cashew nut shell: Studies on equilibrium isotherm, kinetics and thermodynamics of interactions. Desalination 2010, 261, 52–60. [Google Scholar] [CrossRef]
- Senthilkumaar, S.; Kalaamani, P.; Subburaam, C. Liquid phase adsorption of crystal violet onto activated carbons derived from male flowers of coconut tree. J. Hazard. Mater. 2006, 136, 800–808. [Google Scholar] [CrossRef]
- Salama, R.S.; El-Bahy, S.M.; Mannaa, M.A. Sulfamic acid supported on mesoporous MCM-41 as a novel, efficient and reusable heterogenous solid acid catalyst for synthesis of xanthene, dihydropyrimidinone and coumarin derivatives. Colloids Surf. A Physicochem. Eng. Asp. 2021, 628, 127261. [Google Scholar] [CrossRef]
- Soedarti, T.; Tini, S.; Sucipto, H.; Kuncoro, E.P. Bioremediation of mercury (II) contaminated seawater using the diatom Skeletonema costatum. KnE Life Sci. 2017, 3, 62–68. [Google Scholar] [CrossRef]
- Soedarti, T.; Surtiningsih, T.; Hariyanto, S.; Kuncoro, E.P. Remediation of Pb (II) and Cd (II) in seawater by Skeletonema costatum. Sustinere J. Environ. Sustain. 2017, 1, 63–143. [Google Scholar] [CrossRef][Green Version]
- Guillard, R.R. Culture of phytoplankton for feeding marine invertebrates. In Culture of Marine Invertebrate Animals; Springer: Berlin/Heidelberg, Germany, 1975; pp. 29–60. [Google Scholar] [CrossRef]
- Ghoneim, M.M.; El-Desoky, H.S.; El-Moselhy, K.M.; Amer, A.; Abou El-Naga, E.H.; Mohamedein, L.I.; Al-Prol, A.E. Removal of cadmium from aqueous solution using marine green algae, Ulva lactuca. Egypt. J. Aquat. Res. 2014, 40, 235–242. [Google Scholar] [CrossRef]
- Zar, J. Biostatistical Analysis, 2nd ed.; Prentice-Hall: Englewood Cliffs, NJ, USA, 1984. [Google Scholar]
- Hashem, F. Removal of methylene blue by magnetitecovered bentonite nano-composite. Eur. Chem. Bull. 2013, 2, 524–529. [Google Scholar]
- Eddebbagh, M.; Abourriche, A.; Berrada, M.; Zina, M.B.; Bennamara, A. Adsorbent material from pomegranate (Punica granatum) leaves: Optimization on removal of methylene blue using response surface methodology. J. Mater. Environ. Sci. 2016, 7, 2021–2033. [Google Scholar]
- Zhao, D.; Zhang, W.; Chen, C.; Wang, X. Adsorption of methyl orange dye onto multiwalled carbon nanotubes. Procedia Environ. Sci. 2013, 18, 890–895. [Google Scholar] [CrossRef]
- Aksu, Z.; Tezer, S. Equilibrium and kinetic modelling of biosorption of Remazol Black B by Rhizopus arrhizus in a batch system: Effect of temperature. Process Biochem. 2000, 36, 431–439. [Google Scholar] [CrossRef]
- Yao, Y.; Bing, H.; Feifei, X.; Xiaofeng, C. Equilibrium and kinetic studies of methyl orange adsorption on multiwalled carbon nanotubes. Chem. Eng. J. 2011, 170, 82–89. [Google Scholar] [CrossRef]
- Wu, K.; Yu, J.; Jiang, X. Multi-walled carbon nanotubes modified by polyaniline for the removal of alizarin yellow R from aqueous solutions. Adsorpt. Sci. Technol. 2018, 36, 198–214. [Google Scholar] [CrossRef]
- Shirmardi, M.; Mahvi, A.H.; Hashemzadeh, B.; Naeimabadi, A.; Hassani, G.; Niri, M.V. The adsorption of malachite green (MG) as a cationic dye onto functionalized multi walled carbon nanotubes. Korean J. Chem. Eng. 2013, 30, 1603–1608. [Google Scholar] [CrossRef]
- Gupta, A.; Das, A.; Majumder, K.; Arora, N.; Mayo, H.G.; Singh, P.P.; Beg, M.S.; Singh, S. Obesity is independently associated with increased risk of hepatocellular cancer-related mortality: A systematic review and meta-analysis. Am. J. Clin. Oncol. 2018, 41, 874. [Google Scholar] [CrossRef]
- Doğar, Ç.; Gürses, A.; Açıkyıldız, M.; Özkan, E. Thermodynamics and kinetic studies of biosorption of a basic dye from aqueous solution using green algae Ulothrix sp. Colloids Surf. B Biointerfaces 2010, 76, 279–285. [Google Scholar] [CrossRef]
- Amuda, O.S.; Olayiwola, A.O.; Alade, A.O.; Farombi, A.G.; Adebisi, S.A. Adsorption of methylene blue from aqueous solution using steam-activated carbon produced from Lantana camara Stem. J. Environ. Prot. 2014, 5, 1352. [Google Scholar] [CrossRef]
- Alprol, A.E.; Heneash, A.M.M.; Ashour, M.; Abualnaja, K.M.; Alhashmialameer, D.; Mansour, A.T.; Sharawy, Z.Z.; Abu-Saied, M.A.; Abomohra, A.E. Potential Applications of Arthrospira platensis Lipid-Free Biomass in Bioremediation of Organic Dye from Industrial Textile Effluents and Its Influence on Marine Rotifer (Brachionus plicatilis). Materials 2021, 14, 4446. [Google Scholar] [CrossRef]
- Inyinbor, A.; Adekola, F.; Olatunji, G.A. Kinetics, isotherms and thermodynamic modeling of liquid phase adsorption of Rhodamine B dye onto Raphia hookerie fruit epicarp. Water Resour. Ind. 2016, 15, 14–27. [Google Scholar] [CrossRef]
- Taufik, A.; Saleh, R. Synthesis of iron (II, III) oxide/zinc oxide/copper (II) oxide (Fe3O4/ZnO/CuO) nanocomposites and their photosonocatalytic property for organic dye removal. J. Colloid Interface Sci. 2017, 491, 27–36. [Google Scholar] [CrossRef]
- Hossain, M.; Ngo, H.H.; Guo, W.; Nguyen, T. Removal of copper from water by adsorption onto banana peel as bioadsorbent. GEOMATE J. 2012, 2, 227–234. [Google Scholar] [CrossRef]
- Subbareddy, Y.; Jeseentharani, V.; Jayakumar, C.; Nagaraja, K.; Jeyaraj, B. Adsorptive removal of Malachite Green (oxalate) by low cost adsorbent. J. Environ. Res. Dev. 2012, 7, 275–284. [Google Scholar]
- Achak, M.; Hafidi, A.; Ouazzani, N.; Sayadi, S.; Mandi, L. Low cost biosorbent “banana peel” for the removal of phenolic compounds from olive mill wastewater: Kinetic and equilibrium studies. J. Hazard. Mater. 2009, 166, 117–125. [Google Scholar] [CrossRef]
- Memon, J.R.; Memon, S.Q.; Bhanger, M.; Memon, G.Z.; El-Turki, A.; Allen, G.C. Characterization of banana peel by scanning electron microscopy and FT-IR spectroscopy and its use for cadmium removal. Colloids Surf. B Biointerfaces 2008, 66, 260–265. [Google Scholar] [CrossRef]
- Abdelwahab, O.; Amin, N. Adsorption of phenol from aqueous solutions by Luffa cylindrica fibers: Kinetics, isotherm and thermodynamic studies. Egypt. J. Aquat. Res. 2013, 39, 215–223. [Google Scholar] [CrossRef]
- Langmuir, I. The constitution and fundamental properties of solids and liquids. II. Liquids. J. Am. Chem. Soc. 1917, 39, 1848–1906. [Google Scholar] [CrossRef]
- Foo, K.Y.; Hameed, B.H. Insights into the modeling of adsorption isotherm systems. Chem. Eng. J. 2010, 156, 2–10. [Google Scholar] [CrossRef]
- Tran, H.; You, S.-J.; Hosseini-Bandegharaei, A.; Chao, H.P. Mistakes and inconsistencies regarding adsorption of contaminants from aqueous solutions: A critical review. Water Res. 2017, 120, 88–116. [Google Scholar] [CrossRef]
- Hall, K.R.; Eagleton, L.C.; Acrivos, A.; Vermeulen, T. Pore-and solid-diffusion kinetics in fixed-bed adsorption under constant-pattern conditions. Ind. Eng. Chem. Fundam. 1966, 5, 212–223. [Google Scholar] [CrossRef]
- Ahalya, N.; Kanamadi, R.; Ramachandra, T. Biosorption of iron (III) from aqueous solutions using the husk of Cicer arientinum. CSIR 2006, 13, 122–127. [Google Scholar]
- Adamson, A.W.; Gast, A.P. Physical Chemistry of Surfaces; Interscience publishers: New York, NY, USA, 1967; Volume 150. [Google Scholar]
- Freundlich, H. Über die Adsorption in Lösungen. Habilitationsschrift Durch Welche… zu Haltenden Probevorlesung” Kapillarchemie und Physiologie” Einladet Dr. Herbert Freundlich; W. Engelmann: Leipzig, Germany, 1906. [Google Scholar]
- Kargi, F.; Cikla, S. Biosorption of zinc (II) ions onto powdered waste sludge (PWS): Kinetics and isotherms. Enzym. Microb. Technol. 2006, 38, 705–710. [Google Scholar] [CrossRef]
- Kavitha, D.; Namasivayam, C. Experimental and kinetic studies on methylene blue adsorption by coir pith carbon. Bioresour. Technol. 2007, 98, 14–21. [Google Scholar] [CrossRef]
- Wang, X.; Guo, Y.; Yang, L.; Han, M.; Zhao, J.; Cheng, X. Nanomaterials as sorbents to remove heavy metal ions in wastewater treatment. J. Environ. Anal. Toxicol. 2012, 2, 154. [Google Scholar] [CrossRef]
- Volesky, B. Detoxification of metal-bearing effluents: Biosorption for the next century. Hydrometallurgy 2001, 59, 203–216. [Google Scholar] [CrossRef]
- Halsey, G. Physical adsorption on non-uniform surfaces. J. Chem. Phys. 1948, 16, 931–937. [Google Scholar] [CrossRef]
- Kumar, Y.P.; King, P.; Prasad, V. Removal of copper from aqueous solution using Ulva fasciata sp.—A marine green algae. J. Hazard. Mater. 2006, 137, 367–373. [Google Scholar] [CrossRef] [PubMed]
- Yang, S.I.; Seth, J.; Strachan, J.P.; Gentemann, S.; Kim, D.; Holten, D.; Lindsey, J.S.; Bocian, D.F. Ground and excited state electronic properties of halogenated tetraarylporphyrins. Tuning the building blocks for porphyrin-based photonic devices. J. Porphyr. Phthalocyanines 1999, 3, 117–147. [Google Scholar] [CrossRef]
- Menkiti, M.; Aniagor, C.; Agu, C.; Ugonabo, V. Effective adsorption of crystal violet dye from an aqueous solution using lignin-rich isolate from elephant grass. Water Conserv. Sci. Eng. 2018, 3, 33–46. [Google Scholar] [CrossRef]
- El Nemr, A.; Abdelwahab, O.; El-Sikaily, A.; Khaled, A. Removal of direct blue-86 from aqueous solution by new activated carbon developed from orange peel. J. Hazard. Mater. 2009, 161, 102–110. [Google Scholar] [CrossRef]
- Kannan, N.; Meenakshisundaram, M. Adsorption of Congo Red on various activated carbons. A comparative study. Water Air Soil Pollut. 2002, 138, 289–305. [Google Scholar] [CrossRef]
- Wright, E.; Partt, N. Current chemical Papars. J. Chem. Soc. Faraday Trans. 1961, 70, 1461. [Google Scholar] [CrossRef]
- Volesky, B.; Weber, J.; Park, J. Continuous-flow metal biosorption in a regenerable Sargassum column. Water Res. 2003, 37, 297–306. [Google Scholar] [CrossRef]
- Wu, Z.; Deng, W.; Tang, S.; Ruiz-Hitzky, E.; Luo, J.; Wang, X. Pod-inspired MXene/porous carbon microspheres with ultrahigh adsorption capacity towards crystal violet. Chem. Eng. J. 2021, 426, 130776. [Google Scholar] [CrossRef]
- Mittal, H.; Al Alili, A.; Morajkar, P.P.; Alhassan, S.M. Graphene oxide crosslinked hydrogel nanocomposites of xanthan gum for the adsorption of crystal violet dye. J. Mol. Liq. 2021, 323, 115034. [Google Scholar] [CrossRef]
- Satapathy, M.K.; Das, P. Optimization of crystal violet dye removal using novel soil-silver nanocomposite as nanoadsorbent using response surface methodology. J. Environ. Chem. Eng. 2014, 2, 708–714. [Google Scholar] [CrossRef]
- Takabi, A.S.; Shirani, M.; Semnani, A. Apple stem as a high performance cellulose based biosorbent for low cost and eco-friendly adsorption of crystal violet from aqueous solutions using experimental design: Mechanism, kinetic and thermodynamics. Environ. Technol. Innov. 2021, 24, 101947. [Google Scholar] [CrossRef]
- Putri, K.N.A.; Keereerak, A.; Chinpa, W. Novel cellulose-based biosorbent from lemongrass leaf combined with cellulose acetate for adsorption of crystal violet. Int. J. Biol. Macromol. 2020, 156, 762–772. [Google Scholar] [CrossRef] [PubMed]
- Falaki, Z.; Bashiri, H. Preparing an adsorbent from the unused solid waste of Rosewater extraction for high efficient removal of Crystal Violet. J. Iran. Chem. Soc. 2021, 18, 2689–2702. [Google Scholar] [CrossRef]
- Ji, Q.; Li, H. High surface area activated carbon derived from chitin for efficient adsorption of Crystal Violet. Diam. Relat. Mater. 2021, 118, 108516. [Google Scholar] [CrossRef]
- Bertolini, T.C.R.; Izidoro, J.C.; Magdalena, C.P.; Fungaro, D.A. Adsorption of crystal violet dye from aqueous solution onto zeolites from coal fly and bottom ashes. Orbital Electron. J. Chem. 2013, 5, 179–191. [Google Scholar]
- Sarabadan, M.; Bashiri, H.; Mousavi, S.M. Removal of crystal violet dye by an efficient and low cost adsorbent: Modeling, kinetic, equilibrium and thermodynamic studies. Korean J. Chem. Eng. 2019, 36, 1575–1586. [Google Scholar] [CrossRef]
- Amodu, O.S.; Ojumu, T.V.; Ntwampe, S.K.; Ayanda, O.S. Rapid adsorption of crystal violet onto magnetic zeolite synthesized from fly ash and magnetite nanoparticles. J. Encapsulation Adsorpt. Sci. 2015, 5, 191. [Google Scholar] [CrossRef]
- Ali, H.; Muhammad, S.K. Biosorption of crystal violet from water on leaf biomass of Calotropis procera. J. Environ. Sci. Technol. 2008, 1, 143–150. [Google Scholar] [CrossRef]
- Guler, U.A.; Ersan, M.; Tuncel, E.; Dügenci, F. Mono and simultaneous removal of crystal violet and safranin dyes from aqueous solutions by HDTMA-modified Spirulina sp. Process Saf. Environ. Prot. 2016, 99, 194–206. [Google Scholar] [CrossRef]
- Mondal, S. Methods of dye removal from dye house effluent—An overview. Environ. Eng. Sci. 2008, 25, 383–396. [Google Scholar] [CrossRef]
- Knauer, K.; Behra, R.; Sigg, L. Adsorption and uptake of copper by the green alga scenedesmus subspicatus (chlorophyta) 1. J. Phycol. 1997, 33, 596–601. [Google Scholar] [CrossRef]
- Perales-Vela, H.V.; Pena-Castro, J.M.; Canizares-Villanueva, R.O. Heavy metal detoxification in eukaryotic microalgae. Chemosphere 2006, 64, 1–10. [Google Scholar] [CrossRef] [PubMed]
- Shaw, J. Heavy Metal Tolerance in Plants: Evolutionary Aspects; CRC Press: Boca Raton, FL, USA, 1989. [Google Scholar]


| Properties | Data |
|---|---|
| BET surface area | 87.17 m² g−1 |
| Single-point BET | 74.10 m² g−1 |
| DH desorption | 62.89 m² g−1 |
| Skeletal density | 2.2 g C−1 |
| Average pore sizes | 3.131 nm |
| Average pore volume | 0.103 CC g−1 |
| T (°C) | Qe (mg g−1) | ΔG (kJ mol−1) | ΔH (kJ mol−1) | ΔS (kJ mol−1 k) |
|---|---|---|---|---|
| 25 | 1.190 | −5.050 | 8.636 | −0.036 |
| 35 | 0.964 | −3.279 | ||
| 45 | 0.824 | −2.355 | ||
| 55 | 0.852 | −2.636 |
| RL | Type of Isotherm |
|---|---|
| RL > 1 | Unfavorable |
| RL = 1 | Linear |
| 0 < RL < 1 | Favorable |
| RL = 0 | Irreversible |
| Isotherm Model | Isotherm Parameters | Values |
|---|---|---|
| Langmuir | Qm (mg g−1) | 17.76 |
| RL | 0.011 | |
| KL | 5.06 | |
| R2 | 0.876 | |
| X2 | 1.013 | |
| Freundlich | 1/n | 0.196 |
| nF | 5.102 | |
| KF (mg1–1/n L1/n g−1) | 12.94 | |
| R2 | 0.936 | |
| X2 | 0.001 | |
| Tempkin | AT | 136.38 |
| BT | 13.38 | |
| bT | 185.16 | |
| R2 | 0.895 | |
| X2 | 1205.66 | |
| Halsey | n | 5.1 |
| K | 475,898 | |
| R2 | 0.936 | |
| X2 | 0.002 | |
| Henderson | nh | 1 |
| Kh | 0.006 | |
| R2 | 0.78 | |
| X2 | 62.093 |
| Kinetic Models | Parameters | Values |
|---|---|---|
| The pseudo-first-order | qe (calc.) (mg g−1) | 63.09 |
| k1 (min−1) | 0.00414 | |
| R2 | 0.752 | |
| qe (exp.) (mg g−1) | 0.1316 | |
| The pseudo-second-order | qe (calc.) (mg g−1) | 0.12 |
| k2 (mg g−1 min−1) | 2.16 | |
| ho | 0.03 | |
| R2 | 0.978 | |
| qe (exp.) (mg g−1) | 0.1316 | |
| The intraparticle diffusion | Kdif (mg g−1 min−0.5) | 0.0583 |
| C (calc.) (mg g−1) | 0.01 | |
| R2 | 0.438 |
| Material | qe (mg g−1) | Refs. |
|---|---|---|
| Grapefruit peel | 254.16 | [22] |
| Lignin-rich Isolate from Elephant Grass | 24.99 | [102] |
| Pod-inspired MXene/porous carbon microspheres | 750.00 | [107] |
| Fe3O4 nanoparticles | 269.70 to 282.50 | [107] |
| Graphene oxide cross-linked hydrogel nanocomposites of xanthan gum | 371.29 | [108] |
| Soil-Ag nanoparticles | 1.92 | [109] |
| Cellulose-based biosorbent | 153.85 | [110] |
| Lemongrass leaf fibers incorporated with cellulose acetate | 36.10 | [111] |
| Unused solid waste of Rosewater extraction | 168.8 | [112] |
| Chitin | 420.10 | [113] |
| Zeolite from bottom ash | 17.60 | [114] |
| Natural zeolite | 106.67 | [115] |
| Magnetic Zeolite | 0.97 | [116] |
| Leaf biomass of Calotropis procera | 4.14 | [117] |
| Blue-green alga, Spirulina sp. | 101.87 | [118] |
| Marine diatom, Skeletonema costatum | 6.41 | Present study |
Publisher’s Note: MDPI stays neutral with regard to jurisdictional claims in published maps and institutional affiliations. |
© 2022 by the authors. Licensee MDPI, Basel, Switzerland. This article is an open access article distributed under the terms and conditions of the Creative Commons Attribution (CC BY) license (https://creativecommons.org/licenses/by/4.0/).
Share and Cite
Ashour, M.; Alprol, A.E.; Khedawy, M.; Abualnaja, K.M.; Mansour, A.T. Equilibrium and Kinetic Modeling of Crystal Violet Dye Adsorption by a Marine Diatom, Skeletonema costatum. Materials 2022, 15, 6375. https://doi.org/10.3390/ma15186375
Ashour M, Alprol AE, Khedawy M, Abualnaja KM, Mansour AT. Equilibrium and Kinetic Modeling of Crystal Violet Dye Adsorption by a Marine Diatom, Skeletonema costatum. Materials. 2022; 15(18):6375. https://doi.org/10.3390/ma15186375
Chicago/Turabian StyleAshour, Mohamed, Ahmed E. Alprol, Mohamed Khedawy, Khamael M. Abualnaja, and Abdallah Tageldein Mansour. 2022. "Equilibrium and Kinetic Modeling of Crystal Violet Dye Adsorption by a Marine Diatom, Skeletonema costatum" Materials 15, no. 18: 6375. https://doi.org/10.3390/ma15186375
APA StyleAshour, M., Alprol, A. E., Khedawy, M., Abualnaja, K. M., & Mansour, A. T. (2022). Equilibrium and Kinetic Modeling of Crystal Violet Dye Adsorption by a Marine Diatom, Skeletonema costatum. Materials, 15(18), 6375. https://doi.org/10.3390/ma15186375