
Strength Properties of 316L and 17-4 PH Stainless Steel Produced with Additive Manufacturing

 , , ,
, , ,
Abstract
:1. Introduction
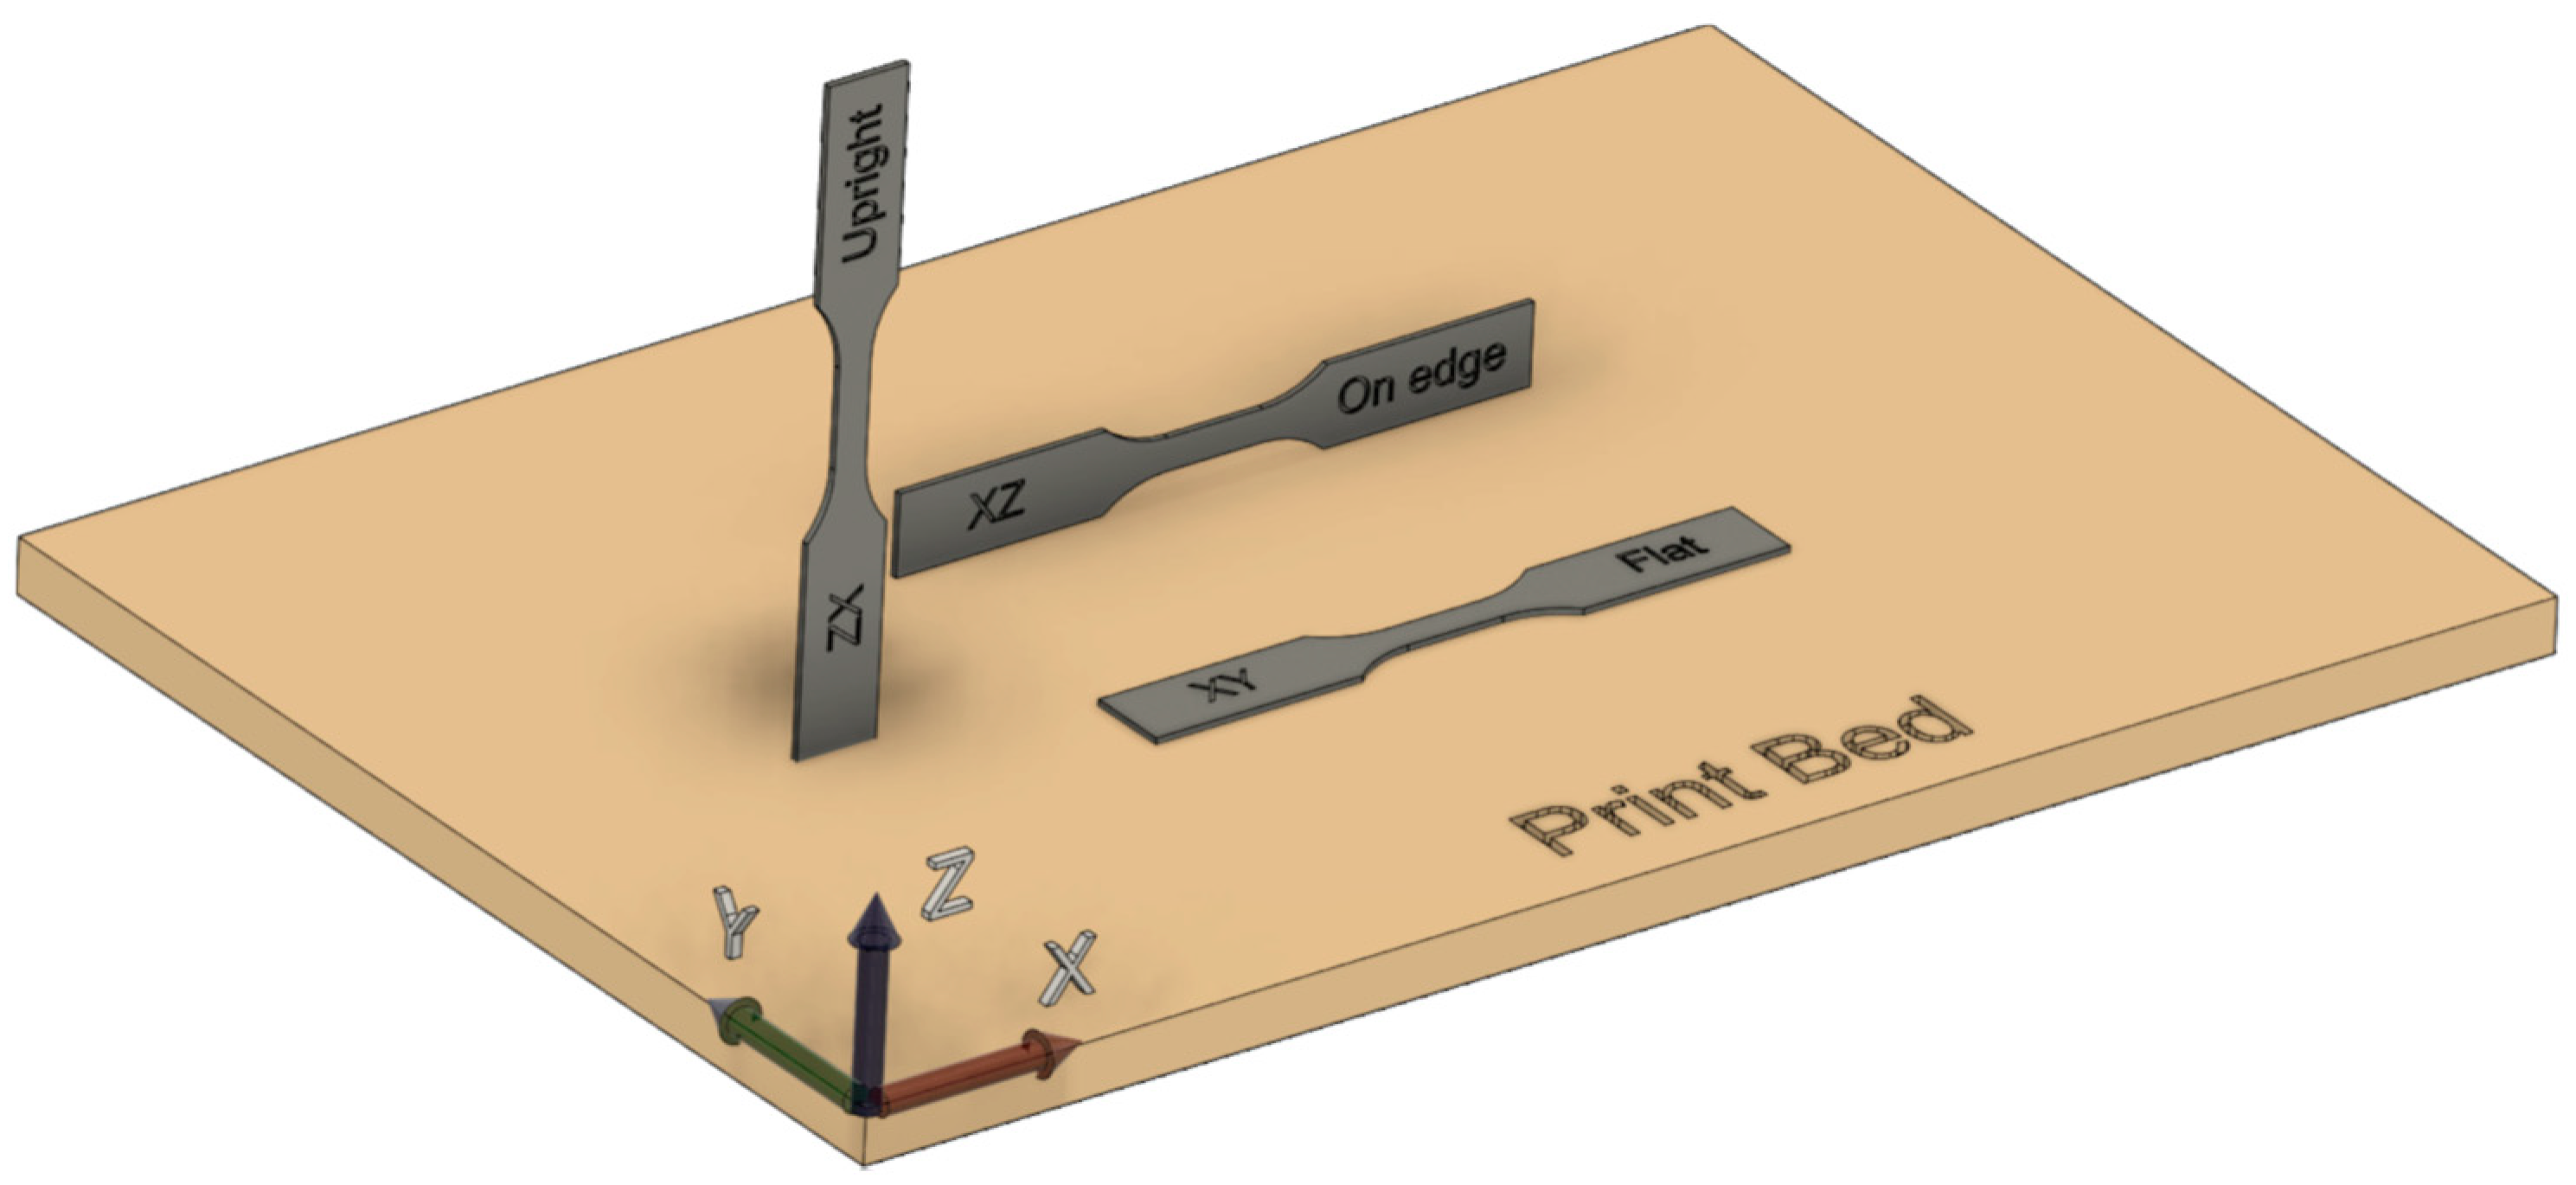
2. Materials and Methods
3. Results
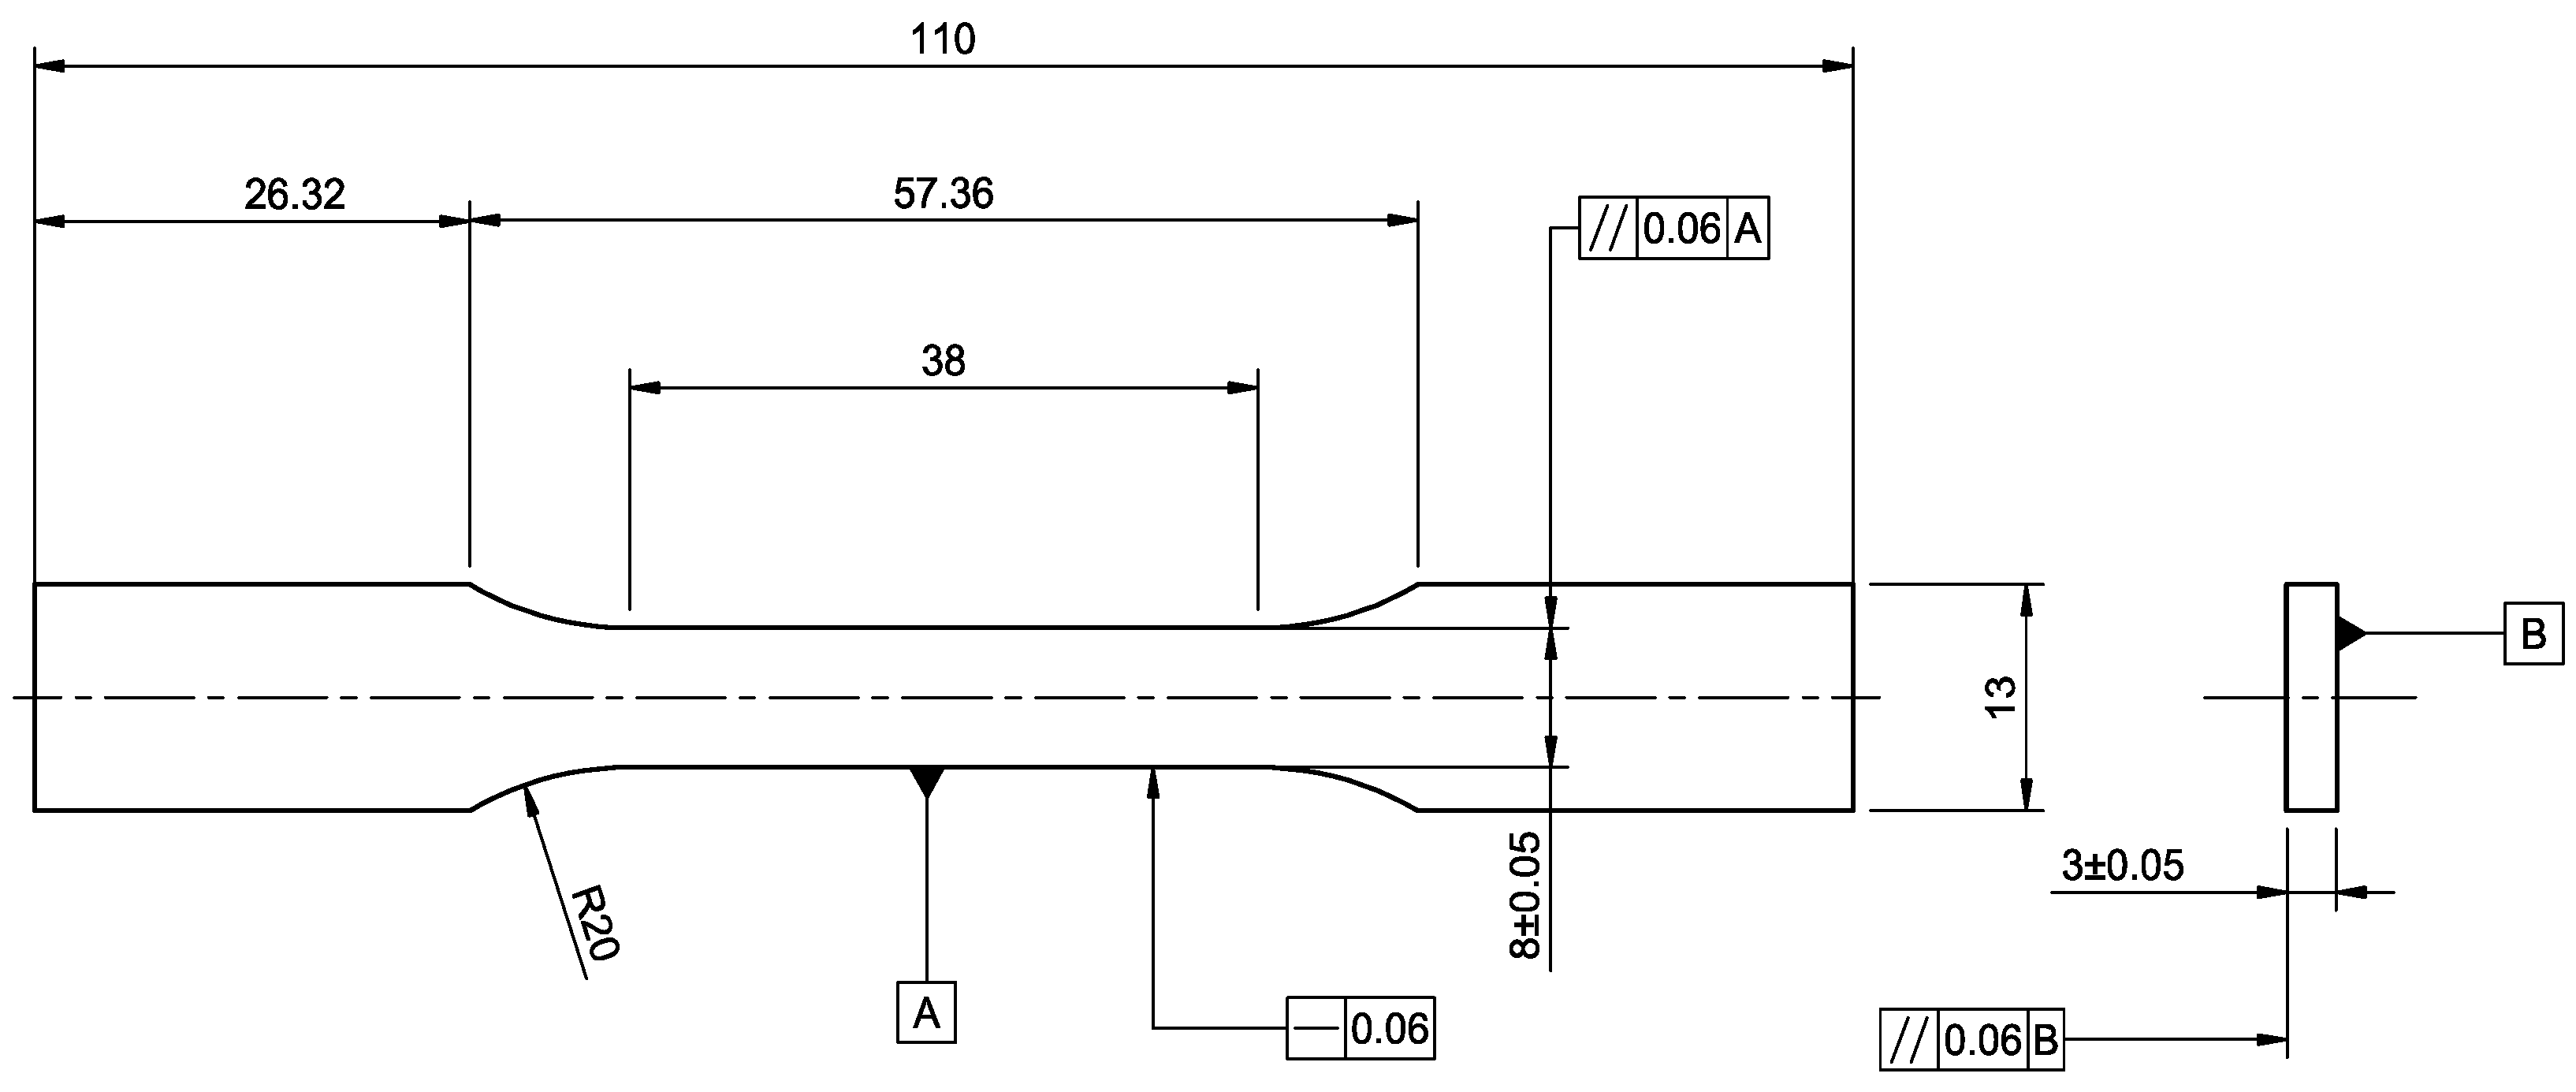
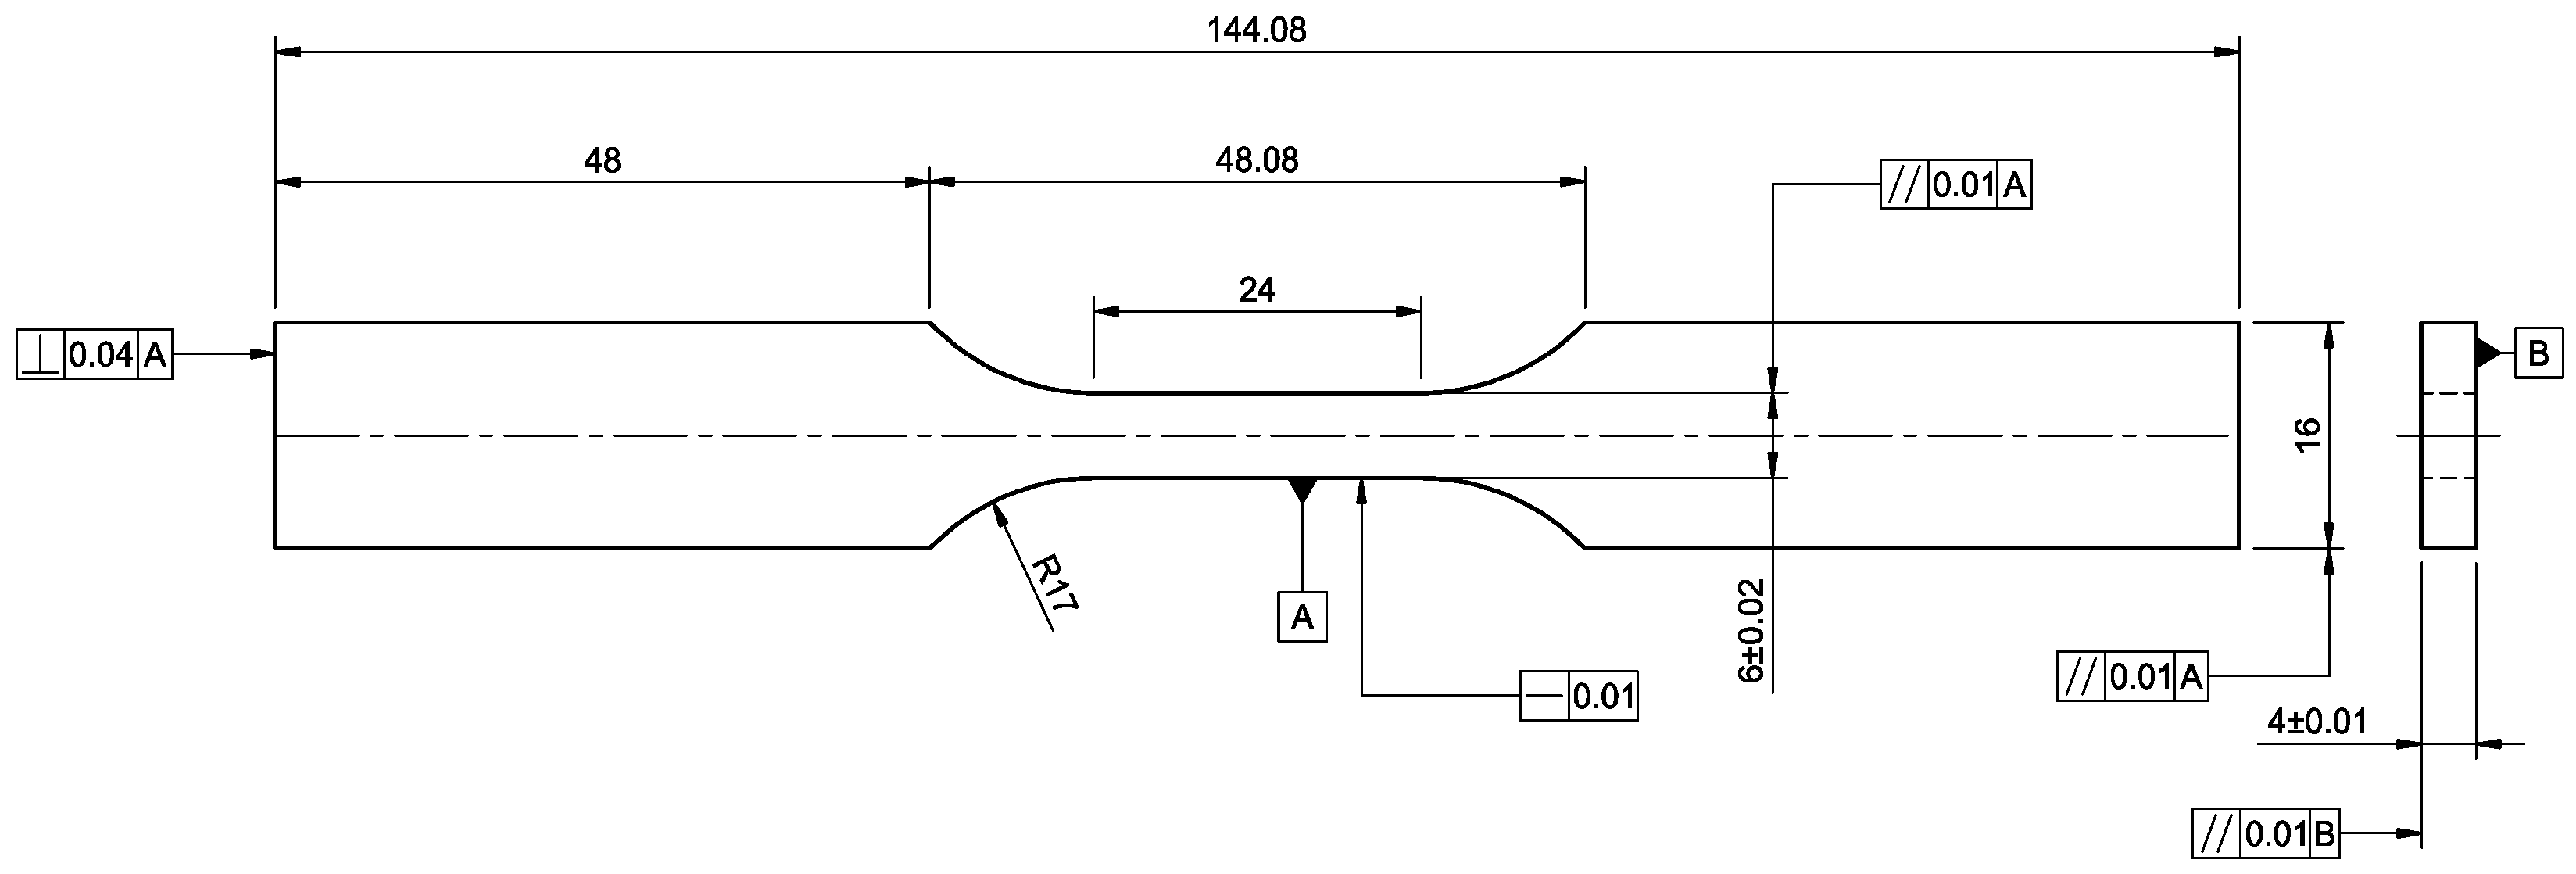
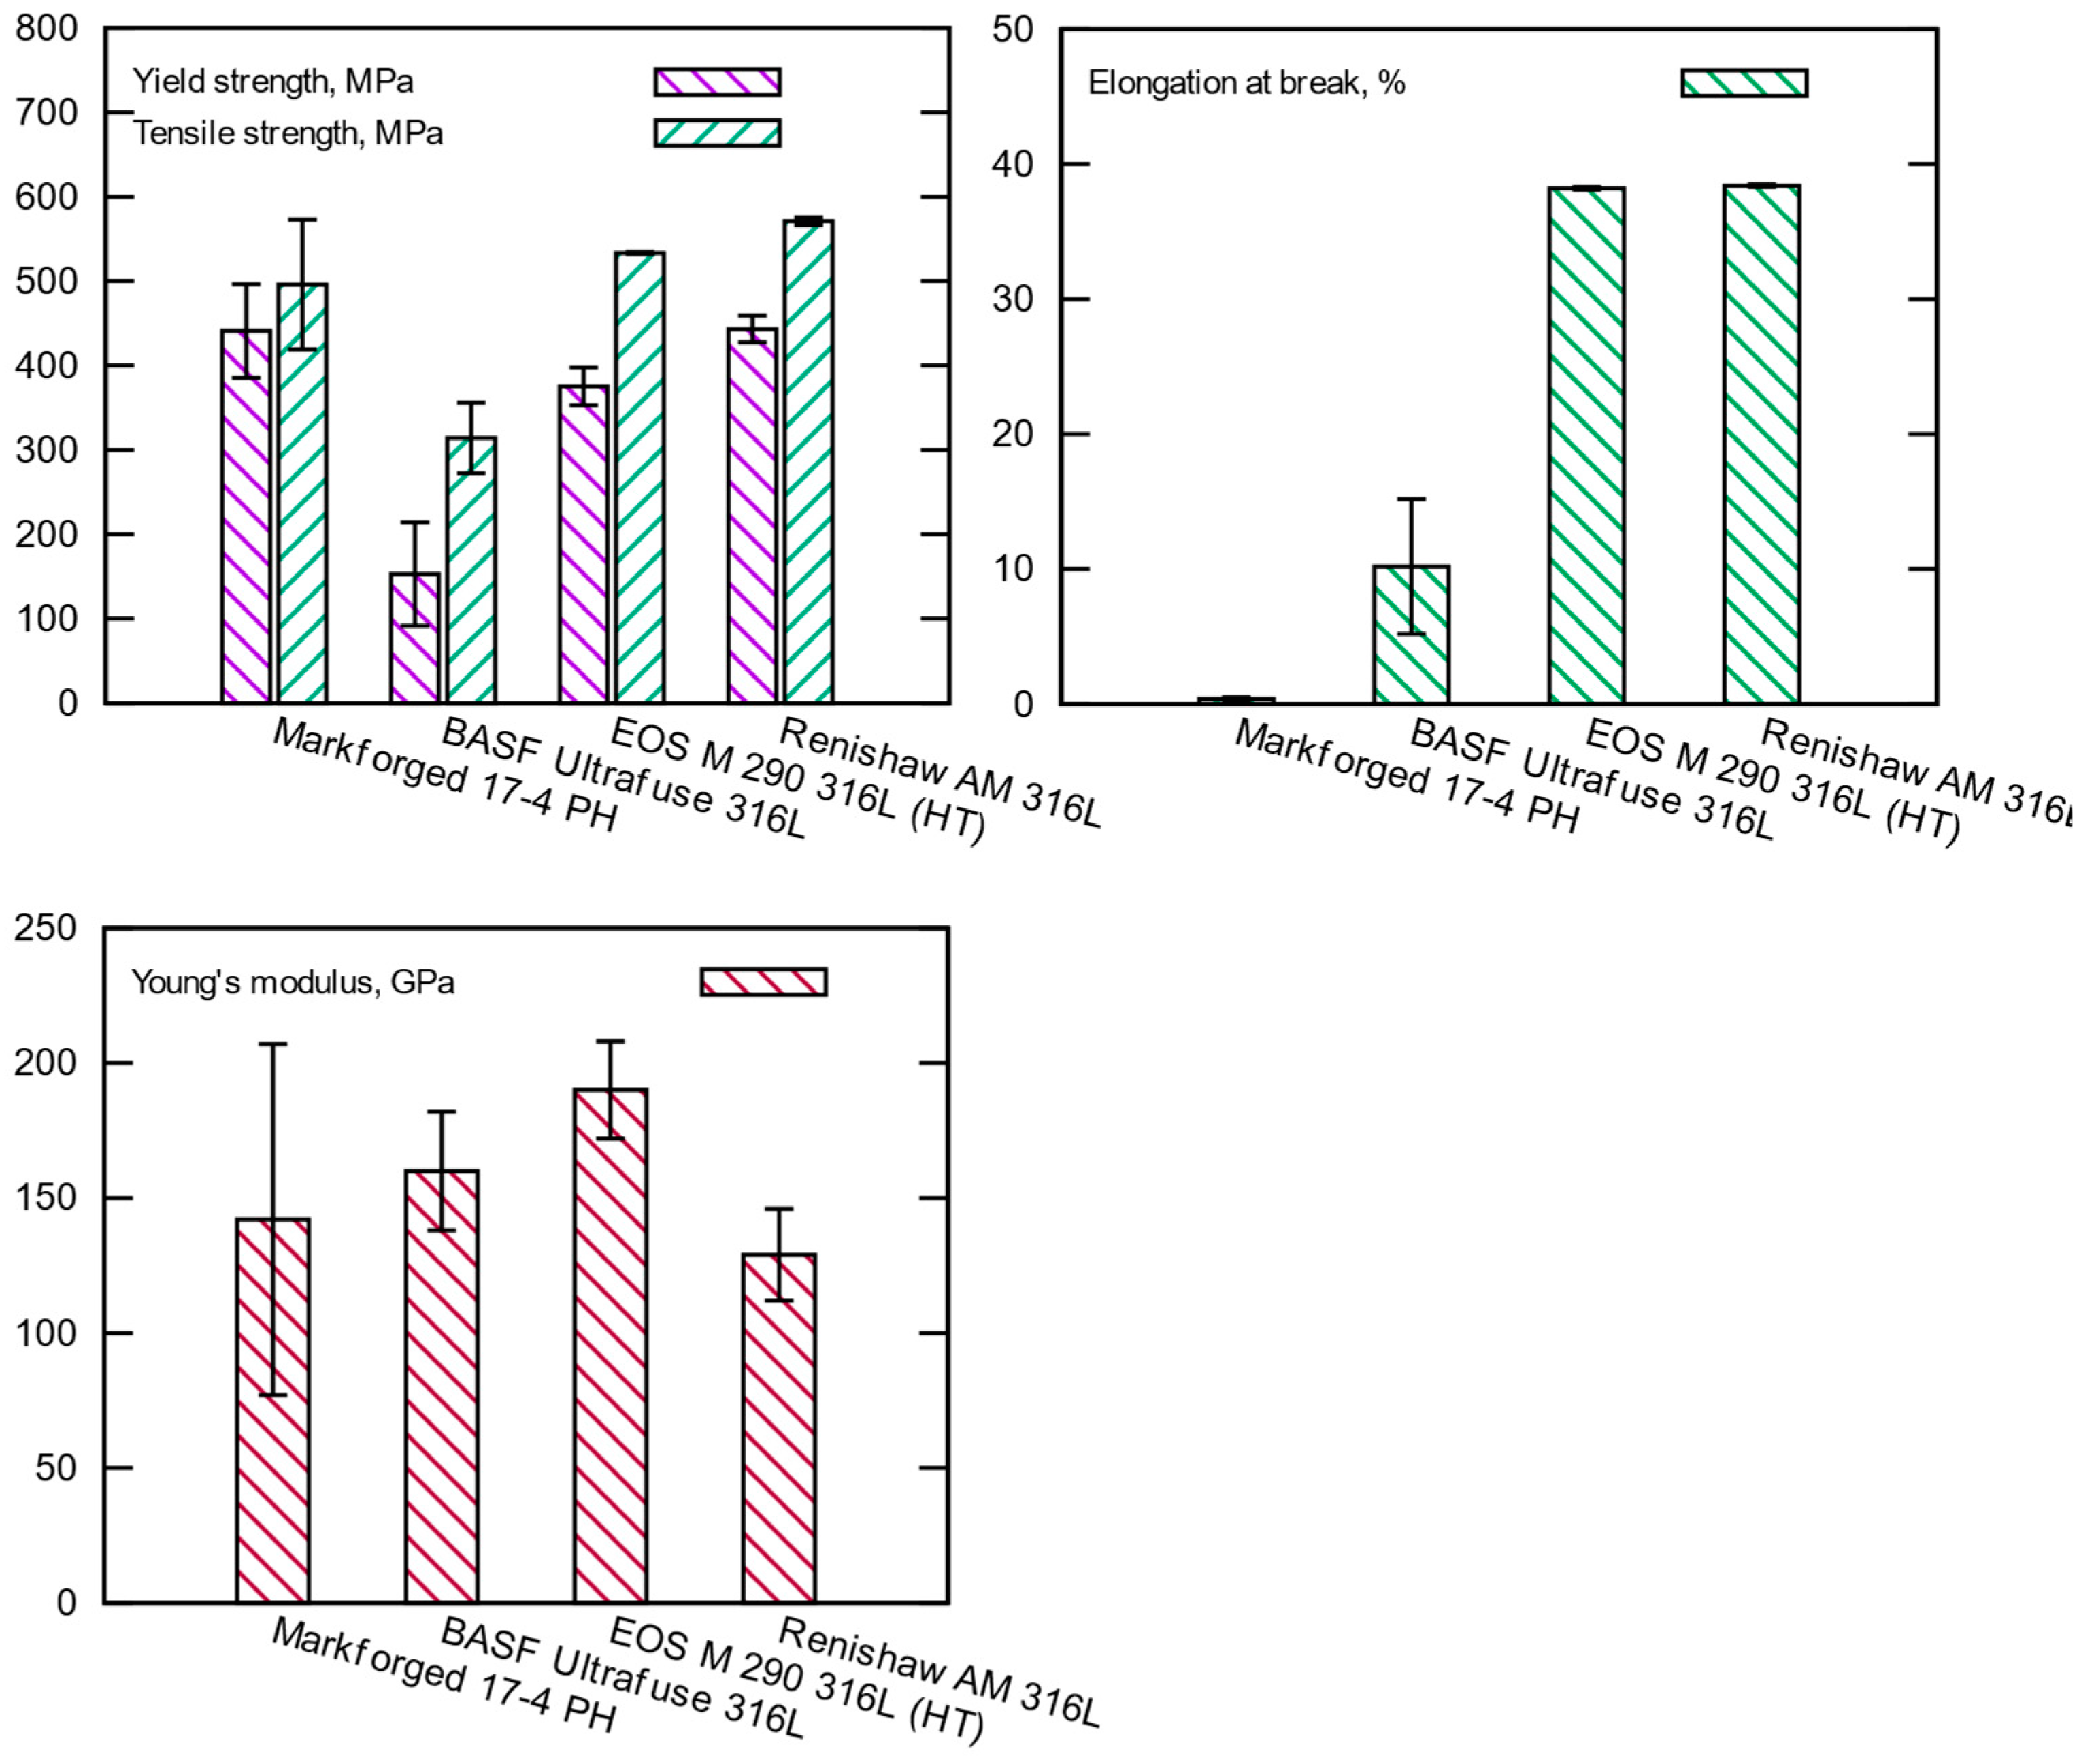
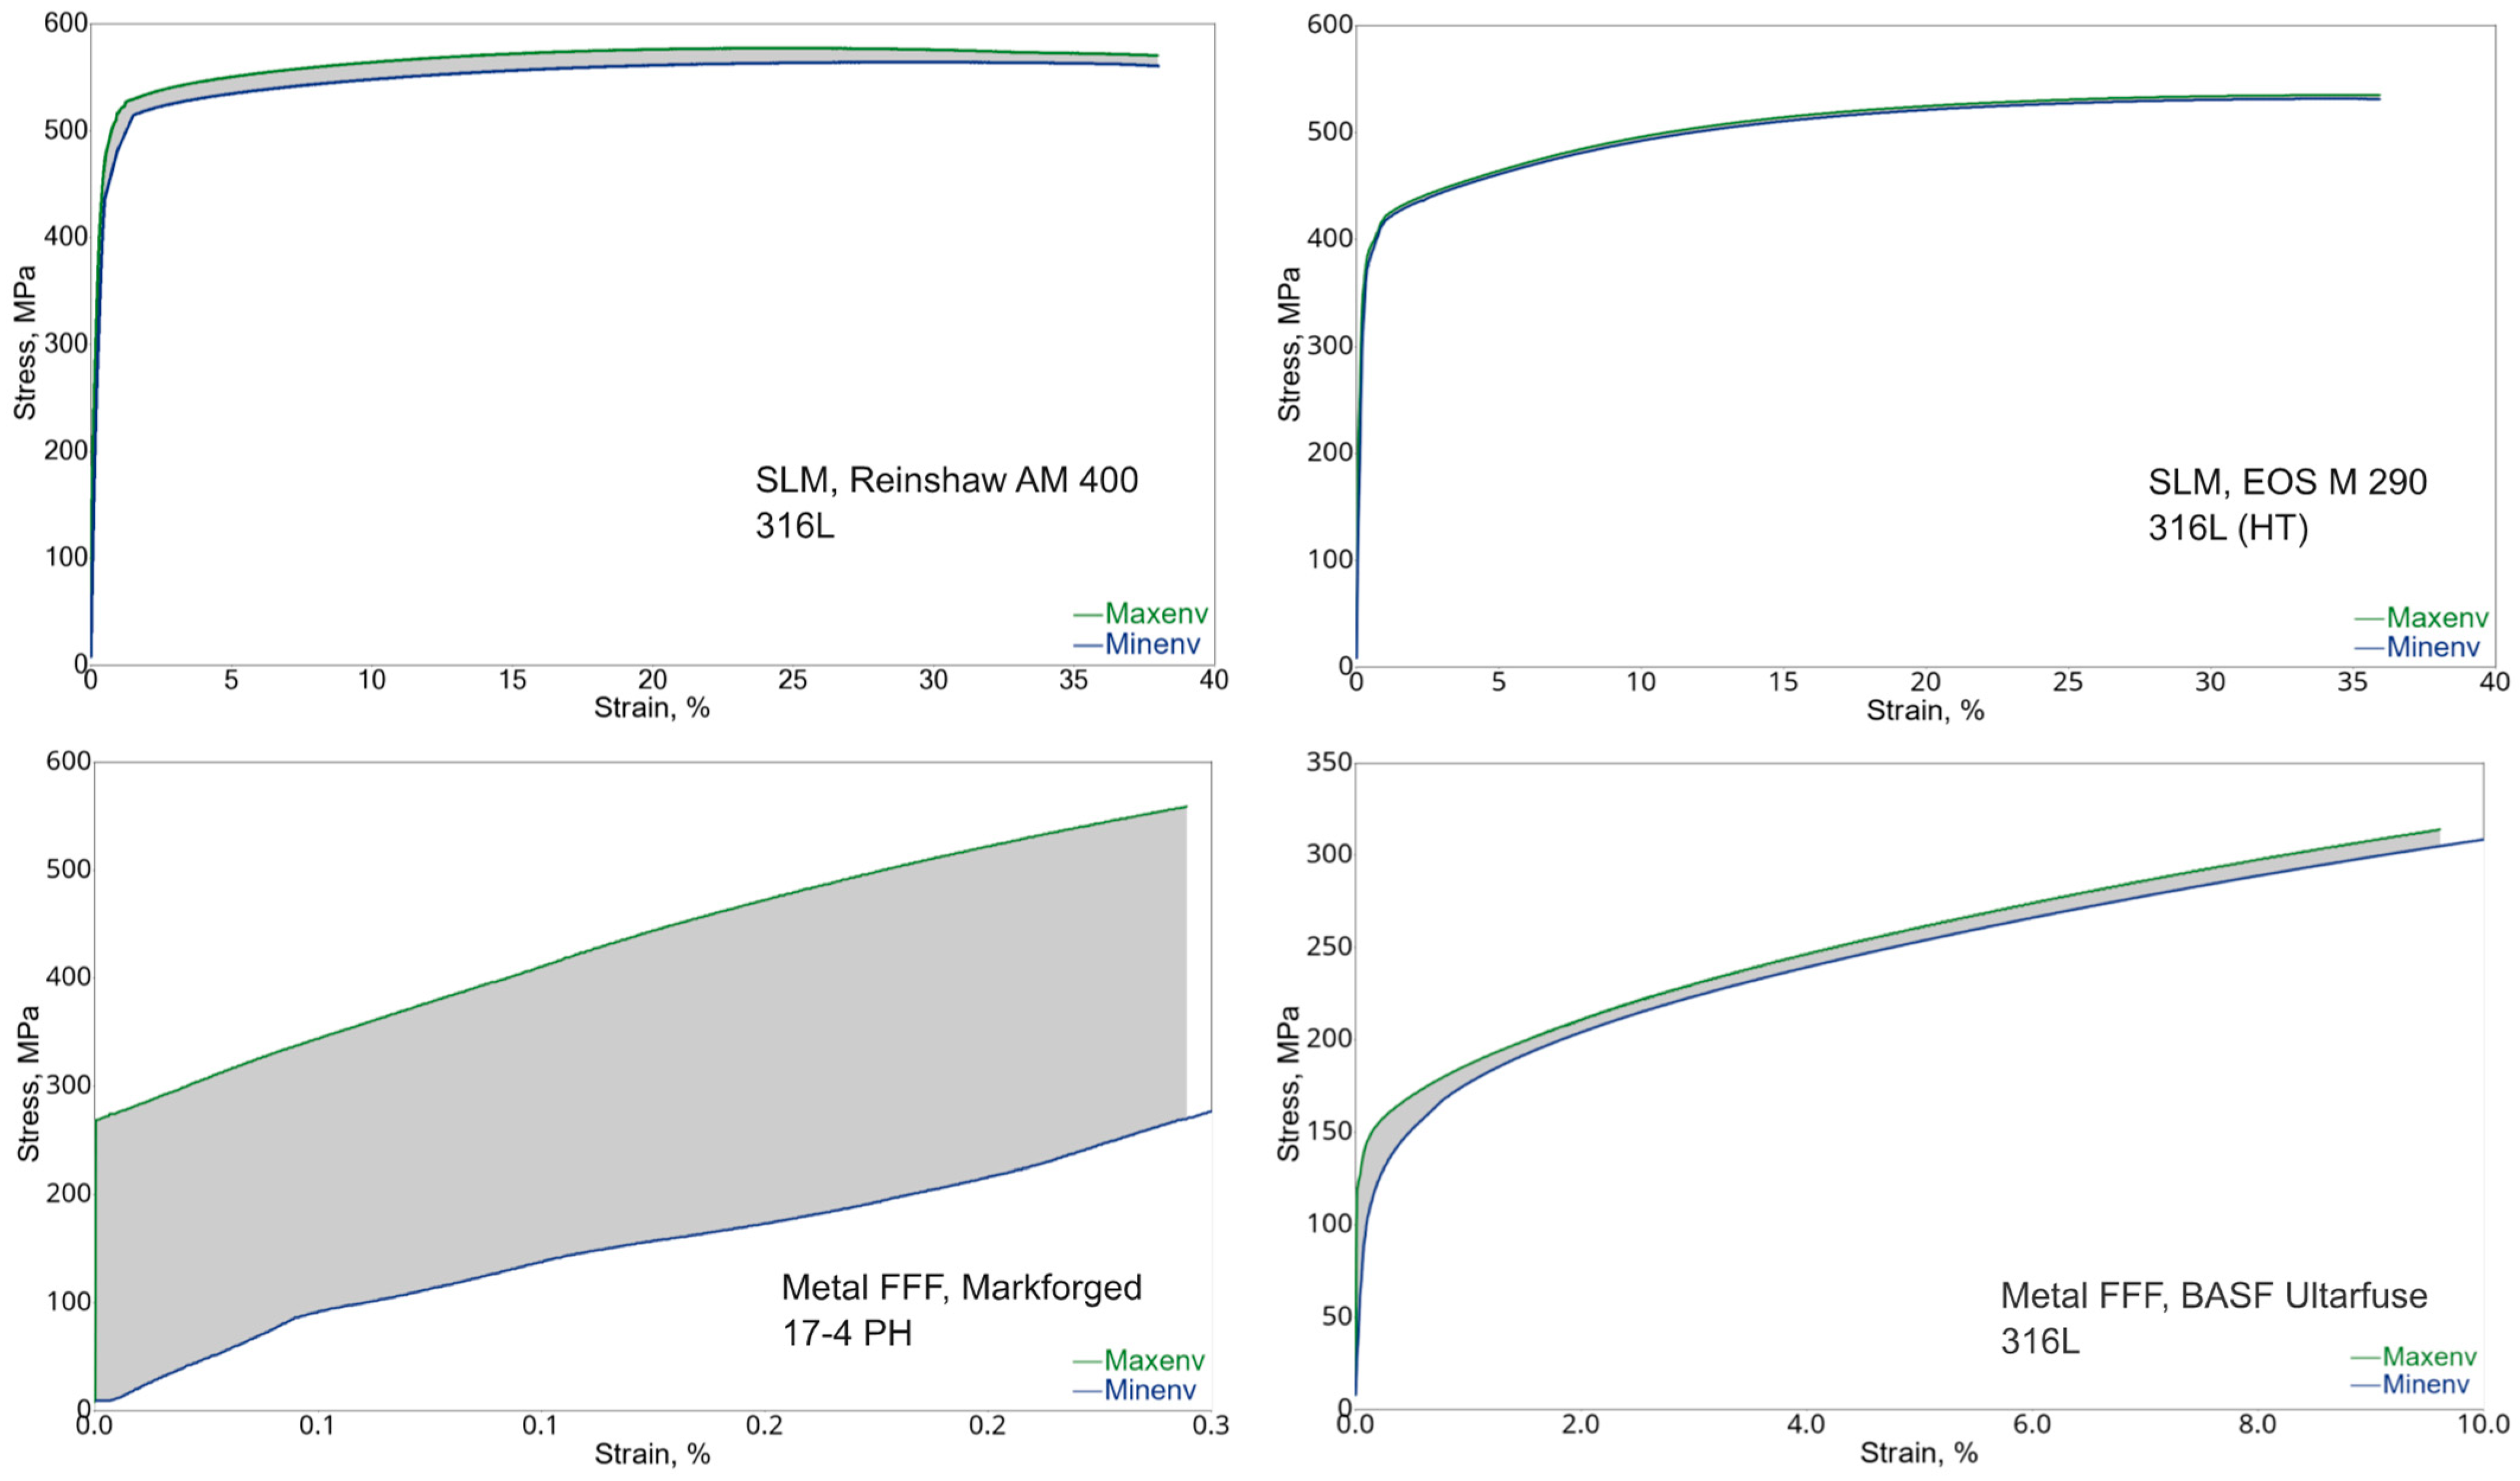
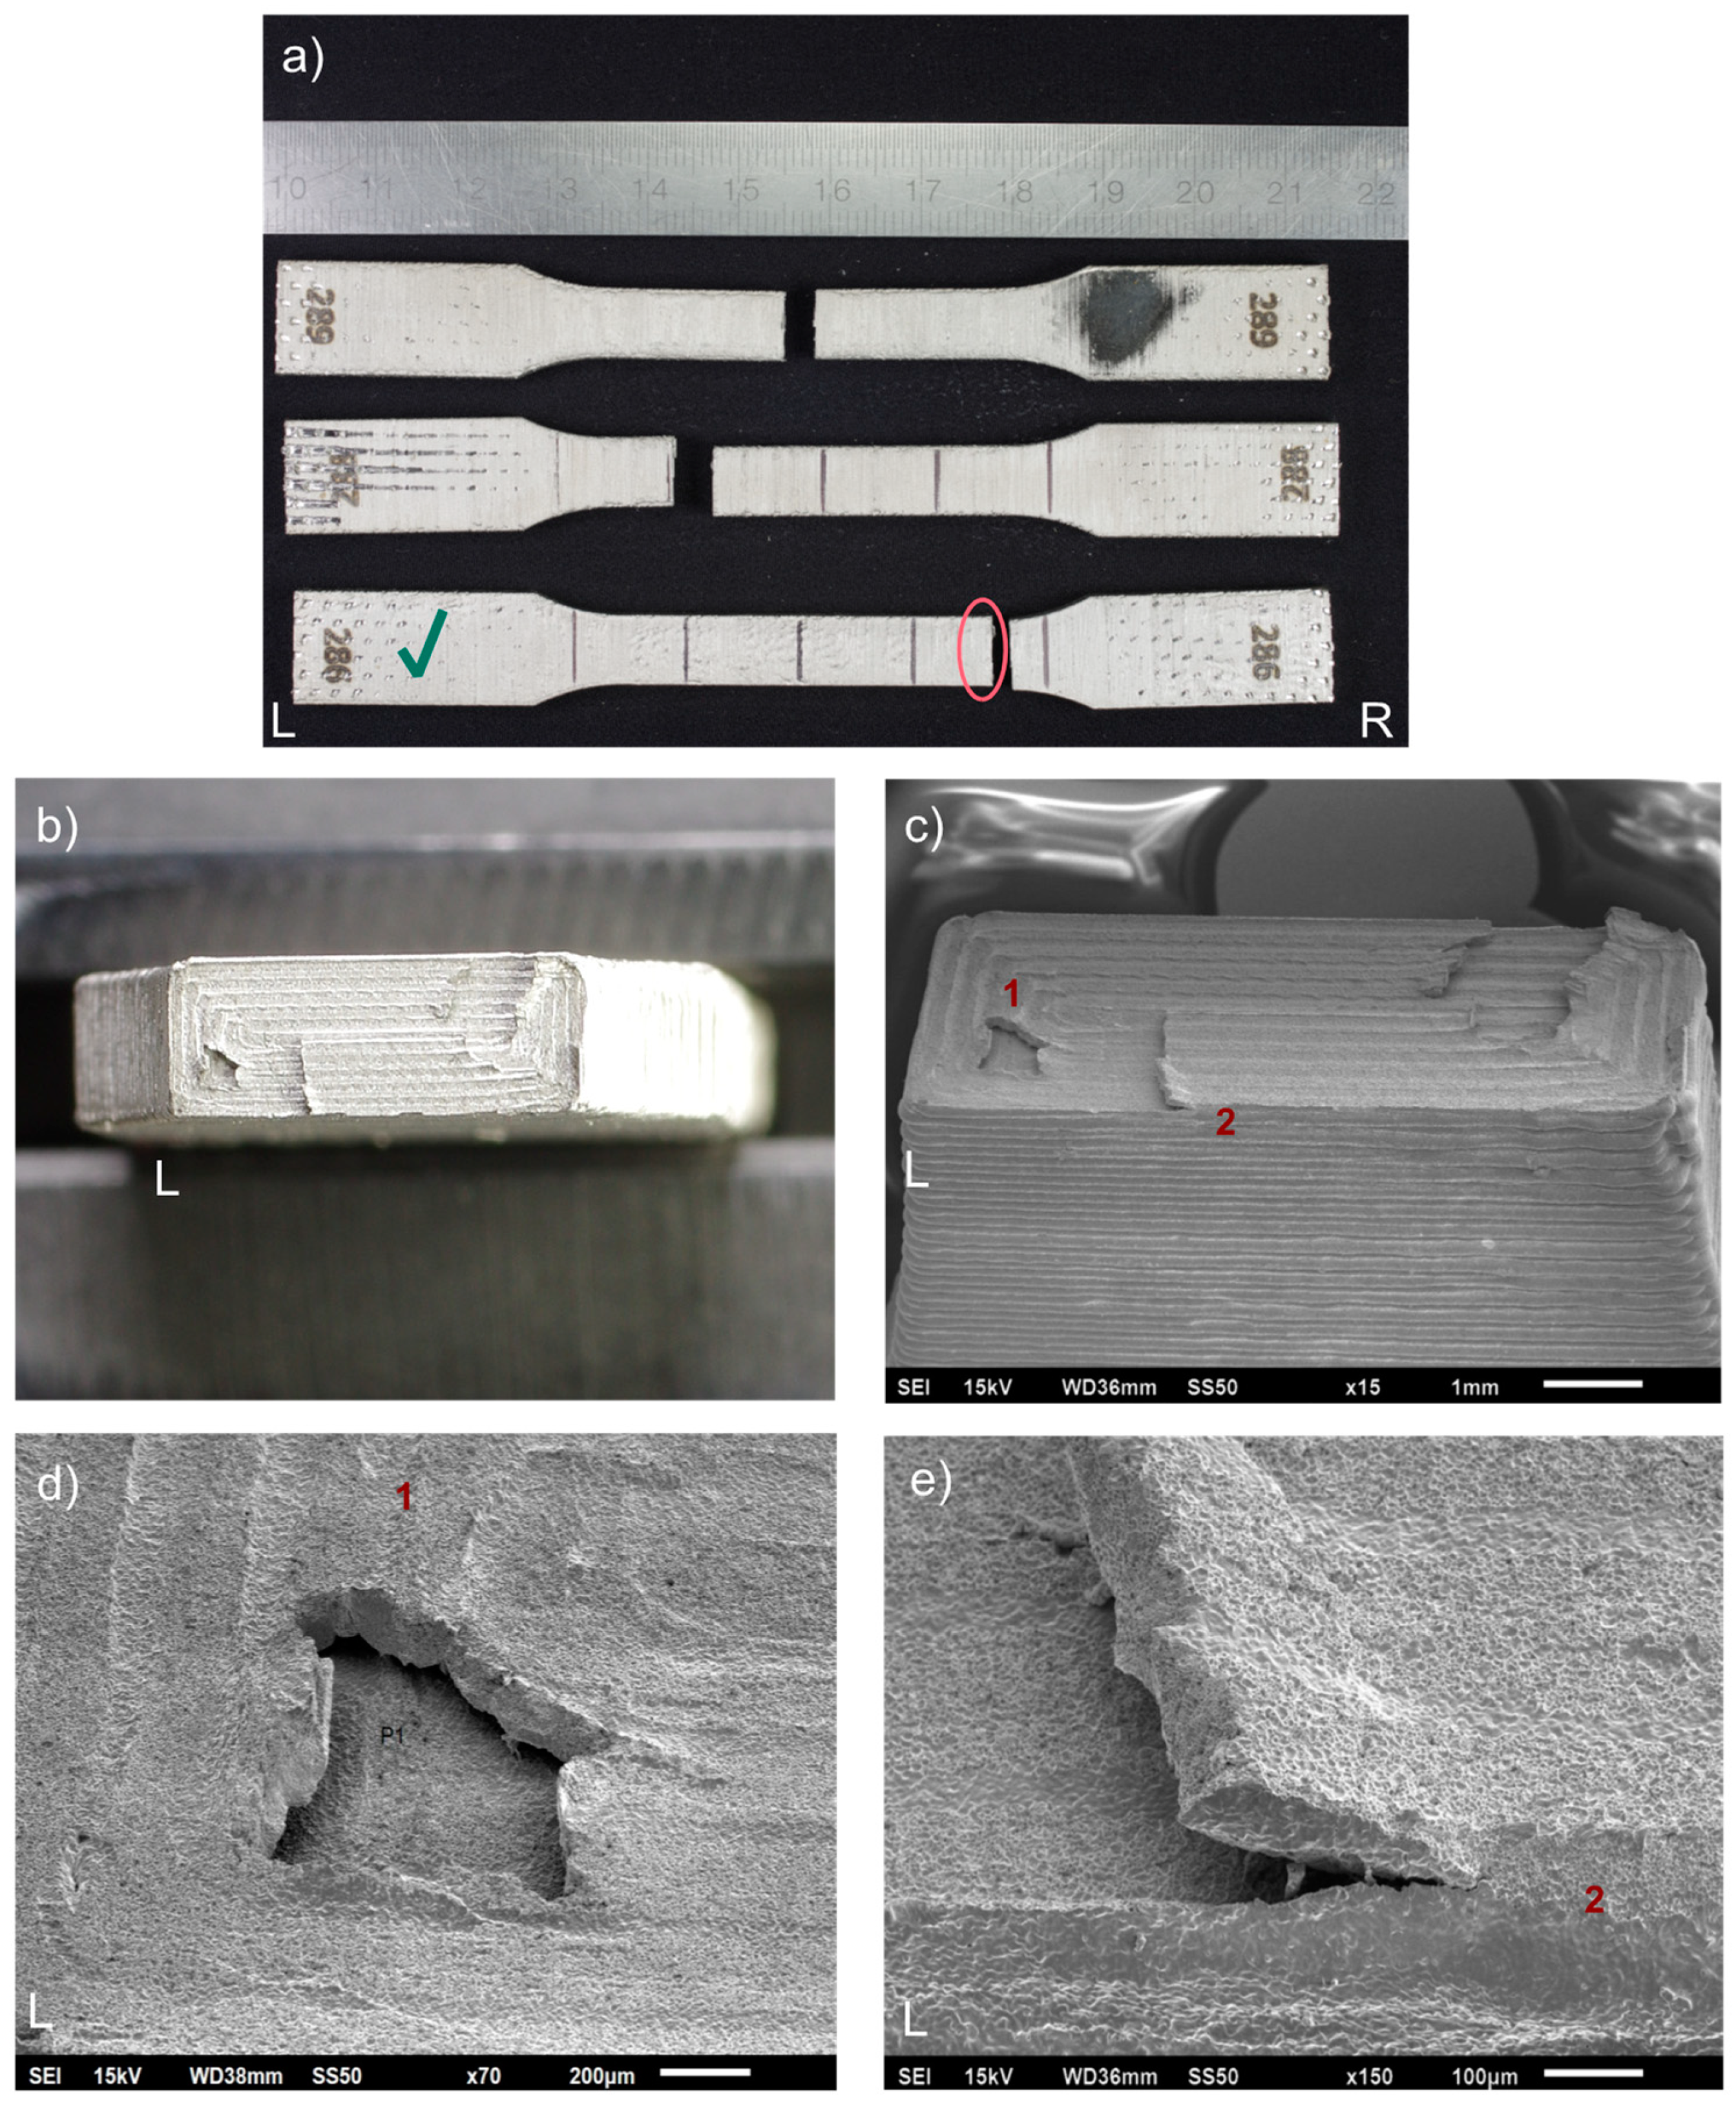
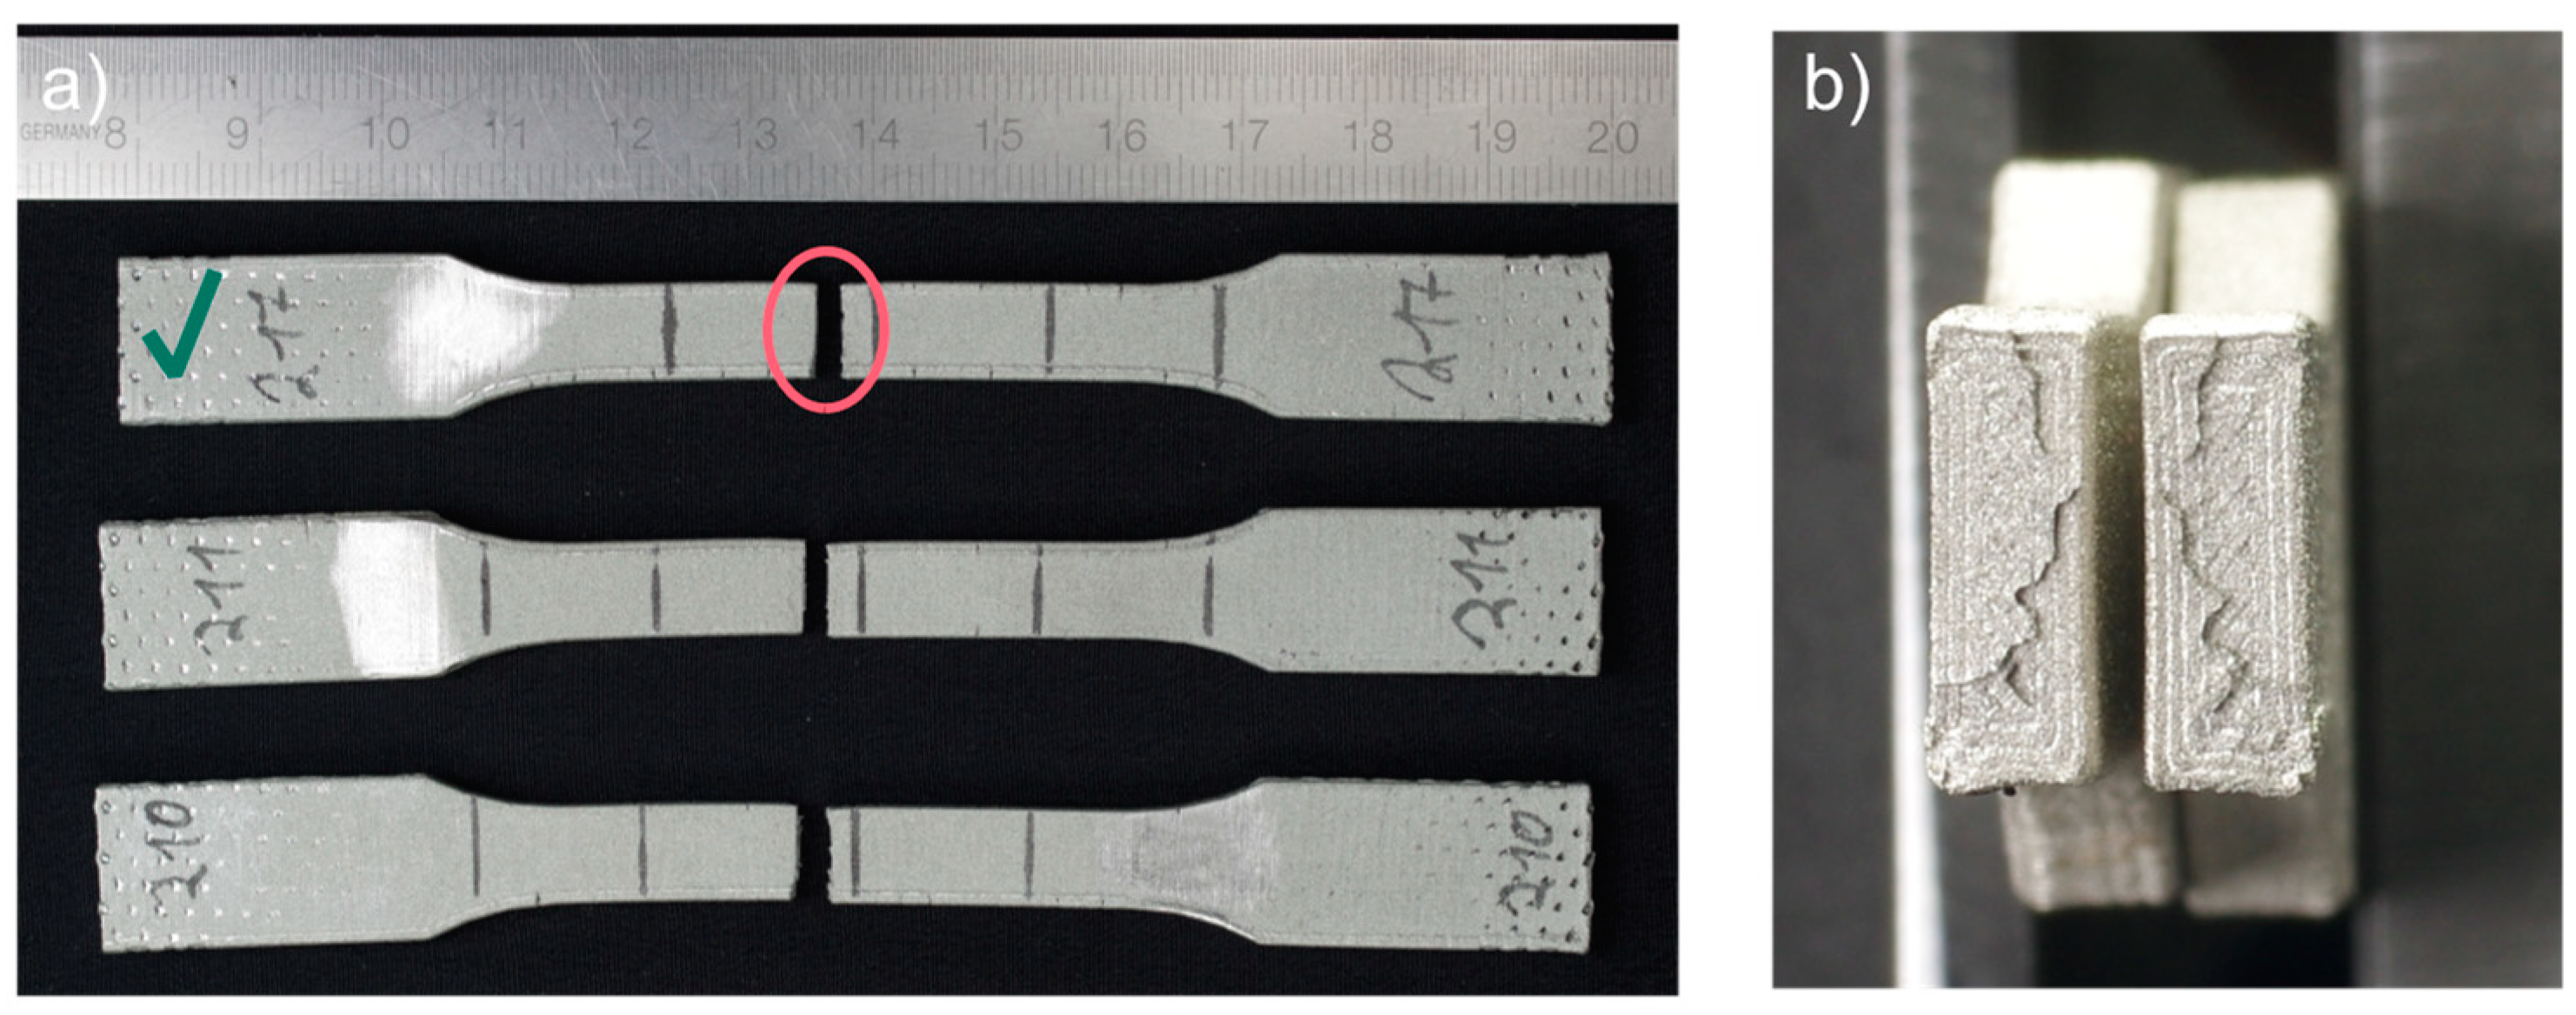
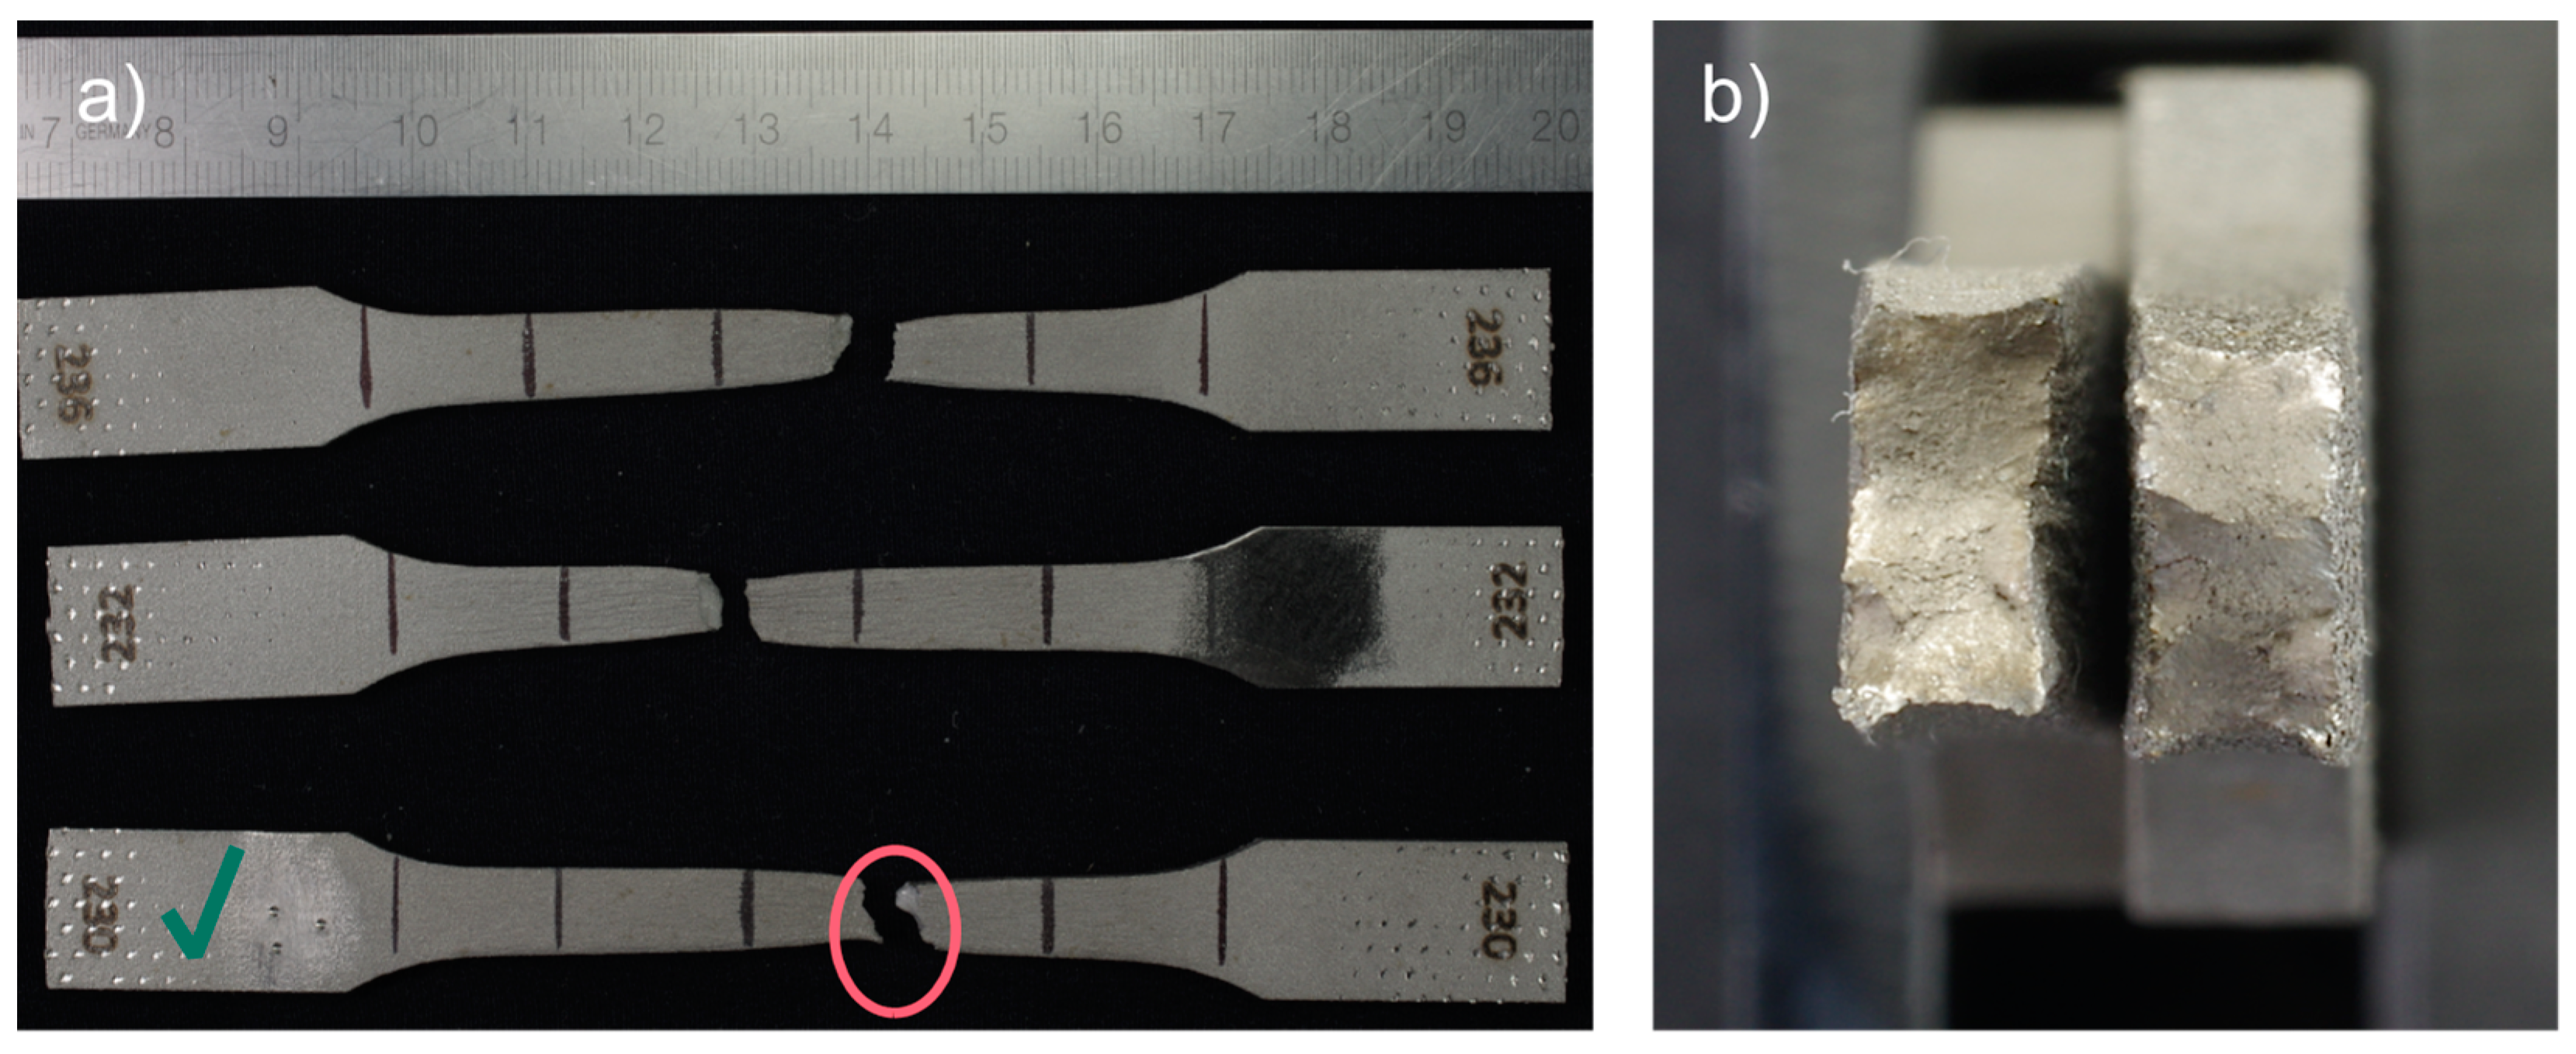
3.1. Tensile Tests
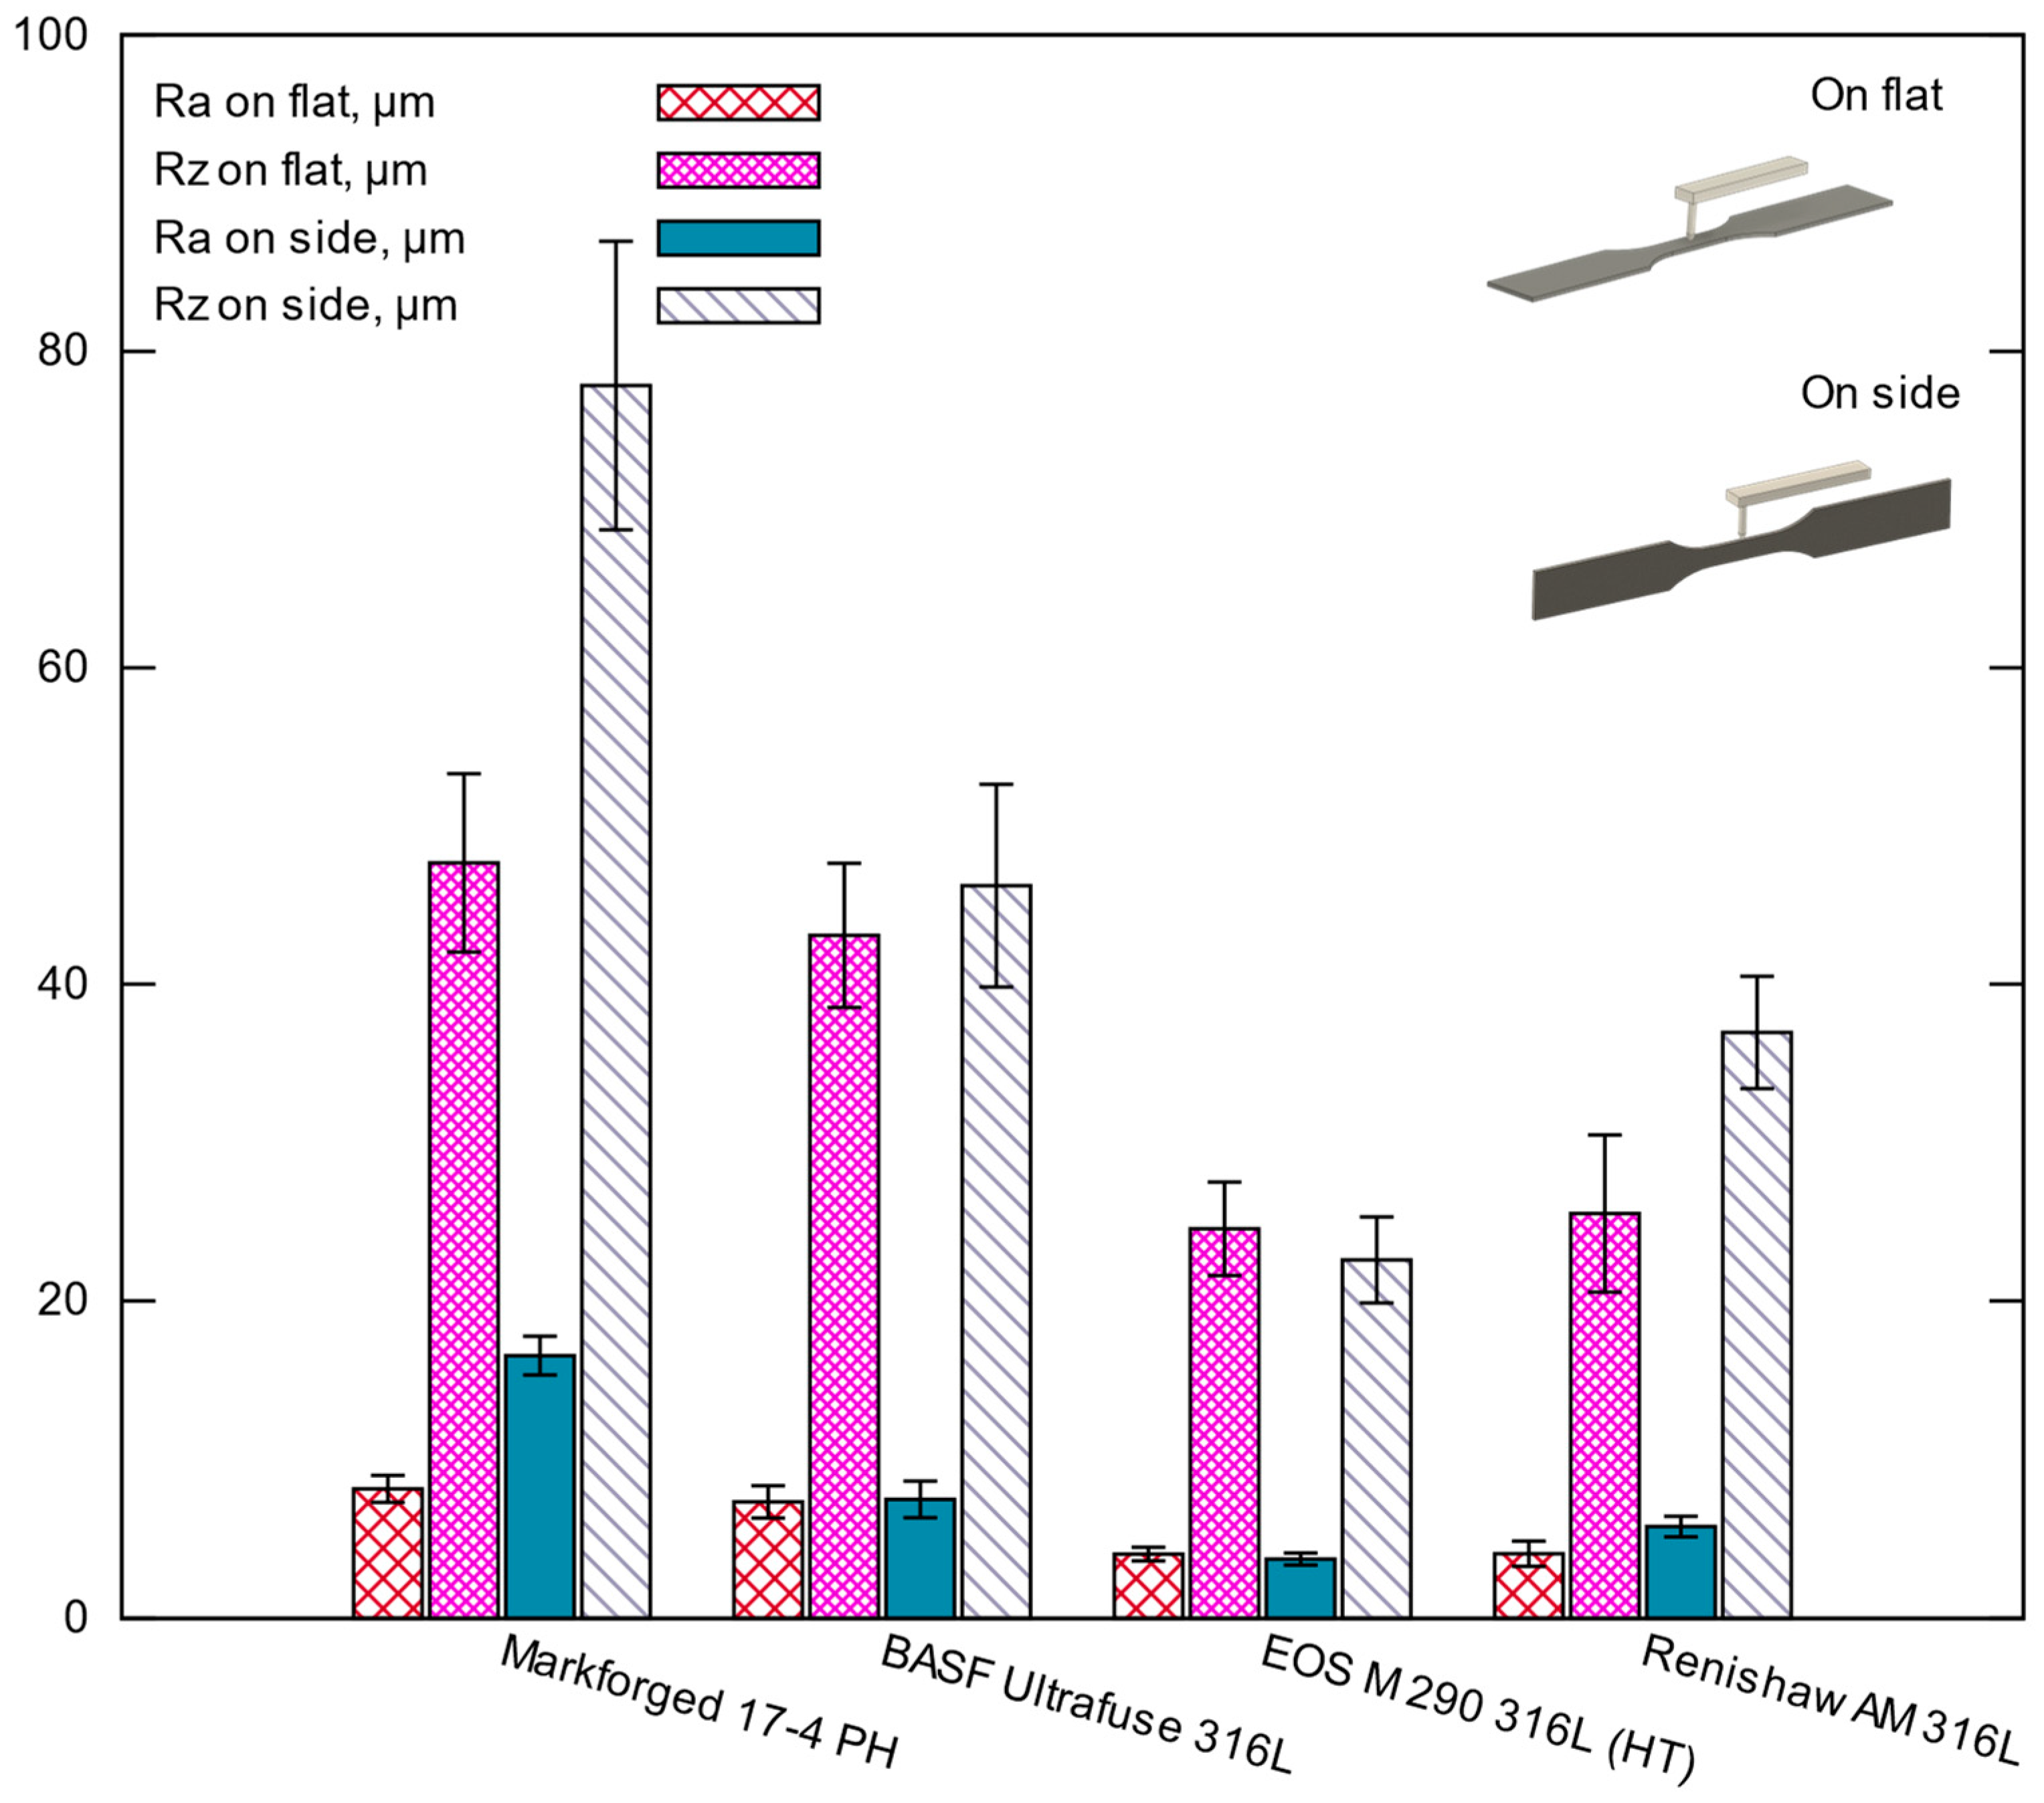
3.2. Roughness and Hardness Tests
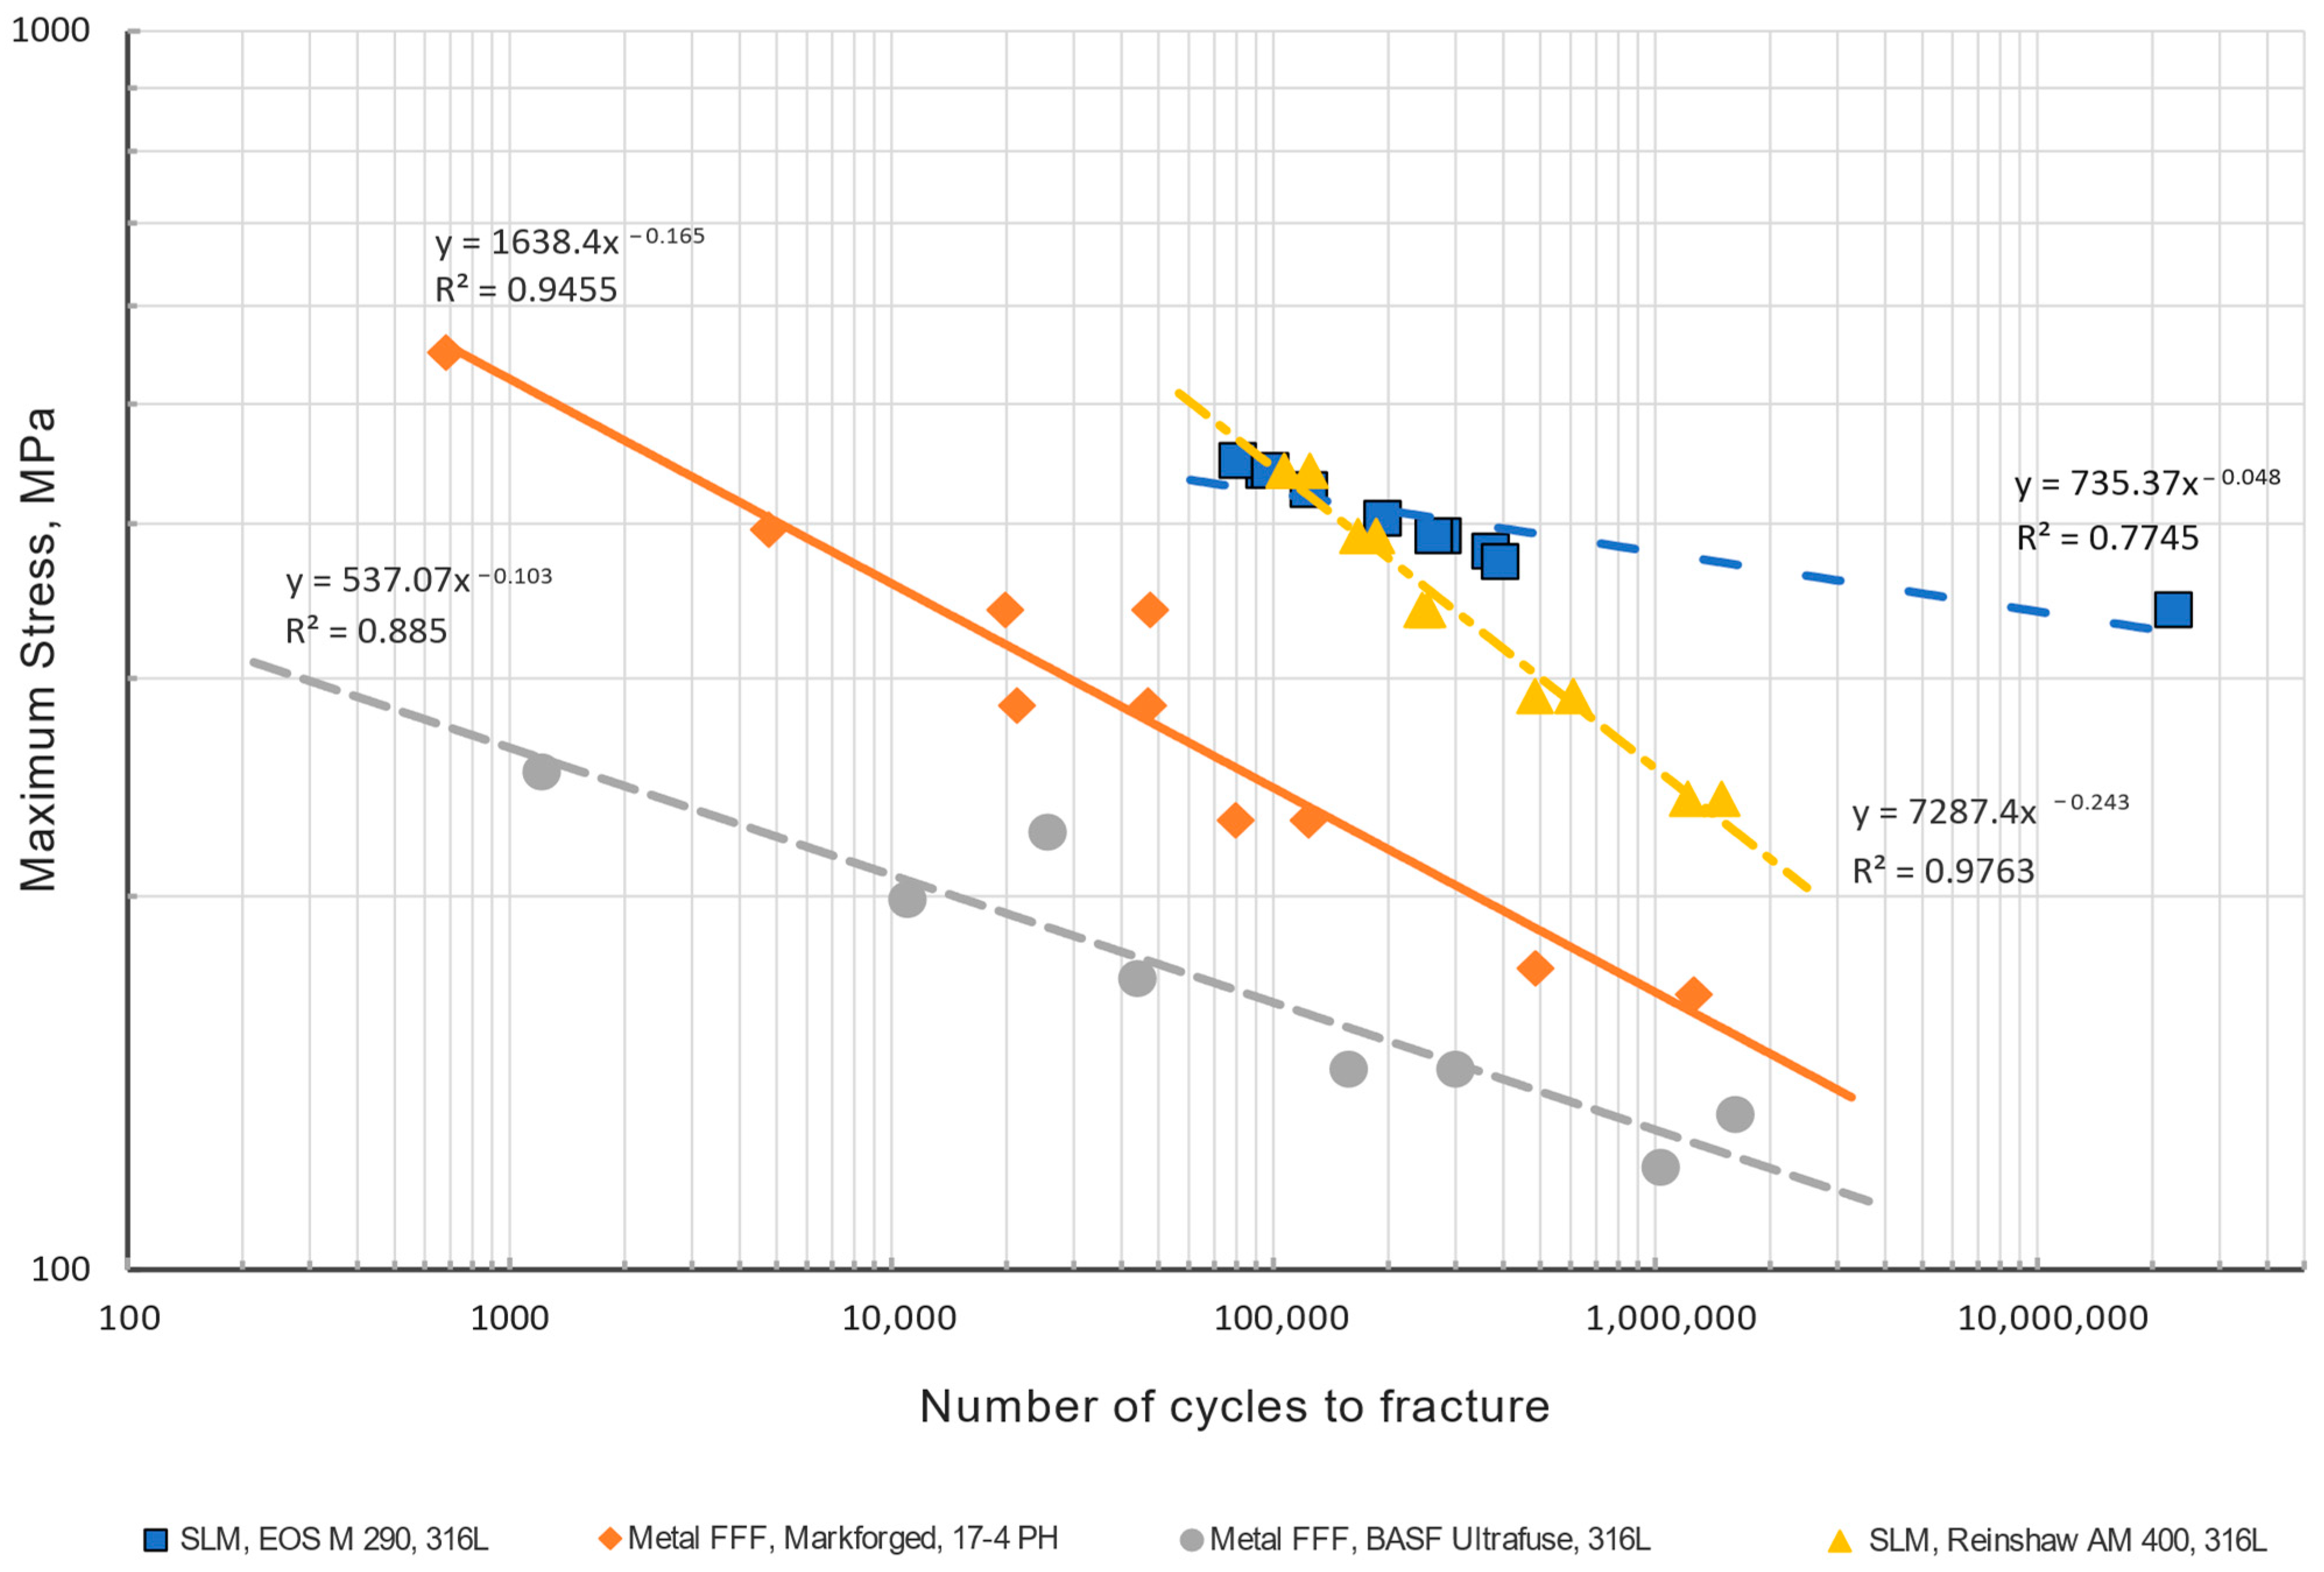
3.3. Fatigue Tests
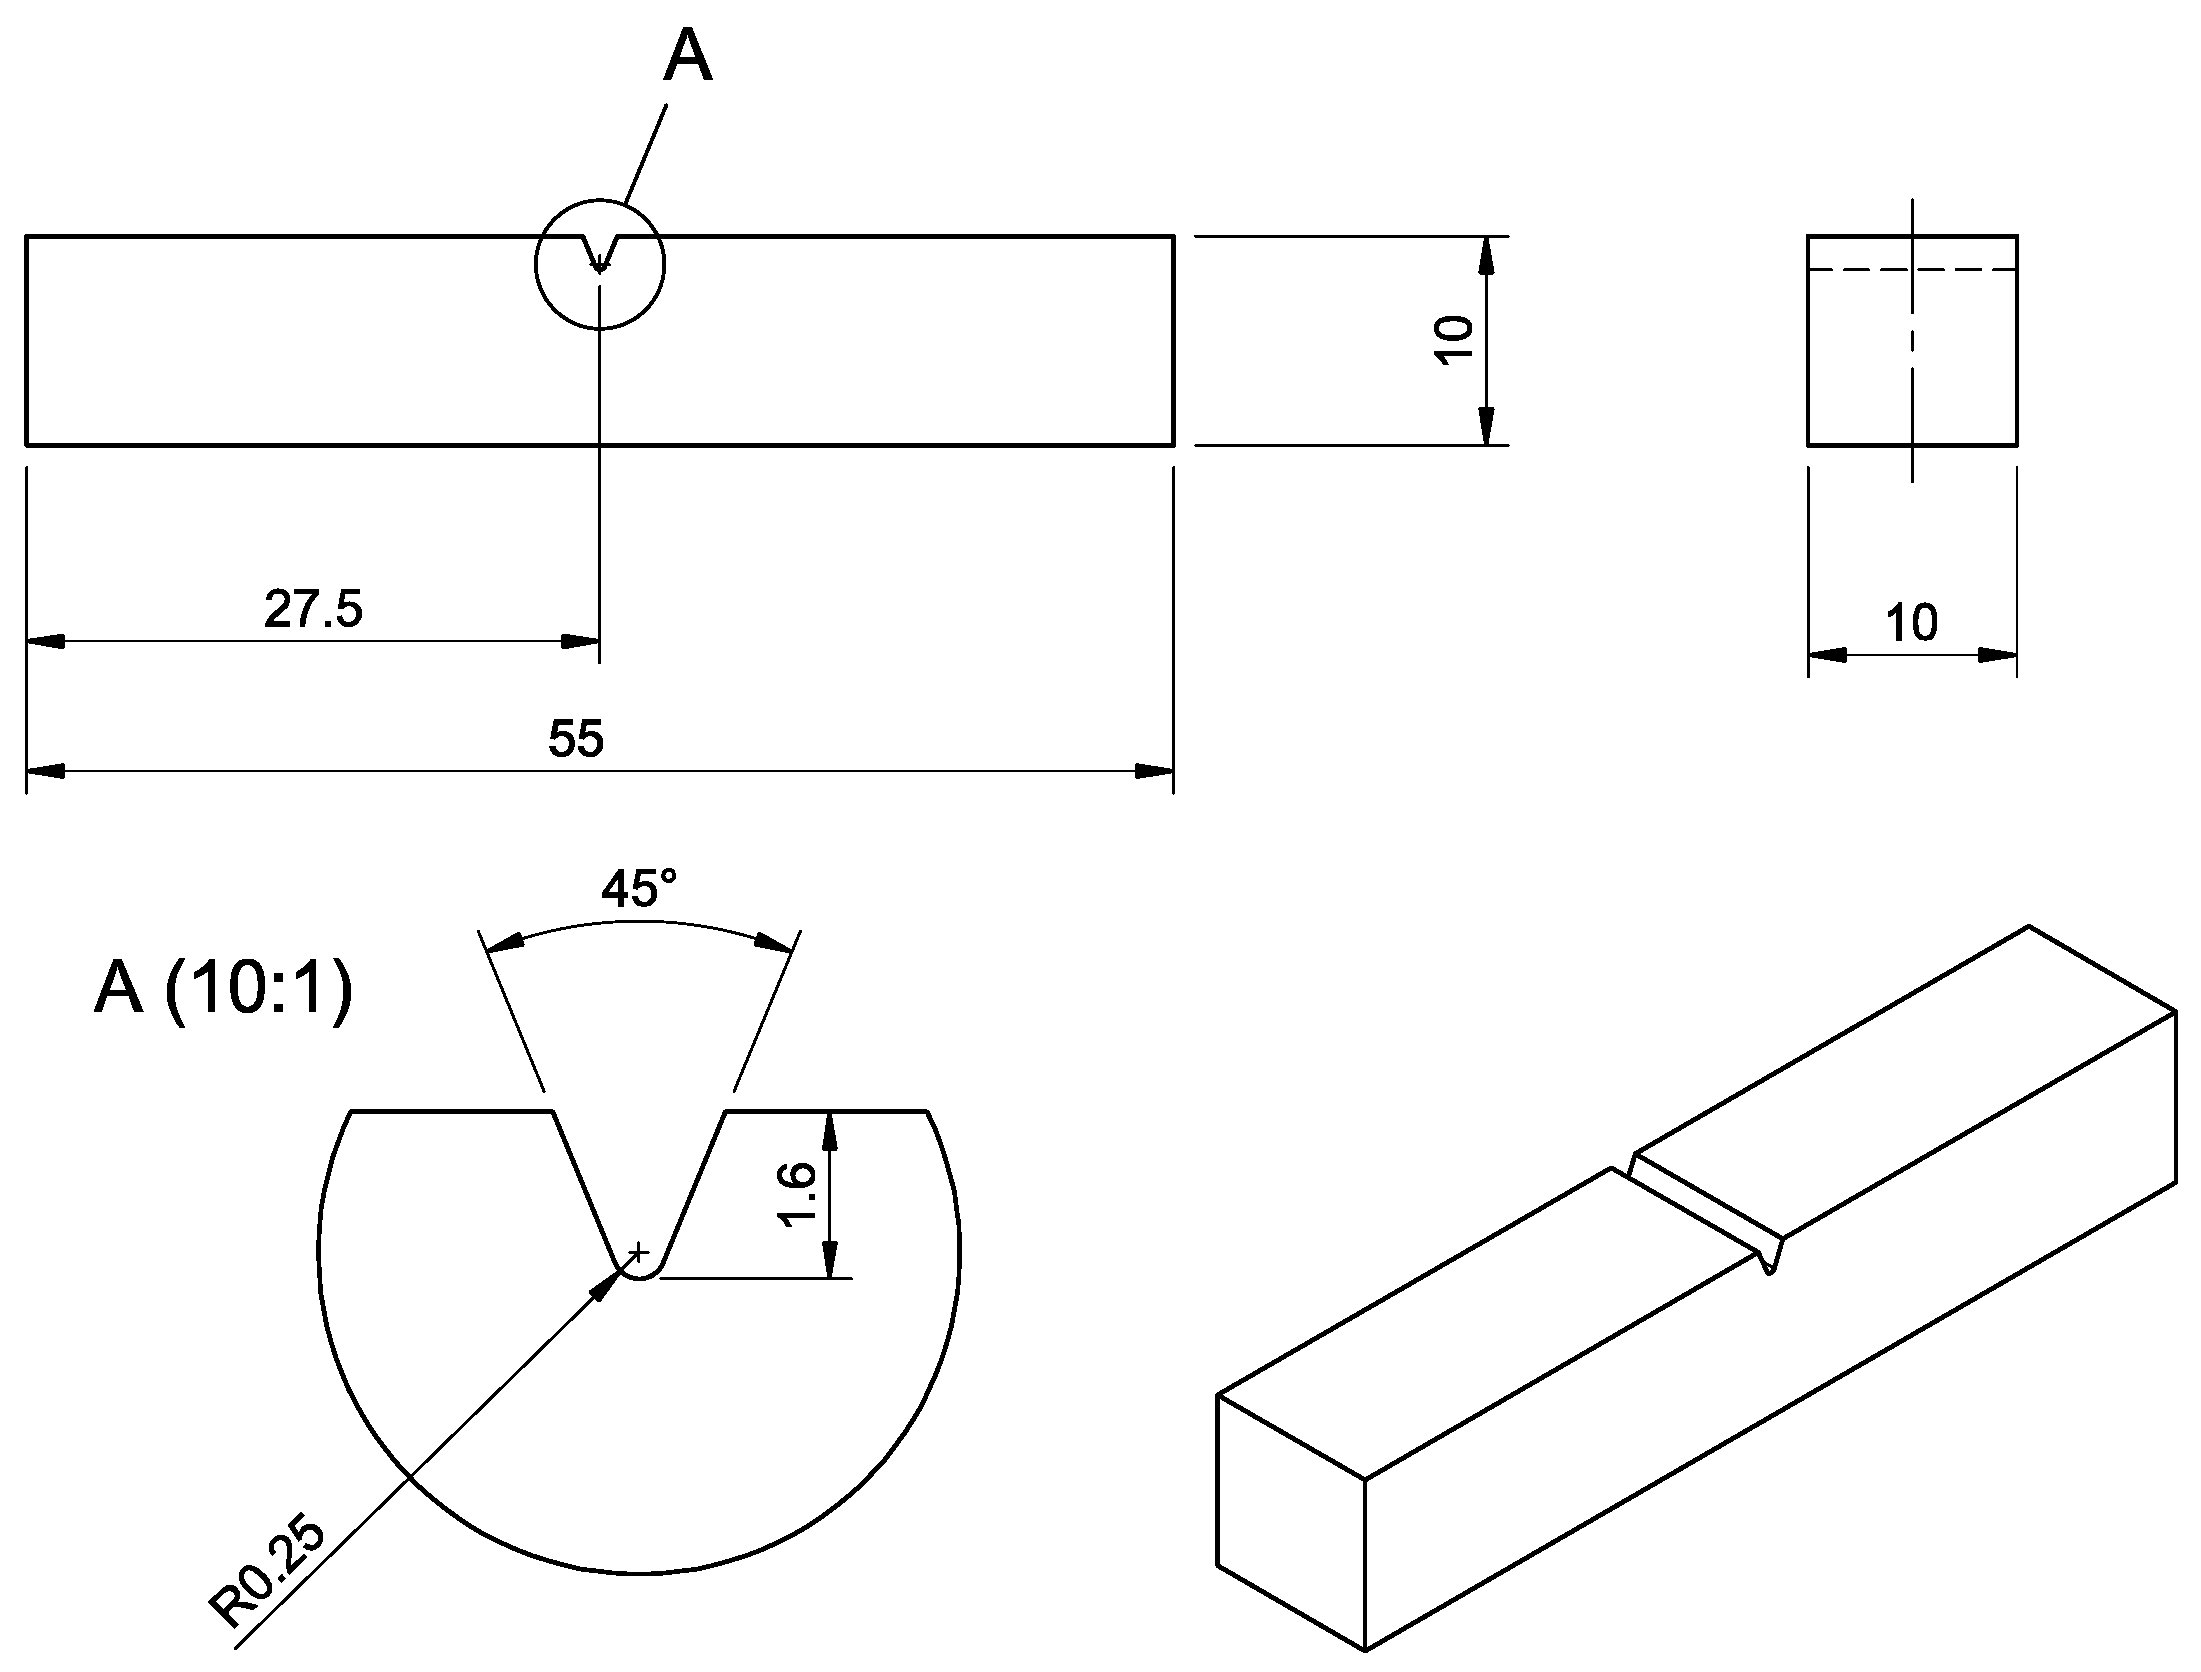
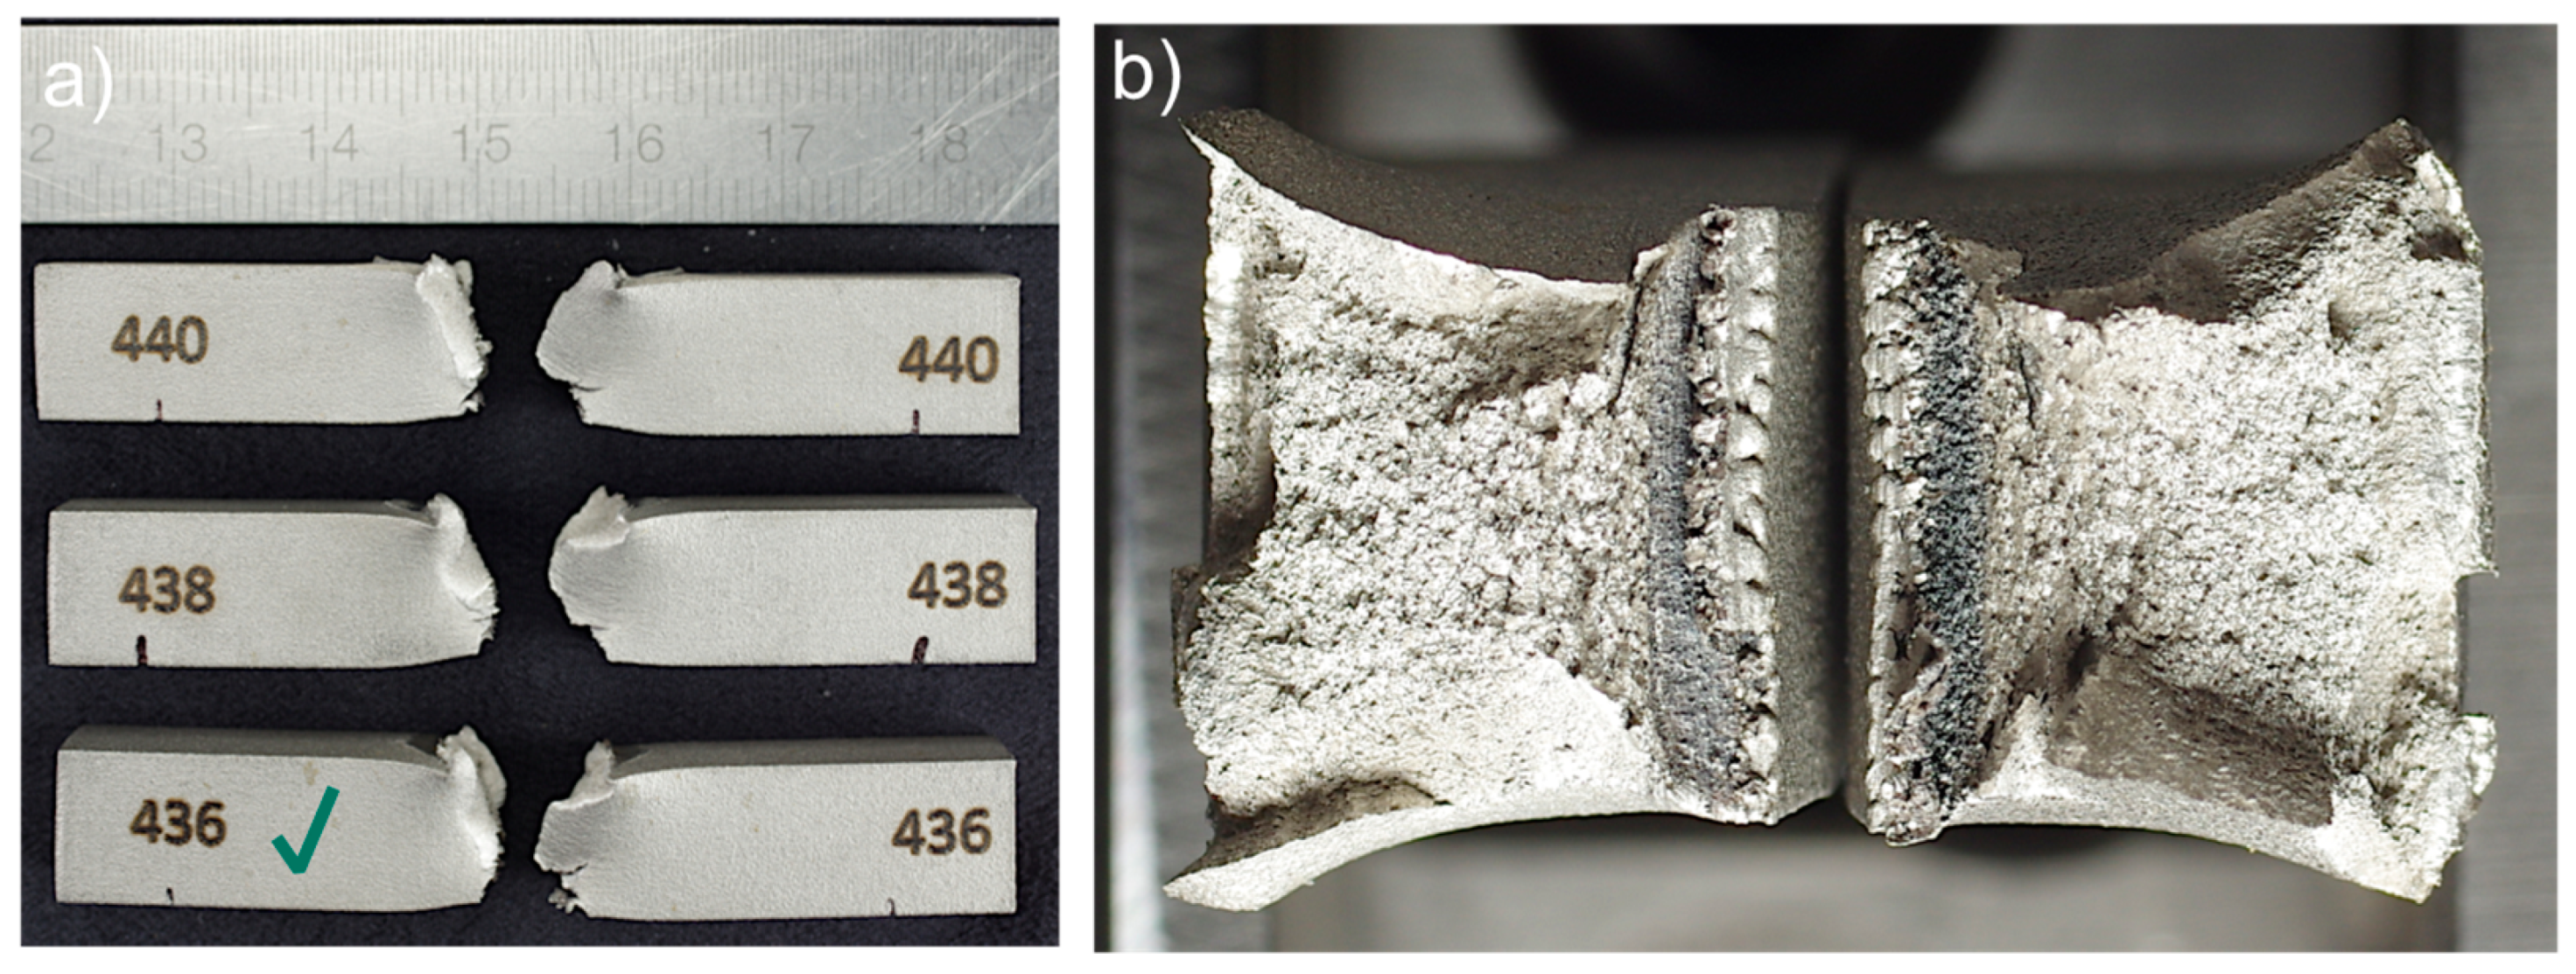
3.4. Charpy Test
4. Discussion
4.1. Test Results
4.2. Comparison with Literature
4.2.1. Tensile Test Considerations
4.2.2. Fatigue Test Considerations
4.3. Final Assessment
5. Conclusions
Author Contributions
Funding
Institutional Review Board Statement
Informed Consent Statement
Data Availability Statement
Conflicts of Interest
Abbreviations
| AM | Additive manufacturing |
| BJ | Binder jetting |
| CAD | Computer-aided design |
| CT | Computed tomography |
| FDM | Fused deposition modeling |
| FFF | Fused filament fabrication |
| HIP | Hot isostatic pressing |
| MIM | Metal injection molding |
| PBF | Powder bed fusion |
| SEM | Scanning electron microscope |
| SLM | Selective laser melting |
References
- Spencer, O.O.; Yusuf, O.T.; Tofade, T.C. Additive manufacturing technology development: A trajectory towards Industrial Revolution. Am. J. Mech. Ind. Eng. 2018, 3, 80–90. [Google Scholar] [CrossRef]
- Munsch, M.; Schmidt-Lehr, M.; Wycisk, E. Binder Jetting and FDM: A Comparison with Laser Powder Bed Fusion and Metal Injection Moulding. In Metal Additive Manufacturing; Inovar Communications Ltd.: Shrewsbury, UK, 2018; Volume 4, p. 159. [Google Scholar]
- Galati, M.; Minetola, P. Analysis of density, roughness, and accuracy of the atomic diffusion additive manufacturing (ADAM) process for metal parts. Materials 2019, 12, 4122. [Google Scholar] [CrossRef] [PubMed]
- Suwanpreecha, C.; Manonukul, A. A review on material extrusion additive manufacturing of metal and how it compares with metal injection moulding. Metals 2022, 12, 429. [Google Scholar] [CrossRef]
- Kan, X.; Yang, D.; Zhao, Z.; Sun, J. 316L FFF binder development and debinding optimization. Mater. Res. Express 2021, 8, 116515. [Google Scholar] [CrossRef]
- Desktop Metal Inc. BMD Design Guide; Desktop Metal, Inc.: Cambridge, MA, USA, 2022. [Google Scholar]
- Kurose, T.; Abe, Y.; Santos, M.V.; Kanaya, Y.; Ishigami, A.; Tanaka, S.; Ito, H. Influence of the layer directions on the properties of 316l stainless steel parts fabricated through fused deposition of metals. Materials 2020, 13, 2493. [Google Scholar] [CrossRef] [PubMed]
- Alkindi, T.; Alyammahi, M.; Susantyoko, R.A.; Atatreh, S. The effect of varying specimens’ printing angles to the bed surface on the tensile strength of 3D-printed 17-4PH stainless-steels via metal FFF additive manufacturing. MRS Commun. 2021, 11, 310–316. [Google Scholar] [CrossRef]
- Bjørheim, F.; Lopez, I.L.T. Tension testing of additively manufactured specimens of 17-4 PH processed by Bound Metal Deposition. IOP Conf. Ser. Mater. Sci. Eng. 2021, 1201, 012037. [Google Scholar] [CrossRef]
- GmbH, B.D.P.S. User Guidelines for 3D Printing Metal Parts. Available online: https://forward-am.com/material-portfolio/ultrafuse-filaments-for-fused-filaments-fabrication-fff/metal-filaments/ultrafuse-316l/ (accessed on 28 July 2022).
- Poprawe, R.; Hinke, C.; Meiners, W.; Schrage, J.; Bremen, S.; Merkt, S. SLM Production Systems: Recent Developments in Process Development, Machine Concepts and Component Design. In Advances in Production Technology; Springer International Publishing AG: Cham, Switzerland, 2015; pp. 49–65. [Google Scholar]
- Yadroitsev, I.; Smurov, I. Selective laser melting technology: From the single laser melted track stability to 3D parts of complex shape. Phys. Procedia 2010, 5 Pt B, 551–560. [Google Scholar] [CrossRef]
- Kokkonen, P.; Salonen, L.; Virta, J.; Hemming, B.; Laukkanen, P.; Savolainen, M.; Komi, E.; Junttila, J.; Ruusuvuori, K.; Varjus, S. Design Guide for Additive Manufacturing of Metal Components by SLM Process; VTT Technical Research Centre of Finland: Espoo, Finland, 2016; p. 131. [Google Scholar]
- Abe, Y.; Kurose, T.; Santos, M.V.; Kanaya, Y.; Ishigami, A.; Tanaka, S.; Ito, H. Effect of layer directions on internal structures and tensile properties of 17-4PH stainless steel parts fabricated by fused deposition of metals. Materials 2021, 14, 243. [Google Scholar] [CrossRef]
- Messimer, S.L.; Rocha Pereira, T.; Patterson, A.E.; Lubna, M.; Drozda, F.O. Full-density fused deposition modeling dimensional error as a function of raster angle and build orientation: Large dataset for eleven materials. J. Manuf. Mater. Process. 2019, 3, 6. [Google Scholar] [CrossRef] [Green Version]
- Renishaw. SS 316L-0407 Powder for Additive Manufacturing. Available online: https://www.renishaw.com/resourcecentre/en/details/Data%20sheet:%20SS%20316L-0407%20powder%20for%20additive%20manufacturing(75792)?lang=en (accessed on 10 May 2022).
- BASF. Technical Data Sheet for Ultrafuse 316L. Available online: https://www.ultrafusefff.com/wp-content/uploads/2019/07/Ultrafuse_316L_Technical_Data_Sheet_TDS.pdf (accessed on 30 May 2022).
- Markforged. 17-4 PH Stainless Steel. Available online: https://static.markforged.com/downloads/17-4-ph-stainless-steel.pdf (accessed on 10 May 2022).
- DIN EN ISO 6892; Metallic Materials—Tensile Testing—Part 1: Method of Test at Room Temperature. DIN: Berlin, Germany, 2020.
- ISO 1099:2017; Metallic Materials—Fatigue Testing—Axial Force—Controlled Method. International Organization for Standardization: Geneva, Switzerland, 2017.
- ISO 6506-1; Metallic Materials—Brinell Hardness Test—Part 1: Test Method. In Part 1: Test Method. International Organization for Standardization: Geneva, Switzerland, 2014.
- ISO 148-1:2016; Metallic Materials—Charpy Pendulum Impact Test—Part 1: Test Method. 3rd ed. International Organization for Standardization: Geneva, Switzerland, 2016; p. 29.
- EOS. EOS Stainless Steel 316L Material Data Sheet. Available online: https://www.eos.info/03_system-related-assets/material-related-contents/metal-materials-and-examples/metal-material-datasheet/stainlesssteel/material_datasheet_eos_stainlesssteel_316l_en_web.pdf (accessed on 10 May 2022).
- Chao, Q.; Thomas, S.; Birbilis, N.; Cizek, P.; Hodgson, P.D.; Fabijanic, D. The effect of post-processing heat treatment on the microstructure, residual stress and mechanical properties of selective laser melted 316L stainless steel. Mater. Sci. Eng. 2021, 821, 141611. [Google Scholar] [CrossRef]
- Milella, P.P. Fatigue and Corrosion in Metals; Springer Science & Business Media: Berlin/Heidelberg, Germany, 2013. [Google Scholar] [CrossRef]
- Jiang, D.; Ning, F. Additive manufacturing of 316L stainless steel by a printing-debinding-sintering method: Effects of microstructure on fatigue property. J. Manuf. Sci. Eng. 2021, 143, 091007. [Google Scholar] [CrossRef]
- Tosto, C.; Tirillò, J.; Sarasini, F.; Cicala, G. Hybrid metal/polymer filaments for Fused Filament Fabrication (FFF) to print metal parts. Appl. Sci. 2021, 11, 1444. [Google Scholar] [CrossRef]
- Gong, H.; Snelling, D.; Kardel, K.; Carrano, A. Comparison of stainless steel 316L parts made by FDM-and SLM-based additive manufacturing processes. JOM 2018, 71, 880–885. [Google Scholar] [CrossRef]
- ASTM International. ASTM B883-19; Standard Specification for Metal Injection Molded (MIM) Materials. ASTM International: Geneva, Switzerland, 2019; Volume ASTM B883-19.
- Zhang, Y.; Feng, E.; Mo, W.; Lv, Y.; Ma, R.; Ye, S.; Wang, X.; Yu, P. On the Microstructures and Fatigue Behaviors of 316L Stainless Steel Metal Injection Molded with Gas- and Water-Atomized Powders. Metals 2018, 8, 893. [Google Scholar] [CrossRef]
- Heaney, D.F. Handbook of Metal Injection Molding; Woodhead Publishing: Sawston, UK, 2018. [Google Scholar]
- Lavery, N.; Cherry, J.; Mehmood, S.; Davies, H.; Girling, B.; Sackett, E.; Brown, S.; Sienz, J. Effects of hot isostatic pressing on the elastic modulus and tensile properties of 316L parts made by powder bed laser fusion. Mater. Sci. Eng. A 2017, 693, 186–213. [Google Scholar] [CrossRef]
- Montero Sistiaga, M.; Nardone, S.; Hautfenne, C.; Van Humbeeck, J. Effect of heat treatment of 316L stainless steel produced by selective laser melting (SLM). In Proceedings of the 27th Annual International Solid Freeform Fabrication Symposium-An Additive Manufacturing Conference, Austin, TX, USA, 8–10 July 2016; pp. 558–565. [Google Scholar]
- Suryawanshi, J.; Prashanth, K.G.; Ramamurty, U. Mechanical behavior of selective laser melted 316L stainless steel. Mater. Sci. Eng. 2017, 696, 113–121. [Google Scholar] [CrossRef]
- Eshkabilov, S.; Ara, I.; Sevostianov, I.; Azarmi, F.; Tangpong, X. Mechanical and thermal properties of stainless steel parts, manufactured by various technologies, in relation to their microstructure. Int. J. Eng. Sci. 2021, 159, 103398. [Google Scholar] [CrossRef]
- Mahmoudi, M.; Elwany, A.; Yadollahi, A.; Thompson, S.M.; Bian, L.; Shamsaei, N. Mechanical properties and microstructural characterization of selective laser melted 17-4 PH stainless steel. Rapid Prototyp. J. 2017, 23, 280–294. [Google Scholar] [CrossRef] [Green Version]
- Wang, F. Mechanical property study on rapid additive layer manufacture Hastelloy® X alloy by selective laser melting technology. Int. J. Adv. Manuf. Technol. 2012, 58, 545–551. [Google Scholar] [CrossRef]
- Watson, A.; Belding, J.; Ellis, B.D. Characterization of 17-4 PH Processed via Bound Metal Deposition (BMD). In Proceedings of TMS 2020 149th Annual Meeting & Exhibition Supplemental Proceedings; Springer: Cham, Switzerland, 2020; pp. 205–216. [Google Scholar]
- Henry, T.C.; Morales, M.A.; Cole, D.P.; Shumeyko, C.M.; Riddick, J.C. Mechanical behavior of 17-4 PH stainless steel processed by atomic diffusion additive manufacturing. Int. J. Adv. Manuf. Technol. 2021, 114, 2103–2114. [Google Scholar] [CrossRef]
- Suwanpreecha, C.; Seensattayawong, P.; Vadhanakovint, V.; Manonukul, A. Influence of specimen layout on 17-4PH (AISI 630) alloys fabricated by low-cost additive manufacturing. Metall. Mater. Trans. 2021, 52, 1999–2009. [Google Scholar] [CrossRef]
- Harmer, S. ASM Handbook Vol. 7 ‘Powder Metal Technologies and Applications’; ASM International: Almere, The Netherlands, 2000; Volume 43, p. 22. [Google Scholar]
- Jui-Hung, W.; Chih-Kuang, L. Tensile and fatigue properties of 17-4 PH stainless steel at high temperatures. Metall. Mater. Trans. 2002, 33, 1715–1724. [Google Scholar] [CrossRef]
- Nezhadfar, P.D.; Shrestha, R.; Phan, N.; Shamsaei, N. Fatigue behavior of additively manufactured 17-4 PH stainless steel: Synergistic effects of surface roughness and heat treatment. Int. J. Fatigue 2019, 124, 188–204. [Google Scholar] [CrossRef]
- Luecke, W.E.; Slotwinski, J.A. Mechanical properties of austenitic stainless steel made by additive manufacturing. J. Res. Natl. Inst. Stand. Technol. 2014, 119, 398–418. [Google Scholar] [CrossRef]
- Desktop Metal, I. 17-4 PH Stainless Steel. Available online: www.desktopmetal.com (accessed on 15 May 2022).
- Werner, T.; Madia, M.; Zerbst, U. Comparison of the fatigue behavior of wrought and additively manufactured AISI 316L. Procedia Struct. Integr. 2022, 38, 554–563. [Google Scholar] [CrossRef]
- Celik, A.; Arslan, Y.; Yetim, A.F.; Efeoglu, I. Fatigue behaviour of duplex treated AISI 316L stainless steel. Metall. Mater. 2007, 45, 35–40. [Google Scholar]
- Strizak, J.; Tian, H.; Liaw, P.; Mansur, L. Fatigue properties of type 316LN stainless steel in air and mercury. J. Nucl. Mater. 2005, 343, 134–144. [Google Scholar] [CrossRef]
- Marshall, T.P. Injection molding of 17-4 PH stainless steel. SAE Trans. 1984, 93, 27. [Google Scholar] [CrossRef]
- Yadollahi, A.; Shamsaei, N.; Thompson, S.M.; Elwany, A.; Bian, L.; Mahmoudi, M. Fatigue Behavior of Selective Laser Melted 17-4 PH Stainless Steel. In Proceedings of the 2015 International Solid Freeform Fabrication Symposium, Houston, TX, USA, 13–19 November 2015. [Google Scholar]
- Molaei, R.; Fatemi, A.; Phan, N. Multiaxial fatigue of LB-PBF additive manufactured 17–4 PH stainless steel including the effects of surface roughness and HIP treatment and comparisons with the wrought alloy. Int. J. Fatigue 2020, 137, 105646. [Google Scholar] [CrossRef]
- Concli, F.; Fraccaroli, L.; Nalli, F.; Cortese, L. High and low-cycle-fatigue properties of 17–4 PH manufactured via selective laser melting in as-built, machined and hipped conditions. Prog. Addit. Manuf. 2021, 7, 99–109. [Google Scholar] [CrossRef]
- Al-Maharma, A.Y.; Patil, S.P.; Markert, B. Effects of porosity on the mechanical properties of additively manufactured components: A critical review. Mater. Res. Express 2020, 7, 122001. [Google Scholar] [CrossRef]


| Elements | EOS 316L 1 | Renishaw 316L [16] 2 | Ultrafuse BASF 316L [17] | 17-4 PH [18] | ||||
|---|---|---|---|---|---|---|---|---|
| Min | Max | Min | Max | Min | Max | Min | Max | |
| Fe | balance | balance | balance | balance | ||||
| C | - | 0.03 | - | 0.03 | - | 0.07 | - | 0.07 |
| Co | - | 0.1 | - | - | - | - | - | - |
| Cr | 16 | 18 | 16 | 18 | 16 | 18.5 | 15 | 17.5 |
| Cu | - | 0.075 | - | - | - | - | 3.0 | 5.0 |
| Mn | - | 2.0 | - | 2.0 | - | 2.0 | - | 1.0 |
| Mo | 2.0 | 3.0 | 2.0 | 3.0 | 2.0 | 2.5 | - | - |
| N | - | 0.01 | - | 0.01 | - | 0.11 | - | - |
| Nb | - | - | - | - | - | - | 0.15 | 0.45 |
| Ni | 10 | 14 | 10 | 14 | 10 | 13 | 3.0 | 5.0 |
| O | - | 0.1 | - | 0.1 | - | - | - | - |
| P | - | 0.04 | - | 0.045 | - | 0.045 | - | 0.04 |
| Si | - | 1.0 | - | 1.0 | - | 1.0 | - | 1.0 |
| S | - | 0.03 | - | 0.03 | - | 0.03 | - | 0.03 |
| Printing Parameter | Value |
|---|---|
| Nozzle size, mm | 0.4 |
| Retraction distance, mm | 0.5 |
| Retraction speed, mm/s | 45 |
| Layer height, mm | 0.15 |
| Nozzle temperature, °C | 250 |
| Print bed temperature, °C | 100 |
| Chamber temperature, °C | 100 |
| Oversizing factors: X, Y, Z, % | 21.35, 21.35, 26 |
| Printing Parameter | Value |
|---|---|
| Nozzle size, mm | 0.45 |
| Layer height, mm | 0.125 |
| Print bed temperature, °C | 115 |
| Metal hotend temperature, °C | 220 |
| Chamber temperature, °C | 48 |
| Oversizing factors: X, Y, Z, % | 19.5, 19.5, 20 |
| Printing Parameter | EOS M 290 | Renishaw AM 400 |
|---|---|---|
| Layer height, µm | 40 | 40 |
| Laser power, W | * | 180 |
| Focus Diameter, µm | 100 | 70 |
| Hatch distance, mm | * | 0.11 |
| Shielding gas | Argon | Argon |
| Oxygen content, % | * | 0.15 |
| Parameters | Markforged 17-4 PH | BASF Ultrafuse 316L | EOS M 290 316L (HT) | Renishaw AM 400 316L |
|---|---|---|---|---|
| Yield strength, , MPa | 441.0 ± 55.4 | 152.9 ± 61.3 | 375.2 ± 22.4 | 443.1 ± 15.7 |
| Tensile strength, , MPa | 495.9 ± 77.0 | 314.0 ± 41.7 | 533.2 ± 1.1 | 570.8 ± 4.4 |
| Elongation at break , % | 0.4 ± 0.1 | 10.2 ± 5.0 | 38.2 ± 0.1 | 38.4 ± 0.1 |
| Young’s modulus, , GPa | 142 ± 65 | 160 ± 22 | 190 ± 18 | 129 ± 17 |
| Markforged 17-4 PH (XY) 1 [18] | BASF Ultrafuse 316L (XY/ZX) [17] | EOS M 290 316L 2 (XY/ZX) [23] | Renishaw AM 400 316L (XY/ZX) [16] | |
|---|---|---|---|---|
| , MPa | 800 | 251/234 | 530/470 | 547/494 |
| , MPa | 1050 | 561/521 | 640/540 | 676/624 |
| , % | 5 | 53/36 | 40/54 | 43+/−2/35+/−8 |
| , GPa | 140 | - | - | 197/190 |
| ρ, density g/cm3 | 7.44 | 7.85 | ≥7.97 | 7.99 |
| , impact strength, J/cm2 | - | 111/- | - | - |
| Hardness | 30, HRC | 128/128, HV10 | - | 198/208, HV0.5 |
| Roughness | Measurement Direction | Markforged 17-4 PH | BASF Ultrafuse 316L | EOS M 290 316L (HT) | Renishaw AM 400 316L |
|---|---|---|---|---|---|
| Flat, along a sample | 8.15 ± 0.85 | 7.34 ± 1.02 | 4.05 ± 0.43 | 4.07 ± 0.79 | |
| Flat, along a sample | 47.67 ± 5.64 | 43.09 ± 4.56 | 24.54 ± 2.95 | 25.51 ± 4.96 | |
| Side, along a sample | 16.55 ± 1.22 | 7.49 ± 1.15 | 3.73 ± 0.38 | 5.78 ± 0.65 | |
| Side, along a sample | 77.84 ± 9.12 | 46.23 ± 6.41 | 22.58 ±2.71 | 36.95 ± 3.55 |
| HB 2.5/187.5 | Markforged 17-4 PH | BASF Ultrafuse 316L | EOS M 290 316L (HT) | Renishaw AM400 316L |
|---|---|---|---|---|
| 261 ± 17.4 | 126 ± 6.2 | 213 ± 9.7 | 217 ± 10.6 |
| Markforged 17-4 PH, J | BASF Ultrafuse 316L, J | EOS M 290 316L (HT), J | Renishaw AM 400 316L, J |
|---|---|---|---|
| Not measurably small | Not measurably small | 202.4 ± 17.3 | 223.3 ± 18.0 |
| Method | Infill, Print Direction % | Build Orientation, Notes | Porosity 7 % | MPa | MPa | % | GPa | Source |
|---|---|---|---|---|---|---|---|---|
| FFF | 100 | XY | - | 251 | 561 | 53 | - | [17] |
| FFF | 100 | ZX | - | 234 | 521 | 36 | - | [17] |
| FFF | 100 1 | XY | - | 148 | 444 | 43 | 157 | [27] |
| FFF | 100 | ZX | - | 114 | 206 | 13 | 117 | [27] |
| FFF | 100 | XY | 1.5 | 167 | 465 | 31 | 152 | [28] |
| FFF | 100 2 | XY | 8.2 | - | 421 | 43 | - | [7] |
| FFF | 100 2 | ZX | 7.3 | - | 107 | 2.5 | - | [7] |
| FFF | 100 2 | XZ | 8.5 | - | 356 | 28 | - | [7] |
| MIM | N/A | - | 5.3 6 | 175 6 | 520 6 | 50 6 | - | [29] |
| MIM | N/A | water atomized | 4 | 170 | 460 | 29 | - | [30] |
| MIM | N/A | gas atomized | 2 | 205 | 560 | 58 | - | [30] |
| MIM | N/A | - | 2 6 | 180 6 | 520 6 | 40 6 | 185 6 | [31] |
| SLM | 100 | XZ | 2 | 412 | 577 | 35 | 139 | [32] |
| SLM | 100 | ZX | 2 | 365 | 469 | 17 | 78 | [32] |
| SLM | 100 | XY | 0.7 | 500 | 630 | 39 | - | [33] |
| SLM | 100 | ZX | 0.7 | 500 | 625 | 47 | - | [33] |
| SLM | 100 3 | ZX | 2.3 | 512 | 622 | 20 | - | [34] |
| SLM | 100 3 | XY | 2.3 | 430 | 509 | 12 | - | [34] |
| SLM | 100 4 | ZX | 1.9 | 536 | 668 | 25 | - | [34] |
| SLM | 100 4 | XY | 1.9 | 449 | 528 | 12 | - | [34] |
| SLM | 100 5 | XY | - | 320 | 574 | 50 | 180 | [35] |
| Wrought | N/A | hot rolled | - | 241 | 621 | 59 | 185 | [35] |
| Method | Infill, Print Direction % | Build Orientation, Notes | Porosity % | MPa | MPa | % | GPa | Source |
|---|---|---|---|---|---|---|---|---|
| FFF | 100 1 | XY | 9.8 | 443 | 497 | 0.79 | 108 | [27] |
| FFF | 100 1 | ZX | - | 412 | 494 | 0.95 | 103 | [27] |
| FFF | 100 2 | XY | 2.7 | 604 | 776 | 7.7 | 176 | [38] |
| FFF | 100 2 | XY | 2.7 | 605 | 776 | 5.9 | 176 | [38] |
| FFF | 100 4 | XY aligned in Y | 6.5 5 | 580 | 794 | 2.7 | 128 | [39] |
| FFF | 100 4 | XY aligned in X | 6.5 5 | 600 | 795 | 3.2 | 131 | [39] |
| FFF | 100 4 | ZX | 6.5 5 | 647 | 701 | 0.76 | 134 | [39] |
| FFF | 100 4 | XY | - | 688 | 1068 | 4.97 | 138 | [9] |
| FFF | 100 4 | XZ | - | 650 | 815 | 0.86 | 189 | [9] |
| FFF | 100 4 | ZX | - | 615 | 727 | 0.98 | 131 | [9] |
| FFF | 100 | XY | 1.4 | 746 | 1034 | 4.9 | 176 | [40] |
| FFF | 100 | XZ | 2.6 | 689 | 978 | 4.2 | 163 | [40] |
| FFF | 100 | ZX | 2.3 | 668 | 745 | 0.8 | 159 | [40] |
| FFF | 100 4 | XY | 4 | 800 | 1050 | 5 | 140 | [18] |
| FFF | 100 4 | XY/H900 | 4 | 1100 | 1250 | 6 | 170 | [18] |
| MIM | N/A | Heat-treated | 4 | 965 | 1140 | 12 | - | [41] |
| MIM | N/A | 1038 °C @0.5 h | - | 992 | 1018 | 13.4 | 199 | [42] |
| MIM | N/A | H900 | - | 1387 | 1414 | 12.5 | 223 | [42] |
| MIM | N/A | As sintered | 3.2 | 730 3 | 900 3 | 6 3 | - | [29] |
| MIM | N/A | H900 | 3.2 | 965 3 | 1070 3 | 6 3 | - | [29] |
| SLM | N/A | ZX | - | 830 | 887 | 61 | 133 | [43] |
| SLM | N/A | ZX/H900 | - | 1050 | 1117 | 17 | 189 | [43] |
| SLM | N/A | XZ | - | 493 | 1058 | 19 | - | [44] |
| SLM | N/A | XY/650 °C @1 h | - | 428 | 1281 | 15 | - | [44] |
| SLM | N/A | XY | - | 535 | 1029 | 18 | - | [44] |
| SLM | N/A | ZX | - | 494 | 979 | 18 | - | [44] |
| SLM | N/A | ZX/650 °C @1 h | - | 483 | 1298 | 15 | - | [44] |
| SLM | N/A | XY | - | 635 | 1048 | 9.8 | - | [36] |
| SLM | N/A | ZX | - | 635 | 942 | 4 | - | [36] |
| Wrought | N/A | - | - | 980 | 1060 | 8 | 200 | [45] |
| Wrought | N/A | - | - | 1000 | 1103 | 5 | - | [20] |
| Alloy | Method | Infill % | Surface/Porosity % | Build Orientation, Notes | Max Stress MPa | Life Cycles | R | Source |
|---|---|---|---|---|---|---|---|---|
| 316L | FFF | 100 | as sintered/4.4 | XY | 80 1 | * 1.0 × 10⁶ | 0.1 | [26] |
| 316L | FFF | 100 | as sintered/4.4 | XY | 100 1 | 1.04 × 10⁵ | 0.1 | [26] |
| 316L | FFF | 100 | as sintered/4.4 | XY | 120 1 | 1.05 × 10⁴ | 0.1 | [26] |
| 316L | MIM | - | as produced/4 | water atomized | 90 1 | * 3.32 × 10⁶ | 0.1 | [30] |
| 316L | MIM | - | as produced/2 | gas atomized | 135 1 | * 1.0 × 10⁷ | 0.1 | [30] |
| 316L | SLM | - | Rz < 0.2 µm | H900 | 280 1 | 3.0 × 10⁶ | −1 | [46] |
| 316L | wrought | - | Rz < 0.2 µm | 1100 °C, water | 210 1 | * 1.0 × 10⁷ | −1 | [46] |
| 316L | wrought | - | Polished | - | 438 2 | 1.0 × 10⁷ | −1 | [47] |
| 316L | wrought | - | Ra = 0.2 µm | 1038 °C, air | 220 1 | * 1.0 × 10⁶ | −1 | [48] |
| 316L | wrought | - | Ra = 0.2 µm | 1038 °C, air | 165 1 | * 2.0 × 10⁷ | 0.1 | [48] |
| 17-4 | MIM | - | as sintered/4 | H1000 | 414 2 | * 1.0 × 10⁷ | −1 | [49] |
| 17-4 | MIM | - | as sintered/2 | H1000, HIP | 448 2 | * 1.0 × 10⁷ | −1 | [49] |
| 17-4 | SLM | 100 | Ra < 0.7 µm | ZX | 225 1 | 1.5 × 10⁵ | −1 | [50] |
| 17-4 | SLM | 100 | Ra < 0.7 µm | ZX/H900 | 280 1 | * 1.0 × 10⁶ | −1 | [50] |
| 17-4 | SLM | 100 | Ra = 8.38 µm | ZX/CA-H1025 | 311 1 | * 1.0 × 10⁷ | −1 | [51] |
| 17-4 | SLM | 100 | Ra = 0.015 µm | ZX/CA-H1025 | 480 1 | * 1.0 × 10⁷ | −1 | [51] |
| 17-4 | SLM | 100 | Ra = 0.013 µm | ZX/CA-H1025 | 541 1 | 1.266 × 10⁶ | −1 | [51] |
| 17-4 | SLM | 100 | Ra = 0.011 µm | ZX/HIP | 560 1 | 5.0 × 10⁶ | −1 | [51] |
| 17-4 | SLM | 100 | as produced | ZX | 271 1 | * 5.0 × 10⁸ | −1 | [52] |
| 17-4 | SLM | 100 | as produced | ZX/HIP | 243 1 | * 5.0 × 10⁸ | −1 | [52] |
| 17-4 | SLM | 100 | Machined | ZX | 340 1 | * 5.0 × 10⁸ | −1 | [52] |
| 17-4 | wrought | N/A | as produced | H900 | 355 1 | * 5.0 × 10⁸ | −1 | [52] |
| 17-4 | wrought | N/A | Ra = 0.01 µm | H1025 | 750 1 | 8.91 × 10⁵ | −1 | [51] |
Publisher’s Note: MDPI stays neutral with regard to jurisdictional claims in published maps and institutional affiliations. |
© 2022 by the authors. Licensee MDPI, Basel, Switzerland. This article is an open access article distributed under the terms and conditions of the Creative Commons Attribution (CC BY) license (https://creativecommons.org/licenses/by/4.0/).
Share and Cite
Kedziora, S.; Decker, T.; Museyibov, E.; Morbach, J.; Hohmann, S.; Huwer, A.; Wahl, M. Strength Properties of 316L and 17-4 PH Stainless Steel Produced with Additive Manufacturing. Materials 2022, 15, 6278. https://doi.org/10.3390/ma15186278
Kedziora S, Decker T, Museyibov E, Morbach J, Hohmann S, Huwer A, Wahl M. Strength Properties of 316L and 17-4 PH Stainless Steel Produced with Additive Manufacturing. Materials. 2022; 15(18):6278. https://doi.org/10.3390/ma15186278
Chicago/Turabian StyleKedziora, Slawomir, Thierry Decker, Elvin Museyibov, Julian Morbach, Steven Hohmann, Adrian Huwer, and Michael Wahl. 2022. "Strength Properties of 316L and 17-4 PH Stainless Steel Produced with Additive Manufacturing" Materials 15, no. 18: 6278. https://doi.org/10.3390/ma15186278
APA StyleKedziora, S., Decker, T., Museyibov, E., Morbach, J., Hohmann, S., Huwer, A., & Wahl, M. (2022). Strength Properties of 316L and 17-4 PH Stainless Steel Produced with Additive Manufacturing. Materials, 15(18), 6278. https://doi.org/10.3390/ma15186278