Article

Phonon Structure, Infra-Red and Raman Spectra of Li2MnO3 by First-Principles Calculations

by
Ruth Pulido
1,2,
Nelson Naveas
1,2,*,
Raúl J. Martin-Palma
1,
Fernando Agulló-Rueda
3,
Victor R. Ferró
4,
Jacobo Hernández-Montelongo
5,*,
Gonzalo Recio-Sánchez
6,
Ivan Brito
7 and
Miguel Manso-Silván
1,8
1
Departamento de Física Aplicada and Instituto Universitario de Ciencia de Materiales Nicolás Cabrera, Universidad Autónoma de Madrid, 28049 Madrid, Spain
2
Departamento de Ingeniería Química y Procesos de Minerales, Universidad de Antofagasta, Avenida Angamos 601, Antofagasta 1240000, Chile
3
Instituto de Ciencia de Materiales de Madrid (ICMM), CSIC, 28049 Madrid, Spain
4
Departamento de Ingeniería Química, Universidad Autónoma de Madrid, 28049 Madrid, Spain
5
Departamento de Ciencias Matemáticas y Físicas, UC Temuco, Temuco 4813302, Chile
6
Facultad de Ingeniería, Arquitectura y Diseño, Universidad de San Sebastián, Concepción 4080871, Chile
7
Departamento de Química, Universidad de Antofagasta, Avenida Angamos 601, Antofagasta 1240000, Chile
8
Centro de Microanálisis de Materiales, Universidad Autónoma de Madrid, Campus de Cantoblanco, 28049 Madrid, Spain
*
Authors to whom correspondence should be addressed.
Materials 2022, 15(18), 6237; https://doi.org/10.3390/ma15186237
Submission received: 15 August 2022 / Revised: 2 September 2022 / Accepted: 2 September 2022 / Published: 8 September 2022

Abstract

:
The layer-structured monoclinic Li2MnO3 is a key material, mainly due to its role in Li-ion batteries and as a precursor for adsorbent used in lithium recovery from aqueous solutions. In the present work, we used first-principles calculations based on density functional theory (DFT) to study the crystal structure, optical phonon frequencies, infra-red (IR), and Raman active modes and compared the results with experimental data. First, Li2MnO3 powder was synthesized by the hydrothermal method and successively characterized by XRD, TEM, FTIR, and Raman spectroscopy. Secondly, by using Local Density Approximation (LDA), we carried out a DFT study of the crystal structure and electronic properties of Li2MnO3. Finally, we calculated the vibrational properties using Density Functional Perturbation Theory (DFPT). Our results show that simulated IR and Raman spectra agree well with the observed phonon structure. Additionally, the IR and Raman theoretical spectra show similar features compared to the experimental ones. This research is useful in investigations involving the physicochemical characterization of Li2MnO3 material.

1. Introduction

The growing demand for portable devices, electronic vehicles and energy storage, as well as attempts to mitigate the impacts of global warming, have led to rapid advances in the development of lithium-ion batteries as well as the search for new technologies in lithium recovery [1,2,3,4]. In this instance, lithium manganese oxide (LMO) materials have attracted a great deal of interest due to their key roles as cathodic and precursor materials for energy and lithium adsorption from aqueous solutions, respectively [5,6]. In the context of these potential applications, Li-rich LMO such as Li2MnO3 has been identified as a crucial component due to its interesting physicochemical properties [7,8]. Interestingly, it has been reported that the increase of Li2MnO3 content enhances the cycling stability of cathode materials based on Li-Mn-O, preventing the manganese dissolution [9,10]. Similarly, by controlling the Li2MnO3 layered phase content in lithium adsorbent precursor materials, it is possible to prevent the manganese dissolution from the LMO lattice during the Li+ desorption process [11].
The layer-structured monoclinic Li2MnO3 materials (with the rock salt crystal structure; Figure 1) belong to the C 2 / m space group. Li2MnO3 structure consists of laminations of alternating Li/Mn and Li-layers (Figure 1a). The Li+ and Mn+4 ions reside in the octahedral interstices of a close-packed cubic oxygen lattice stacking order, as represented in Figure 1b,c [12]. Their formula can also be written as:
{ ( L i 1 / 2 ) 2 c ( L i 1 ) 4 h } i n t e r s l a b { ( L i 1 / 2 ) 2 b ( M n 1 ) 4 g ( O 1 ) 4 i ( O 2 ) 8 j }
The lithium ions are scattered octahedrally in the 2c and 4h Wyckoff position inside the [Li+] layer and in the 2b position into the [LiMn2] layer, while the Mn+4 ions are dispersed octahedrally in the 4g sites [13].
Li2MnO3-based LMO materials can be formed by different synthesis routes, varying in conformation and composition. Structures such as core-shell type, spinel embedded within the layered matrix, and spherical particles have been reported [9,14,15]. Whatever the conformation and composition are chosen, a detailed characterization of the LMO material is essential to provide an understanding of its different properties. For example, one of the most critical issues in understanding electrochemical properties is determining the local structure [16]. In this context, some studies have shown a relationship between the structural properties and electrochemical performance in doped-LMO composites [7,17]. Kim et al. reported that the enhanced stability of the local structure of lithium manganese oxides is related to the improvement of cyclability [18]. Likewise, the knowledge of the local environment of LMO helps to elucidate the underlying mechanism of the ad/desorption process in LMO-based lithium-ion sieves [19]. In this sense, vibrational spectroscopy can be used to provide information on the structural aspects of LMO. Raman and infra-red (IR) spectroscopies are very sensitive to the short-range environment of oxygen coordination around the cations [20]. Julien and co-workers have extensively studied the structural properties of spinel-type LMO by Raman and IR spectroscopies [20,21,22,23,24,25,26]. Their results are based on the experimental analysis of the LMO building blocks, namely, the tetrahedra LiO4 and the octahedra MnO6, which compose the crystal lattice. On the contrary, the vibrational analysis of the Li2MnO3 has not been completely and vigorously studied yet, despite the fact that its IR and/or Raman bands have been studied previously by experiments [8,27]. Therefore, there is a need to perform detailed studies in order to obtain solid knowledge about its vibrational properties. In this context, simulated IR and Raman spectra based on density functional theory (DFT) calculations can be helpful in understanding the vibrational properties of Li2MnO3. In fact, DFT-based theoretical studies have shown excellent agreement with experimental IR and/or Raman spectra of organic compounds [28], crystalline [29], and 2D materials [30].
In the present work, we report a computational study of the vibrational properties of Li2MnO3. Initially, we synthesized and physicochemically characterized the Li2MnO3 powder material. Further, we proceeded to the calculation of the optimized crystal structure and the electronic properties by first-principle calculations using the Local Density Approximation (LDA). Then, by using Density Functional Perturbation Theory (DFPT), we studied the vibrational modes and computed the phonon structure, IR and Raman spectra of the Li2MnO3. Finally, a detailed interpretation of obtained data was presented.

2. Materials and Methods

2.1. Material Synthesis and Characterization

The Li2MnO3 samples were synthesized by way of a hydrothermal method. First, LiOH (2 mol·L 1 ) and H2O2 (1.2 mol·L 1 ) were dissolved in ultra-pure water to produce Li precursor solutions. Then, MnSO4 (0.4 mol·L 1 ) was dissolved in ultra-pure water to form an Mn precursor solution. Both solutions were magnetically stirred for 2 h. Subsequently, the mixture was crystallized for 8 h at 180 C in a Teflon-lined stainless steel autoclave. The crystallization product was washed and centrifuged numerous times. Finally, the resultant product was dried at 60 C for 12 h before being calcined at 800 C for 4 h.
Powder X-ray Diffraction (XRD) in a Bruker New D8 Advance X-ray diffractometer equipped with a Johansson monochromator (Cu-K α 1 radiation (Billerica, MA, USA), λ = 1.5406 Å) and LYNXEYE XE detector was used to investigate the Li2MnO3 crystallographic structure. With an angular step of 0.02° and a scanning rate of 2 /s, the diffraction patterns were scanned from 2 θ 10 to 90 .
High-resolution transmission electron microscopy (HR-TEM) and electron diffraction (ED) (JEOL 2100F, Tokyo, Japan), operating under an accelerating voltage of 200 kV, were used to analyze the morphology and microstructure of Li2MnO3 samples.
The vibrational properties of Li2MnO3 samples were studied by Raman, and Fourier transform infrared (FT-IR) spectroscopies. Raman spectra were acquired from Renishaw Ramascope 2000 Raman microspectrometer, coupled to an Olympus BH-2 optical microscope at room temperature using argon ion laser (514.5 nm wavelength (green)) for excitation. The objective had a numerical aperture of NA = 0.80 and a magnification of 50×. On the sample surface, the laser power was of the order of 1 mW. Each CCD pixel integration time was 50 s. The FT-IR spectra were obtained from Spectrum Two Spectrometer (Perkin Elmer; Waltham, MA, USA) with a resolution of 4 cm−1 over the range of 4000–50 cm−1.

2.2. Calculation Details

The calculations were carried out under the Density Functional Theory (DFT) framework using the plane wave pseudopotential method coded inside the Quantum ESPRESSO computational package [31]. We used the conventional unit cell to represent Li2MnO3, which is composed of four formula units, resulting in a total of 24 atoms (Li8Mn4O12; see Figure 1b). Then, the optimized cell parameters were obtained via DFT by variable-cell relaxation. For Li, Mn, and O atoms, norm-conserving pseudopotentials based on Local Density Approximation (LDA) were selected [32]. We used very tight values for the kinetic energy cutoff, total energy and force tolerance, setting them to 80 Ry, 1 × 10 9 Ry and 1 × 10 5 Ry per Bohr, respectively. In order to sample the reciprocal space, we used the Monkhorst–Pack method [33] with a k-point mesh of 4 × 4 × 4 for the cell model, Li8Mn4O12. Despite the fact that the nature of Li2MnO3 is antiferromagnetic, several reports demonstrated that the effect of various spin configurations on the total formation energies is minimal; therefore, in order to simplify the model, only the ferromagnetic configuration is taken into account when the spin polarization is included in the calculations [13,34,35,36]. The optimized cell parameters and atomic positions were used to construct the electronic density of states (DOS) and the electronic band structure. In order to calculate the vibrational properties, we performed Density Functional Perturbation Theory (DFPT) using the Phonon Package of Quantum ESPRESSO [37]. Using the DFPT linear response approach at the Γ point, the dynamic matrix and frequencies of the harmonic phonon modes were determined. The calculated IR and Raman spectra were represented by a Gaussian function with an FWHM of 10 cm−1. The vibrational modes were visualized with the XCrysDen software [38]. The phonon band structure and phonon DOS were computed by using a q-point mesh of 2 × 2 × 2.

3. Results and Discussion

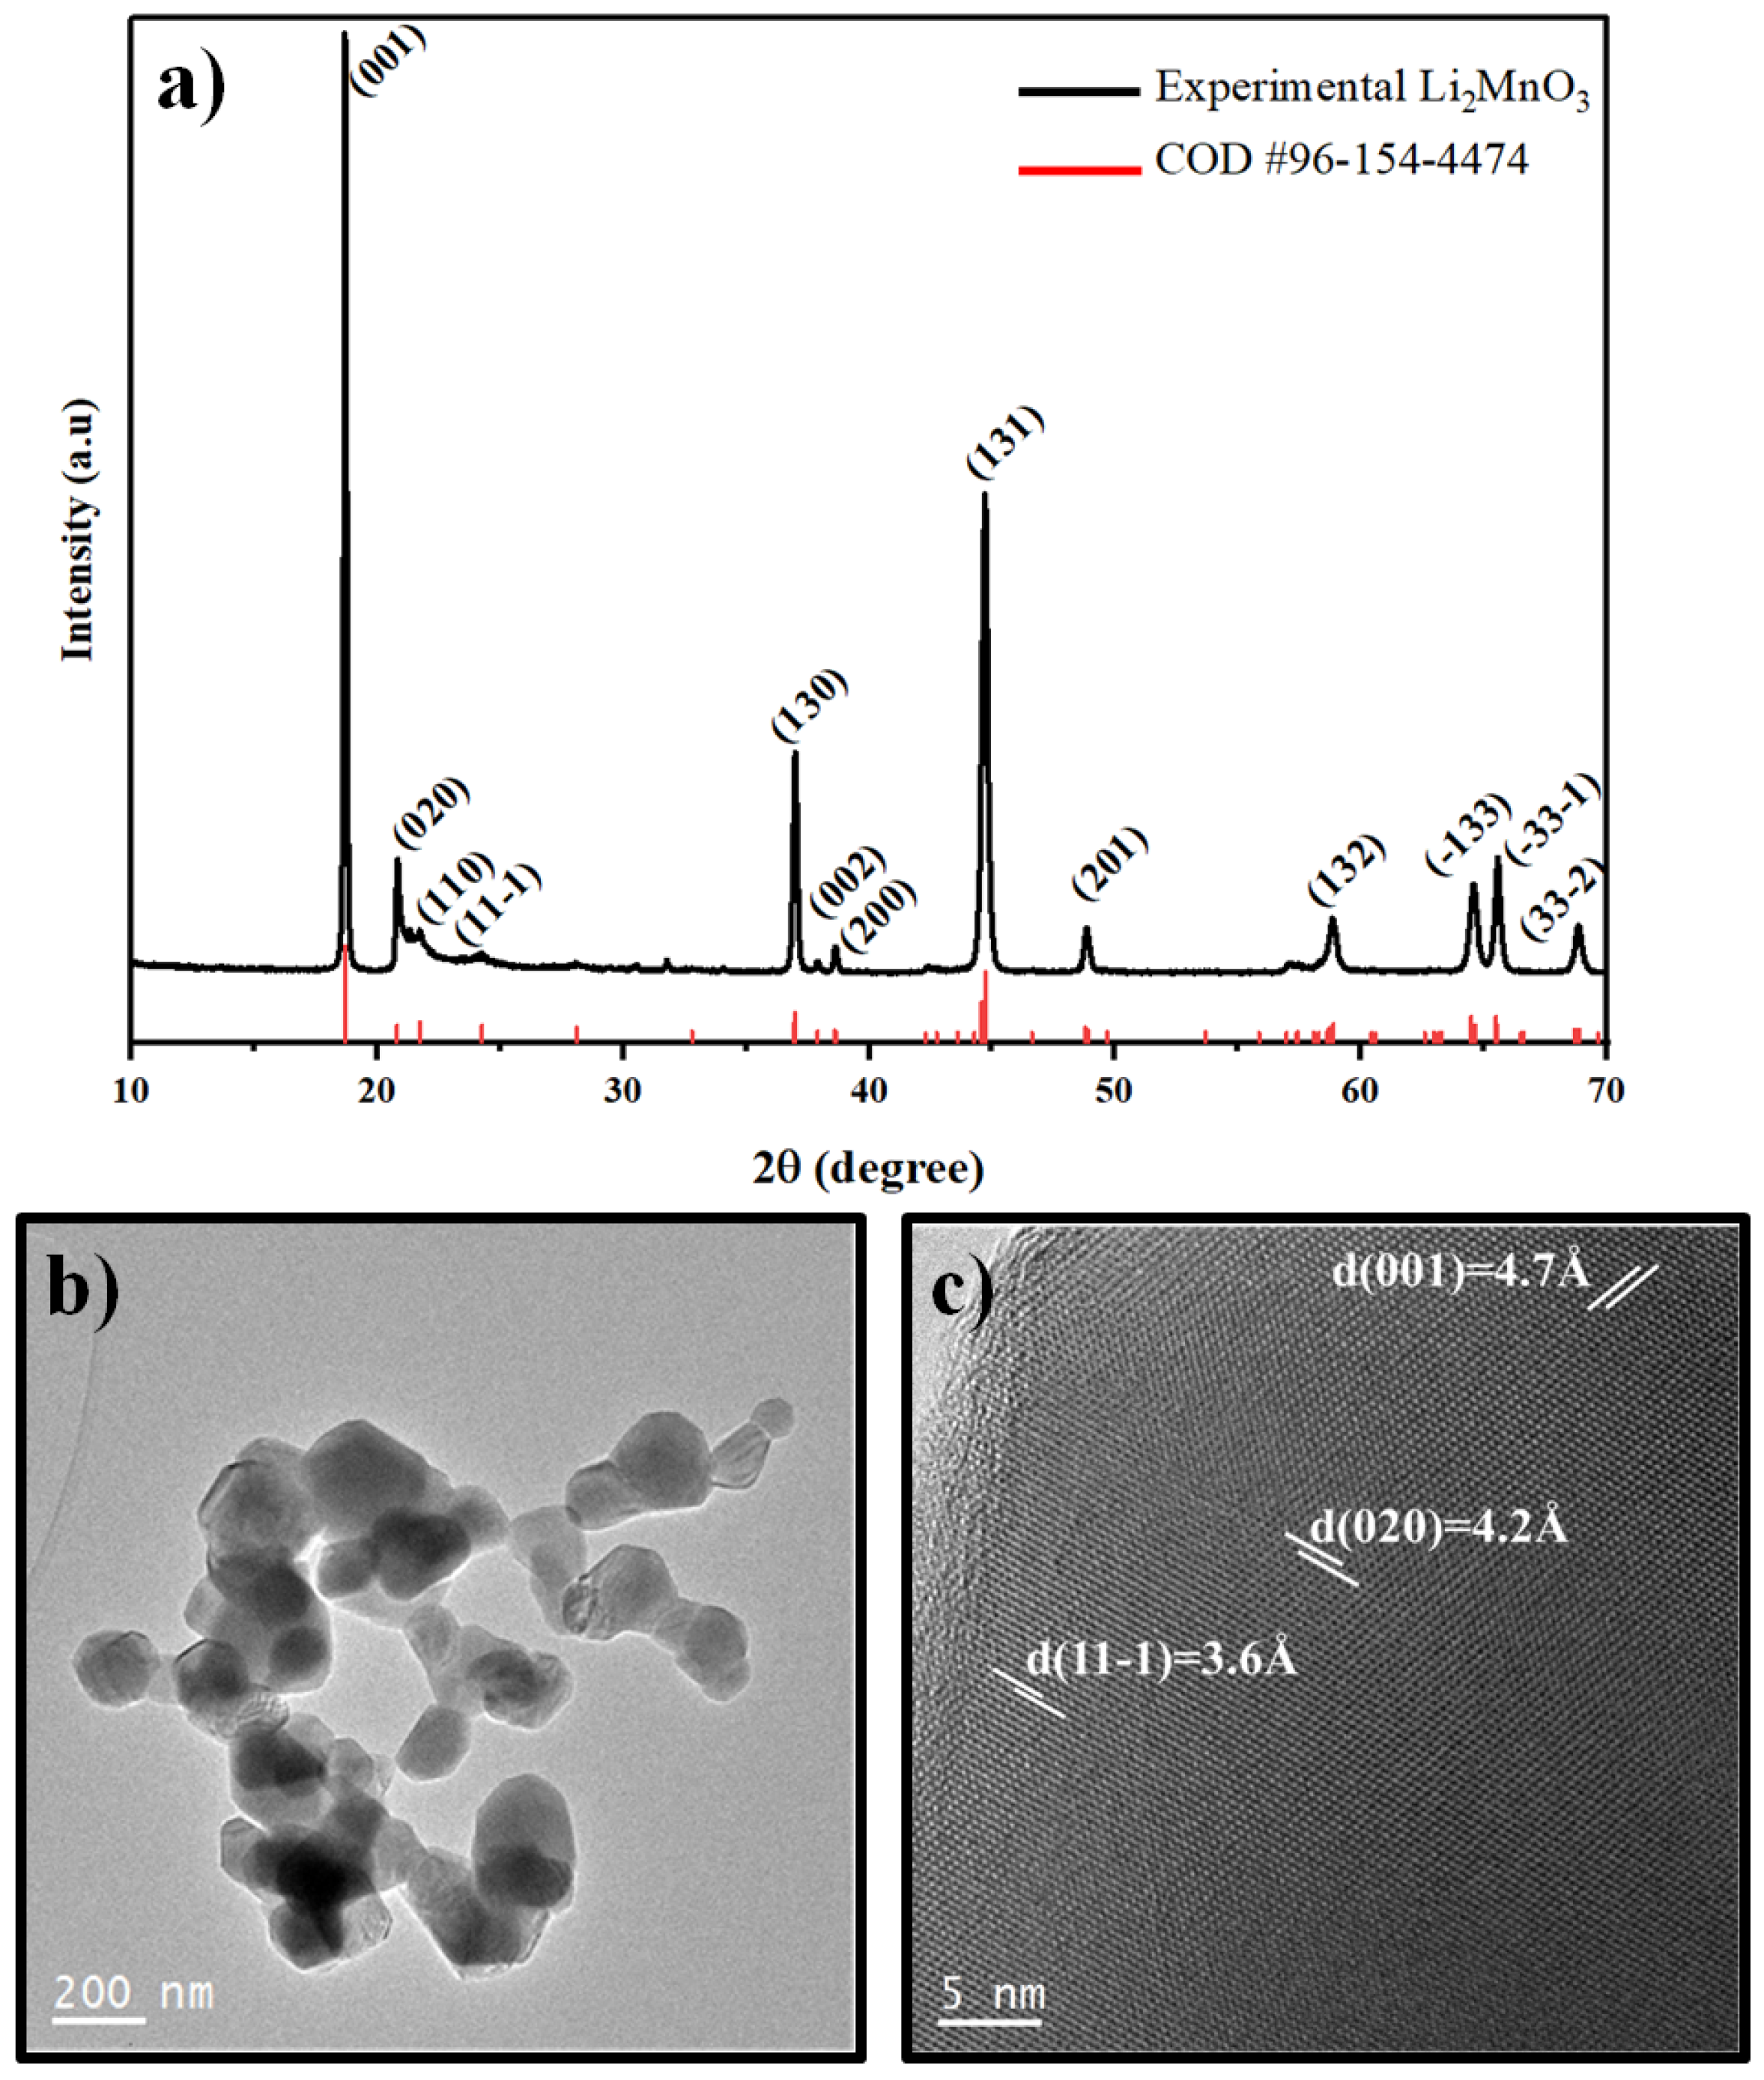
3.1. Characterization of the Li2MnO3 Powder Material

The performance of the LMO is strongly influenced by the crystalline structure, particle size, morphology and specific surface area. Therefore, it is important to conduct a detailed characterization before its application [11]. In order to characterize synthesized Li2MnO3 in terms of crystalline structure, we performed XRD analysis (Figure 2a). The high sharpness and intensity of the experimental peaks are remarkable indicators of the good crystalline nature of the material. Characteristic peaks of monoclinic Li2MnO3 ( C 2 / m spatial group; COD entry # 96-154-4474) [39] can be distinguished. Thus, between 20 and 25 , shoulder-like peaks related to the diffraction of the superlattice of Li2MnO3 are observed [40]. Moreover, the samples display the typical peak splitting between 63–67 , corresponding to the (-133) and (33-1) planes.
HRTEM was used for the local study of the microstructure of LMO. HRTEM images (Figure 2b) show the presence of agglomerated nanoparticles with granular morphology and particle sizes between 100 and 200 nm. Moreover, by analyzing the HRTEM image in Figure 2c, it is possible to identify the [001], [020] and [11-1] zone axes with interplanar spacings of 4.7 Å, 4.2 Å and 3.6 Å, respectively, which correspond to the layered structure Li2MnO3 [11,41].

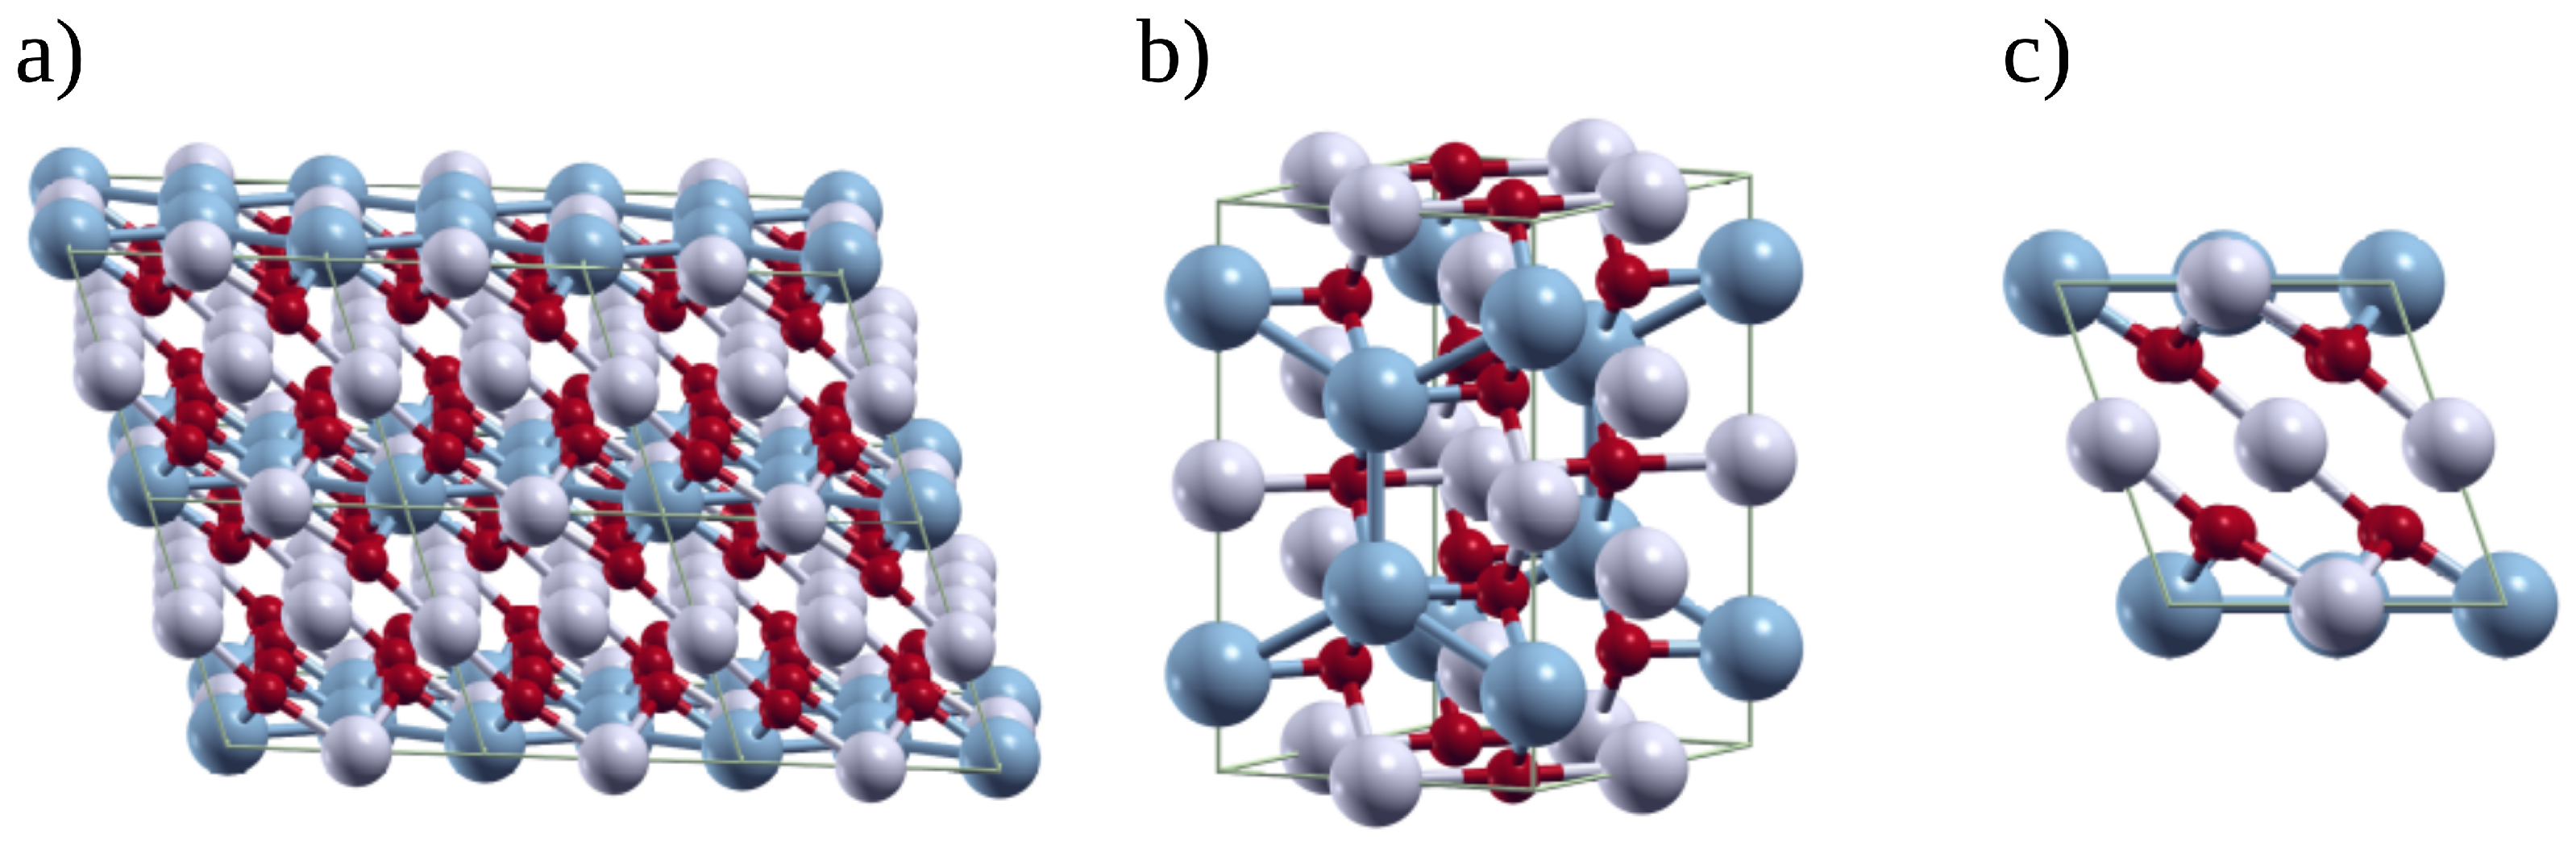
3.2. Optimized Crystal Structure and Electronic Properties of the Li2MnO3

The Li2MnO3 crystal structure exhibits a monoclinic spatial ordering with a space group C 2 / m . The parameters of the conventional unit cell are a = 4.933 Å, b = 8.535 Å, c = 5.026 Å and β = 109.314 ° [42,43]. Herein, the Mn+4 ions are arranged in octahedral 4 g sites, while the lithium-ion, L i + , are spread in 2c and 4h octahedral sites into the [ L i M n 2 ] layer and [ L i + ] layer stack [3]. Thus, we first calculated the structural parameters of the relaxed conventional unit cell of the Li2MnO3 by using the LDA method and compared them to the experimental values (Table 1). On the one hand, the results showed that the calculated lattice parameters a, b and c were underestimated by the LDA method compared to the experimental values by approximately 3%. On the contrary, the β angle (the angle between axes a and c) was slightly overestimated. Despite the fact that LDA has been shown to underestimate the lattice parameters for several types of materials severely, our optimized lattice parameters for the Li2MnO3 present good agreement with the experimental results.
Figure 3 shows the predicted projected density of states (pDOS) and band structure of the Li2MnO3 along with the high-symmetry points of the first Brillouin zone. The Fermi energy level ( E F ) has been set to zero energy. The electronic DOS of the Figure 3 shows an overlap/hybridization between the 3 d state of Mn and the 2 p state of O, which is characteristic of 3 d transition metal oxides [35]. The occupied states at the Fermi level are largely constituted of O 2 p , while the Mn 3 d orbitals contribute more to the conduction bands. The band gap between the lowest conduction and maximum valence levels are 1.65 eV and 1.99 eV for the spin-up and down configuration, respectively, thus assuming a semiconductor behavior. On the other hand, the electronic band structure of Li2MnO3 indicates that both valence band maximum and conduction band minimum are localized at the Γ -point.

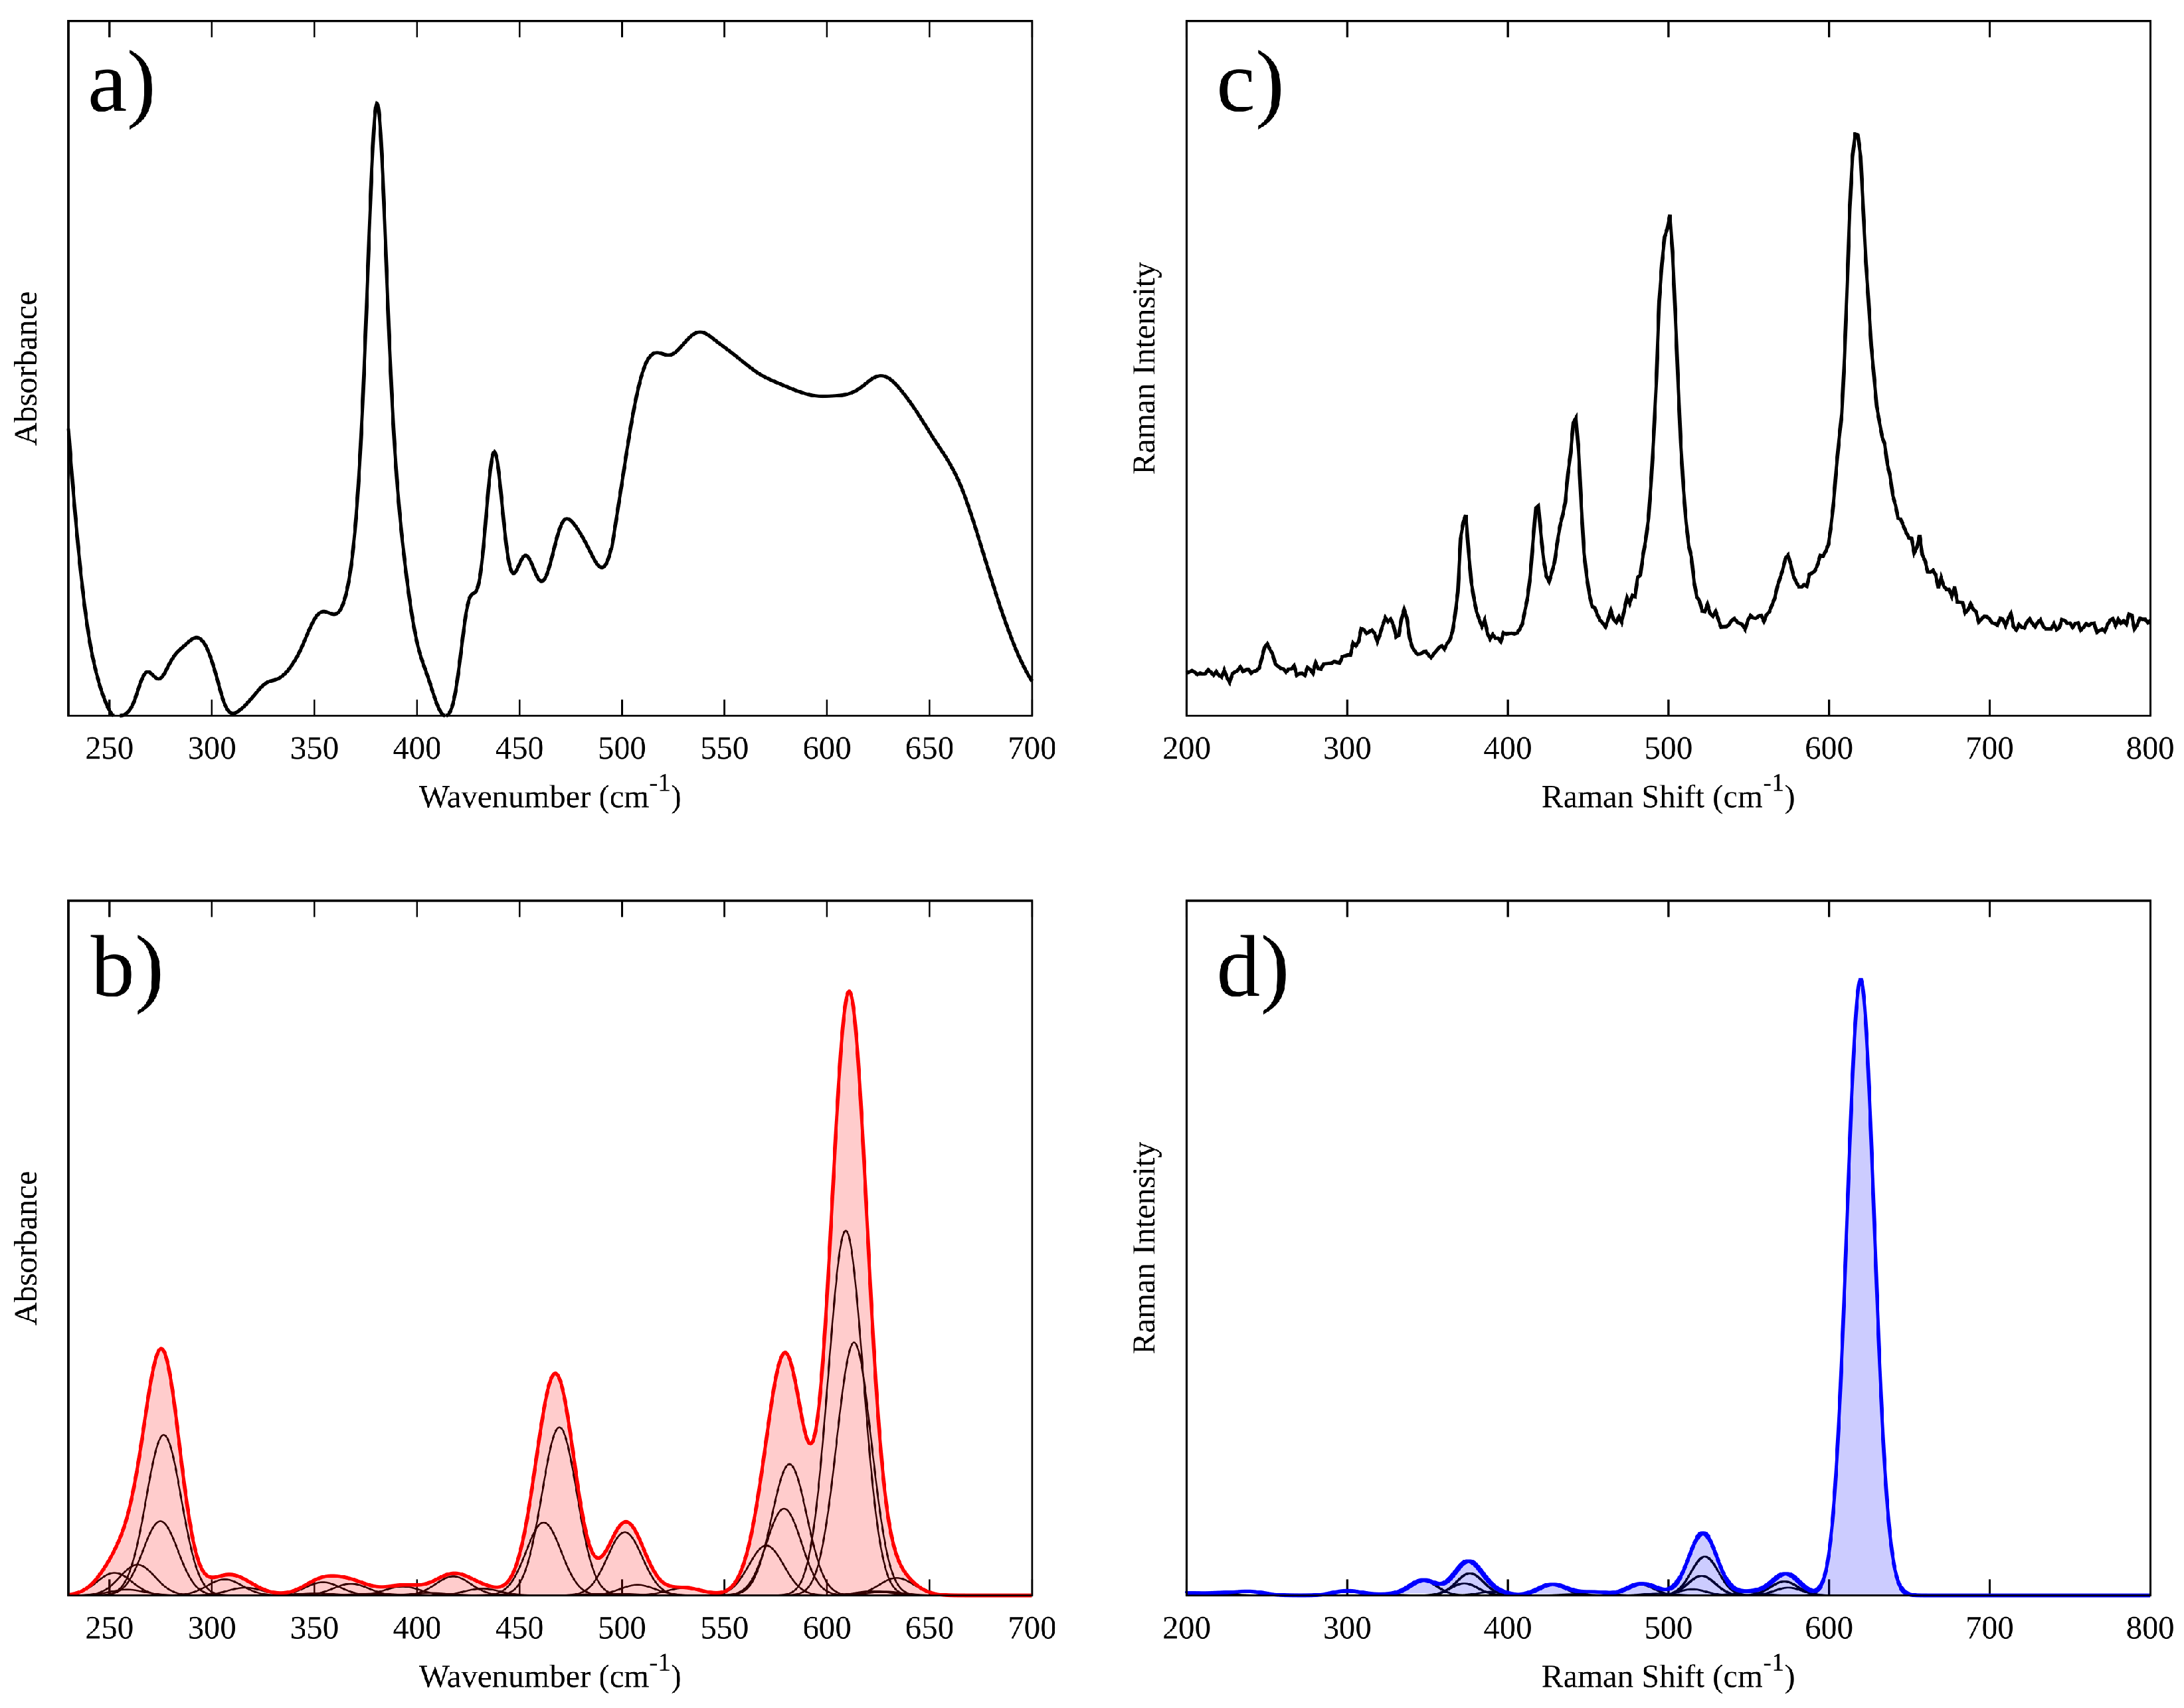
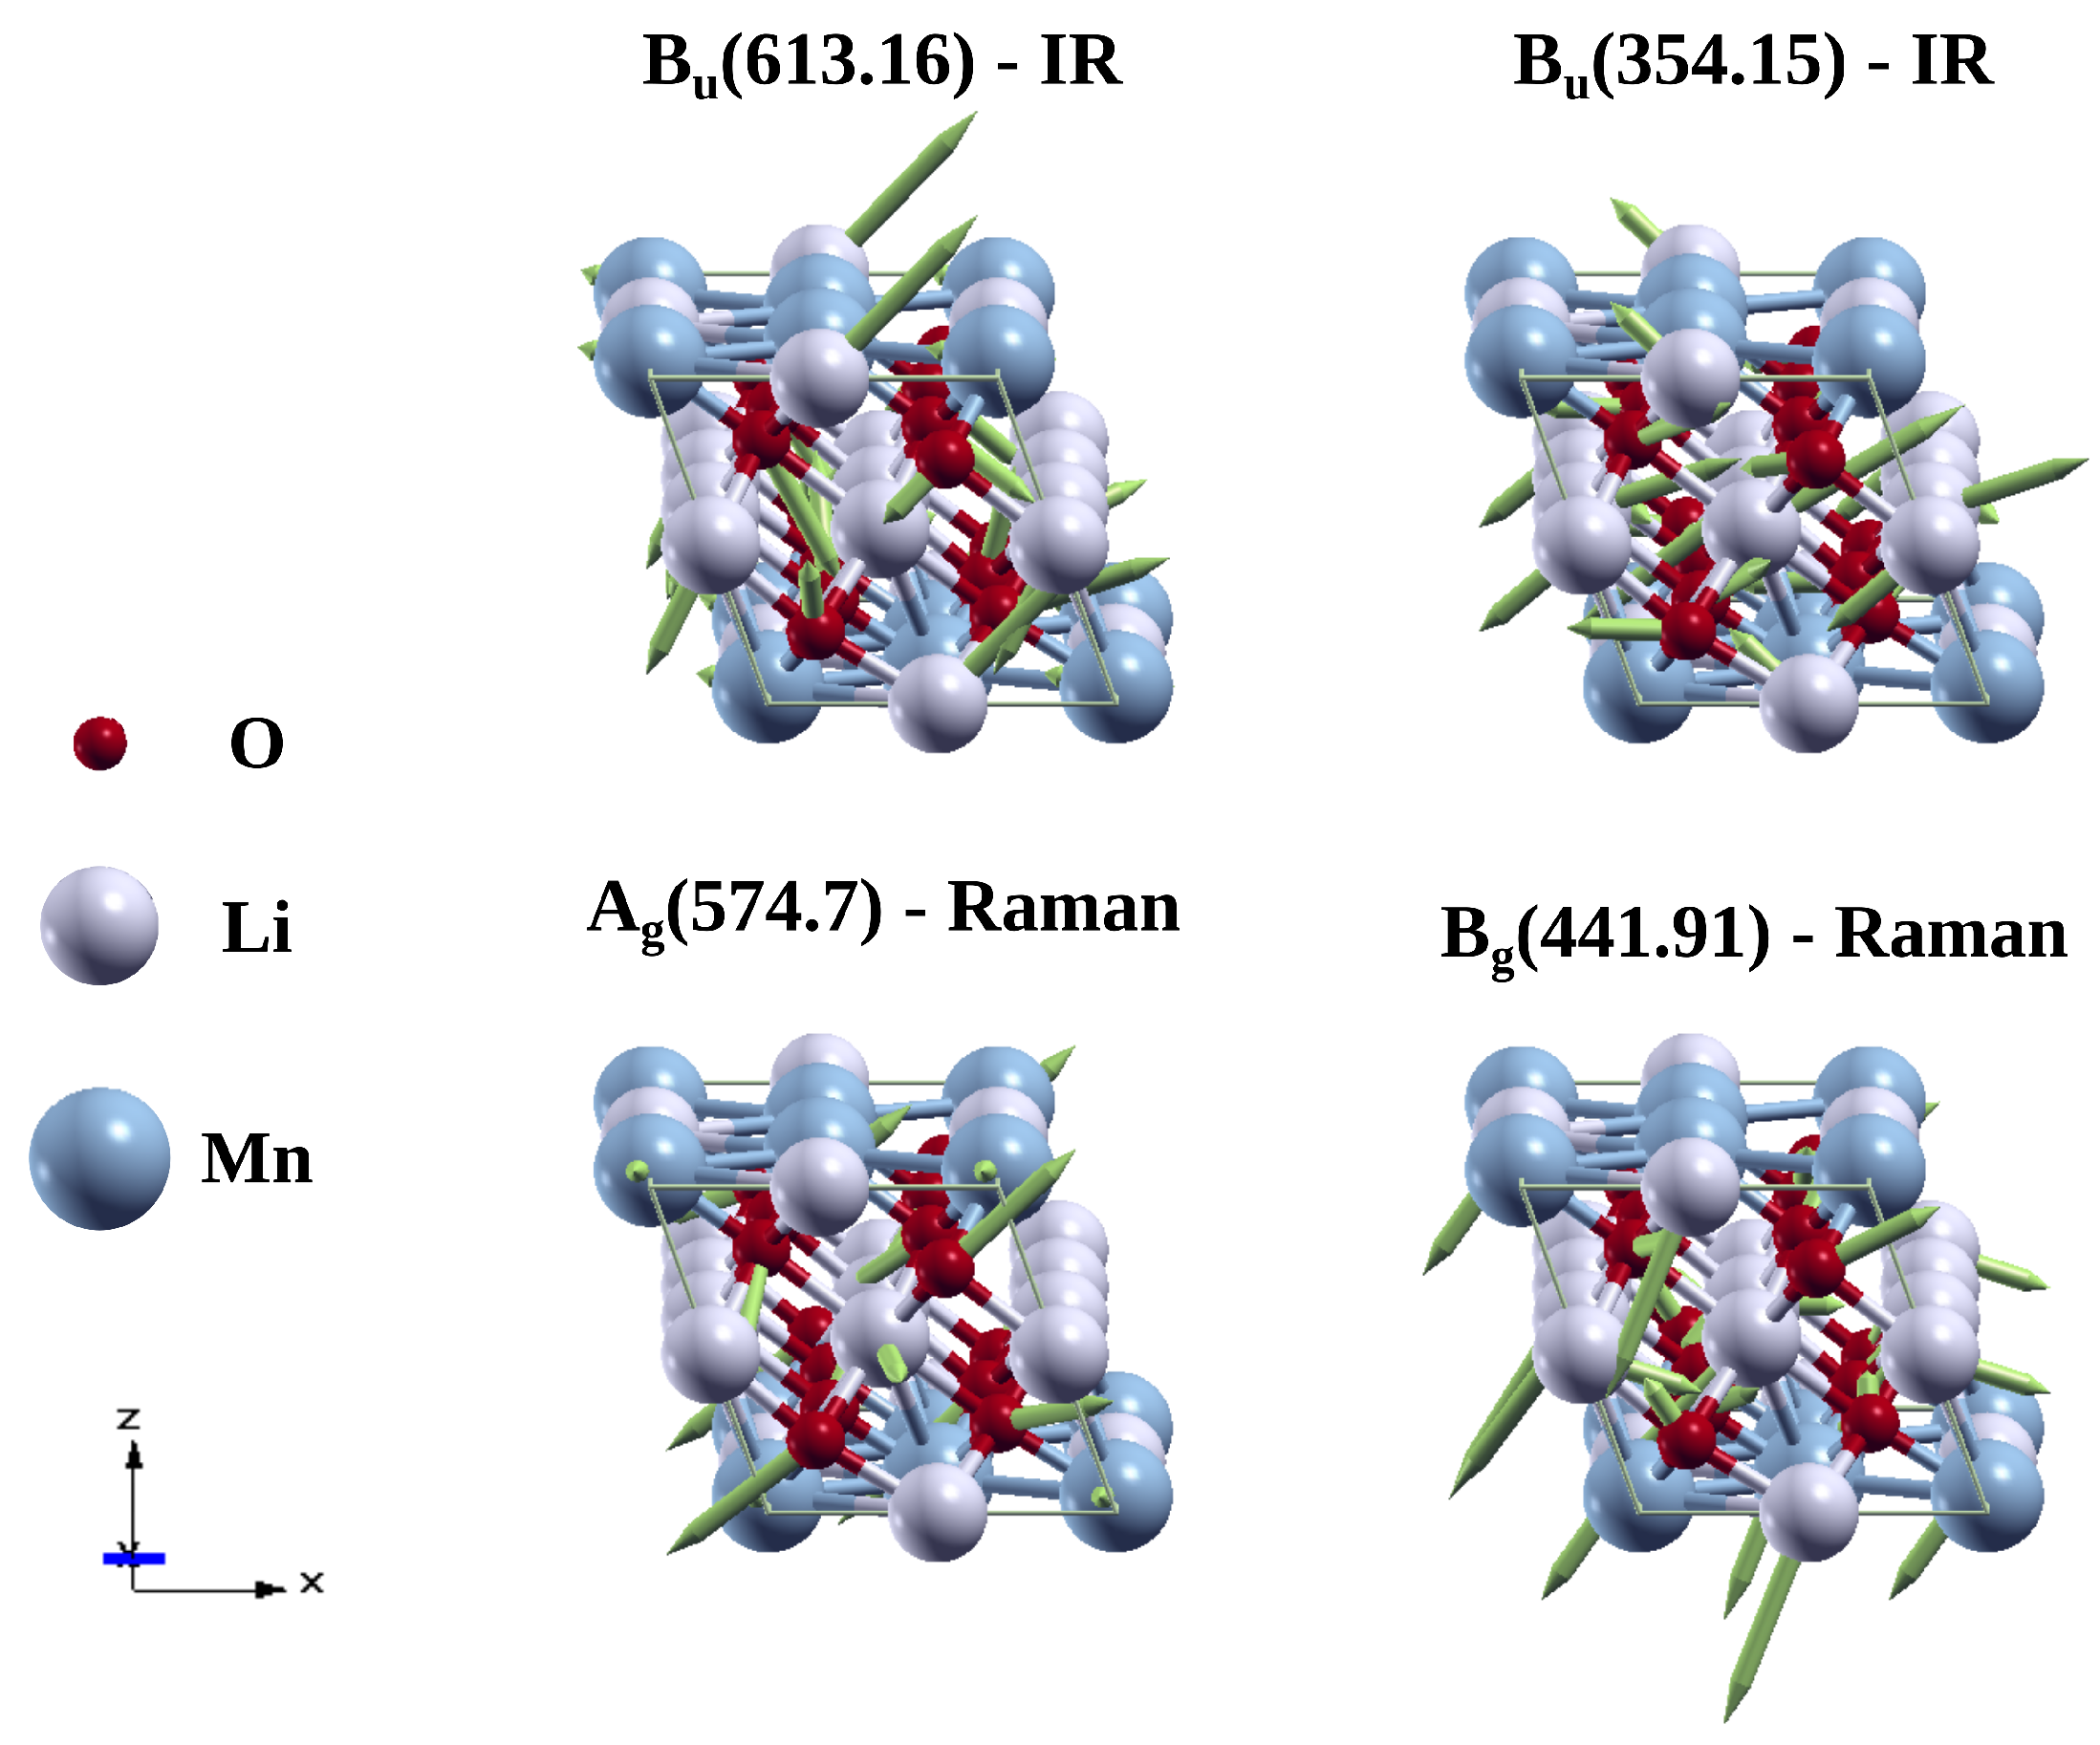
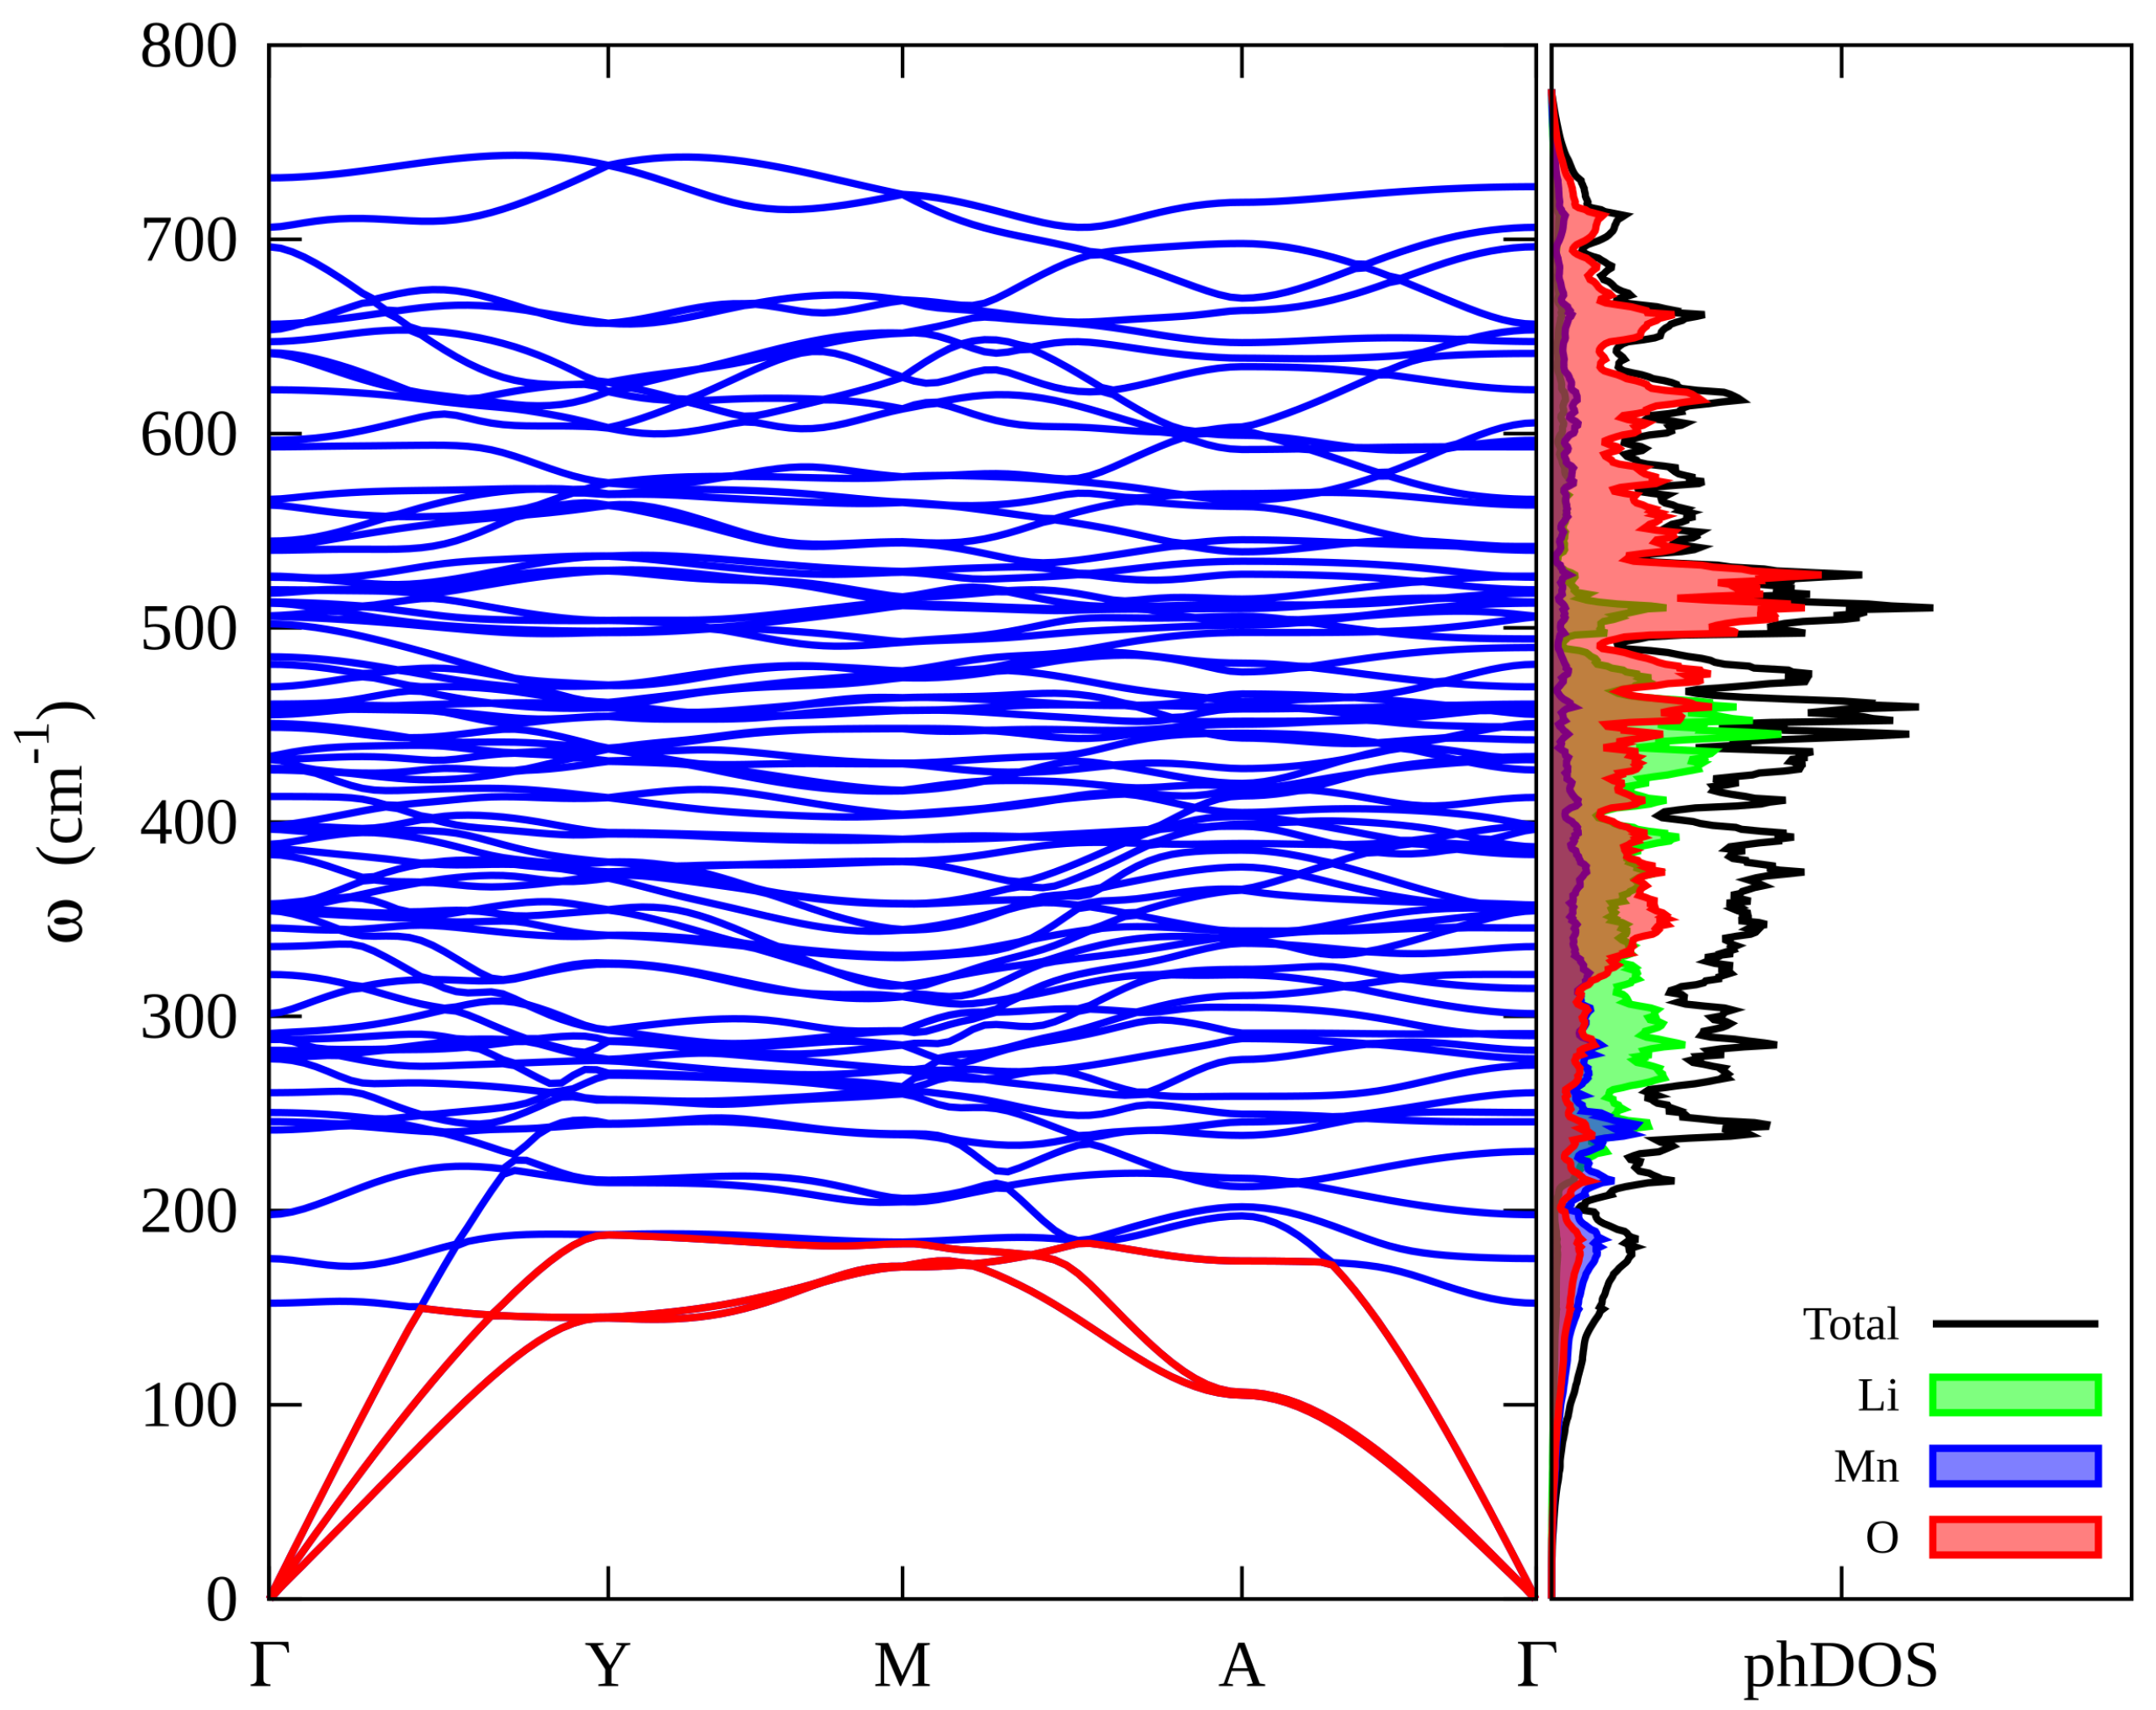
3.3. Vibrational Properties of Li2MnO3

The computed phonon bands dispersion and phonon DOS for Li2MnO3 along the high-symmetry directions of the first Brillouin zone are shown in Figure 4. Importantly, the absence of imaginary frequency modes in the Brillouin zone demonstrates the structural dynamical stability of our model of Li2MnO3 [44,45]. According to the dispersion curves in Figure 4, the highest wavenumber is about 700 cm−1. More interestingly, the phonon band structure of Li2MnO3 does not contain a phonon gap [45]. The phonon DOS for Li2MnO3 is shown on the right-hand of Figure 4. The shaded green, red, and blue areas represent Li, O, and Mn atom phonon partial DOS, respectively. On the one hand, it is evident that the O atom contributes to the overall phonon distribution, dominating the zone with the highest intensities at higher frequencies. Additionally, the phonon distribution of the Mn atom extends to the whole spectrum but with lower intensity than the O atom. Interestingly, there is a hybridization between Mn and O vibrational states at higher frequencies. On the other hand, the phonon distribution of the Li atom mainly contributes to the middle part of the spectrum, ranging from 200 cm−1 to 500 cm−1, suggesting hybridization between Li and O vibrational states in this zone.
The unit cell of Li2MnO3 has 24 atoms. After the software analysis, there are three acoustic and sixty-nine optical modes. Li2MnO3 belongs to the C 2 / m space group (point group C 2 h ), and its irreducible representations at the Brillouin zone point are the following:
Γ a c o u s t i c = A u + 2 B u
Γ o p t i c = 15 A u + 12 A g + 24 B u + 16 B g .
Table 2 and Table 3 show the calculated Γ zone-centered optical phonon frequencies of Li2MnO3. In Li2MnO3, according to the C 2 h point group character table, the A u and B u modes are IR active, whereas the A g and B g modes are Raman active. The lowest and highest phonon frequencies are 173.38 and 668.64 cm−1, respectively, which is consistent with our previous results of the computed phonon dispersion.
The experimental and theoretical IR and Raman spectra are shown in Figure 5. The IR and Raman spectra calculated for Li2MnO3 were based on lattice dynamic simulations. As has been previously shown for other transition metal oxides, in our case, the number of experimental modes is much lower than that expected theoretically due to the three possible circumstances: (i) certain modes have very similar energy; (ii) stronger bands may overlap some weaker bands, and (iii) in spectra of a randomly oriented crystalline material, the relevant bands cannot be resolved properly [46,47].
Figure 5a shows the FT-IR spectra of synthesized Li2MnO3 powder. The sample exhibited strong absorption bands around 500–700 cm−1. Specifically, these bands appear at 514, 537 and 627 cm−1. The major contribution of these bands is related to the asymmetric stretching vibrations of octahedral MnO6 [21,25]. In this range, however, the stretching vibrations of tetrahedral LiO4 groups have also been observed at 650 cm−1 [19] and 350–550 cm−1 [23]. IR spectroscopy investigations of lithium inorganic compounds have demonstrated that the vibrations of MnO6 groups are tightly related to LiOn polyhedral vibrational modes at low and high frequencies (LiO6 and LiO4) [21]. The calculated IR spectra of Li2MnO3 are shown in Figure 5b. Interestingly, the theoretical spectrum shows similar characteristics to the experimental one, with some shifts in the frequency of the main vibrational modes. The results show two IR active modes with high intensity at higher frequencies (550–650 cm−1). Additionally, four intense IR active modes appear at the middle-to-low frequencies zone (250–510 cm−1). The absorption bands around 550–650 cm−1 and 250–510 region are attributed mainly to the MnO6 and LiOn functional groups, respectively, as can be seen in the atomic displacements for the IR vibrations modes of Li2MnO3 (Figure 6). Remarkably, these theoretical results are in agreement with the phonon study, which shows a strong hybridization between Li-O and Mn-O at low and high frequencies, respectively.
Figure 5c shows the typical Raman spectra of the synthesized Li2MnO3 powder. Eight major contributions are resolved with clarity. Strong bands at high frequencies, related to the stretching of Mn-O bond modes that arise from the MnO6 octahedra, are evidenced [48]. Additionally, weak bands in the low-frequency region related to Li-O bonds are observed [49]. The Raman spectra exhibited active Raman bands around 616, 574, 501, 442, 419, 374, 335, and 250 cm−1. Similar results were reported by other authors [49,50]. The calculated Raman spectrum of Li2MnO3 is shown in Figure 5d. Interestingly, the theoretical spectrum shows similar characteristics to the experimental one, showing minor differences in intensities. The results show eight Raman signals. Two main Raman active modes were evidenced at high and middle frequencies around 620 and 522 cm−1. These bands can be assigned to A g and B g modes due to the vibrations of the Mn atoms and the vibrations of Li atoms in the Mn layer, respectively [50,51]. Two representative atomic displacements for the Raman vibration modes of Li2MnO3 are shown in Figure 6. Interestingly, our phonon and Raman simulations are in agreement.

4. Conclusions

In the present study, we have systematically computed the phonon structure, infra-red, and Raman spectra of Li2MnO3 by first-principles calculations. We analyzed its crystal structure, optical phonon frequencies, IR, and Raman active mode and compared them to the experimental findings. By using the LDA exchange functional, we have found an underestimation of the lattice parameters by approximately 3% compared to the experimental one. Moreover, the electronic properties evidenced a semiconductor behavior with a strong hybridization between Mn 3 d and O 2 p states near the Fermi level. From the point of view of the vibrational properties, the phonon band structure of Li2MnO3 does not show a phonon gap. Additionally, the phonon distribution shows that Mn and O vibrational states dominate at higher frequencies, and Li and O atoms mainly contribute to the middle-to-low part of the spectrum. Simulated IR and Raman spectra agree with the experimental data. Thus, this work can be considered helpful for future studies dealing with the vibrational characterization of Li2MnO3 material.

Author Contributions

Conceptualization, R.P., N.N. and M.M.-S.; Experimental analysis, R.P., N.N., R.J.M.-P., G.R.-S., F.A.-R., I.B. and J.H.-M.; Theoretical calculations, R.P., N.N., R.J.M.-P., M.M.-S. and V.R.F.; writing—original draft preparation, R.P. and N.N. All authors have read and agreed to the published version of the manuscript.

Funding

This work was financially supported by CONICYT PFCHA/DOCTORADO/2015-21151648 (Ruth Pulido) and PFCHA/DOCTORADO/2017-21172001 (Nelson Naveas), and with partial funding for accessing research infrastructures granted by project PID2020-112770RB-C22, from the Minisiterio de Ciencia e Innovación (Spain). The simulations used in this paper have been performed in the Centro de Computación Científica-Universidad Autónoma de Madrid (CCC-UAM); thanks to CPU time and other resources granted by the institution.

Institutional Review Board Statement

Not applicable.

Informed Consent Statement

Not applicable.

Data Availability Statement

The data that support the findings of this study are available from the corresponding author upon reasonable request.

Acknowledgments

We recognize PhD programs in “Advanced Materials and Nanotechnologies” from Universidad Autónoma de Madrid (UAM, Spain) and “Ingeniería de Procesos de Minerales” from Universidad de Antofagasta (UA, Chile).

Conflicts of Interest

The authors declare no conflict of interest. The funders had no role in the design of the study, in the collection, analysis, or interpretation of data, in the writing of the manuscript, or in the decision to publish the results.

Abbreviations

The following abbreviations are used in this manuscript:
DFTDensity Functional Theory
DFPTDensity Functional Perturbation Theory
LMOLithium Manganese Oxide
LDALocal Density Approximation
DOSDensity of States
IRInfrared

References

  1. Karrech, A.; Azadi, M.A.; Elchalakani, M.; Shahin, M.A.; Seibi, A.C. A review on methods for liberating lithium from pegmatities. Miner. Eng. 2020, 145, 106085. [Google Scholar] [CrossRef]
  2. Potapenko, A.V.; Kirillov, S.A. Lithium manganese spinel materials for high-rate electrochemical applications. J. Energy Chem. 2014, 23, 543–558. [Google Scholar] [CrossRef]
  3. Pan, H.; Zhang, S.; Chen, J.; Gao, M.; Liu, Y.; Zhu, T.; Jiang, Y. Li- and Mn-rich layered oxide cathode materials for lithium-ion batteries: A review from fundamentals to research progress and applications. Mol. Syst. Des. Eng. 2018, 3, 748–803. [Google Scholar] [CrossRef]
  4. Yu, H.; Naidu, G.; Zhang, C.; Wang, C.; Razmjou, A.; Han, D.S.; He, T.; Shon, H. Metal-based adsorbents for lithium recovery from aqueous resources. Desalination 2022, 539, 115951. [Google Scholar] [CrossRef]
  5. Xu, X.; Chen, Y.; Wan, P.; Gasem, K.; Wang, K.; He, T.; Adidharma, H.; Fan, M. Extraction of lithium with functionalized lithium ion-sieves. Prog. Mater. Sci. 2016, 84, 276–313. [Google Scholar] [CrossRef]
  6. Marincaş, A.H.; Goga, F.; Dorneanu, S.; Ilea, P. Review on synthesis methods to obtain LiMn2O4-based cathode materials for Li-ion batteries. J. Solid State Electrochem. 2020, 24, 473–497. [Google Scholar] [CrossRef]
  7. Mabokela, T.; Nwanya, A.; Ndipingwi, M.; Kaba, S.; Ekwere, P.; Werry, S.; Ikpo, C.; Modibane, K.; Iwuoha, E. Review—Recent Advances on High-Capacity Li Ion-Rich Layered Manganese Oxide Cathodes. J. Electrochem. Soc. 2021, 168, 070530. [Google Scholar] [CrossRef]
  8. Pulido, R.; Naveas, N.; Graber, T.; Martin-Palma, R.J.; Agulló-Rueda, F.; Brito, I.; Morales, C.; Soriano, L.; Pascual, L.; Marini, C.; et al. Hydrothermal control of the lithium-rich Li2MnO3 phase in lithium manganese oxide nanocomposites and their application as precursors for lithium adsorbents. Dalton Trans. 2021, 50, 10765–10778. [Google Scholar] [CrossRef]
  9. Li, Y.; Makita, Y.; Lin, Z.; Lin, S.; Nagaoka, N.; Yang, X. Synthesis and characterization of lithium manganese oxides with core-shell Li4Mn5O12@Li2MnO3 structure as lithium battery electrode materials. Solid State Ionics 2011, 196, 34–40. [Google Scholar] [CrossRef]
  10. Johnson, C.; Li, N.; Vaughey, J.; Hackney, S.; Thackeray, M. Lithium–manganese oxide electrodes with layered–spinel composite structures xLi2MnO3·(1 − x)Li1+yMn2-yO4 (0 < x < 1, 0 ≤ y ≤ 0.33) for lithium batteries. Electrochem. Commun. 2005, 7, 528–536. [Google Scholar] [CrossRef]
  11. Pulido, R.; Naveas, N.; Martín-Palma, R.J.; Graber, T.; Brito, I.; Hernández-Montelongo, J.; Manso Silván, M. Experimental and density functional theory study of the Li+ desorption in spinel/layered lithium manganese oxide nanocomposites using HCl. Chem. Eng. J. 2022, 441, 136019. [Google Scholar] [CrossRef]
  12. Song, Y.; Zhao, X.; Wang, C.; Bi, H.; Zhang, J.; Li, S.; Wang, M.; Che, R. Insight into the atomic structure of Li2MnO3 in Li-rich Mn-based cathode materials and the impact of its atomic arrangement on electrochemical performance. J. Mater. Chem. A 2017, 5, 11214–11223. [Google Scholar] [CrossRef]
  13. Xiao, R.; Li, H.; Chen, L. Density Functional Investigation on Li2MnO3. Chem. Mater. 2012, 24, 4242–4251. [Google Scholar] [CrossRef]
  14. Thackeray, M.M.; Johnson, C.S.; Vaughey, J.T.; Li, N.; Hackney, S.A. Advances in manganese-oxide ‘composite’ electrodes for lithium-ion batteries. J. Mater. Chem. 2005, 15, 2257–2267. [Google Scholar] [CrossRef]
  15. Zhu, Z.; Zhuo, S. Nano layered-spinel 0.8Li2MnO3·0.2LiMn2O4 as high-performance cathode for Li-ion batteries. IOP Conf. Ser. Mater. Sci. Eng. 2020, 733, 012005. [Google Scholar] [CrossRef]
  16. Wei, Y.; Kim, K.B.; Chen, G. Evolution of the local structure and electrochemical properties of spinel LiNixMn2-xO4 (0 ≤ x ≤ 0.5). Electrochim. Acta 2006, 51, 3365–3373. [Google Scholar] [CrossRef]
  17. Zhao, W.; Xiong, L.; Xu, Y.; Xiao, X.; Wang, J.; Ren, Z. Magnesium substitution to improve the electrochemical performance of layered Li2MnO3 positive-electrode material. J. Power Sources 2016, 330, 37–44. [Google Scholar] [CrossRef]
  18. Kim, K.W.; Lee, S.W.; Han, K.S.; Chung, H.J.; Woo, S.I. Characterization of Al-doped spinel LiMn2O4 thin film cathode electrodes prepared by Liquid Source Misted Chemical Deposition (LSMCD) technique. Electrochim. Acta 2003, 48, 4223–4231. [Google Scholar] [CrossRef]
  19. Gao, A.; Hou, X.; Sun, Z.; Li, S.; Li, H.; Zhang, J. Lithium-desorption mechanism in LiMn2O4, Li1.33Mn1.67O4, and Li1.6Mn1.6O4 according to precisely controlled acid treatment and density functional theory calculations. J. Mater. Chem. A 2019, 7, 20878–20890. [Google Scholar] [CrossRef]
  20. Julien, C.M.; Massot, M. Lattice vibrations of materials for lithium rechargeable batteries III. Lithium manganese oxides. Mater. Sci. Eng. B 2003, 100, 69–78. [Google Scholar] [CrossRef]
  21. Julien, C. Local Environment in 4-Volt Cathode Materials for Li-Ion Batteries. In Materials for Lithium-Ion Batteries; Julien, C., Stoynov, Z., Eds.; Springer: Dordrecht, The Netherlands, 2000; pp. 309–326. [Google Scholar] [CrossRef]
  22. Julien, C.; Mauger, A. In situ Raman analyses of electrode materials for Li-ion batteries. AIMS Mater. Sci. 2018, 5, 650–698. [Google Scholar] [CrossRef]
  23. Julien, C.; Massot, M. Structural Transitions in Positive Electrodes for Li-Ion Batteries the Vibronic Approach. Ionics 2002, 8, 6–16. [Google Scholar] [CrossRef]
  24. Julien, C.M.; Massot, M. Raman spectroscopic studies of lithium manganates with spinel structure. J. Phys. Condens. Matter 2003, 15, 3151–3162. [Google Scholar] [CrossRef]
  25. Julien, C.M. Local structure of lithiated manganese oxides. Solid State Ionics 2006, 177, 11–19. [Google Scholar] [CrossRef]
  26. Julien, C.M.; Massot, M. Lattice vibrations of materials for lithium rechargeable batteries I. Lithium manganese oxide spinel. Mater. Sci. Eng. B 2003, 97, 217–230. [Google Scholar] [CrossRef]
  27. Cheng, M.; Tang, W.; Sun, Y.; Zhu, K. Electrochemical properties of Li2MnO3 nanocrystals synthesized using a hydrothermal method. RSC Adv. 2015, 5, 71088–71094. [Google Scholar] [CrossRef]
  28. Dheivamalar, S.; Silambarasan, V. DFT simulations and vibrational analysis of FTIR and FT-Raman spectra of 2-amino-4-methyl benzonitrile. Spectrochim. Acta Part A Mol. Biomol. Spectrosc. 2012, 96, 480–484. [Google Scholar] [CrossRef]
  29. Ratnaparkhe, A.; Lambrecht, W.R.L. Calculated phonon modes, infrared, and Raman spectra in ZnGeGa2N4. J. Appl. Phys. 2020, 128, 075702. [Google Scholar] [CrossRef]
  30. Oreshonkov, A.S.; Sukhanova, E.V.; Popov, Z.I. Raman Spectroscopy of Janus MoSSe Monolayer Polymorph Modifications Using Density Functional Theory. Materials 2022, 15, 3988. [Google Scholar] [CrossRef]
  31. Giannozzi, P.; Baroni, S.; Bonini, N.; Calandra, M.; Car, R.; Cavazzoni, C.; Ceresoli, D.; Chiarotti, G.L.; Cococcioni, M.; Dabo, I.; et al. QUANTUM ESPRESSO: A modular and open-source software project for quantum simulations of materials. J. Phys. Condens. Matter 2009, 21, 395502. [Google Scholar] [CrossRef]
  32. van Setten, M.; Giantomassi, M.; Bousquet, E.; Verstraete, M.; Hamann, D.; Gonze, X.; Rignanese, G.M. The PseudoDojo: Training and grading a 85 element optimized norm-conserving pseudopotential table. Comput. Phys. Commun. 2018, 226, 39–54. [Google Scholar] [CrossRef]
  33. Monkhorst, H.J.; Pack, J.D. Special points for Brillouin-zone integrations. Phys. Rev. B 1976, 13, 5188–5192. [Google Scholar] [CrossRef]
  34. Hoang, K. Defect Physics, Delithiation Mechanism, and Electronic and Ionic Conduction in Layered Lithium Manganese Oxide Cathode Materials. Phys. Rev. Appl. 2015, 3, 24013. [Google Scholar] [CrossRef]
  35. Chen, H.; Islam, M.S. Lithium Extraction Mechanism in Li-Rich Li2MnO3 Involving Oxygen Hole Formation and Dimerization. Chem. Mater. 2016, 28, 6656–6663. [Google Scholar] [CrossRef]
  36. Hoang, K. Doping Li-rich cathode material Li2MnO3: Interplay between lattice site preference, electronic structure, and delithiation mechanism. Phys. Rev. Mater. 2017, 1, 075404. [Google Scholar] [CrossRef]
  37. Giannozzi, P.; Andreussi, O.; Brumme, T.; Bunau, O.; Nardelli, M.B.; Calandra, M.; Car, R.; Cavazzoni, C.; Ceresoli, D.; Cococcioni, M.; et al. Advanced capabilities for materials modelling with Quantum ESPRESSO. J. Phys. Condens. Matter 2017, 29, 465901. [Google Scholar] [CrossRef]
  38. Kokalj, A. Computer graphics and graphical user interfaces as tools in simulations of matter at the atomic scale. Comput. Mater. Sci. 2003, 28, 155–168. [Google Scholar] [CrossRef]
  39. Nakao, Y.; Ozawa, K.; Nemoto, Y.; Uesugi, F.; Fujii, H.; Mochiku, T. Structural variation of Li2MnO3 during charge-discharge cycling. Nippon. Seramikkusu Kyokai Gakujutsu Ronbunshi/J. Ceram. Soc. Jpn. 2015, 123, 589–594. [Google Scholar] [CrossRef]
  40. Shimoda, K.; Oishi, M.; Matsunaga, T.; Murakami, M.; Yamanaka, K.; Arai, H.; Ukyo, Y.; Uchimoto, Y.; Ohta, T.; Matsubara, E.; et al. Direct observation of layered-to-spinel phase transformation in Li2MnO3 and the spinel structure stabilised after the activation process. J. Mater. Chem. A 2017, 5, 6695–6707. [Google Scholar] [CrossRef] [Green Version]
  41. Kaewmala, S.; Limphirat, W.; Yordsri, V.; Kim, H.; Muhammad, S.; Yoon, W.S.; Srilomsak, S.; Limthongkul, P.; Meethong, N. Structural and Electrochemical Kinetic Properties of 0.5Li2MnO3·0.5LiCoO2 Cathode Materials with Different Li2MnO3 Domain Sizes. Sci. Rep. 2019, 9, 427. [Google Scholar] [CrossRef]
  42. Boulineau, A.; Croguennec, L.; Delmas, C.; Weill, F. Structure of Li2MnO3 with different degrees of defects. Solid State Ionics 2010, 180, 1652–1659. [Google Scholar] [CrossRef]
  43. Boulineau, A.; Croguennec, L.; Delmas, C.; Weill, F. Reinvestigation of Li2MnO3 Structure: Electron Diffraction and High Resolution TEM. Chem. Mater. 2009, 21, 4216–4222. [Google Scholar] [CrossRef]
  44. Huang, Y.; Liu, L.; Gao, M. Molecular dynamics study on the Li diffusion mechanism and delithiation process of Li2MnO3. Solid State Ionics 2020, 346, 115195. [Google Scholar] [CrossRef]
  45. Zhang, X.; Zheng, F.; Wu, S.; Zhu, Z. Identifying a Li-rich superionic conductor from charge–discharge structural evolution study: Li2MnO3. Phys. Chem. Chem. Phys. 2021, 23, 4829–4834. [Google Scholar] [CrossRef] [PubMed]
  46. Saraiva, G.; da Silva Filho, J.; Saraiva-Souza, A.; de Castro, A.R.; Teixeira, A.; Luz-Lima, C.; Oliveira, F.; Neto, V.S.; Freire, P.; de Sousa, F. Temperature dependence Raman spectroscopy and DFT calculations of Bi2(MoO4)3. Spectrochim. Acta Part A Mol. Biomol. Spectrosc. 2020, 224, 117340. [Google Scholar] [CrossRef]
  47. Moura, J.; Silveira, J.; da Silva Filho, J.; Souza Filho, A.; Luz-Lima, C.; Freire, P. Temperature-induced phase transition in h-MoO3: Stability loss mechanism uncovered by Raman spectroscopy and DFT calculations. Vib. Spectrosc. 2018, 98, 98–104. [Google Scholar] [CrossRef]
  48. Post, J.; Mckeown, D.; Heaney, P. Raman spectroscopy study of manganese oxides: Tunnel structures. Am. Mineral. 2020, 105, 1175–1190. [Google Scholar] [CrossRef]
  49. Yu, D.Y.W.; Yanagida, K. Structural Analysis of Li2MnO3 and Related Li-Mn-O Materials. J. Electrochem. Soc. 2011, 158, A1015. [Google Scholar] [CrossRef]
  50. Ruther, R.E.; Dixit, H.; Pezeshki, A.M.; Sacci, R.L.; Cooper, V.R.; Nanda, J.; Veith, G.M. Correlating Local Structure with Electrochemical Activity in Li2MnO3. J. Phys. Chem. C 2015, 119, 18022–18029. [Google Scholar] [CrossRef]
  51. Torres-Castro, L.; Shojan, J.; Julien, C.M.; Huq, A.; Dhital, C.; Paranthaman, M.P.; Katiyar, R.S.; Manivannan, A. Synthesis, characterization and electrochemical performance of Al-substituted Li2MnO3. Mater. Sci. Eng. B 2015, 201, 13–22. [Google Scholar] [CrossRef] [Green Version]
Figure 1. (a) A 2 × 1 × 2 super-cell showing the [Li+] and [ L i M n 2 ] layers, (b) the conventional unit cell, and (c) the top view of the monoclinic Li2MnO3 crystal (Li: grey, Mn: blue and O: red).
Materials 15 06237 g001
Figure 2. (a) X-ray diffraction pattern and (b,c) Transmission Electron Microscopy images of the Li2MnO3 powder material used in this study.
Materials 15 06237 g002
Figure 3. Electronic band structure and electronic density of states of Li2MnO3 calculated by LDA. In the electronic band structure, the blue and black bands correspond to the spin-up and down, respectively.
Materials 15 06237 g003
Figure 4. Phonon dispersion and phonon DOS for Li2MnO3 calculated by using the LDA method. In the phonon band structure, the acoustic bands are plotted in red.
Materials 15 06237 g004
Figure 5. Experimental and theoretical IR (a,b) and Raman (c,d) spectra of Li2MnO3.
Materials 15 06237 g005
Figure 6. Atomic displacements for representatives IR and Raman vibrations modes of Li2MnO3 calculated by LDA.
Materials 15 06237 g006
Table 1. Optimized structural parameters of the Li2MnO3 crystal determined by DFT calculations.
a (Å)b (Å)c (Å) β (°)Volume (ų)
LDA4.8058.3084.854109.628182.494
Experimental4.9338.5355.026109.314211.608
Table 2. Experimental and calculated IR modes for the Li2MnO3 crystal determined by DFPT calculations.
Exp. IR freq.(cm−1)Calc. IR freq.(cm−1)SymmetryExp. IR freq.(cm−1)Calc. IR freq.(cm−1)Symmetry
173.38 B u 417.7 B u
181.89 A u 425431.79 A u
184.75 B u 439.87 B u
208.99 B u 437.8461.78 A u
226.19 B u 437.8469.48 B u
252.46 A u 489.38 A u
258.53 B u 498.5 B u
268263.69 B u 501.37 A u
282274.87 A u 514507.57 B u
282276.48 B u 530.38 B u
292306.25 B u 543.95 B u
327316.27 A u 537570.37 A u
334.01 A u 537579.04 B u
352350.02 B u 537581.66 B u
352354.15 B u 627609.12 A u
367.76 B u 627613.16 B u
380378.5 B u 627622.42 A u
393 A u 627628.49 A u
401.78 A u 627633.94 B u
407.29 B u
Table 3. Experimental and calculated Raman modes for the Li2MnO3 crystal determined by DFPT calculations.
Exp. Raman freq.(cm−1)Calc. Raman freq.(cm−1)SymmetryExp. Raman freq.(cm−1)Calc. Raman freq.(cm−1)Symmetry
201.07 A g 482.56 A g
218.24 A g 501493.99 B g
224.08 B g 501514.9 B g
250238.84 B g 501520.66 A g
309300.07 B g 501522.63 A g
324322.81 B g 549.63 B g
335347.34 B g 552.83 B g
374372.87 A g 565.07 B g
374376.47 A g 574572.2 B g
390.11 A g 574574.7 A g
419427.5 A g 616619.61 A g
435.11 B g 623.26 A g
442441.91 B g 668.64 A g
454.22 A g
Publisher’s Note: MDPI stays neutral with regard to jurisdictional claims in published maps and institutional affiliations.

