Article

Resilient Modulus Behavior and Prediction Models of Unbound Permeable Aggregate Base Materials Derived from Tunneling Rock Wastes

1
School of Civil Engineering, Central South University, Changsha 410075, China
2
Urban Rail and Underground Engineering Design and Research Institute, China Railway Siyuan Survey and Design Group Co., Ltd., Wuhan 430063, China
3
MOE Key Laboratory of Engineering Structures of Heavy Haul Railway, Central South University, Changsha 410075, China
*
Author to whom correspondence should be addressed.
Materials 2022, 15(17), 6005; https://doi.org/10.3390/ma15176005
Submission received: 25 July 2022 / Revised: 20 August 2022 / Accepted: 27 August 2022 / Published: 31 August 2022
(This article belongs to the Special Issue Recycled Materials and By-Products for Pavement Construction)

Abstract

:
Tunneling rock wastes (TRWs), which are often open- or gap-graded in nature, have been increasingly recycled and reused for sustainable construction of unbound permeable aggregate base (UPAB) courses with high porosity and desired drainability. However, there is still a lack of sufficient understanding of long-term mechanical stability of such TRW materials subjected to repeated applications of moving wheel loads. This paper aimed to characterize and predict resilient modulus (Mr) behavior of the TRW materials used in unbound permeable aggregate base applications. To achieve this goal, five different UPAB gradations were designed based on the gravel-to-sand ratio (G/S) concept. In order to study their Mr behavior, the laboratory repeated load triaxial tests were conducted under different combinations of confining pressure and deviator stress as controlled by the levels of the shear stress ratio (SSR). The prediction accuracy of fourteen classical Mr prediction models was comparatively analyzed, from which the improved Mr prediction model incorporating gradation and stress variables was proposed for TRW-derived UPAB materials and further validated by external database accordingly. The results show that under the same G/S value and confining pressure level, the higher the SSR is, the greater the final Mr values are, and the more significant the effect of G/S on Mr is. Under the same SSR level, the increase of confining pressure alleviates the effect of G/S on Mr. There appears to exist an optimal G/S value of around 1.6–1.8 that yields the best Mr behavior of the TRW-derived UPAB materials studied. The improved Mr prediction model was verified extensively to be universally applicable. It can potentially contribute to balancing long-term mechanical stability and drainability of TRW-derived UPAB materials through gradation optimization. The findings could provide a theoretical basis and technical reference for cost-effective and sustainable applications of UPAB materials derived from TRWs.

1. Introduction

In recent years, the frequency of occurrence and severity of damage of catastrophic weather events, including heavy precipitation and urban flooding (known as the El Niño phenomenon), have increased significantly around the global [1,2,3]. In order to mitigate flooding risks and related damages, the initiative of sponge cities has been widely enforced, where the construction of permeable pavements has emerged as one of the effective alternatives to enhance drainage capacity of urban road networks [4,5,6]. As compared to traditional impervious or low-permeability pavement structures constructed with dense-graded materials, permeable pavement layers constructed with open-graded materials feature larger porosity and better-connected pore structure, as well as the resulting advantages of improved drainability, skid resistance, and sound-absorbing and noise-reducing abilities [7,8,9,10,11]. As tunneling rock wastes (TRWs) are being increasingly produced and stockpiled, the sustainable recycling and reuse of such open- or gap-graded waste materials in permeable pavement construction becomes a major socioenvironmental concern and thus deserves in-depth research efforts. The majority of the existing research studies in the literature focused on the permeability, stability, and durability of permeable surface courses such as open-graded friction courses (OGFCs) [12], pervious Portland cement concrete (PCC) courses [13], porous asphalt concrete (AC) courses, and permeable wearing courses [14], while relatively few research studies were conducted on unbound permeable aggregate base (UPAB) materials with open gradation and high porosity for use underneath AC or PCC surface courses [15], particularly those for use in unsurfaced low-volume roads [16]. As a critical pavement layer, UPAB materials, in essence, serve the three major functionalities (denoted as “3Ps” for brevity), i.e., providing uniform and stable support for surface layers, protecting underlying subbase layers and/or subgrade soils, and promoting rapid drainage of excessive water out of pavement structures. However, high porosity and adequate permeability of UPAB often lead to insufficient bearing capacity and deformation stability [17], and previous studies barely resolved the challenging task of maximizing the drainage performance while maintaining desired mechanical stability. Resilient modulus (Mr) of UPAB materials reflects the deviator stress-resilient strain relation, which is typically nonlinear and stress-dependent in nature, under the repeated applications of moving wheel loading [18,19]. It has become an important mechanical property and input parameter for mechanistic pavement design [20,21]. Therefore, it is of great significance to investigate resilient modulus characteristics of UPAB materials for further extending their use in higher-volume roads where their mechanical stability and durability are as important as drainage performance.
Generally speaking, there currently exists three main types of methods for determining Mr of unbound granular materials including UPAB materials, i.e., indirect back-calculation from falling weight (or lightweight) deflectometer measurements [22], direct measurement from laboratory repeated load triaxial tests [23], and indirect estimation from empirical or mechanistic–empirical predictive models [24]. As compared to the back-calculation method with heavy field-testing workload and uncontrollable field uncertainties and errors, the determination of Mr from laboratory repeated load triaxial tests is the most accurate and can capture the sensitivity of Mr to stress states and physical conditions (e.g., gradation, moisture, and compaction levels). The mechanistic–empirical Mr prediction models established accordingly from laboratory triaxial testing results are increasingly used as well.
Previous studies on laboratory repeated load triaxial tests of Mr of conventional dense-graded unbound granular materials were reported in the literature [25,26,27]. It was found that quantifying the influences of critical factors such as gradation, stress state, and moisture content on Mr is indispensable. The particle shape, aggregate source, and the maximum particle size (Dmax) were reported to significantly affect the mechanical properties of unbound aggregate base materials [28]. Greater Mr values were observed for unbound aggregate specimens containing coarser particles as compared to specimens containing finer particles [29]. The Mr values of angular aggregates with rough surfaces are greater than those of rounded aggregates with smooth surfaces [30]. The influence of stress states on Mr is complex and often mixed with those of material physical properties such as gradation, particle shape, moisture content, and degree of compaction [31]. Previous studies showed that Mr is influenced primarily by stress states, e.g., it increases significantly with increasing confining pressure [32,33,34,35,36]. It also increases with increasing loading frequency. When the loading frequency is low, Mr increases rapidly and then gradually transits to increase steadily with increasing frequency [37]. As the amplitude of cyclic deviator stress increases, Mr first increases linearly and then gradually transits to increase steadily [38]. As compared to stress states, material physical properties play a relatively secondary role in Mr of unbound granular materials. As seen from the above survey of the related literature, the strong dependency of Mr of conventional unbound granular materials on stress states and physical properties has been well studied in the past few decades; however, few studies have been conducted to characterize resilient modulus behavior of UPAB materials or optimize their gradations for balancing resilient modulus and drainage performance.
Despite that Mr characteristics of UPAB materials could be accurately obtained from laboratory repeated load triaxial tests, it is not practically affordable to run such time-consuming, labor-intensive tests for routine pavement design on a daily basis with widely varying combinations of major influential factors exhausted (e.g., gradation, stress state, and moisture content), partly because such tests require costly triaxial apparatus and well-trained personnel. Therefore, a variety of purely empirical correlations, complex elastoplastic constitutive models, and mechanistic–empirical predictive models have been developed in the literature to estimate Mr with different levels of accuracy. The initial Mr prediction models merely considered the influence of one single factor (e.g., confining pressure σ3, deviatoric stress σd, or the first principal stress invariant I) [39,40,41], among which the one proposed by Seed [42] based on the first principal stress invariant was a particular example. Although Seed’s model is simple in its formula and applications, it still has the dimension problem. The Mr prediction models considering multiple factors were subsequently proposed, of which a few well-known examples can be named herein. Uzan [43] proposed an Mr prediction model considering both the first principal stress invariant and the deviatoric stress. It resolved the dimension problem, but encountered the new problem of indeterminate Mr value for zero octahedral shear stress. Ni et al. [44] further modified Uzan’s model [43] by adding the constant of 1 to both confining pressure and deviatoric stress terms, which not only improved the accuracy of the model but also solved the problems of indeterminate modulus value and the modulus dimension. Those single-factor or two-factor Mr prediction models were then applied in many studies [45,46,47], where the majority of them were found to be applicable only for fine-grained soils and only a few of them were applicable for unbound aggregate base materials [45,48,49]. Dan et al. [50] carried out a series of cyclic loading triaxial tests, quantitatively analyzed the water sensitivity of Mr of unbound aggregate materials under different stress states, and then established an improved nonlinear Mr prediction model. Ekblad [29] reported that the modified Uzan (K-θ) model is the best-fitting model for unbound granular materials. Among the existing Mr prediction models, few of them addressed gradation variations, particularly nontraditional open gradations. Therefore, it becomes indispensable to bridge such knowledge gaps.
In this study, five different TRW-derived UPAB gradations were first designed according to the gravel-to-sand ratio (G/S) concept proposed based on particle packing theory, along with the conventional dense gradation for comparison. Second, different combinations of confining pressure and cyclic deviator stress were generated by controlling the levels of the shear stress ratio (SSR), followed by laboratory repeated load triaxial tests under different stress paths. Note that the SSR is defined as the ratio of induced shear stress to shear strength of a specific granular material of interest, and its permanent deformation behavior can be allegedly controlled by limiting the SSR value [51,52]. Third, the influences of gradation variations and stress states on Mr characteristics of such TRW-derived UPAB materials were quantitatively analyzed. Finally, the prediction accuracy of fourteen different flagship Mr prediction models surveyed from the literature was compared and analyzed for all the 60 TRW-derived UPAB specimens tested. Accordingly, the modified Mr prediction model incorporating both gradation and stress state parameters was proposed, with its accuracy verified by external laboratory testing database. The findings could provide theoretical basis and technical reference for cost-effective and sustainable applications of TRW-derived UPAB materials in lower-carbon-emission, permeable pavement construction.

2. Materials and Laboratory Testing Program

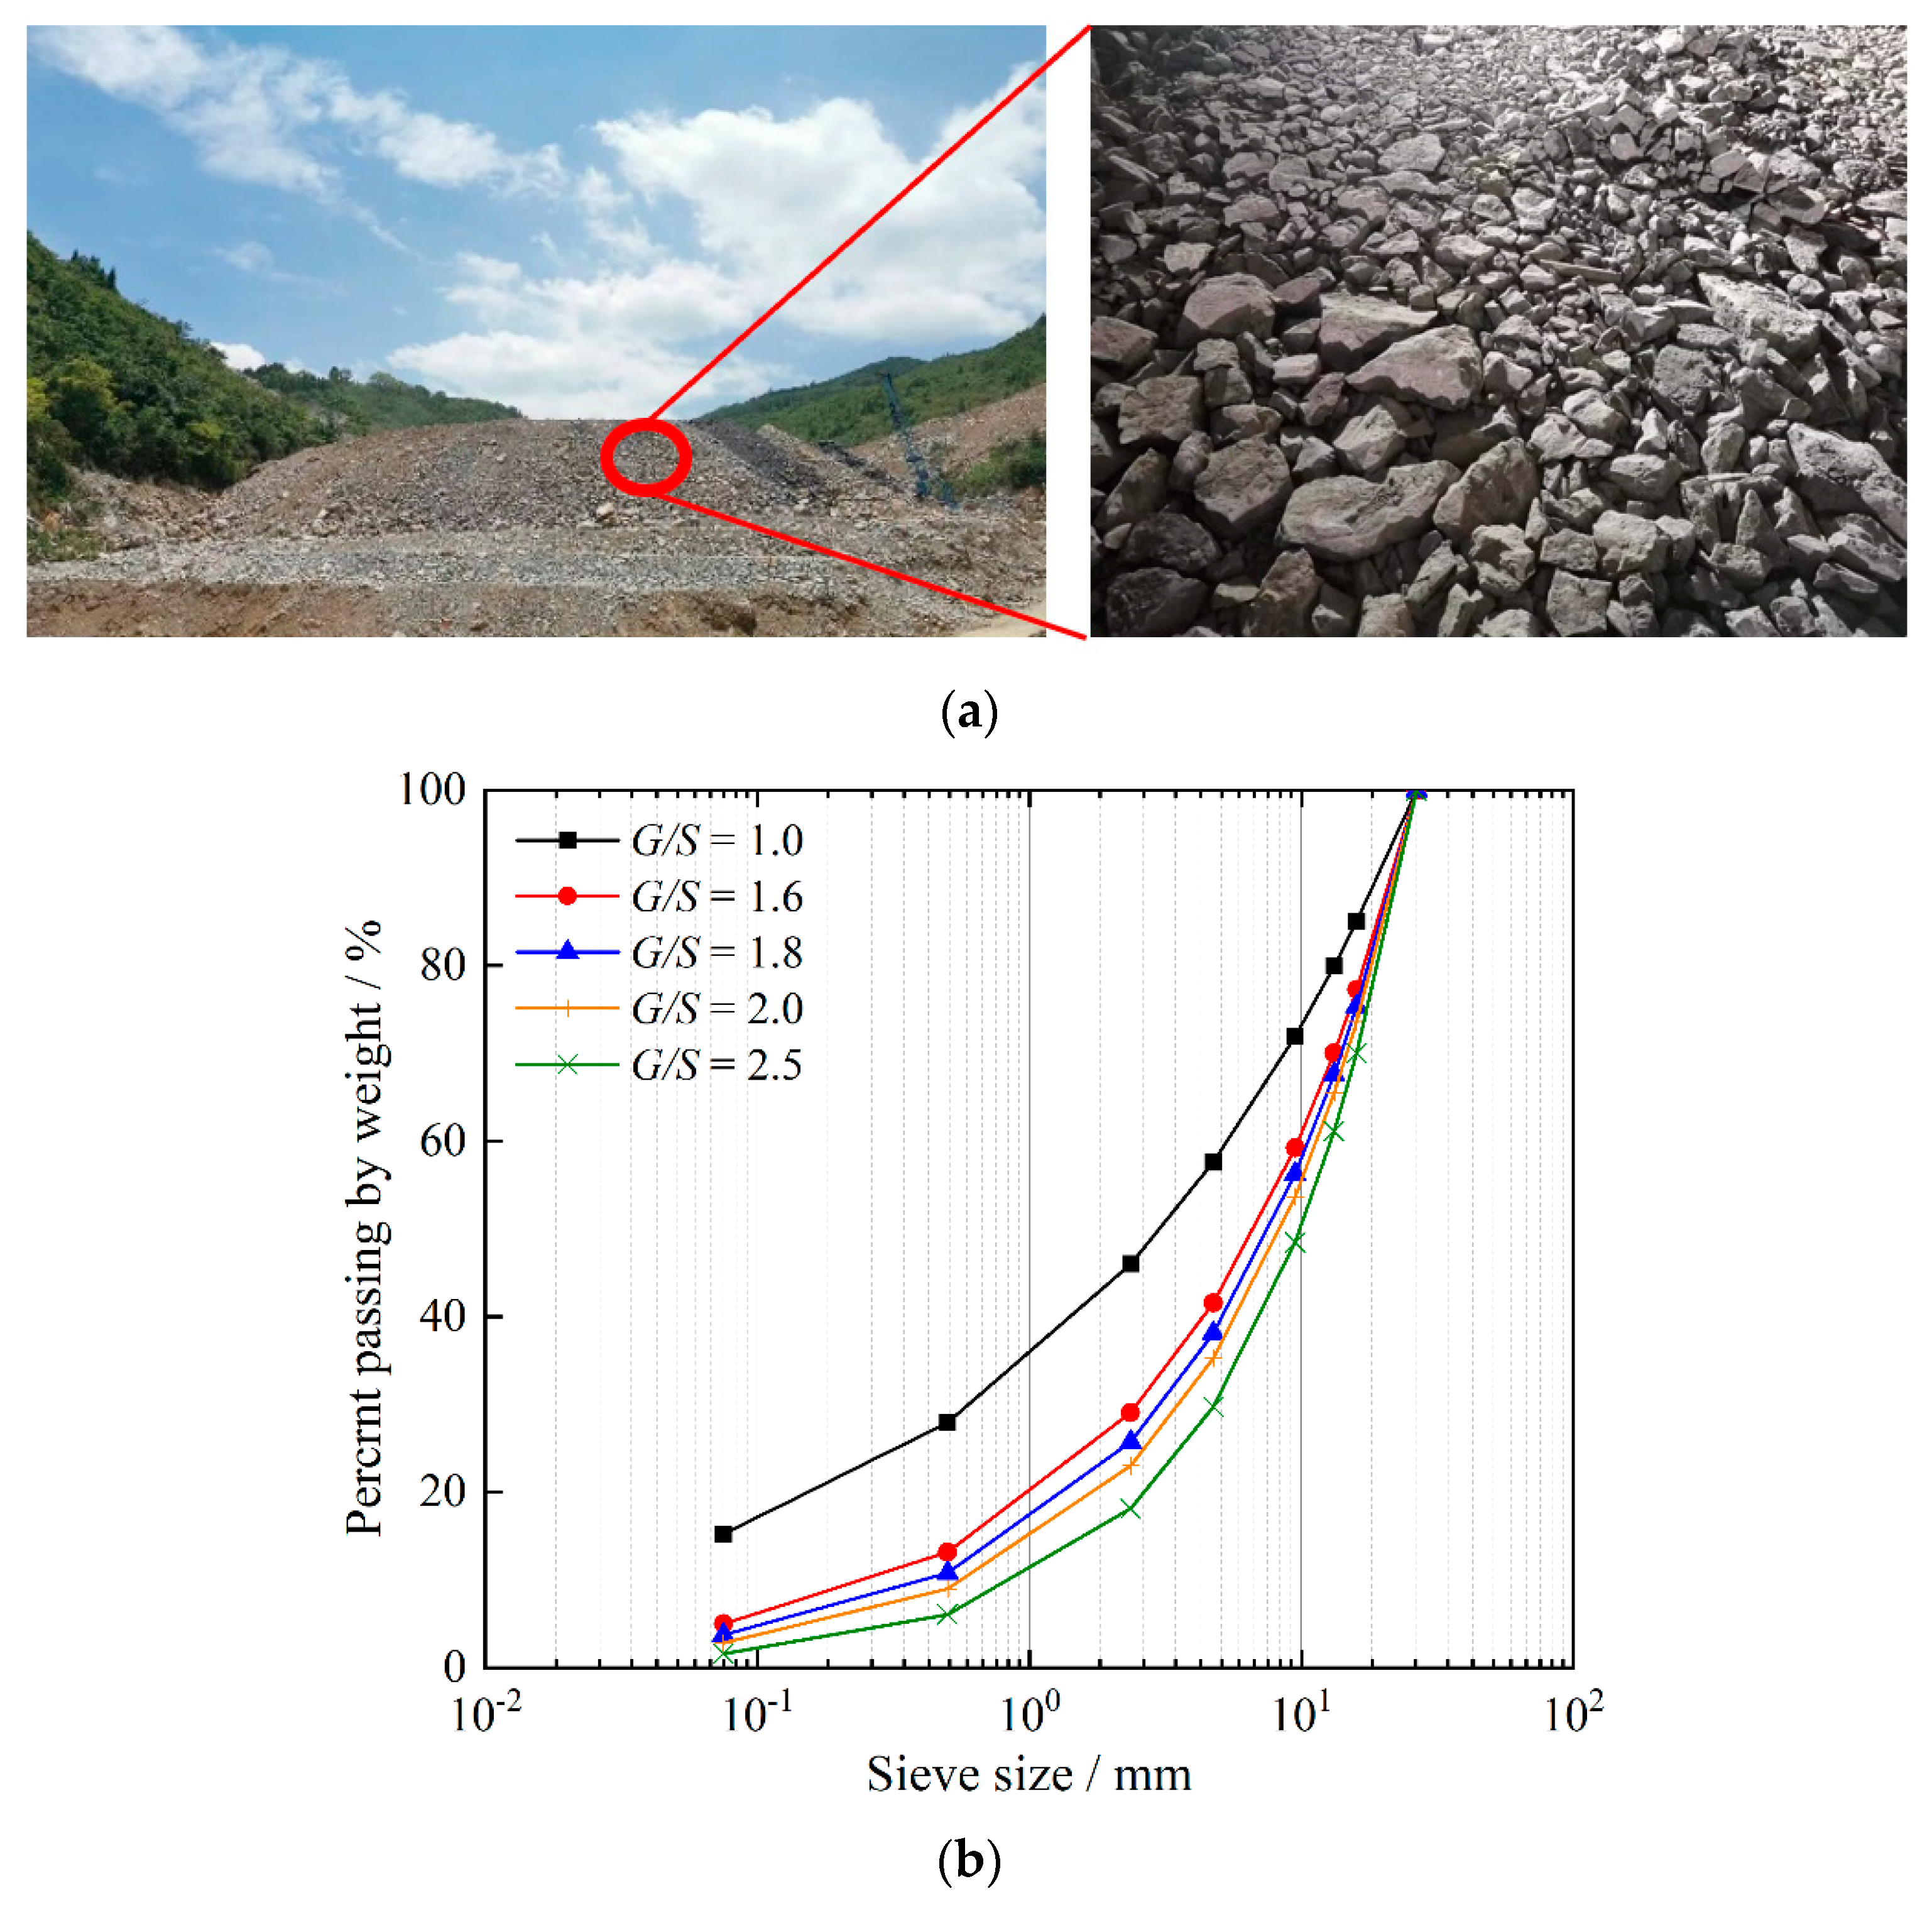
2.1. Materials Tested

The unbound aggregate materials used in the laboratory tests, as shown in Figure 1a, were sampled from a disposal facility of tunneling rock wastes in the suburb of Changsha, Hunan Province, and the lithology of these materials is limestone. A total of five different gradations were designed and controlled using the gravel-to-sand ratio (G/S) concept proposed previously [53] to represent UPAB materials with varying particle-packing structures and thus permeability levels. It is worth noting that the G/S concept was proposed based on the packing theory and has been verified extensively for its applicability to unbound granular materials, of which more details can be found elsewhere [53]. The G/S parameter calculated accordingly via Equations (1) and (2) was found to control key mechanical properties (e.g., shear strength and permanent deformation) of unbound aggregates reasonably well [53]. Note that the parameters Dmax and n in Equation (1) are fitted from the gradation data by the Talbot function in Equation (2), where all the sieve sizes and related percentages of materials passing those sieves ought to be used.
G S = 1 P 4.75 1 ( 1 P 4.75 ) P 0.075 = D max n 4.75 n 4.75 n 0.075 n
P i = ( d i D max ) n
where P i is the percentage of materials passing the i-th sieve (%); d i is the opening aperture size of the i-th sieve (mm); D m a x is the maximum particle size (mm); and n is the shape parameter of the particular gradation curve, and it can be calculated from the given G/S value as per Equation (1), or be fitted from the gradation data by the Talbot function in Equation (2). It is worth noting that the n value was obtained by using the former method in this paper.
In order to follow related Chinese design codes [54] and avoid size effects for triaxial tests [55,56], the maximum particle size was determined to be 26.5 mm. In this study, a suitable gradation band with a maximum particle size of 26.5 mm was chosen, which is also qualified for use as unbound permeable aggregate gradations according to the Chinese technical specifications for highway pavement base construction [54,57]. Within this chosen gradation band, the corresponding G/S values range from 1.57–2.8. As plotted in Figure 1b, a total of five different gradation curves were selected from this gradation band to prepare TRW-derived UPAB specimens, and their G/S values were calculated to be 1.0, 1.6, 1.8, 2.0, and 2.5, respectively. The gradation curves with the G/S values of 1.6, 1.8, 2.0, and 2.5 represented low-, medium-, and high-level permeability, whereas the one with the G/S value of 1.0 served as the baseline against which the other four were compared due to its extremely low permeability. The G/S range of 1.0–2.5 studied is believed to well cover typical gradations of unbound aggregates used in pavement base construction practices. The related parameters of the gradation design scheme are summarized in Table 1.

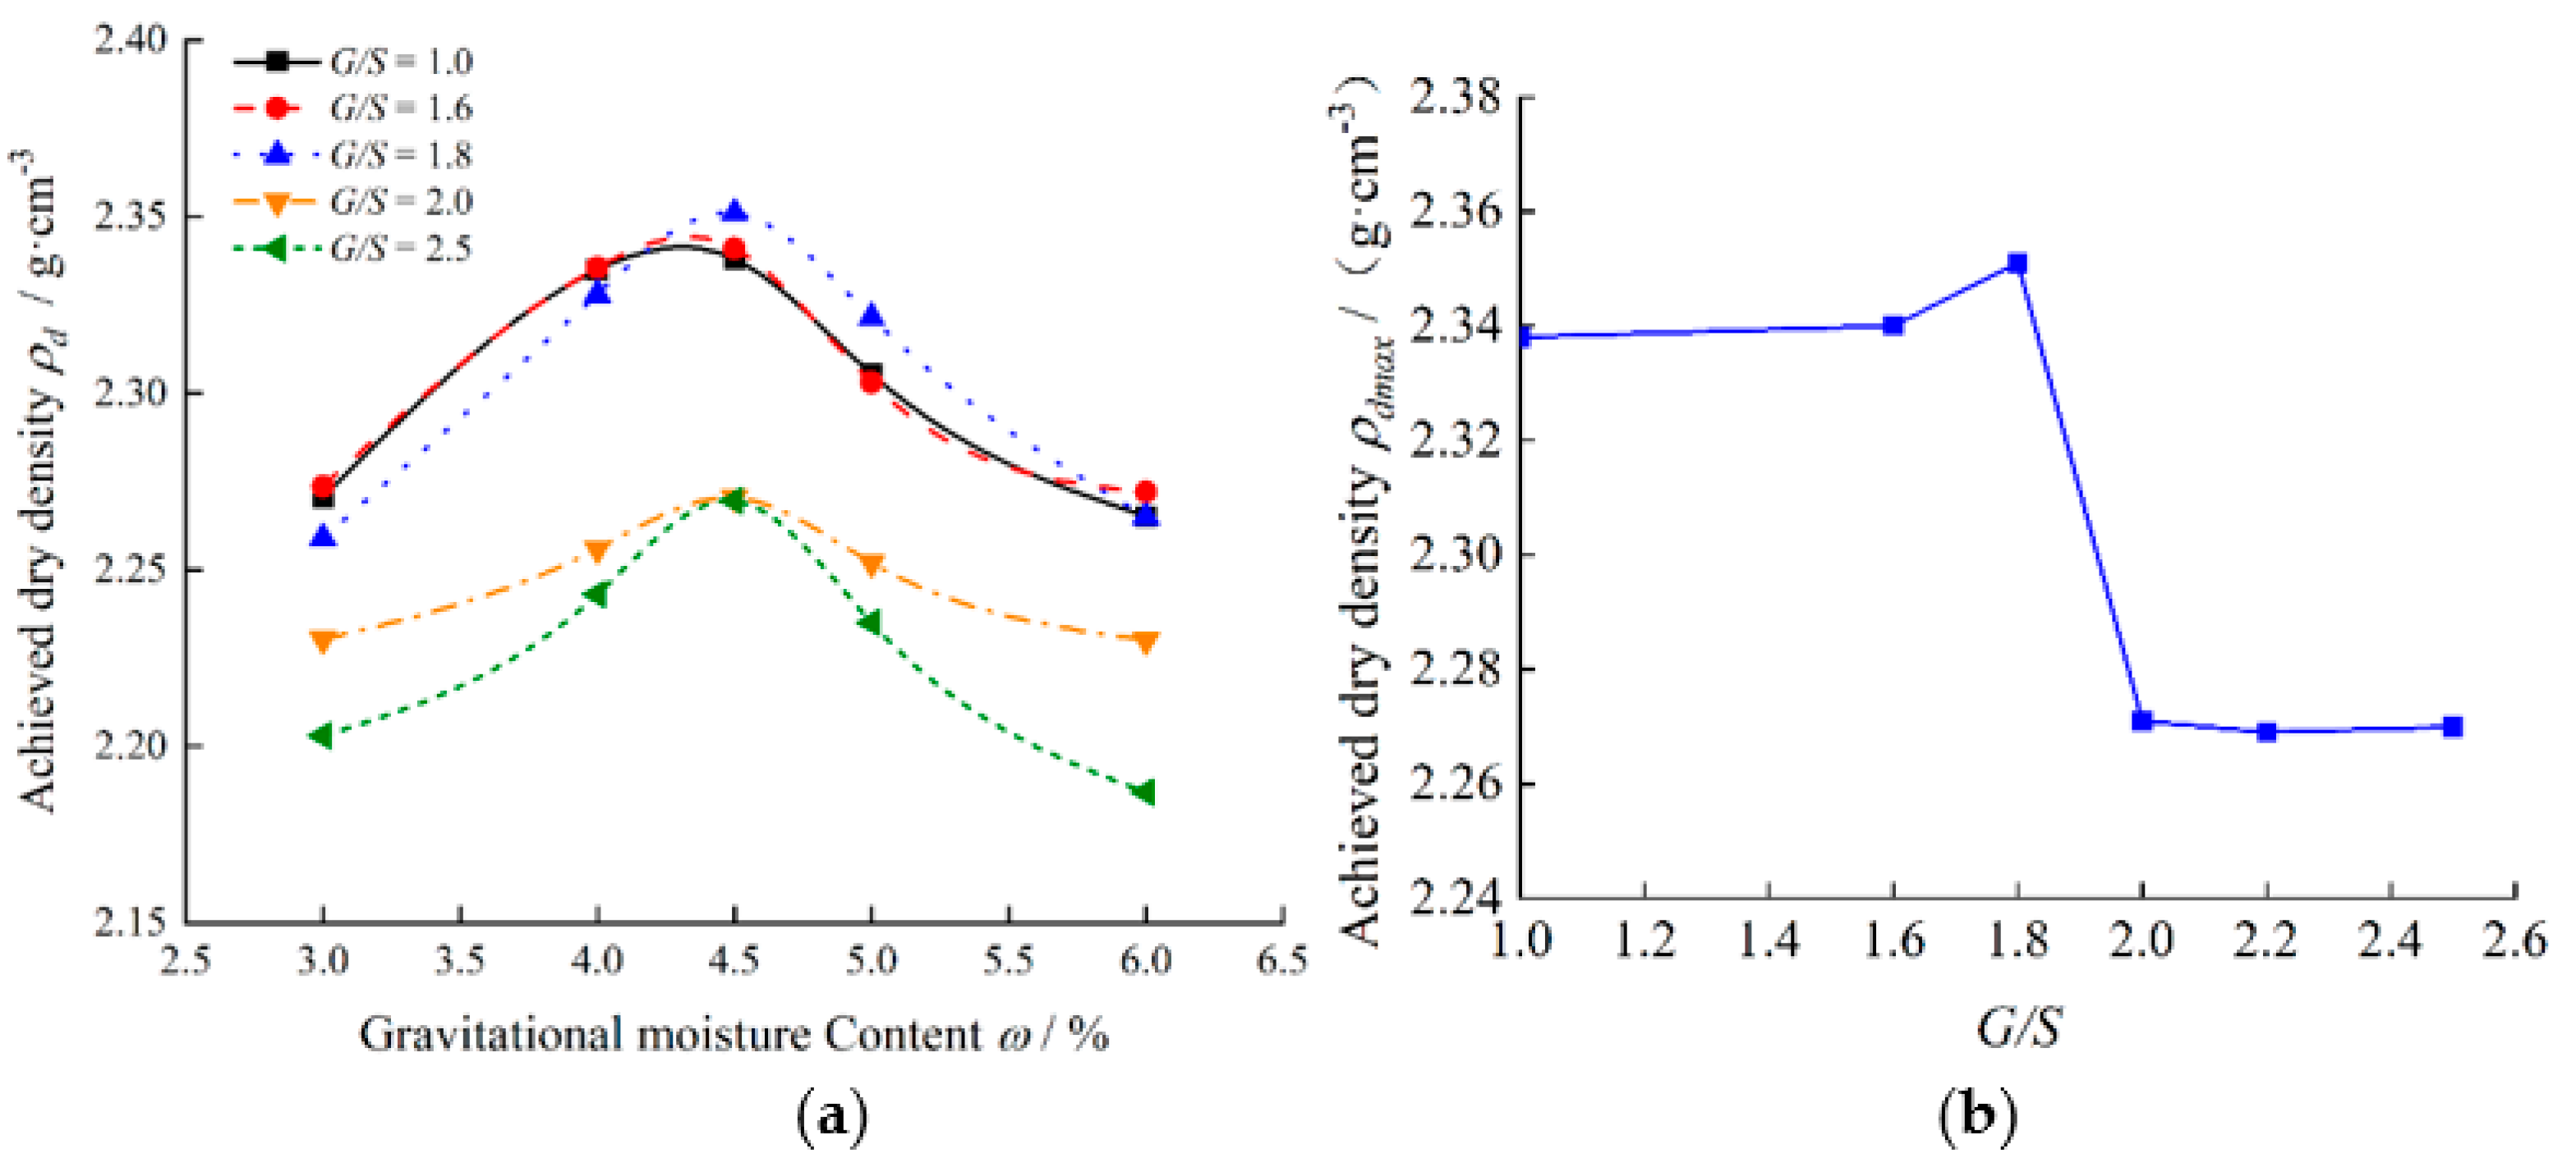
2.2. Laboratory Compaction Tests

The TRW-derived unbound aggregate specimens with the G/S values of 1.0, 1.6, 1.8, 2.0, and 2.5 were prepared at five different initial moisture content levels of 3%, 4%, 4.5%, 5%, and 6% to carry out laboratory Proctor compaction tests, respectively. The inner diameter and height of the compaction mold were 150 mm and 120 mm, respectively. According to the Chinese geotechnical standards [57], the specimens were compacted in 3 sub-layers, with each sub-layer subjected to 98 blows. The applied compaction energy per unit volume was 2677 kJ/m3, which is similar to the 2693.3 kJ/m3 of the modified Proctor compaction according to AASHTO T180 [58]. The compaction curves of gravitational moisture content versus achieved dry density for specimens with different G/S values were obtained and are plotted in Figure 2, from which their optimal moisture content and maximum dry density values were determined accordingly.
It can be seen from Figure 2 that the compaction curves of the unbound aggregate specimens with different G/S values all exhibit similar trends, i.e., the achieved dry density first increases and then decreases with increasing moisture content, with clear peaks observed. The optimum moisture content value of the specimens with different G/S values is around 4.5%, according to Figure 2. However, the maximum dry density values of specimens with different G/S values are also different. As the G/S value gradually increases from 1.0 to 2.5, the maximum dry density of the specimens first increases and then decreases. There seems to exist a peak value of the maximum dry density of the specimens, of which the corresponding G/S value is between 1.6 and 1.8. This is consistent with the result reported by Zhou et al. [59]. This is expected, as fine fractions dominate for low G/S values and coarse fractions dominate for high G/S values. Therefore, specimens with either low or high G/S values are relatively more difficult to compact, thus justifying the existence of the peak value of maximum dry density.

2.3. Monotonic Triaxial Compression Tests

The triaxial test equipment is of the model No. STD and manufactured by the XIAN LETRY Company, Xi’an, China. The dimensions of the laboratory triaxial specimens were 100 mm in diameter and 200 mm in height with the diameter-to-height ratio of 1:2. The unbound aggregate specimens with different G/S values were fabricated at their respective optimal conditions (defined by the maximum dry density and related optimal moisture content) and then compacted in 5 sub-layers to achieve the degree of compaction of at least 98%. The degree of compaction is defined as the ratio of achieved dry density to the related maximum dry density at the same or similar compaction energy level. The compacted specimens were restrained with 0.5 mm thick latex membranes and then transferred to the triaxial chamber for subsequent laboratory monotonic and repeated load triaxial compression tests.
The triaxial testing apparatus is shown in Figure 3. It is capable of applying both monotonic and repeated axial loads of different amplitude and/or frequency levels. The vertical deformation is recorded externally with the linear variable differential transducers (LVDTs). Each aggregate specimen was loaded under three different levels of confining pressure (σ3) of 50 kPa, 100 kPa, and 150 kPa, respectively. The half-sine waveform with a loading frequency of 5 Hz was adopted for deviator stress (σd), as shown in Figure 4. The shear strength parameters (i.e., the apparent cohesion c and the angle of internal friction ϕ) of the specimens were determined by fitting the results of monotonic load triaxial compression tests against the classical Mohr–Coulomb failure criterion.

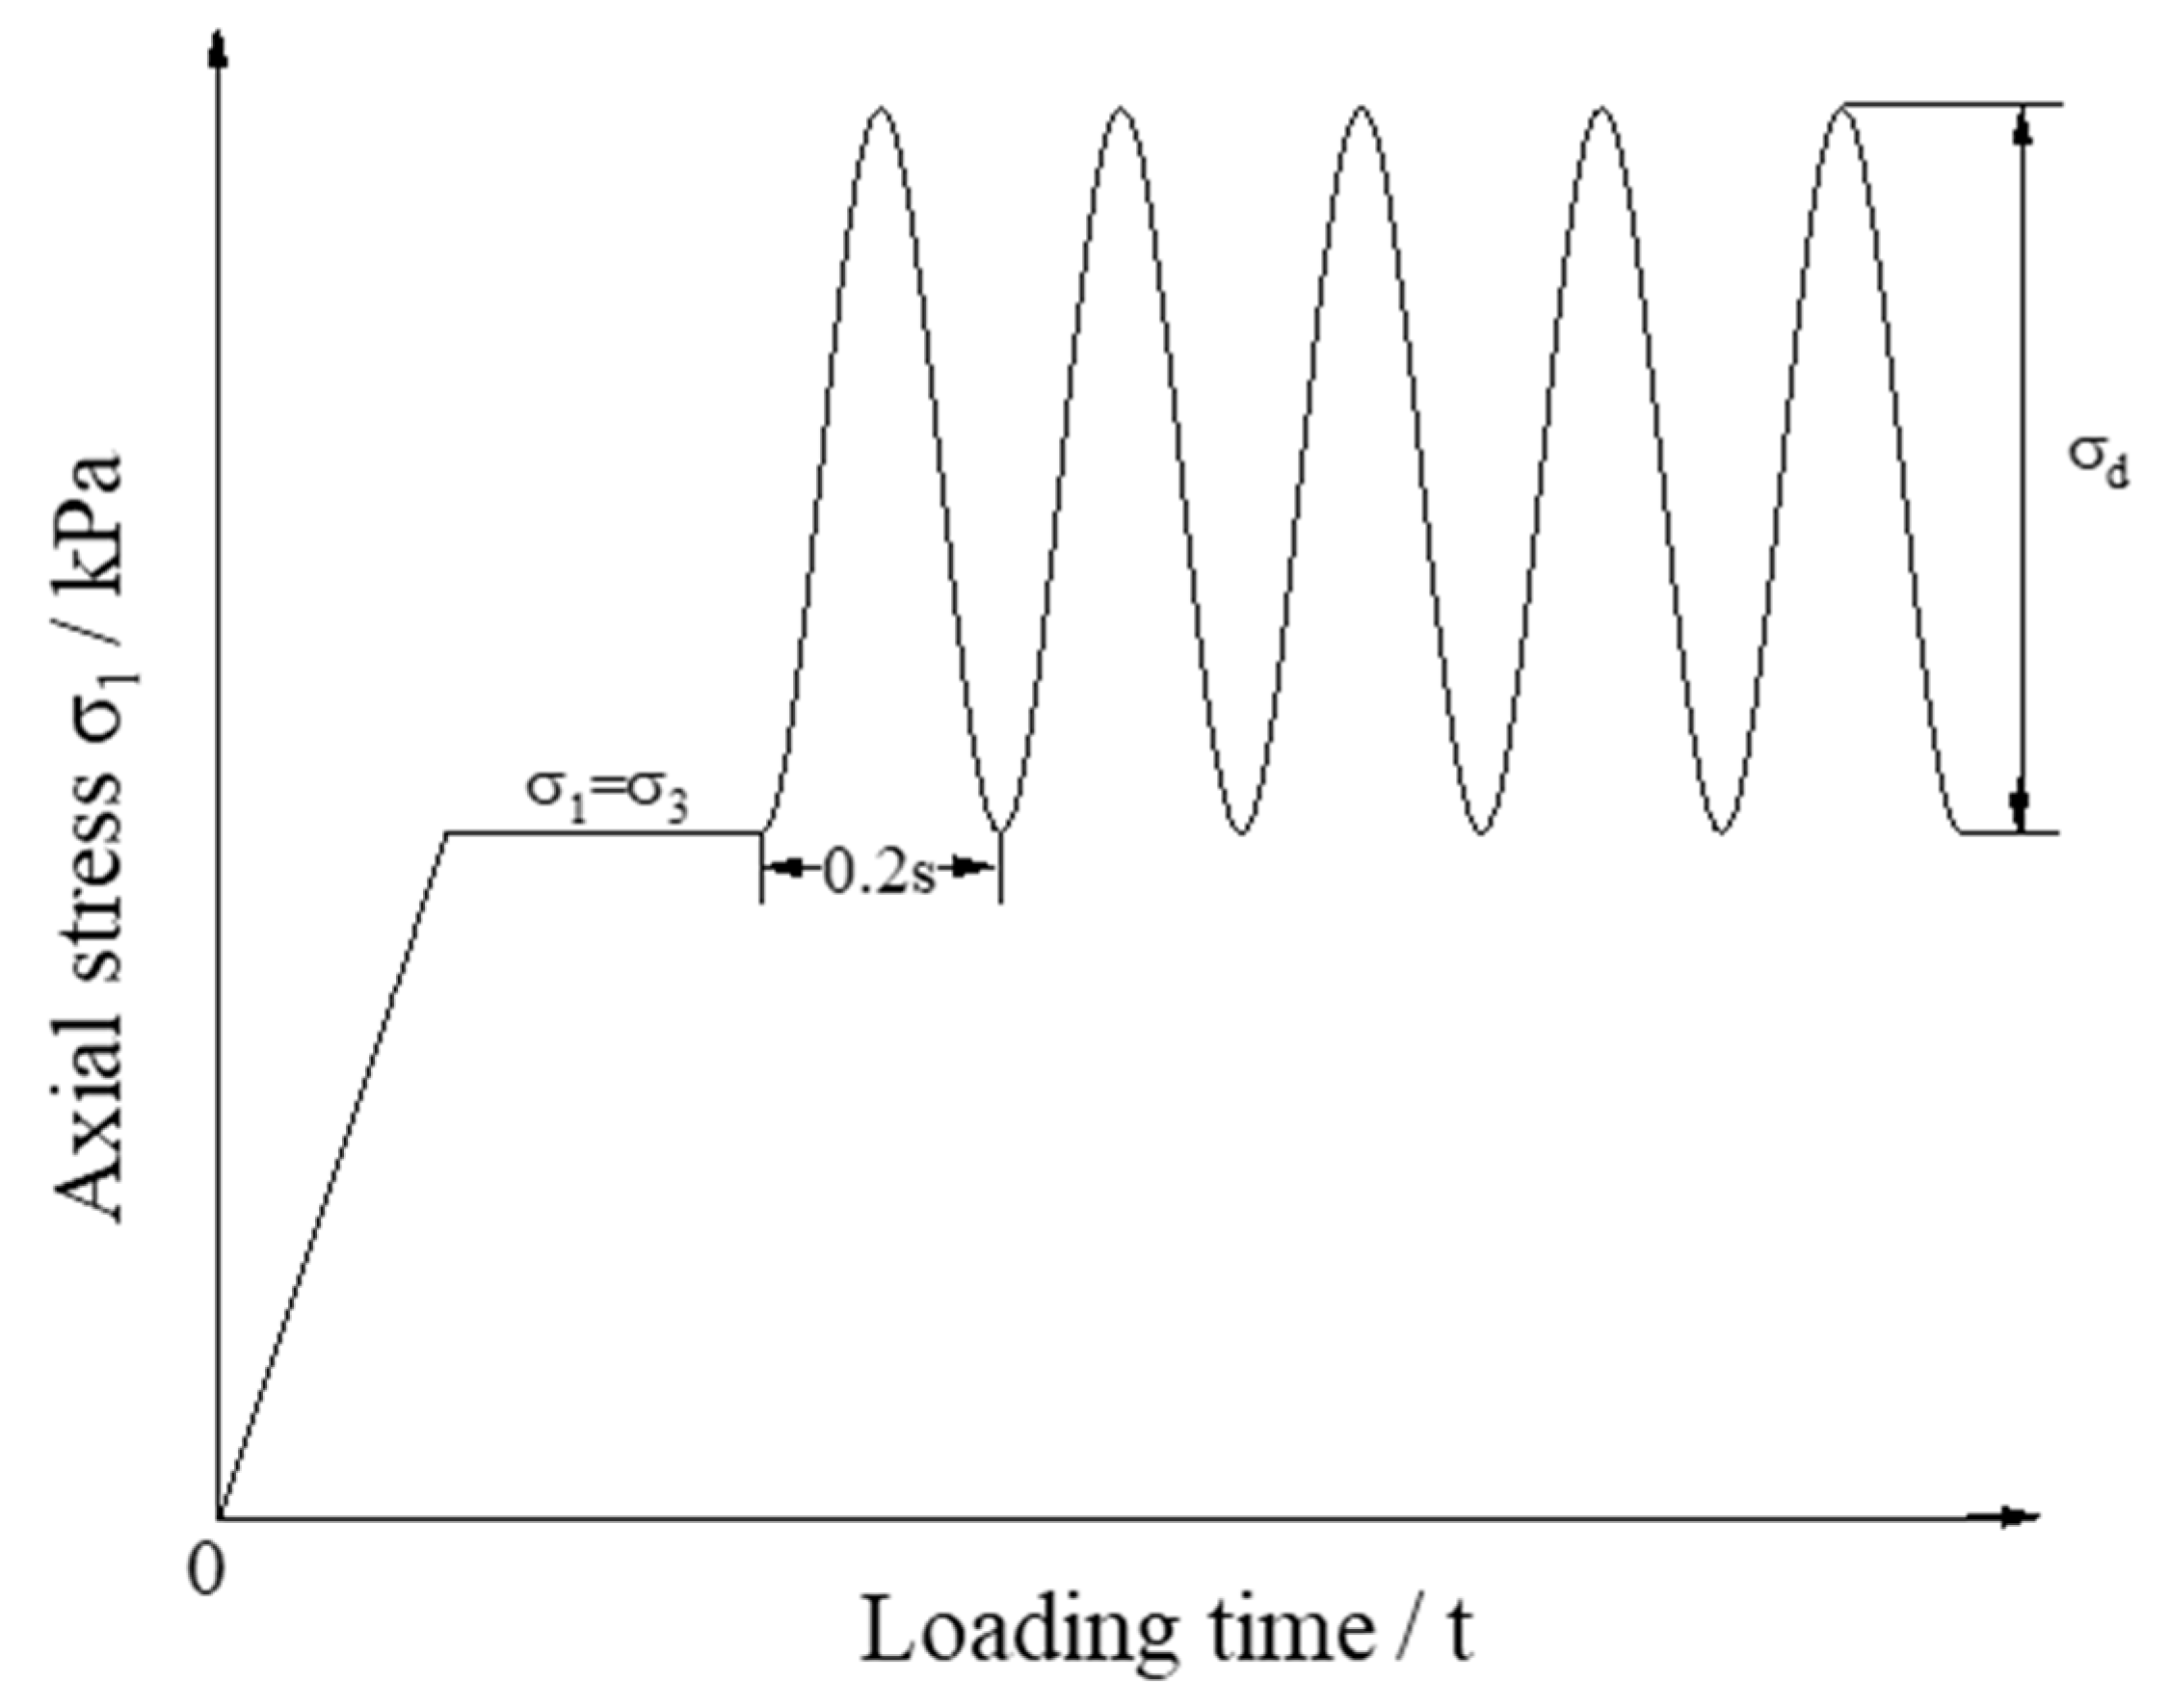
2.4. Repeated Load Triaxial Tests

The repeated load triaxial (RLT) tests were further conducted to study the resilient and plastic strain behavior of TRW-derived UPAB materials, i.e., resilient modulus and permanent deformation characteristics. The shear stress ratio (SSR), of which the definition is illustrated in Figure 5, was used to control the amplitudes of cyclic deviator stress (σd). The related calculation formulas are shown in Equations (3)–(6) sequentially [23]. To study the effect of stress level on resilient modulus of UPAB materials, four different SSR levels were designed for repeated load triaxial tests, i.e., 0.3, 0.5, 0.7, and 0.9, respectively. Therefore, each of the five different gradations corresponds to a total of 12 different combinations of stress states (i.e., 3 different σ3 levels times 4 different SSR levels), as listed in Table 2. The permanent deformation of the UPAB materials tended to be stable after 2000 load applications [53,55]. The dynamic properties of the UPAB materials were basically stable when the number of load applications exceeded 5000 [56]. By considering the stress levels applied to the specimens and the capacity of the triaxial testing apparatus, it was determined in this study that the maximum number of repeated load applications was set as 50,000. The specimens of five different gradations subjected to 50,000 load applications under 50 kPa confining pressure and 93. -kPa deviator stress were photographed and shown as examples in Figure 6.
S S R = τ f τ max
τ f = σ d 2 cos φ
τ max = σ f tan φ + c
σ f = σ 3 + σ d ( 1 sin φ ) 2
M r = σ d ε r ,   λ = S cycle S OAA
where M r is resilient modulus, ε r is resilient (or recoverable) axial strain, ε p is irreversible (or plastic) axial strain, λ is damping ratio, S c y c l e is the enclosed area of the axial stress–axial strain hysteresis loop, and S O A A is the enclosed area of the triangle O A A , as shown in Figure 7.

3. Results and Analysis

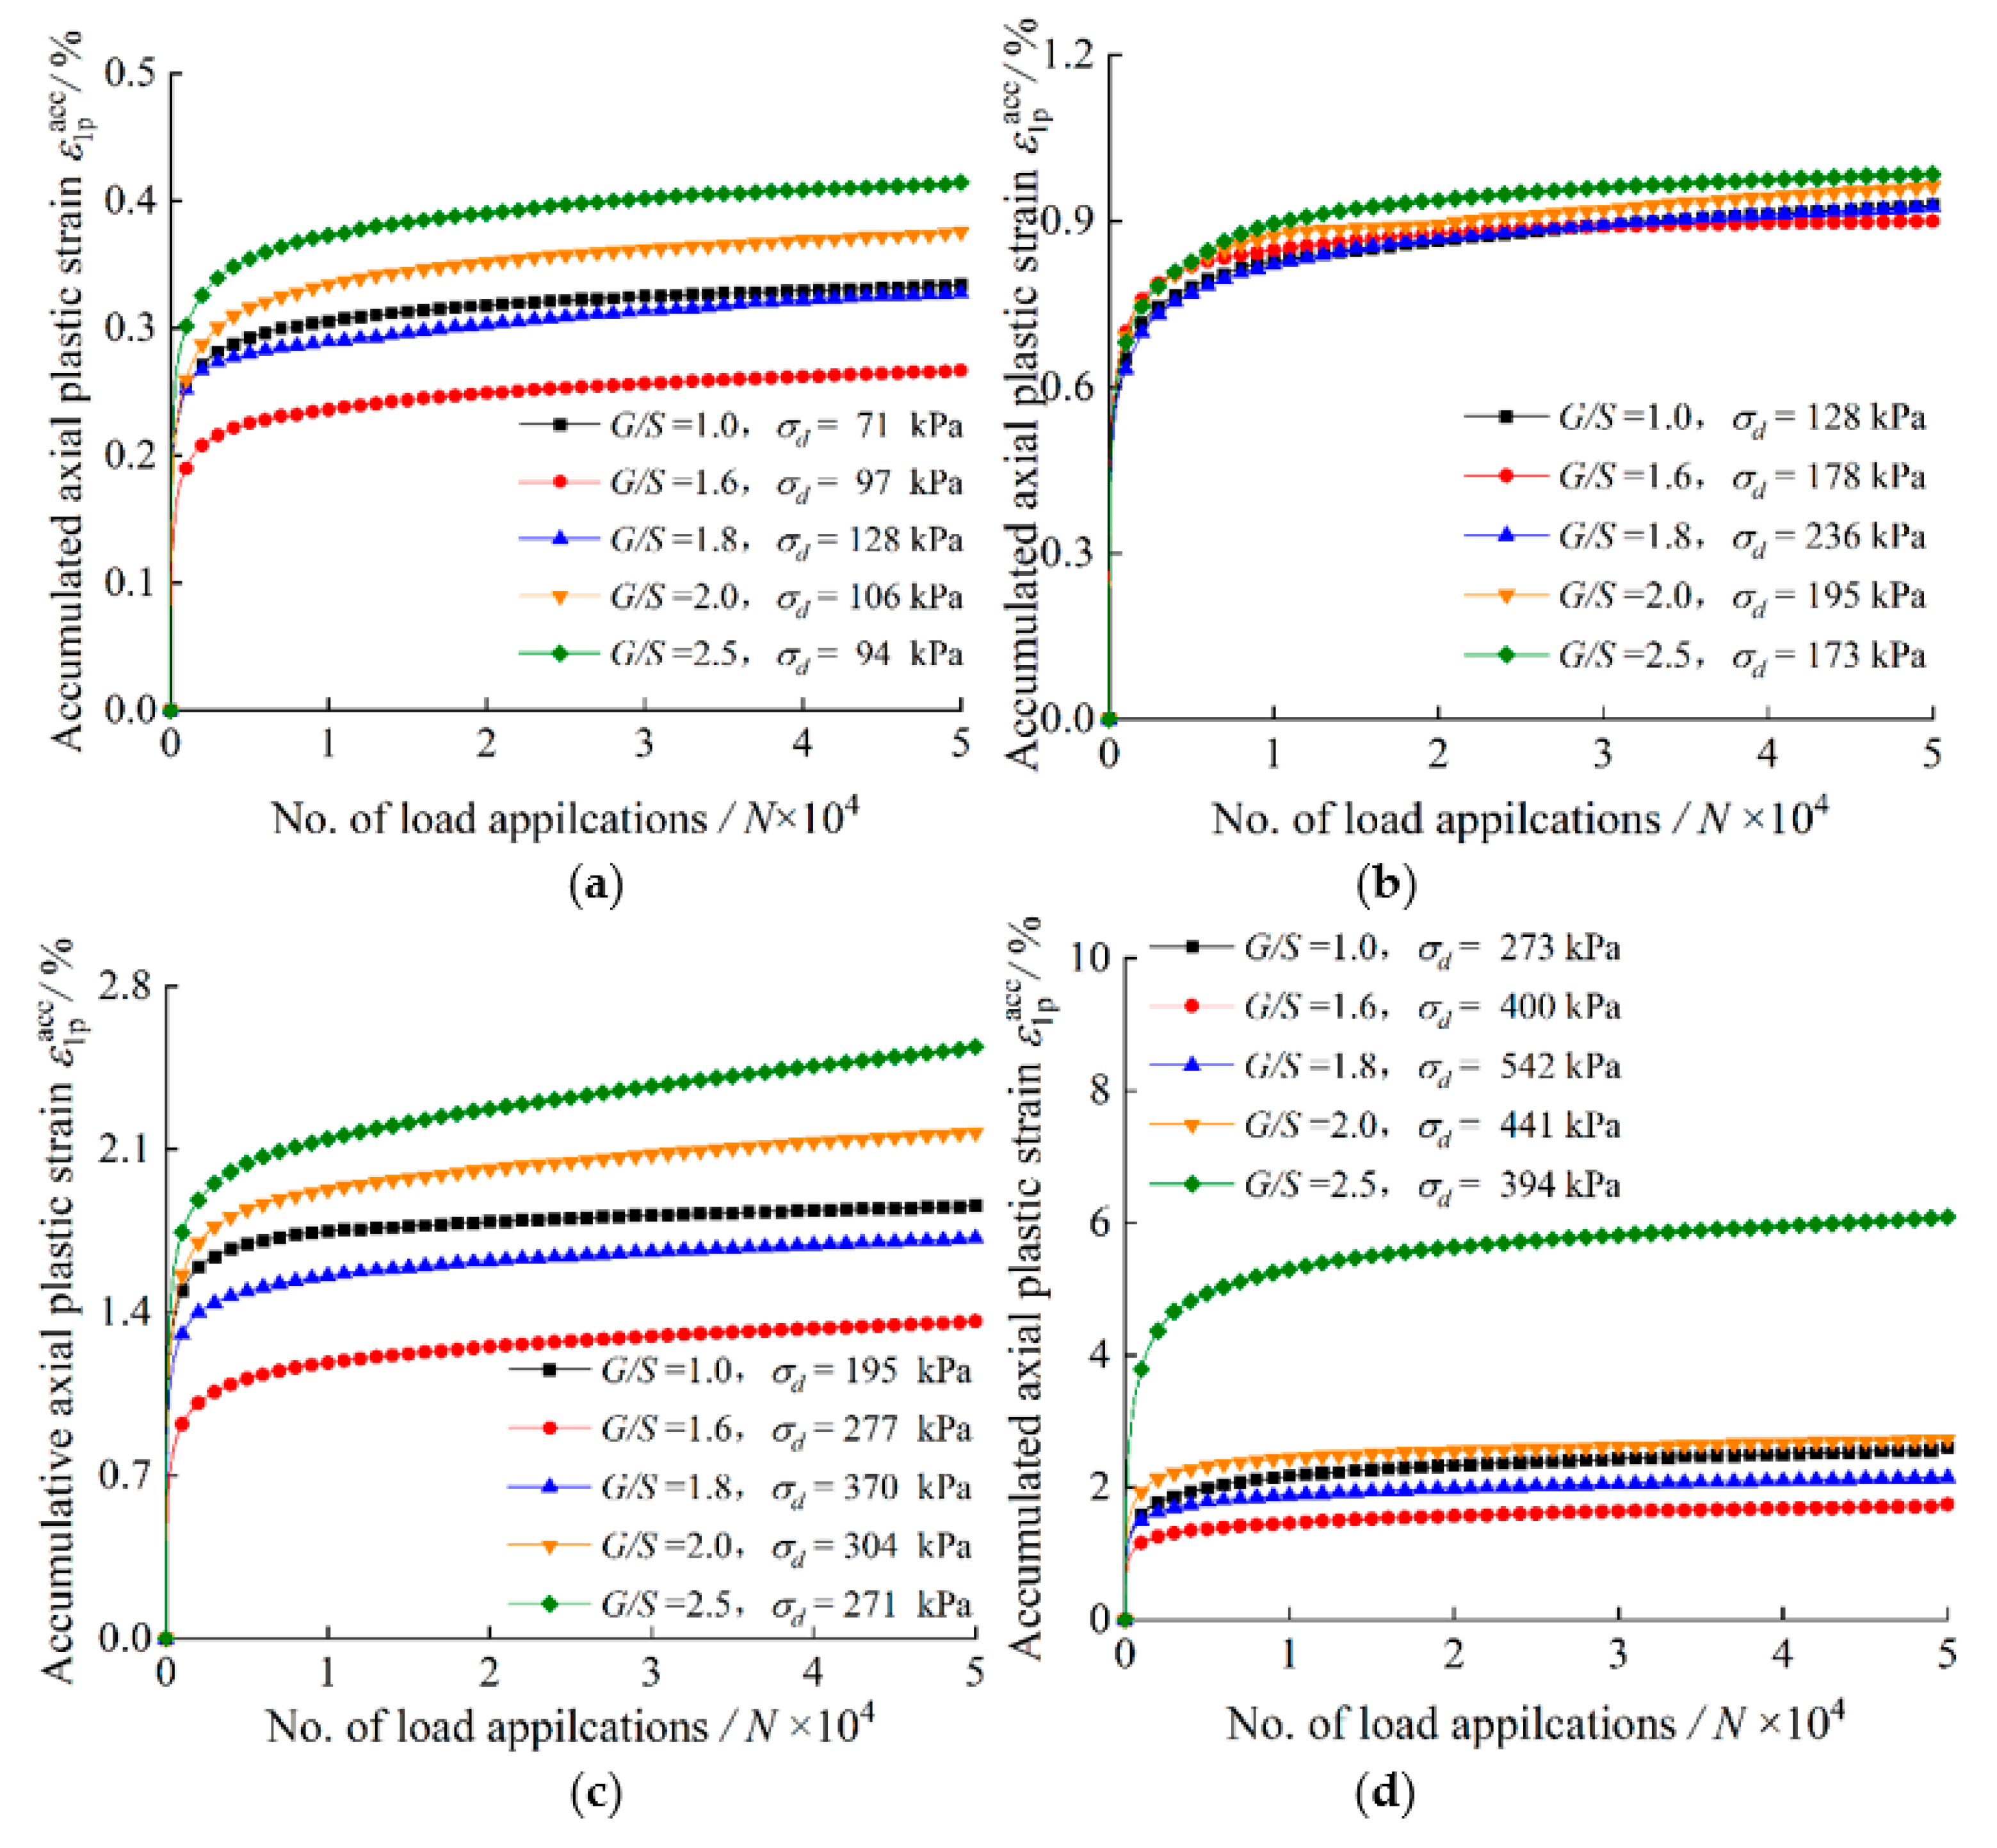
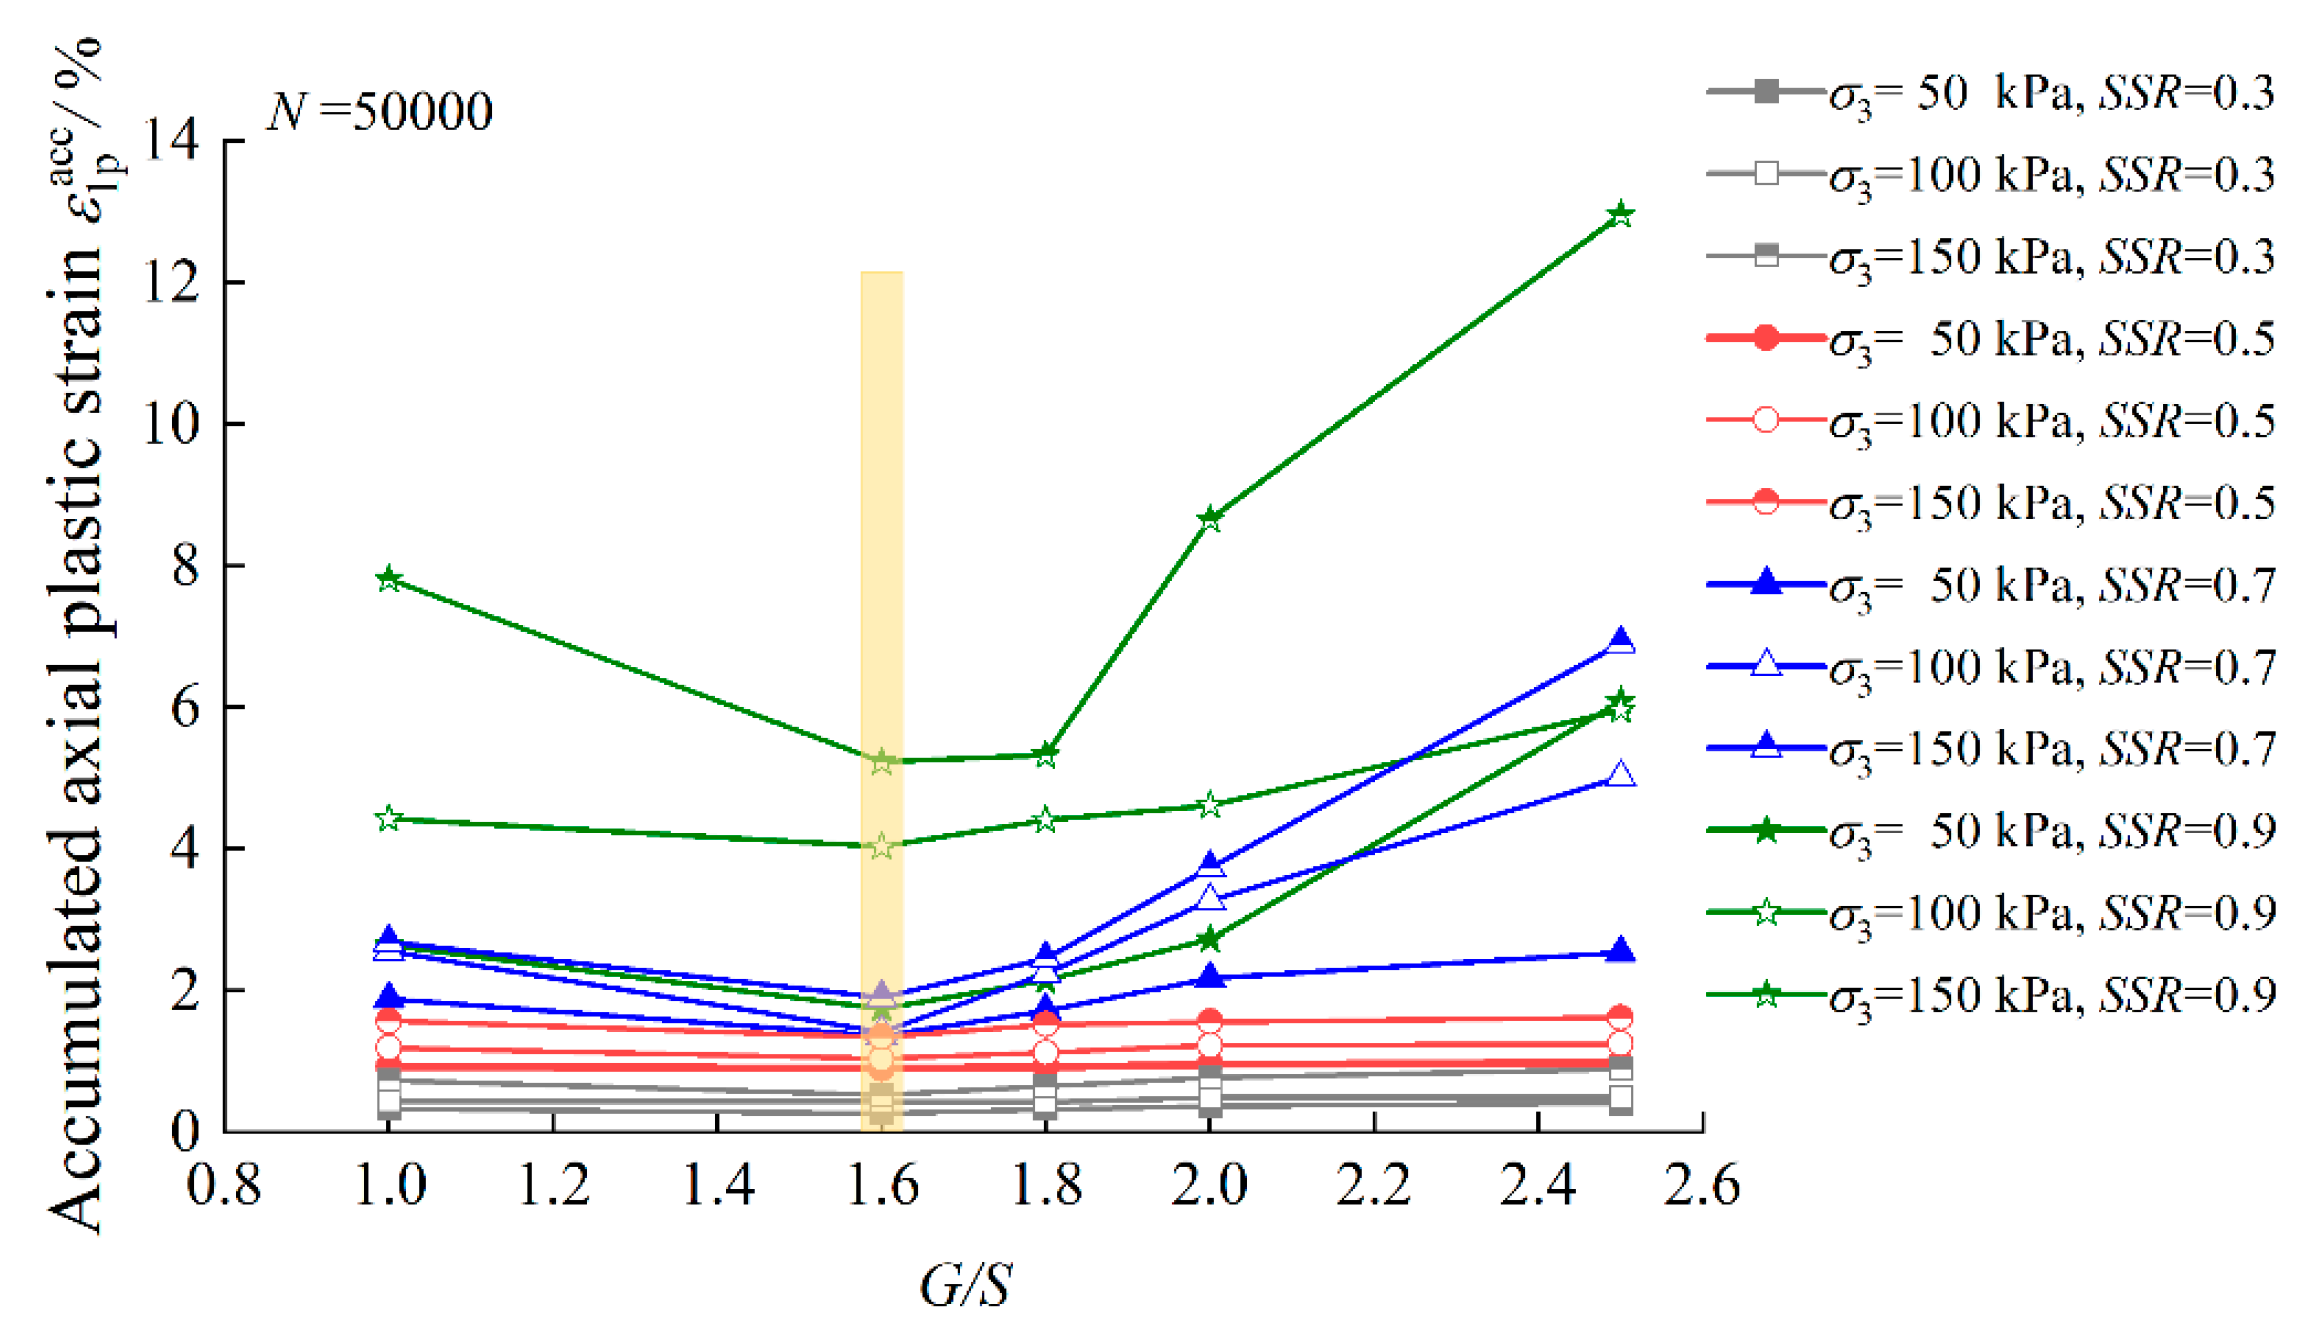
3.1. Plastic Strain Characteristics

Figure 8 shows the variation of accumulated axial plastic strain with the number of load applications (N) for TRW-derived UPAB specimens with different G/S levels under 50 kPa confining pressure. It is worth noting that the amplitudes of deviator stress (σd) applied on the specimens with different G/S values are different even under the same combination of confining pressure and SSR due to their differences in shear strength. The accumulated axial plastic strain of the specimens increases rapidly with increasing number of load applications (N), while the rate of increase decreases during the initial loading stage. The accumulated axial plastic strain tends to be stable approximately at lower SSR levels (≤0.5), while it accumulates rapidly with increasing number of load applications (N) at higher SSR levels (≥0.7). The accumulated axial plastic strain increases significantly with increasing SSR under the same confining pressure and gradation.
In order to further study the influence of the gradation parameter G/S on the accumulated axial plastic strain (ε1pacc) of TRW-derived UPAB materials under different combinations of σ3 and SSR, the ε1pacc values calculated upon the completion of laboratory repeated load triaxial (RLT) tests (i.e., N = 50,000) are plotted for comparison in Figure 9. It can be seen from Figure 9 that under the same combination of σ3 and SSR, the ultimate accumulated axial plastic strain first increases and then decreases with increasing G/S level. This implies that the ultimate accumulated axial plastic strain reaches its minimum and maximum values at G/S = 1.6 and G/S = 2.5, respectively. Therefore, the trend of the ultimate accumulated axial plastic strain varying with G/S is consistent with previously presented trends of maximum dry density and shear strength varying with G/S, respectively.

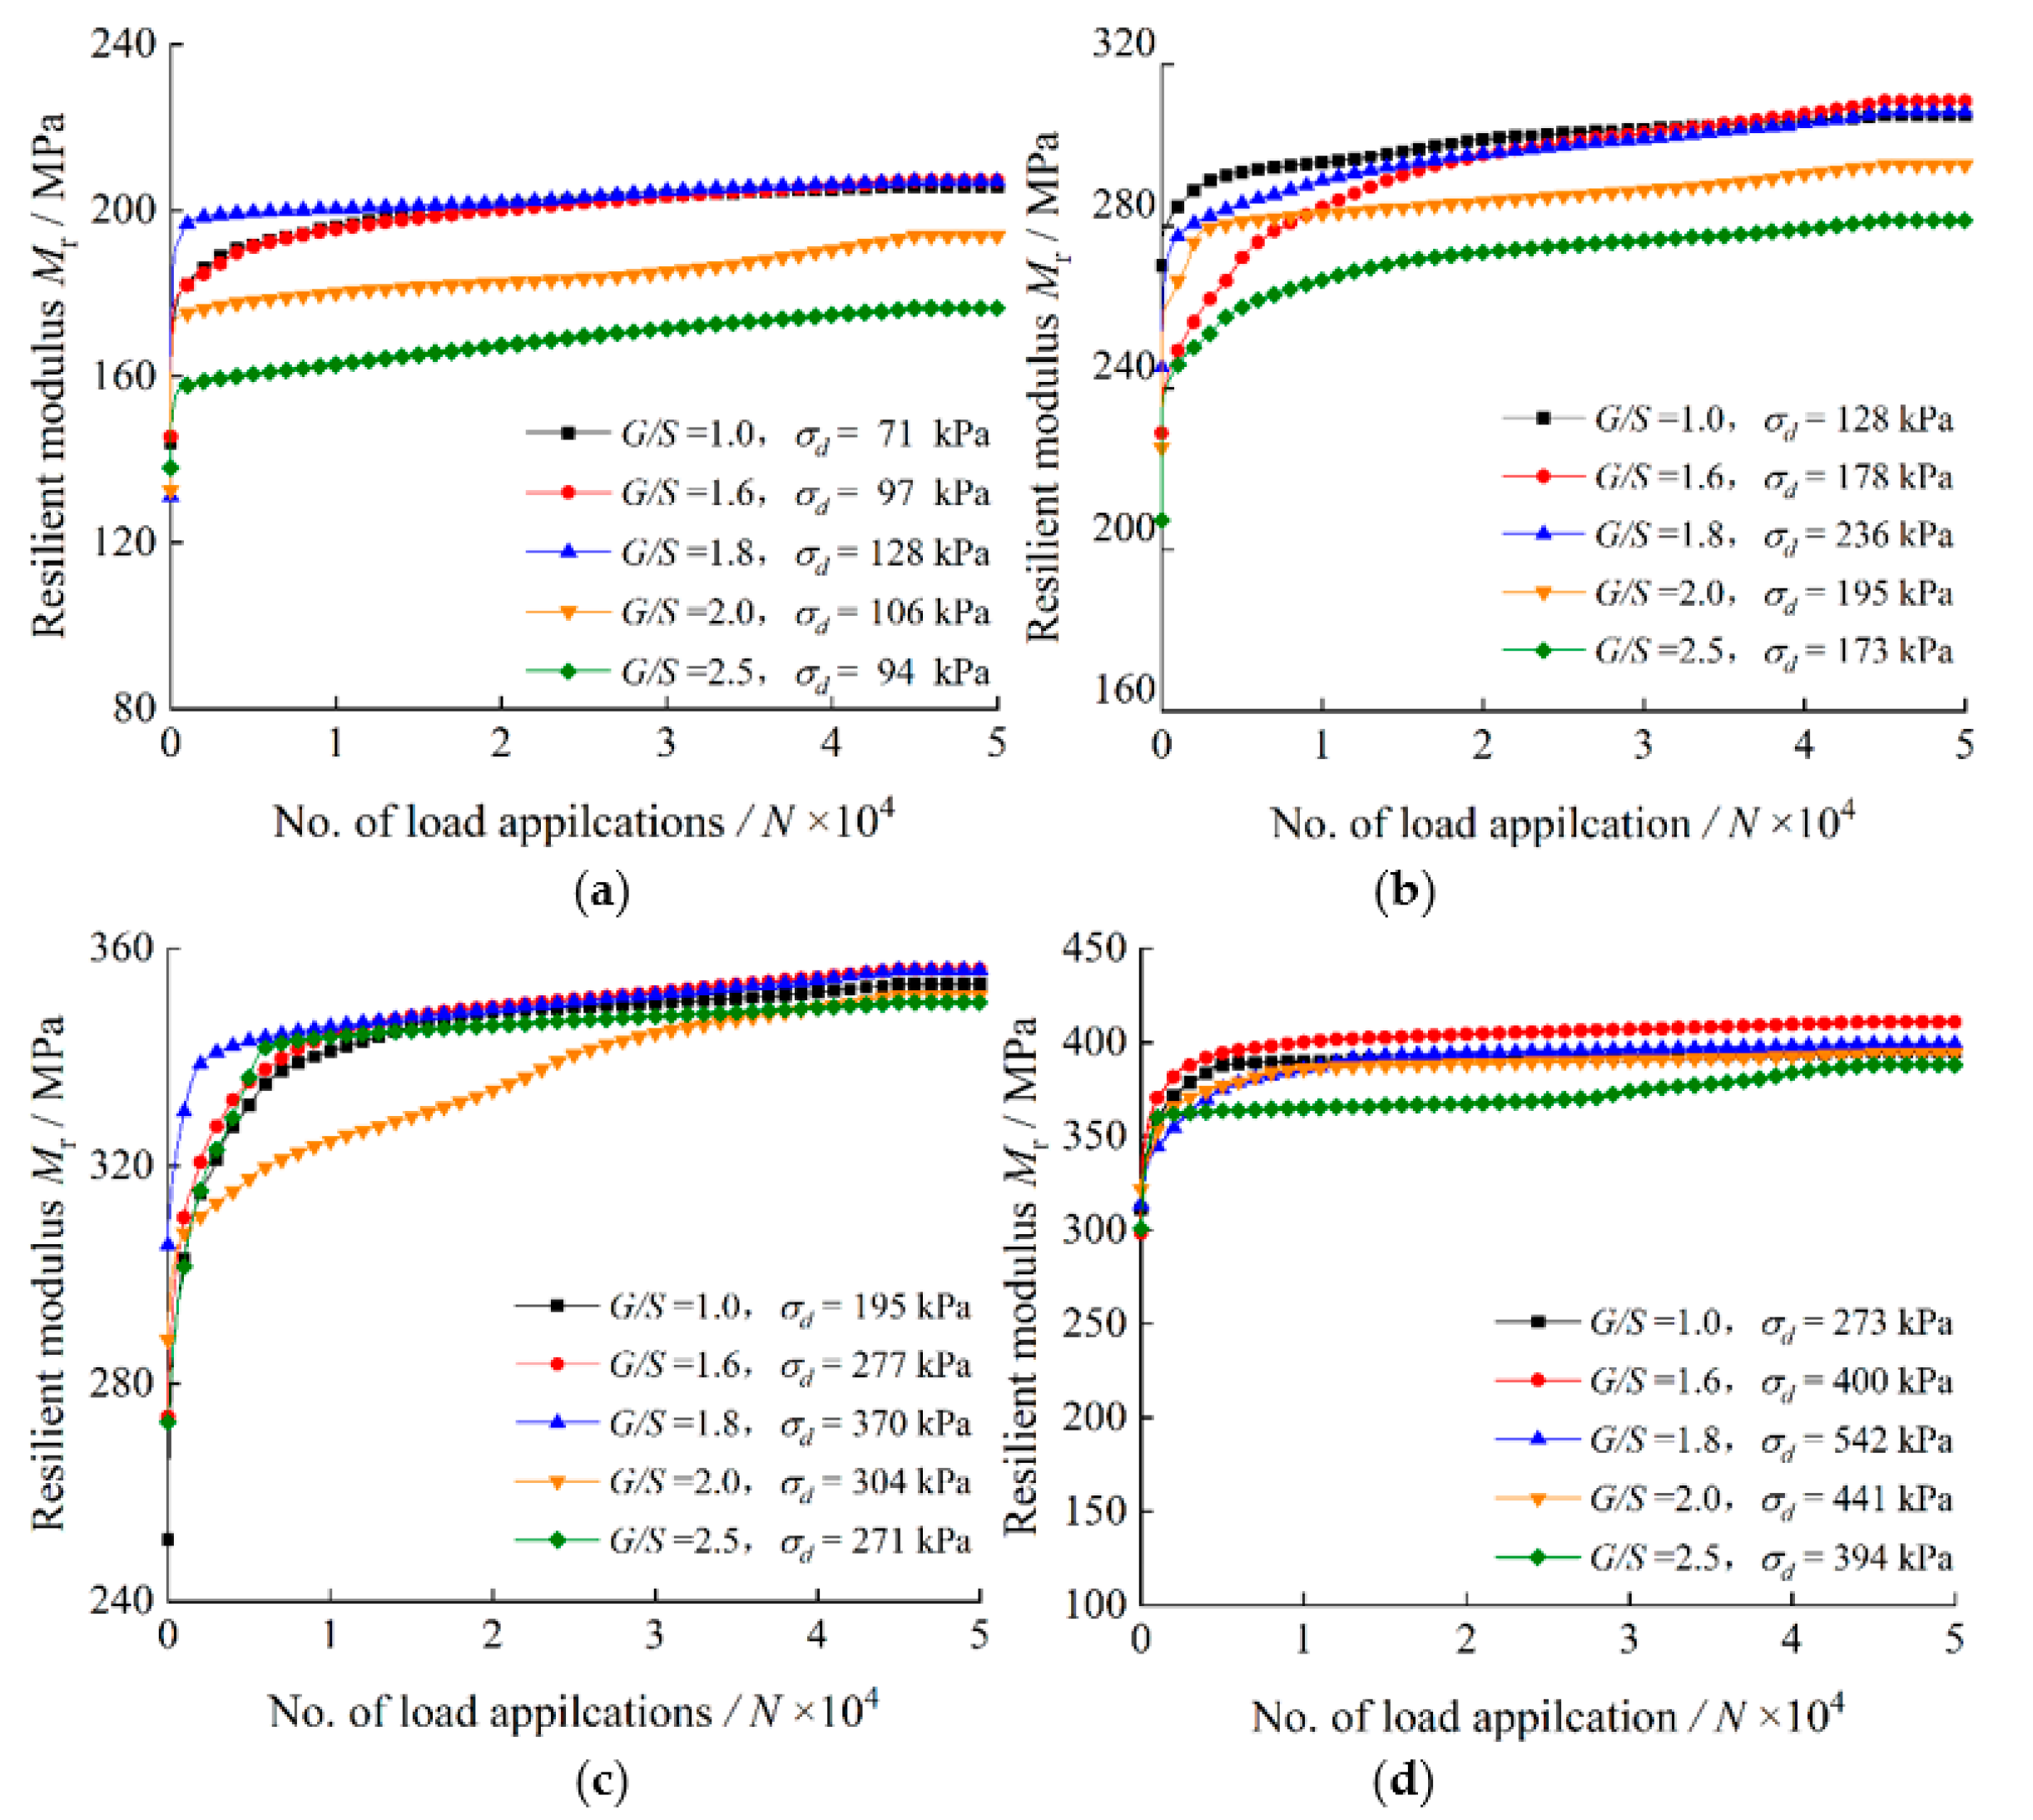
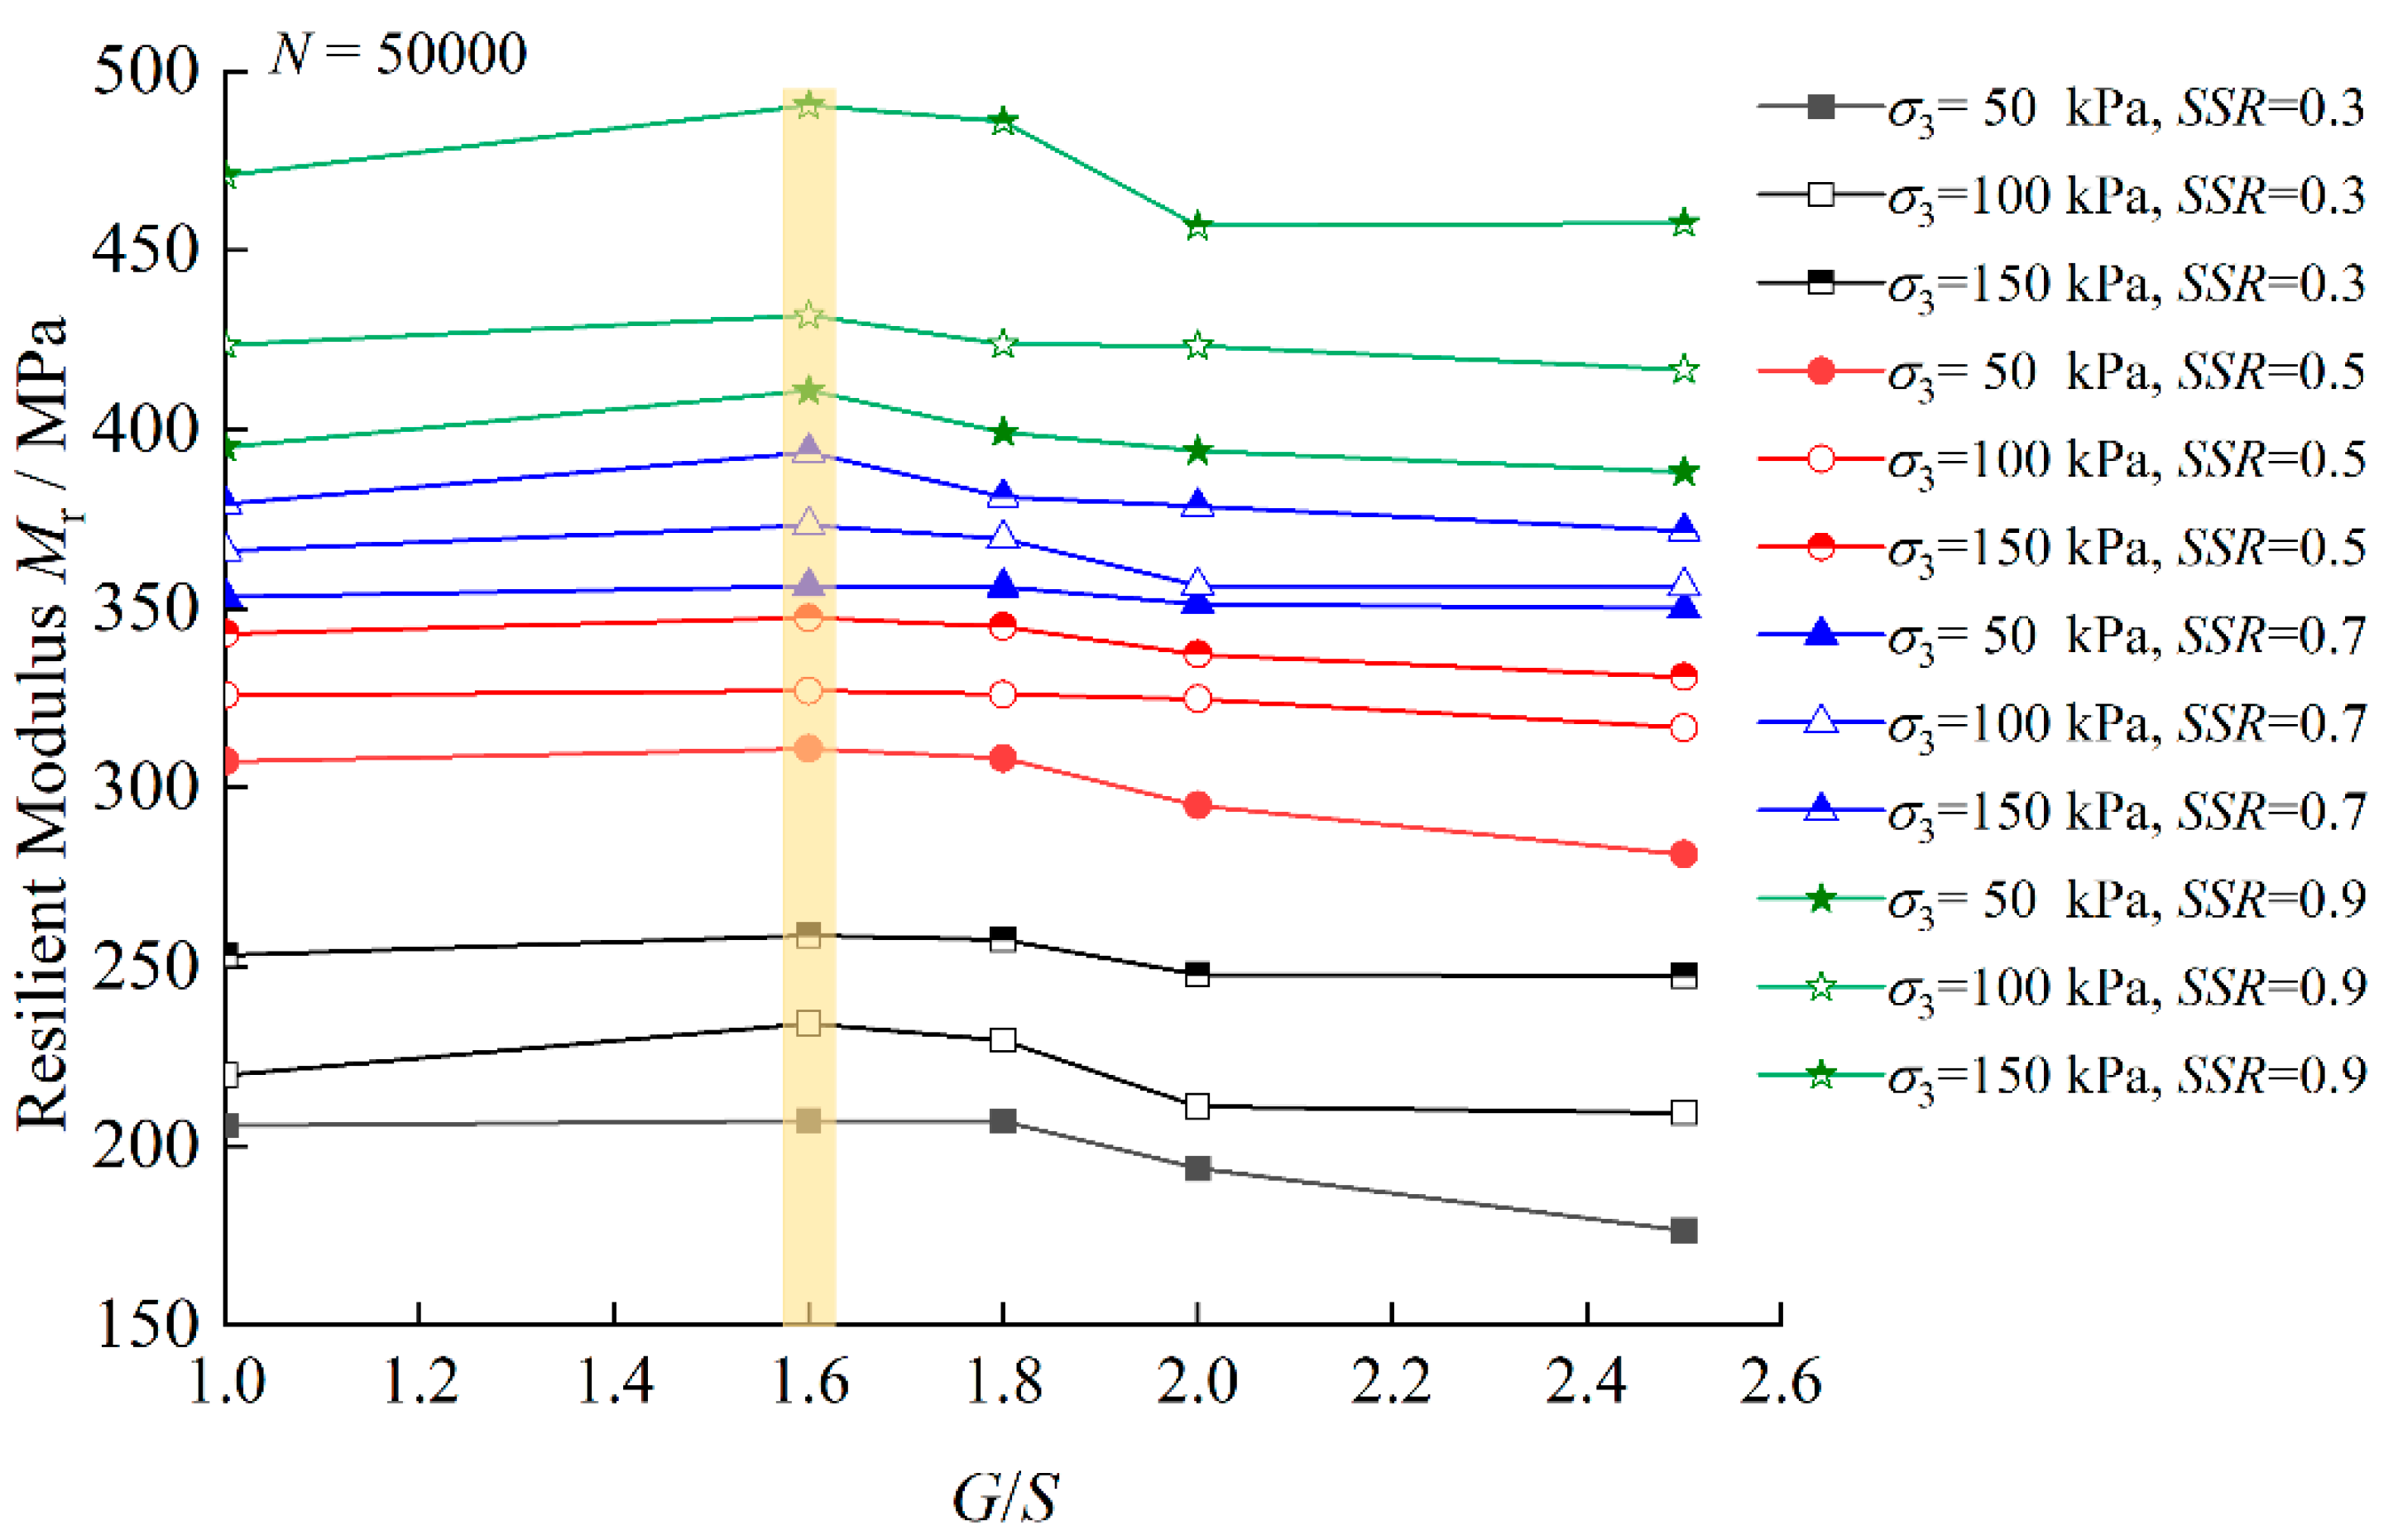
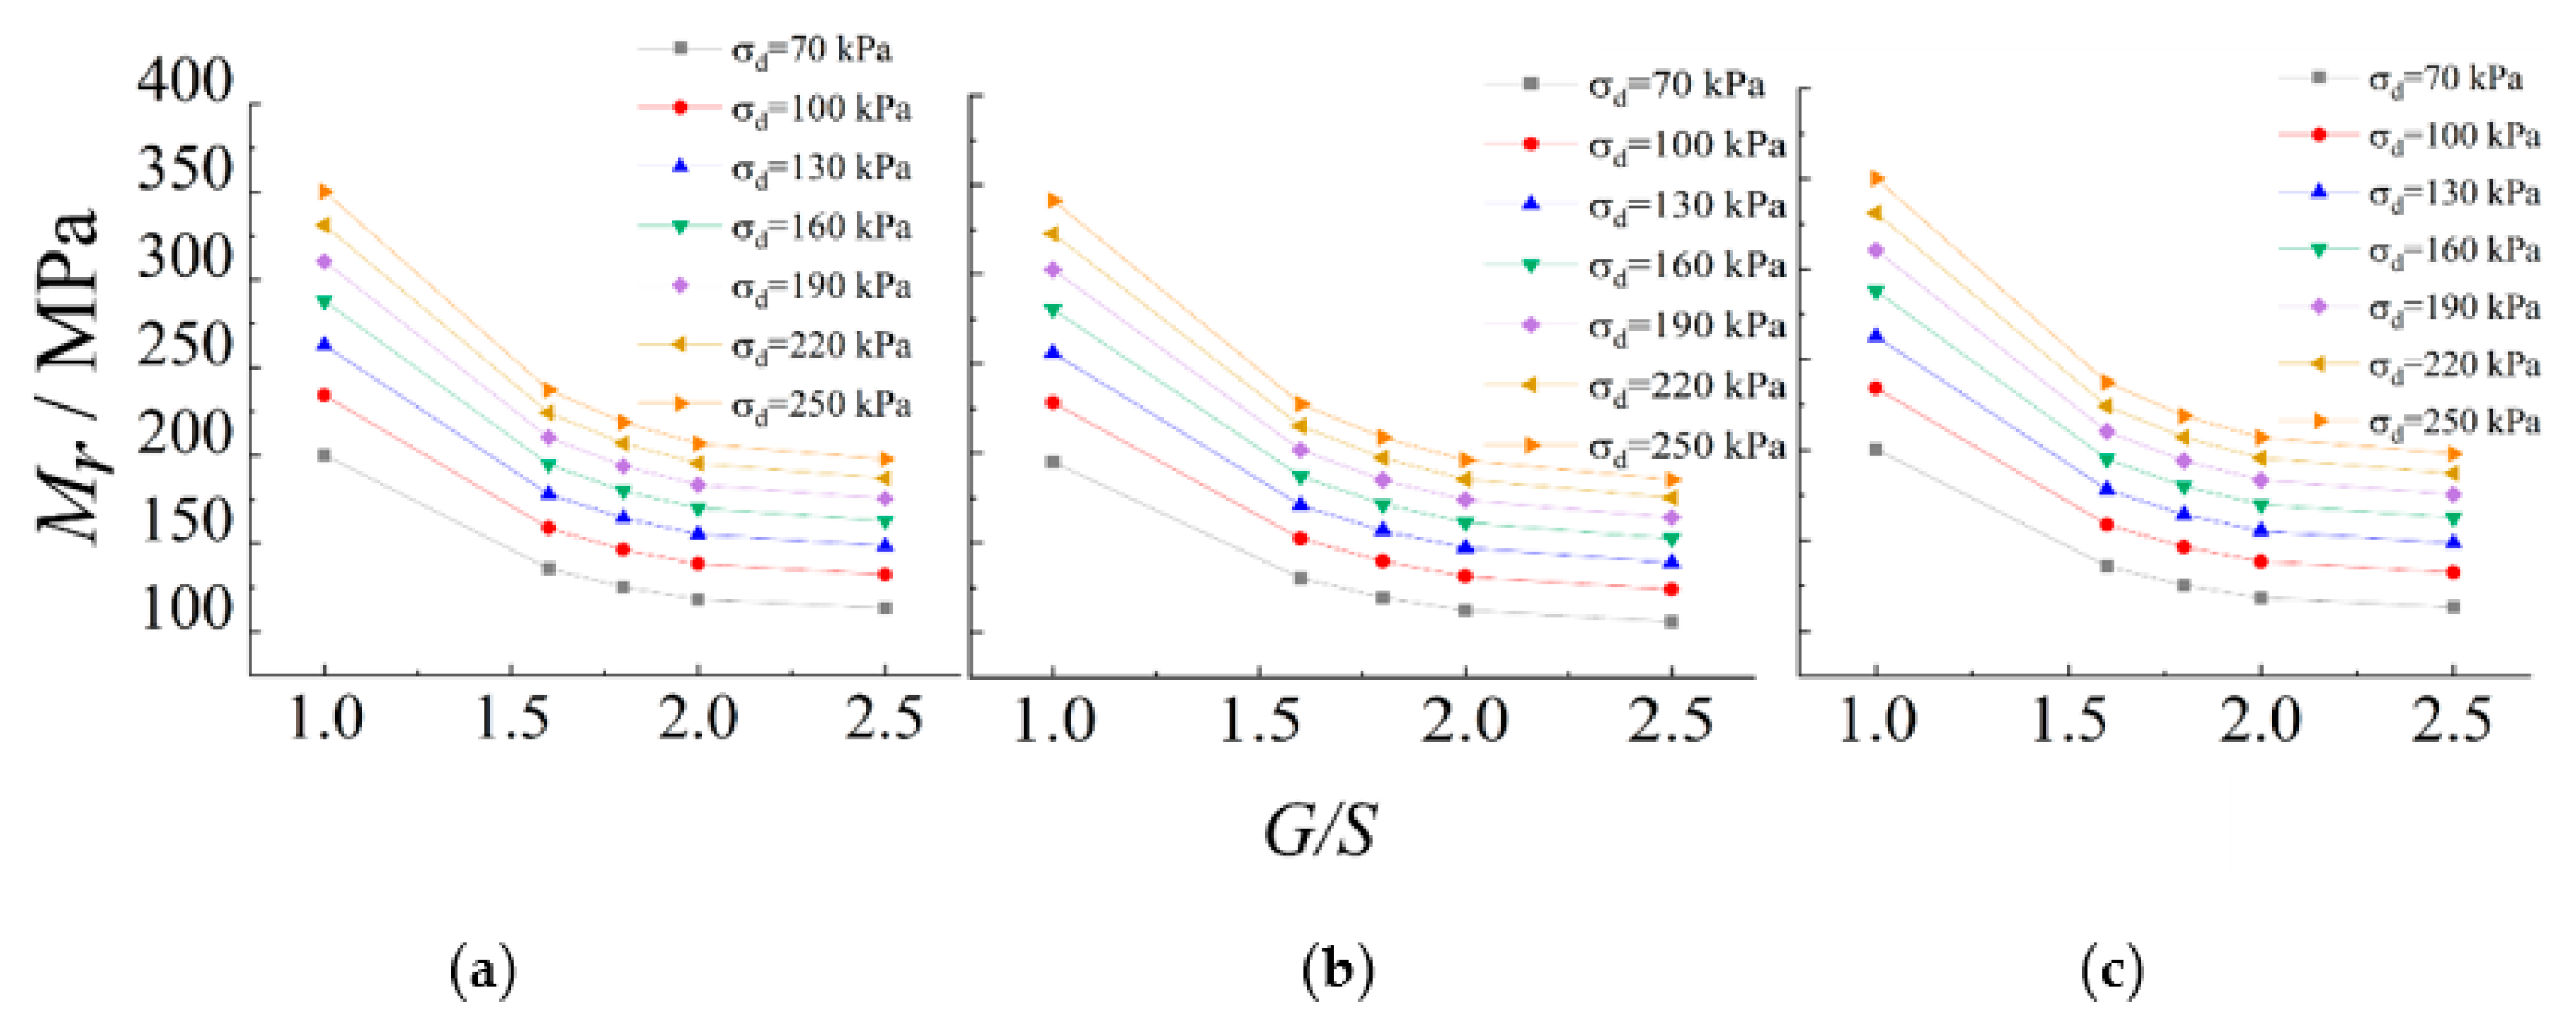
3.2. Resilient Modulus Characteristics

Figure 10 shows the variations of Mr with the number of load applications (N) for TRW-derived UPAB specimens with different G/S levels under 50 kPa confining pressure. It can be seen from Figure 10 that Mr increases rapidly with increasing number of load applications (N) at the initial loading stage until the gradually decreasing rate of increase becomes stable approximately at N = 1500. In addition, the Mr values of UPAB specimens all increase significantly with increasing SSR level, but still vary among different G/S levels even under the same stress state. The UPAB specimen with G/S = 2.5 exhibits the lowest Mr values, which may be attributable to its high fraction of coarse particles and large pores; in contrast, the UPAB specimen with G/S = 1.6 exhibits the greatest Mr values due to its relatively densest packing structure. Figure 10 also shows that the higher the SSR level is, the more significant the influence of gradation on Mr of UPAB specimens is, and the more pronounced the increases in Mr become.
Figure 11 further illustrates the influence of the gradation parameter G/S on Mr characteristics of TRW-derived UPAB materials under different combinations of σ3 and SSR, where Mr values calculated upon N = 50,000 are plotted as examples. It can be seen from Figure 11 that under the same combination of σ3 and SSR, Mr values first increase and then decrease with increasing G/S level, thus clearly indicating that the highest Mr is reached at G/S = 1.6 and the lowest Mr at G/S = 2.5. Therefore, it appears that the optimal G/S value of 1.6–1.8 exists where the maximum resilient modulus (or the best resilient behavior) can be expected for UPAB materials. Under the same confining pressure level of 150 kPa and the varying SSR levels of 0.3, 0.5, 0.7, and 0.9, Mr values of the specimen with G/S = 1.6 increase by 4.53%, 4.99%, 5.95%, and 7.18% as compared to their counterparts of the specimens with G/S = 2.5, respectively. The influence of gradation on Mr characteristics of UPAB materials appears more pronounced for higher SSR levels. In addition, under the same SSR level of 0.5, as confining pressure increases, Mr values of the specimens with G/S = 1.6 increase by 7.64%, 5.24%, and 4.99% as compared to their counterparts of the specimens with G/S = 2.5, respectively. This implies that under the same SSR level, increasing confining pressure would alleviate the effect of gradation on resilient modulus of unbound permeable aggregate base materials, which is expected by the common engineering sense.

4. Development of Resilient Modulus Prediction Model

4.1. Comparative Assessment of Different Calculation Methods of Representative Mr Values

In the past few decades, resilient modulus prediction models for subgrade soils and unbound granular materials have evolved dramatically from primitive to sophisticated ones with key physical properties and the shearing and confinement effects considered sequentially. Among the existing Mr models in the literature, fourteen classical ones were shortlisted for comparative assessment in this study, as listed in Table 3. Since the matrix suction was not scoped into or measured during the laboratory testing program, those Mr prediction models incorporating matrix-suction-related terms were excluded from the scope of this study.
In order to study the influence of different calculation methods of the representative Mr values on the prediction accuracy of the Mr models, three different methods for calculating the representative Mr values were comparatively assessed. The first method averaged Mr values from the last 5 of the first 1500 load applications. The second method averaged Mr values from the last 10 of the first 10,000 load applications, whereas the third one averaged Mr values from the last 100 of the first 50,000 load applications. The entire sets of such representative Mr data calculated by using three different methods for UPAB specimens tested under different combinations of G/S levels and stress states were fitted against each of the Mr prediction models listed in Table 3. The resulting goodness-of-fit results (e.g., R2 values) obtained for the fourteen different Mr prediction models according to the three different calculation methods of the representative Mr values are summarized in Table 3 as well.
Table 3 shows that the R2 values of the fourteen different Mr models for the calculation method I are slightly greater than those for the calculation methods II and III. Overall speaking, little difference is observed among such three different methods in terms of the prediction accuracy, thus indicating that any one of them is suitable for calculating representative Mr values in this study. By comparing the R2 values of the fourteen different Mr models, it further proves that the addition of both standard atmospheric pressure (Pa) and the constant of 1 has little effect on the improvement of prediction accuracy, and that the inclusion of additional model coefficients k4 and k5 is not effective for improving the prediction accuracy of the fourteen different Mr prediction models.

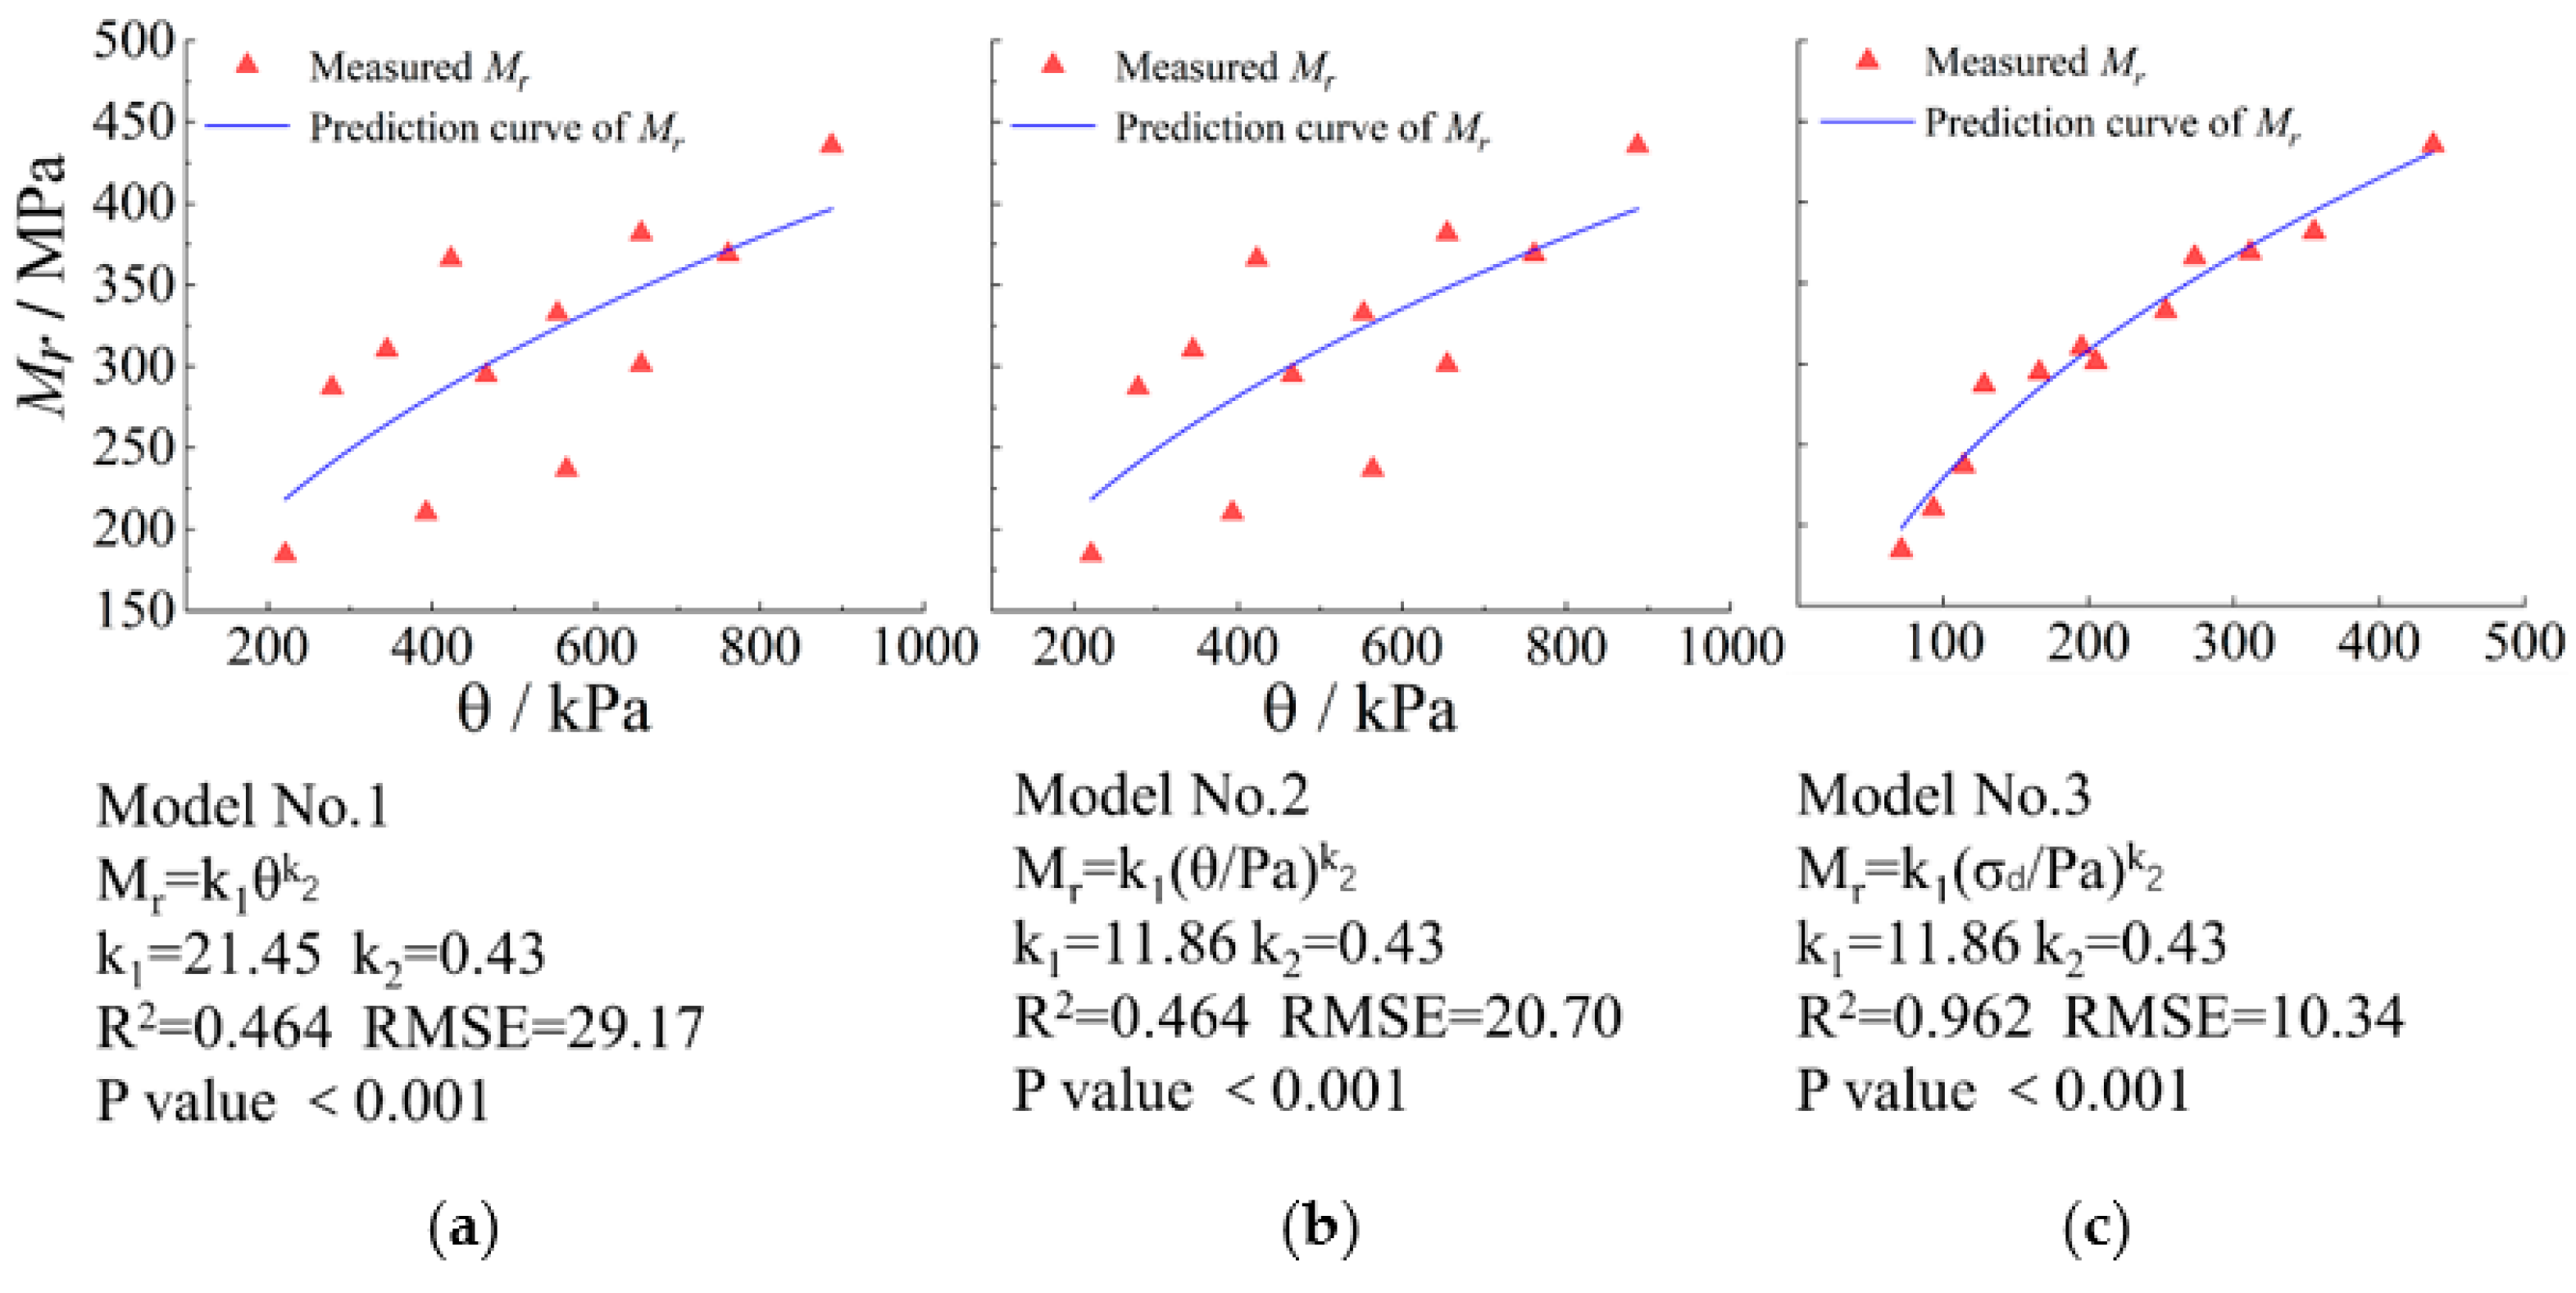
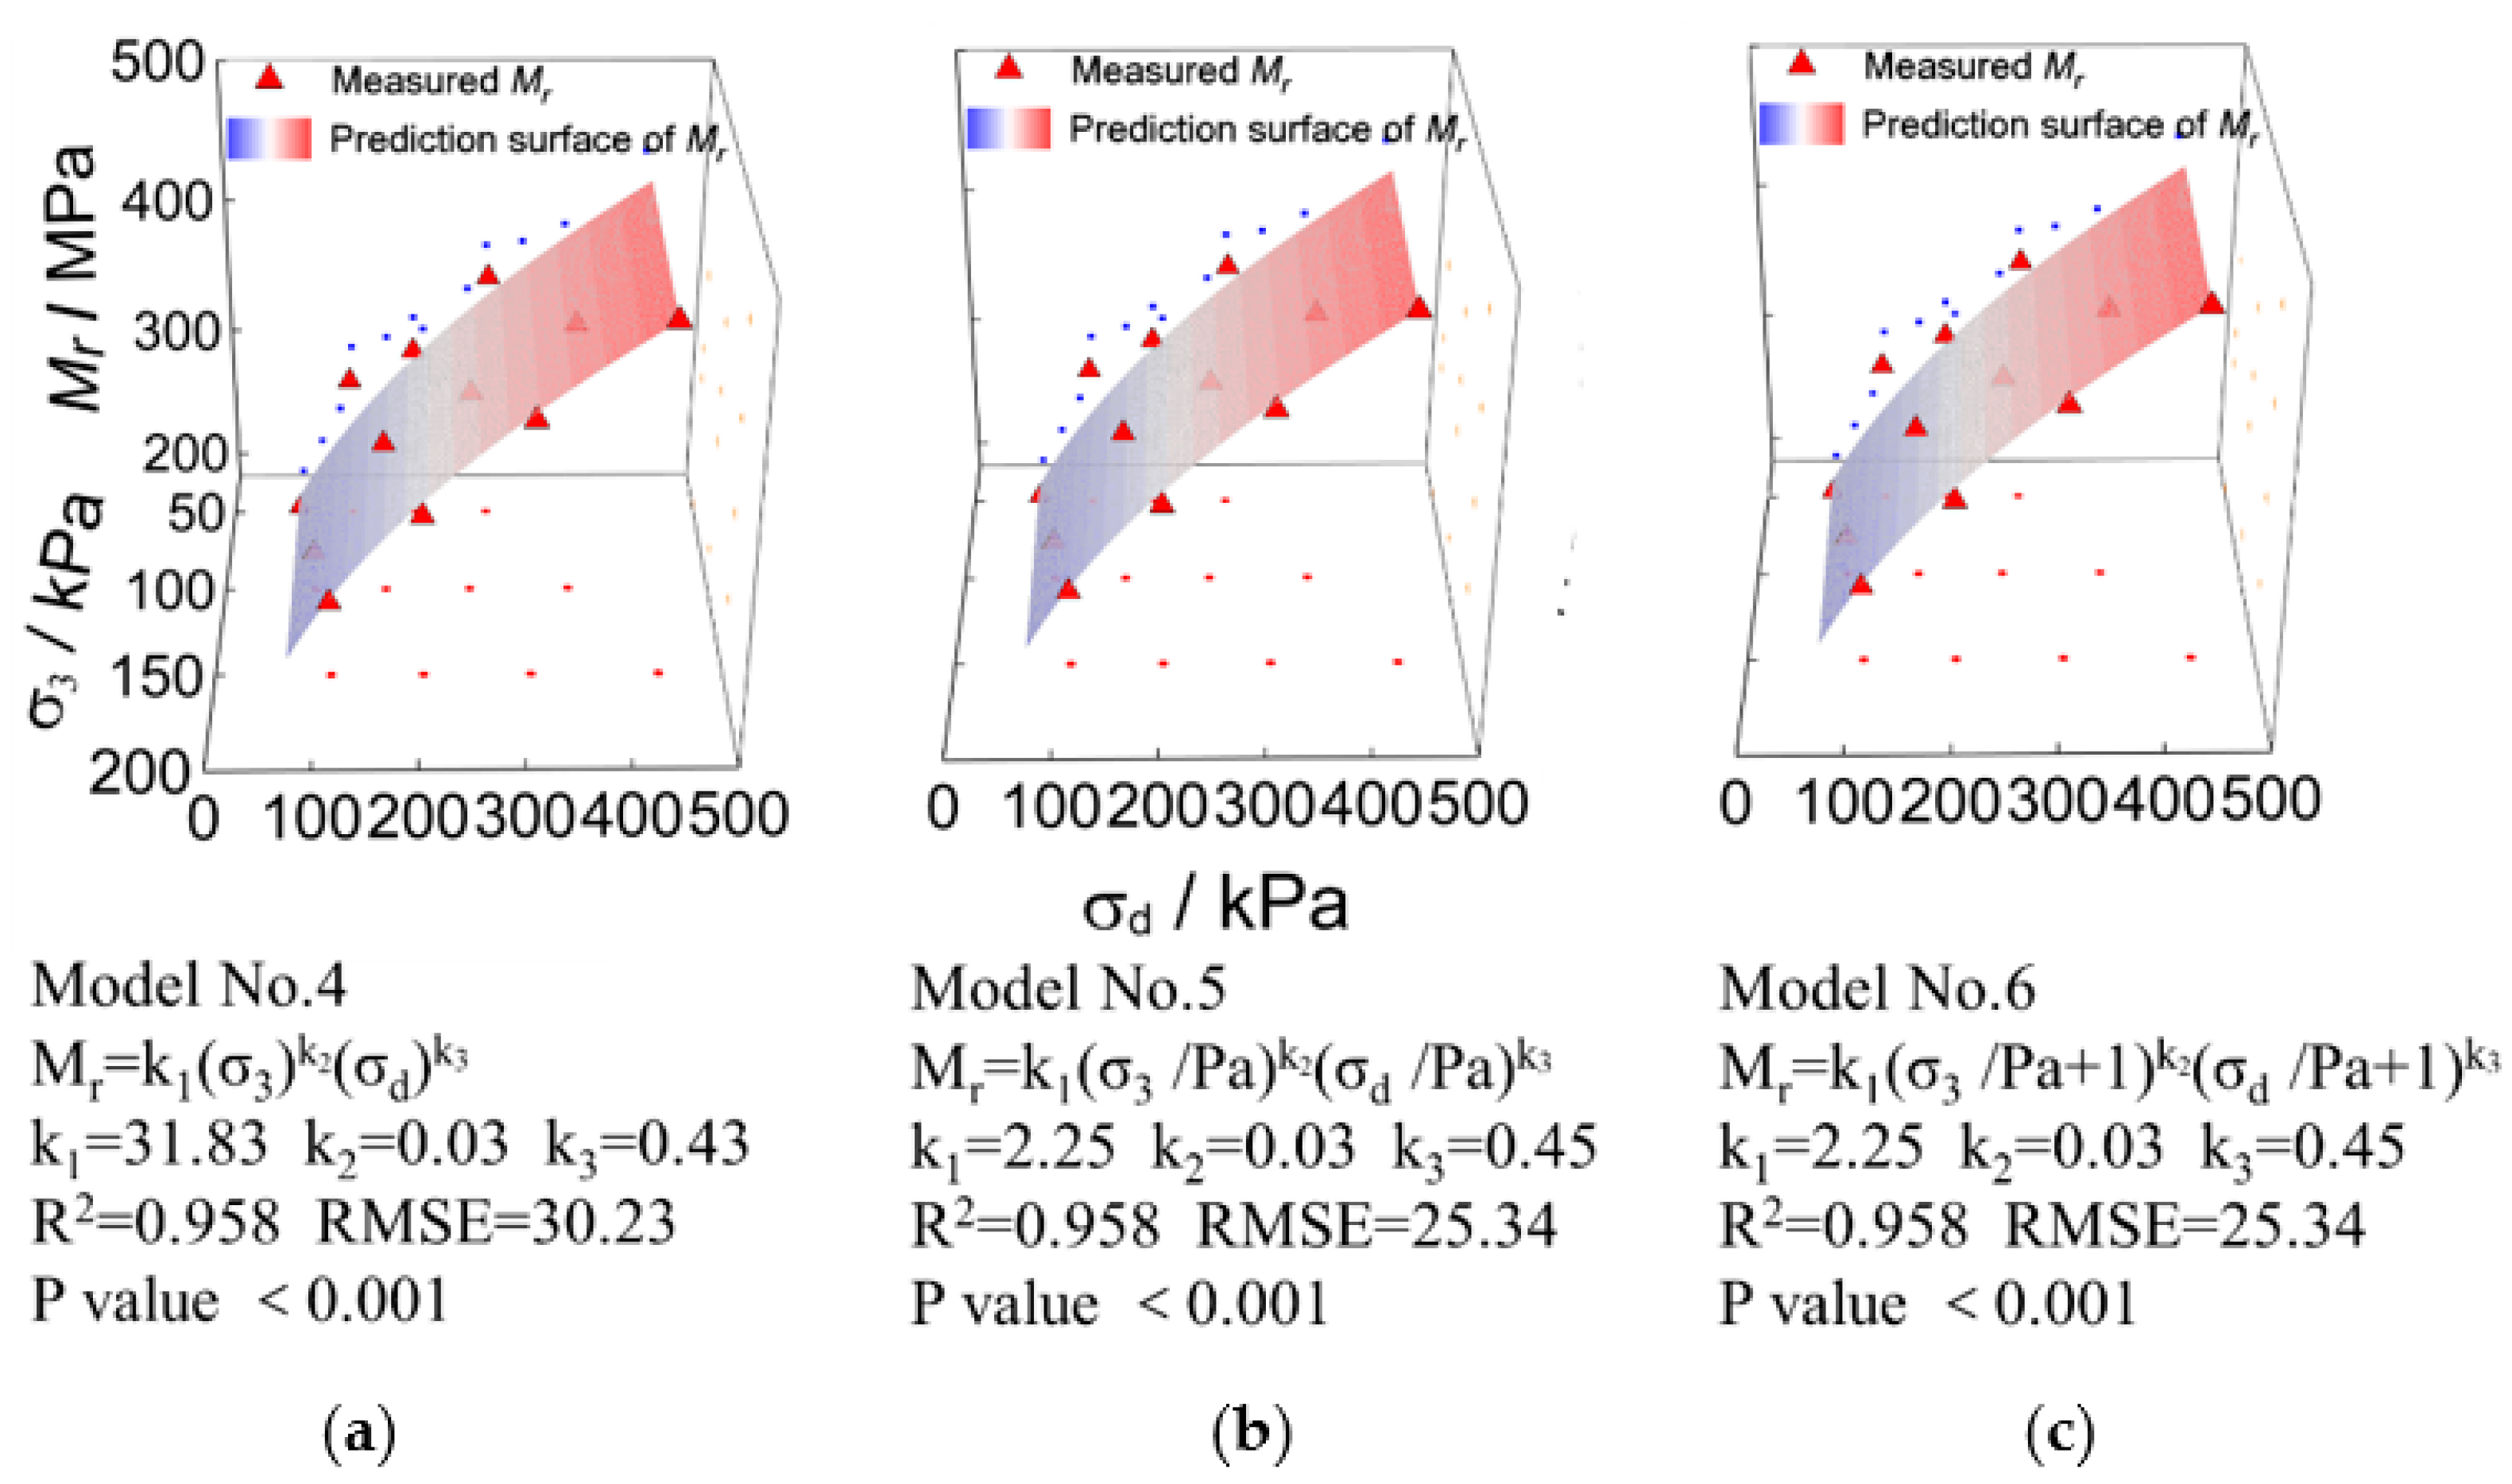
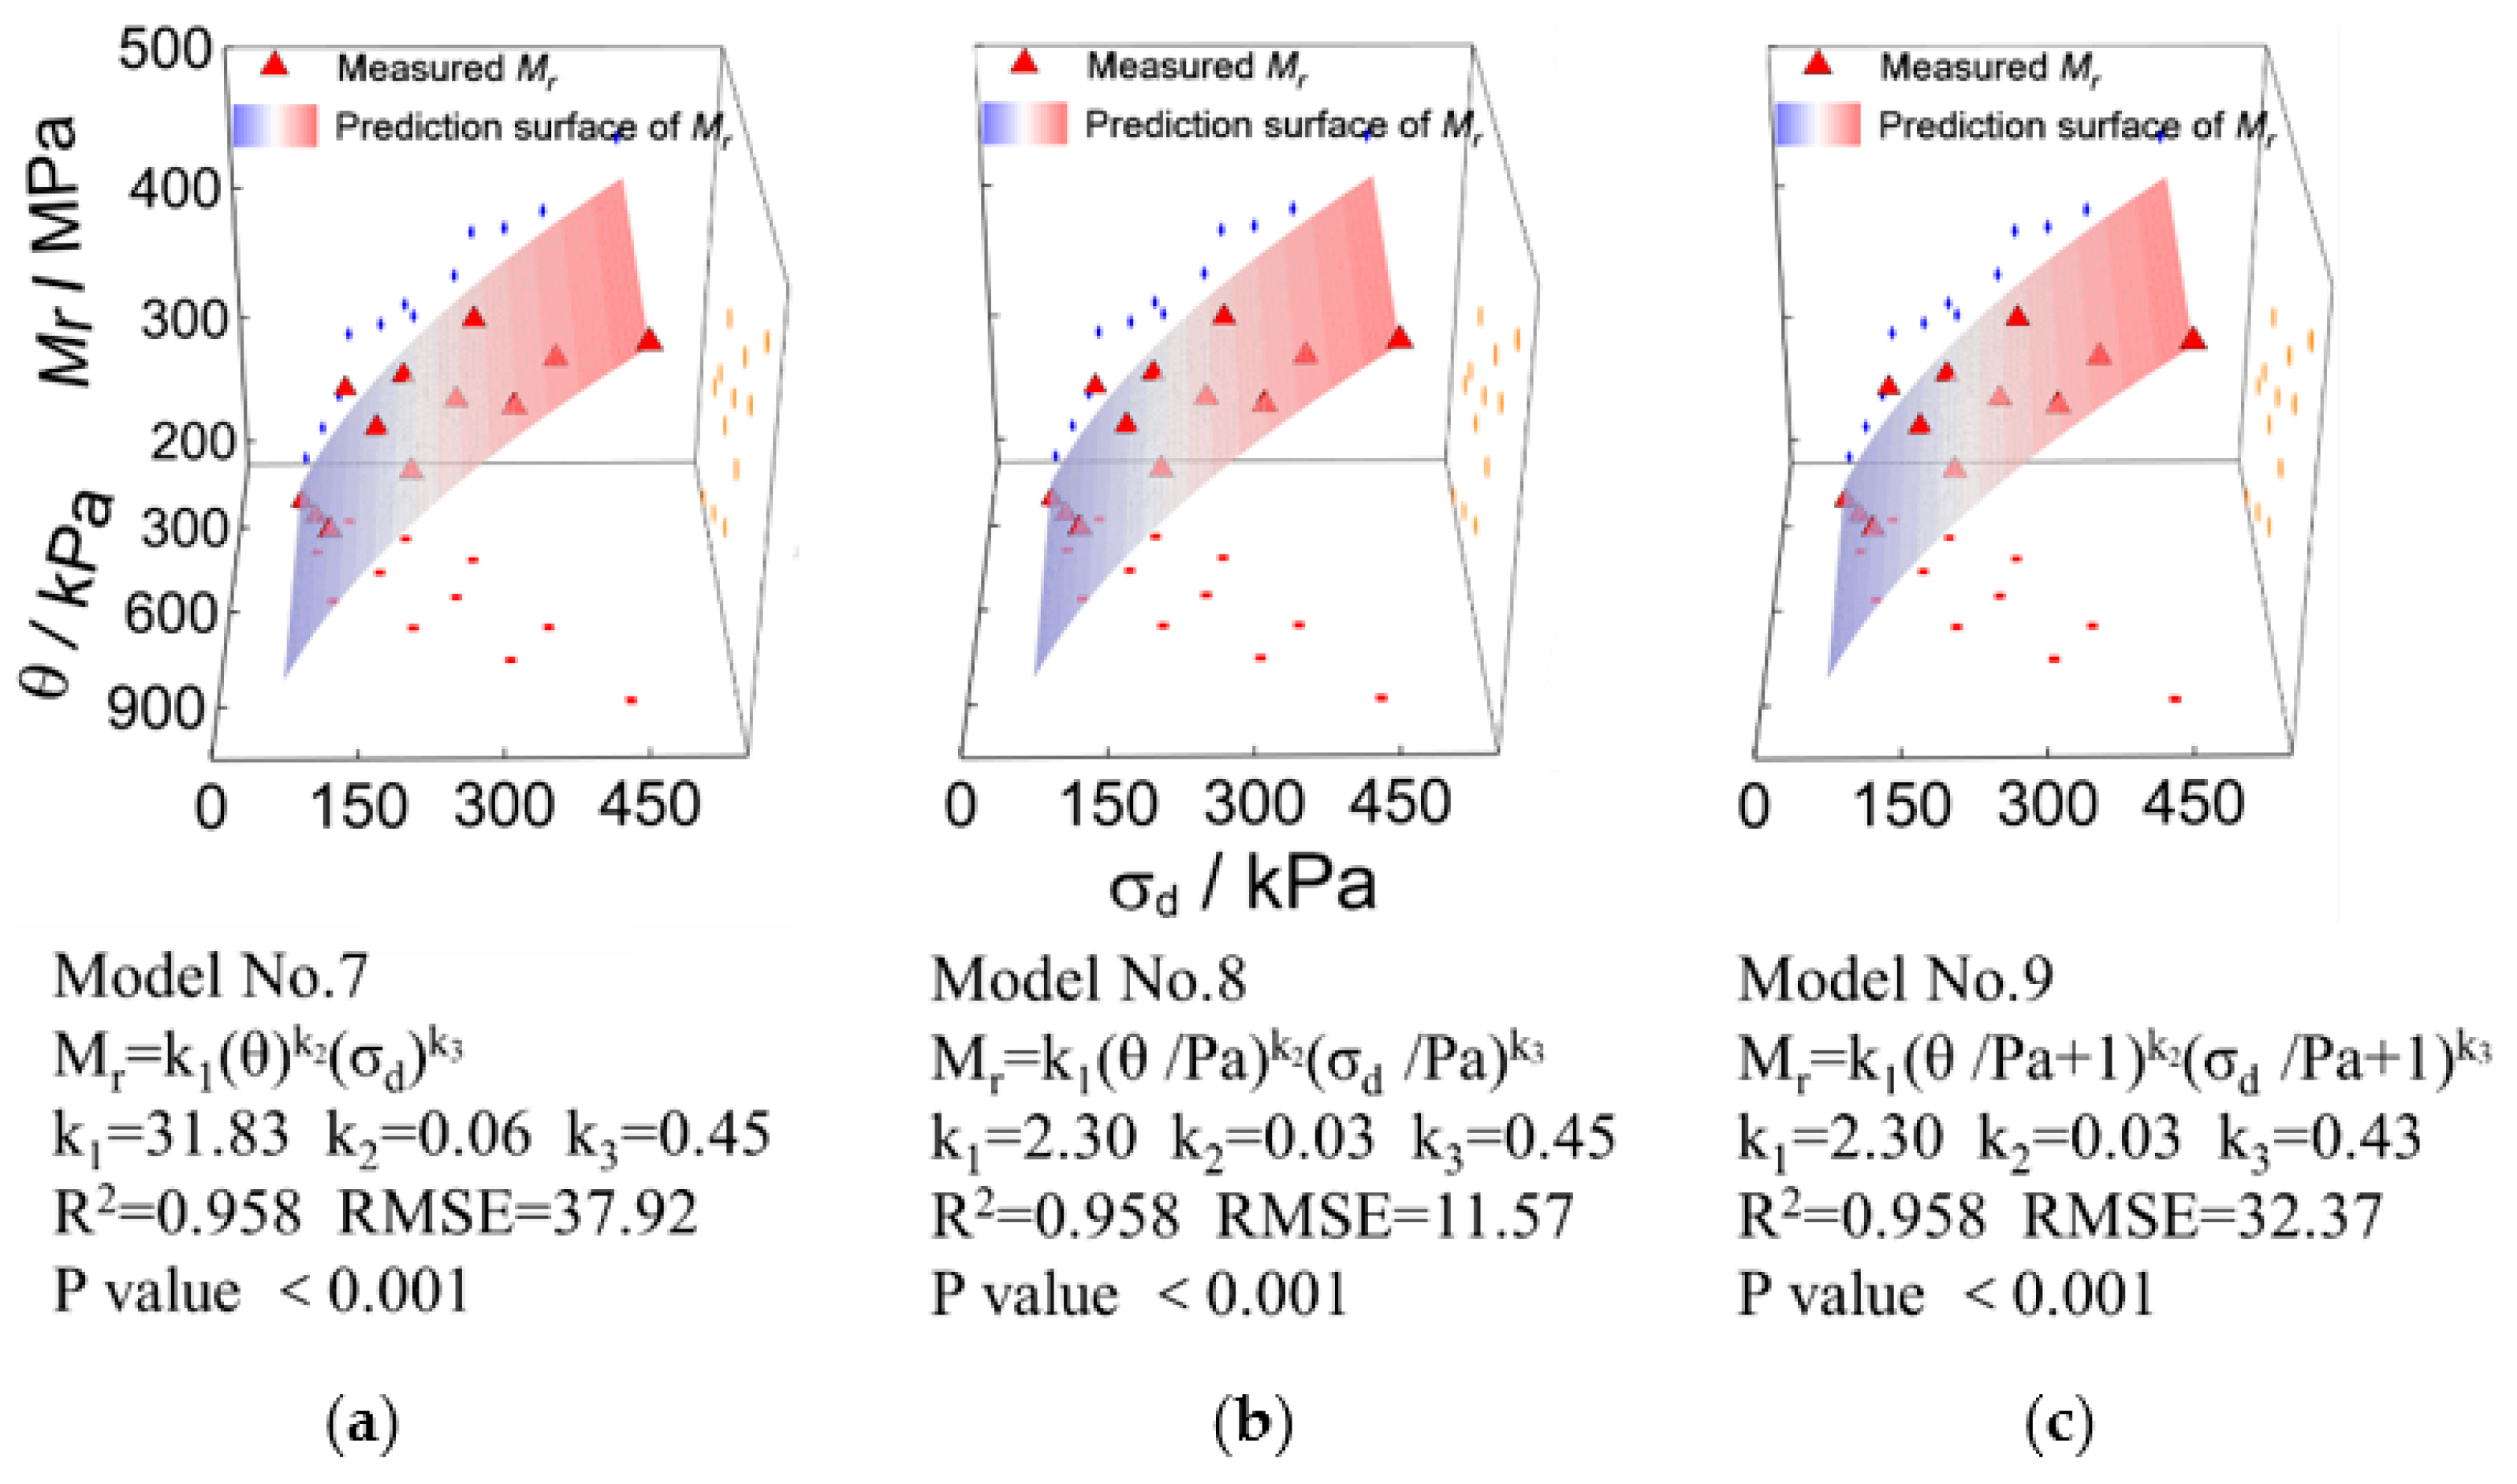
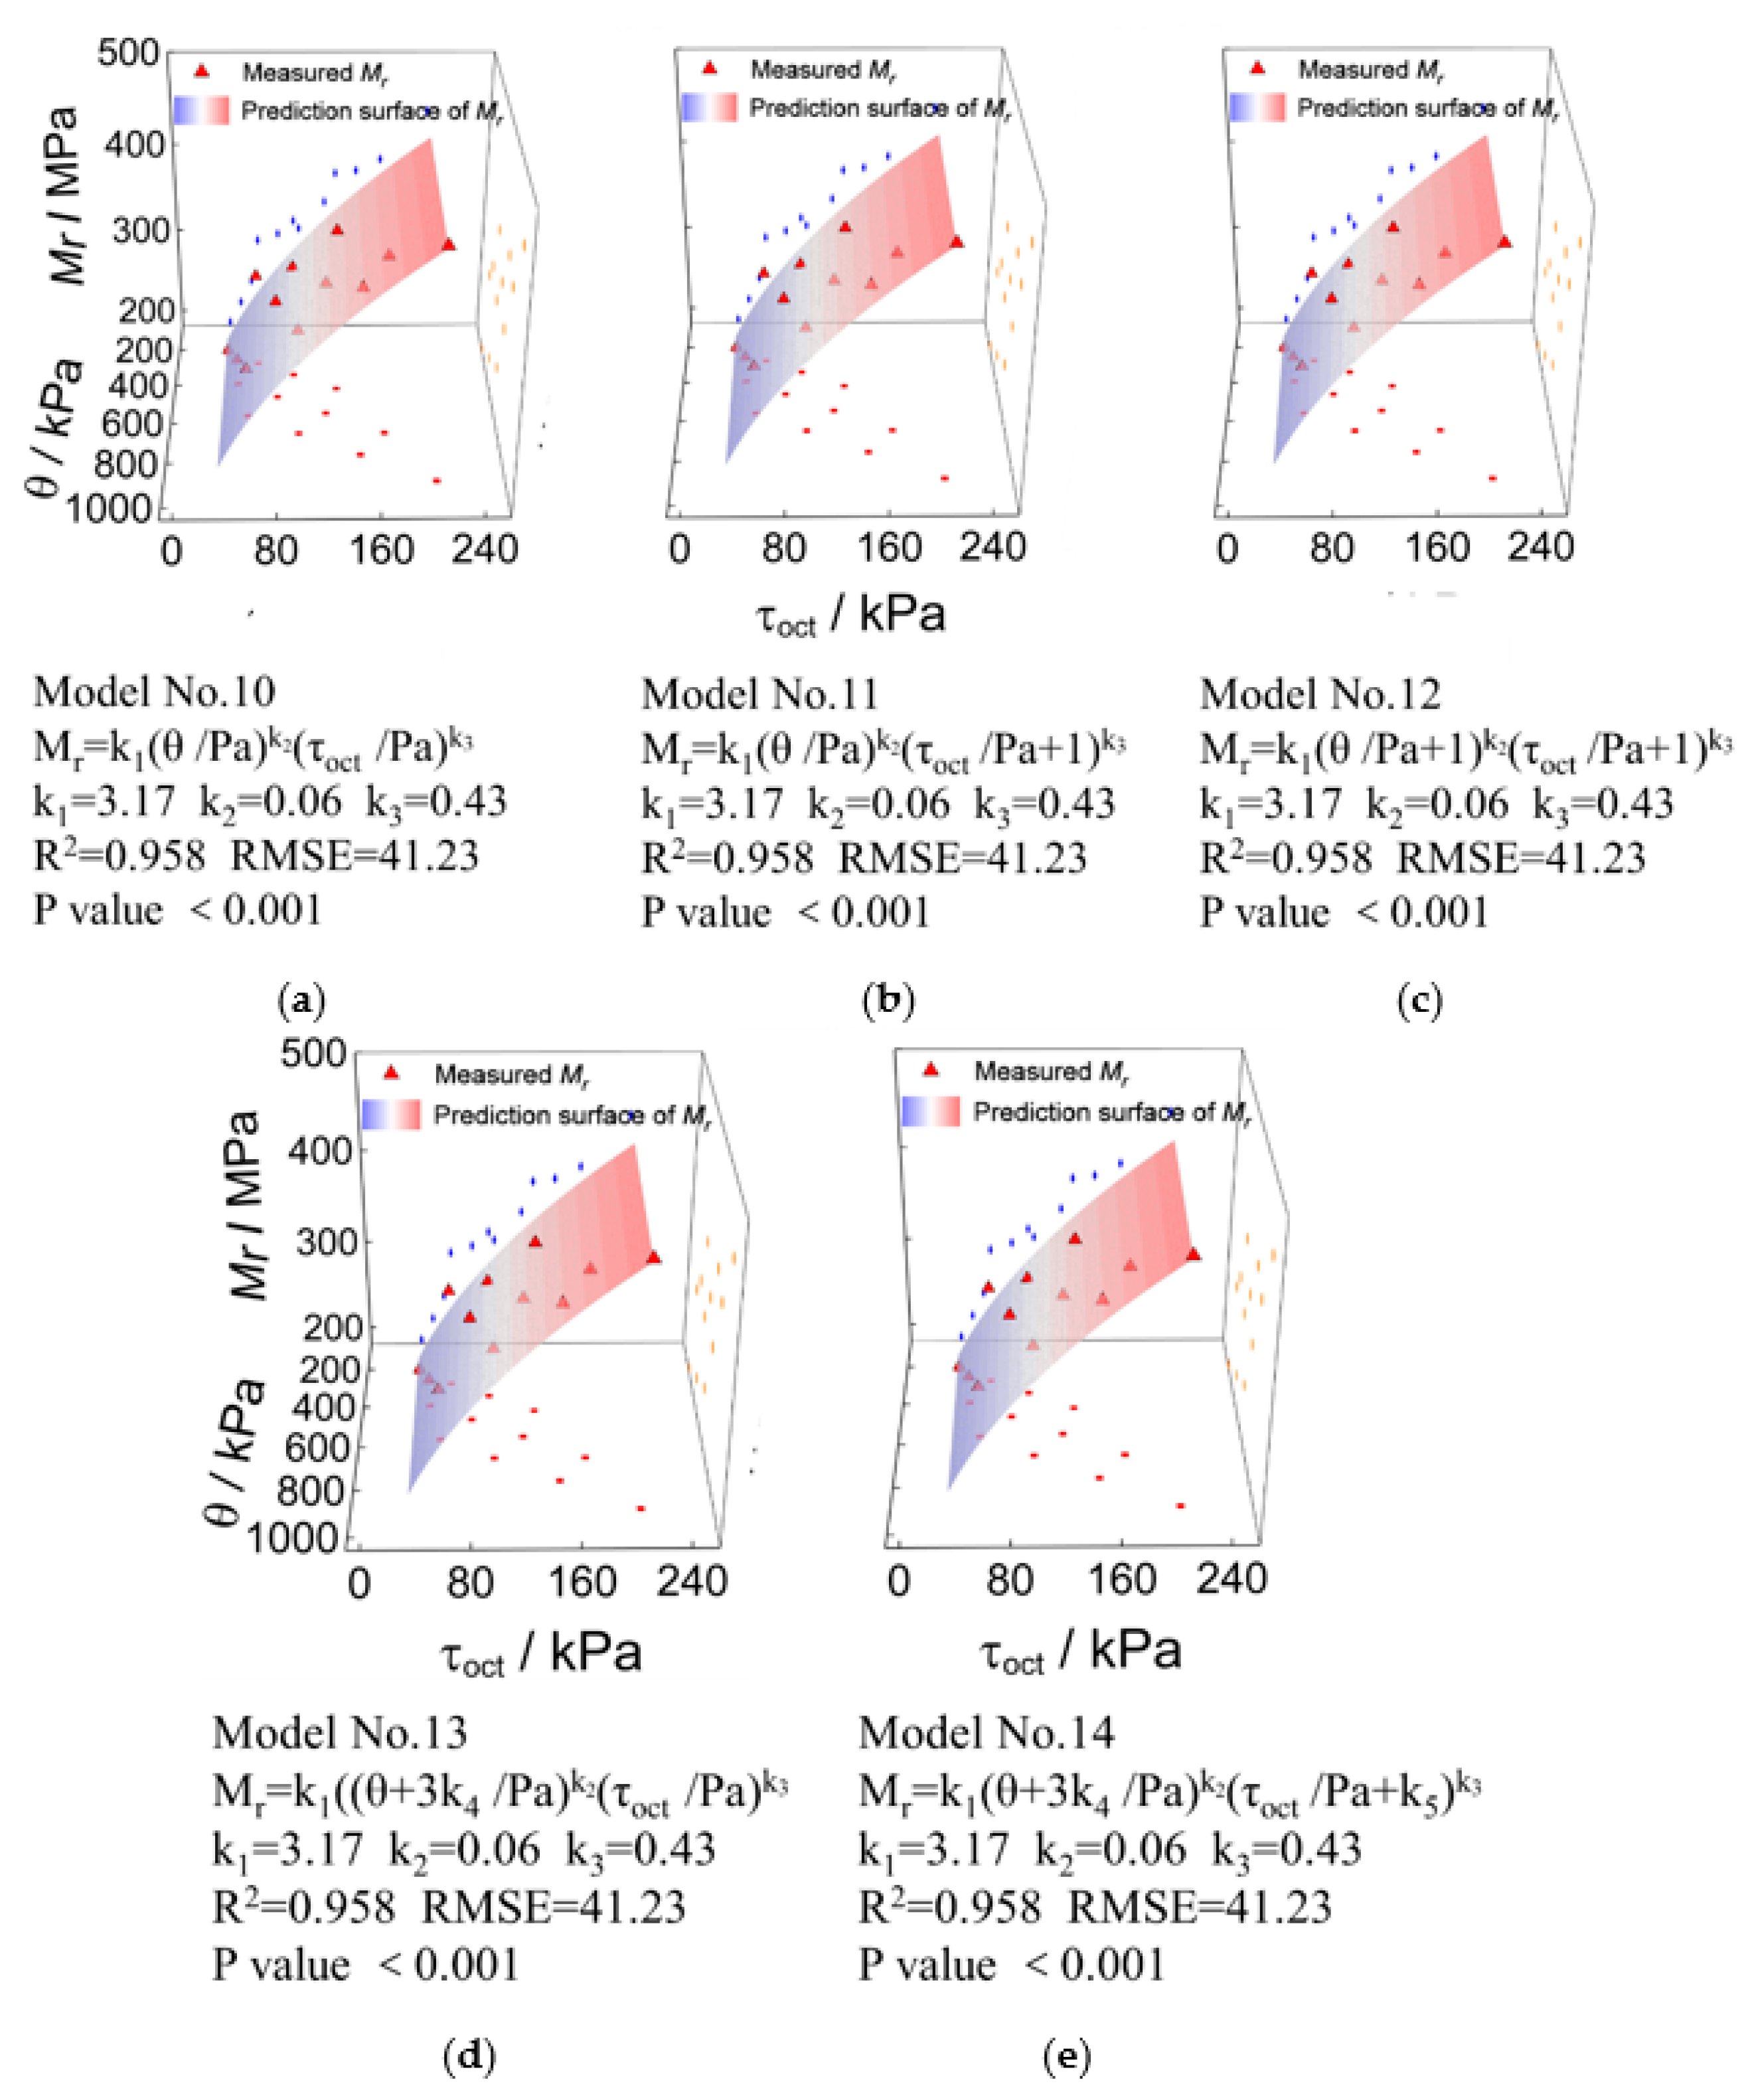
4.2. Comparative Assessment of Existing Classical Mr Prediction Models

The Mr prediction models listed in Table 3 were employed to fit the laboratory-measured representative Mr results under different combinations of G/S levels and stress states. The goodness-of-fit indicators including the coefficient of determination (R2), adjusted R2 (adj. R2), and root mean square error (RMSE) were calculated for comparative assessment of such different Mr models. Since the axial strain (or deformation) of the specimens recorded during each load application of laboratory RLT tests consists of both resilient and plastic parts, the resilient strain induced by each load application can be used to calculate Mr and evaluate its variation with the number of load applications under different combinations of G/S and stress levels, whereas the plastic strain can be used to evaluate permanent deformation accumulation behavior. To facilitate such comparisons, the above-mentioned method I was adopted herein to calculate the representative Mr values of each specimen. The results of such representative Mr values were then fitted by each of the Mr prediction models listed in Table 3 to assess their applicability and accuracy of prediction. The specimens with G/S = 1.0 were taken as examples to illustrate this process and the related results in the following subsections. Although not presented herein for brevity, the comparison results of laboratory-measured versus model-predicted representative Mr values for UPAB specimens with other G/S values than 1.0 (i.e., G/S = 1.6, 1.8, 2.0, or 2.5) also exhibit similar trends and observations to be detailed subsequently.
Figure 12 plots the 12 sets of laboratory-measured representative Mr data for the specimens with G/S = 1.0, along with the results predicted by classical univariate Mr models. It can be seen from Figure 12 that the R2 value is only 0.464 for both Model No. 1 and Model No. 2 incorporating the first principal stress invariant (θ) only. This indicates that the prediction accuracy of both Models No. 1 and No. 2 is poor, and that normalizing the stress variable by the standard atmospheric pressure barely improves model accuracy. In contrast, the R2 value of Model No. 3 incorporating deviatoric stress ( σ d ) only reaches 0.962, thus indicating that the prediction accuracy is relatively satisfactory. It further proves that the correlation between MR and σ d is more significant than θ for UPAB materials studied.
The comparisons of laboratory-measured representative Mr values against predicted values by different bivariate (i.e., σ 3 and σ d ) Mr prediction models are shown in Figure 13 for UPAB specimens with G/S = 1.0. It can be observed from Figure 13 that the R2 values of those bivariate Mr prediction models (i.e., Model No. 4, Model No. 5, and Model No. 6) incorporating both σ 3 and σ d are all above 0.95 and insignificantly different from each other. Due to the dimension inconsistency of Model No. 4, it was abandoned and excluded from further analysis. By comparing the R2 values between Mr prediction models No. 5 and No. 6, it can be found that the addition of the constant of 1 to stress variables in Model No. 6 results in almost negligible difference in prediction accuracy.
Figure 14 shows the comparisons of laboratory-measured and model-predicted representative Mr values for the UPAB specimens with G/S = 1.0. The Mr prediction models compared are bivariate (i.e., θ and σ d ) as well. It can be seen from Figure 14 that the R2 values of those bivariate Mr prediction models (i.e., Model No. 7, Model No. 8, and Model No. 9) are all above 0.95. Similar to the bivariate models incorporating σ 3 and σ d (i.e., Model No. 6), the addition of the constant of 1 to the stress variables θ and σ d in Model No. 9 also results in little improvement in the accuracy of model prediction.
Similarly, the laboratory-measured representative Mr values and those predicted by other prediction models incorporating the first principal stress invariant (θ) and the octahedral shear stress ( τ o c t ) (i.e., Models No. 10 to No. 14) are compared and plotted in Figure 15 for the UPAB specimens with G/S = 1.0. It can be seen from Figure 15 that the R2 values of Models No. 10, No. 11, and No. 12 are consistent, thus indicating that the addition of standard atmospheric pressure (Pa) and the constant of 1 has little effect on improving the prediction accuracy. However, the R2 values of Models No. 14 and No. 15 slightly decrease as compared to those of Models No. 10 to No. 12, indicating that the addition of model coefficients k4 and k5 is not effective for accuracy improvement.

4.3. Selection of the Optimal Classical Mr Prediction Model

The aforementioned Mr prediction models with R2 values greater than 0.95 were further shortlisted to perform additional assessment. Due to the dimension inconsistency existing in the formulas of Models No. 4 and No. 7, they were excluded from further analysis. As presented previously, the addition of standard atmospheric pressure (Pa) and the constant of 1 has little effect on the improvement of prediction accuracy, and the inclusion of additional model coefficients k4 and k5 reduces the prediction accuracy. Therefore, the focus was to further compare Models No. 3, No. 5, No. 8, and No. 10 through comprehensive statistical analysis. Table 4 summarizes the statistics of the residual eigenvalues between the laboratory-measured representative Mr values and their counterparts predicted by Models No. 3, No. 5, No. 8, and No. 10 for the entire UPAB specimens, respectively. Model No. 8 is observed to have the lowest residual sum of squares, variance, root mean square error (RMSE), and Akaike information criterion (AIC) index, as compared to the other three models. In addition, the skewness of Model No. 8 is the lowest and its kurtosis is relatively large, thus indicating that its residual distribution is the closest to the normal distribution and its goodness-of-fit is the best. Therefore, in terms of the overall prediction accuracy, Model No. 8 is the best among the four Mr models evaluated for the UPAB materials studied. Figure 16 plots the P–P diagrams of the normalized residuals between the measured and predicted representative Mr values. Note that the P–P diagrams were drawn according to the relations between the cumulative proportions of predicted Mr values and those of the normal distributions. That is, when the dataset conforms to the normal distribution, each data point approximately falls on the straight line of normal distribution in the P–P graph. It can be found from Figure 16 that the normal P–P diagrams of the standardized residuals generated by the four Mr prediction models all coincide approximately with the straight line. The P–P diagram of Model No. 8 is much closer to the straight line than those of other models. This further confirms that the goodness-of-fit of Model No. 8 is the best among those four models evaluated.
Hence, the optimal prediction model was determined to be Model No. 8. It was then used to fit the measured representative Mr data of the UPAB specimens tested under different combinations of G/S levels and stress states in the laboratory repeated load triaxial tests. The model coefficients k1, k2, and k3 and related adjusted coefficient of determination (Adj. R2) were determined for each G/S level accordingly and are listed in Table 5. It can be seen from Table 5 that as the G/S value increases, the Adj. R2 value decreases but is still greater than 0.85. The values of the model coefficient k1 are quite different among different G/S values, while the values of model coefficients k2 and k3 show insignificant difference with more concentrated distributions.

4.4. Modification of the Optimal Mr Prediction Model

As shown previously, the values of the three model coefficients k1, k2, and k3 of the optimal Mr prediction Model No. 8 are considerably different from each other. In order to further address the influences of gradation variation (quantified by varying G/S levels), statistical correlation analysis was performed between the gradation control parameter G/S and the fitted model coefficients k1, k2, and k3. Different types of fitting functions (e.g., linear, quadratic, power, and logarithmic) were attempted, respectively. It was found by trial and error that there exists a statistically significant quadratic function relating model coefficient k1 and the gradation parameter G/S, and a power function relating k2 and G/S. However, k3 and G/S are not statistically correlated. Therefore, Equations (8) and (9) were obtained accordingly, thus leading to the modified version of the Mr prediction Model No. 8, as formulated in Equation (10). Note that the model coefficient k3 in the Mr prediction Model No. 8 varied insignificantly among different G/S levels and thus was eventually set as the constant of 0.405, the average k3 value from different G/S levels.
k1 = 0.421(G/S)2 − 1.6895(G/S) + 3.552
k 2 = 0.0629 ( G / S ) 1.0432  
M r = ( 0.421 ( G / S ) 2 1.6895 ( G / S ) + 3.552 ) P a ( θ P a ) 0.0629 ( G / S ) 1.0432 ( σ d P a ) 0.405  
where Mr is resilient modulus, k1 and k2 are model coefficients to be regressed, G/S is the gradation control parameter, σ d is deviatoric stress (kPa), θ is the first principal stress invariant (kPa), and Pa is the standard atmospheric pressure.
In order to substantiate the validity and accuracy of the above-modified optimal Mr prediction model (see Equation (10)), its predicted representative Mr values were compared against the laboratory-measured counterparts of a total of 60 UPAB specimens, as shown in Figure 17b. It can be clearly seen from Figure 17b that the prediction errors increase with increasing Mr values, and that the prediction errors for greater Mr values are mainly attributable to the specimens with G/S values of 2 and 2.5. Therefore, it becomes imperative to further improve Equation (10) by dividing it by the arithmetric square root of the gradation parameter G/S, as shown in Equation (12).
M r = [ 0.421 ( G / S ) 1.5 1.6895 ( G / S ) 0.5 + 3.552 ( G / S ) 0.5 ] P a ( θ P a ) [ 0.0629 ( G / S ) 1.0432 ] ( σ d P a ) 0.405
The representative Mr values of all the UPAB specimens predicted by Equation (11) were compared against their laboratory-measured counterparts accordingly. Figure 17c shows that the resulting R2 value of Equation (11) increases from 0.73 to 0.83 as compared to Equation (10), indicating that the modification made to Equation (10) (i.e., Equation (11)) is effective in terms of enhancing the Mr prediction accuracy for UPAB materials. The prediction accuracy of the original Mr Model No. 8 is shown in Figure 17a as well, where the R2 value only reaches 0.53 and is much lower than that yielded by the modified model (i.e., Equation (11)). Therefore, the modified model formulated in Equation (11) was finalized as the optimal Mr prediction model.

4.5. Parametric Sensitivity Analysis of the Final Optimal Mr Predictive Model

The sensitivity of Mr to gradation variations under different stress states was studied by using the final optimal Mr prediction model (i.e., Equation (11)). The results of such parametric sensitivity analysis are plotted in Figure 18. It can be seen from Figure 18 that for G/S values within the range of 1.0–2.5, the representative Mr value predicted by Equation (11) decreases with increasing G/S value under the same combination of confining pressure and deviatoric stress, that is, as the content of fine particles decreases, the representative Mr values decrease. In addition, the gradation variation has a much greater influence on the representative Mr for lower G/S values. This implies that the representative Mr is more sensitive to the gradation variation for UPAB materials with higher fraction of fine particles. In contrast, the gradation variation has little effect on the representative Mr for relatively large G/S value, i.e., the representative Mr is less sensitive to the gradation variation for the UPAB materials with higher fraction of coarse particles.

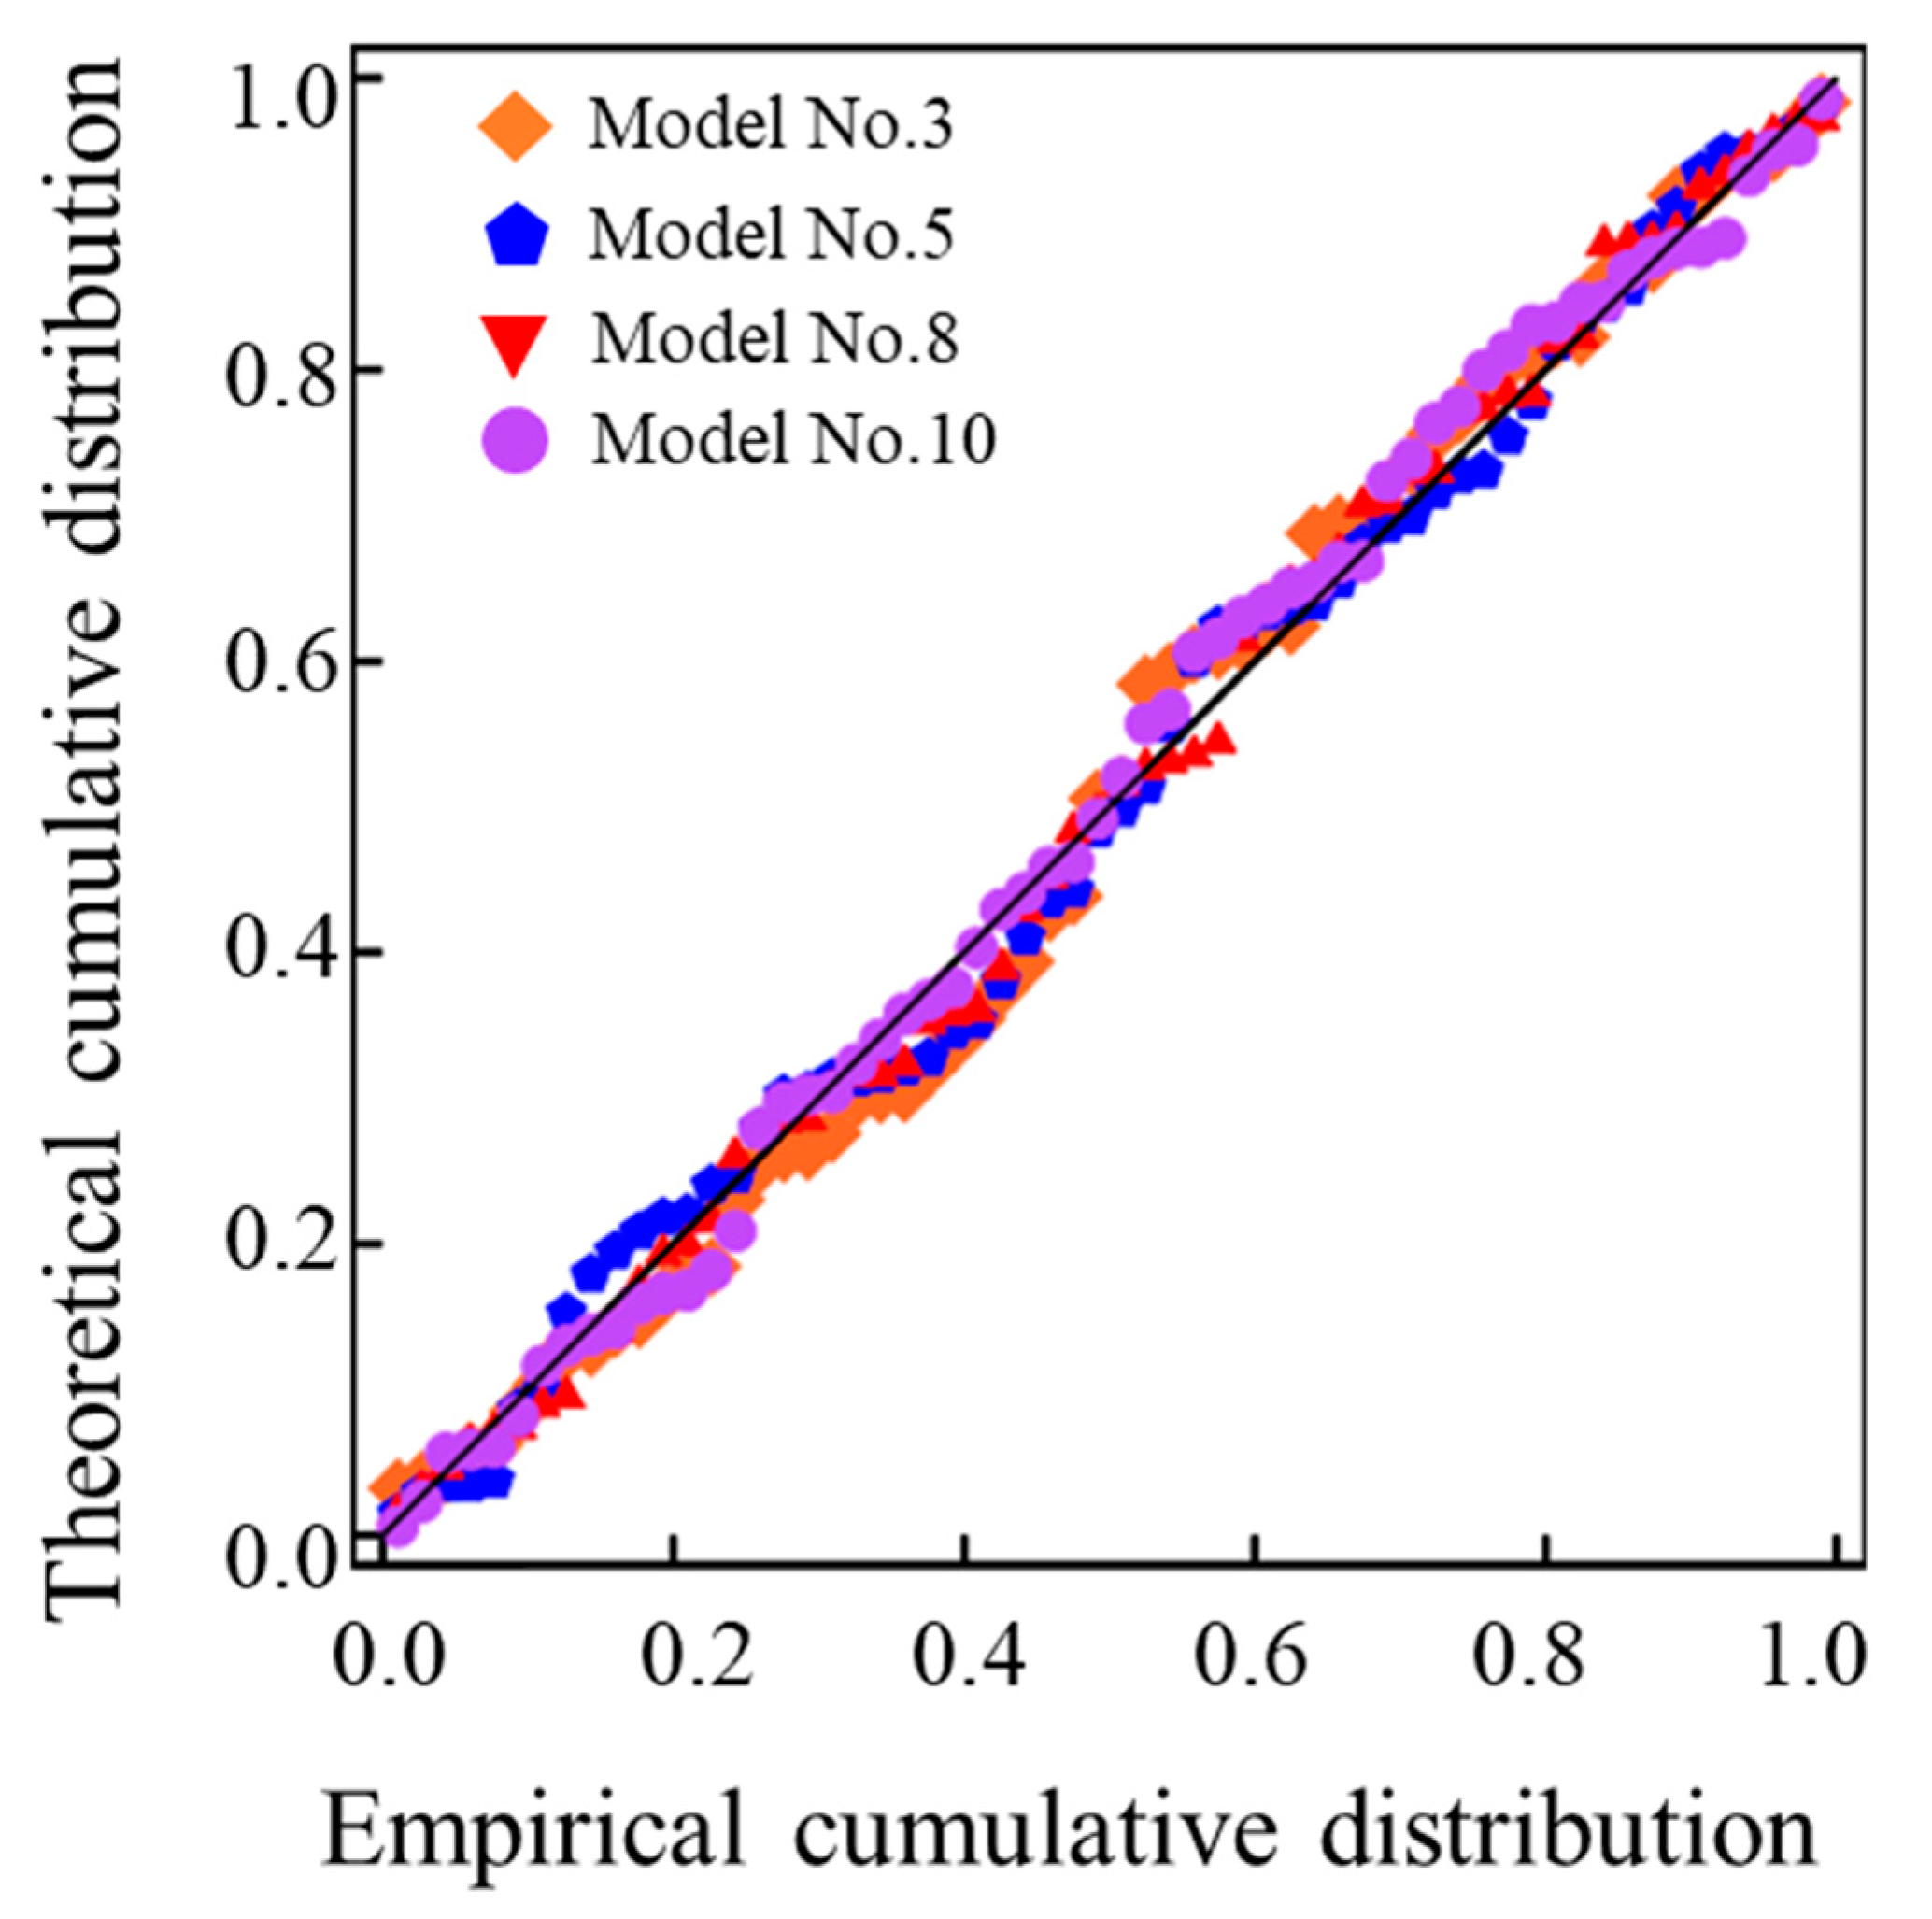
5. Verification of the Developed Resilient Modulus Prediction Model

The additional external resilient modulus database was collected from the literature [67,68] to further verify the previously developed and validated Mr prediction model (i.e., Equation (11)). The three different types of commonly-used unbound aggregate materials were tested, i.e., uncrushed gravel, crushed limestone, and crushed dolomite. Four different levels of fines content (i.e., materials passing No. 200 or 0.075 mm sieve) were designed for each type of unbound aggregate materials, i.e., 4%, 8%, 12%, and 18%. They correspond to the G/S values of 1.39, 1.43, 1.49, and 1.55, respectively. In addition, two different types of fines, i.e., plastic (clay with plasticity index of 10–20%) and nonplastic (mineral powder with plasticity index of near zero), were used for each type of unbound aggregate materials as well. Although each type of unbound aggregate materials was tested under three different levels of moisture content (i.e., 90% × wopt, wopt, and 110% × wopt) to study the influence of moisture content, only the Mr data measured at the optimal conditions were selected for use in the model verification, as the final optimal Mr prediction model was previously developed using the Mr data measured at the optimal conditions only in this study. Table 6 summarizes the basic physical properties of the three different types of unbound aggregate materials tested in the literature [67,68].
By using the above-mentioned external Mr datasets, Table 7 compares the laboratory-measured Mr values against those predicted by the final optimal model established in Equation (11) for each of the three different types of unbound aggregate materials. It can be seen from Table 7 that the Mr prediction model established in this study for UPAB materials is also reasonably accurate for the external unbound aggregates with different combinations of mineralogy, fines content, and plasticity index of fines. Overall, it works better for either limestone aggregate materials or aggregate materials with plastic fines as compared to other materials. Note that the model coefficients in Equation (11) need to be calibrated (or updated) due to the differences in specific physical properties between the external materials from the literature and those tested in this study. Therefore, to further improve the prediction accuracy, the model coefficients related to the G/S parameter were set to be regressed, thus yielding Equation (12).
M r = [ m 1 ( G S ) 1.5 + m 2 ( G / S ) 0.5 + m 3 ( G / S ) 0.5 ] P a ( θ P a ) [ m 4 ( G / S ) m 5 ] ( σ d P a ) m 6
where Mr is resilient modulus; m 1 , m 2 , m 3 , m 4 , m 5 , and m 6 are model coefficients to be regressed; G/S is the gradation control parameter; σ d is deviatoric stress; θ is the first principal stress invariant; and Pa is the standard atmospheric pressure.
The comparison results of laboratory-measured Mr values and those predicted by Equation (12) for the above-mentioned external Mr datasets are plotted in Figure 19. It shows that the prediction accuracy for the three different types of unbound aggregate materials is improved considerably, with Adj. R2 values all greater than 0.90. Additionally, the prediction accuracy for limestone aggregate materials or those with plastic fines is relatively the best, which is consistent with the aforementioned results obtained by Equation (11).

6. Summary and Conclusions

In this study, five different gradations were designed to study the gradation effect on resilient modulus behavior of TRW-derived UPAB materials. Laboratory repeated load triaxial tests were conducted under different combinations of confining pressure and cyclic deviator stress as controlled by the levels of the shear stress ratio (SSR). The Mr prediction model incorporating both gradation and stress state parameters was developed from all the 60 TRW-derived UPAB specimens tested, and the validity and applicability of the developed model were further verified by external laboratory testing database. The major findings of this study are summarized as follows.
(1)
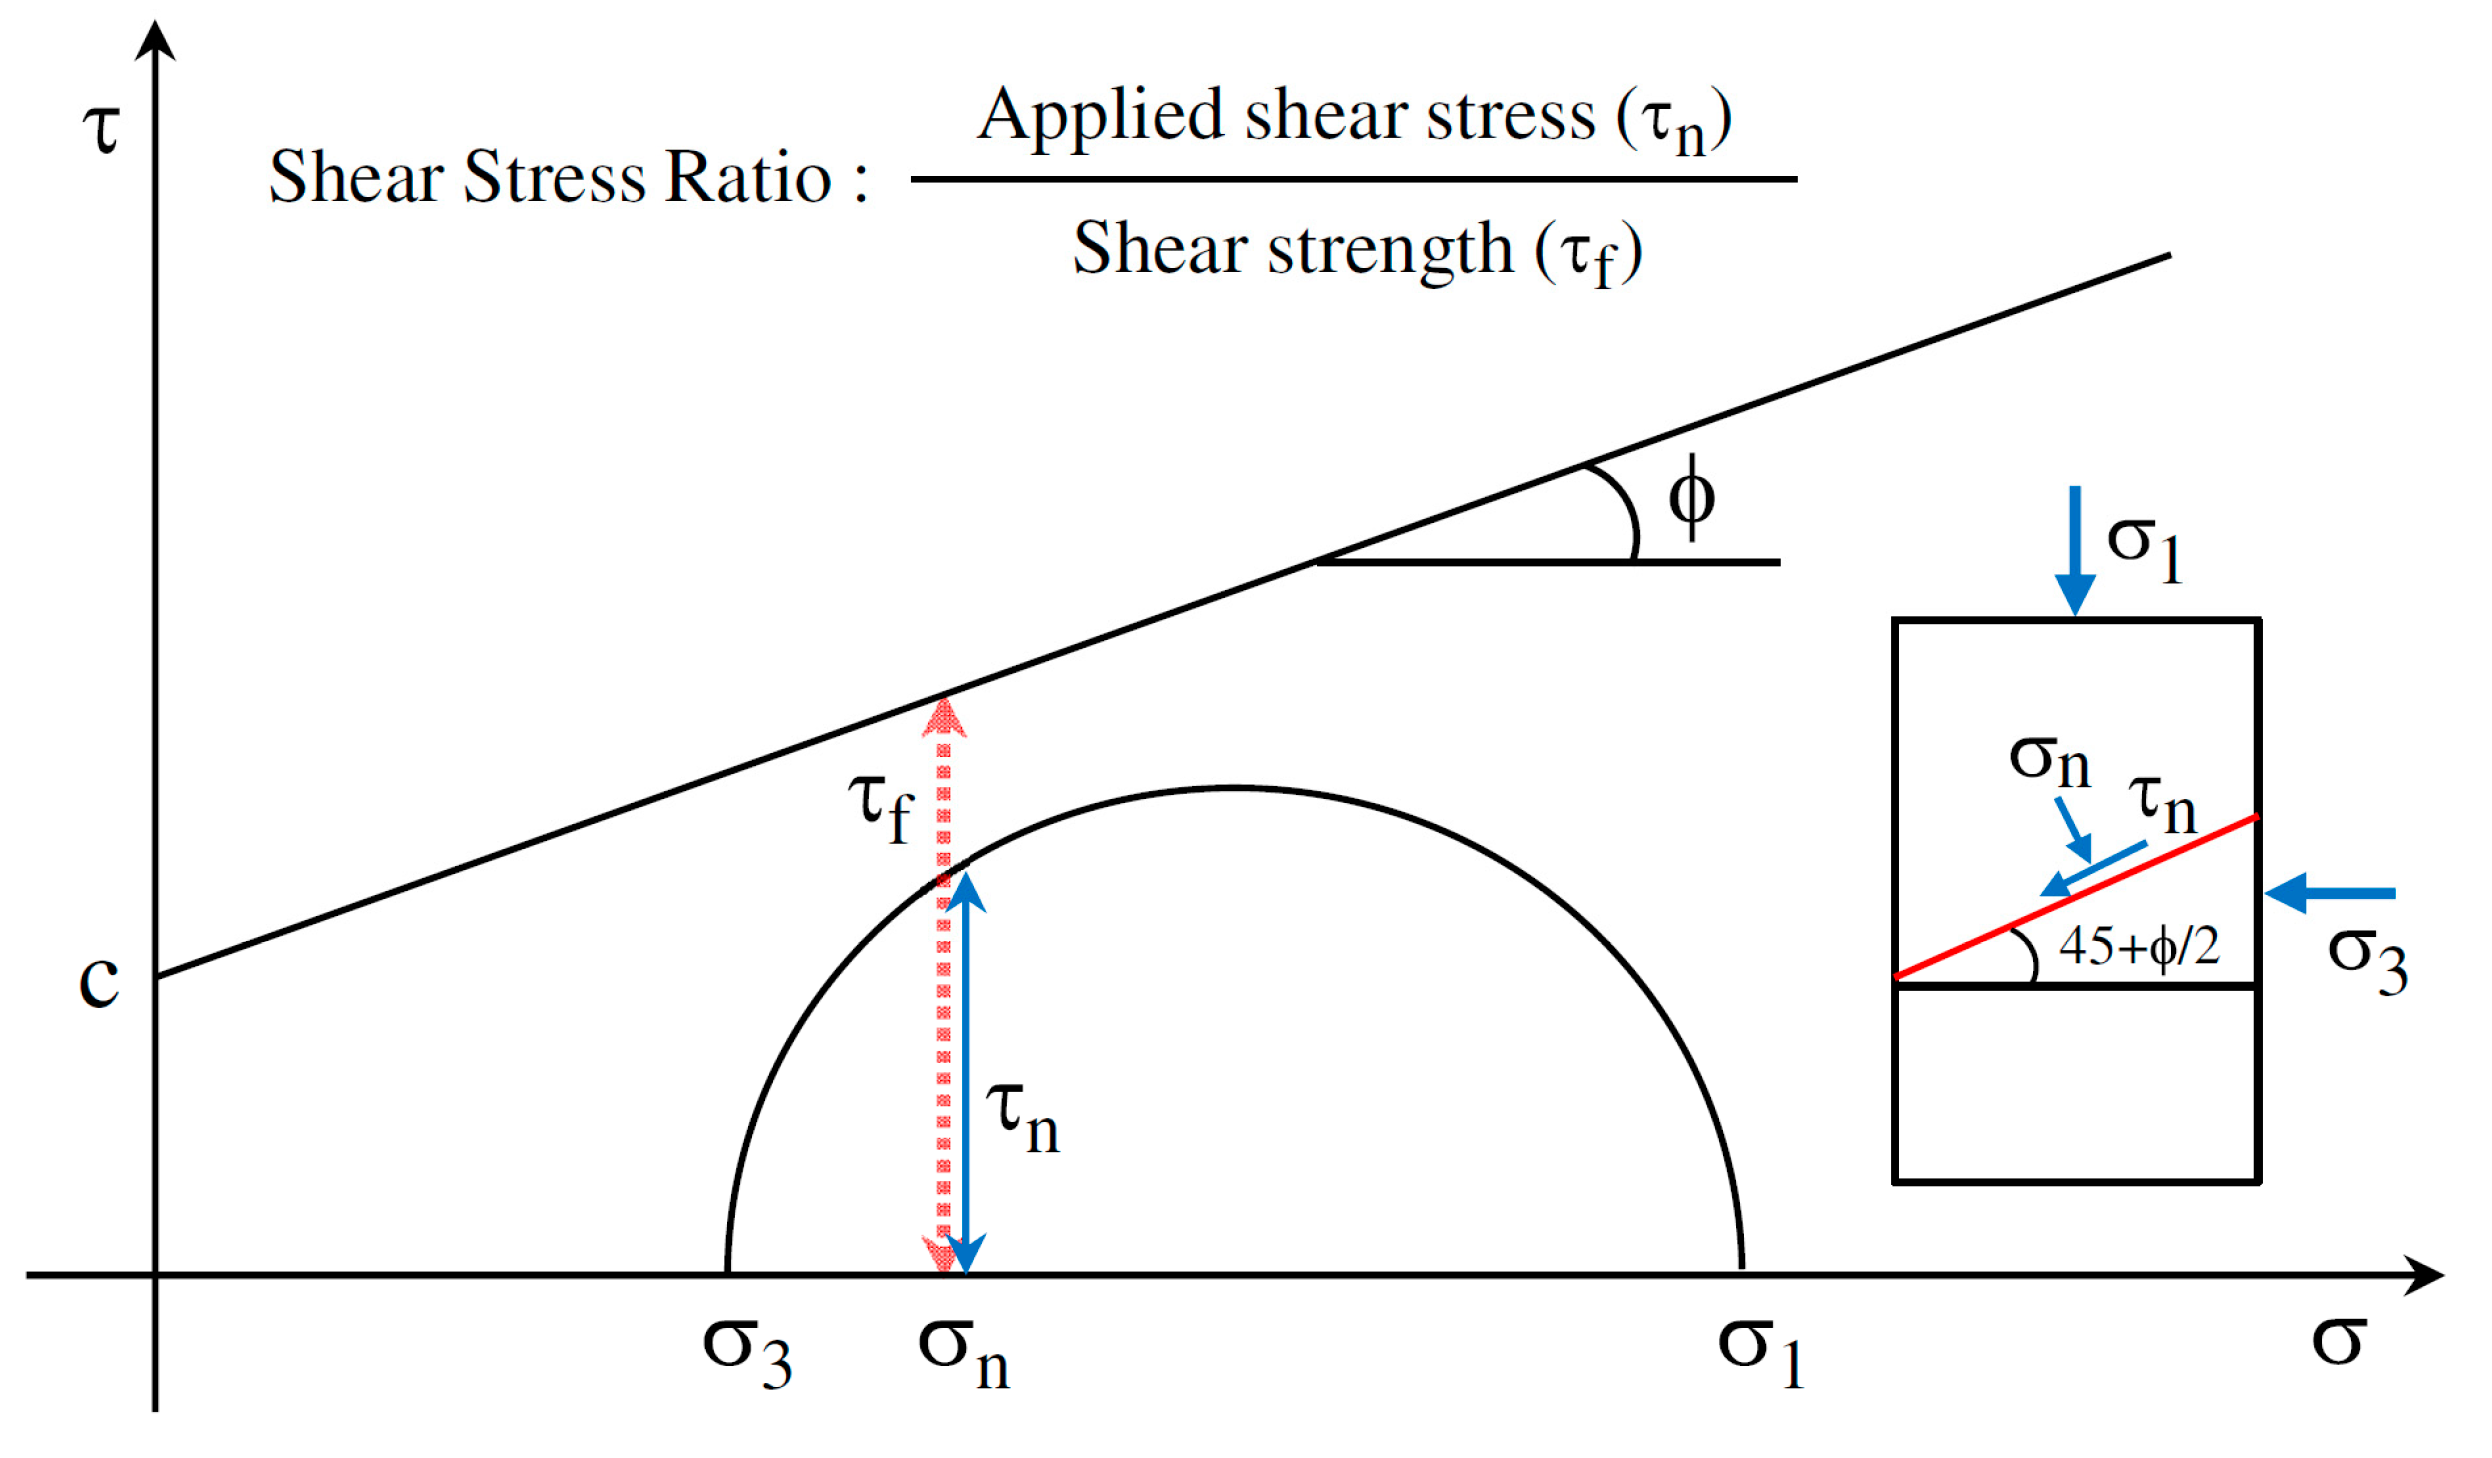
The Mr values of the TRW-derived UPAB materials studied increase rapidly with increasing number of load applications. Under the same G/S value and confining pressure level, the higher the shear stress ratio (SSR) is, the greater the final Mr values are, and the more significant the effect of gradation (G/S) on Mr is. Under the same SSR level, the increase of confining pressure alleviates the effect of gradation (G/S) on Mr of the TRW-derived UPAB materials studied. There appears to exist an optimal G/S value of around 1.6–1.8 that yields the best resilient modulus behavior of the TRW-derived UPAB materials studied.
(2)
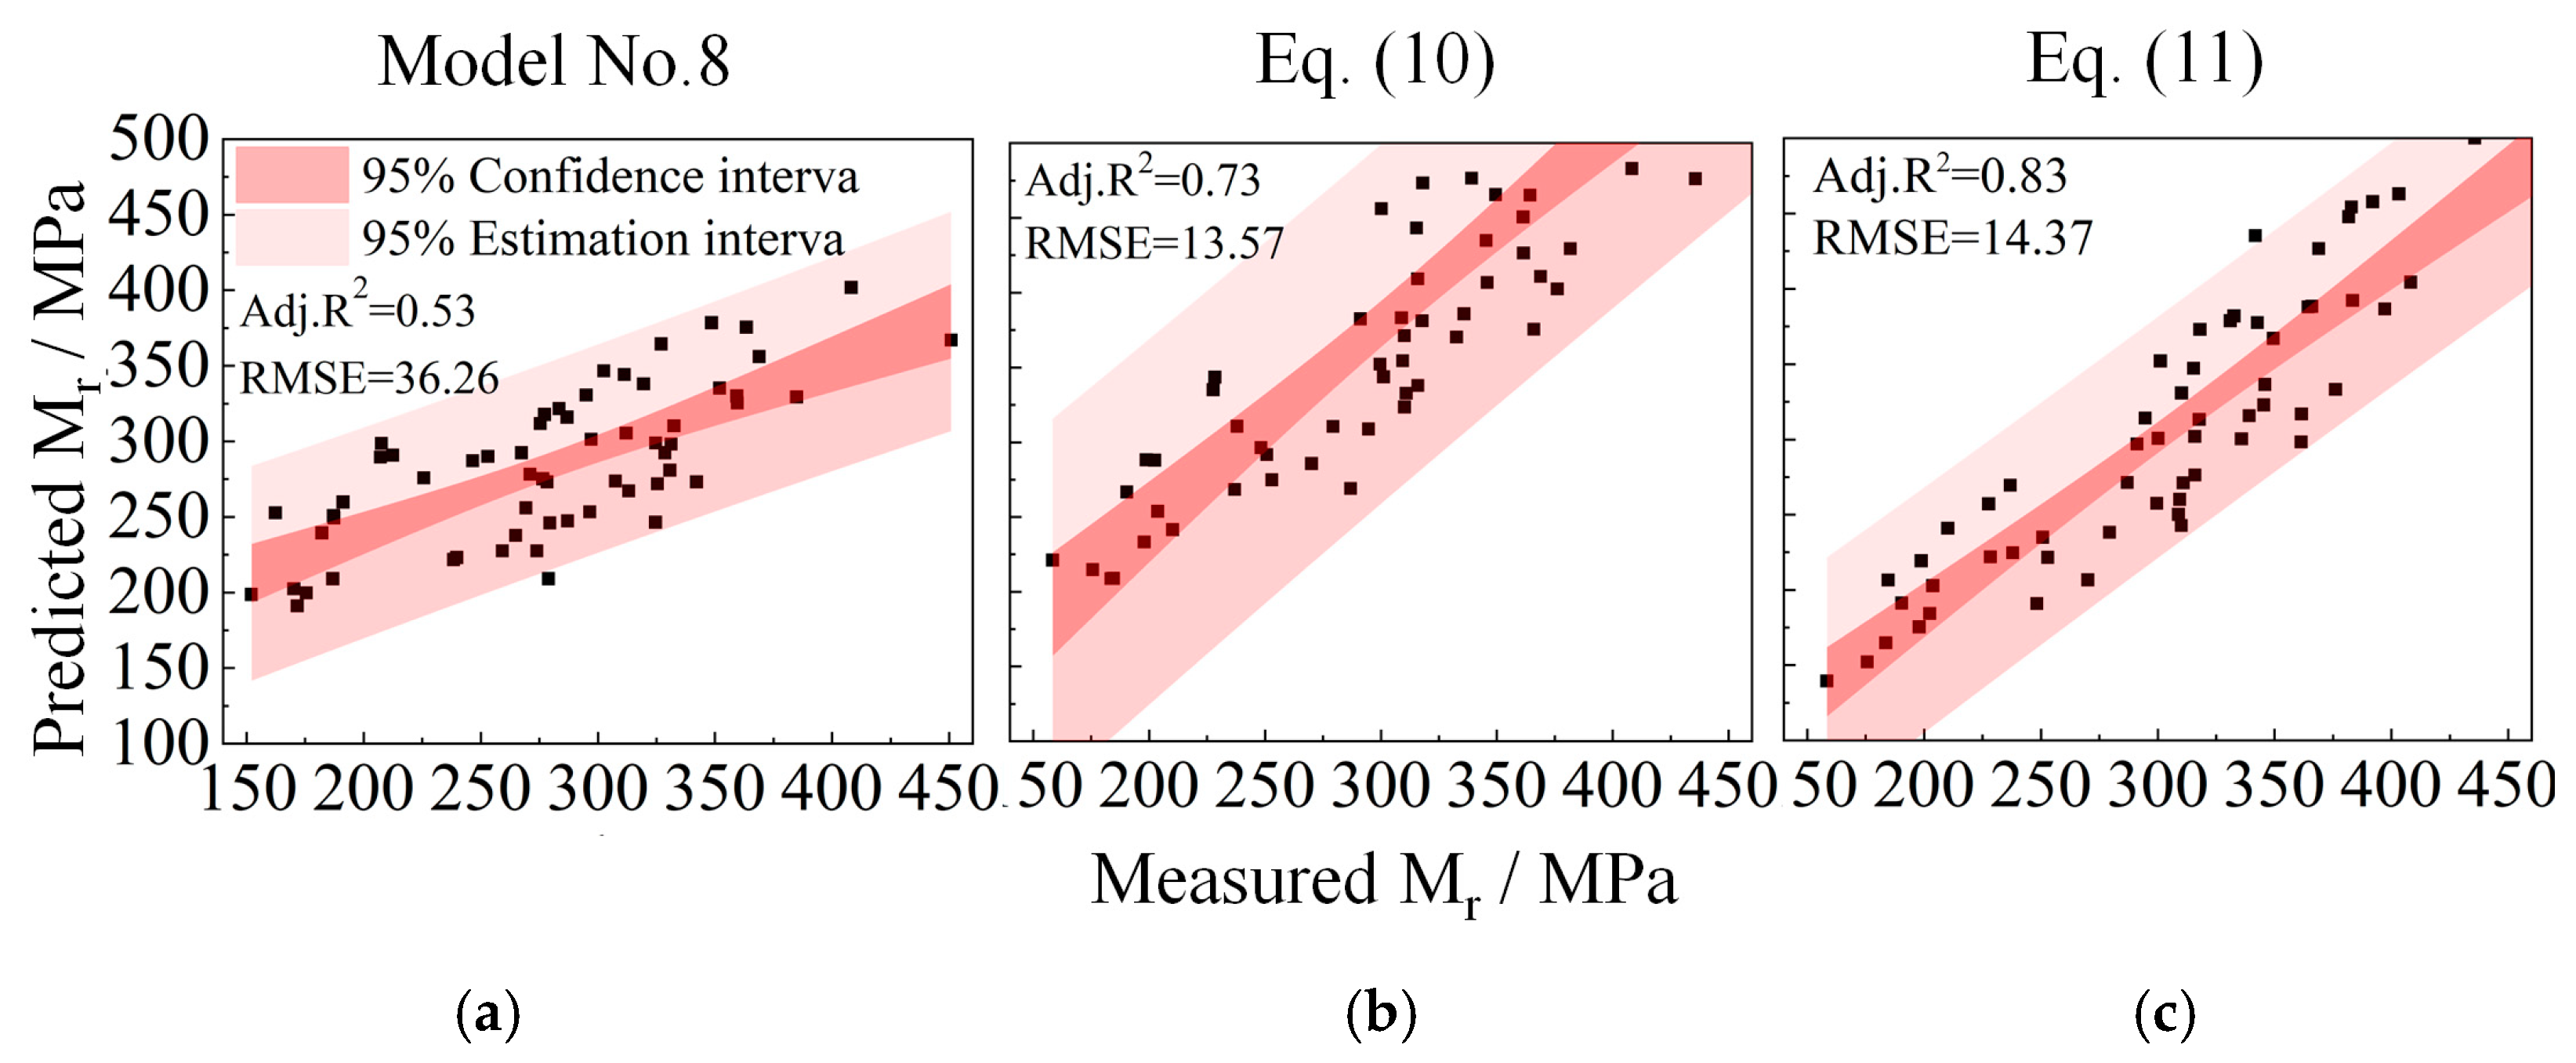
The addition of standard atmospheric pressure (Pa) and the constant of 1 in the Mr models has little effect on the improvement of prediction accuracy, whereas the inclusion of two additional model coefficients, k4 and k5, is not effective for improving prediction accuracy of the Mr models. Among the Mr prediction models compared, the bivariate Model No. 8 incorporating the first principal stress invariant (θ) and deviatoric stress (σd) possesses the best prediction accuracy.
(3)
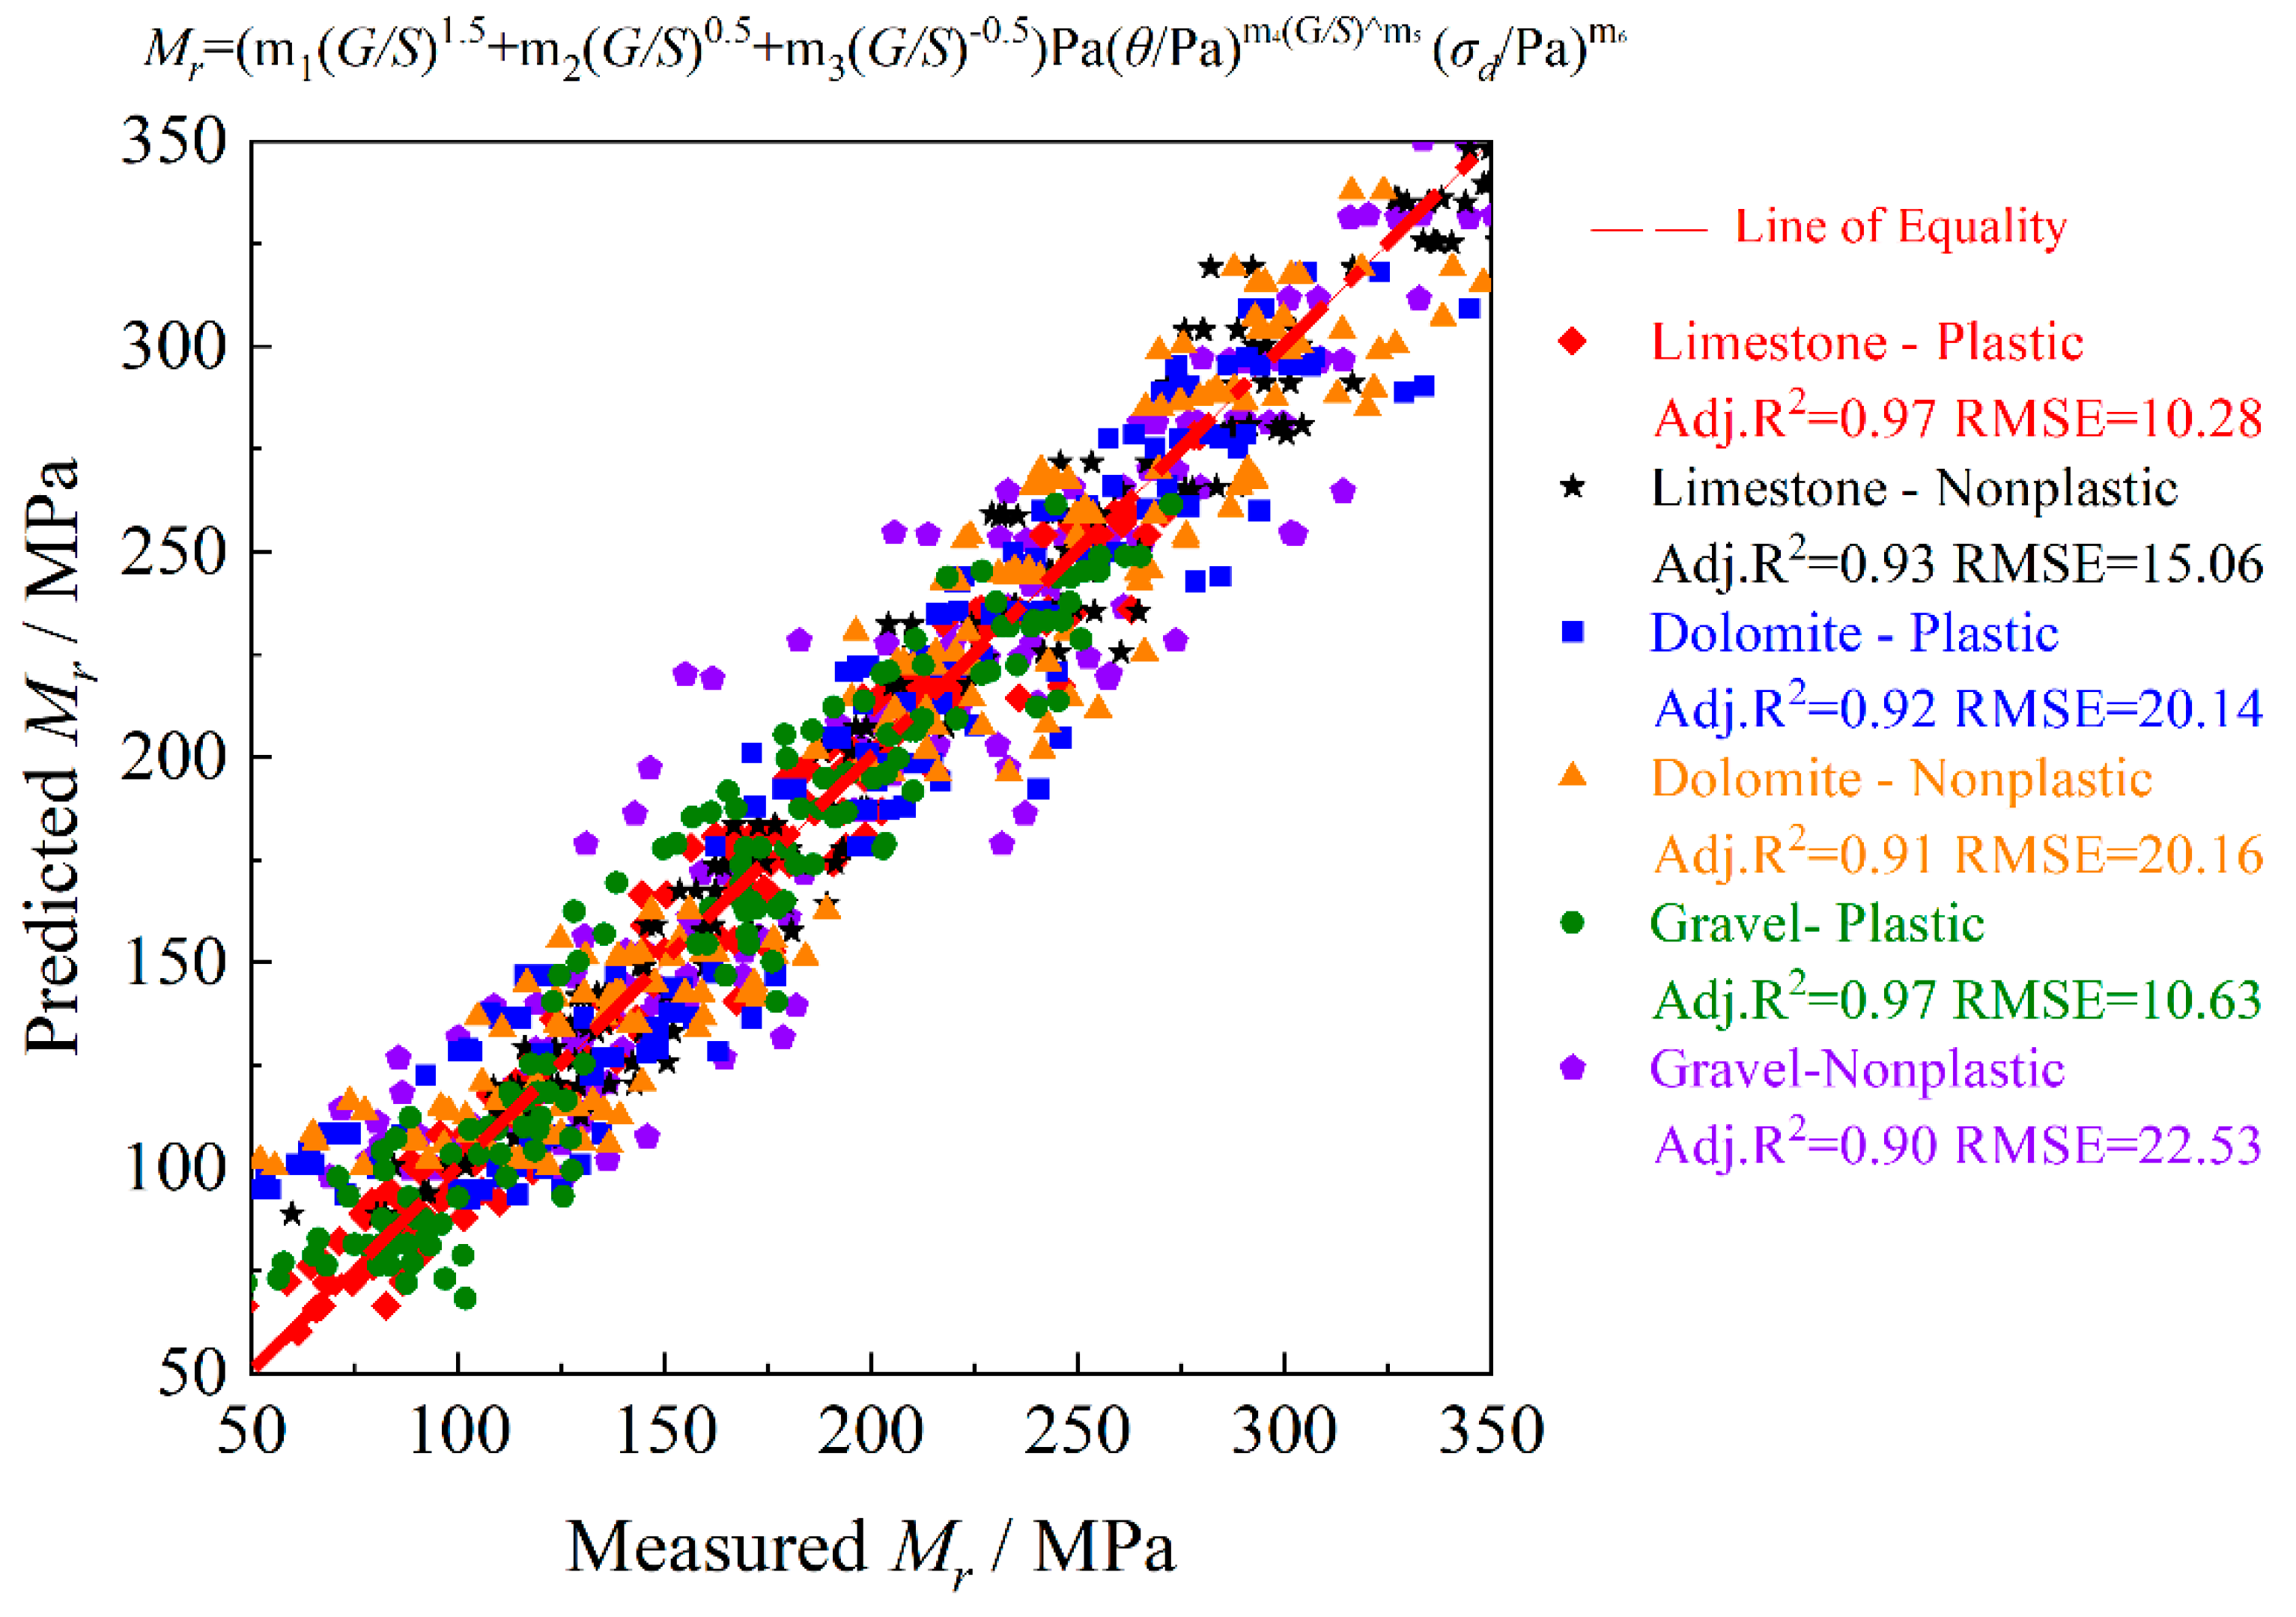
By comparing and analyzing the existing Mr prediction models, a benchmark prediction model suitable for the TRW-derived UPAB materials studied was selected. The statistical correlations among the fitted model coefficients, the gradation control parameter G/S, and stress state variables were further analyzed, from which the improved Mr prediction model was proposed and verified extensively to be universally applicable.

Author Contributions

Conceptualization, M.W., Q.Y. and Y.X.; methodology, M.W., Q.Y., Y.X. and W.L.; software, M.W., Q.Y. and W.L.; validation, M.W., Q.Y., Y.X. and W.L.; formal analysis, M.W., Q.Y., Y.X. and W.L.; writing—original draft preparation, M.W. and Y.X.; writing—review and editing, M.W., Q.Y., Y.X. and W.L.; visualization, M.W. and Y.X.; supervision, Y.X.; funding acquisition, Y.X. All authors have read and agreed to the published version of the manuscript.

Funding

The work presented herein is supported jointly by the National Natural Science Foundation of China (Grant No. 52178443, U1934209, 51878673, U1734208, & 51808577), the National Key R&D program of China (Grant No. 2019YFC1904704), the Key R&D Program of Chinese Academy of Railway Sciences (Grant No. 2020YJ022 & 2019YJ026), and the Open Foundation of MOE Key Laboratory of Engineering Structures of Heavy Haul Railway (Central South University) (Grant No. 2021JZZ01 & 2021JZZ02), and the graduate free exploration project of Central South University (Grant No. 2021zzts0227).

Institutional Review Board Statement

Not applicable.

Informed Consent Statement

Not applicable.

Data Availability Statement

Some or all data, models, or code that support the findings of this study are available from the corresponding author upon reasonable request.

Conflicts of Interest

The authors declare no conflict of interest. The funders had no role in the design of the study; in the collection, analyses, or interpretation of data; in the writing of the manuscript, or in the decision to publish the results.

References

  1. Mokhov, I.I. Anomalous Winters in Regions of Northern Eurasia in Different Phases of the El Niño Phenomena. Dokl. Earth Sci. 2020, 493, 649–653. [Google Scholar] [CrossRef]
  2. Sonone, R.; Gupte, N. Precursors of the El Niño phenomenon: A climate network analysis. Phys. Rev. E 2021, 103, L040301. [Google Scholar] [CrossRef] [PubMed]
  3. Qin, M.; Qiu, L.-H.; Tao, R.; Umar, M.; Su, C.-W.; Jiao, W. The inevitable role of El Niño: A fresh insight into the oil market. Econ. Res. -Ekon. Istraživanja 2020, 33, 1943–1962. [Google Scholar] [CrossRef]
  4. Afonso, M.L.; Dinis-Almeida, M.; Fael, C.S. Permeable pavements–green infrastructures as a flood mitigation measure. In International Symposium on Greener Cities for More Efficient Ecosystem Services in a Climate Changing World; ISHS Acta Horticulturae 1215: Bologna, Italy, 2017; pp. 369–376. [Google Scholar]
  5. Nguyen, T.H.; Ahn, J. Experimental evaluation of the permanent strains of open-graded aggregate materials. Road Mater. Pavement Des. 2019, 22, 1667–1678. [Google Scholar] [CrossRef]
  6. Marvin, J.T.; Scott, J.; Van Seters, T.; Bowers, R.; Drake, J.A. Winter Maintenance of Permeable Interlocking Concrete Pavement: Evaluating Opportunities to Reduce Road Salt Pollution and Improve Winter Safety. Transp. Res. Rec. J. Transp. Res. Board 2020, 2675, 174–186. [Google Scholar] [CrossRef]
  7. Abdullah, M.E.; Zamhari, K.A.; Buhari, R.; Kamaruddin, N.H.M.; Nayan, N.; Hainin, M.R.; Hassan, N.A.; Jaya, R.P.; Yusoff, N.I. A Review on The Exploration of Nanomaterials Application in Pavement Engineering. J. Teknol. 2015, 73. [Google Scholar] [CrossRef]
  8. Ma, G.; Li, H.; Yang, B.; Zhang, H.; Li, W. Investigation on the deformation behavior of open-graded unbound granular materials for permeable pavement. Constr. Build. Mater. 2020, 260, 119800. [Google Scholar] [CrossRef]
  9. Koohmishi, M. Hydraulic conductivity and water level in the reservoir layer of porous pavement considering gradation of aggregate and compaction level. Constr. Build. Mater. 2019, 203, 27–44. [Google Scholar] [CrossRef]
  10. Koohmishi, M.; Shafabakhsh, G. Drainage potential of reservoir course of porous pavement for various particle size distributions of aggregate. Transp. Geotech. 2018, 16, 63–75. [Google Scholar] [CrossRef]
  11. Lu, G.; Renken, L.; Li, T.; Wang, D.; Li, H.; Oeser, M. Experimental study on the polyurethane-bound pervious mixtures in the application of permeable pavements. Constr. Build. Mater. 2019, 202, 838–850. [Google Scholar] [CrossRef]
  12. Cooley, L.A.; Prowell, B.D.; Brown, E.R.; Hall, K.; Button, J.; Davis, R. Issues pertaining to the permeability characteristics of coarse-graded superpave mixes. Asph. Paving Technol. Assoc. Asph. Paving Technol.-Proc. Tech. Sess. 2002, 71, 1–29. [Google Scholar]
  13. Kuang, X.; Sansalone, J.; Ying, G.; Ranieri, V. Pore-structure models of hydraulic conductivity for permeable pavement. J. Hydrol. 2011, 399, 148–157. [Google Scholar] [CrossRef]
  14. Zhang, H.; Li, H.; Zhang, Y.; Wang, D.; Harvey, J.; Wang, H. Performance enhancement of porous asphalt pavement using red mud as alternative filler. Constr. Build. Mater. 2017, 160, 707–713. [Google Scholar] [CrossRef]
  15. Mneina, A.; Shalaby, A. Relating gradation parameters to mechanical and drainage performance of unbound granular materials. Transp. Geotech. 2020, 23, 100315. [Google Scholar] [CrossRef]
  16. Hall, K.D.; Schwartz, C.W. Development of Structural Design Guidelines for Porous Asphalt Pavement. Transp. Res. Rec. J. Transp. Res. Board 2018, 2672, 197–206. [Google Scholar] [CrossRef]
  17. Rahman, M.S.; Erlingsson, S. Predicting permanent deformation behaviour of unbound granular materials. Int. J. Pavement Eng. 2014, 16, 587–601. [Google Scholar] [CrossRef]
  18. Zhang, J.; Peng, J.; Liu, W.; Lu, W. Predicting resilient modulus of fine-grained subgrade soils considering relative compaction and matric suction. Road Mater. Pavement Des. 2019, 22, 703–715. [Google Scholar] [CrossRef]
  19. Zhang, J.; Peng, J.; Zheng, J.; Dai, L.; Yao, Y. Prediction of Resilient Modulus of Compacted Cohesive Soils in South China. Int. J. Géoméch. 2019, 19, 04019068. [Google Scholar] [CrossRef]
  20. Ping, W.V.; Sheng, B. Developing Correlation Relationship between Modulus of Subgrade Reaction and Resilient Modulus for Florida Subgrade Soils. Transp. Res. Rec. J. Transp. Res. Board 2011, 2232, 95–107. [Google Scholar] [CrossRef]
  21. Piratheepan, J.; Gnanendran, C.T. Back-Calculation of Resilient Modulus of Lightly Stabilized Granular Base Materials from Cyclic Load Testing Facility. J. Mater. Civ. Eng. 2013, 25, 1068–1076. [Google Scholar] [CrossRef]
  22. Ping, W.V.; Yang, Z.; Liu, C.; Dietrich, B. Measuring Resilient Modulus of Granular Materials in Flexible Pavements. Transp. Res. Rec. J. Transp. Res. Board 2001, 1778, 81–90. [Google Scholar] [CrossRef]
  23. Nguyen, B.T.; Mohajerani, A. Resilient modulus of fine-grained soil and a simple testing and calculation method for determining an average resilient modulus value for pavement design. Transp. Geotech. 2016, 7, 59–70. [Google Scholar] [CrossRef]
  24. Chowdhury, S.M.R.M.; Kassem, E.; Alkuime, H.; Mishra, D.; Bayomy, F.M.S. Summary Resilient Modulus Prediction Model for Unbound Coarse Materials. J. Transp. Eng. Part B Pavements 2021, 147, 04021035. [Google Scholar] [CrossRef]
  25. Rahman, M.S.; Erlingsson, S. Influence of Post Compaction on the Moisture Sensitive Resilient Modulus of Unbound Granular Materials. Procedia Eng. 2016, 143, 929–936. [Google Scholar] [CrossRef]
  26. Li, N.; Tian, Y.; Ma, B.; Hu, D. Experimental Investigation of Water-Retaining and Mechanical Behaviors of Unbound Granular Materials under Infiltration. Sustainability 2022, 14, 1174. [Google Scholar] [CrossRef]
  27. Jaffar, S.T.A.; Abid, M.M.; Khan, S.Z.; Jafri, T.; Rehman, Z.U.; Tariq, M.A.U.R.; Ng, A.W.M. Evaluation of Conventional and Sustainable Modifiers to Improve the Stiffness Behavior of Weak Sub-Grade Soil. Sustainability 2022, 14, 2493. [Google Scholar] [CrossRef]
  28. Thai, H.N. Effects of Particle Size and Type of Aggregate on Mechanical Properties and Environmental Safety of Unbound Road Base and Subbase Materials: A Literature Review. Int. J. Geomate 2021, 20, 148–157. [Google Scholar] [CrossRef]
  29. Ekblad, J. Statistical evaluation of resilient models characterizing coarse granular materials. Mater. Struct. 2007, 41, 509–525. [Google Scholar] [CrossRef]
  30. Barskale, R.D.; Itani, S.Y. Influence of aggregate shape on base behavior. Transp. Res. Rec. 1989, 1227, 173–182. [Google Scholar]
  31. Li, N.; Wang, H.; Ma, B.; Li, R. Investigation of unbound granular material behavior using precision unbound material analyzer and repeated load triaxial test. Transp. Geotech. 2019, 18, 1–9. [Google Scholar] [CrossRef]
  32. Smith, W.; Nair, K. Development of Procedures for Characterization of Untreated Granular Base Course and Asphalt-T reated Base Course Materials; Materials Research: Oakland, CA, USA, 1973. [Google Scholar]
  33. Monismith, C.L.; Seed, F.G.; Mitry, F.G.; Chan, C. Predictions of pavement deflections from laboratory tests. In Proceedings of the Second In-ternational Conference on the Structural Design of Asphalt Pavements, Ann Arbor, MI, USA, 7–11 August 1967. [Google Scholar]
  34. Lekarp, F.; Isacsson, U.; Dawson, A. State of the Art. I: Resilient Response of Unbound Aggregates. J. Transp. Eng. 2000, 126, 66–75. [Google Scholar] [CrossRef]
  35. Nguyen, B.T.; Mohajerani, A. Possible simplified method for the determination of the resilient modulus of unbound granular materials. Road Mater. Pavement Des. 2016, 17, 841–858. [Google Scholar] [CrossRef]
  36. Chanpheng, P.; Sangpetngam, B. Influences of Moisture and Compaction on Resilient Modulus of an Unbound Base Material. In Proceedings of the 18th National Convention on Civil Engineering, Chiang Mai, Thailand, 8–10 May 2013. [Google Scholar]
  37. Li, N.; Ma, B.; Wang, H.; Tang, J.; Wang, X.; Shao, Z. Influence of loading frequency on mechanical properties of unbound granular materials via repeated load tests. Constr. Build. Mater. 2021, 301, 124098. [Google Scholar] [CrossRef]
  38. Gu, C.; Zhan, Y.; Wang, J.; Cai, Y.; Cao, Z.; Zhang, Q. Resilient and permanent deformation of unsaturated unbound granular materials under cyclic loading by the large-scale triaxial tests. Acta Geotech. 2020, 15, 3343–3356. [Google Scholar] [CrossRef]
  39. Allen, J.J.; Thompson, M.R. Resilient response of granular materials subjected to time-dependent lateral stresses. Transp. Res. Rec. 1974, 510, 1–13. [Google Scholar]
  40. Garg, N.; Thompson, M.R. Triaxial Characterization of Minnesota Road Research Project Granular Materials. Transp. Res. Rec. J. Transp. Res. Board 1997, 1577, 27–36. [Google Scholar] [CrossRef]
  41. Moossazadeh, J.; Witczak, M.W. Prediction of subgrade moduli for soil that exhibits nonlinear behavior. Transp. Res. Rec. 1981, 810, 9–17. [Google Scholar]
  42. Seed, H.B.; Chan, C.K.; Lee, C.E. Resilience characteristics of subgrade soils and their relation to fatigue failures in asphalt pavements. In Proceedings of the International Conference on the Structural Design of Asphalt Pavements, Ann Arbor, MI, USA, 20–24 August 1962. [Google Scholar]
  43. Uzan, J. Characterization of granular material. Transp. Res. Rec. 1985, 1022, 52–59. [Google Scholar]
  44. Ni, B.; Hopkins, T.; Sun, L.; Beckham, T. Modeling the Resilient Modulus of Soils. In Bearing Capacity of Roads, Railways and Airfields; CRC Press: Lisbon, Portugal, 2002; pp. 1131–1142. [Google Scholar] [CrossRef]
  45. Ng, K.; Mebrahtom, D.; Ksaibati, K. Characterization of crushed base materials in Wyoming (No. WY-1706F); University of Wyoming: Laramie, WY, USA, 2017. [Google Scholar]
  46. Hasan, M.; Hasan, A.; Tarefder, R.A. Development of Resilient Modulus Prediction Model for Granular and Noncohesive Soils of New Mexico. Adv. Civ. Eng. Mater. 2019, 8, 400–410. [Google Scholar] [CrossRef]
  47. Li, L.; Liu, J.; Zhang, X.; Saboundjian, S. Laboratory Investigation of Seasonal Variations in Resilient Modulus of Alaskan Base Course Material. Paving Mater. Pavement Anal. 2010, 3, 270–278. [Google Scholar] [CrossRef]
  48. Hossain, Z.; Zaman, M.; Doiron, C. Mechanistic Empirical Pavement Design Guide Input Parameters for Unbound Aggregates in Oklahoma. In Proceedings of the IACGE 2013: Challenges and Recent Advances in Geotechnical and Seismic Research and Practices, Chengdu, China, 25–27 October 2013; pp. 578–585. [Google Scholar]
  49. Haj, E.Y.; Thavathurairaja, J.; Stolte, S.; Sebaaly, P.E.; Piratheepan, M.; Motamed, R.; Center, W.R.S. Resilient modulus prediction models of unbound materials for Nevada (No. P224-14-803); SOLARIS Consortium: Madison, WI, USA, 2018. [Google Scholar]
  50. Han-Cheng, D.; Lin-Hua, H.; Lian-Heng, Z. Experimental investigation on the resilient response of unbound graded aggregate materials by using large-scale dynamic triaxial tests. Road Mater. Pavement Des. 2018, 21, 434–451. [Google Scholar] [CrossRef]
  51. Kim, I.T. Permanent Deformation Behavior of Airport Flexible Pavement Base and Subbase Courses. Ph.D. Thesis, University of Illinois at Urbana-Champaign, Champaign, IL, USA, 2005. [Google Scholar]
  52. Chow, L.C. Permanent Deformation Behavior of Unbound Granular Materials and Rutting Model Development. Master’s Thesis, University of Illinois at Urbana-Champaign, Champaign, IL, USA, 2014. [Google Scholar]
  53. Xiao, Y. Performance-Based Evaluation of Unbound Aggregates Affecting Mechanistic Response and Performance of Flexible Pavements. Ph.D. Thesis, University of Illinois at Urbana-Champaign, Champaign, IL, USA, 2014. [Google Scholar]
  54. Technical Guidelines for Construction of Highway Roadbases; China Communications Press Co., Ltd.: Beijing, China, 2015.
  55. Chow, L.C.; Mishra, D.; Tutumluer, E. Framework for Development of an Improved Unbound Aggregate Base Rutting Model for Mechanistic–Empirical Pavement Design. Transp. Res. Rec. J. Transp. Res. Board 2014, 2401, 11–21. [Google Scholar] [CrossRef]
  56. Mohajerani, A.; Nguyen, B.T.; Glavacevic, L. Estimation of resilient modulus of unbound granular materials using Clegg impact value and field stress levels. Transp. Geotech. 2016, 7, 115–129. [Google Scholar] [CrossRef]
  57. Technical Specifications for Construction of Highway Roadbases; China Communications Press Co., Ltd.: Beijing, China, 2019.
  58. AASHTO T 307-99; Determining the Resilient Modulus of Soils and Aggregate Materials. AASHTO: Washington, DC, USA, 2003.
  59. Zhou, Z.; Wang, M.; Yu, Q.; Zheng, K.; Xiao, Y.; Chen, X. Mechanical behavior of unbound permeable aggregate base materials studied from large-scale direct shear tests. J. Railw. Sci. Eng. 2019, 16, 2175–2183. [Google Scholar]
  60. Brown, S.F.; Pell, P.S. An experimental investigation of the stresses, strains and deflection in a layered pavement structure subjected to dynamic loads. In Proceedings of the 2nd International Conference on the Structural Design of Asphalt Pavements, Ann Arbor, MI, USA, 7–11 August 1967; pp. 487–504. [Google Scholar]
  61. Hicksr, G.; Monismithc, L. Prediction of the resilient response of pavements containing granular layers using nonlinear elastictheory. In Proceedings of the 3rd International Conference on the Structural Design of Asphalt Pavements, Grosvenor House, Park Lane, London, UK, 11–15 September 1972; pp. 410–429. [Google Scholar]
  62. Pezo, R. A General Method of Reporting Resilient Modulus Tests of Soils-A Pavement Engineer’s Point of View; Paper No: 93082; Transportation Research Board, National Research Council: Washington, DC, USA, 1993. [Google Scholar]
  63. Raad, L.; Figueroa, J.L. Load Response of Transportation Support Systems. Transp. Eng. J. ASCE 1980, 106, 111–128. [Google Scholar] [CrossRef]
  64. Boudali, M.; Robert, C. Laboratory determination of base material resilient moduli. In Proceedings of the 5th International Conference on the Bearing Capacity of Road and Airfields; Road Directorate, Danish Road Institute, Trondheim, Norway, 6–8 July 1998; pp. 1235–1245. [Google Scholar]
  65. Lytton, R.L.; Uzan, J.; Femando, E.G.; Roque, R.; Hiltunen, D.; Stoffels, S.M. Development and Validation of Performance Prediction Models and Specifications for Asphalt Binders and Paving Mixes; Report SHRP A-357, Strategic Highway Research Program, National Research Council: Washington, DC, USA, 1993; pp. 125–138. [Google Scholar]
  66. Hopkins, T.C.; Beckham, T.L.; Sun, C.; Ni, B. Resilient Modulus of Kentucky Soils; Report No. KTC-01-07/SPR163-95-1F; University of Kentucky: Lexington, KY, USA, 2001. [Google Scholar]
  67. Tutumluer, E.; Mishra, D.; Butt, A.A. Characterization of Illinois Aggregates for Subgrade Replacement and Subbase; Illinois Center for Transportation: Rantoul, IL, USA, 2009. [Google Scholar]
  68. Xiao, Y.; Tutumluer, E.; Mishra, D. Performance Evaluations of Unbound Aggregate Permanent Deformation Models for Various Aggregate Physical Properties. Transp. Res. Rec. 2015, 2525, 20–30. [Google Scholar] [CrossRef]
Figure 1. Illustration of (a) TRW-derived unbound aggregate materials and (b) gradation curves tested in the laboratory.
Materials 15 06005 g001
Figure 2. Laboratory compaction curves of unbound aggregate specimens: (a) achieved dry density versus moisture content and (b) achieved dry density versus G/S.
Materials 15 06005 g002
Figure 3. The apparatus used for laboratory monotonic and repeated load triaxial compression tests.
Materials 15 06005 g003
Figure 4. Illustration of the time–history curve of the axial load applied during laboratory repeated load triaxial compression tests.
Materials 15 06005 g004
Figure 5. Illustration of the definition of the shear stress ratio (SSR).
Materials 15 06005 g005
Figure 6. The real TRW-derived UPAB specimens with different G/S values upon the completion of 50,000 load applications during laboratory repeated load triaxial tests: (a) G/S = 1.0, (b) G/S = 1.6, (c) G/S = 1.8, (d) G/S = 2.0, (e) G/S = 2.2, and (f) G/S = 2.5.
Materials 15 06005 g006
Figure 7. Illustration of the definitions of (a) resilient modulus and (b) damping ratio from axial stress–axial strain loops obtained from laboratory repeated load triaxial tests.
Materials 15 06005 g007
Figure 8. Accumulated axial plastic strain versus the number of load applications for TRW-derived UPAB specimens with varying G/S levels under 50 kPa confining pressure for (a) SSR = 0.3, (b) SSR = 0.5, (c) SSR = 0.7, and (d) SSR = 0.9.
Materials 15 06005 g008
Figure 9. Accumulated axial plastic strain values upon N = 50,000 versus G/S levels for TRW-derived UPAB specimens under 50 kPa confining pressure.
Materials 15 06005 g009
Figure 10. Resilient modulus versus the number of load applications for TRW-derived UPAB specimens with varying G/S levels under 50 kPa confining pressure for (a) SSR = 0.3, (b) SSR = 0.5, (c) SSR = 0.7, and (d) SSR = 0.9.
Materials 15 06005 g010
Figure 11. Resilient modulus values upon N = 50,000 versus G/S levels for TRW-derived UPAB specimens under 50 kPa confining pressure.
Materials 15 06005 g011
Figure 12. Comparisons of laboratory-measured representative Mr values against predicted values by different univariate Mr prediction models for TRW-derived UPAB specimens with G/S = 1.0: (a) Model No. 1, (b) Model No. 2, and (c) Model No. 3.
Materials 15 06005 g012
Figure 13. Comparisons of laboratory-measured representative Mr values against predicted values by different bivariate (i.e., σ 3 and σ d ) models for TRW-derived UPAB specimens with G/S = 1.0: (a) Model No. 4, (b) Model No. 5, and (c) Model No. 6.
Materials 15 06005 g013
Figure 14. Comparisons of laboratory-measured representative Mr values against predicted values by different bivariate (i.e., θ and σ d ) models for TRW-derived UPAB specimens with G/S = 1.0: (a) Model No. 7, (b) Model No. 8, and (c) Model No. 9.
Materials 15 06005 g014
Figure 15. Comparisons of laboratory-measured representative Mr values against predicted values by different bivariate (i.e., θ and τ o c t ) models for TRW-derived UPAB specimens with G/S = 1.0: (a) Model No. 10, (b) Model No. 11, (c) Model No. 12, (d) Model No. 13, and (e) Model No. 14.
Materials 15 06005 g015
Figure 16. The P–P diagrams of standardized residuals of the four Mr prediction models evaluated.
Materials 15 06005 g016
Figure 17. Comparison of the laboratory-measured representative Mr values against those predicted by (a) the initial Model No. 8 without considering gradation variations, (b) Equation (10), and (c) Equation (11).
Materials 15 06005 g017
Figure 18. The sensitivity of representative Mr to gradation variation (quantified by the parameter G/S) evaluated from Equation (11) under (a) 50-kPa, (b) 100-kPa, and (c) 150-kPa confining pressure levels, respectively.
Materials 15 06005 g018
Figure 19. Comparison of measured and predicted Mr values of three different types of unbound aggregates in the external database for model verification.
Materials 15 06005 g019
Table 1. Gradation design scheme and corresponding gradation parameters.
G/SDmax/mmnCuCc
1.026.50.32270.223.55
1.626.50.5129.091.97
1.826.50.5623.642.08
2.026.50.6118.091.90
2.526.50.7111.631.63
Note: Cc is the coefficient of curvature; Cu is the coefficient of uniformity.
Table 2. The loading scheme adopted for laboratory repeated load triaxial tests.
G/Sc/kPaφConfining
Pressure/kPa
SSRDeviator Stress/kPaNo. of Load
Applications (Nmax)
1.065.529.2500.3/0.5/0.7/0.971/128/195/27350,000
10093/166/253/355
150114/205/311/273
1.664.840.95097/178/277/400
100136/150/388/560
150175/321/498/400
1.864.347.950128/236/370/542
100184/341/535/793
150241/446/699/542
2.06443.650106/195/304/441
100151/277/432/628
150196/360/561/441
2.548.745.55064/173/271/394
100142/261/407/592
150189/348/543/394
Note: The deviator stress values were calculated from the prescribed confining pressure and SSR values by using the obtained shear strength parameters (c and ϕ).
Table 3. The goodness-of-fit results of the fourteen different Mr prediction models based on the three different methods for calculating representative Mr values of each of the TRW-derived UPAB specimens.
Mr Prediction ModelFitted Coefficient of Determination (R2)
No.SourceFormulaMethod IMethod IIMethod III
1K-θ Model [42,60,61] M r = k 1 θ k 2 0.460.430.42
2Modification K-θ Model [42,60,61] M r = k 1 ( θ P a ) k 2 0.460.430.42
3Moossazadeh & Witczak Model [41] M r = k 1 ( σ d P a ) k 2 0.960.950.95
4Pezo Model [62] M r = k 1 ( σ 3 ) k 2 ( σ d ) k 3 0.960.960.95
5Raad & Figueroa Model [63] M r = k 1 P a ( σ 3 P a ) k 2 ( σ d P a ) k 3 0.960.960.95
6Ni Model [44] M r = k 1 ( σ 3 P a + 1 ) k 2 ( σ d P a + 1 ) k 3 0.960.960.95
7Uzan Model [43] M r = k 1 ( θ ) k 2 ( σ d ) k 3 0.960.960.96
8Octahedral Shear Stress Model [43] M r = k 1 P a ( θ P a ) k 2 ( σ d P a ) k 3 0.960.960.96
9Modified Ni Model [44] M r = k 1 P a ( θ P a + 1 ) k 2 ( σ d P a + 1 ) k 3 0.960.960.96
10Modified Uzan Model [43] M r = k 1 P a ( θ P a ) k 2 ( τ o c t P a ) k 3 0.960.960.96
11NCHRP 1-28A Model [64,65] M r = k 1 P a ( θ P a ) k 2 ( τ o c t P a + 1 ) k 3 0.960.960.96
12Improved Ni Model [44] M r = k 1 P a ( θ P a + 1 ) k 2 ( τ o c t P a + 1 ) k 3 0.960.960.96
13Superpave Performance Model [66] M r = k 1 P a ( θ 3 k 4 P a ) k 2 ( τ o c t P a ) k 3 0.950.940.94
14Hopkins Model [66] M r = k 1 P a ( θ 3 k 4 P a ) k 2 ( τ o c t P a + k 5 ) k 3 0.950.940.94
Notes: M r denotes resilient modulus (MPa); k 1 , k 2 , k 3 , k 4 , and k 5 denote model coefficients to be fitted; θ denotes the first principal stress invariant (kPa), i.e., θ = σ 1 + σ 2 + σ 3 ; τ o c t denotes the octahedral shear stress, i.e., τ o c t = 1 3 ( σ 1 σ 2 ) 2 + ( σ 1 σ 3 ) 2 + ( σ 1 σ 3 ) 2 (or τ o c t = 2 3 σ d in triaxial stress space where σ 2 = σ 3 ); and P a denotes the reference stress that is generally taken as the standard atmospheric pressure of 100 kPa.
Table 4. Comparison of the residual statistics of four Mr prediction models evaluated.
StatisticsModel No. 3Model No. 5Model No. 8Model No. 10
Residual sum of squares23,116.725,465.6122,296.1925,329.81
Variance391.776430.270371.282420.497
Root mean square error19.7920.7419.2620.51
Skewness0.058−0.024−0.024−0.187
Standard error of skewness0.3090.3090.3090.309
Kurtosis−0.815−0.367−0.631−0.383
Standard error of kurtosis0.6080.6080.6080.608
AIC index361.23369.04361.07368.72
Table 5. Regressed model coefficients and adjusted R2 values of the optimal Mr prediction model No. 8 for TRW-derived UPAB specimens with varying G/S levels.
G/S Valuek1k2k3Adj. R2
1.02.295690.060510.429570.95759
1.61.895890.08970.464080.95544
1.81.824630.159020.385880.85698
2.01.9470.126190.365250.88606
2.51.939140.146580.381410.86677
Table 6. The basic physical properties of unbound base/subbase aggregate materials tested in the literature and used as additional external datasets for Mr model validation.
Unbound Aggregate MaterialsOptimal Moisture Content/%Maximum Dry Density/G·cm3G/SPlasticity Index (PI)/%
Limestone with nonplastic finesL4NP10.52.1221.390
L8NP8.42.1821.430
L12NP7.62.2431.490
L16NP6.82.2691.550
Limestonewith plastic finesL4P9.32.1651.3910
L8P82.1711.438
L12P7.62.2291.499
L16P7.12.2701.559
Dolomite with nonplastic finesD4NP9.22.1141.390
D8NP8.12.1471.430
D12NP7.12.1981.490
D16NP7.12.2081.550
Dolomite with plastic finesD4P8.02.1491.3911
D8P7.32.1681.4312
D12P7.12.1941.4913
D16P6.92.1841.5514
Gravel with nonplastic finesG4NP10.62.1181.390
G8NP8.52.2111.430
L12NP6.82.2591.490
G16NP6.62.2861.550
Gravel with plastic finesG4P10.42.1571.398
G8P7.42.2081.439
G12P6.62.2421.499
G16P6.62.2561.559
Notes: L denotes limestone; D denotes dolomite; G denotes gravel; P denotes plastic (clay); NP denotes nonplastic (mineral power); and the number in the symbol of each material denotes the fines content (i.e., percentage of materials passing No. 200 or 0.075 mm sieve), for example, “L4NP” denotes unbound crushed limestone aggregate materials with the nonplastic fines content of 4%.
Table 7. The prediction accuracy of the developed Mr model formulated by Equation (11) for the three different types of unbound aggregates in the external database.
Material TypeR2
Limestone with plastic fines0.6575
Limestone with nonplastic fines0.6098
Dolomite with plastic fines0.6218
Dolomite with nonplastic fines0.6161
Gravel with plastic fines0.5874
Gravel with nonplastic fines0.5841
Publisher’s Note: MDPI stays neutral with regard to jurisdictional claims in published maps and institutional affiliations.

