
Non-Aqueous Electrodeposition and Characterization of AlCrCuFeNi High Entropy Alloy Thin Films

 , ,
, ,  , , , ,

Abstract
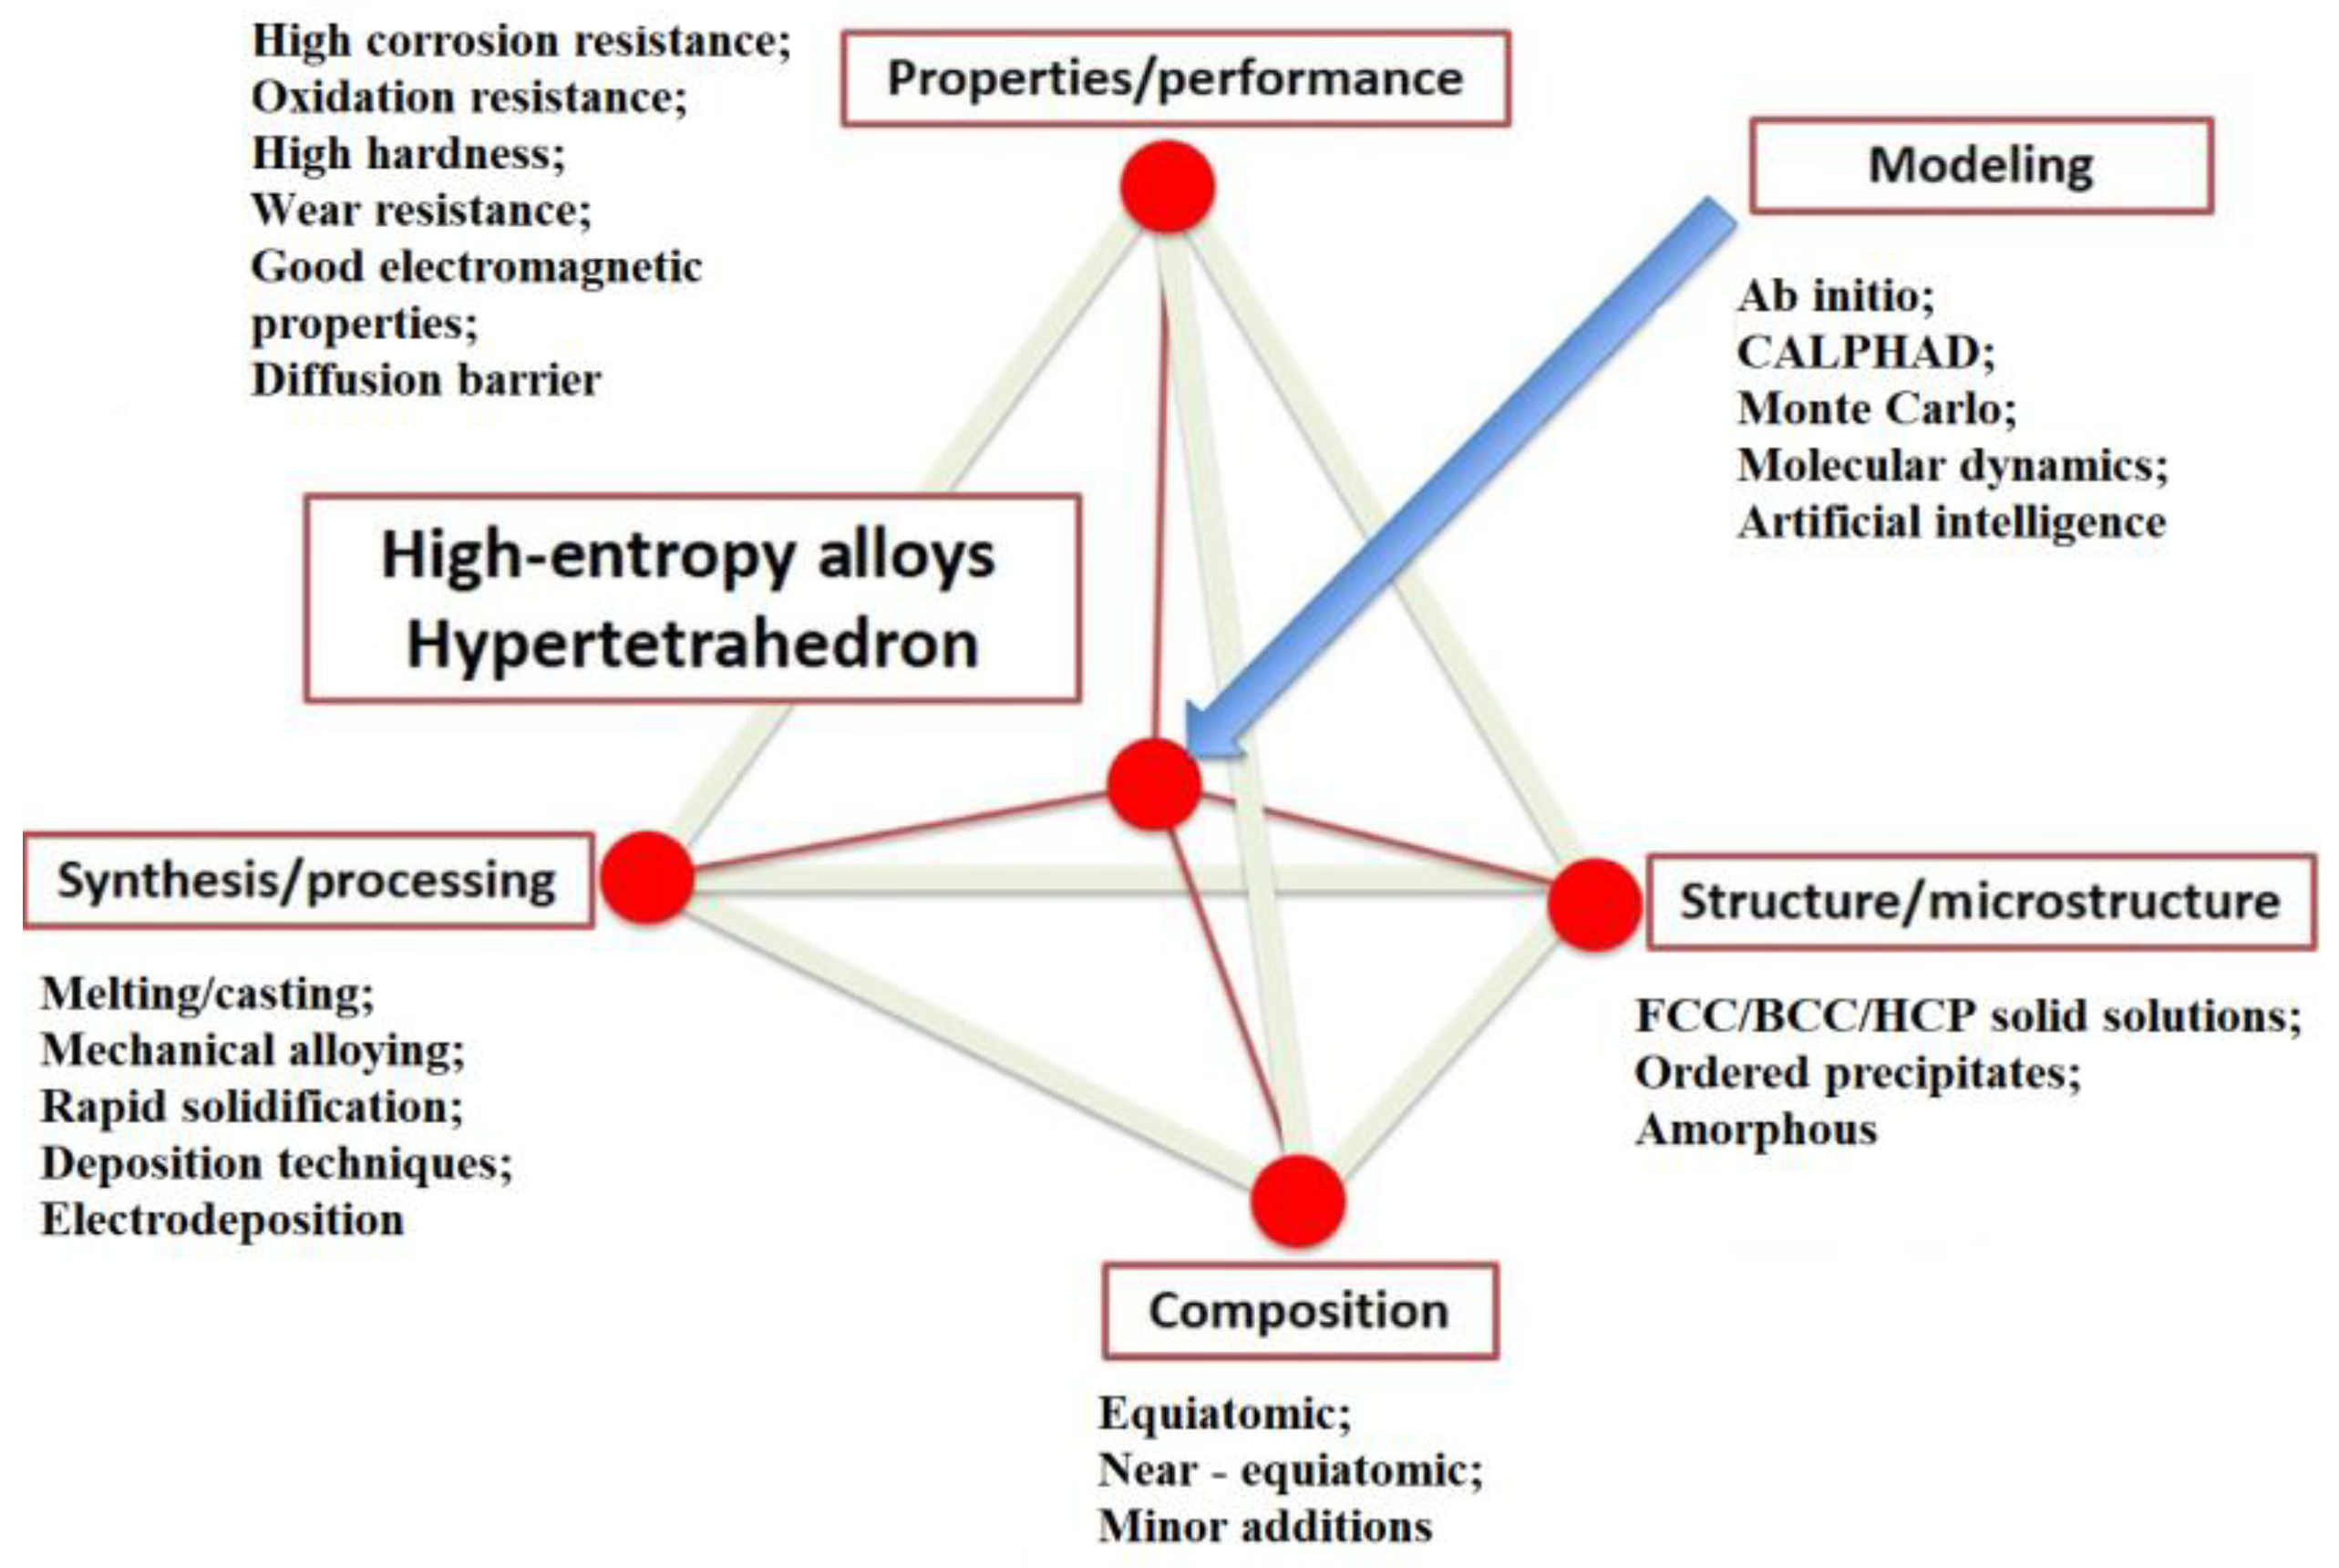
:1. Introduction
2. Materials and Methods
3. Results
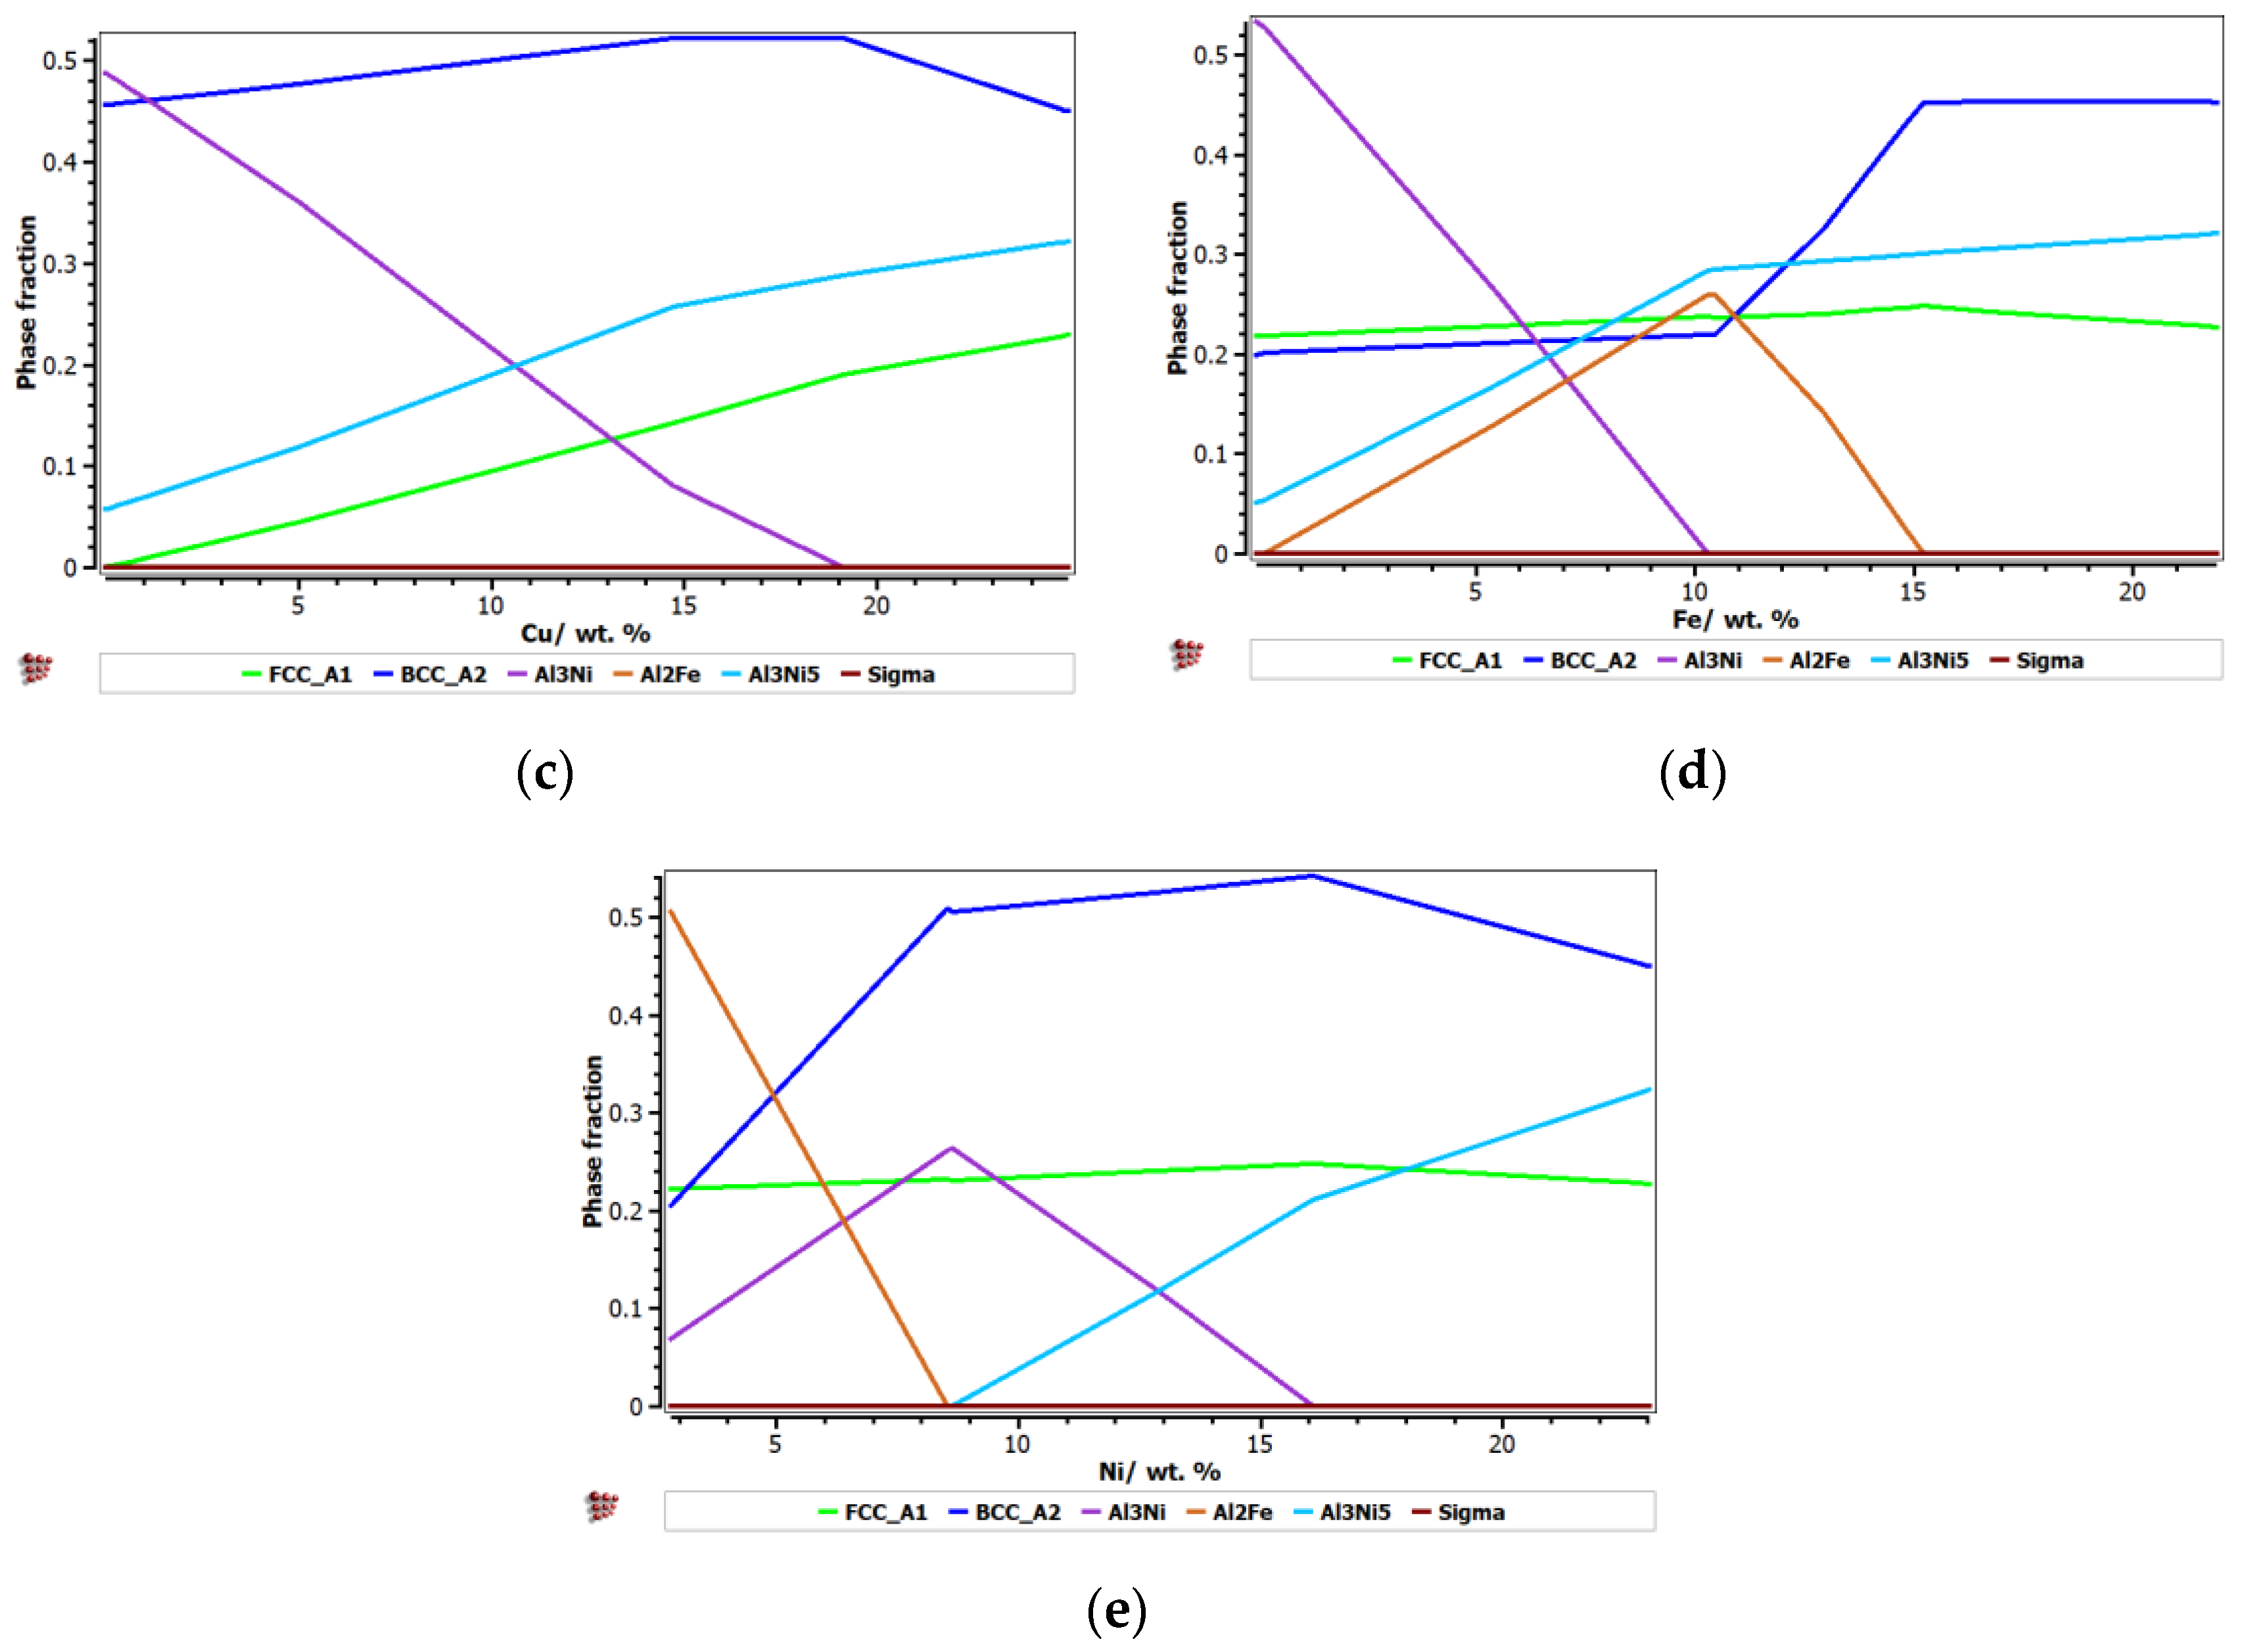
3.1. The Influence of Concentration on the Structure of High-Entropy Alloys
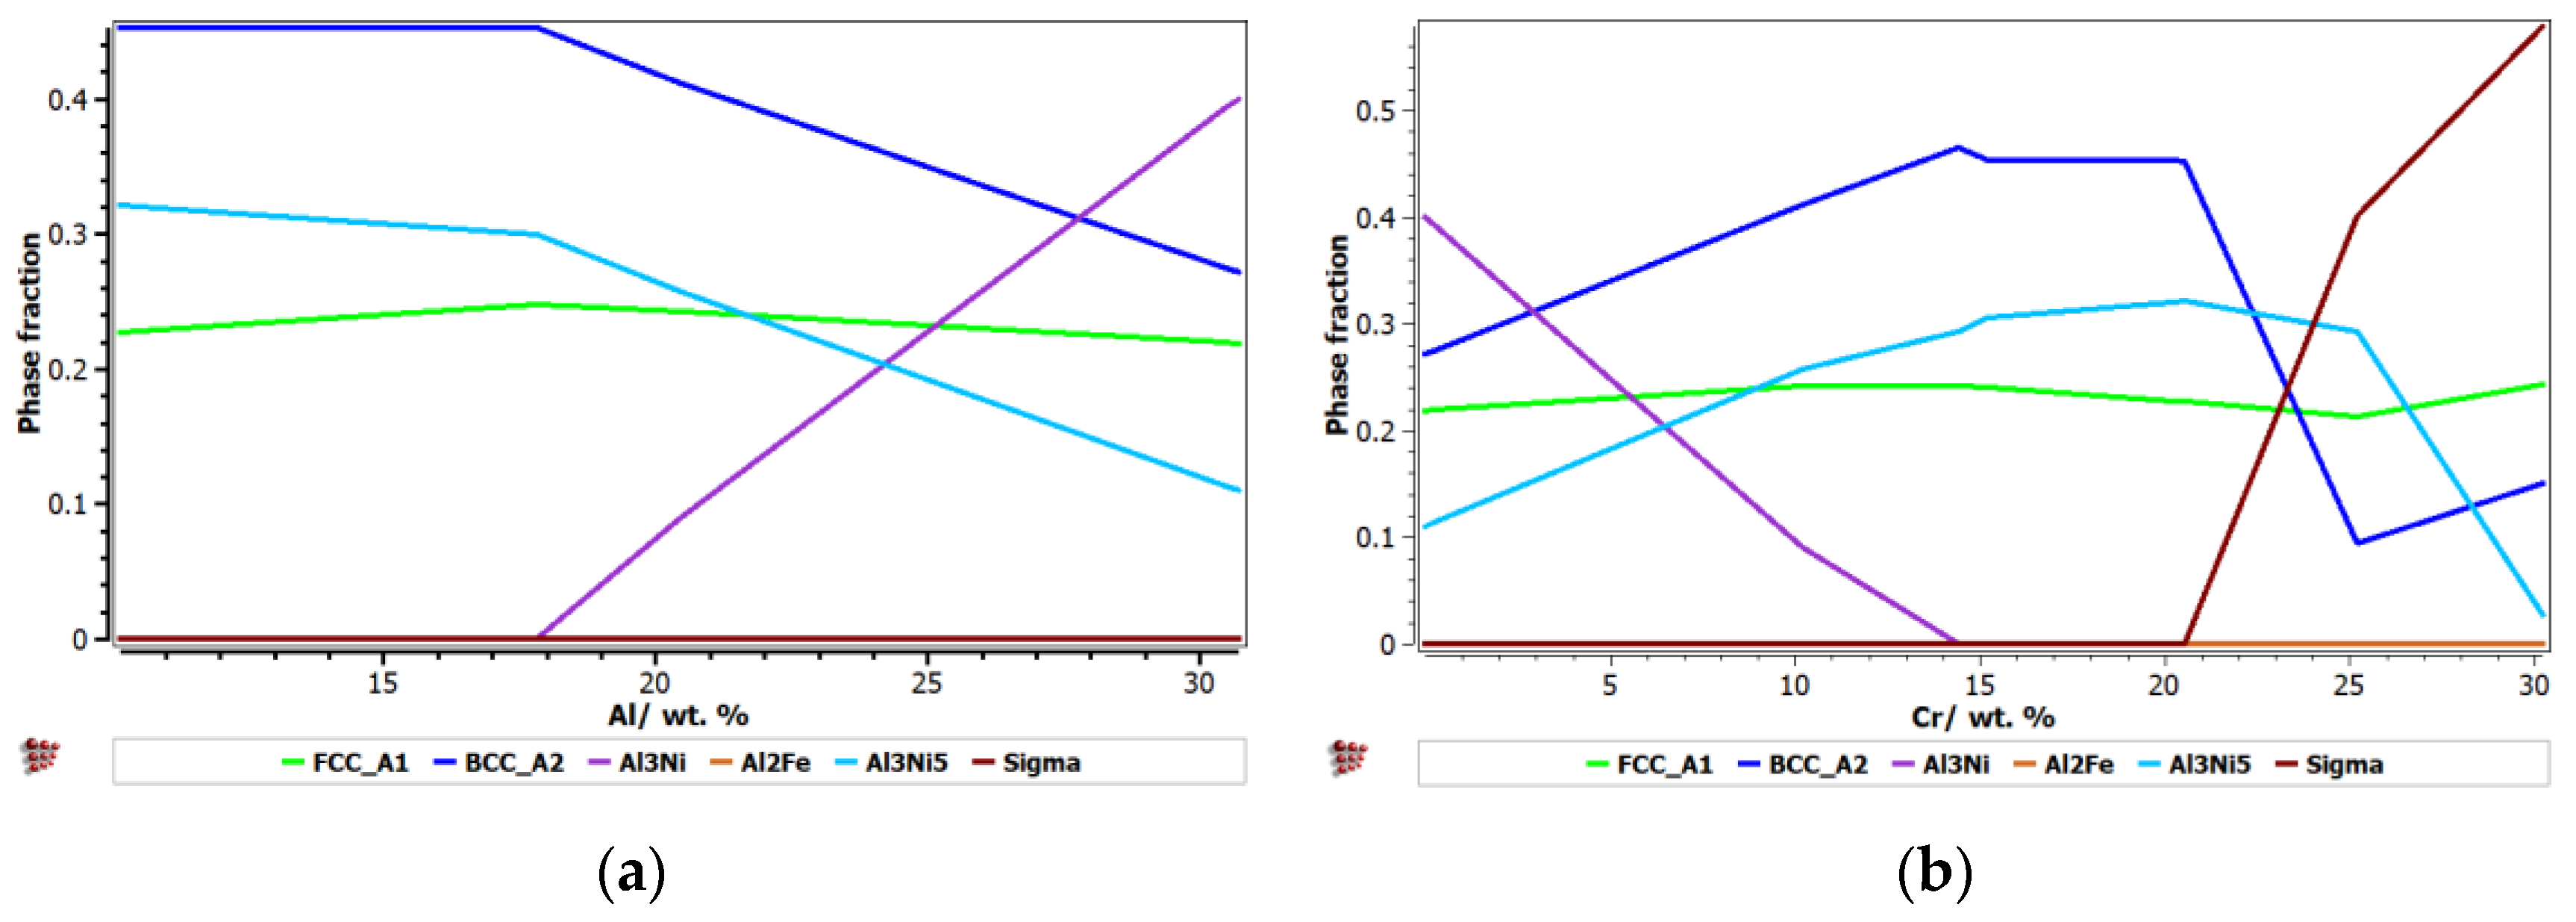
3.2. Multi-Objective Mathematical Optimisation
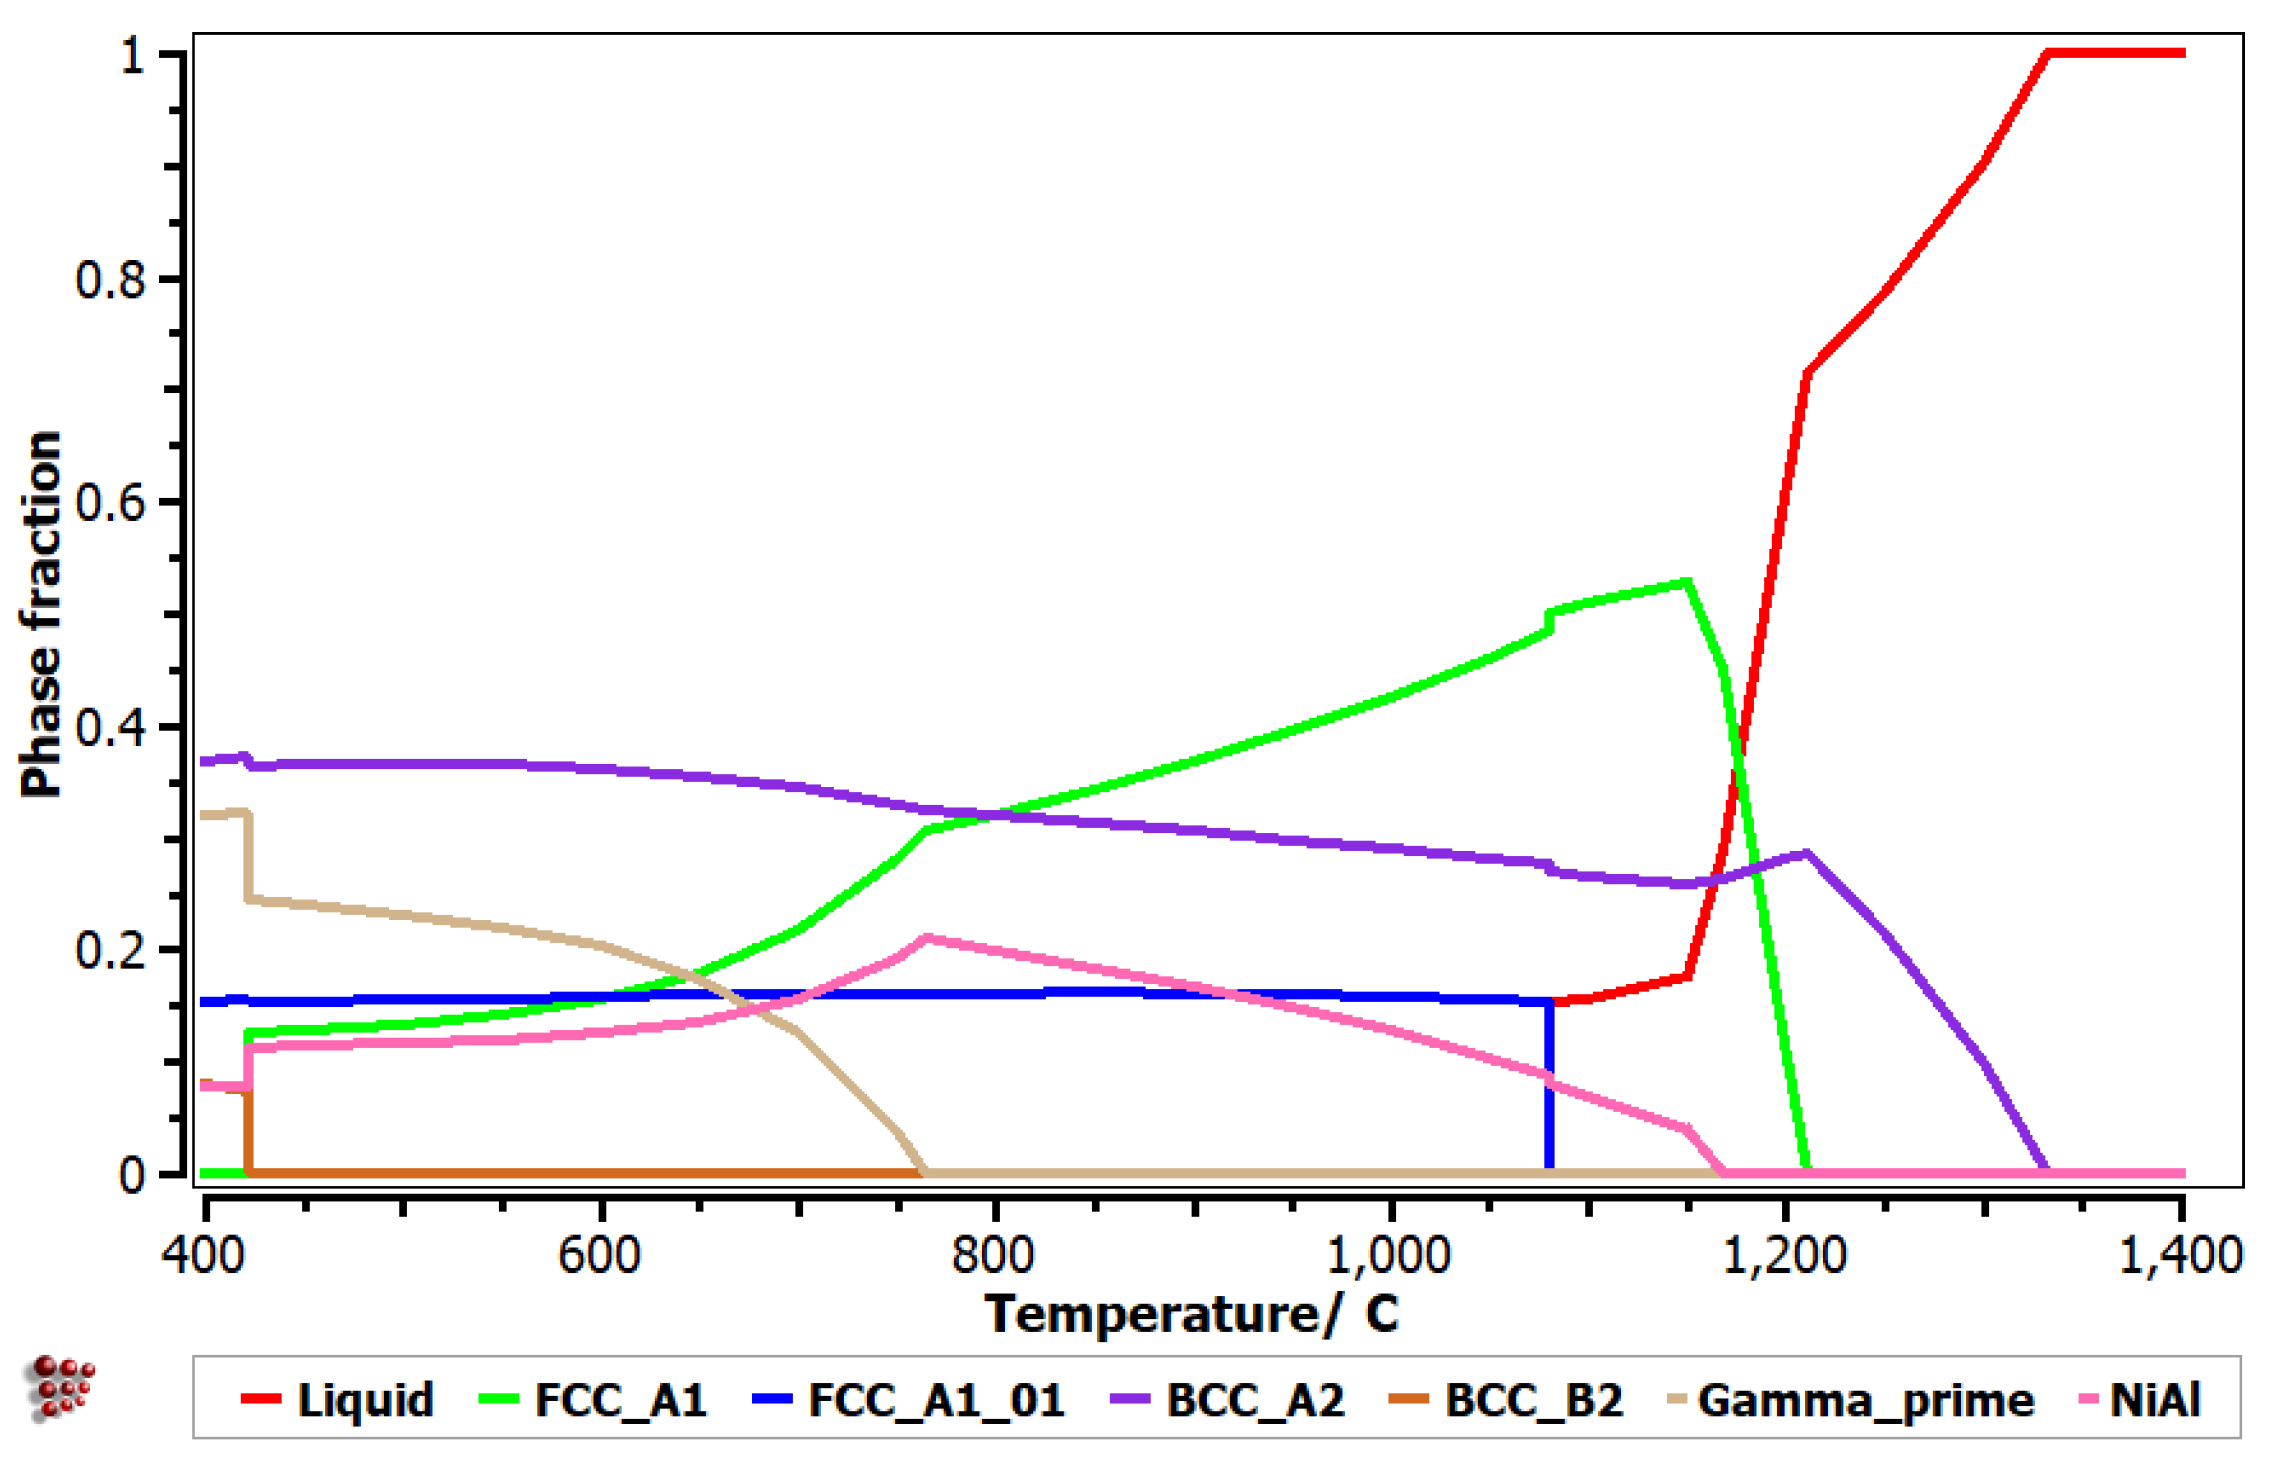
3.3. Simulated Phase Diagram of the Selected Alloy Composition
3.4. Experimental Results
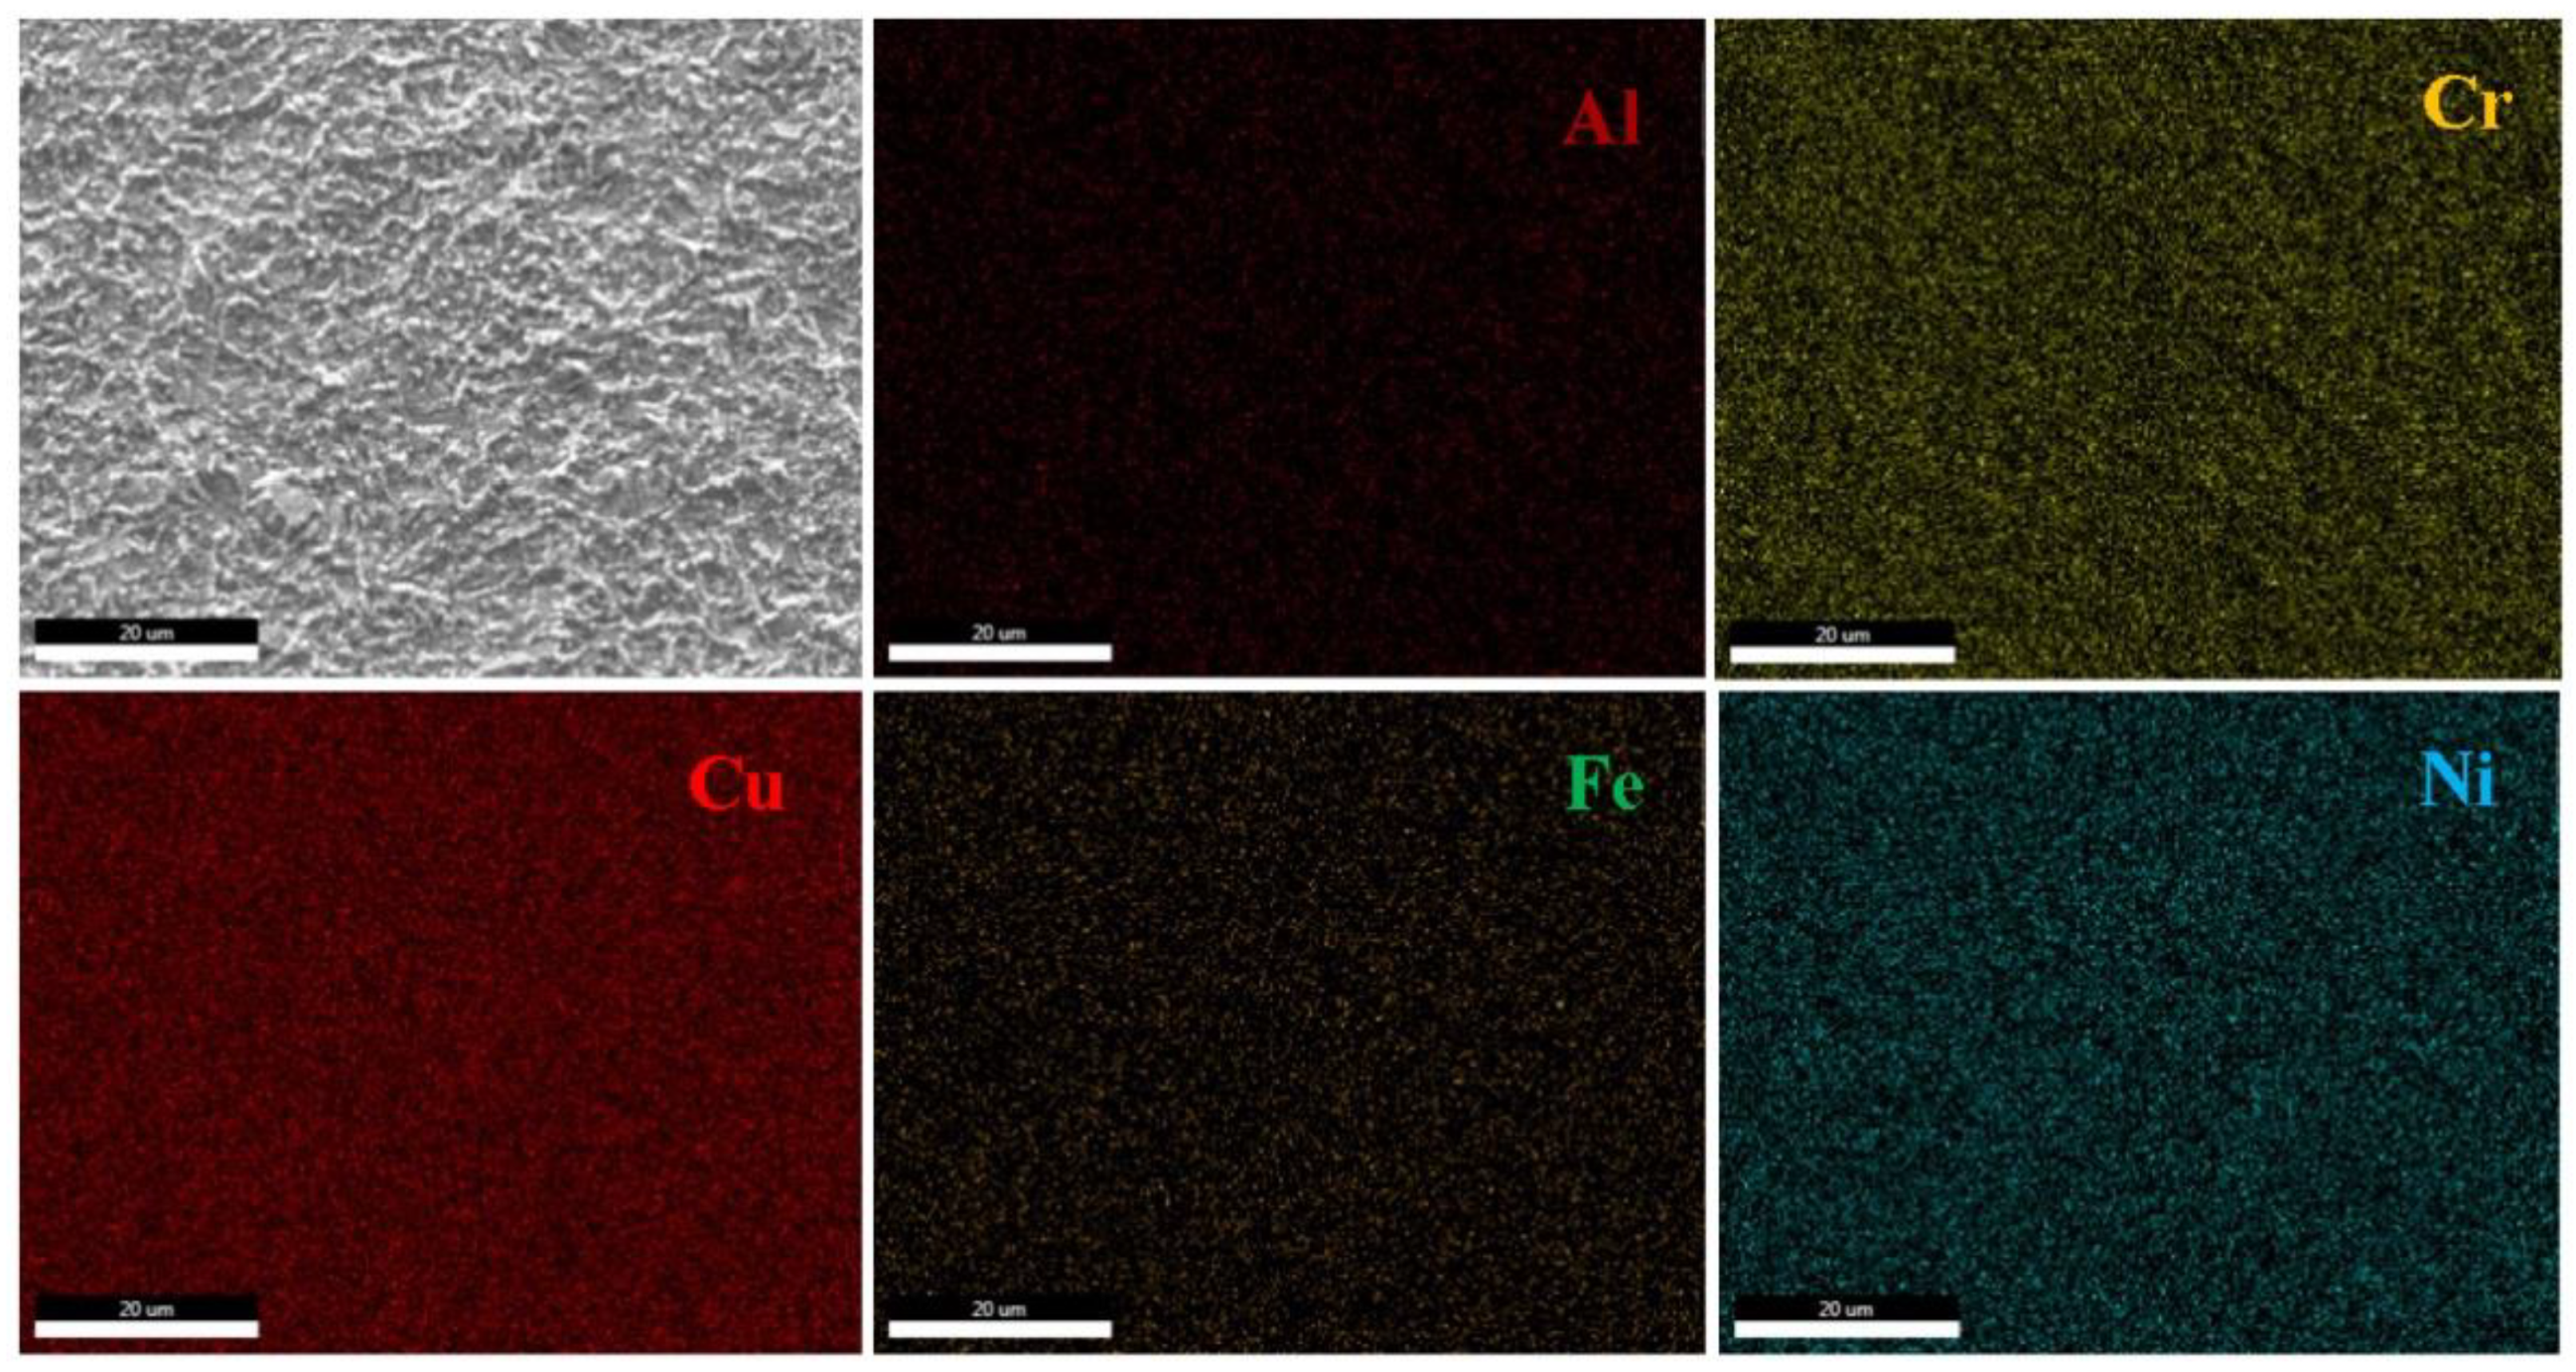
3.4.1. Chemical Characterization
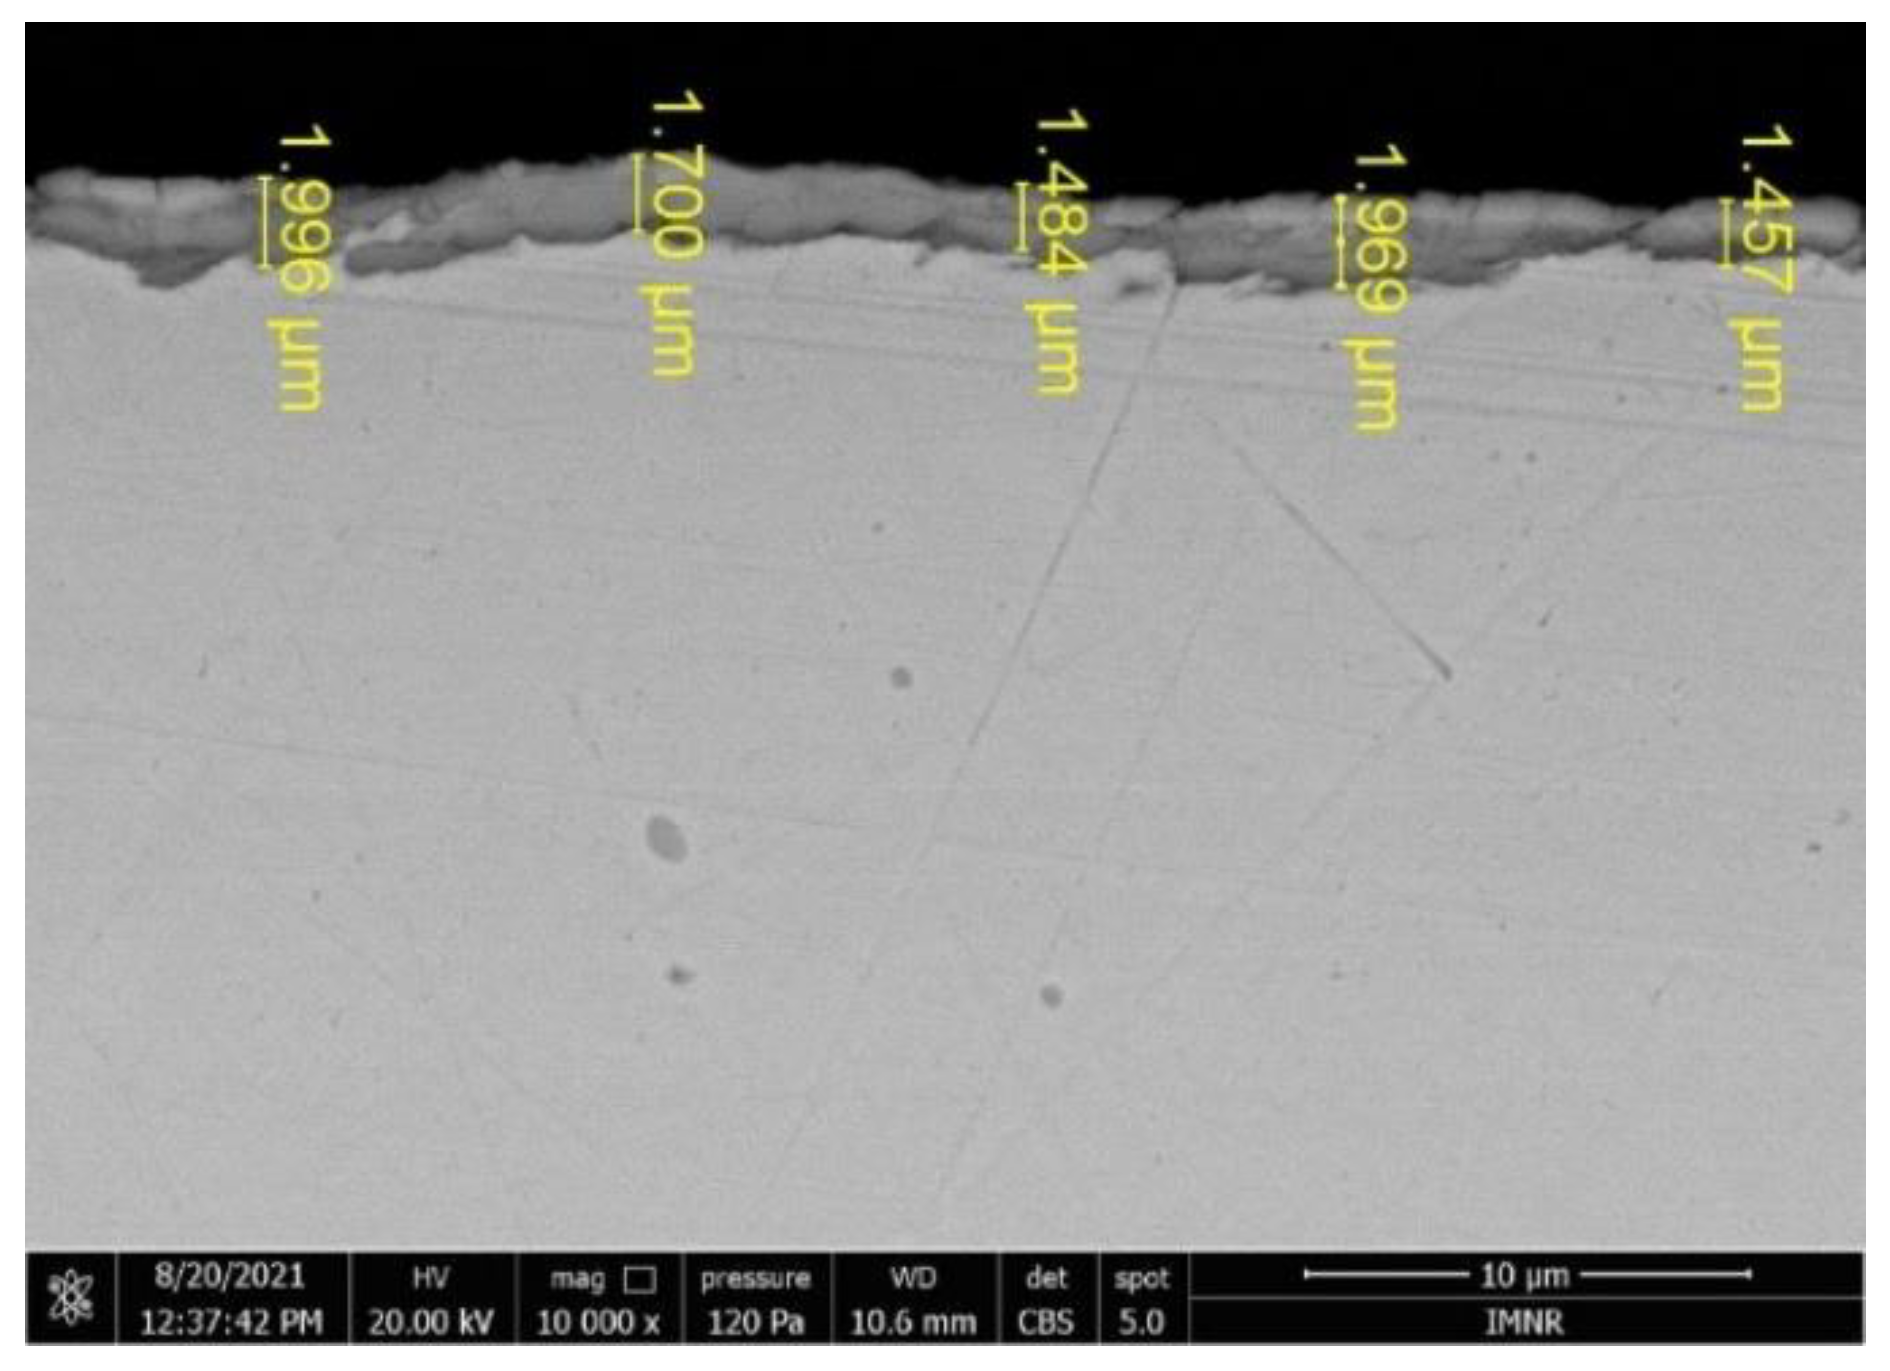
3.4.2. Microstructural Characterization
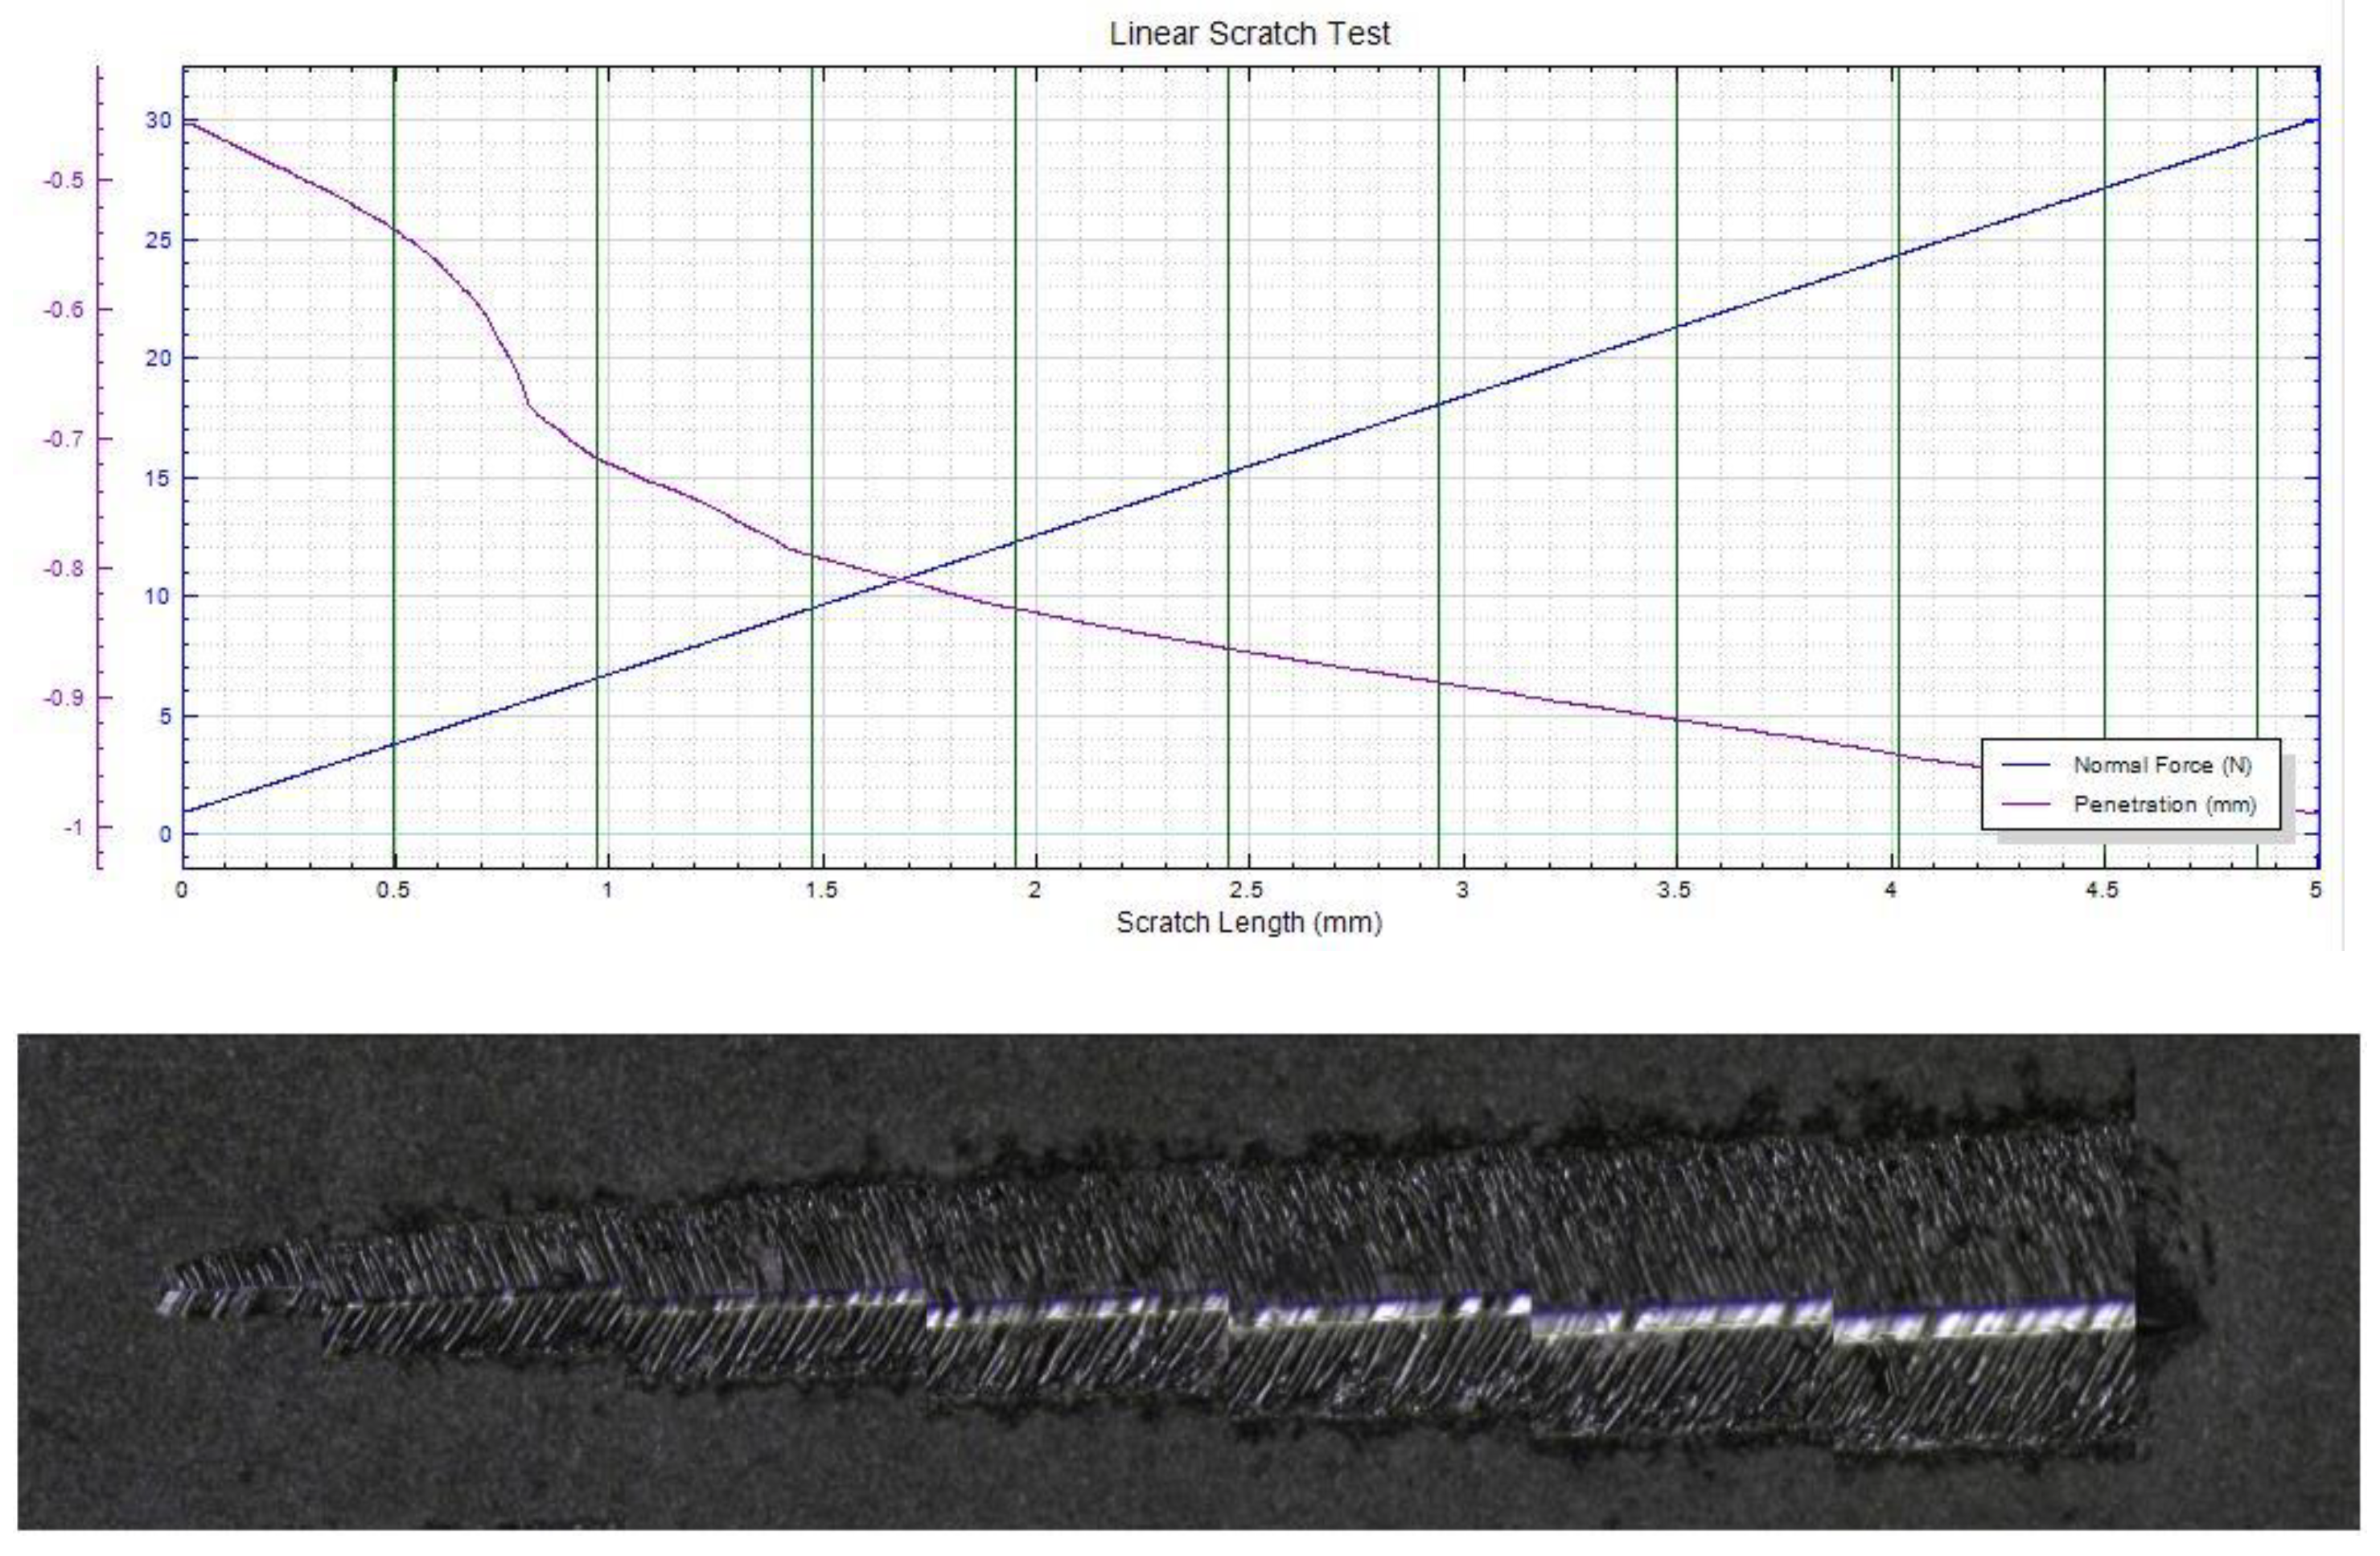
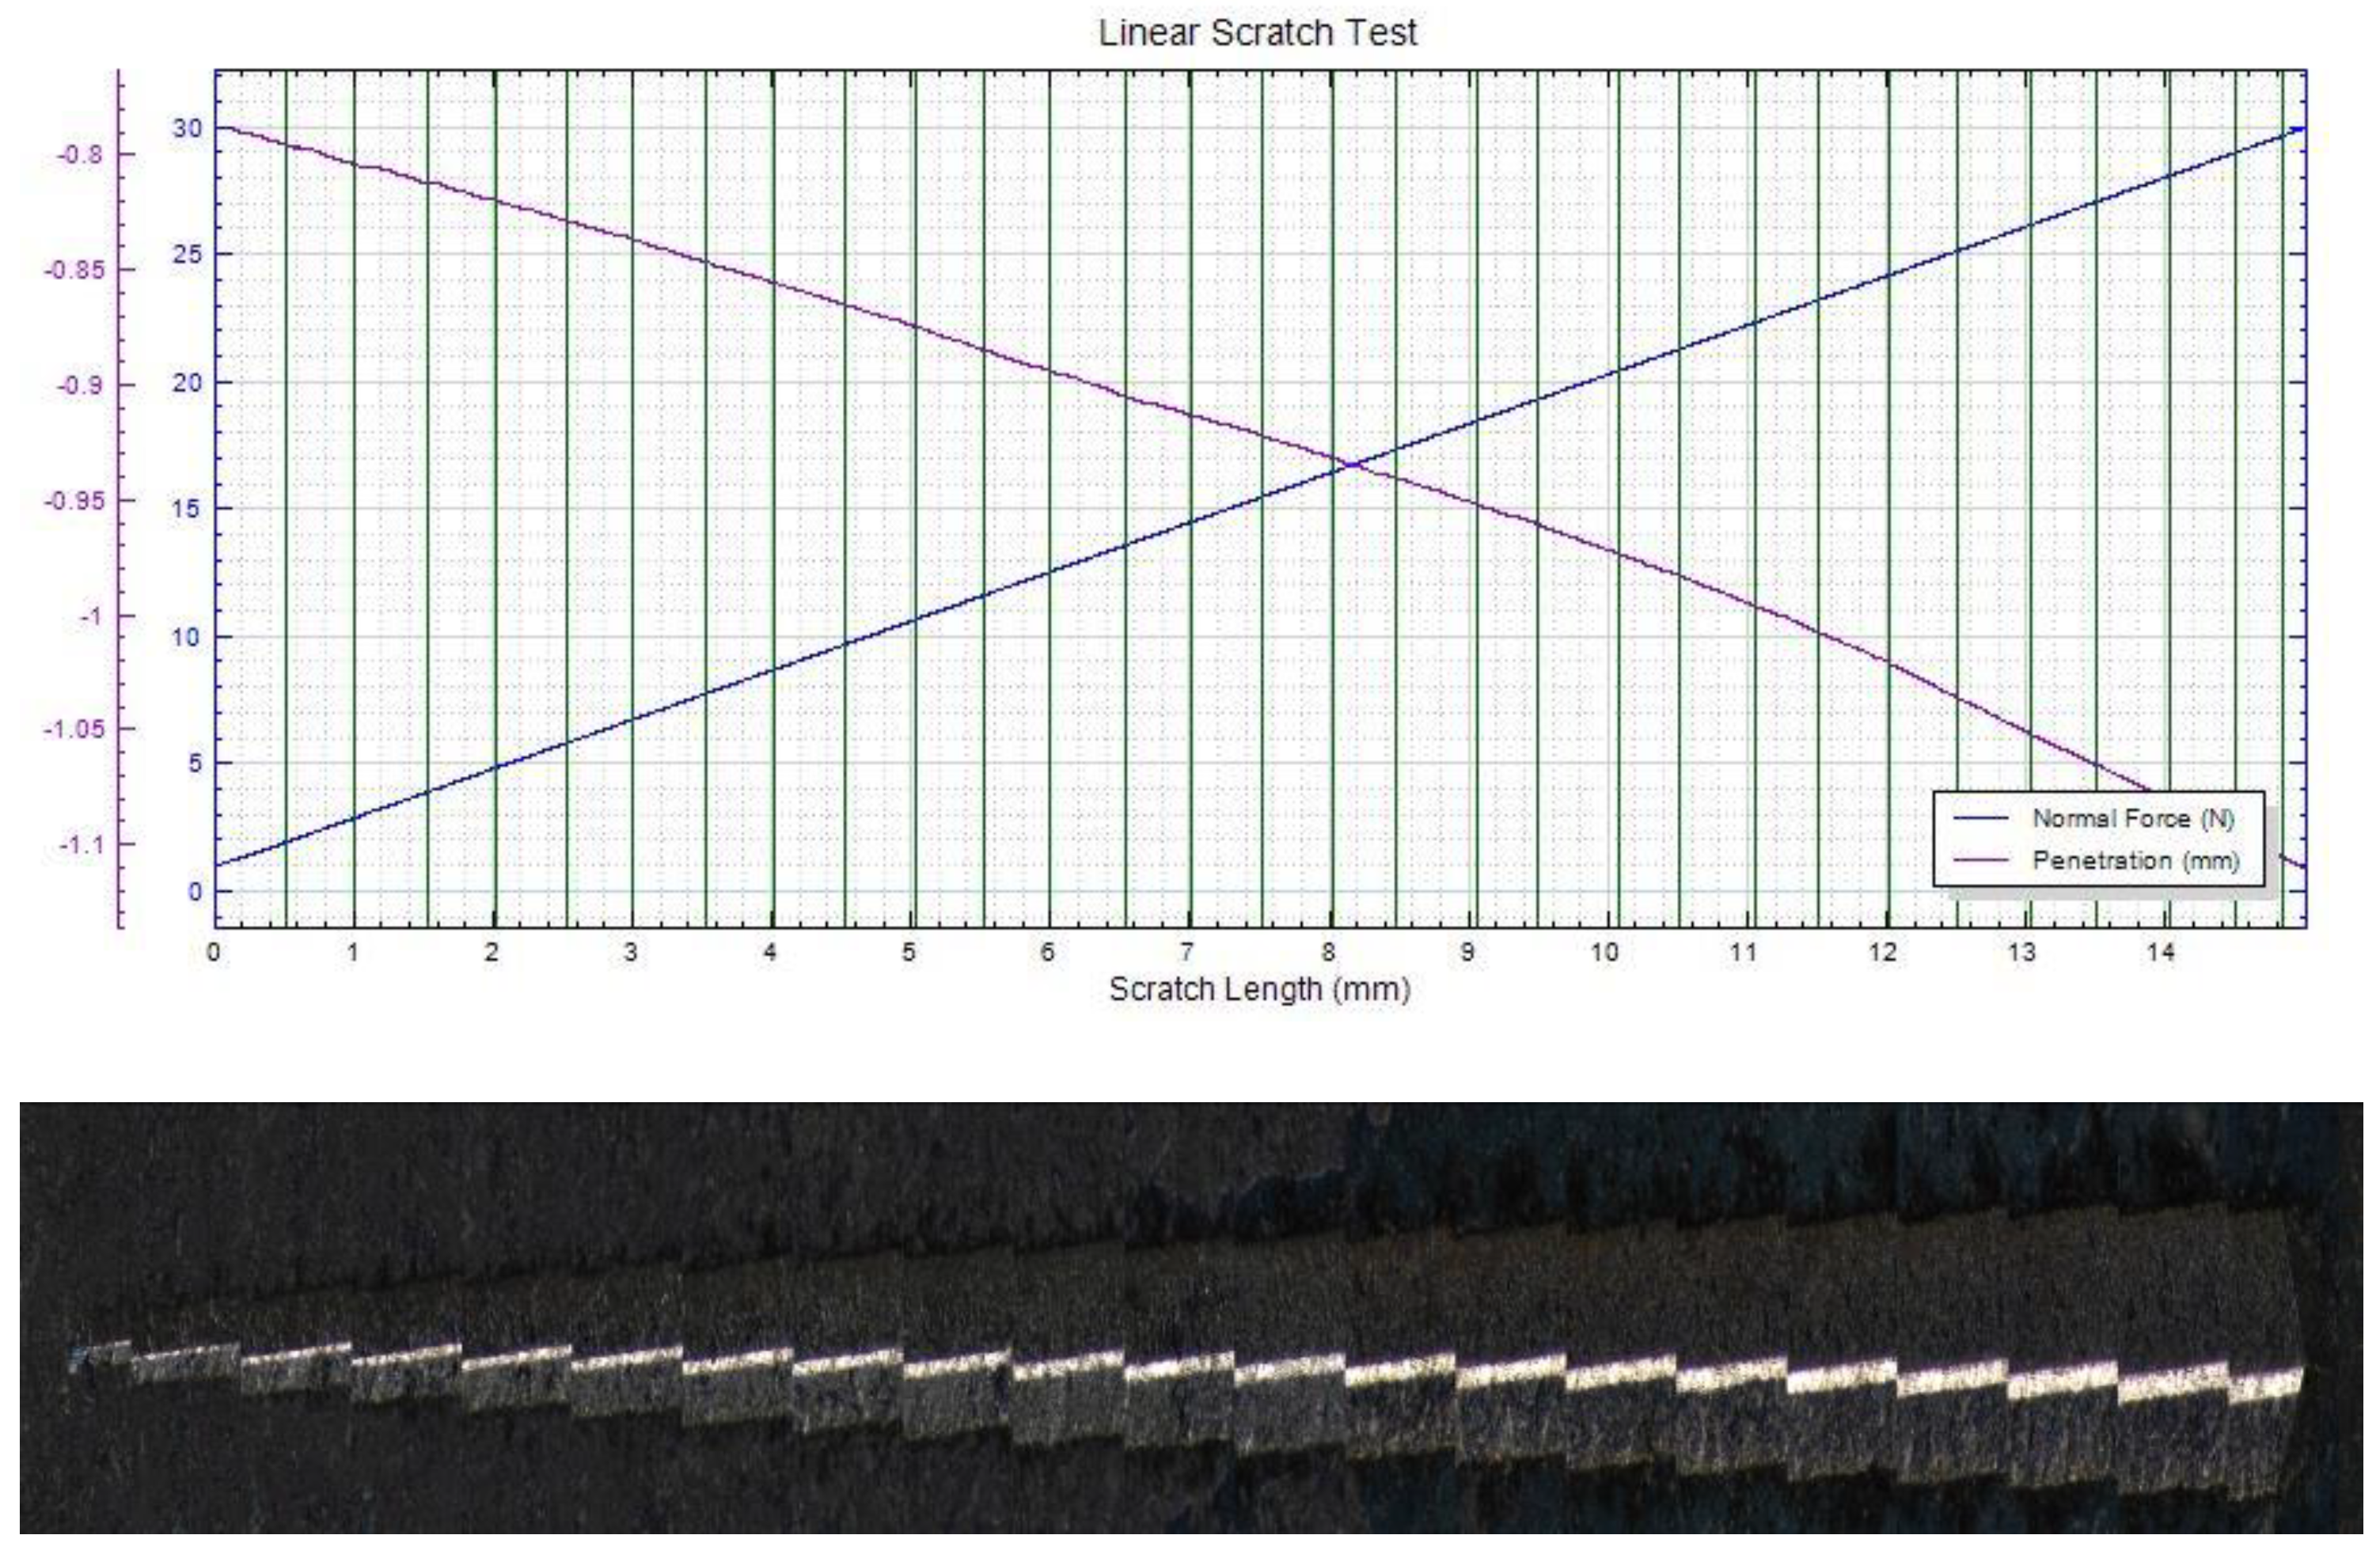
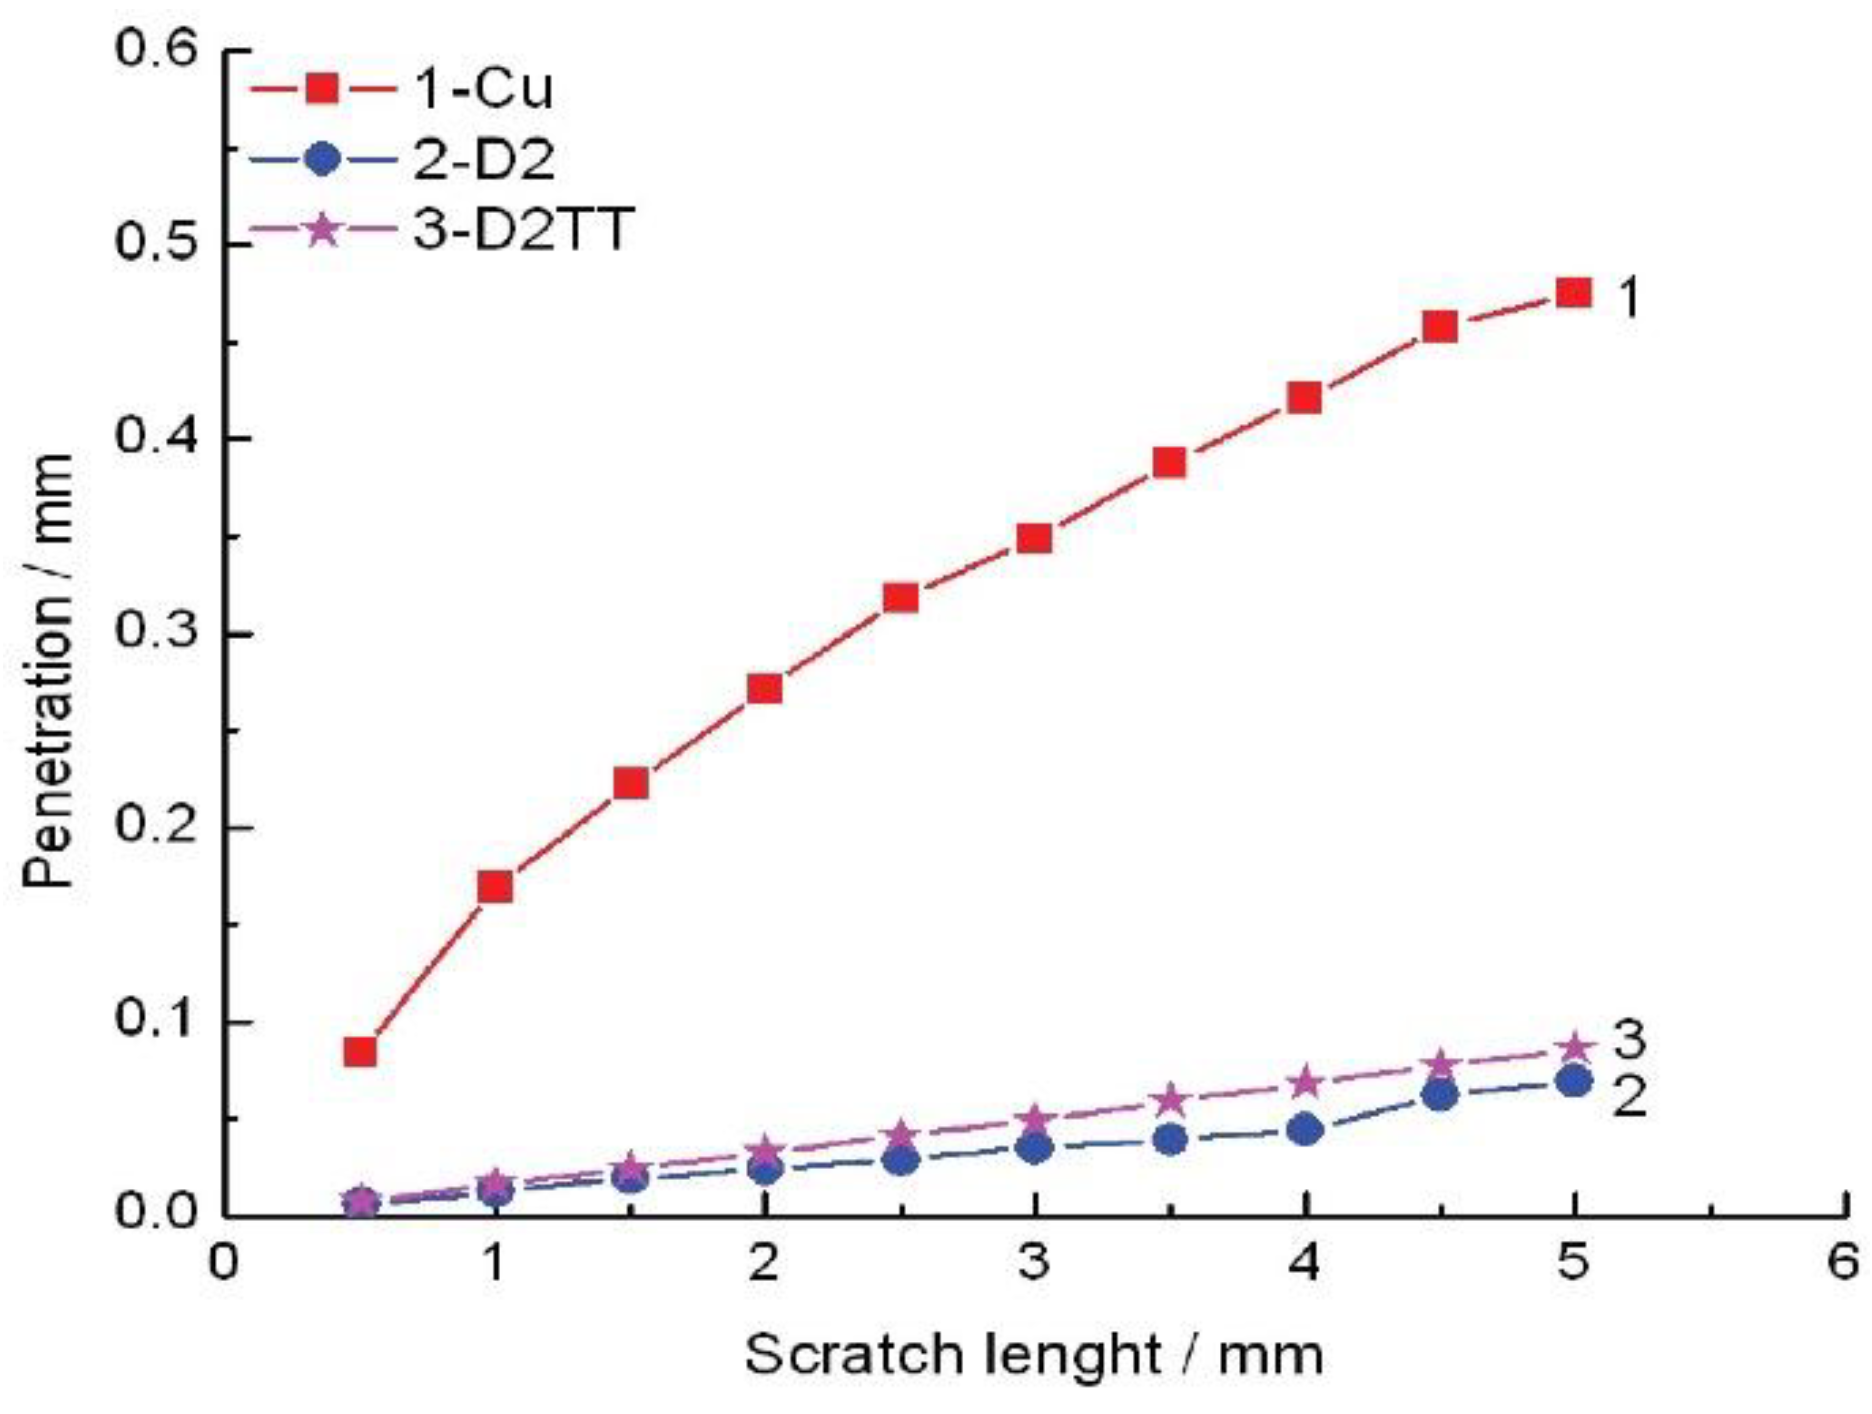
3.5. Corrosion Tests
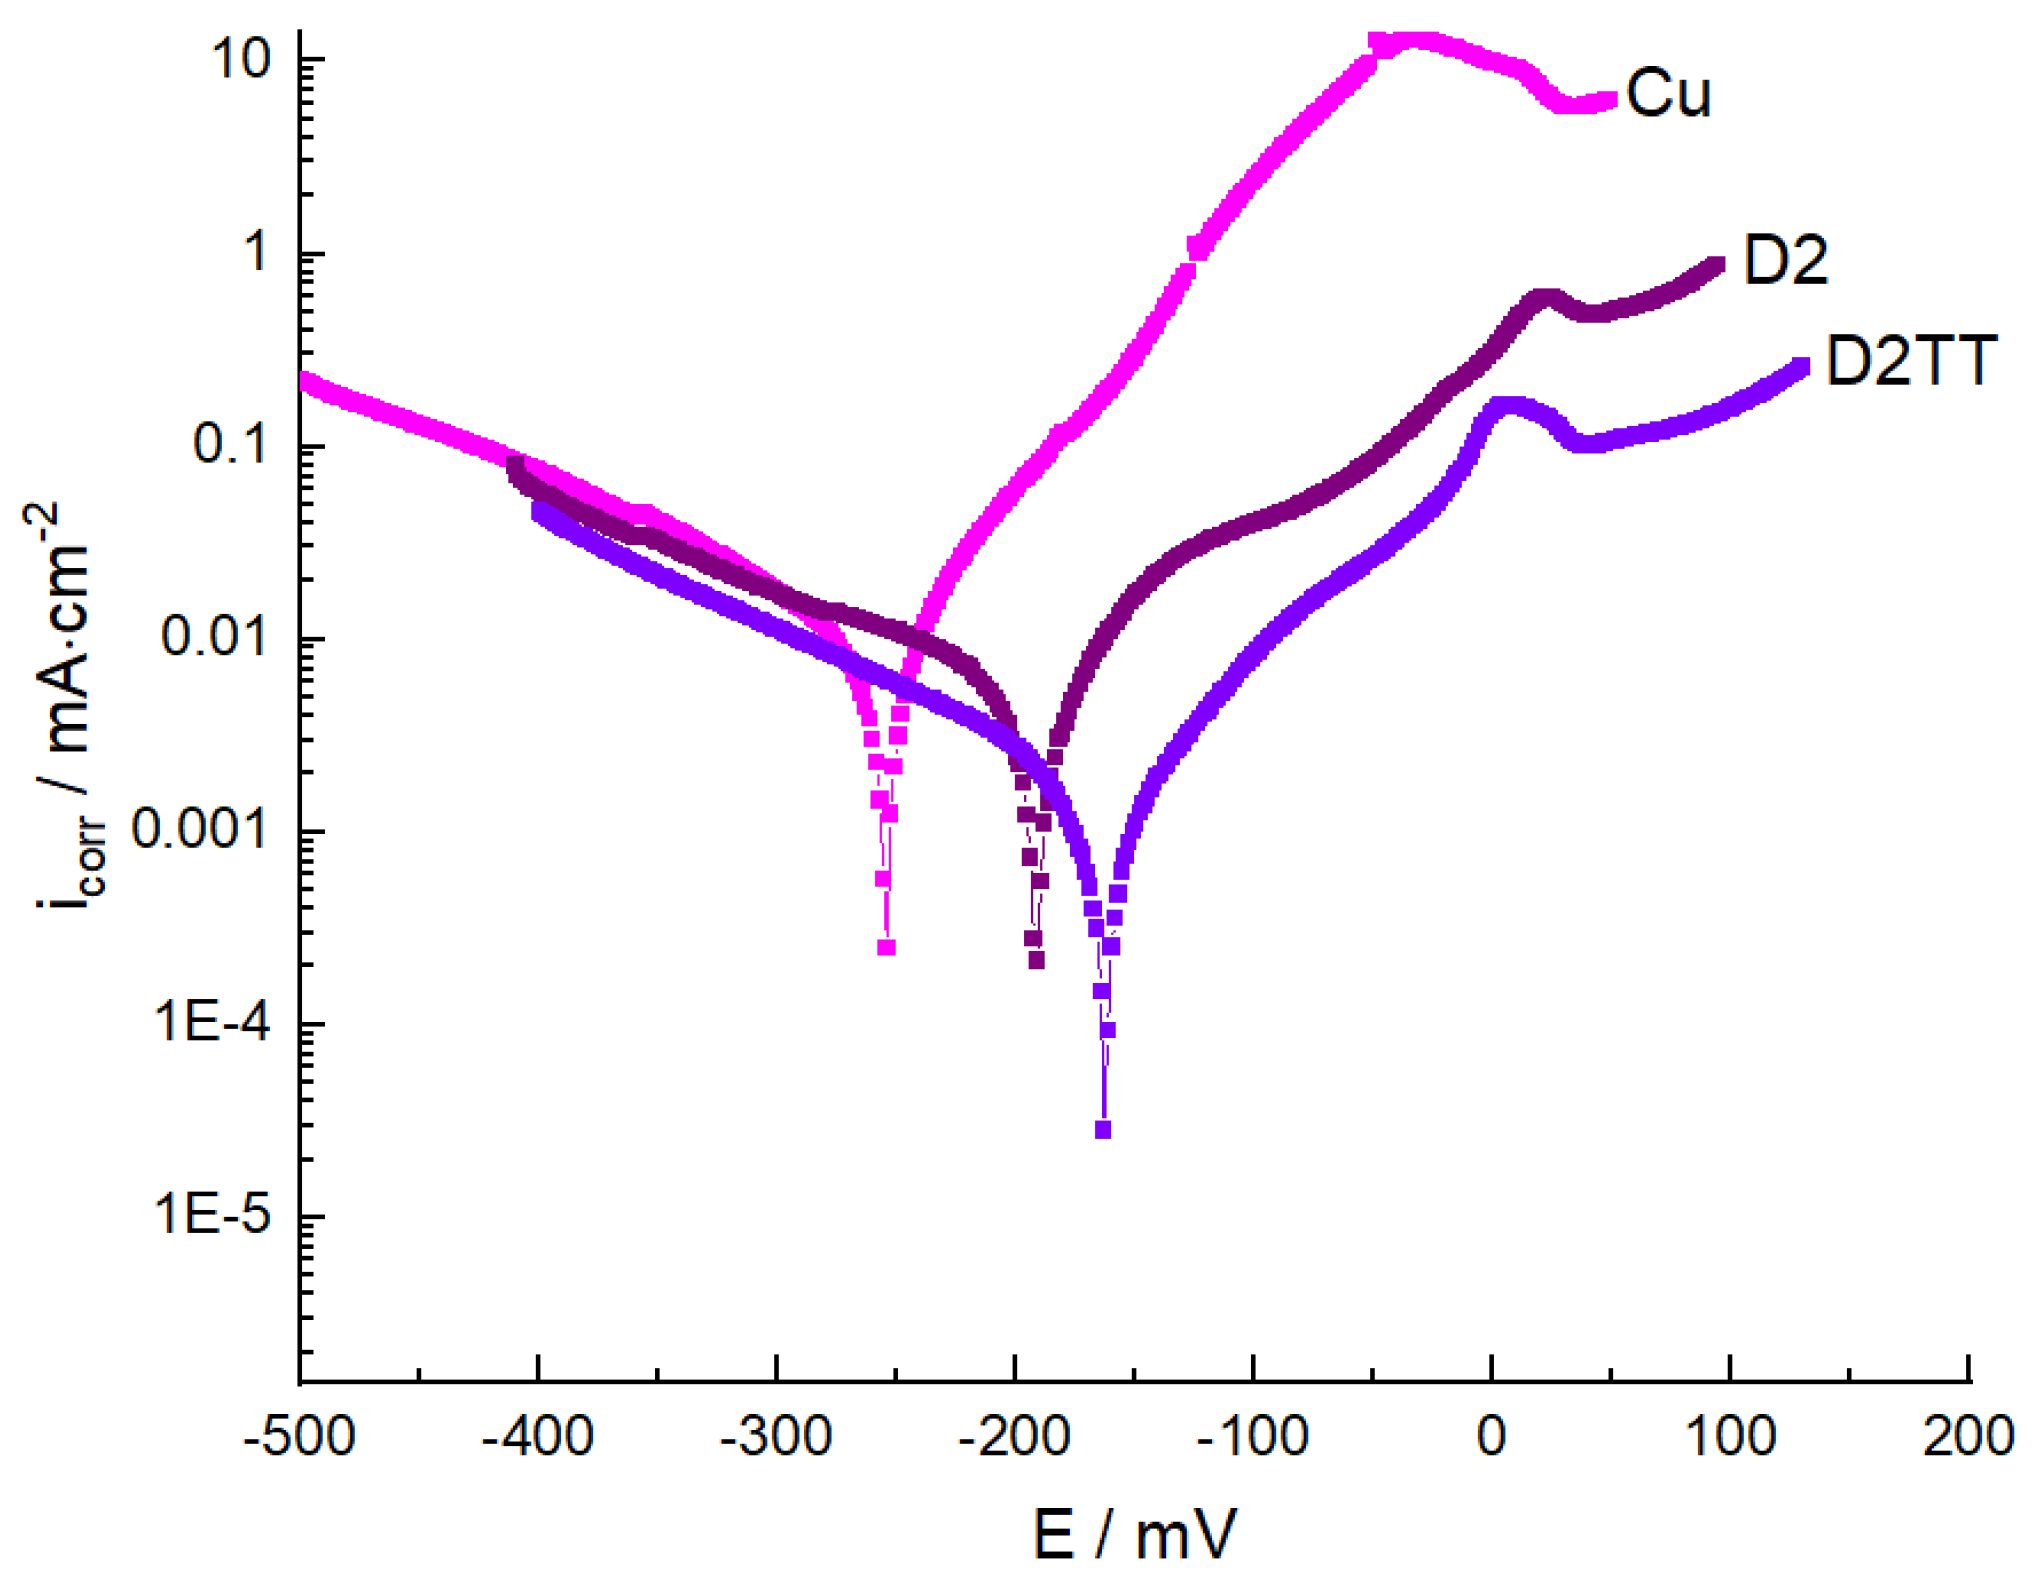
3.5.1. Potentiodynamic Polarization Studies
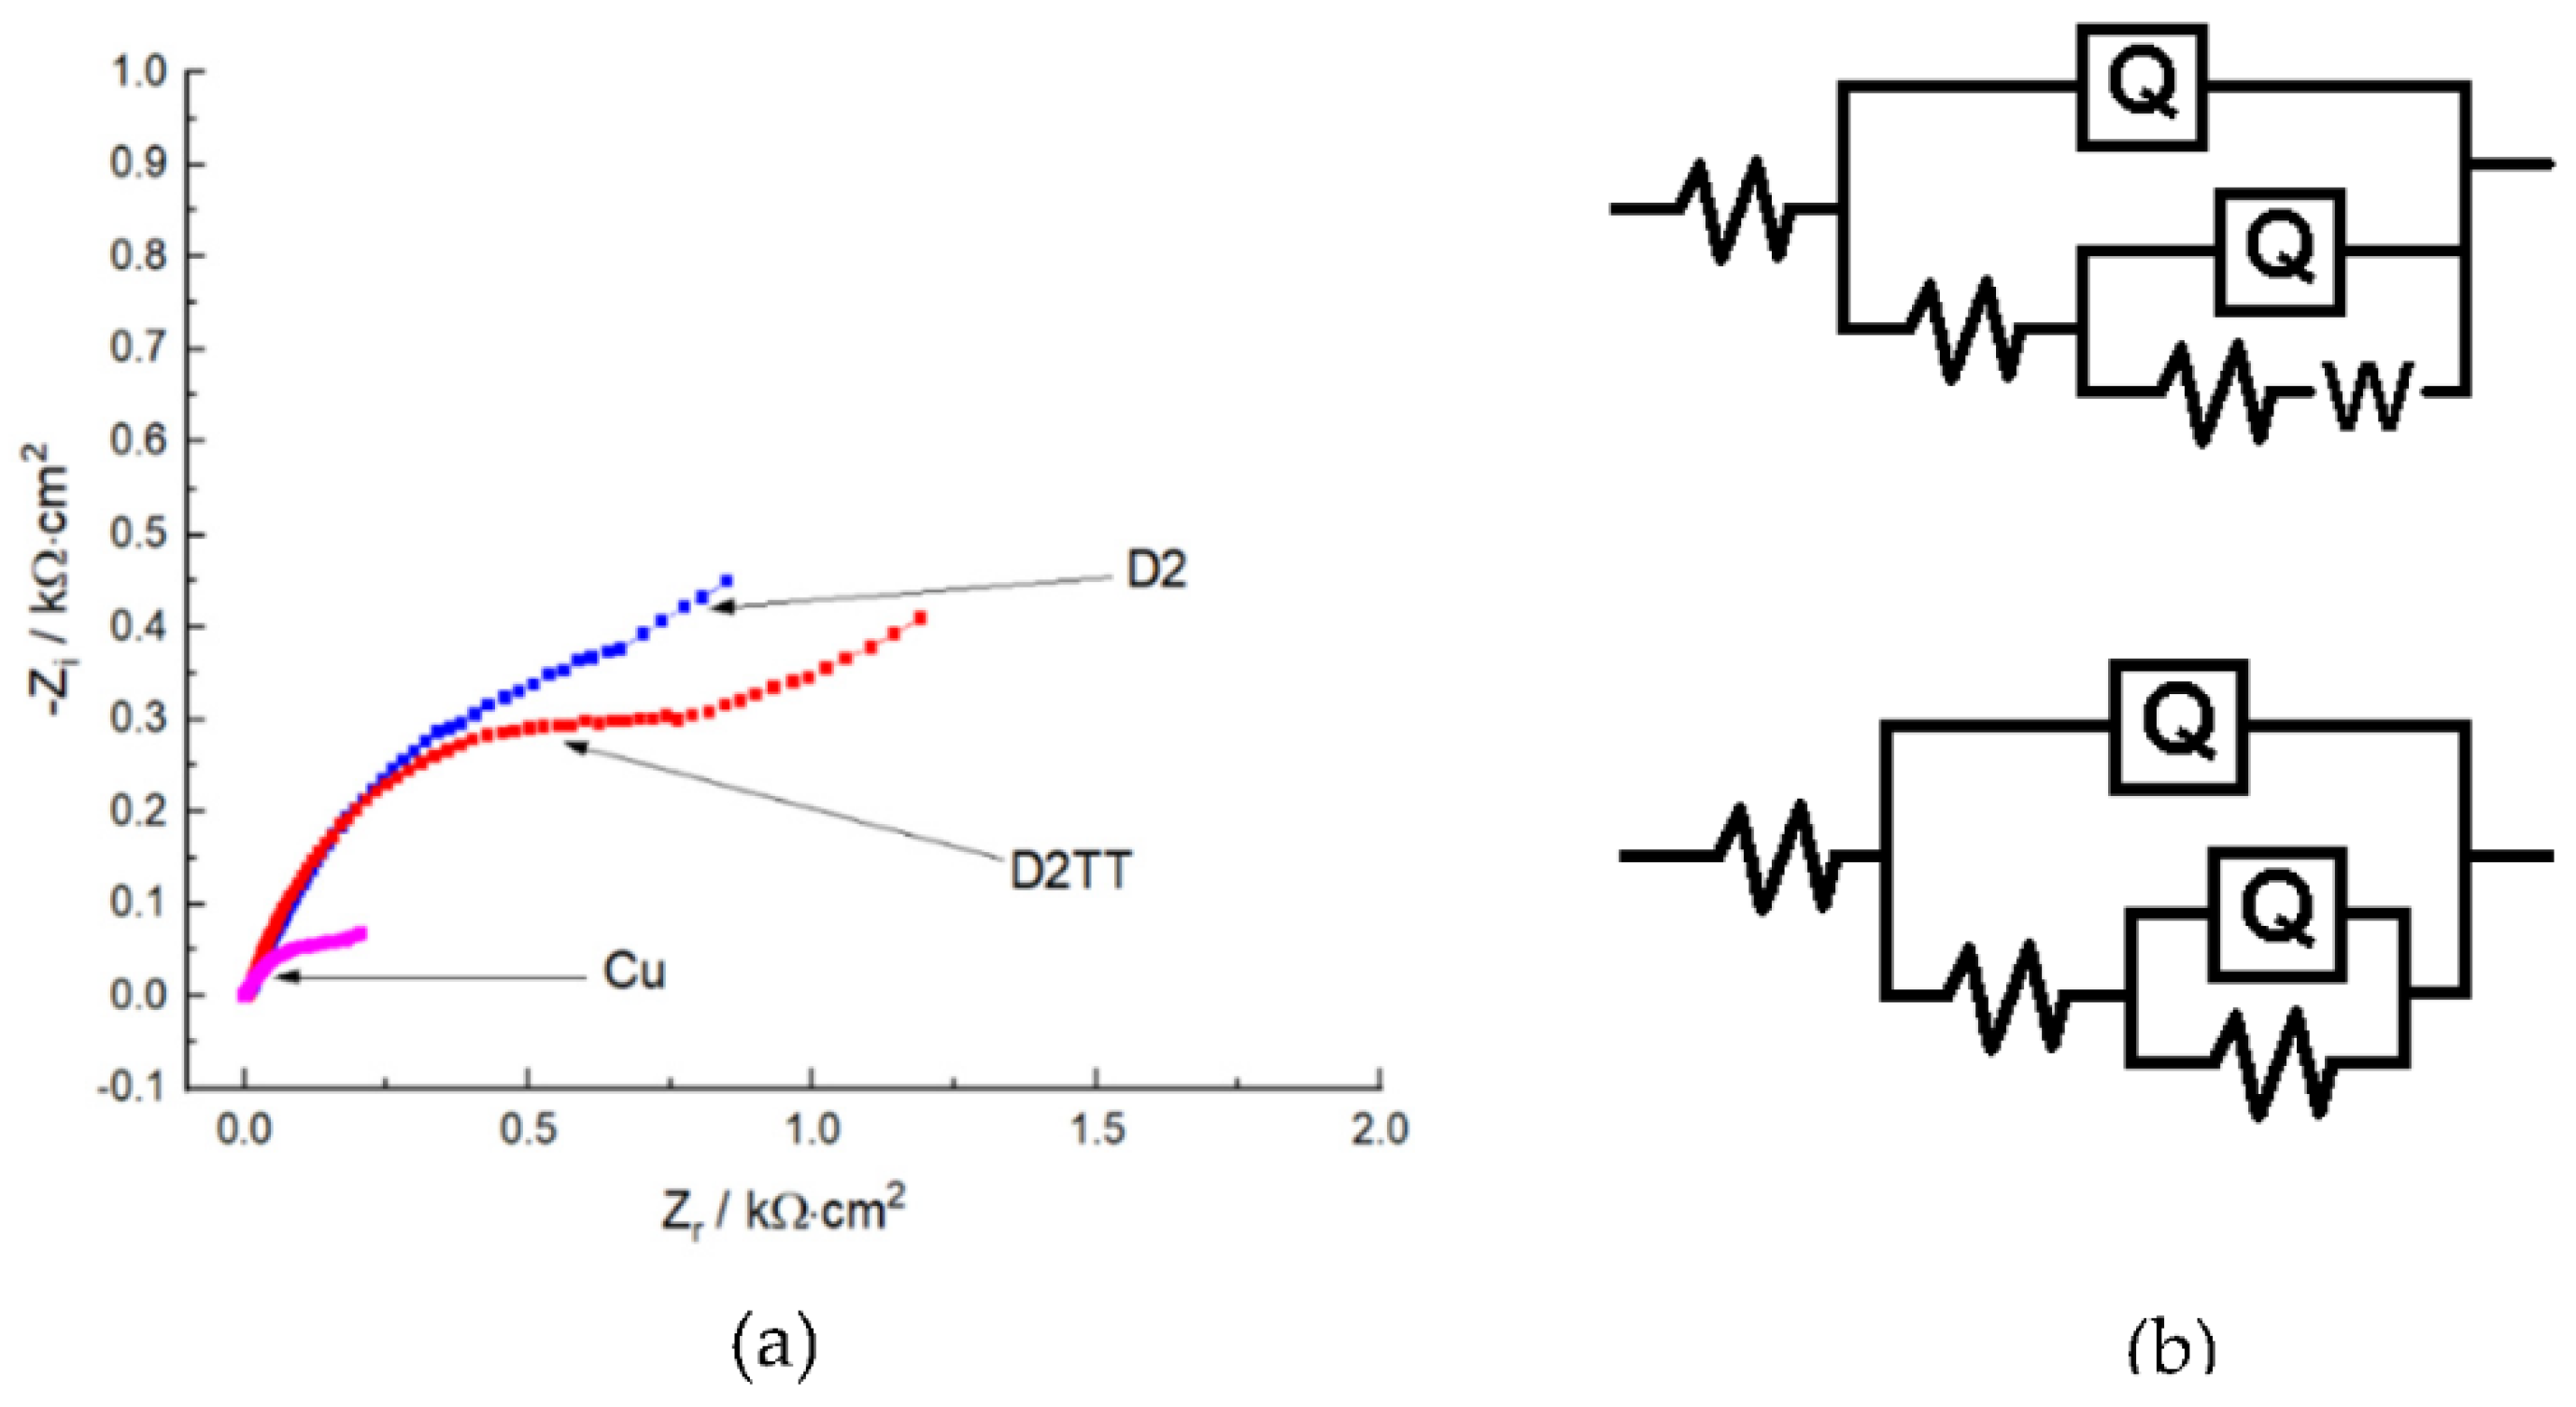
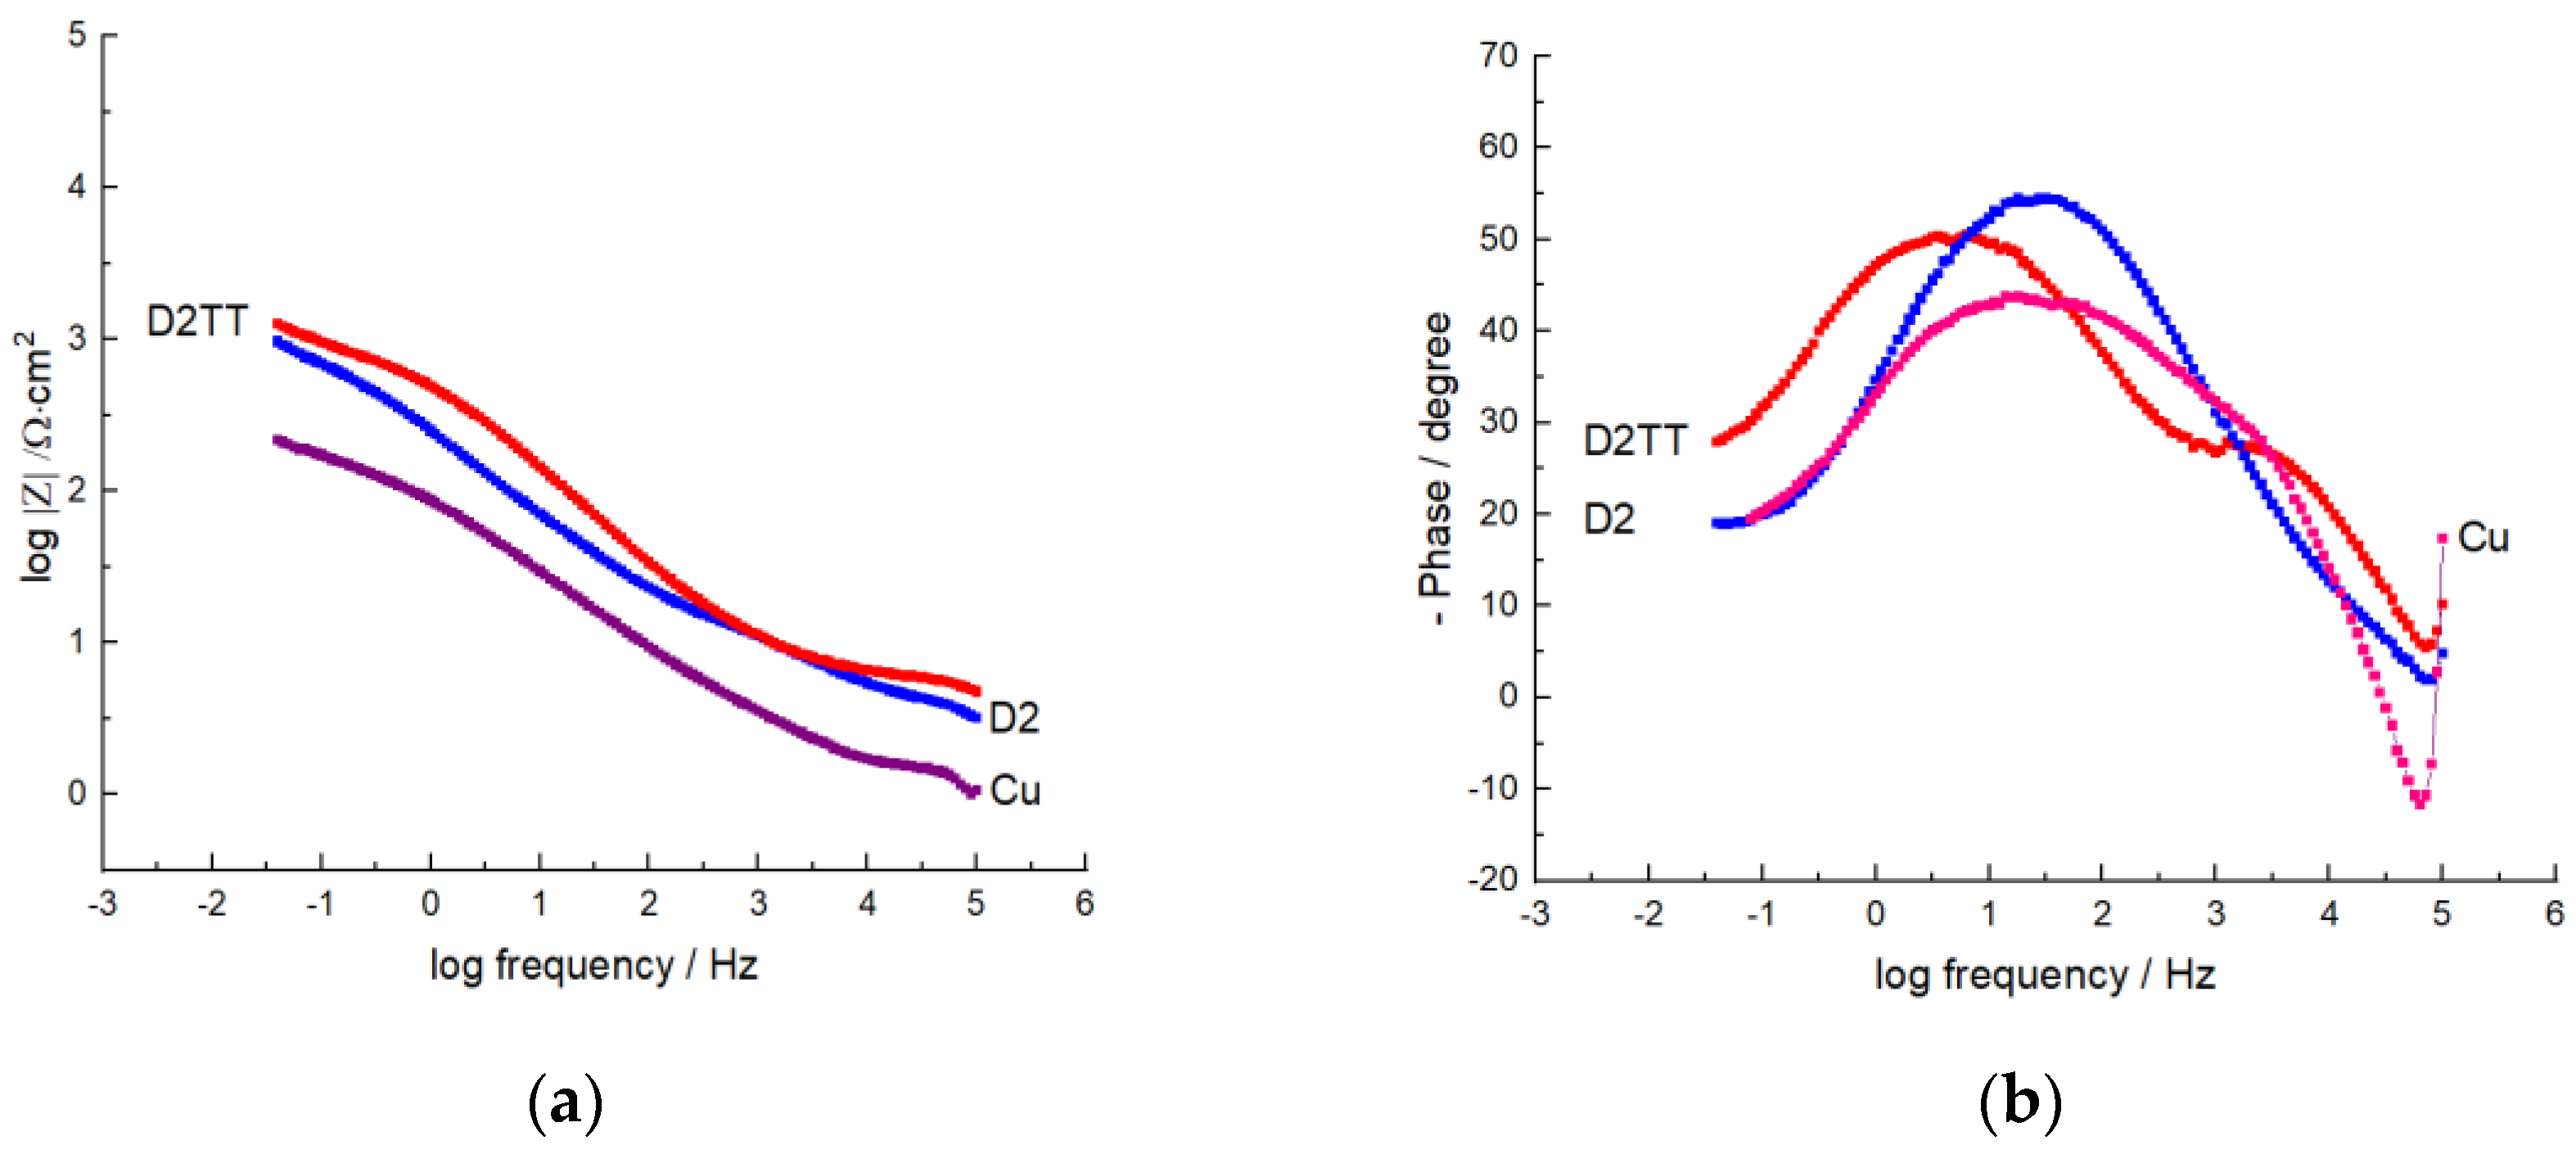
3.5.2. EIS Analysis
4. Conclusions
Author Contributions
Funding
Informed Consent Statement
Data Availability Statement
Acknowledgments
Conflicts of Interest
References
- Tylecote, R.F. A History of Metallurgy, 2nd ed.; The Institute of Materials: London, UK, 1992; ISBN 1-902653-79-3. [Google Scholar]
- Constantinescu, D.; Cârlan, B.A. A point of view about the metallic materials during the human evolution. In Proceedings of the METAL 2017: 26th International Conference on Metallurgy and Materials, Hotel Voronez I, Brno, Czech Republic EU, 24–26 May 2007; pp. 755–760. [Google Scholar]
- Murty, B.S.; Yeh, J.W.; Ranganathan, S. High-Entropy Alloys, 2nd ed.; Elsevier: Amsterdam, The Netherlands, 2019. [Google Scholar]
- Miracle, D.B.; Senkov, O.N. A critical review of high entropy alloys and related concepts. Acta Mater. 2017, 122, 448–511. [Google Scholar] [CrossRef]
- Gao, M.C.; Yeh, J.W.; Liaw, P.K.; Zhang, Y. High-Entropy Alloys Fundamentals and Applications; Springer International Publishing: Cham, Switzerland, 2016. [Google Scholar]
- Sharma, P.; Dwivedi, V.K.; Dwivedi, S.P. Development of high entropy alloys: A review. Mater. Today Proc. 2021, 43, 502–509. [Google Scholar] [CrossRef]
- Jin, K.; Bei, H. Physical properties of high entropy alloys. Encycl. Mater. Met. Alloys 2022, 2, 474–483. [Google Scholar]
- Zhang, Y.; Zuo, T.T.; Tang, Z.; Gao, M.C.; Dahmen, K.A.; Liaw, P.K.; Lu, Z.P. Microstructures and properties of high-entropy alloys. Prog. Mater. Sci. 2014, 61, 1–93. [Google Scholar] [CrossRef]
- Popescu, A.-M.J.; Branzoi, F.; Constantin, I.; Anastasescu, M.; Burada, M.; Mitrica, D.; Anasiei, I.; Olaru, M.-T.; Constantin, V. Electrodeposition, Characterization, and Corrosion Behavior of CoCrFeMnNi High-Entropy Alloy Thin Films. Coatings 2021, 11, 1367. [Google Scholar] [CrossRef]
- Syrovatka, M. On sustainability interpretations of the ecological footprint. Ecol. Econom. 2020, 169, 106543. [Google Scholar] [CrossRef]
- Mukherjee, S. Complex Concentrated Alloys (CCAs)—Current Understanding and Future Opportunities. Metals 2020, 10, 1253. [Google Scholar] [CrossRef]
- Gheribi, A.E.; Pelton, A.D.; Belisle, E.; Digabel, S.L.; Harvey, J.P. On the prediction of low cost high entropy alloys using new thermodynamic multi—Objective criteria. Acta Mater. 2018, 161, 73–82. [Google Scholar] [CrossRef]
- Yang, X.; Zhang, Y. Prediction of high-entropy stabilized solid-solution in multi-component alloys. Mater. Chem. Phys. 2012, 132, 233–238. [Google Scholar] [CrossRef]
- Tsai, M.-H.; Chang, K.-C.; Li, J.-H.; Tsai, R.-C.; Cheng, A.-H. A second criterion for sigma phase formation in high-entropy alloys. Mater. Res. Lett. 2015, 4, 90–95. [Google Scholar] [CrossRef]
- Troparevsky, M.C.; Morris, J.R.; Kent, P.R.C.; Lupini, A.R.; Stocks, G.M. Criteria for Predicting the Formation of Single-Phase High-Entropy Alloys. Phys. Rev. X 2015, 5, 11041. [Google Scholar] [CrossRef] [Green Version]
- Senkov, O.N.; Miller, J.D.; Miracle, D.B.; Woodward, C. Accelerated exploration of multi-principal element alloys with solid solution phases. Nat. Commun. 2015, 6, 6529. [Google Scholar] [CrossRef] [PubMed]
- Kumar, A.; Singh, A.; Suhane, A. Mechanically alloyed high entropy alloys: Existing challenges and opportunities. J. Mater. Res. Technol. 2022, 17, 2431–2456. [Google Scholar] [CrossRef]
- Rahul, M.R.; Samal, S.; Phanikumar, G. Metastable microstructures in the solidification of undercooled high entropy alloys. J. Alloys Compd. 2020, 821, 153488. [Google Scholar] [CrossRef]
- Dada, M.; Popoola, P.; Mathe, N.; Pityana, S.; Adeosun, S. In situ reactive synthesis and characterization of a high entropy alloy coating by laser metal deposition. Int. J. Lightweight Mater. Manuf. 2022, 5, 11–19. [Google Scholar] [CrossRef]
- Braeckman, B.R.; Boydens, F.; Hidalgo, H.; Dutheil, P.; Jullien, M.; Thomann, A.L.; Depla, D. High entropy alloy thin films deposited by magnetron sputtering of powder targets. Thin Solid Film. 2015, 580, 71–76. [Google Scholar] [CrossRef]
- Gunnarsdóttir, I.; Davidsdottir, B.; Worrell, E.; Sigurgeirsdóttir, S. Sustainable energy development: History of the concept and emerging themes. Renew. Sustain. Energy Rev. 2021, 141, 110770. [Google Scholar] [CrossRef]
- Zhang, Y.; Xing, Q. High entropy alloys: Manufacturing routes. Encycl. Mater. Met. Alloys 2022, 2, 327–338. [Google Scholar]
- Soare, V.; Burada, M.; Constantin, I.; Mitrica, D.; Badilita, V.; Caragea, A.; Târcolea, M. Electrochemical deposition and microstructural characterization of AlCrFeMnNi and AlCrCuFeMnNi high entropy alloy thin films. Appl. Surf. Sci. 2015, 358, 533–539. [Google Scholar] [CrossRef]
- Pavithra, C.L.P.; Janardhana, R.K.S.K.; Reddy, K.M.; Murapaka, C.; Joardar, J.; Sarada, B.V.; Tamboli, R.R.; Hu, Y.; Zhang, Y.; Wang, X.; et al. An advancement in the synthesis of unique soft magnetic CoCuFeNiZn high entropy alloy thin films. Sci. Rep. 2021, 11, 8836. [Google Scholar] [CrossRef]
- Yoosefan, F.; Ashraf, A.; Mahmoud Monir Vaghefi, S.; Constantin, I. Synthesis of CoCrFeMnNi high entropy alloy thin films by pulse electrodeposition: Part 1: Effect of pulse electrodeposition parameters. Met. Mater. Int. 2020, 26, 1262–1269. [Google Scholar] [CrossRef]
- Chen, C.H.; Yeh, J.W. High—Entropy coatings. Encycl. Mater. Met. Alloy. 2022, 2, 558–568. [Google Scholar]
- Tang, Z.; Huang, L.; He, W.; Liaw, P.K. Alloying and processing effects on the aqueous corrosion behavior of high-entropy alloys. Entropy 2014, 16, 895–911. [Google Scholar] [CrossRef]
- Aliyu, A.; Srivastava, C. Corrosion behavior and protective film constitution of AlNiCoFeCu and AlCrNiCoFeCu high entropy alloy coatings. Surf. Interfaces 2021, 27, 101481. [Google Scholar] [CrossRef]
- Zhang, C.; Zhang, F.; Chen, S.; Cao, W. Computational Thermodynamics Aided High-Entropy Alloy Design. JOM 2012, 64, 839–845. [Google Scholar] [CrossRef]
- Ågren, J. CALPHAD—An Approach to Predict Microstructural Stability. In Encyclopedia of Materials: Metals and Alloys; Elsevier: Amsterdam, The Netherlands, 2022; Volume 4, pp. 497–509. ISBN 9780128197332. [Google Scholar]
- Katz-Demyanetz, A.; Gorbachev, I.; Eshed, E.; Popov, V.; Bamberger, M. High entropy Al0.5CrMoNbTa0.5 alloy: Additive manufacturing vs. casting vs. CALPHAD approval calculations. Mater. Charact. 2020, 167, 110505. [Google Scholar] [CrossRef]
- Popescu, A.-M.J.; Branzoi, F.; Burada, M.; Atkinson, I.; Constantin, I.; Moreno, J.C.; Miculescu, F.; Mitrica, D.; Badea, I.-C.; Olaru, M.T.; et al. Influence of Heat Treatment on the Corrosion Behavior of Electrodeposited CoCrFeMnNi High-Entropy Alloy Thin Films. Coatings 2022, 12, 1108. [Google Scholar] [CrossRef]
- Hizi, W.; Rahmouni, H.; Gorji, N.E.; Guesmi, A.; Ben Hamadi, N.; Khezami, L.; Dhahri, E.; Khirouni, K.; Gassoumi, M. Impact of Sintering Temperature on the Electrical Properties of La0.9Sr0.1MnO3 Manganite. Catalysts 2022, 12, 340. [Google Scholar] [CrossRef]


| Material | AlCl3 mol/L | CrCl3 × 6H2O mol/L | CuCl2 mol/L | FeCl2 × 4H2O mol/L | NiCl2 × 6H2O mol/L | LiCl0.4 mol/L |
|---|---|---|---|---|---|---|
| Electrolyte | 0.02 | 0.07 | 0.03 | 0.02 | 0.05 | 0.1 |
| Alloy | Electrolyte Type | Potential, V | Time, Min | Scan Rate, mV/s |
|---|---|---|---|---|
| D1 | El | −1.0 to −2.8 V | - | 50 |
| D2 | El | −3.0 V | 30 min | - |
| State | Al | Cr | Cu | Fe | Ni | Average Difference |
|---|---|---|---|---|---|---|
| nominal | 5.03 | 33.98 | 17.8 | 12.51 | 30.68 | - |
| D1 | 14.94 | 4.72 | 53.20 | 21.63 | 5.51 | 21.772 |
| D2 | 9.6 | 31.5 | 15.4 | 12.9 | 30.6 | 1.984 |
| Sample | Ecorr, (mV) | Icorr, µA/cm2 | Rp, ohm·cm2 | ba | bc | R, mpy | P, mm/an | E, % |
|---|---|---|---|---|---|---|---|---|
| Cu | −263 | 7.73 | 1782 | 63 | −125 | 3.66 | 0.093 | - |
| D2 | −192 | 5.23 | 3400 | 78 | −185 | 2.531 | 0.064 | 34 |
| D2TT | −205 | 4.01 | 2800 | 93 | −96 | 2.012 | 0.051 | 50 |
| System | Rs | Q1-Yo | Q1-n | Rf/Rc | Q2-Yo | Q2-n | Rct | W | χ |
|---|---|---|---|---|---|---|---|---|---|
| Cu | 16.9 | 1.143 × 10⁻⁴ | 0.705 | 232 | 1.642 × 10⁻⁴ | 0.622 | 1843 | 0.002246 | 6.17 × 10⁻⁴ |
| D2TT | 5.69 | 0.000402 | 0.675 | 572 | 0.005279 | 0.79 | 1315 | - | 1.26 × 10⁻³ |
| D2 | 3.73 | 8.173 × 10⁻⁵ | 0.767 | 9973 | 0.001029 | 0.625 | 1135 | 0.00603 | 7.61 × 10⁻⁴ |
Publisher’s Note: MDPI stays neutral with regard to jurisdictional claims in published maps and institutional affiliations. |
© 2022 by the authors. Licensee MDPI, Basel, Switzerland. This article is an open access article distributed under the terms and conditions of the Creative Commons Attribution (CC BY) license (https://creativecommons.org/licenses/by/4.0/).
Share and Cite
Serban, B.-A.; Olaru, M.-T.; Badea, I.-C.; Mitrica, D.; Burada, M.; Anasiei, I.; Ghita, M.; Tudor, A.-I.; Matei, C.-A.; Popescu, A.M.J.; et al. Non-Aqueous Electrodeposition and Characterization of AlCrCuFeNi High Entropy Alloy Thin Films. Materials 2022, 15, 6007. https://doi.org/10.3390/ma15176007
Serban B-A, Olaru M-T, Badea I-C, Mitrica D, Burada M, Anasiei I, Ghita M, Tudor A-I, Matei C-A, Popescu AMJ, et al. Non-Aqueous Electrodeposition and Characterization of AlCrCuFeNi High Entropy Alloy Thin Films. Materials. 2022; 15(17):6007. https://doi.org/10.3390/ma15176007
Chicago/Turabian StyleSerban, Beatrice-Adriana, Mihai-Tudor Olaru, Ioana-Cristina Badea, Dumitru Mitrica, Marian Burada, Ioana Anasiei, Mihai Ghita, Albert-Ioan Tudor, Cristian-Alexandru Matei, Ana Maria Julieta Popescu, and et al. 2022. "Non-Aqueous Electrodeposition and Characterization of AlCrCuFeNi High Entropy Alloy Thin Films" Materials 15, no. 17: 6007. https://doi.org/10.3390/ma15176007
APA StyleSerban, B.-A., Olaru, M.-T., Badea, I.-C., Mitrica, D., Burada, M., Anasiei, I., Ghita, M., Tudor, A.-I., Matei, C.-A., Popescu, A. M. J., Constantin, V., Branzoi, F., Dobrescu, C., & Constantin, N. (2022). Non-Aqueous Electrodeposition and Characterization of AlCrCuFeNi High Entropy Alloy Thin Films. Materials, 15(17), 6007. https://doi.org/10.3390/ma15176007