
Study on the Application of Sediment-Based Embankment Building and Ultra-High-Performance Concrete (UHPC) Preparation in the Resource Utilization of Yellow River Sediment

Abstract
:1. Introduction
2. Previous Work
2.1. Sediment Used for Land Rectification
- (1)
- Flood diversion and desilting: The silted Yellow River sediment is adopted to fill dike ditches and cascade ditches on the beach surface to improve the impermeability of the dike and to prevent the river from rushing directly into the dike along the cascade ditch. Based on silting treatment, the probability of flood discharge along the embankment and the occurrence of cross river, oblique river, and rolling river decreases, thus ensuring flood-control safety of the Yellow River embankment to a certain extent. First, the sediment of the Yellow River can consume the sediment deposited by the Yellow River. Further, the construction of village platforms and centralized resettlement can save considerable land resources and improve the carrying capacity of land resources for economic and social development.
- (2)
- Sediment filling of collapsed mining areas: There are a considerable number of coal mines in the Yellow River Basin [9]. Out of the 26 large coal fields in China with proven reserves of more than 10 billion tons, 12 are in the Yellow River Basin. Due to the shallow burial of coal seams and unfavorable construction, numerous coal mining subsidence areas have been formed. Shandong alone has five areas: Jining Zaozhuang Plain Lake, Tai’an Laiwu Hills, Jinan Dezhou Binhuang River, Heze Plain, and Longkou Binhai Plain. First, coal mines can save subsidence land compensation and cultivated land occupation tax every year due to safe production and mine standardization construction, which reduces the economic burden of enterprises. Further, this improves agricultural conditions by enhancing drought and flood resistance, land productivity, and output.
- (3)
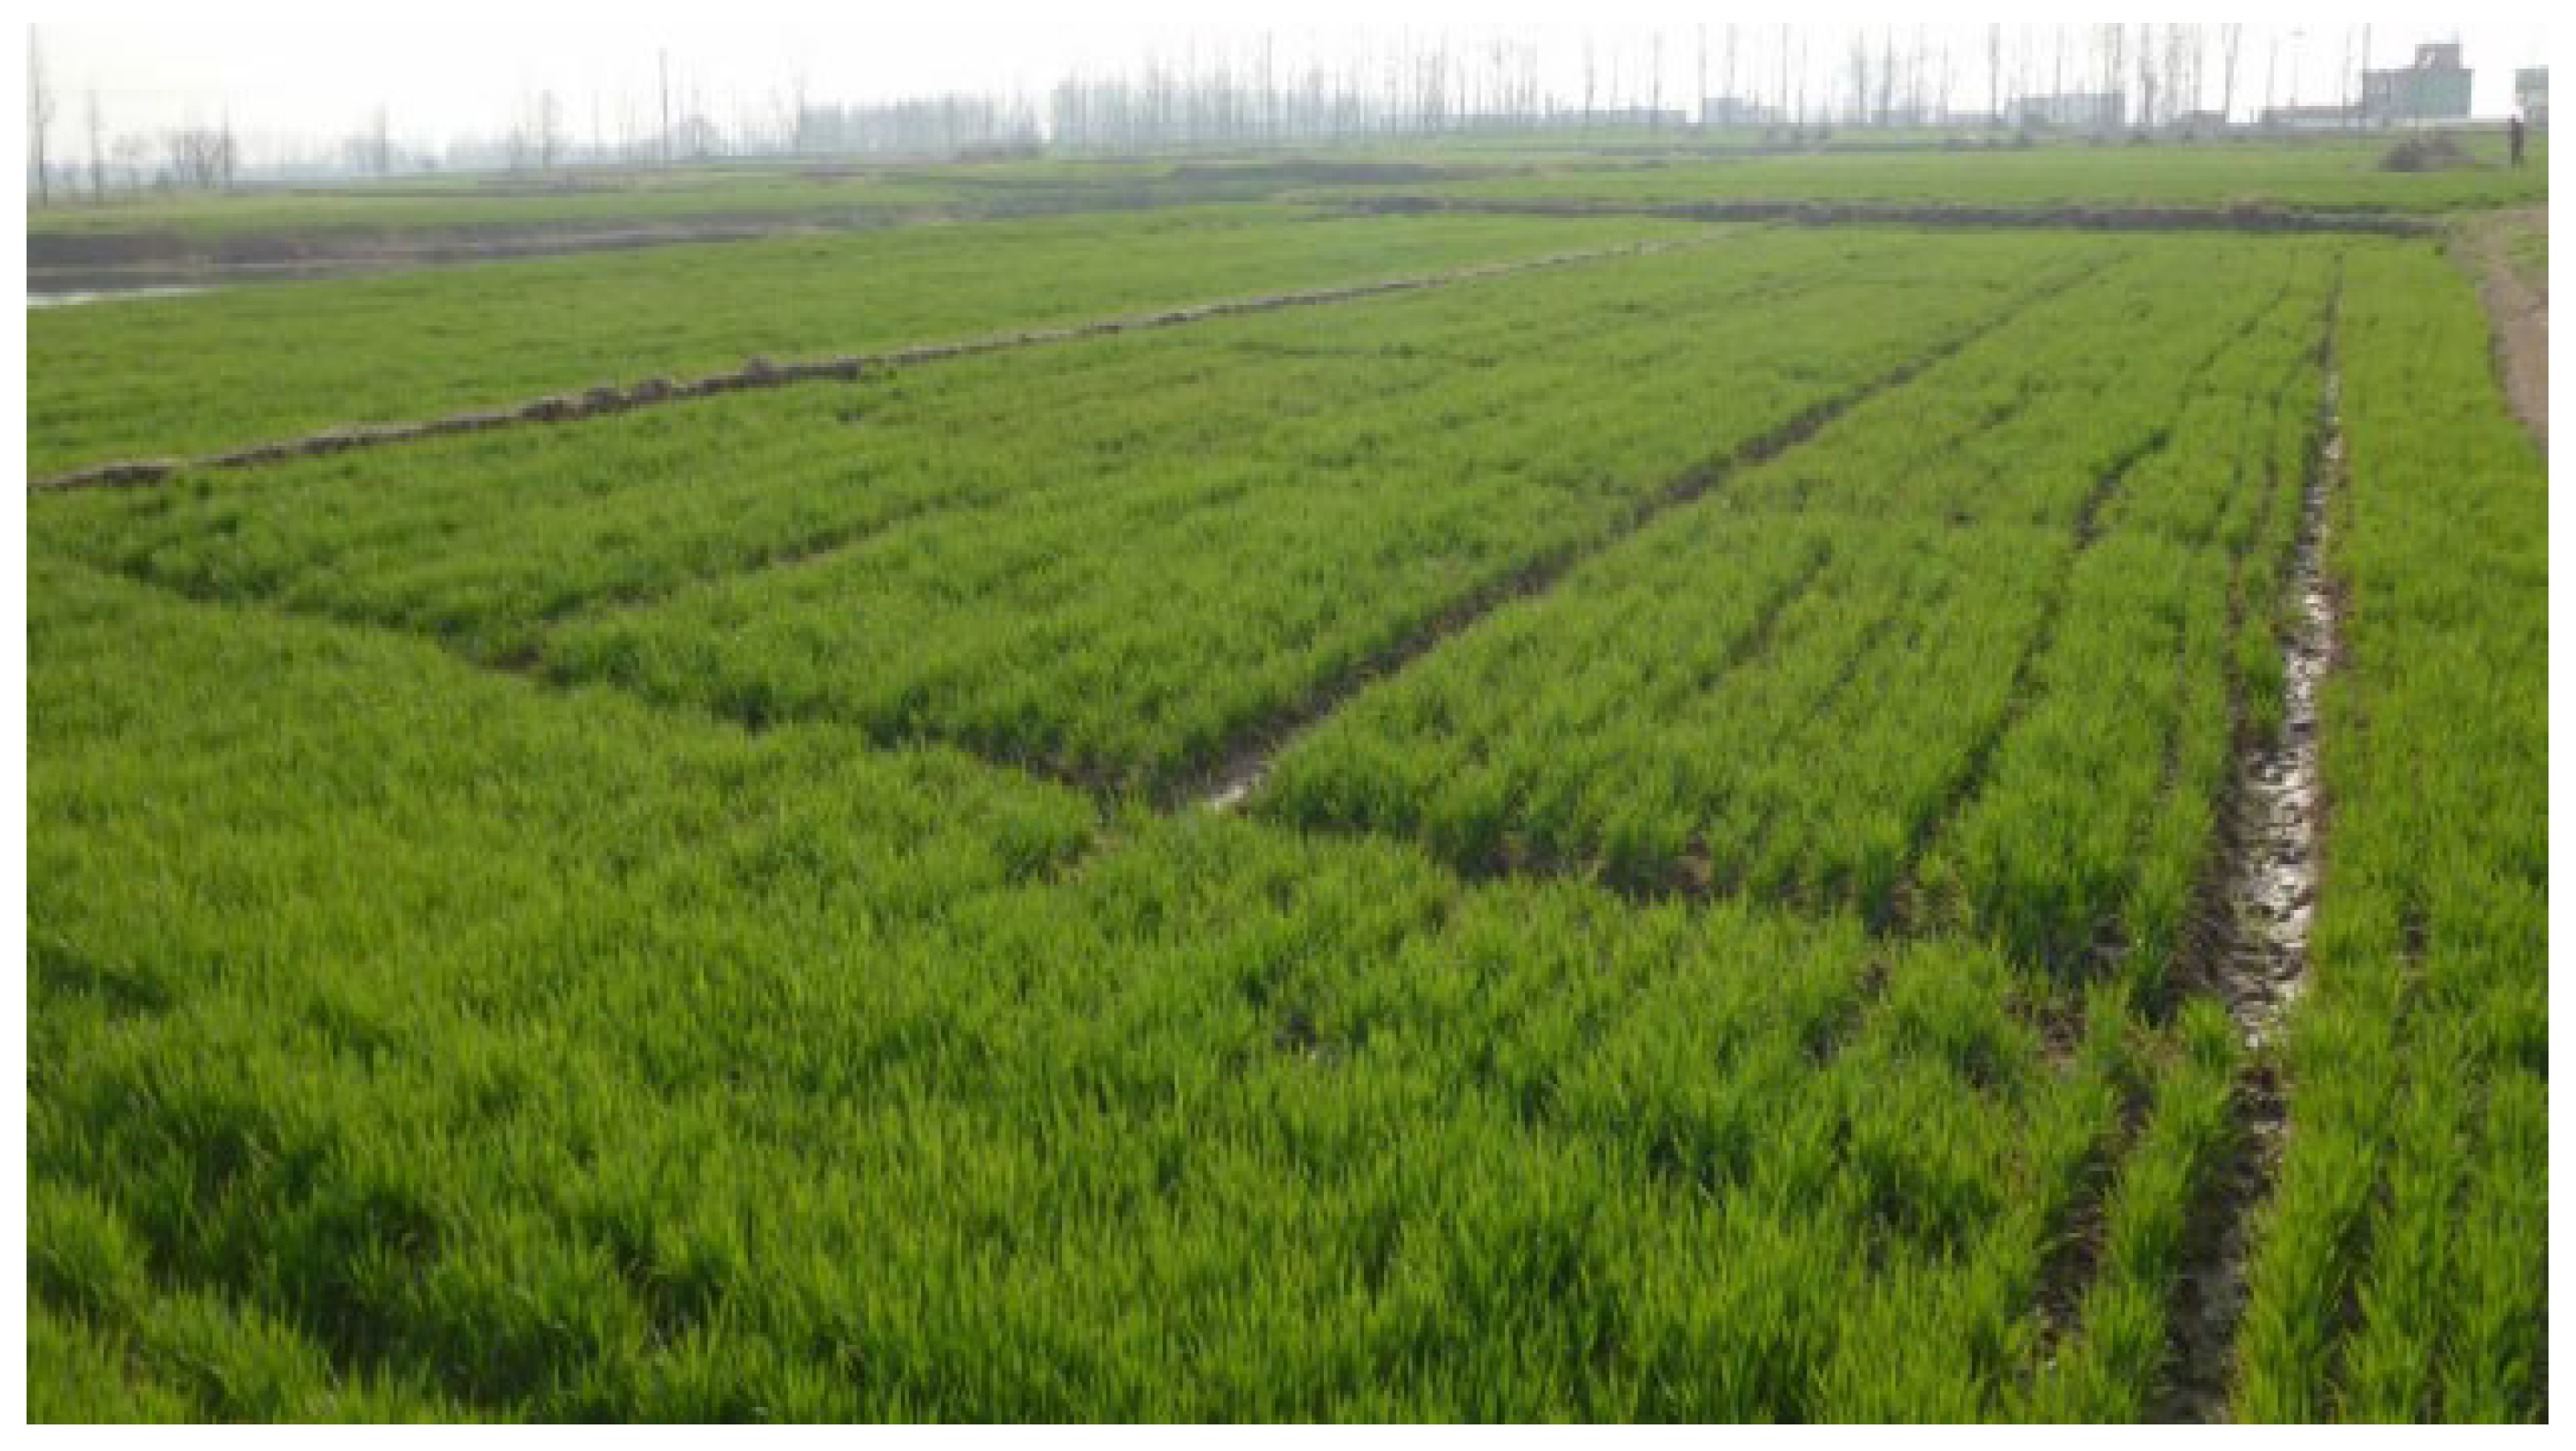
- Farmland improvement: Using the sediment of the Yellow River to improve farmland [10] can significantly enhance soil physical properties (Figure 1), reducing soil bulk density, increasing porosity, facilitating effective infiltration and precipitation storage, reducing surface runoff, and preventing water and soil loss.
2.2. Sediment Use in Construction Industry
- (1)
- Sand brickmaking. With China’s increasing attention to the ecological environment, sources of building materials that have an impact on the environment, such as mountain quarries, are limited, and Yellow River sediment brickmaking and flood control stone materials have progressively aroused the attention of society. Boxing County [14] of Shandong province has successfully trail-produced new wall materials with Yellow River sludge as a raw material over the past five years. The products comprise hollow bricks, perforated bricks, decorative bricks, and others, which are characterized by their high strength, thermal insulation, energy savings, and no radioactivity. The project has been covered in the first batch of key projects of the “double high and one excellent” guiding plan by the state.
- (2)
- Sand ceramsite: Yellow River sediment can be excavated, naturally dried, pelletized, preheated, roasted, and cooled into ceramsite. As a result, sediment resource utilization has been achieved. Using the sediment of the Yellow River to replace clay to make pottery [15] reduces the use of clay, ceramsite, and other filler materials, protecting clay and other resources.
2.3. Preparation of Concrete from Yellow River Sand
3. Materials and Methods
3.1. Sediment-Based Embankment Building
3.1.1. Feasibility Study
3.1.2. Embankment Scheme Planning
3.1.3. Embankment Cost
- (1)
- Sediment extraction cost: The total cost of sand excavation consists of sand dredger rental, power, labor, and oil. Dredger rental would cost from 80 million yuan to 120 million yuan, which is equivalent to the purchase price. The salary of the personnel over the total building period would be nearly 60–70 million yuan plus other expenses (e.g., electricity, oil, and ship loss). The sediment extraction cost would be about 200–300 million yuan.
- (2)
- Building of embankment and relocation cost: The cost of dump trucks and excavators would be about 160 million yuan. Oil, electricity, and other related expenses are expected to cost between 20–30 million yuan. The total transportation cost ranges from 200 to 300 million yuan. The cost of concrete would be approximately 80–90 million yuan. The labor cost and the excavator cost would reach nearly 130 million yuan. Compensation for resident relocation is based on a population of approximately 50 thousand people in the Sanmenxia Reservoir area, and the cost would range from 4 to 4.5 billion yuan.
3.1.4. Engineering Benefit
- (1)
- Dredging: Building sediment revetments significantly reduces the amount of sediment deposition in the reservoir area, enhances the water storage performance of the reservoir, and utilizes rather than wastes the cleared sediment.
- (2)
- Swan protection: Swans are second-class protected animals. Tens of thousands of white swans migrate from Siberia to Sanmenxia for winter every October. The construction of Swan Lake wetland community will provide tens of thousands of mu of habitat for swans.
- (3)
- After the water surface in the Sanmenxia Reservoir is raised, alkali pressing can be achieved, and farming conditions, soil fertility and quality, and crop yield can be improved, increasing agricultural income.
3.2. Ultra-High-Performance Concrete Made of Yellow River Sand
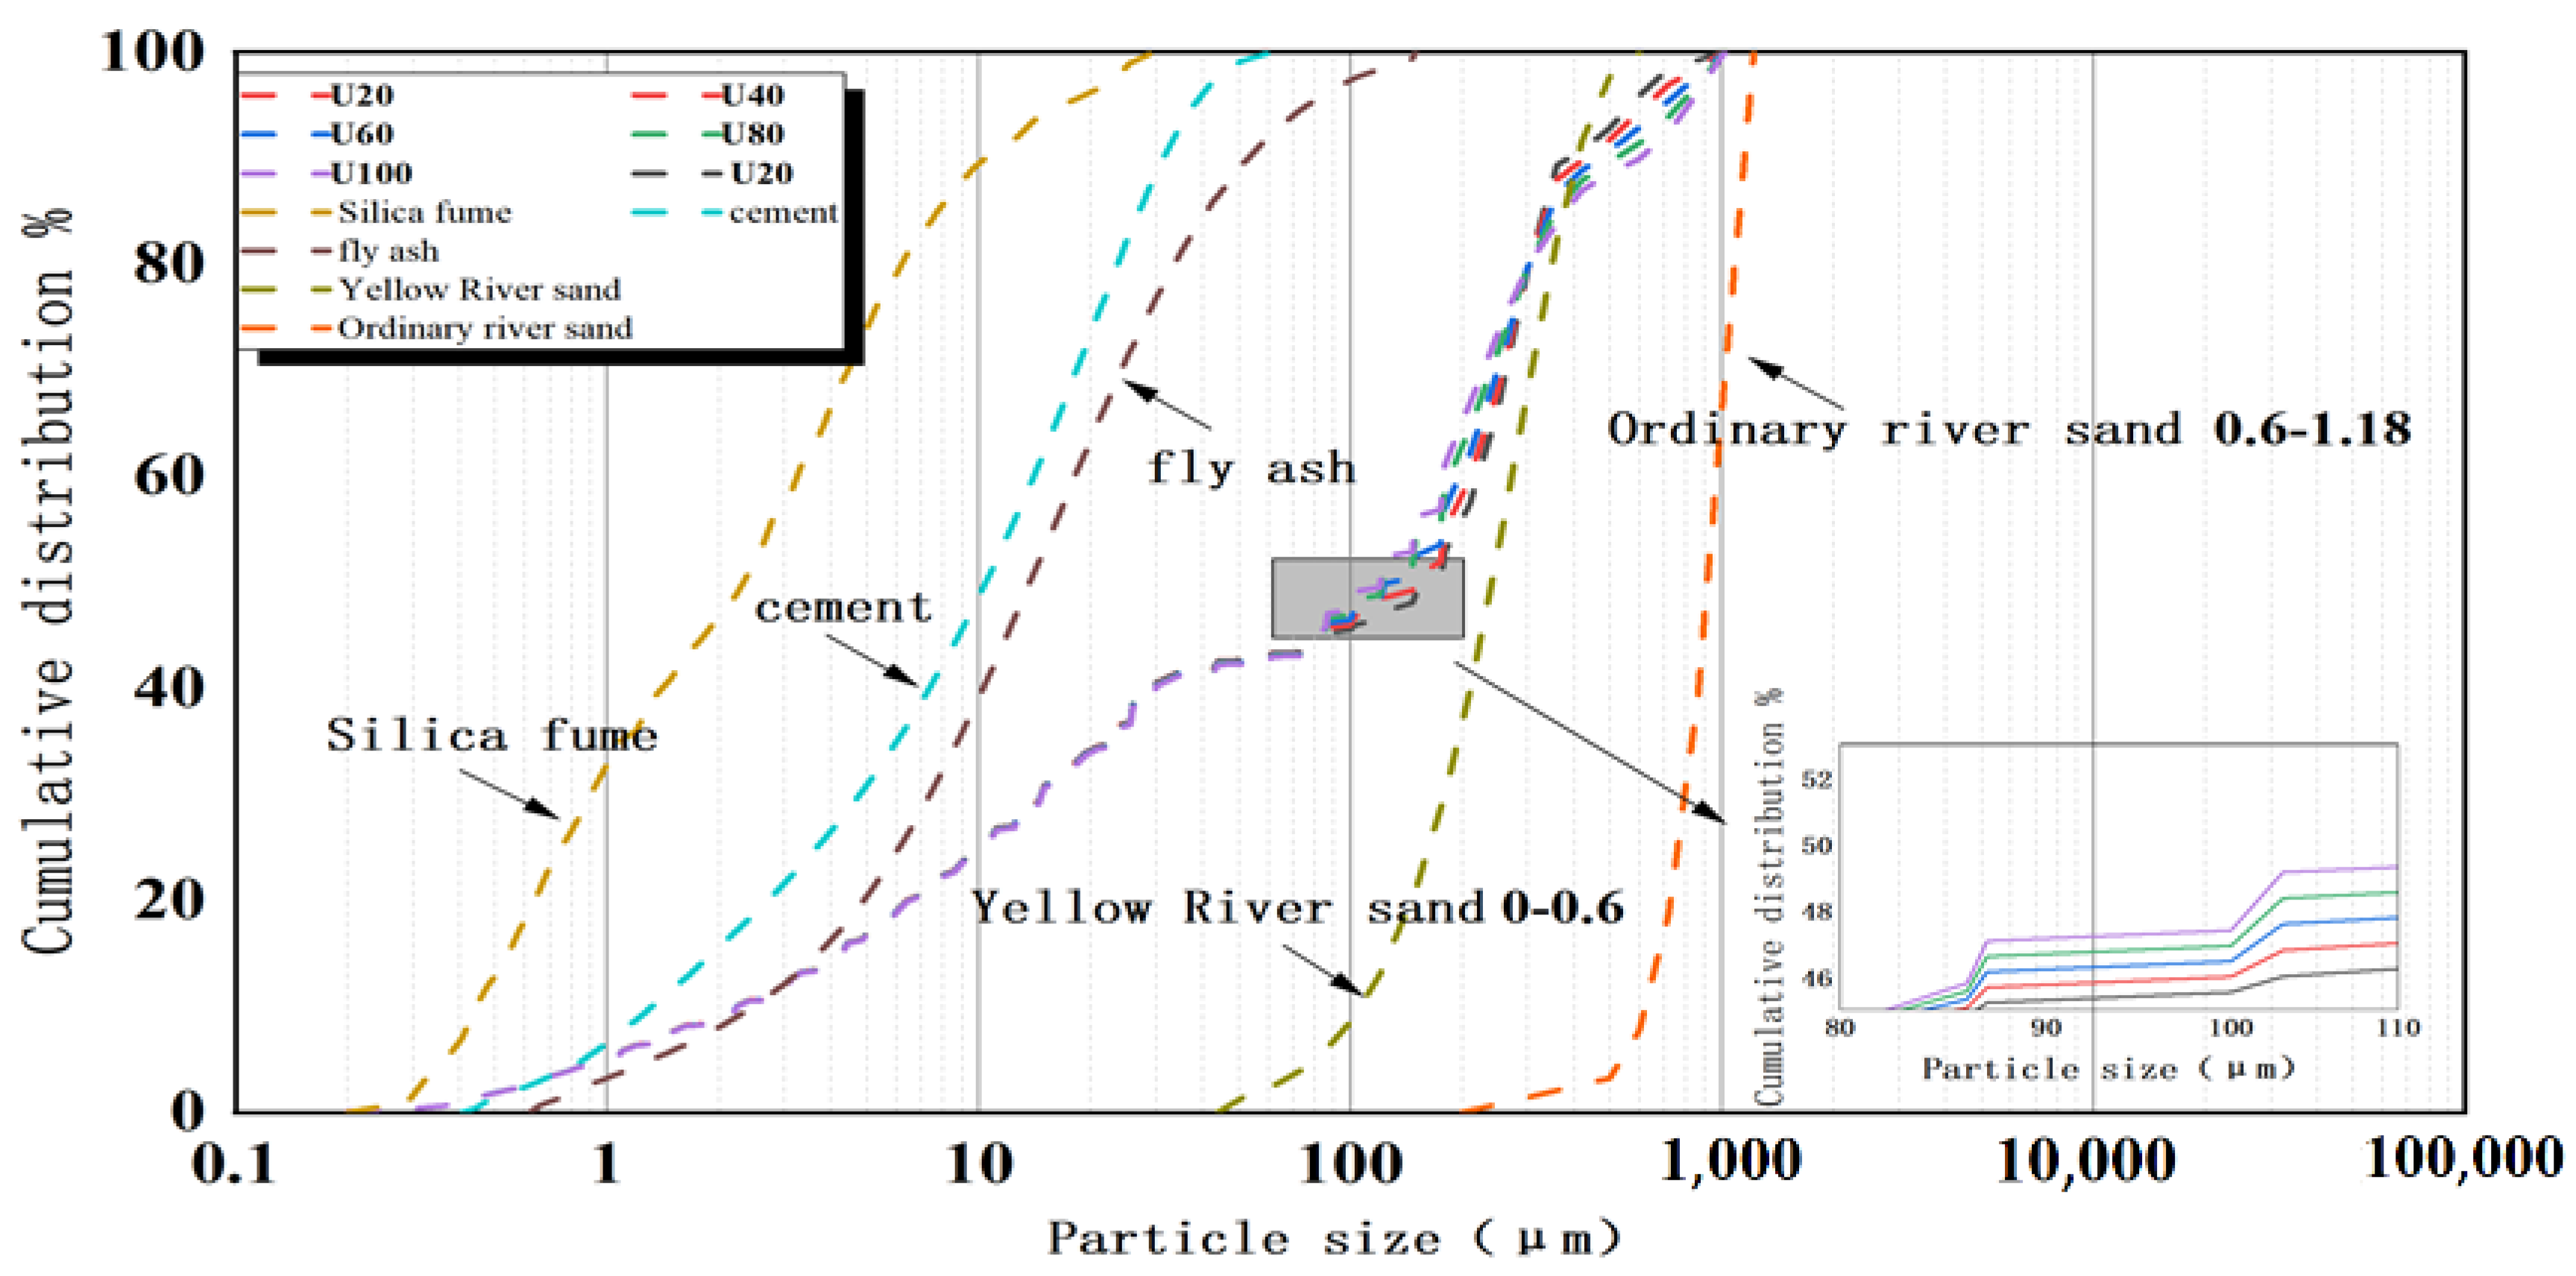
3.2.1. Raw Materials
3.2.2. Mix Proportion Design
Design Method
Mix Proportion
3.2.3. Concrete Preparation
3.2.4. Concrete Performance Test
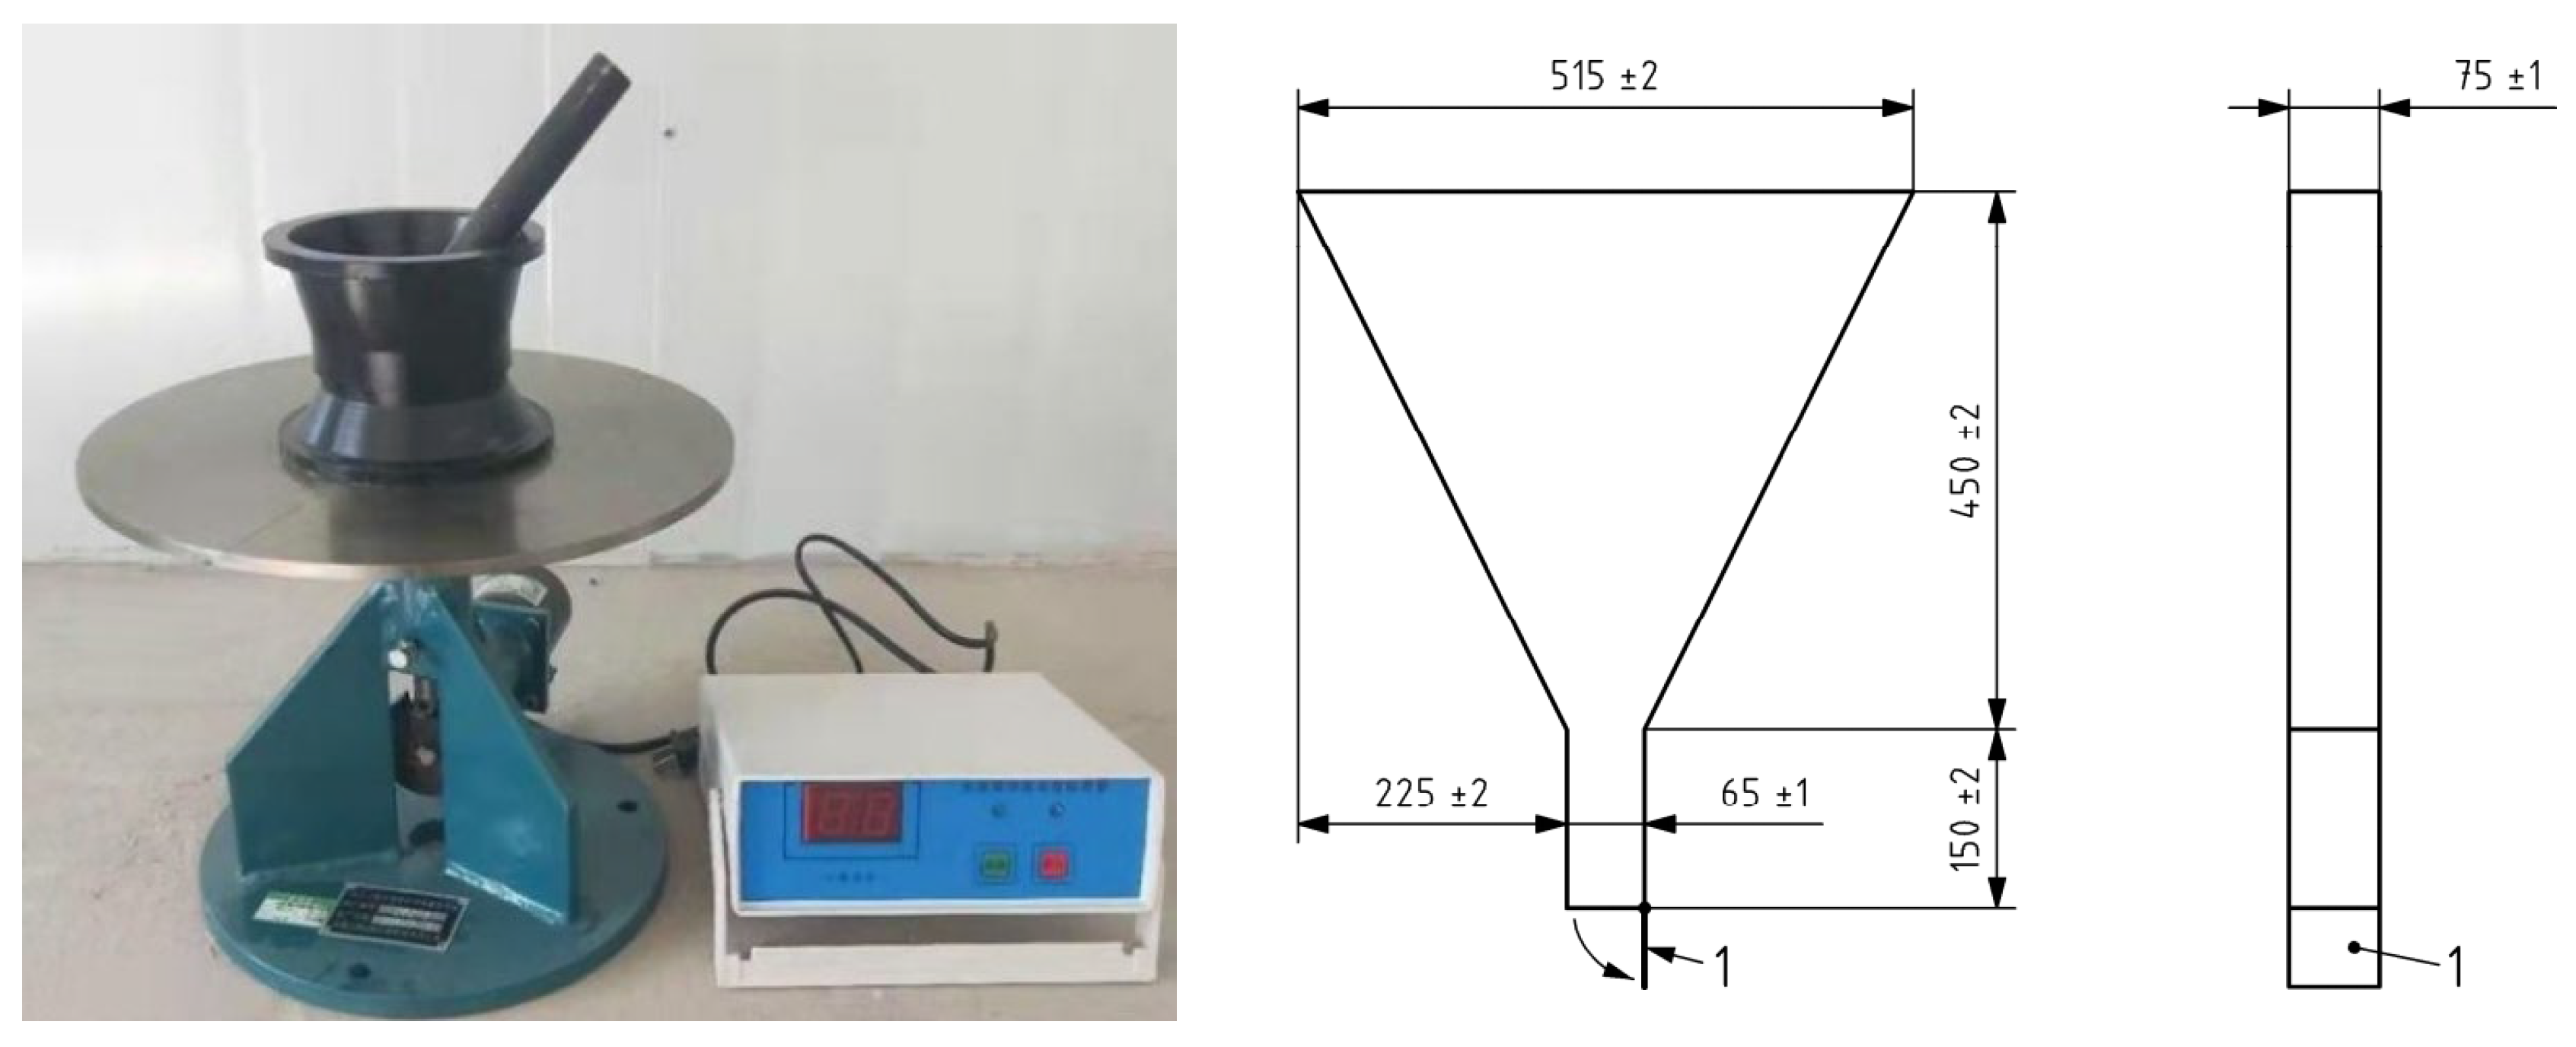
Fluidity
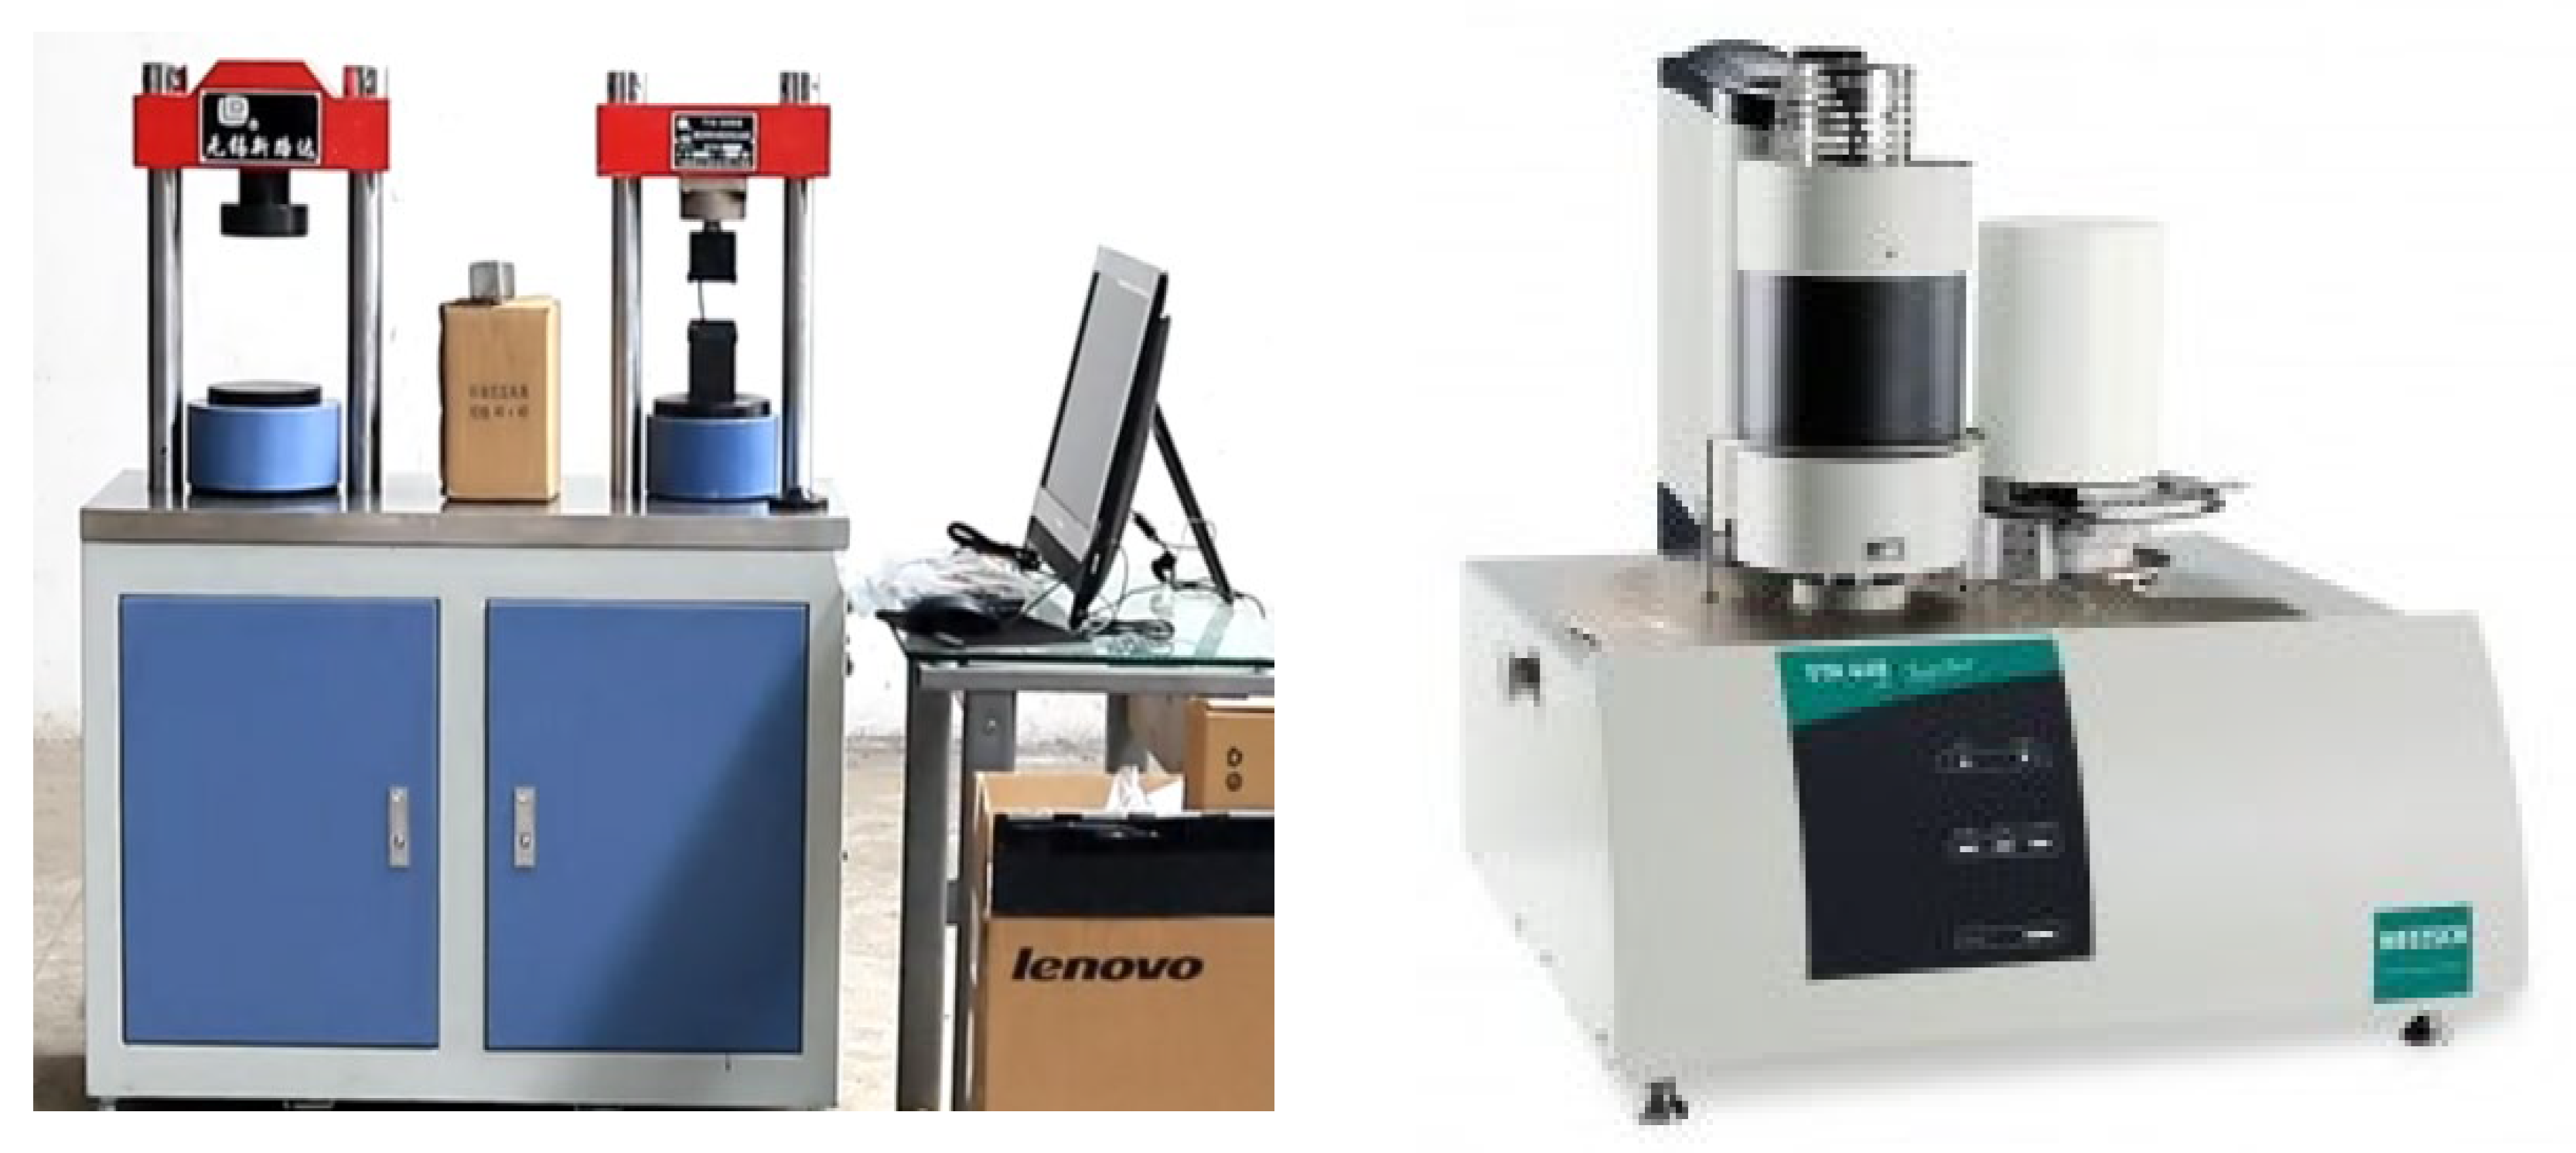
Mechanical Properties
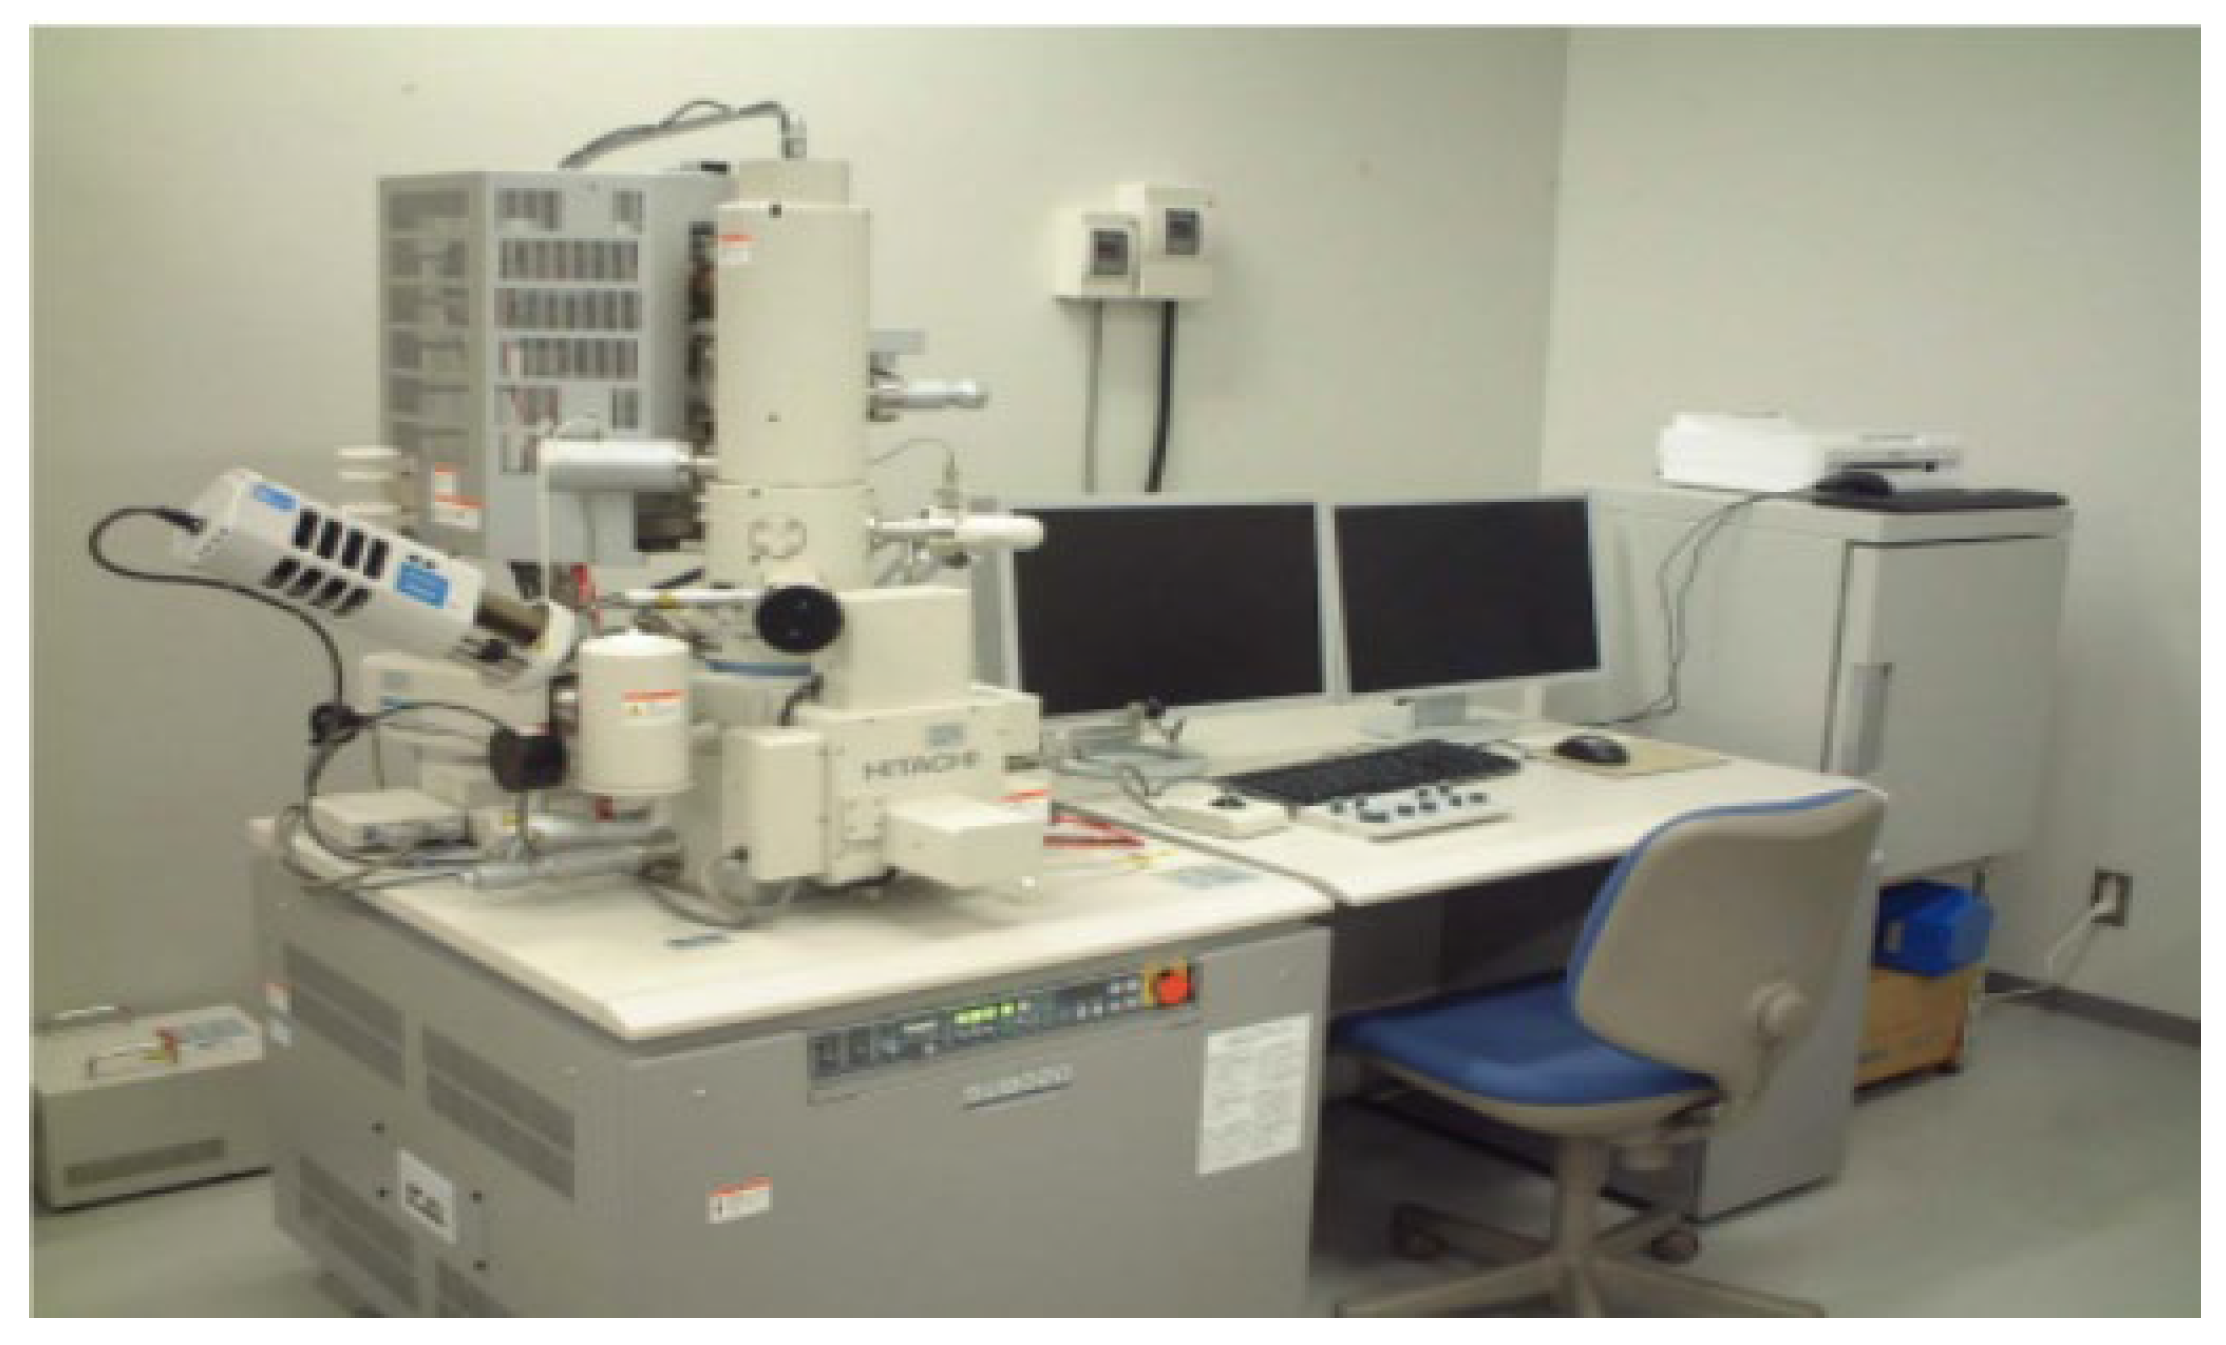
Microscopic Measurement of Interface Transition Zone and Pore Structure
Ecological Evaluation
Economic Analysis
4. Results and Discussion
4.1. Concrete Performance
4.1.1. Fluidity
4.1.2. Mechanical Tests
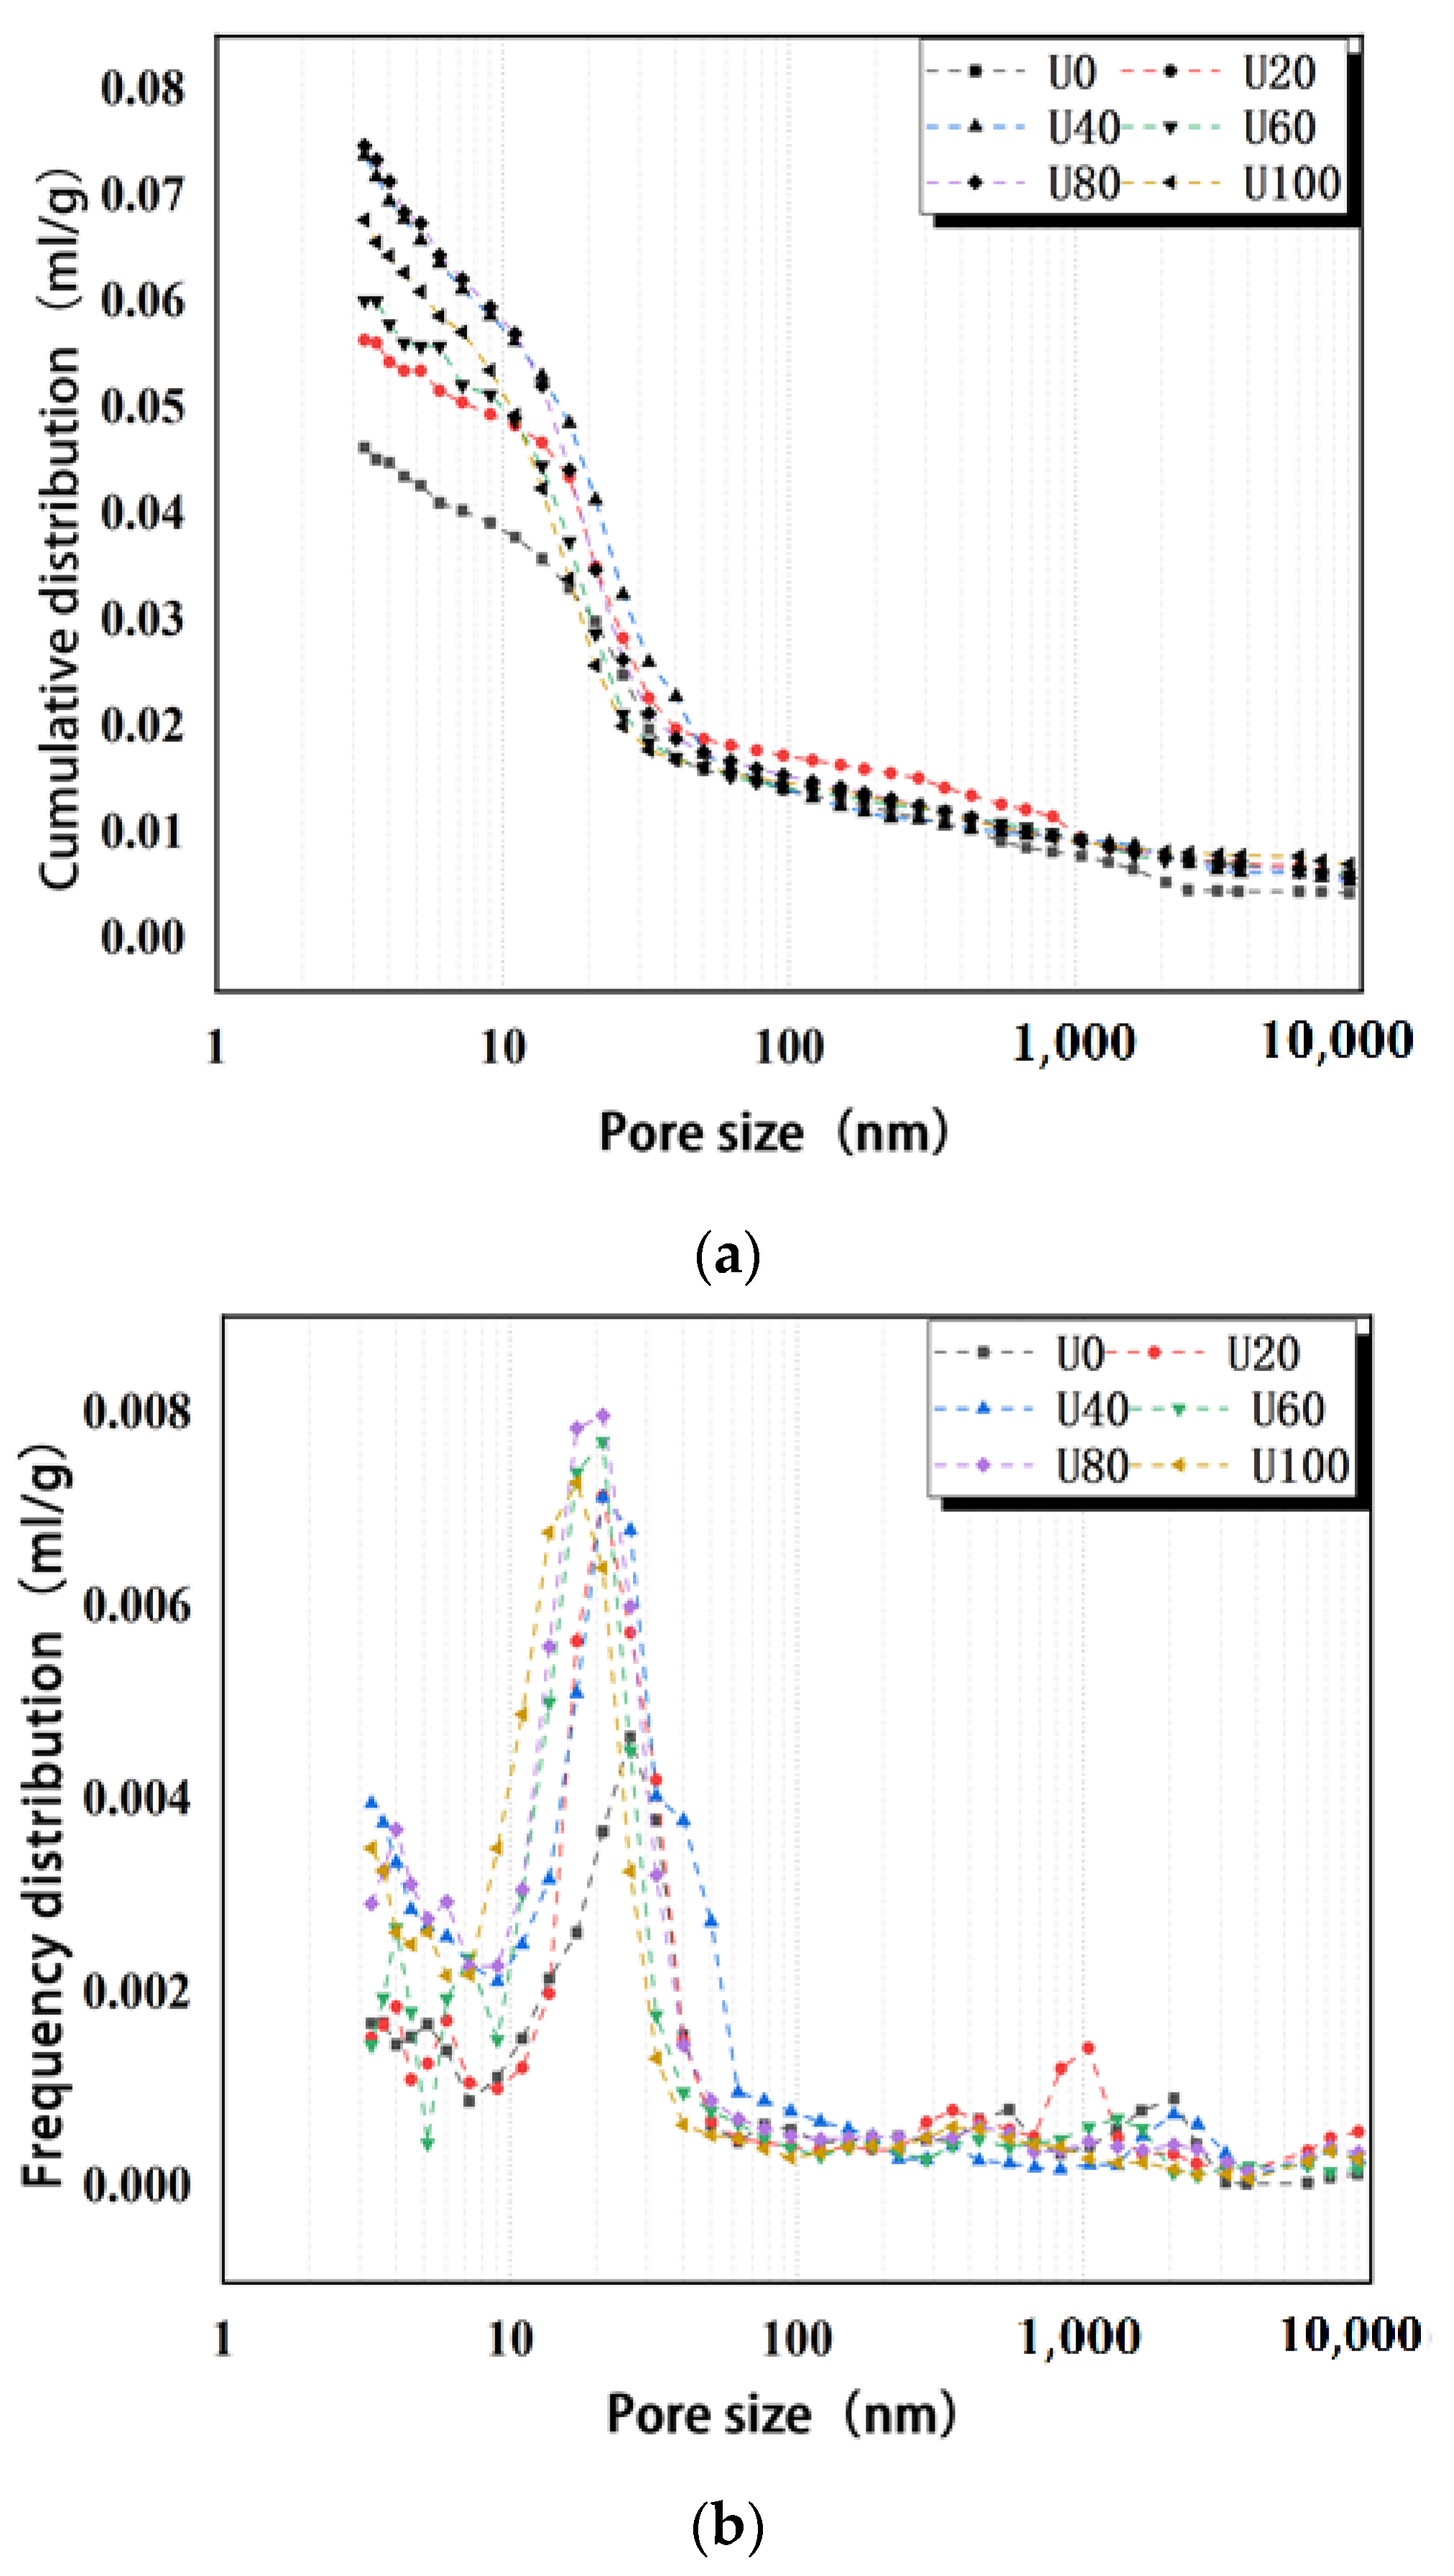
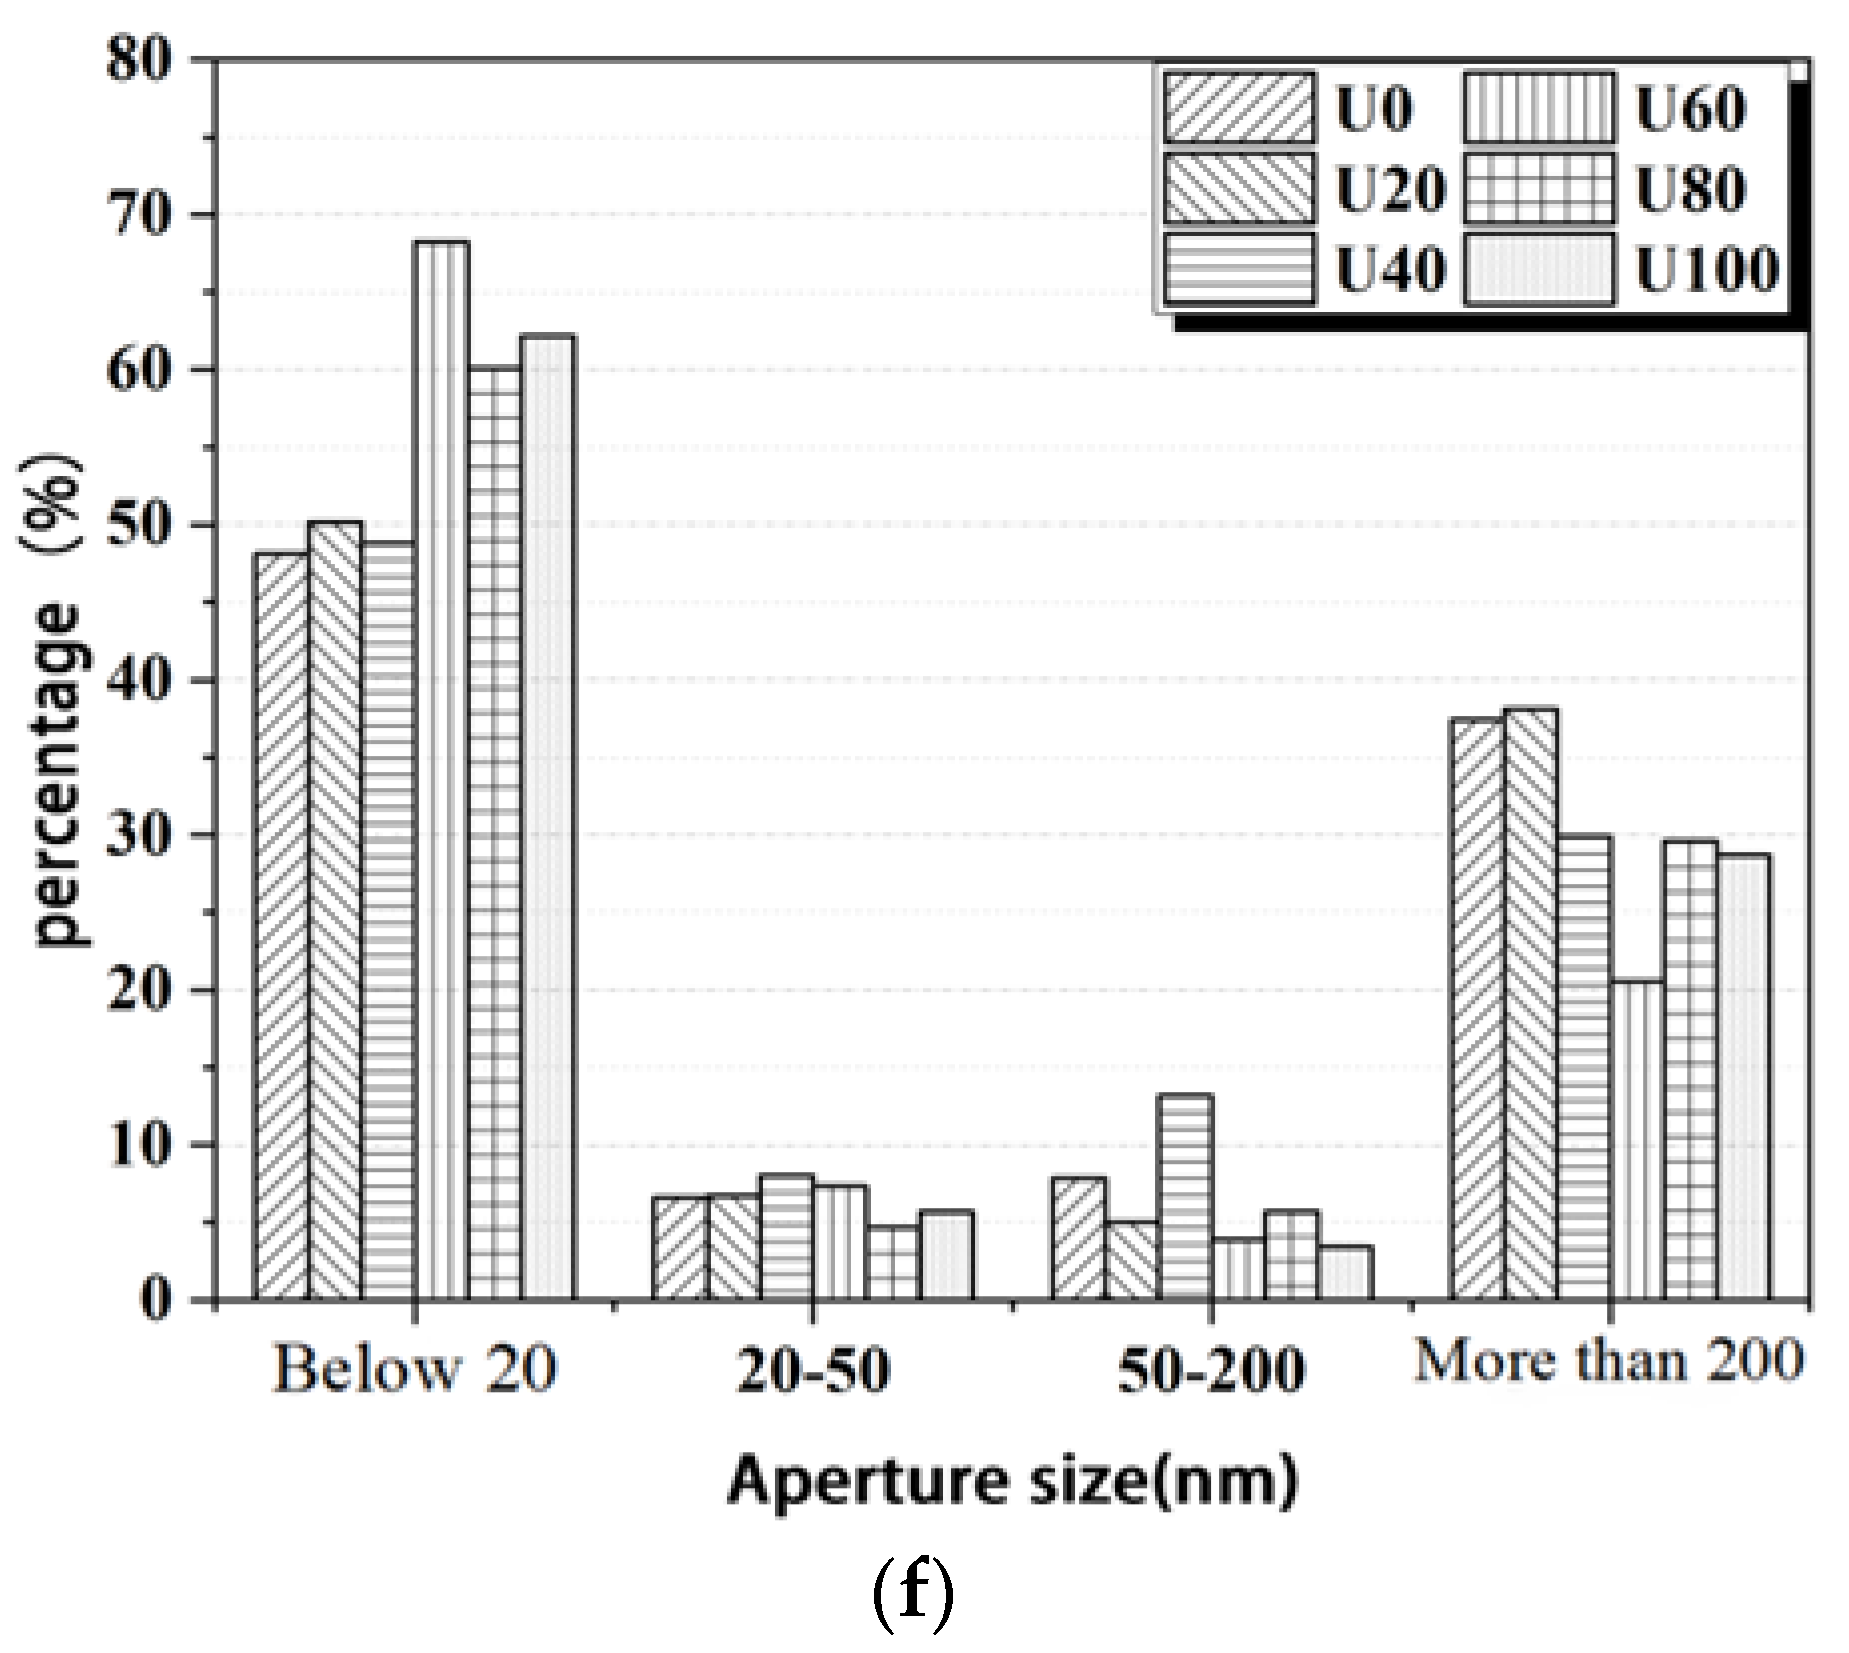
4.2. Pore Structure and Microscopic Measurement
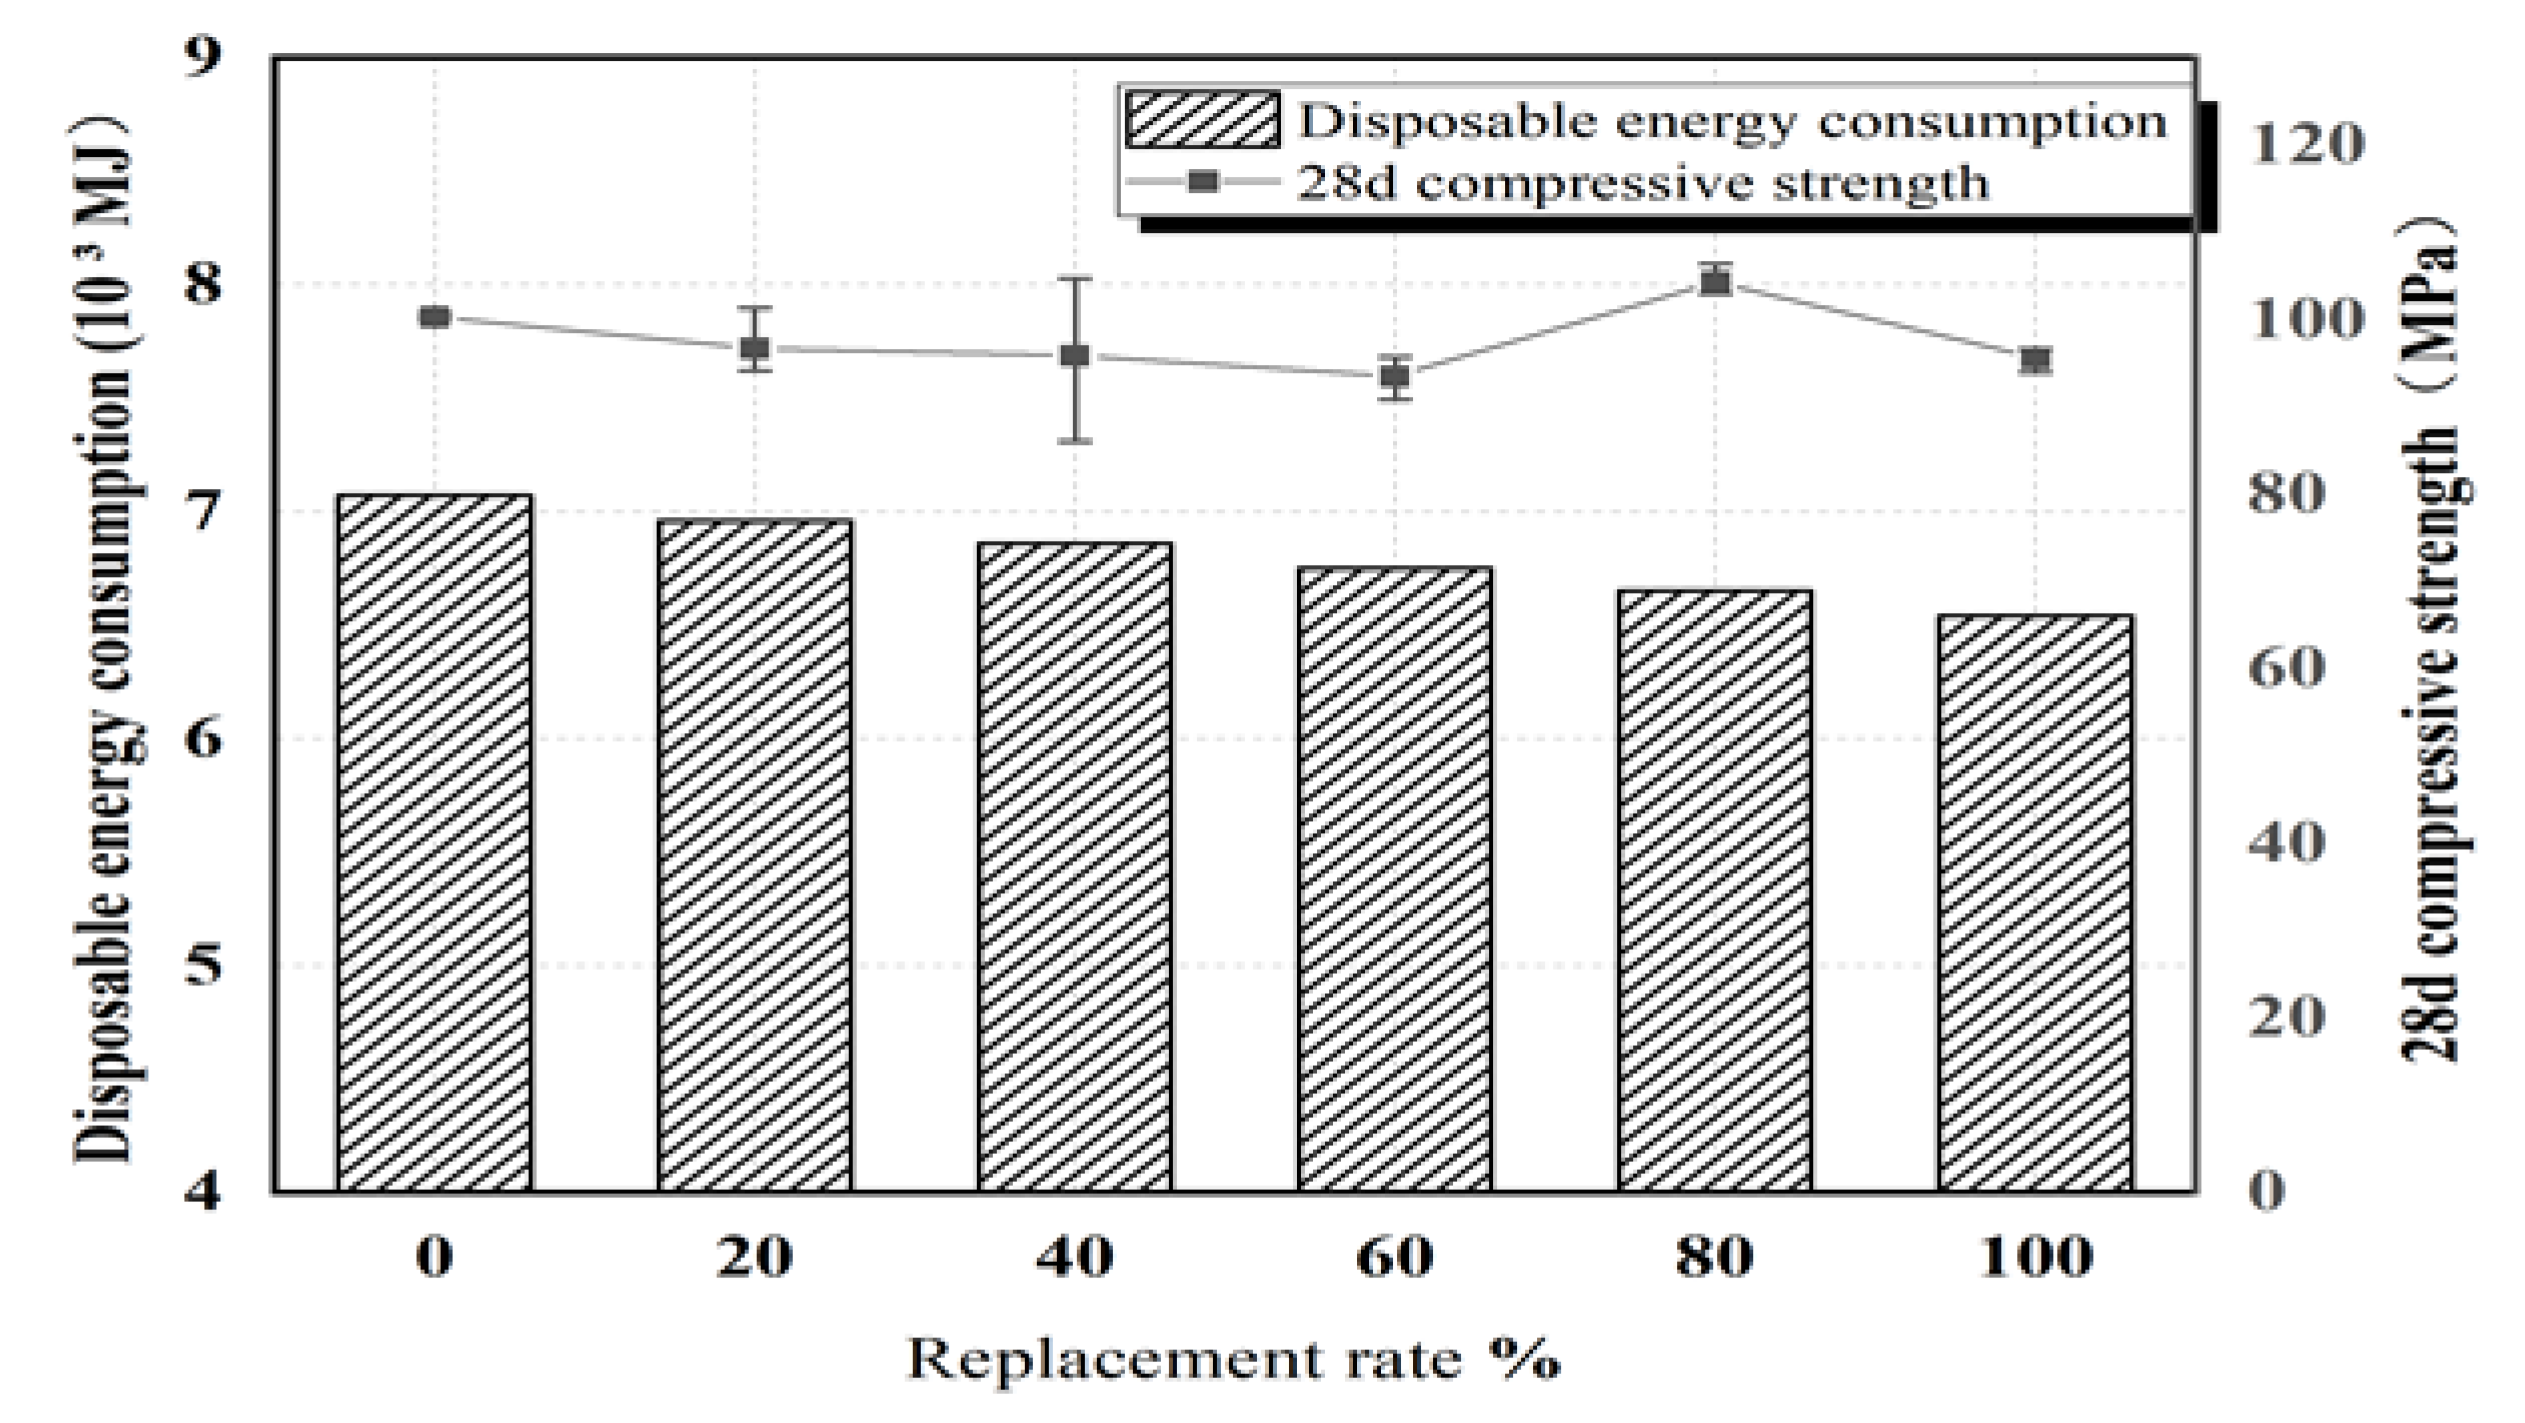
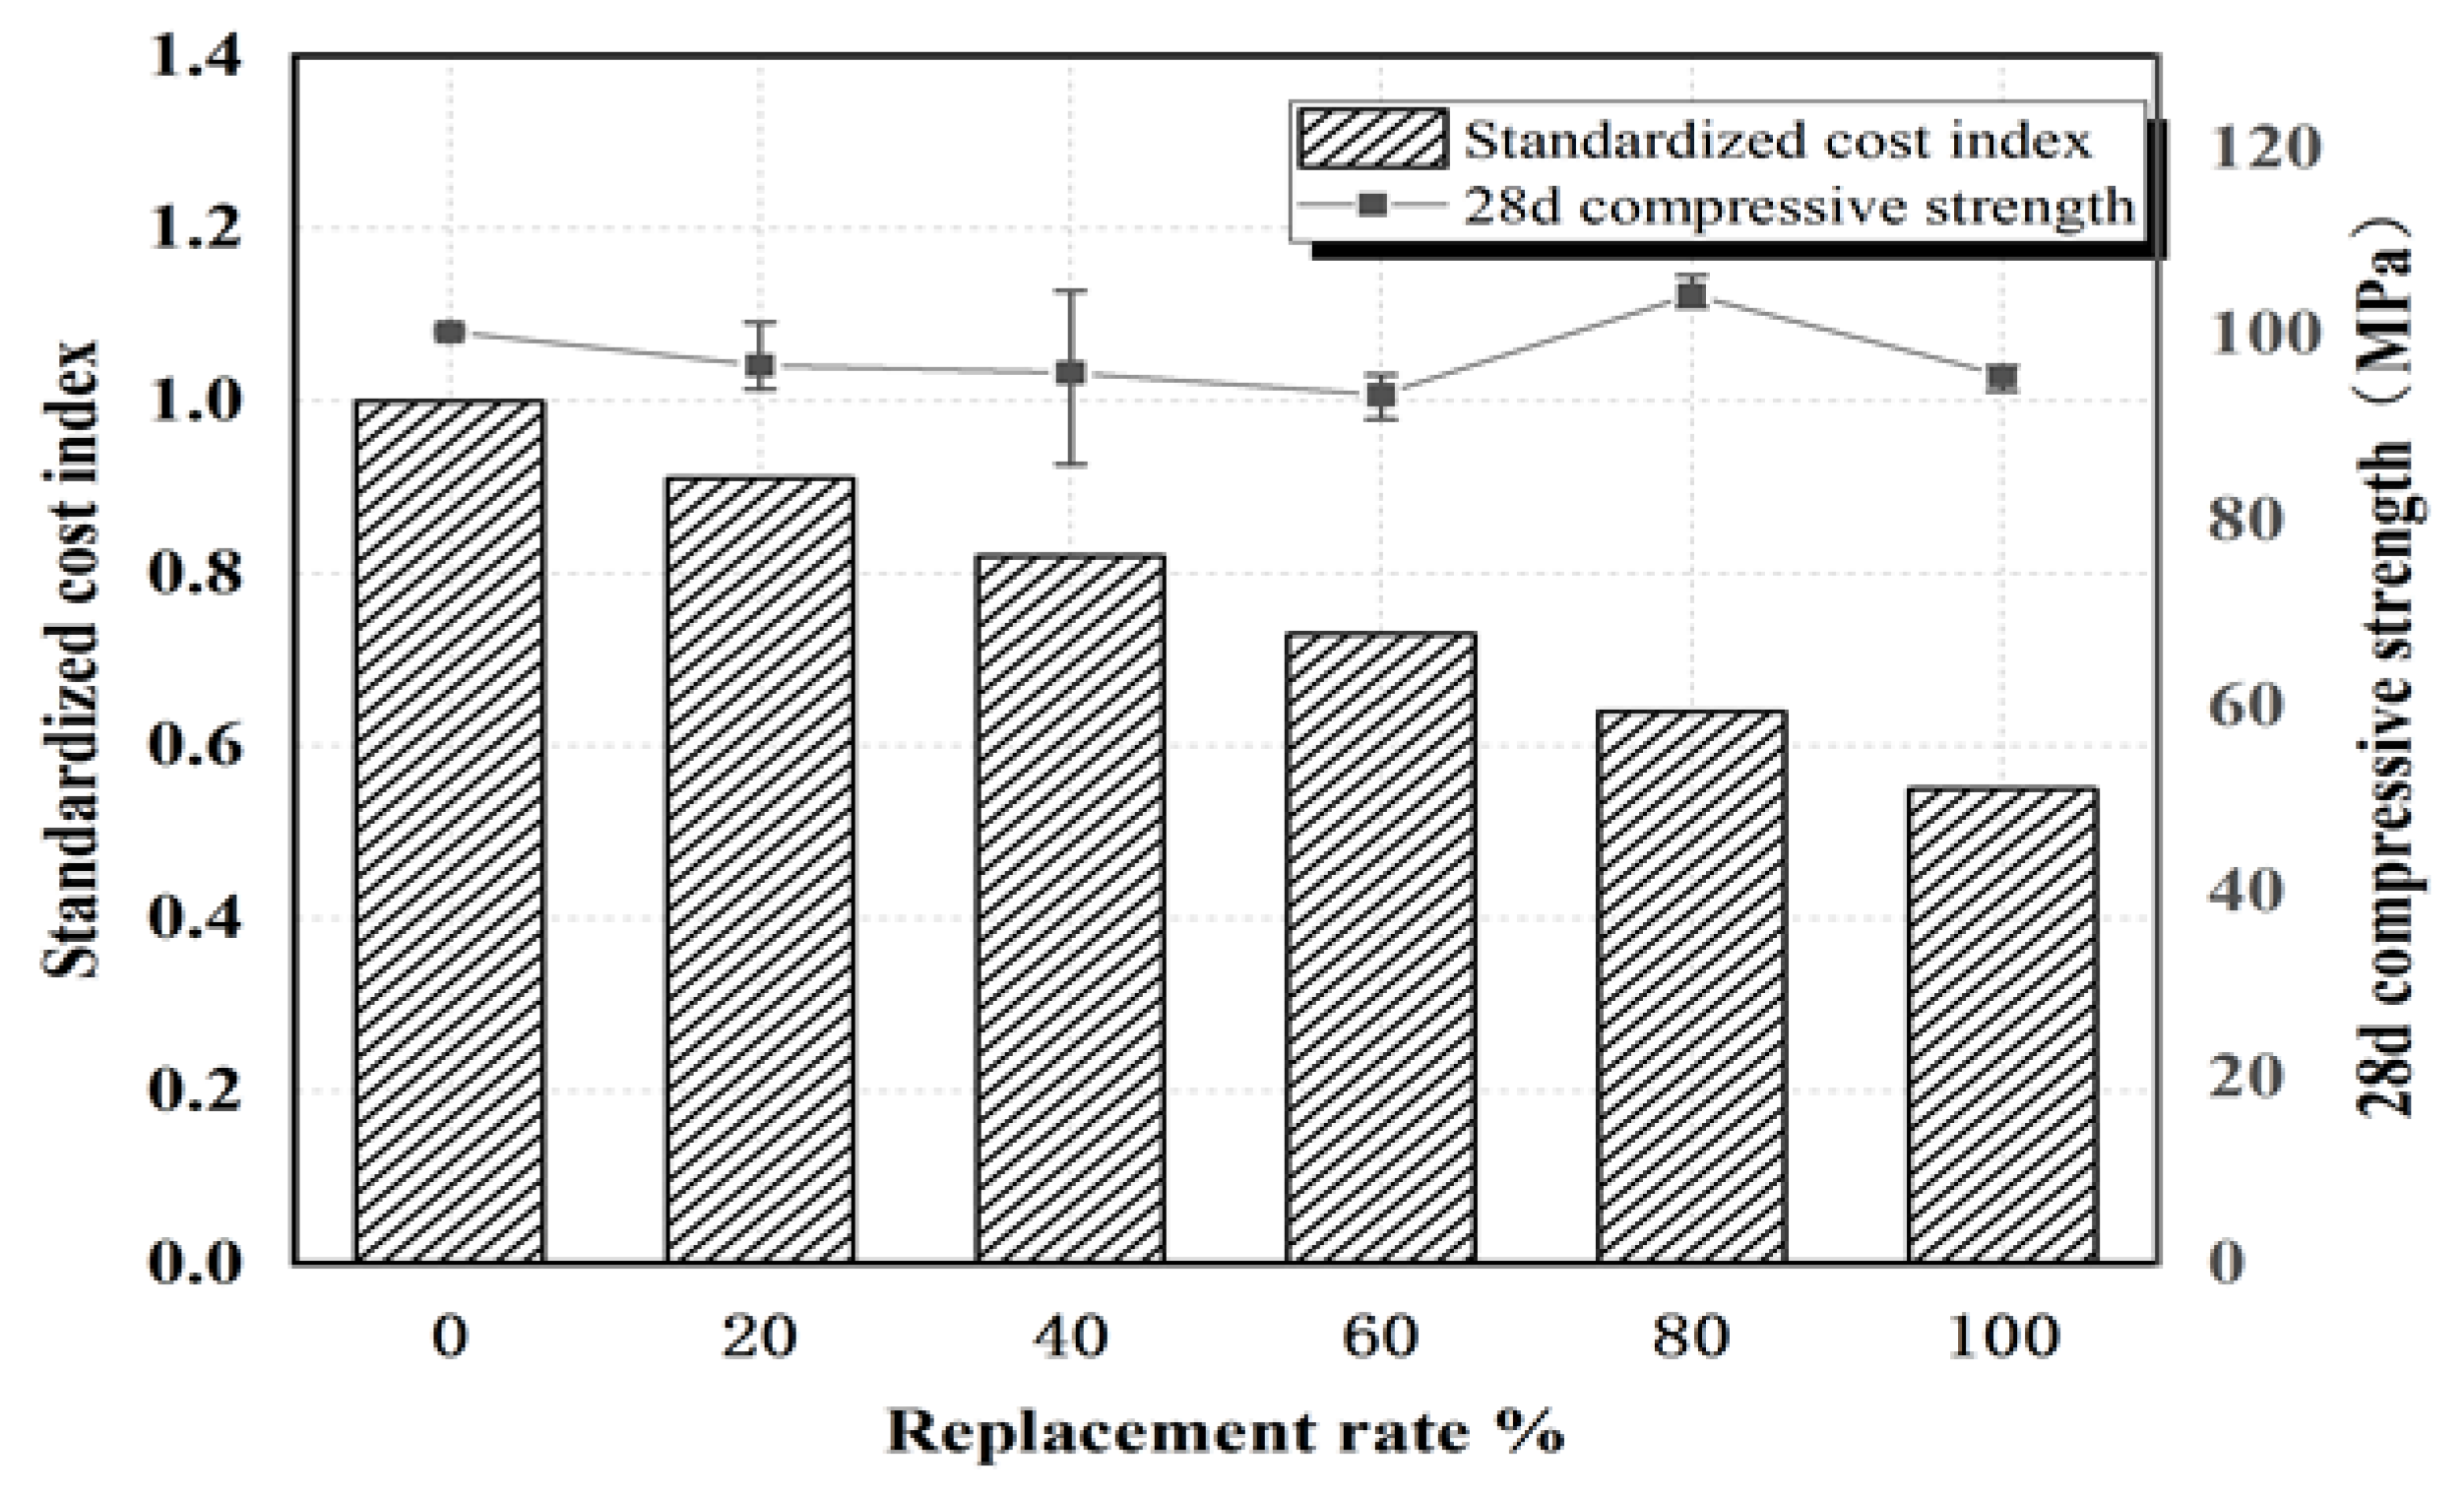
4.3. Ecological and Economic Evaluation
5. Conclusions
- (1)
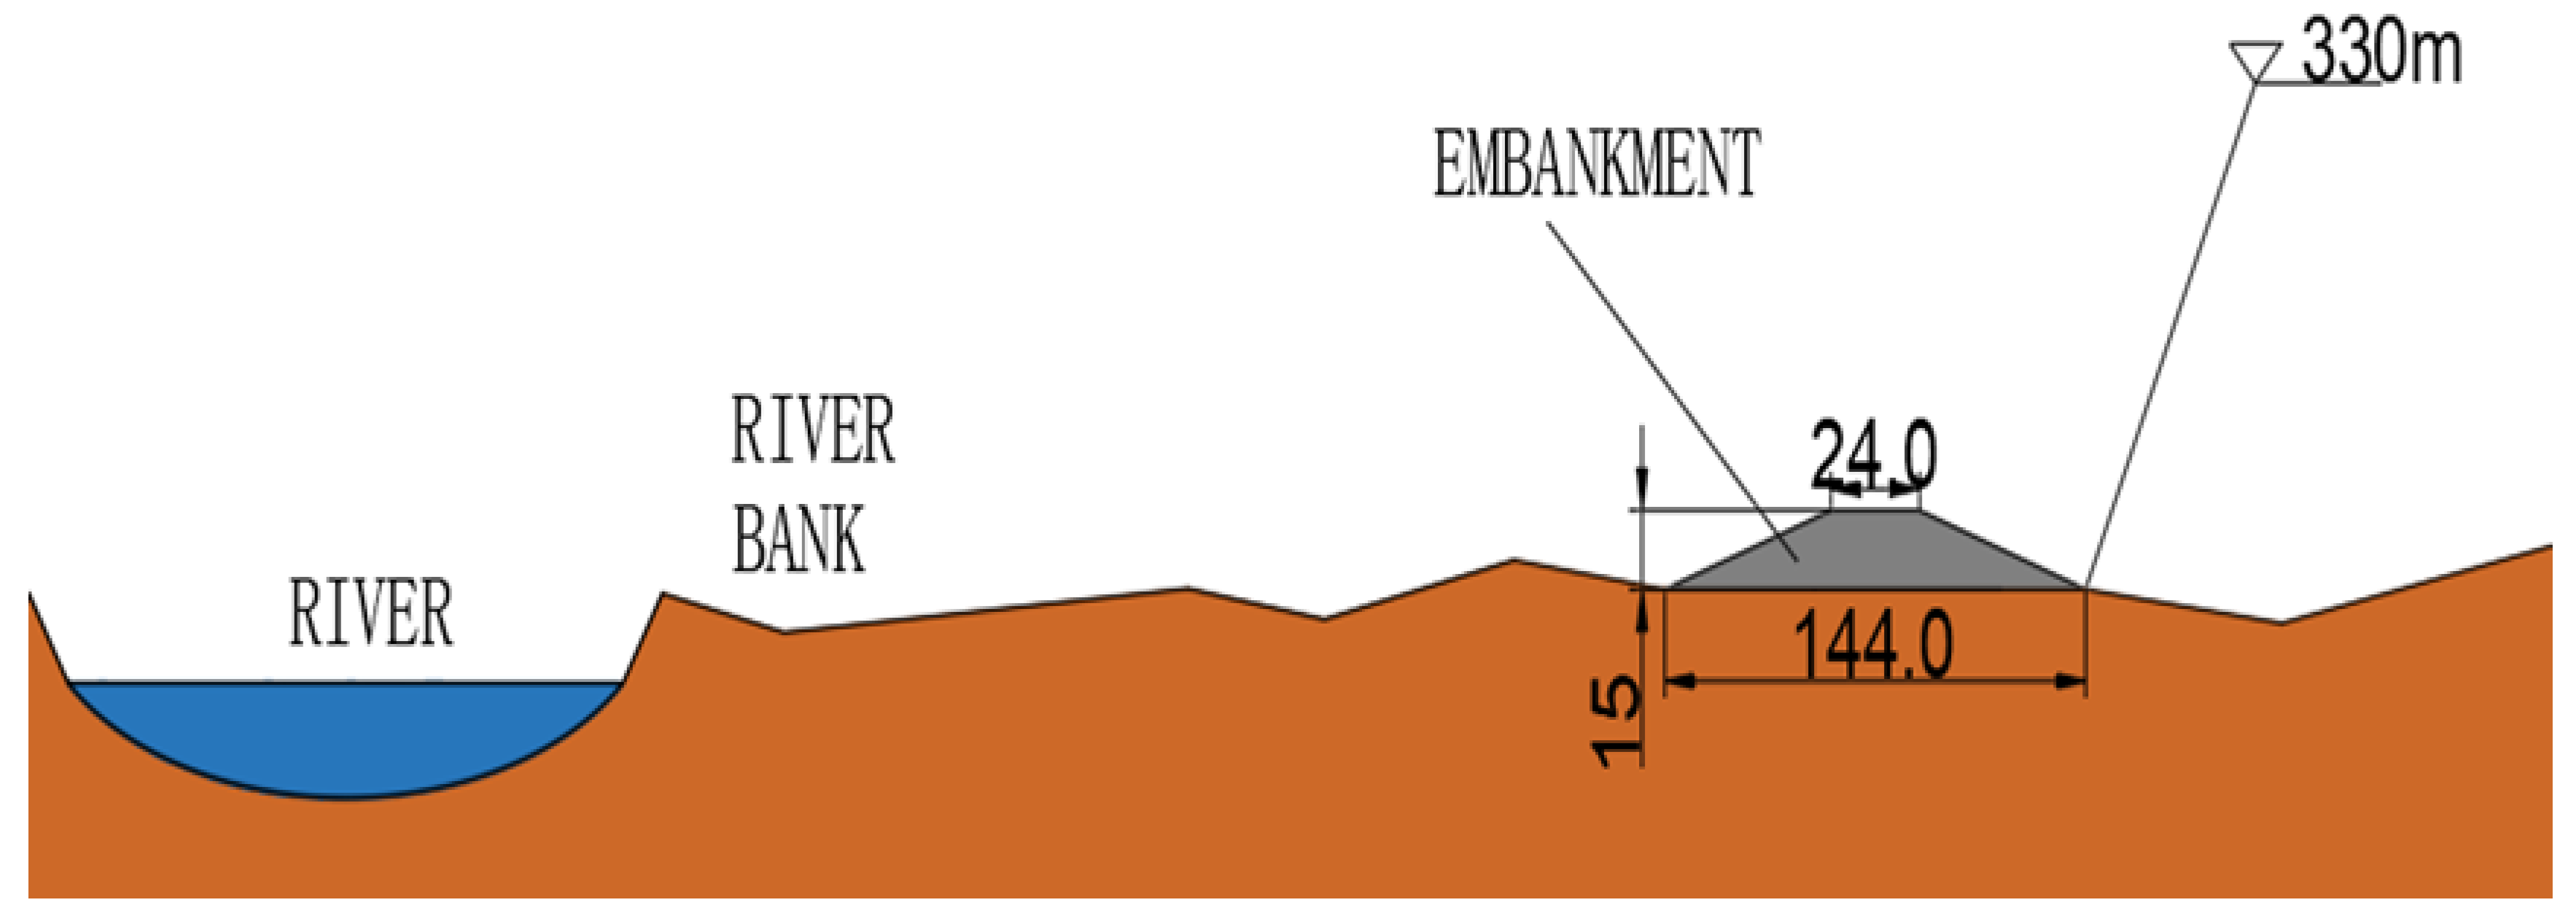
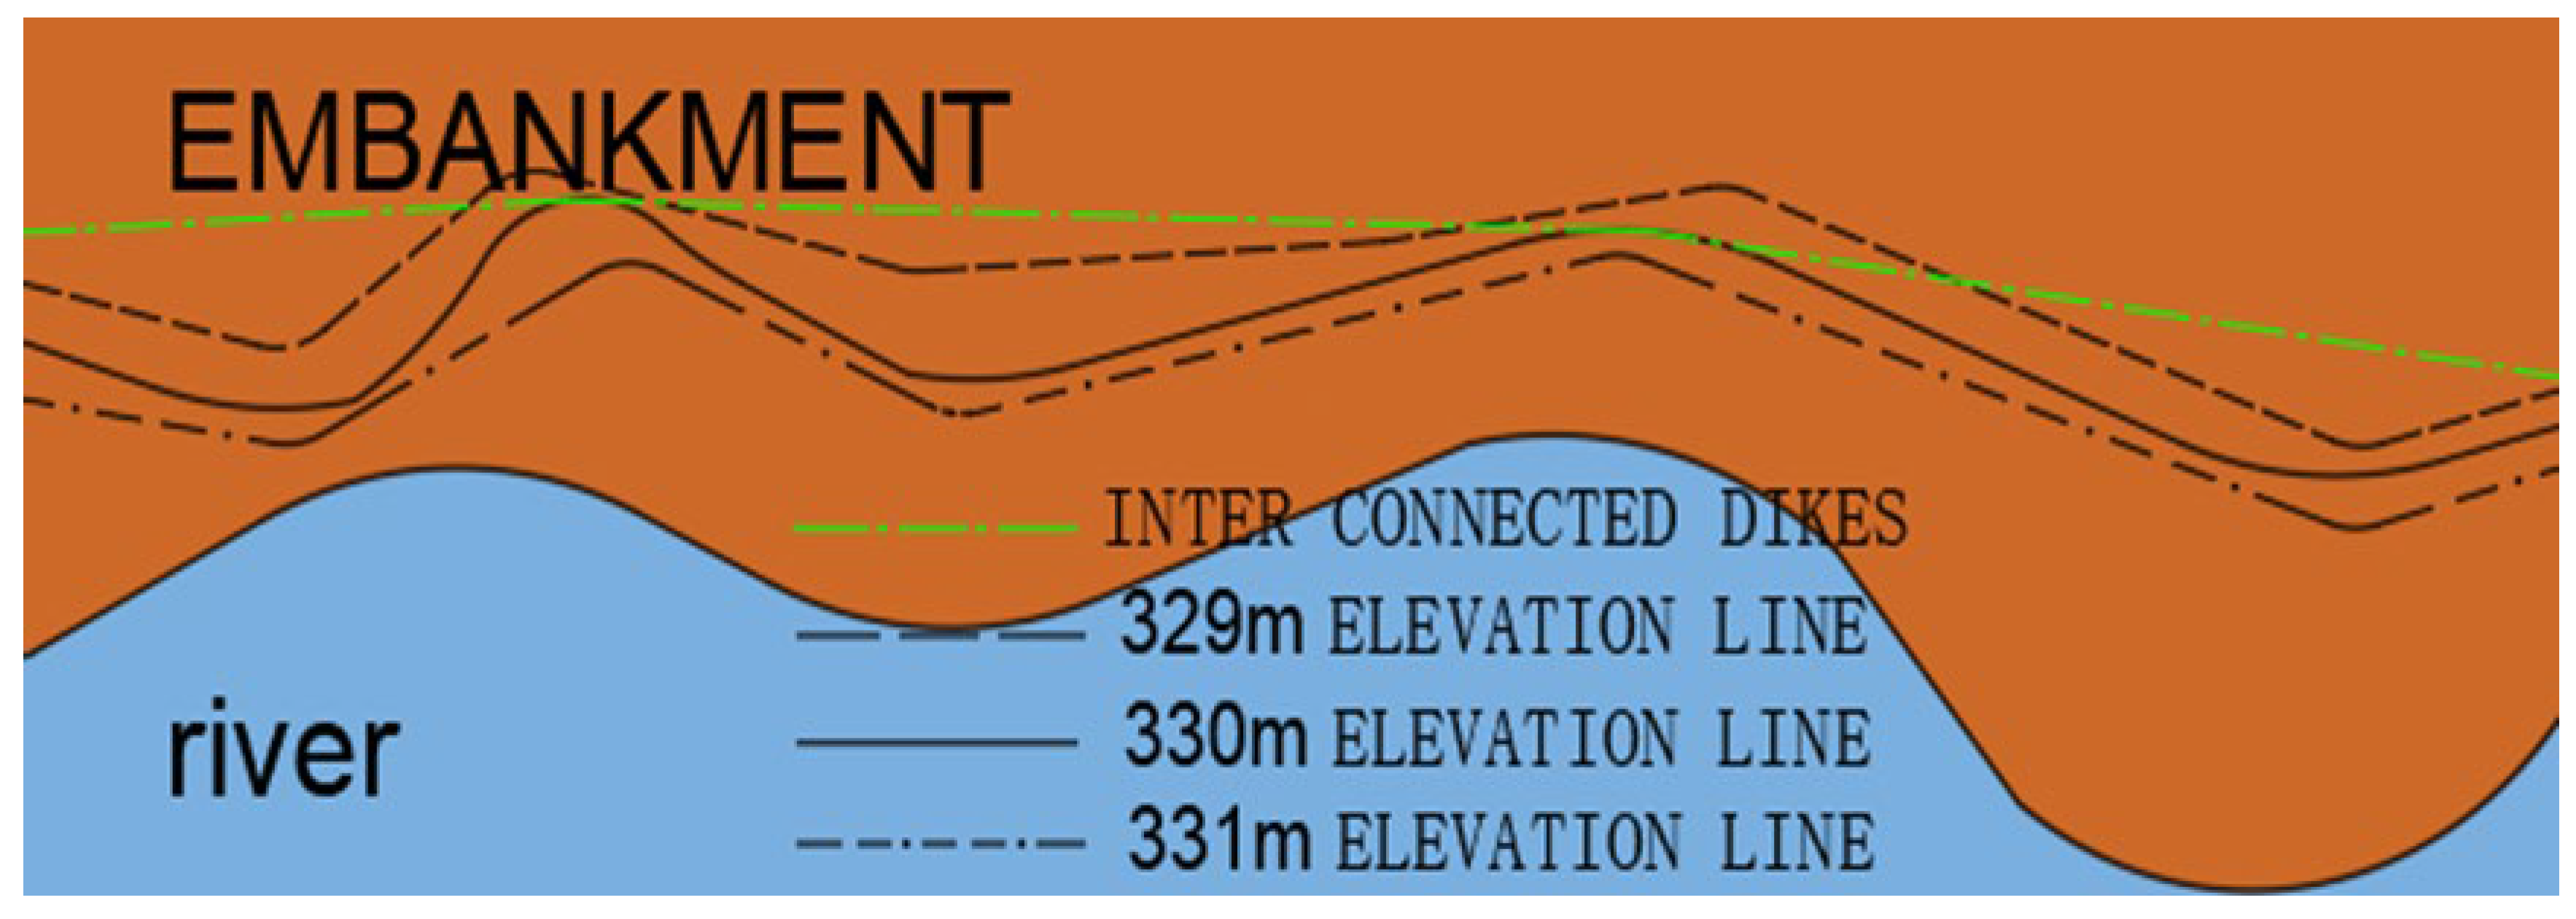
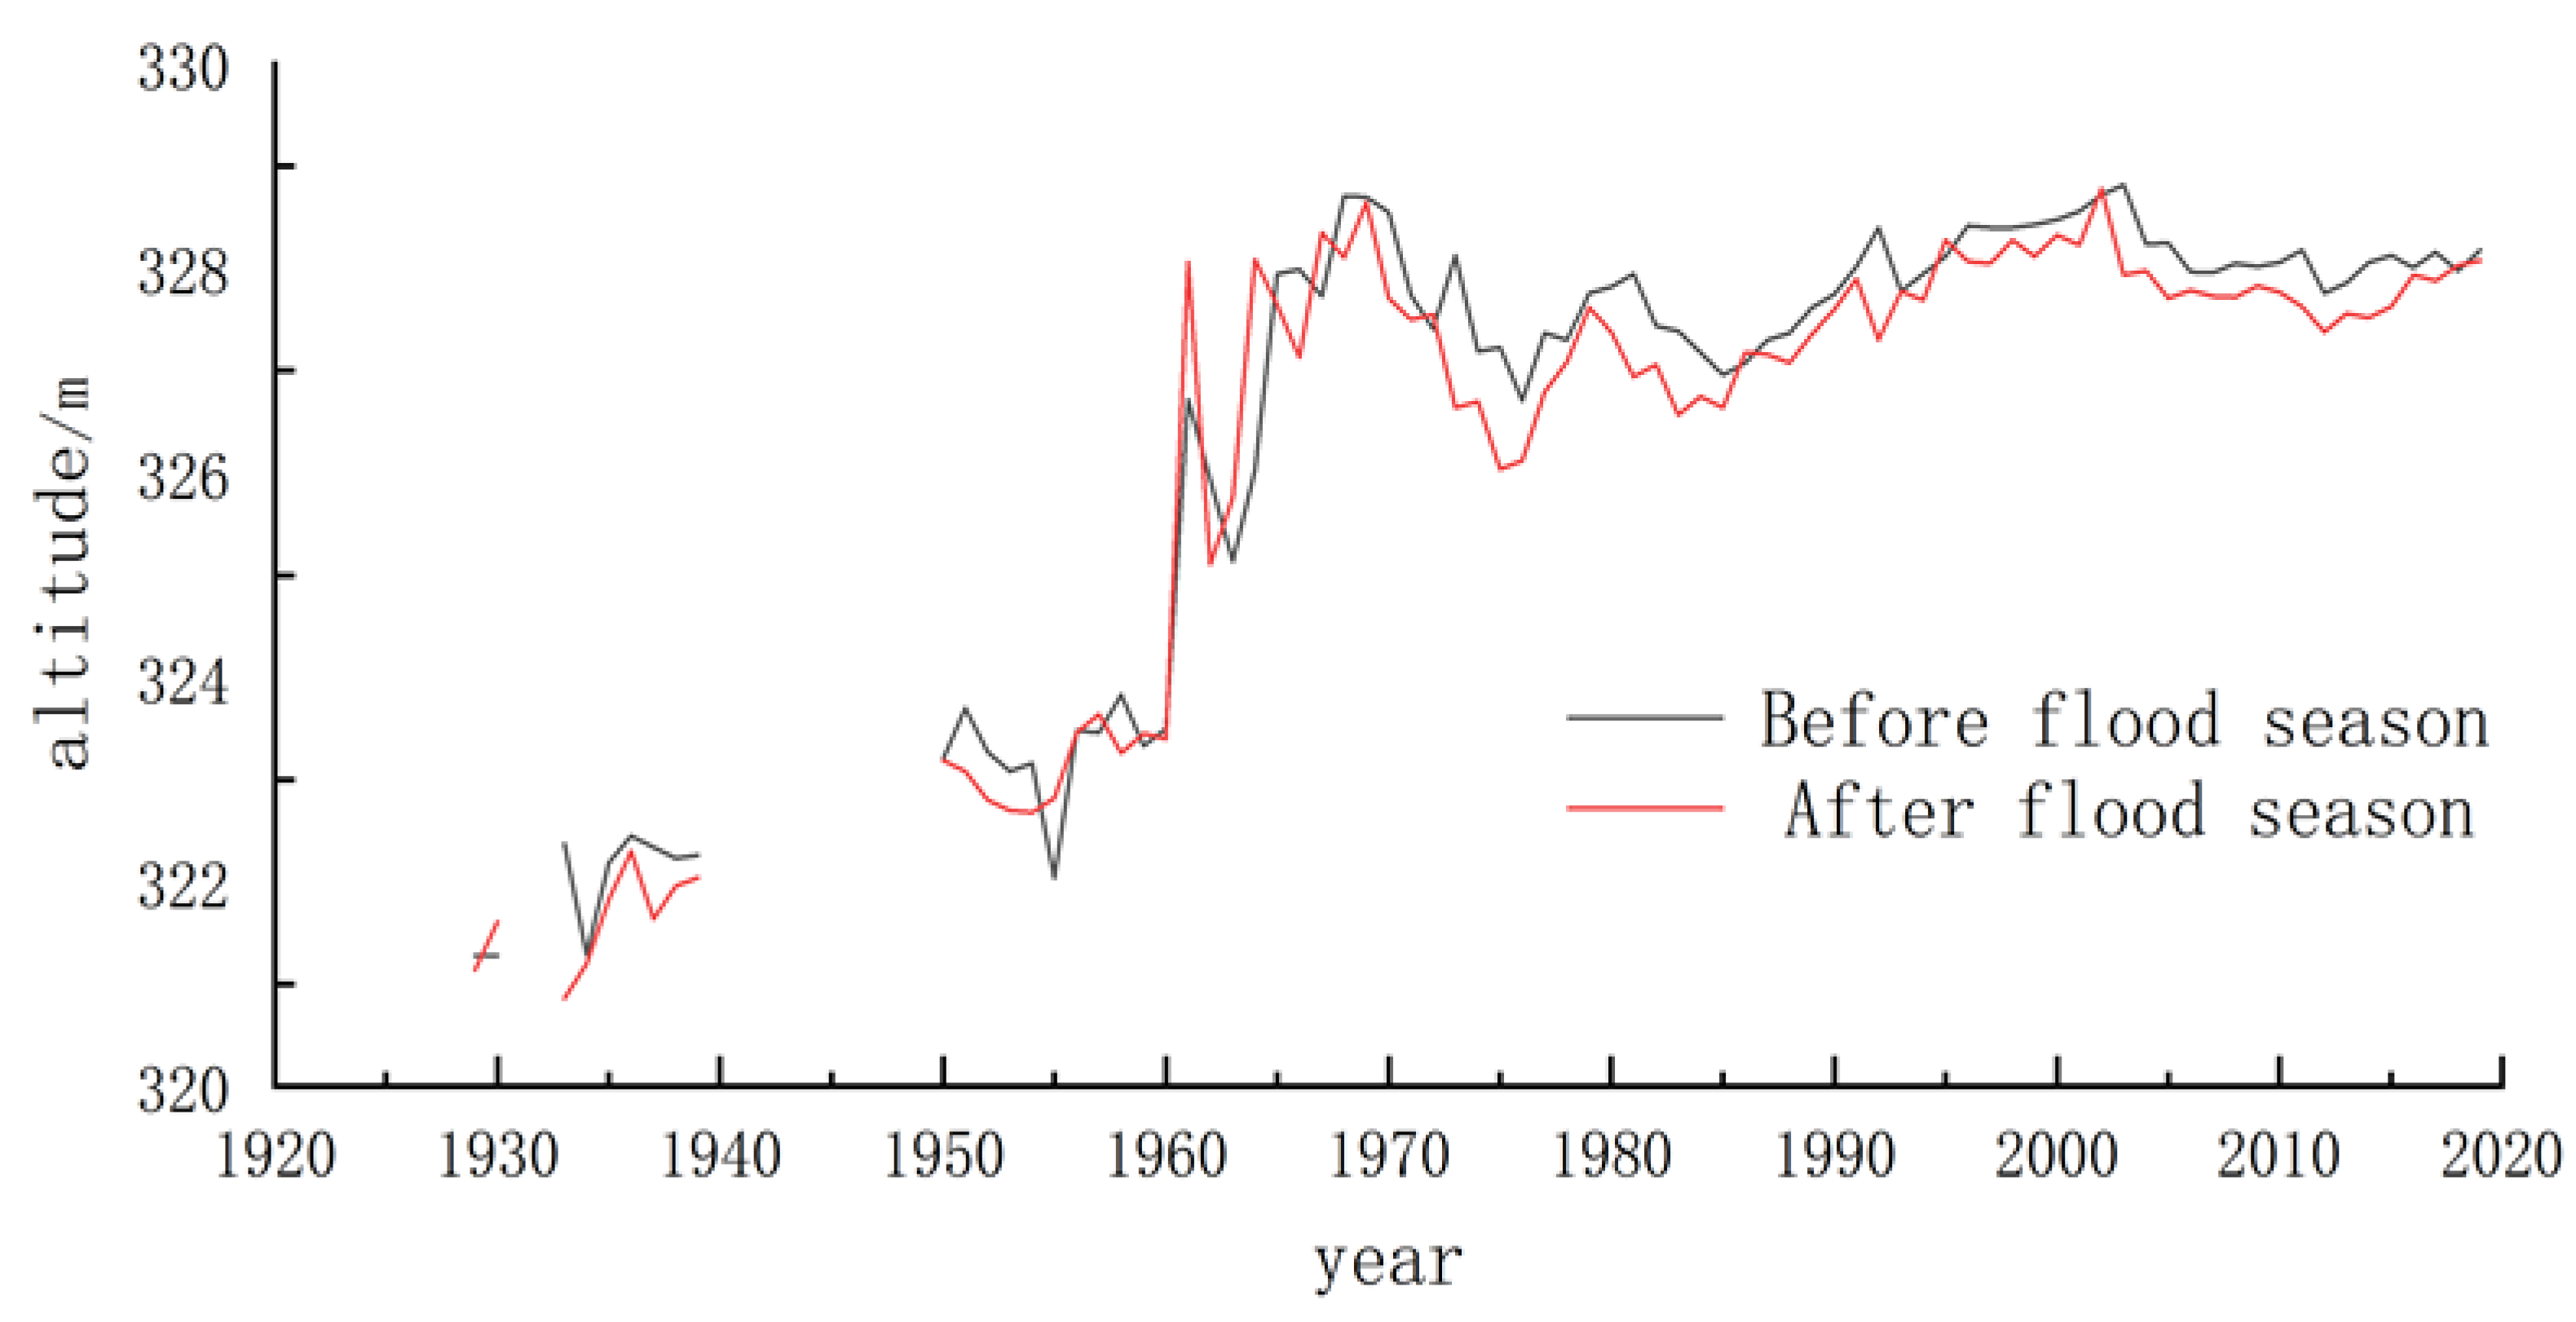
- Since sediment resources have been underutilized, this study proposes sediment-based embankment building, i.e., transporting sediment from the bottom of the reservoir to the shore and building an embankment at the 330 m elevation line on both sides of the reservoir. This would be consume considerable sediment and increase the water storage capacity of the reservoir area.
- (2)
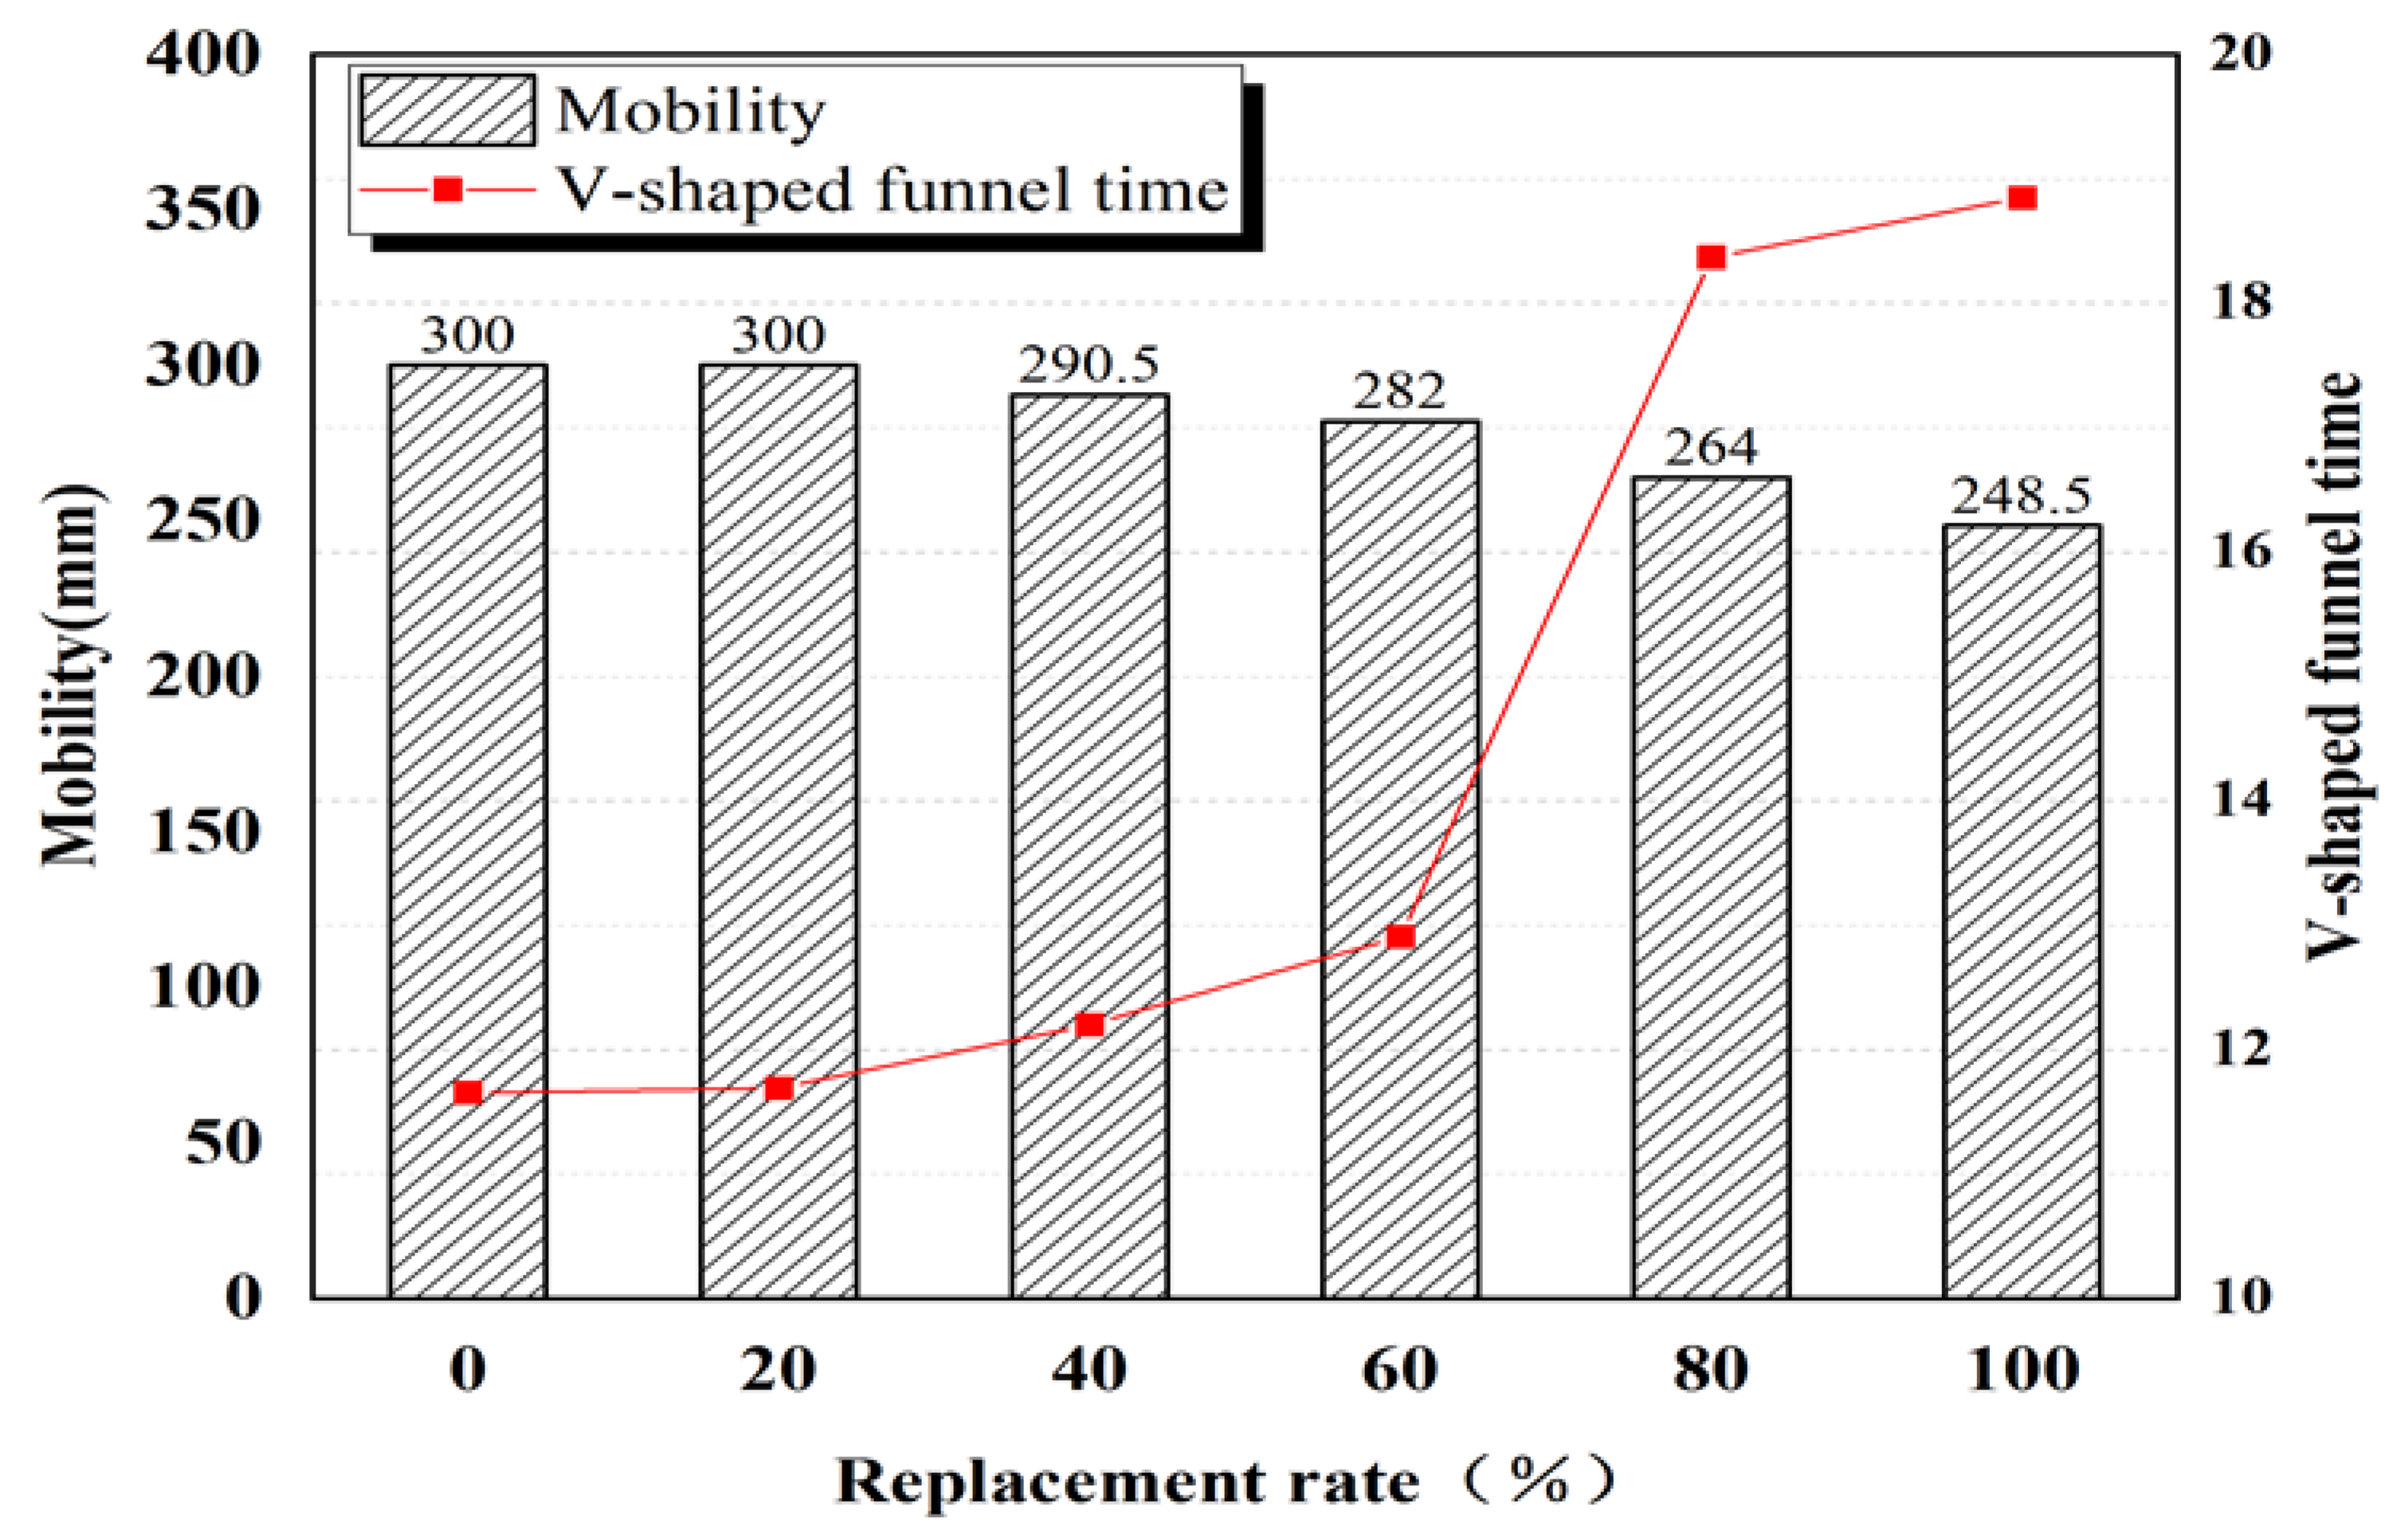
- To solve the low strength of Yellow River sand concrete, we propose a method for utilizing the ultra-fine Yellow River sand to make high-strength concrete, i.e., mixing of the ultra-fine Yellow River sand and river sand negatively affects the fluidity of ultra-high-performance concrete; however, even with a replacement rate as high as 100%, the mixture still exhibits high fluidity (248.5 mm). The addition of mixed sand does not seriously reduce the compressive strength. At a 100% replacement rate, pore diameter is primarily distributed at 3 nm. At the 100% replacement rate, UHPC cost can be reduced by 45% and primary energy consumption by 7% with no significant decrease in compressive strength.
Author Contributions
Funding
Institutional Review Board Statement
Informed Consent Statement
Data Availability Statement
Conflicts of Interest
References
- Hu, C.; Zhang, X.M.; Zhao, Y. Cause analysis of the centennial trend and recent fluctuation of the Yellow River sediment load. Adv. Water Sci. 2020, 31, 725–733. [Google Scholar] [CrossRef]
- Wang, L.J.; Yao, W.Y.; Leng, Y.B. Ways and Principles of Utilizing Sediment Resources of the Yellow River. Yellow River 2014, 36, 9–12. [Google Scholar]
- Jiang, E.H.; Cao, Y.T.; Dong, Q.H.; Gao, G.M.; Li, J.H.; Jiang, S.Q. Long Term Effects of the Yellow River Sediment Resources Utilization. Yellow River 2015, 37, 1–5+12. [Google Scholar]
- Liu, G.Z. Preliminary study on harnessing subsidence area of Juye County coalfield by Yellow River Sediment. Shandong Land Resour. 2010, 26, 66–67. [Google Scholar]
- China University of Mining and Technology (Beijing). A Method of Dynamic Filling Coal Mining Subsidence Ground with Yellow River. Sediment. Patent CN201811159810.6, 22 February 2019.
- Liu, Y.C.; Zhang, J.C.; Pan, D.L. Practice and effect of using silt of the Yellow River to fill up dike and stream ditches. Technol. Mark. 2012, 19, 87. [Google Scholar]
- Zhang, B.S.; Yang, G.Y.; Qi, H.H. A study on the technique of channel blocking in the Lower Yellow River. Geol. Disasters Environ. Prot. 2007, 1, 10–13. [Google Scholar]
- Lu, X.L.; Su, L.Z.; Li, L.Q.; Gong, X.C.; Zhang, H. Analysis on Harnessing Issues of Yellow River Beach Area and Geological Bearing Capacity of Village Platform Silting Engineering. Yellow River 2021, 43, 54–61+105. [Google Scholar]
- Su, X.F.; Wang, B.L.; Ye, Z.Z. A new way of sediment utilization in Panzhuang irrigation area. Shandong Water Conserv. 2012, 12, 51–52. [Google Scholar]
- Wang, G.X.; Xia, J.B.; Wang, J.Y. Soil function evaluation of land use improvement in abandoned soil area of Yellow River Irrigation area. Notif. Soil Water Conserv. 2016, 36, 264–269. [Google Scholar]
- Wang, X.L.; Ma, X.; Mei, R.F.; Yang, L.Y.; Li, C.Q.; Sun, Z.M. Research progress on technology of sediment resource utilization. Chem. Miner. Process. 2021, 50, 36–44. [Google Scholar]
- Wang, B.M.; Zheng, L.E. Using Alkali-Activated Modified Yellow River Sediment to Make Artificial Flood Control Stone; Solid Waste Subcommittee of The Chinese Ceramic Society: Beijing, China.
- Song, W.Z.; Zhang, K.; Liu, H.; Zheng, G.H. Study on production technology and forming equipment of artificial flood control stone material for Yellow River sediment. Build. Mater. Technol. Appl. 2018, 5, 13–16. [Google Scholar]
- Liu, Y.H. Yellow River Sediment Brick. Brick World 2006, 3, 53. [Google Scholar]
- Zhou, Y.; Jia, R.; Zhou, L.; Peng, X.; Wu, Y. Preparation of non-burned ceramsite for dredged sediment and its water purification effect. Environ. Eng. 2017, 11, 2804–2811. [Google Scholar]
- Zhang, Y.F. Experimental Study on Strength and Durability of Pumping Concrete with Superfine Sand from the Yellow River. Master’s Thesis, North China University of Water Resources and Hydropower, Zhengzhou, China, 2018. [Google Scholar]
- Zhang, S. Experimental Study on Mechanical Properties and Early Shrinkage Properties of Yellow River Super Fine Sand Concrete. Master’s Thesis, Zhengzhou University, Zhengzhou, China, 2016. [Google Scholar]
- Wang, J.J. Study on Mix Proportion Design and Compressive Strength Test of Pumping Concrete with Ultra-Fine Sand from the Yellow River. Master’s Thesis, North China University of Water Resources and Hydropower, Zhengzhou, China, 2018. [Google Scholar]
- Wang, L.X. Application of Yellow River sand in high fluidity concrete. Yellow River 2017, 39, 106–111. [Google Scholar]
- Zhang, T.Y.; Wang, Z.L.; Zhu, H.T. Permeability of Yellow River Super fine sand plastic concrete. J. Sichuan Univ. (Eng. Sci. Ed.) 2015, 47, 69–75. [Google Scholar]
- Wang, B.; Li, G.; Han, J.; Zheng, Y.; Liu, H.; Song, W. Study on the properties of artificial flood-prevention stone made by Yellow River silt. Constr. Build. Mater. 2017, 144, 484–492. [Google Scholar] [CrossRef]
- Hou, S.Z.; Gou, X.J.; Hu, T. Yellow River Institute of Hydraulic Research. J. Sediment Res. 2019, 44, 14–18. [Google Scholar]
- Wu, B.S.; Deng, Y. Effect of controlled water level on sediment scouring and silting in Sanmenxia Reservoir during non-floodseason. Hydroelectr. J. 2007, 2, 93–98. [Google Scholar]
- Tang, X.H.; Lei, F.Z.; Yang, W.X.; Feng, P.L.; Zhang, X.L.; Feng, L.J.; Bi, Y.X.; Ma, X.Y.; Shi, C.W. Influence of Sanmenxia Reservoir on Shaanxi Reservoir area and its control countermeasures. Hydroelectr. J. 2001, 2, 53–57. [Google Scholar]
- Cheng, Y.F.; Xia, J.Q.; Zhou, M.R.; Deng, S.S. Response of flood discharge capacity to the incoming flow and sediment regime and channel geometry in the braided reach of the Lower Yellow River. Adv. Water Sci. 2020, 31, 337–347. [Google Scholar] [CrossRef]
- Wu, B.S.; Zheng, S.; Shen, Y. Influence of scouring and silting of Sanmenxia Reservoir on operation of 318. Water Conserv. Hydropower Technol. 2020, 51, 5–16. [Google Scholar]
- Lu, F.F.; Chen, R.S. Levee top width design of standardized levee project in the Lower Yellow River. Water Conserv. Hydropower Northeast China 2017, 35, 16–18+21. [Google Scholar]
- Li, W.J.; Li, Z. Demonstration and Formation of Standardized Embankment in the Lower Reaches of the Yellow River. Yellow River 2019, 41, 53–57. [Google Scholar]
- Mehdipour, I.; Khayat, K.H. Effect of particle-size distribution and specific surface area of different binder systems on packing density and flow characteristics of cement paste. Cem. Concr. Compos. 2017, 78, 120–131. [Google Scholar] [CrossRef]
- Andreasen, J.A.A.H.M. Über die Beziehungen zwischen Kornabstufungen und Zwischenraum in Produkten aus losen Körnern (mit einigen Experimenten). Kolloid Zeitschrift 1930, 50, 217–228. [Google Scholar] [CrossRef]
- Funk, J.; Dinger, D. Caol Gringding and Particle Size Distribution Studies for Coal-Water Sluries at High Solids Content; Final Report; Empire State Electric Energy Research Corporation (ESEERCO): New York, NY, USA, 2015. [Google Scholar]
- Columbu, S.; Usai, M.; Rispoli, C.; Fancello, D. Lime and Cement Plasters from 20th Century Buildings: Raw Materials and Relations between Mineralogical–Petrographic Characteristics and Chemical–Physical Compatibility with the Limestone Substrate. Minerals 2022, 12, 226. [Google Scholar] [CrossRef]
- Columbu, S.; Sitzia, F.; Ennas, G. The ancient pozzolanic mortars and concretes of Heliocaminus baths in Hadrian’s Villa (Tivoli, Italy). Archaeol. Anthropol. Sci. 2017, 9, 523–553. [Google Scholar] [CrossRef]
- Columbu, S.; Garau, A.M. Mineralogical, petrographic and chemical analysis of geomaterials used in the mortars of Roman Nora theatre (south Sardinia, Italy). Ital. J. Geosci. 2017, 136, 238–262. [Google Scholar] [CrossRef]
- Li, Y.; Teng, N.; Liu, R.; Cui, Y. Effect of Particle Size Distribution of Slag on the Strength and Pore Structure of Low-Temperature Concrete; IOP Publishing: Shanghai, China, 2019; p. 6. [Google Scholar]
- Zhang, G.-Z.; Cheng, G.J.; Zhang, C.-X.; Jun, Y.; Kaiwei, L.; Wang, A.-G.; Sun, D.-S. Progress in the influence of curing regime on the formation mechanism of concrete microstructure. Mater. Rev. 2021, 35, 15125–15133. [Google Scholar]


| Form | Na2O | MgO | Al2O3 | SiO2 | P2O5 | TiO2 | SO3 | K2O | CaO | Fe2O3 | LOI |
|---|---|---|---|---|---|---|---|---|---|---|---|
| Cement | 0.09 | 1.61 | 4.18 | 19.2 | 0.09 | - | 3.35 | 0.78 | 64.93 | 3.32 | 2.49 |
| Silica fume | 0.13 | 0.47 | 0.25 | 94.65 | 0.17 | - | 0.69 | 0.84 | 0.36 | 0.15 | 2.29 |
| Fly ash | 0.33 | 0.23 | 38.01 | 46.44 | 0.06 | - | 0.69 | 0.88 | 7.5 | 3.12 | 2.79 |
| Yellow River sand | 1.65 | 1.88 | 10.79 | 72.73 | 0.17 | 0.83 | - | 3.33 | 3.93 | 4.31 | 0.38 |
| Large-size river sand | 1.75 | 1.65 | 11.58 | 75.89 | 0.23 | 0.9 | - | 3.21 | 2.29 | 2.3 | 0.2 |
| Quartz sand | 1.3 | 0.8 | 0.9 | 88.25 | 0.15 | 0.75 | - | 3.35 | 2.45 | 1.2 | 0.85 |
| Number | Cement | Fly Ash | Silica Fume | River Sand | Sand of the Yellow River | Small Quartz Sand | Large Quartz Sand | Water | Water Reducing Agent |
|---|---|---|---|---|---|---|---|---|---|
| U0 | 723 | 181 | 174 | 0 | 0 | 811 | 195 | 194 | 30 |
| U20 | 723 | 181 | 174 | 44 | 157 | 649 | 156 | 194 | 30 |
| U40 | 723 | 181 | 174 | 88 | 314 | 487 | 117 | 194 | 30 |
| U60 | 723 | 181 | 174 | 132 | 472 | 324 | 78 | 194 | 30 |
| U80 | 723 | 181 | 174 | 176 | 629 | 162 | 39 | 194 | 30 |
| U100 | 723 | 181 | 174 | 220 | 789 | 0 | 0 | 194 | 30 |
Publisher’s Note: MDPI stays neutral with regard to jurisdictional claims in published maps and institutional affiliations. |
© 2022 by the authors. Licensee MDPI, Basel, Switzerland. This article is an open access article distributed under the terms and conditions of the Creative Commons Attribution (CC BY) license (https://creativecommons.org/licenses/by/4.0/).
Share and Cite
Yan, J.; Zhong, S.; Chen, S.; Lv, Y.; Yang, L.; Peng, G.; Deng, A. Study on the Application of Sediment-Based Embankment Building and Ultra-High-Performance Concrete (UHPC) Preparation in the Resource Utilization of Yellow River Sediment. Materials 2022, 15, 5668. https://doi.org/10.3390/ma15165668
Yan J, Zhong S, Chen S, Lv Y, Yang L, Peng G, Deng A. Study on the Application of Sediment-Based Embankment Building and Ultra-High-Performance Concrete (UHPC) Preparation in the Resource Utilization of Yellow River Sediment. Materials. 2022; 15(16):5668. https://doi.org/10.3390/ma15165668
Chicago/Turabian StyleYan, Jun, Sai Zhong, Sainan Chen, Yajun Lv, Longbin Yang, Guanghong Peng, and Anjun Deng. 2022. "Study on the Application of Sediment-Based Embankment Building and Ultra-High-Performance Concrete (UHPC) Preparation in the Resource Utilization of Yellow River Sediment" Materials 15, no. 16: 5668. https://doi.org/10.3390/ma15165668
APA StyleYan, J., Zhong, S., Chen, S., Lv, Y., Yang, L., Peng, G., & Deng, A. (2022). Study on the Application of Sediment-Based Embankment Building and Ultra-High-Performance Concrete (UHPC) Preparation in the Resource Utilization of Yellow River Sediment. Materials, 15(16), 5668. https://doi.org/10.3390/ma15165668