
Influence of Mechanical Fatigue at Different States of Charge on Pouch-Type Li-Ion Batteries

 ,
,  and
and 
Abstract
:1. Introduction
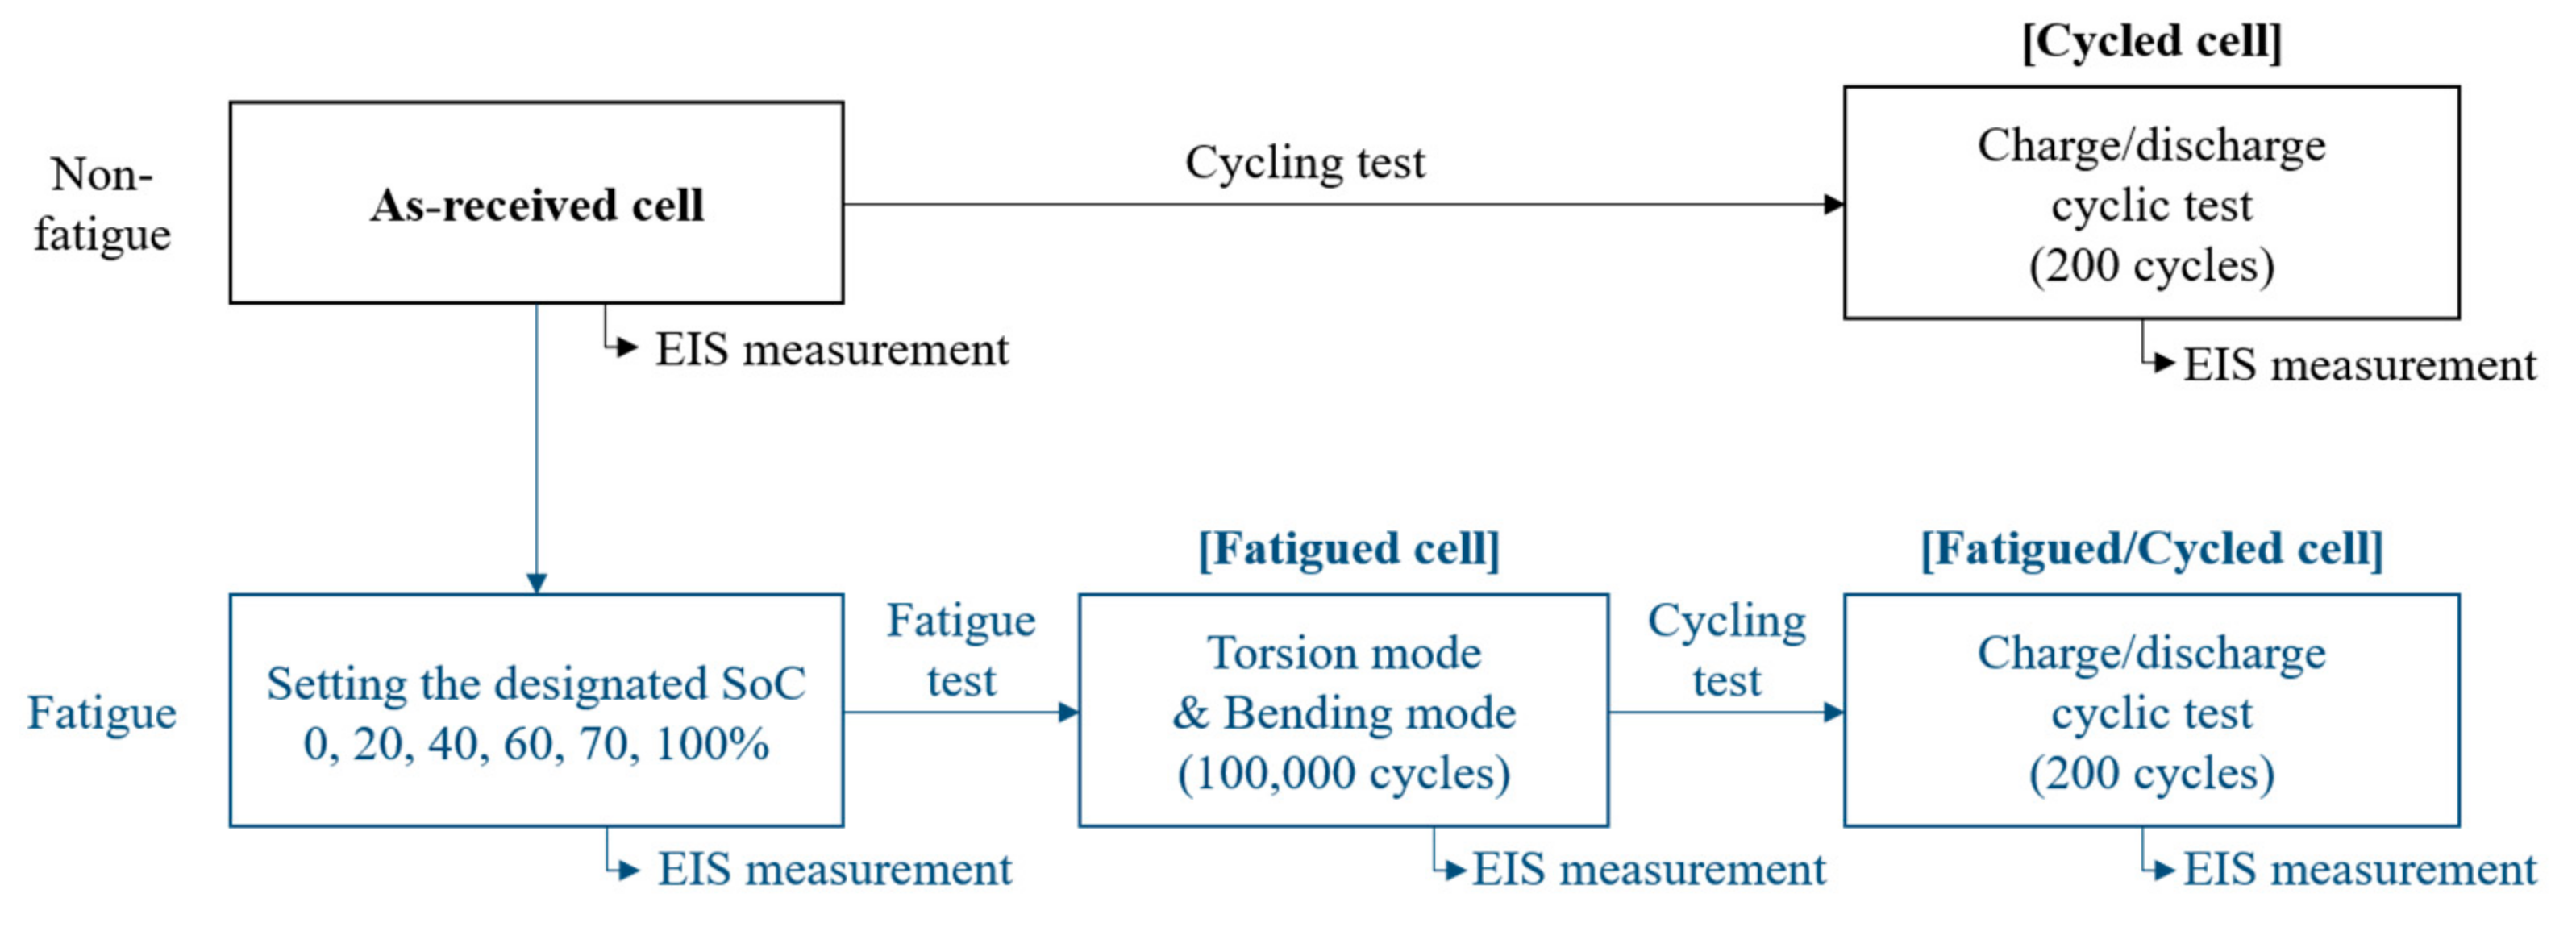
2. Materials and Methods
2.1. Sample Characterization
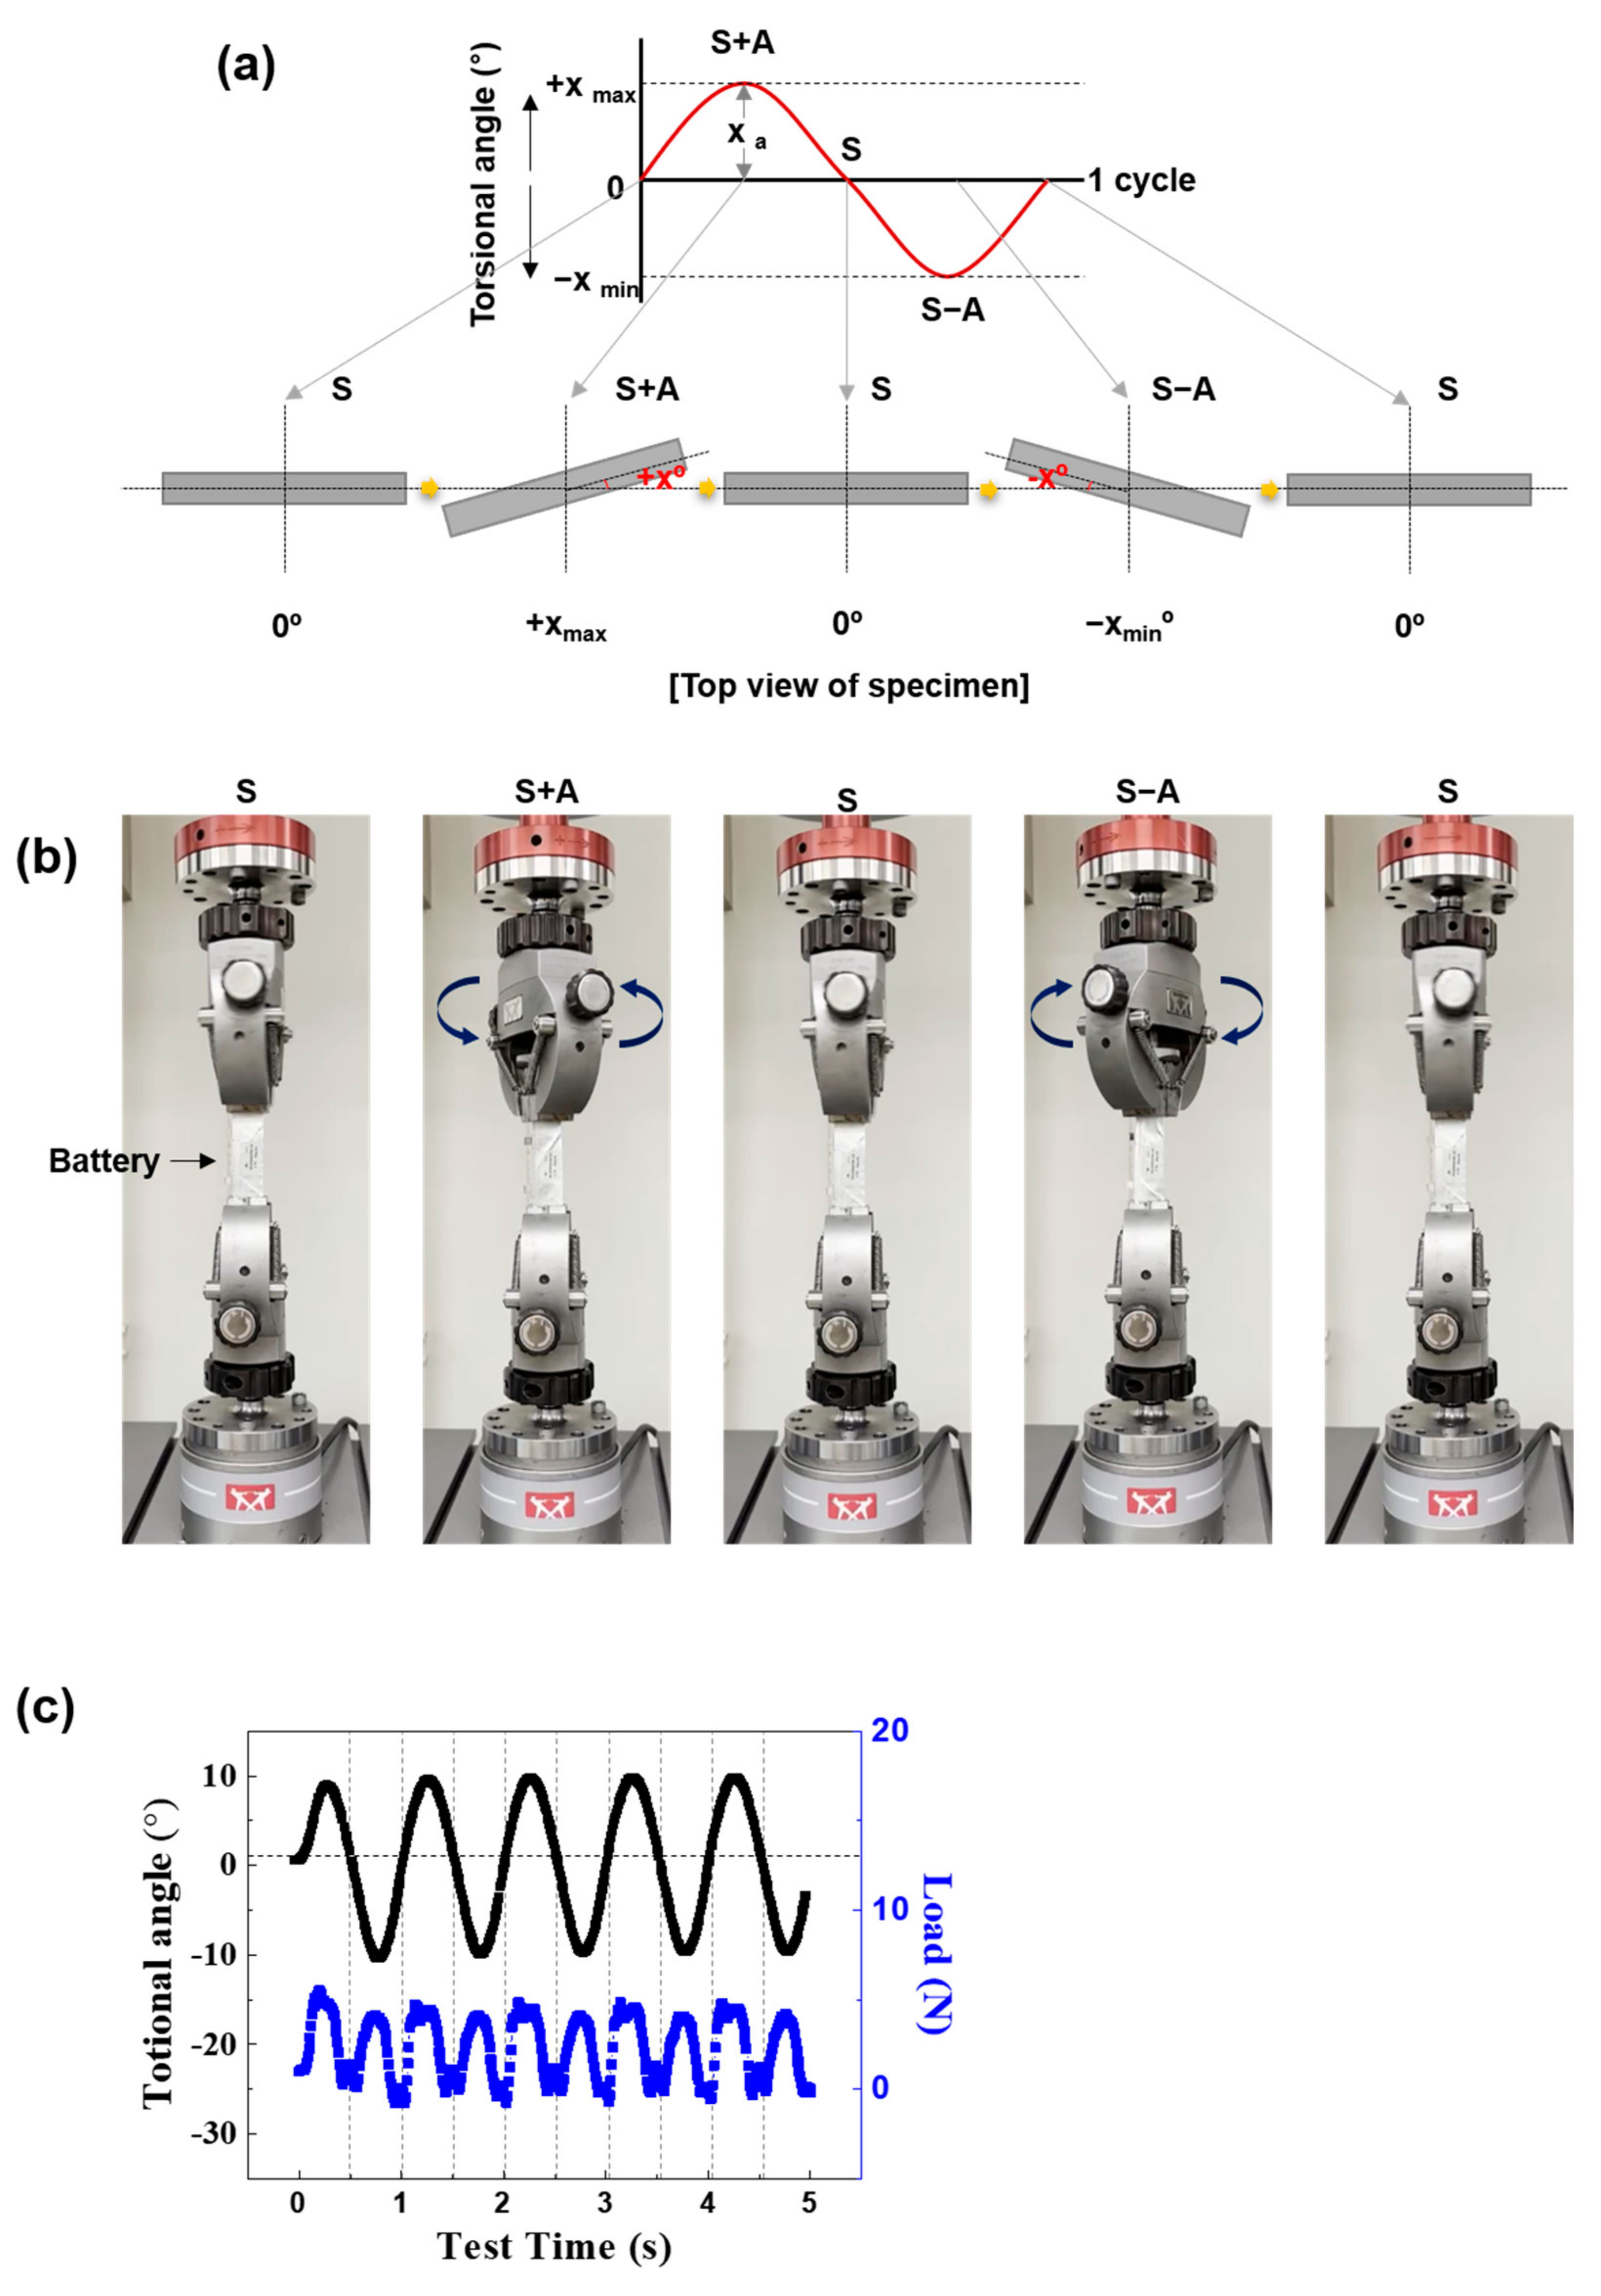
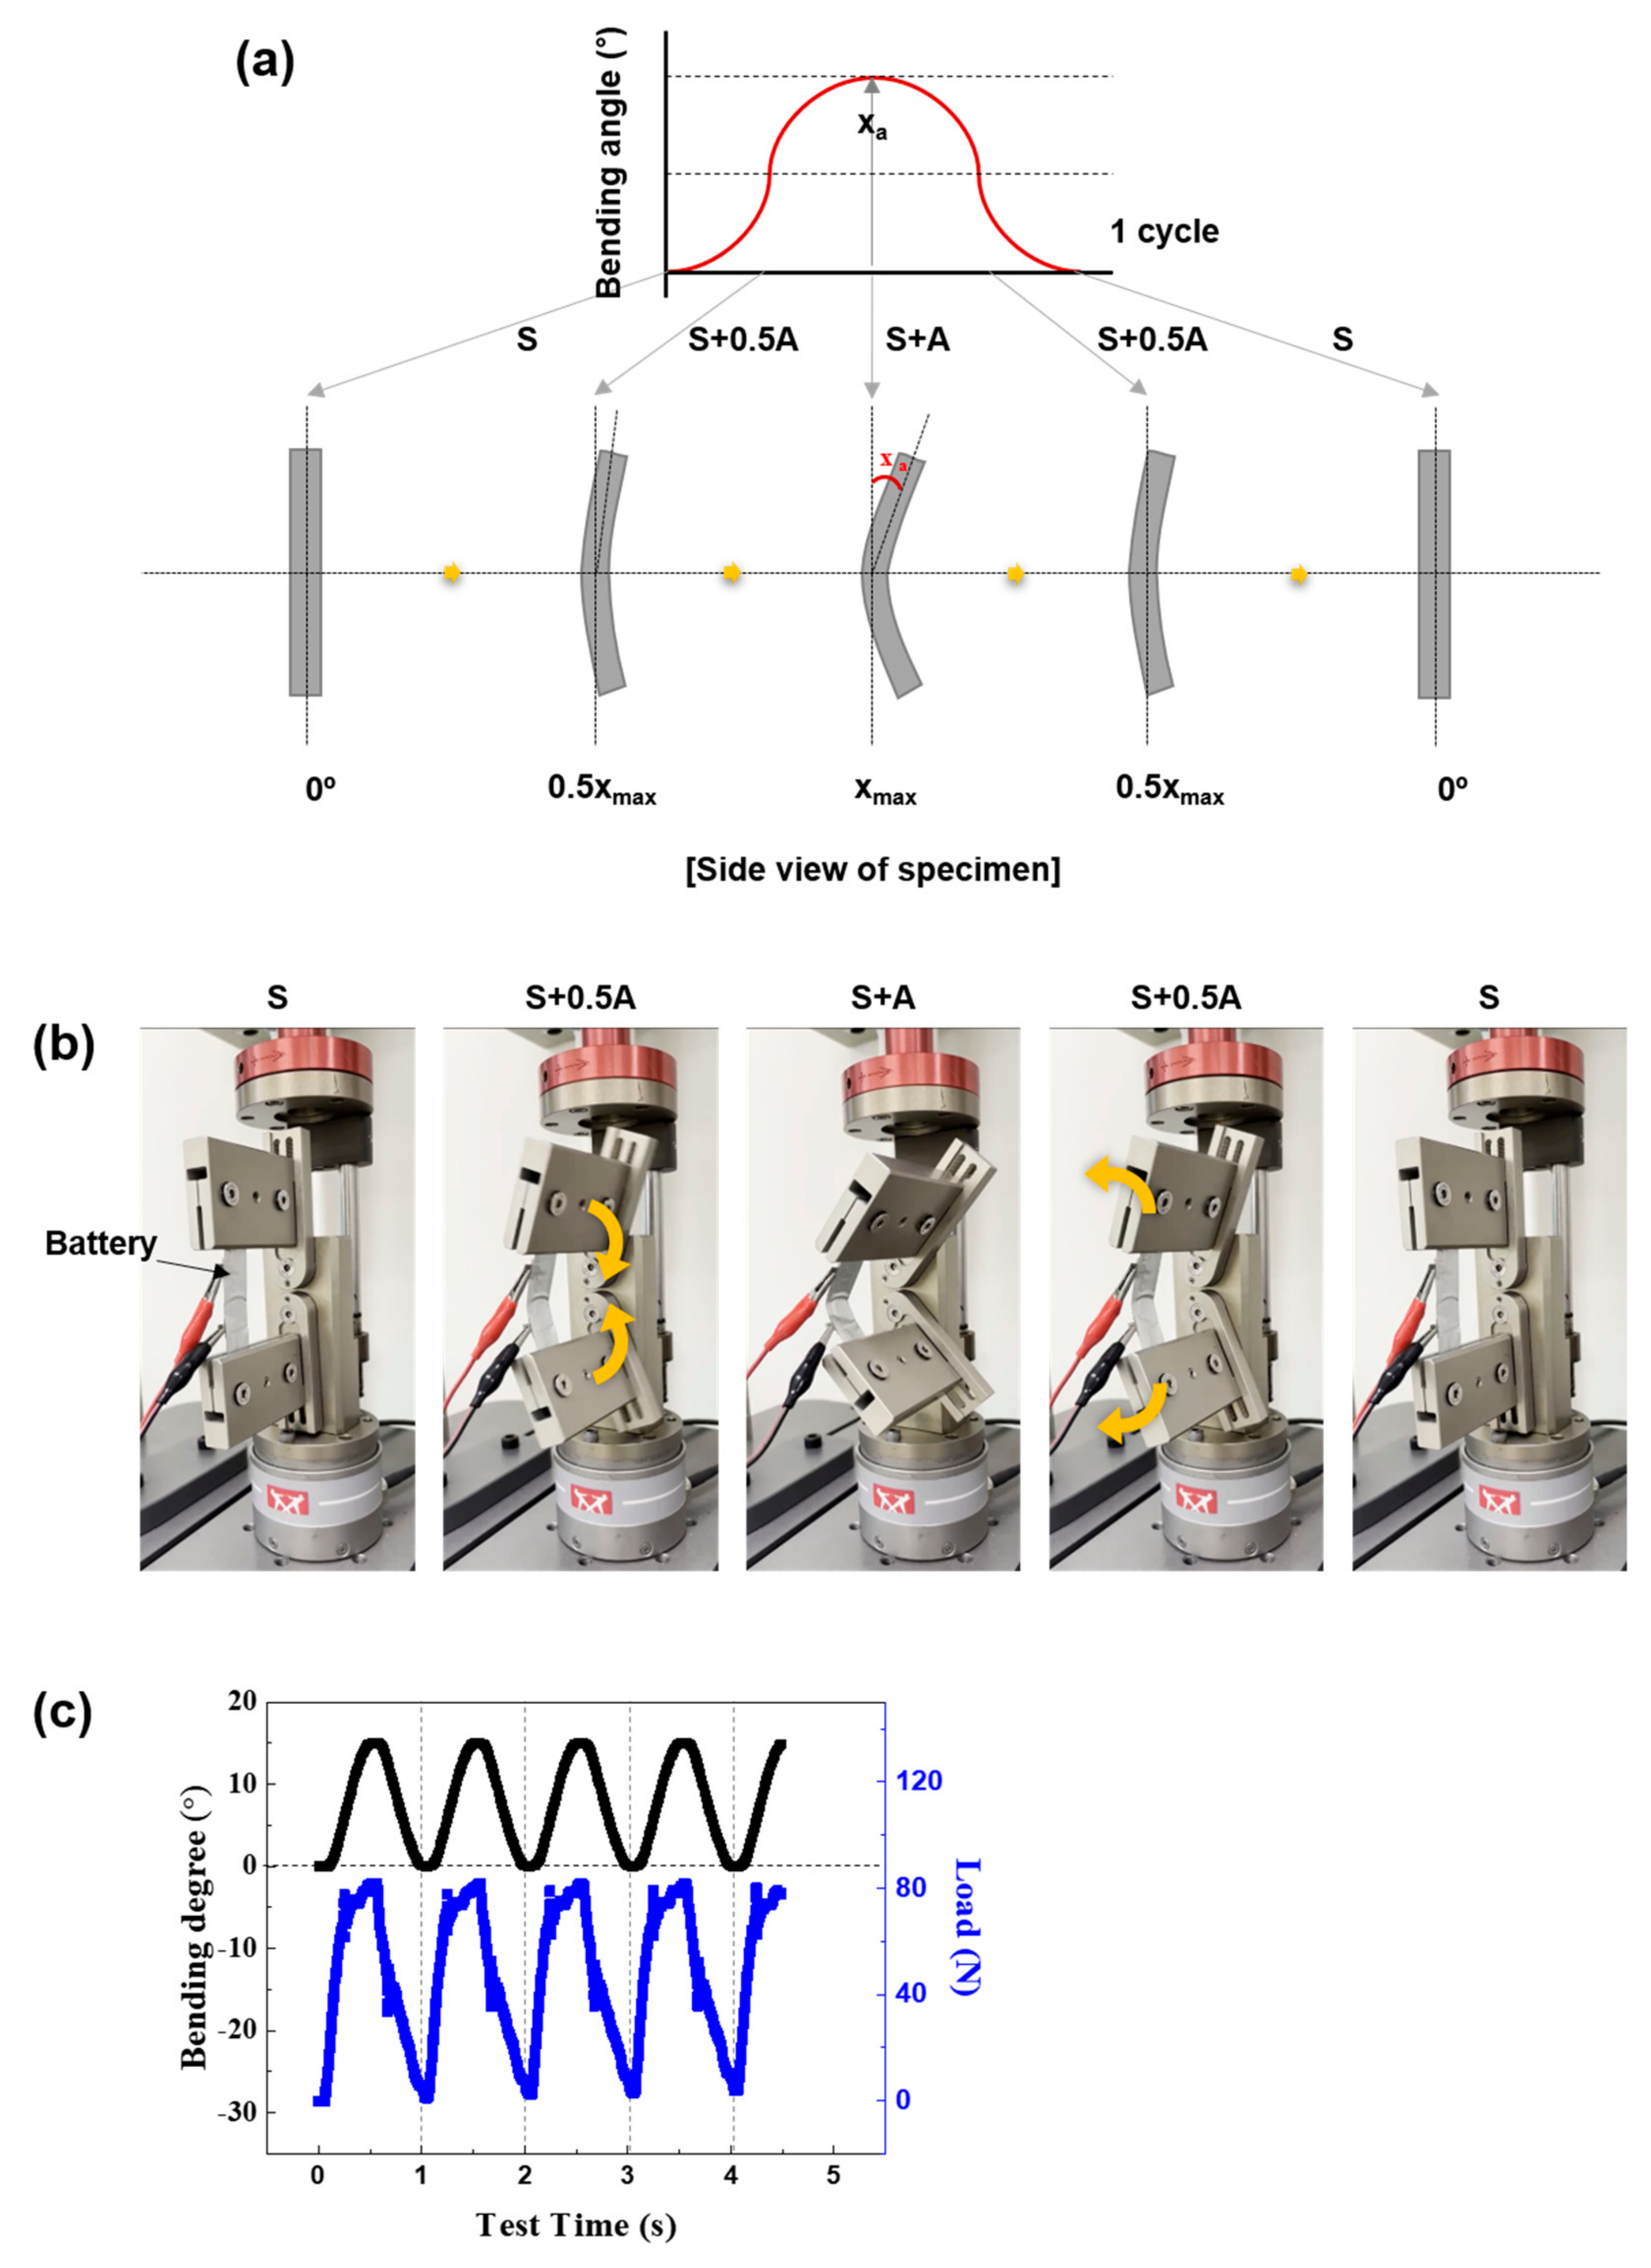
2.2. Mechanical Fatigue Test
2.3. Electrochemical Test
2.4. Failure Analysis
3. Results and Discussion
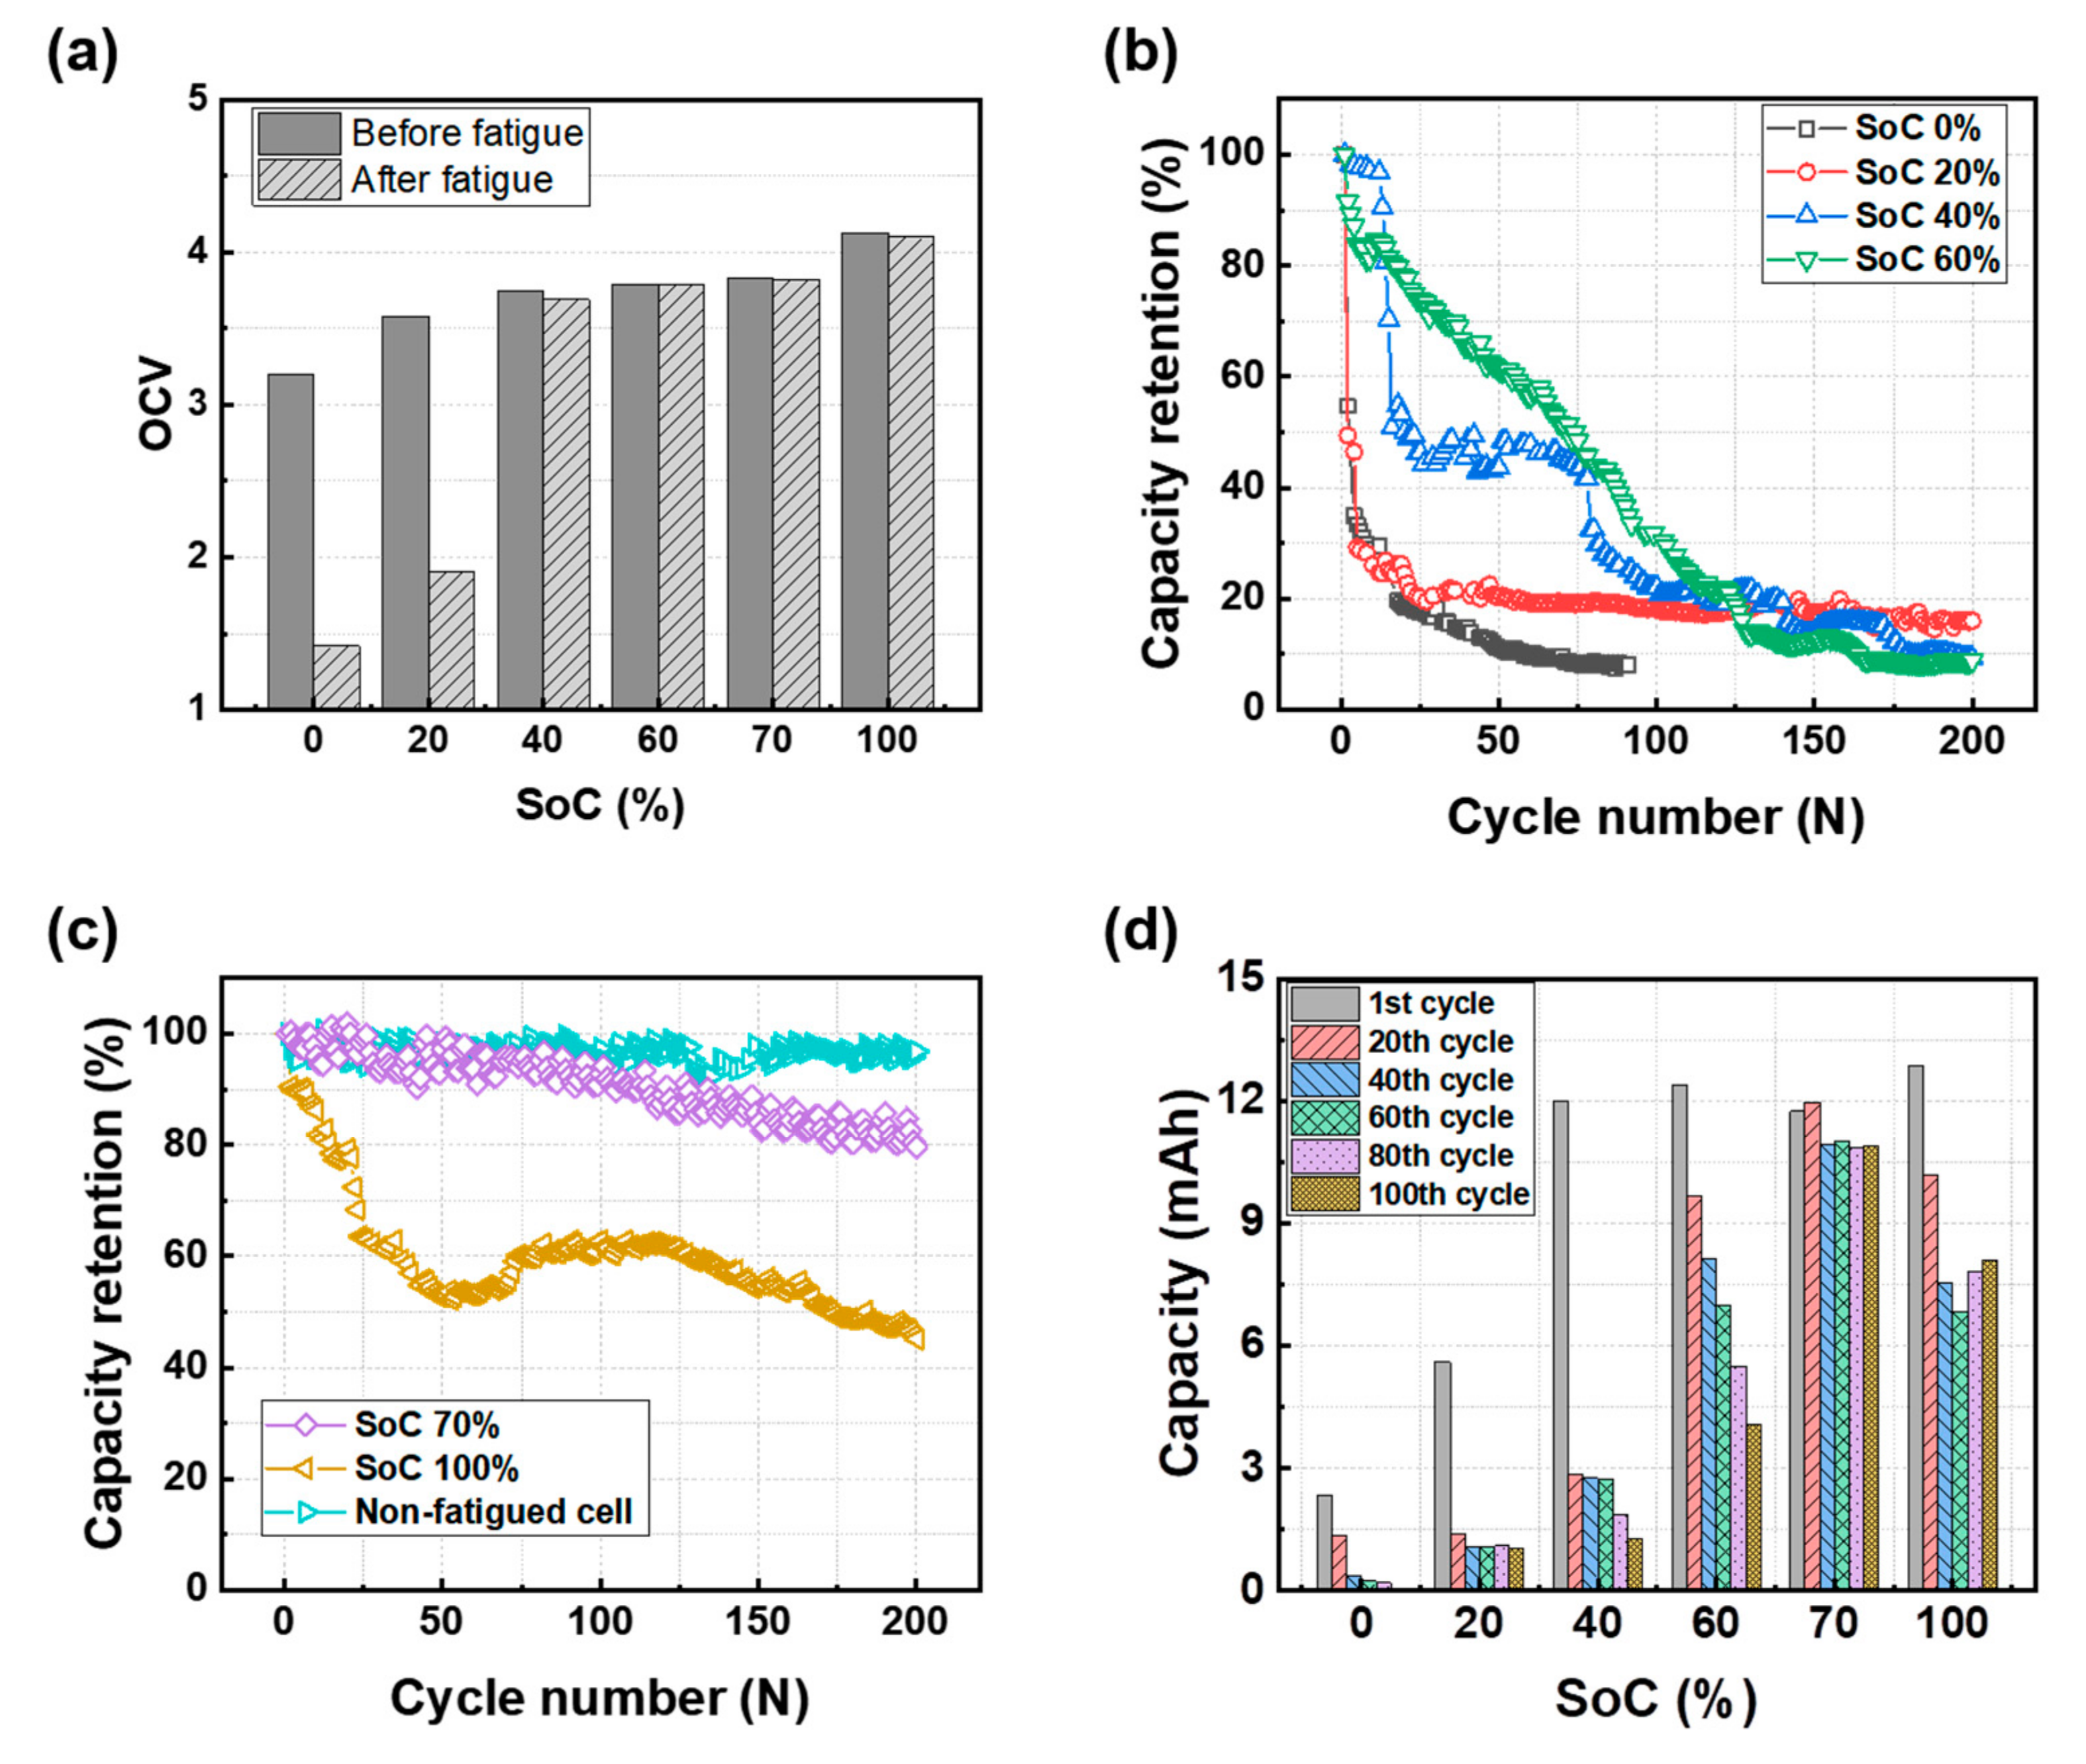
3.1. Cycle Performance after the Mechanical Test
3.2. Effect of the Initial SoC Prior to the Mechanical Test on Electrode Resistance
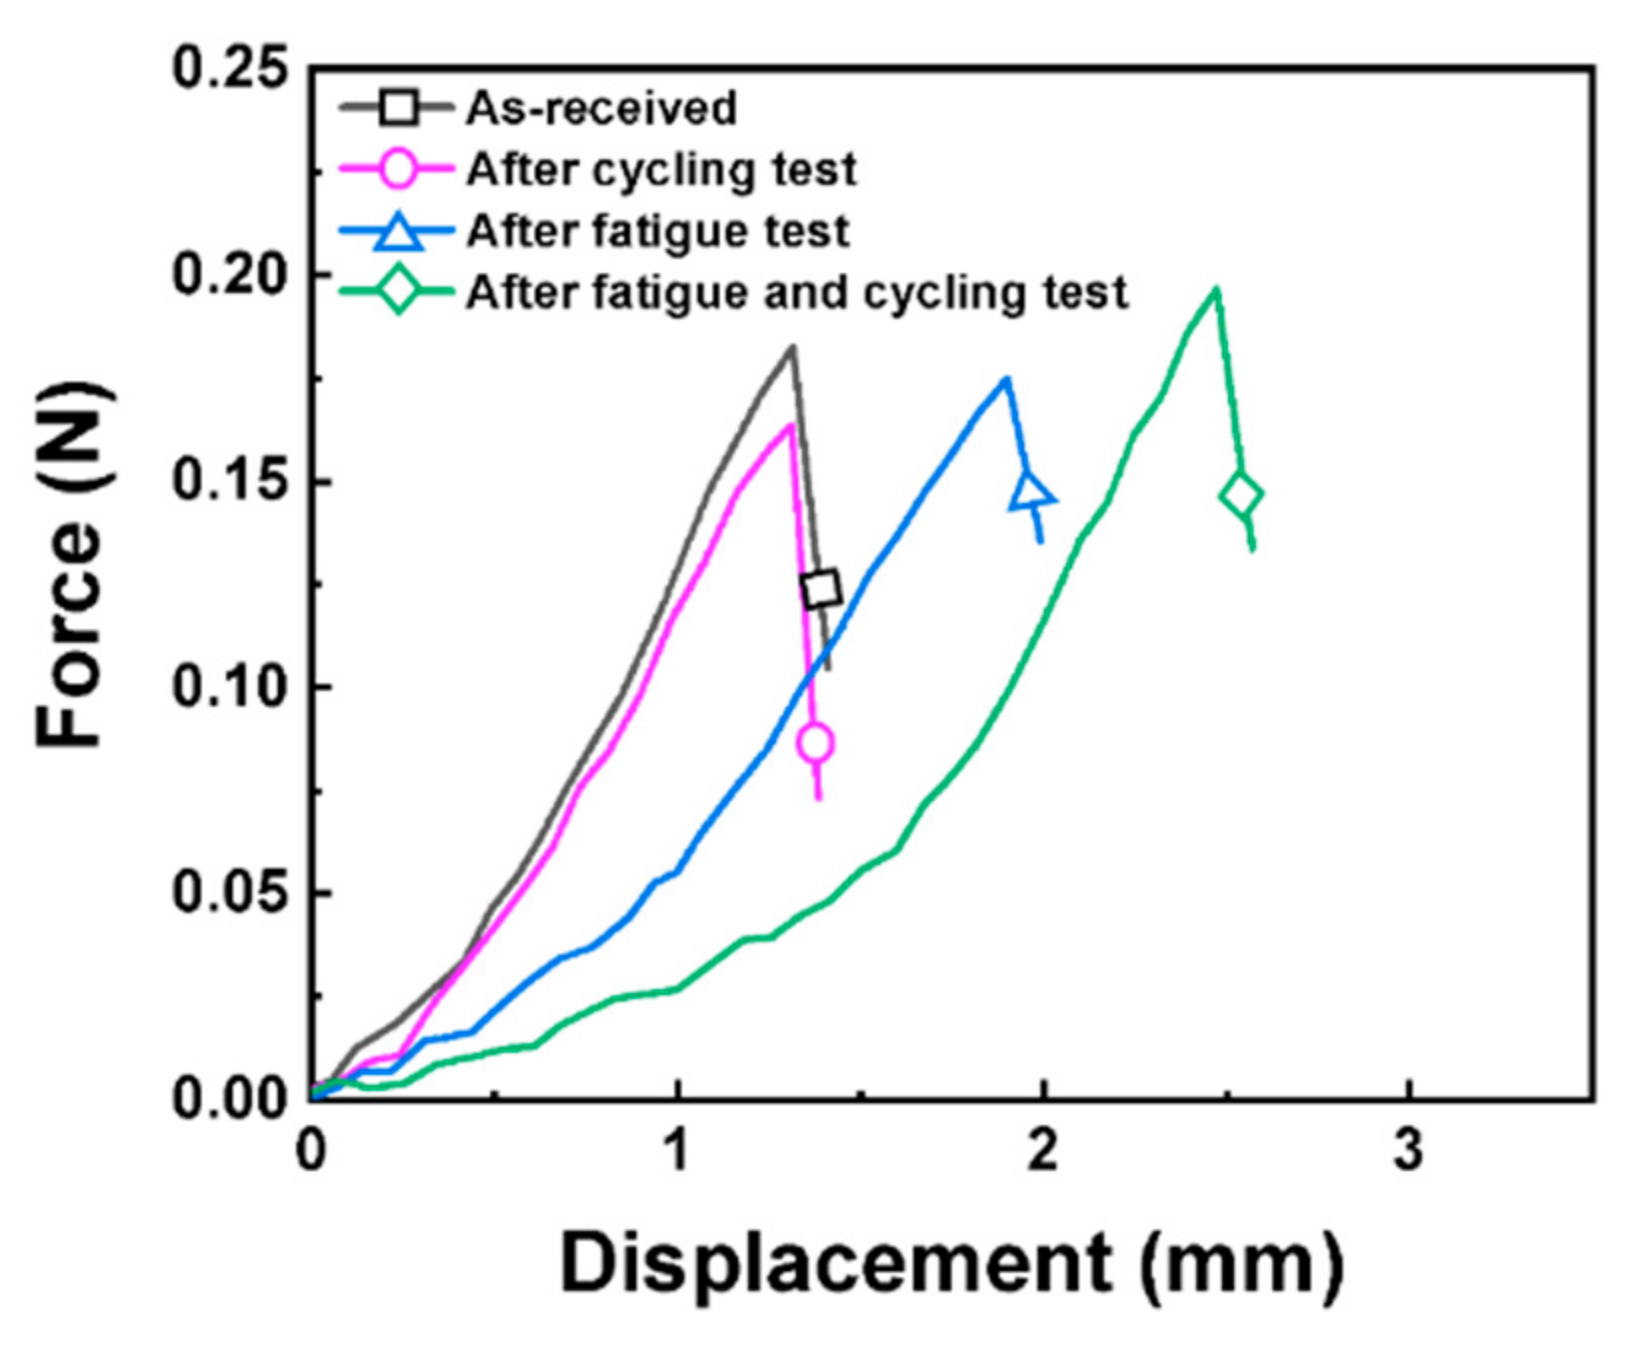
3.3. Effect of Mechanical Test Conditions
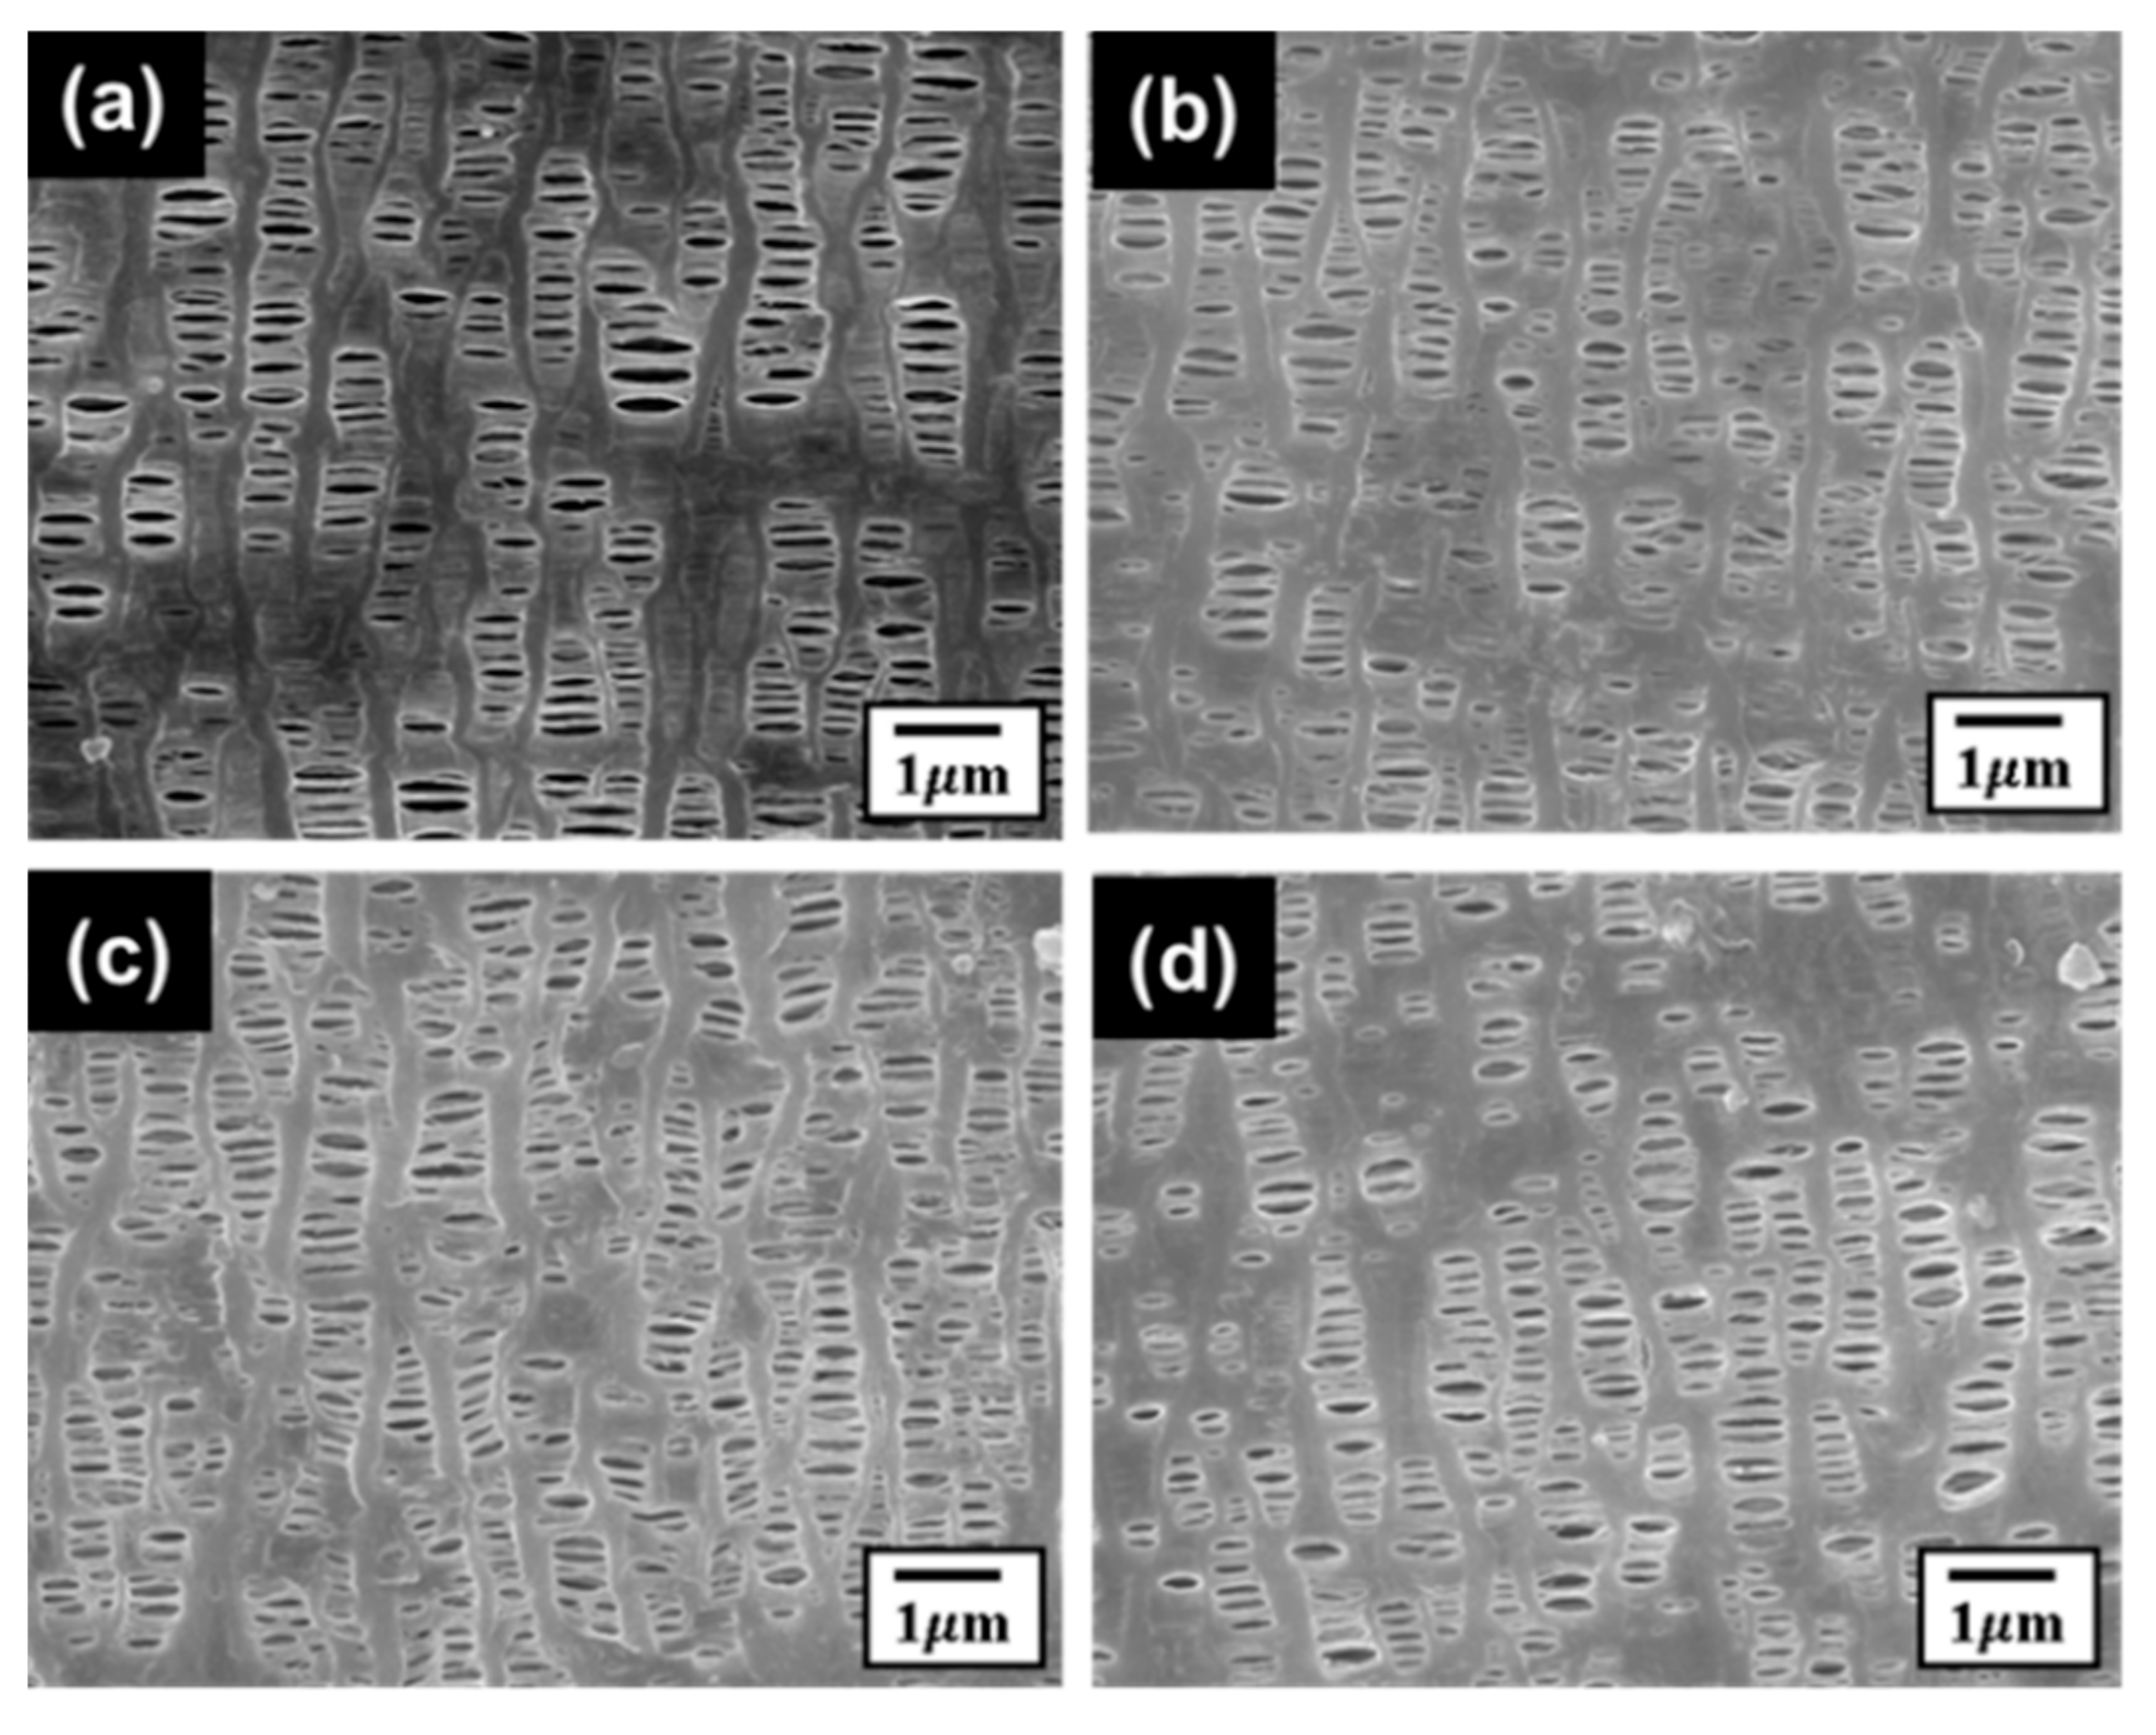
3.4. Mechanical Test Effect on the Separators
4. Conclusions
Supplementary Materials
Author Contributions
Funding
Institutional Review Board Statement
Informed Consent Statement
Data Availability Statement
Conflicts of Interest
References
- Sasaki, T.; Ukyo, Y.; Novák, P. Memory effect in a lithium-ion battery. Nat. Mater. 2013, 12, 569–575. [Google Scholar] [CrossRef] [PubMed]
- Wang, S.; Zhu, J.; Li, Y.; Cao, G.; Chen, Y.; Zhang, D.; Tan, Z.; Yang, J.; Zheng, J.; Li, H. Role of Al on the electrochemical performances of quaternary nickel-rich cathode LiNi0.8Co0.1Mn0.1−xAlxO2 (0 ≤ x ≤ 0.06) for lithium-ion batteries. J. Electroanal Chem. 2021, 888, 115200. [Google Scholar] [CrossRef]
- Sun, Y.K.; Myung, S.T.; Park, B.C.; Prakash, J.; Belharouak, I.; Amine, K. High-energy cathode material for long-life and safe lithium batteries. Nat. Mater. 2009, 8, 320–324. [Google Scholar] [CrossRef] [PubMed]
- Niehoff, P.; Passerini, S.; Winter, M. Interface Investigations of a Commercial Lithium Ion Battery Graphite Anode Material by Sputter Depth Profile X-ray Photoelectron Spectroscopy. Langmuir 2013, 29, 5806–5816. [Google Scholar] [CrossRef] [PubMed]
- Flandrois, S.; Simon, B. Carbon materials for lithium-ion rechargeable batteries. Carbon 1997, 37, 165–180. [Google Scholar] [CrossRef]
- Kim, K.H.; Cho, J.H.; Hwang, J.U.; Im, J.S.; Lee, Y.S. A key strategy to form a LiF-based SEI layer for a lithium-ion battery anode with enhanced cycling stability by introducing a semi-ionic C-F bond. J. Ind. Eng. Chem. 2021, 99, 48–54. [Google Scholar] [CrossRef]
- Uhlmann, C.; Illig, J.; Ender, M.; Schuster, R.; Ivers-Tiffée, E. In situ detection of lithium metal plating on graphite in experimental cells. J. Power Sources 2015, 279, 428–438. [Google Scholar] [CrossRef]
- Zhang, S.S.; Xu, K.; Jow, T.R. Study of the charging process of a LiCoO2-based Li-ion battery. J. Power Sources 2006, 160, 1349–1354. [Google Scholar] [CrossRef]
- Münster, P.; Diehl, M.; Frerichs, J.E.; Börner, M.; Hansen, M.R.; Winter, M.; Niehoff, P. Effect of Li plating during formation of lithium ion batteries on their cycling performance and thermal safety. J. Power Sources 2021, 484, 229306. [Google Scholar] [CrossRef]
- Huang, W.; Feng, X.; Han, X.; Zhang, W.; Jiang, F. Questions and Answers Relating to Lithium-Ion Battery Safety Issues. Cell Rep. Phys. Sci. 2021, 2, 100285. [Google Scholar] [CrossRef]
- Liang, L.; Yuan, W.; Chen, X.; Liao, H. Flexible, nonflammable, highly conductive and high-safety double cross-linked poly(ionic liquid) as quasi-solid electrolyte for high performance lithium-ion batteries. Chem. Eng. 2021, 421, 130000. [Google Scholar] [CrossRef]
- Feng, X.; Ouyang, M.; Liu, X.; Lu, L.; Xia, Y.; He, X. Thermal runaway mechanism of lithium ion battery for electric vehicle: A review. Energy Storage Mater. 2018, 10, 246–267. [Google Scholar] [CrossRef]
- Tan, L.; Zhang, L.; Sun, Q.; Shen, M.; Qu, Q.; Zheng, H. Capacity loss induced by lithium deposition at graphite anode for LiFePO4/graphite cell cycling at different temperatures. Electrochim. Acta 2013, 111, 802–808. [Google Scholar] [CrossRef]
- Zhang, L.; Jiang, J.; Zhang, W. Capacity Decay Mechanism of the LCO+NMC532/Graphite Cells Combined with Post-Mortem Technique. Energies 2017, 10, 1147. [Google Scholar] [CrossRef]
- Li, N.; Yang, S.; Chen, H.; Jiao, S.; Song, W. Mechano-electrochemical perspectives on flexible lithium-ion batteries. Int. J. Miner. Metall. Mater. 2022, 29, 1019–1036. [Google Scholar] [CrossRef]
- Park, M.; Cha, H.; Lee, Y.; Hong, J.; Kim, S.Y.; Cho, J. Postpatterned Electrodes for Flexible Node-Type Lithium-Ion Batteries. Adv. Mater. 2017, 29, 1605773. [Google Scholar] [CrossRef] [PubMed]
- Qian, G.; Liao, X.; Zhu, Y.; Pan, F.; Chen, X.; Yang, Y. Designing flexible lithium-ion batteries by structural engineering. ACS Energy Lett. 2019, 4, 690–701. [Google Scholar] [CrossRef]
- Song, Z.; Ma, T.; Tang, R.; Cheng, Q.; Wang, X.; Krishnaraju, D.; Panat, R.; Chan, C.K.; Yu, H.; Jiang, H. Origami lithium-ion batteries. Nat. Commun. 2014, 5, 3140. [Google Scholar] [CrossRef]
- Gaikwad, A.M.; Khau, B.V.; Davies, G.; Hertzberg, B.; Steingart, D.A.; Arias, A.C. A high areal capacity flexible lithium-ion battery with a strain-compliant design. Adv. Energy Mater. 2015, 5, 1401389. [Google Scholar] [CrossRef]
- Li, H.; Tang, Z.; Liu, Z.; Zhi, C. Evaluating flexibility and wearability of flexible energy storage devices. Joule 2019, 3, 613–619. [Google Scholar] [CrossRef]
- Hiralal, P.; Imaizumi, S.; Unalan, H.E.; Matsumoto, H.; Minagawa, M.; Rouvala, M.; Tanioka., A.; Amaratunga, G.A.J. Nanomaterial-enhanced all-solid flexible zinc–carbon batteries. ACS Nano 2010, 4, 2730–2734. [Google Scholar] [CrossRef] [PubMed]
- Wang, L.; Chen, B.; Ma, J.; Cui, G.; Chen, L. Reviving lithium cobalt oxide-based lithium secondary batteries-toward a higher energy density. Chem. Soc. Rev. 2018, 47, 6505–6602. [Google Scholar] [CrossRef] [PubMed]
- Lee, S.M. In-situ Evaluation of Damage in Lithium Secondary Battery by Acoustic Emission Signal Analysis. Ph.D. Thesis, Seoul National University of Science and Technology, Seoul, Korea, 2017. [Google Scholar]
- Duffiet, M.; Blangero, M.; Cabelguen, P.E.; Delmas, C.; Carlier, D. Influence of the initial Li/Co ratio in LiCoO2 on the high-voltage phase-transitions mechanisms. J. Phys. Chem. Lett. 2018, 9, 5334–5338. [Google Scholar] [CrossRef] [PubMed]
- Li, R.; Ming, Y.; Xiang, W.; Xu, C.; Feng, G.; Li, Y.; Chen, Y.; Wu, Z.; Zhong, B.; Guo, X. Structure and electrochemical performance modulation of a LiNi0.8Co0.1Mn0.1O2 cathode material by anion and cation co-doping for lithium ion batteries. RSC Adv. 2019, 9, 36849–36857. [Google Scholar] [CrossRef]
- Yang, J.; Xia, Y. Suppressing the phase transition of the layered Ni-rich oxide cathode during high-voltage cycling by introducing low-content Li2MnO3. ACS Appl. Mater. Interfaces 2016, 8, 1297–1308. [Google Scholar] [CrossRef]
- Schweidler, S.; de Biasi, L.; Schiele, A.; Hartmann, P.; Brezesinski, T.; Janek, J. Volume changes of graphite anodes revisited: A combined operando X-ray diffraction and in situ pressure analysis study. J. Phys. Chem. C 2018, 122, 8829–8835. [Google Scholar] [CrossRef]
- Kim, J.Y.; Yoo, K.T.; Kim, D.O.; Lee, M.H.; Yang, W.J.; Byeon, J.W. Evaluation of health and safety of mechanically fatigued rechargeable lithium polymer batteries for flexible electronics applications. Microelectron. Reliab. 2019, 100–101, 113441. [Google Scholar] [CrossRef]
- Eshkenazi, V.; Peled, E.; Burstenin, L.; Golodnitsky, D. XPS analysis of the SEI formed on carbonaceous materials. Solid State Ionics 2004, 170, 83–91. [Google Scholar] [CrossRef]
- Inui, Y.; Hirayama, S.; Tanaka, T. Detailed estimation method of heat generation during charge/discharge in lithium-ion battery using equivalent circuit. Electron. Commun. Jpn. 2019, 102, 3–14. [Google Scholar] [CrossRef]
- Onda, K.; Nakayama, M.; Fukuda, K.; Wakahara, K.; Araki, T. Cell Impedance Measurement by Laplace Transformation of Charge and Discharge Current-Voltage. J. Electrochem. Soc. 2006, 153, A1012. [Google Scholar] [CrossRef]
- R-Smith, N.A.-Z.; Leitner, M.; Alic, I.; Toth, D.; Kasper, M.; Romio, M.; Surace, Y.; Jahn, M.; Kienberger, F.; Ebner, A.; et al. Assessment of lithium ion battery ageing by combined impedance spectroscopy, functional microscopy and finite element modelling. J. Power Sources 2021, 512, 230459. [Google Scholar] [CrossRef]
- Ogihara, N.; Itou, Y.; Sasaki, T.; Takeuchi, Y. Impedance Spectroscopy Characterization of Porous Electrodes under Different Electrode Thickness Using a Symmetric Cell for High-Performance Lithium-Ion Batteries. J. Phys. Chem. C 2015, 119, 4612–4619. [Google Scholar] [CrossRef]
- Nie, K.; Hong, Y.; Qiu, J.; Li, Q.; Yu, X.; Li, H.; Chen, L. Interfaces Between Cathode and Electrolyte in Solid State Lithium Batteries: Challenges and Perspectives. Front. Chem. 2018, 6, 616. [Google Scholar] [CrossRef] [PubMed]
- Cruz-Manzo, S.; Greenwood, P. An impedance model based on a transmission line circuit and a frequency dispersion Warburg component for the study of EIS in Li-ion batteries. J. Electroanal. Chem. 2020, 871, 114305. [Google Scholar] [CrossRef]
- Osaka, T.; Momma, T.; Mukoyama, D.; Nara, H. Proposal of novel equivalent circuit for electrochemical impedance analysis of commercially available lithium ion battery. J. Power Sources 2012, 205, 483–486. [Google Scholar] [CrossRef]
- Westerhoff, U.; Kurbach, K.; Lienesch, F.; Kurrat, M. Analysis of Lithium-Ion Battery Models Based on Electrochemical Impedance Spectroscopy. Energy Technol. 2016, 4, 1620–1630. [Google Scholar] [CrossRef]
- Jianchao, C.; Tao, S.; Yue, Q.; Xiaodong, L. A Coupled Penetration-Tension Method for Evaluating the Reliability of Battery Separator. ECS Electrochem. Lett. 2014, 3, A41–A44. [Google Scholar] [CrossRef]
- Fennell, E.; Leszczynski, S.; Kamphus, J.; Huyghea, J.M. A strain induced softening and hardening constitutive model for superabsorbent polymers undergoing finite deformation. Int. J. Eng. Sci. 2020, 154, 103346. [Google Scholar] [CrossRef]


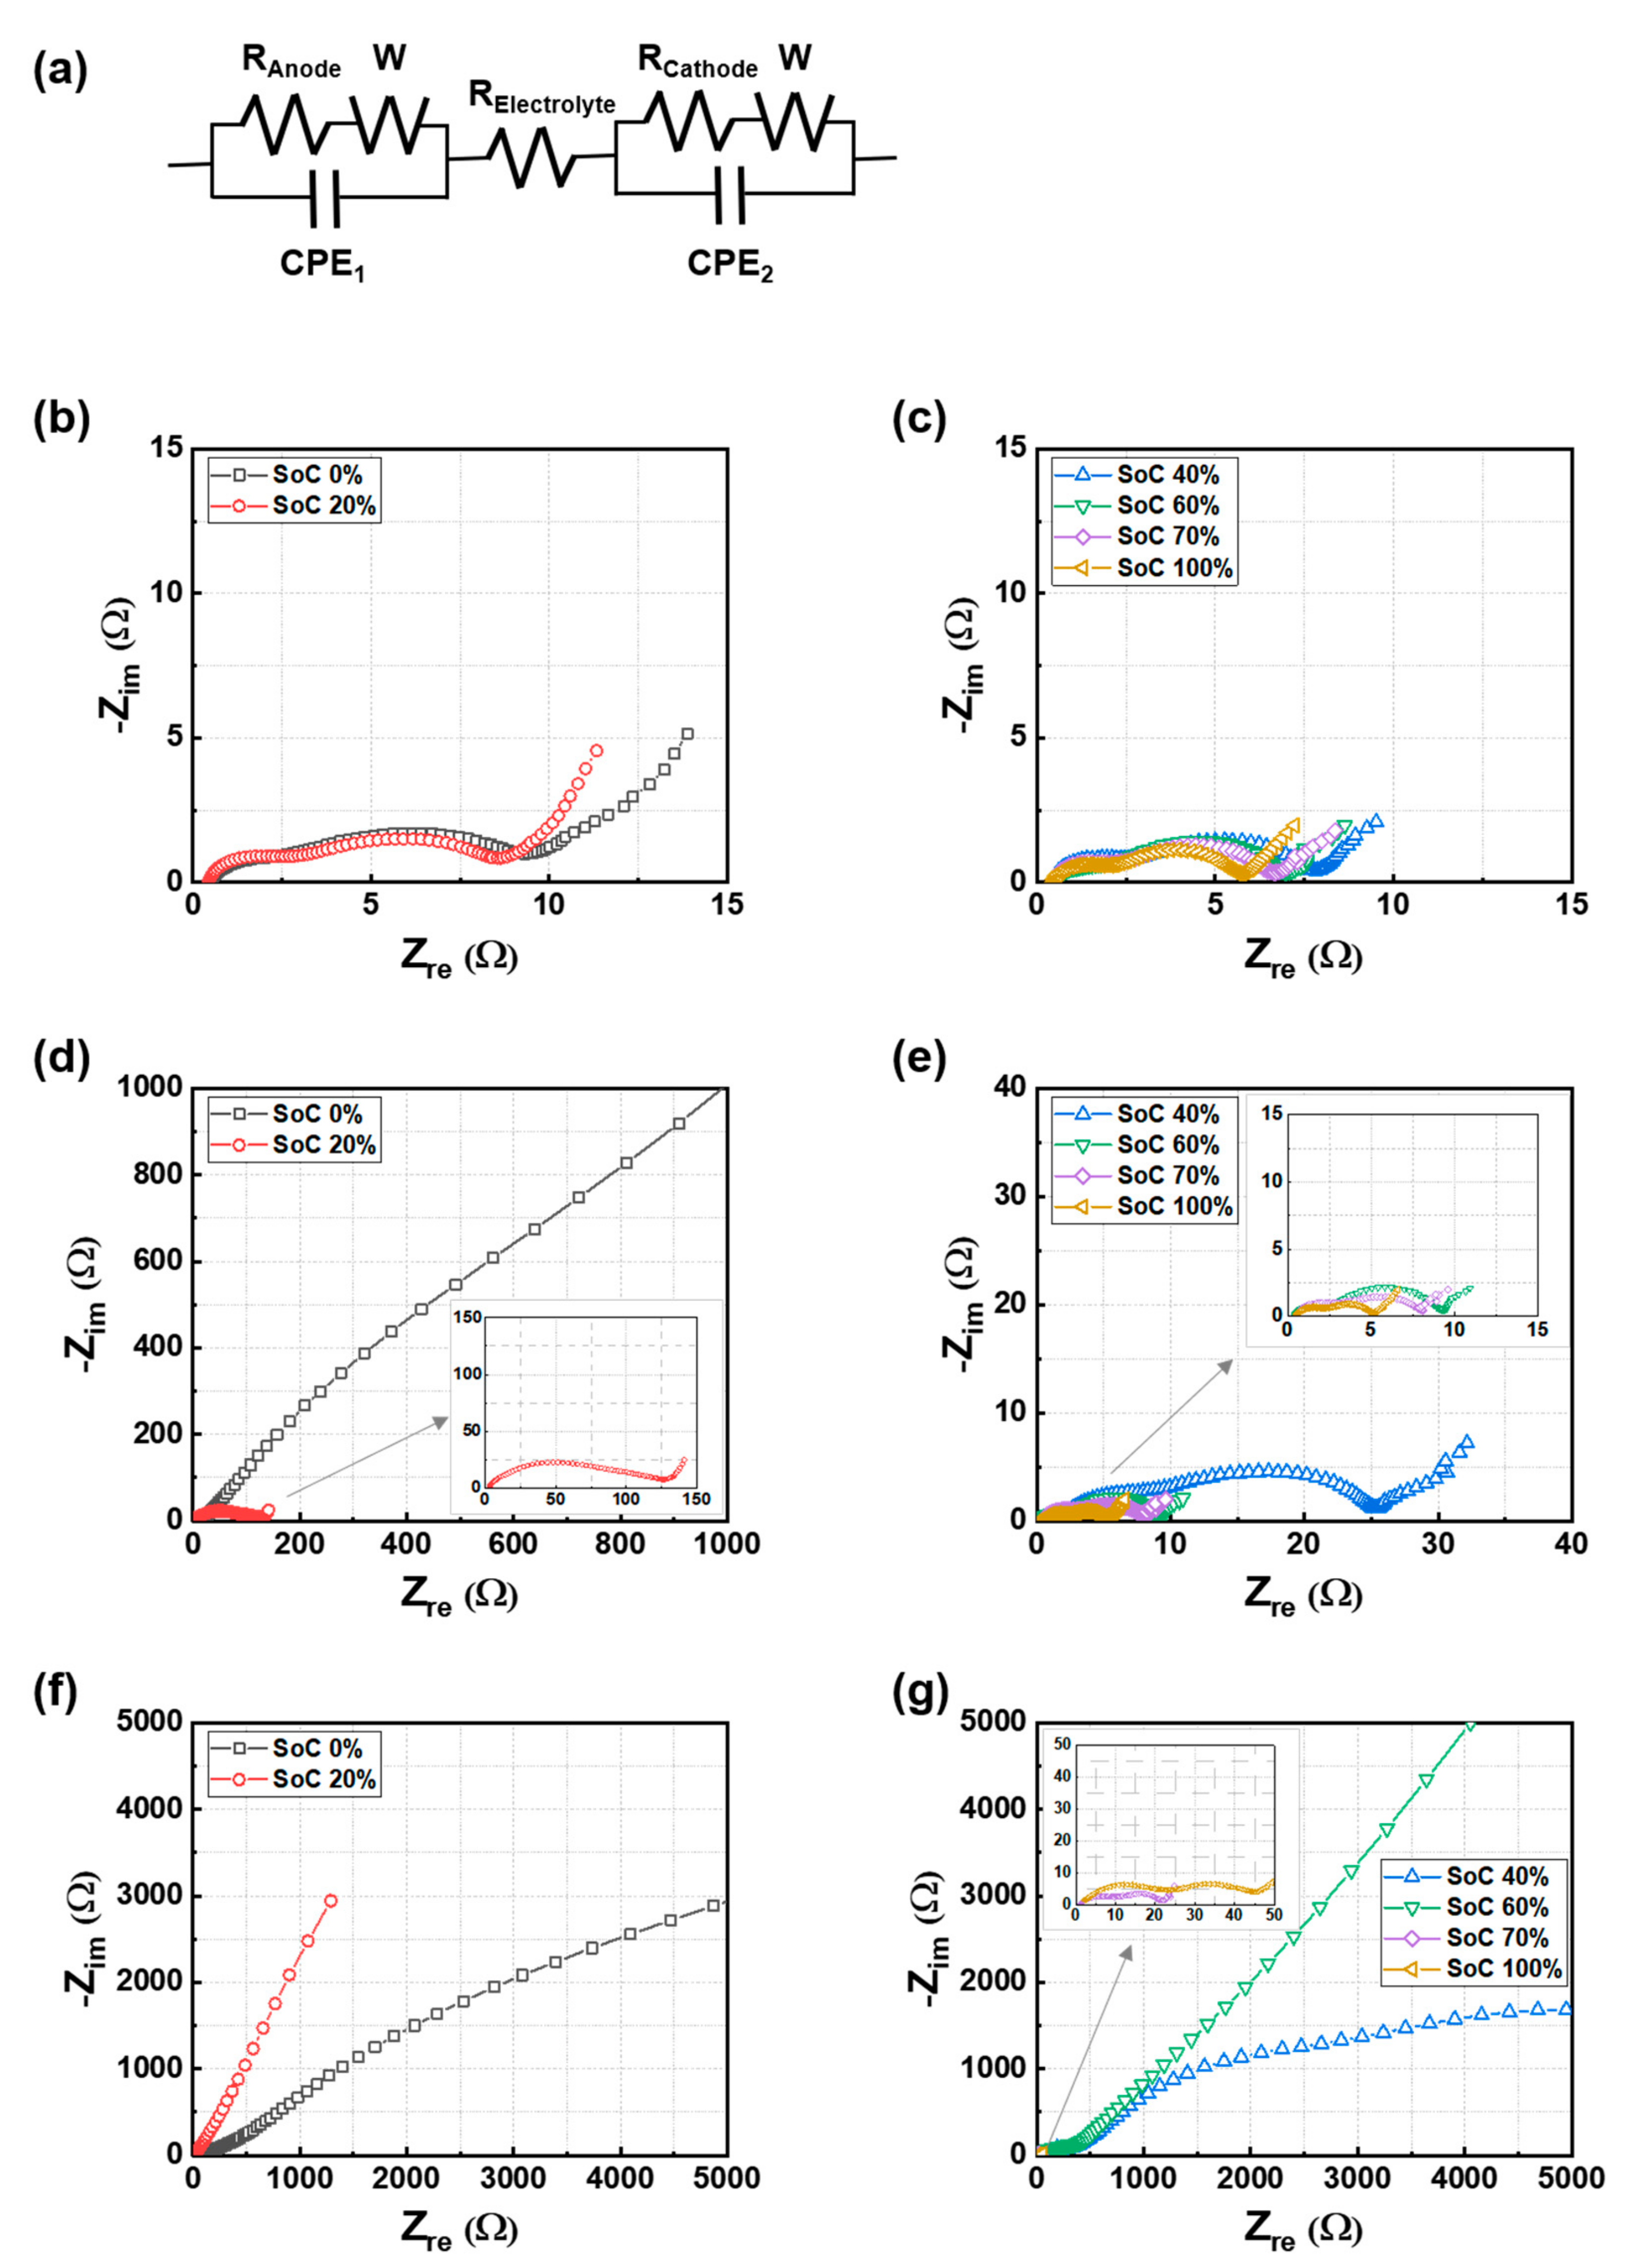
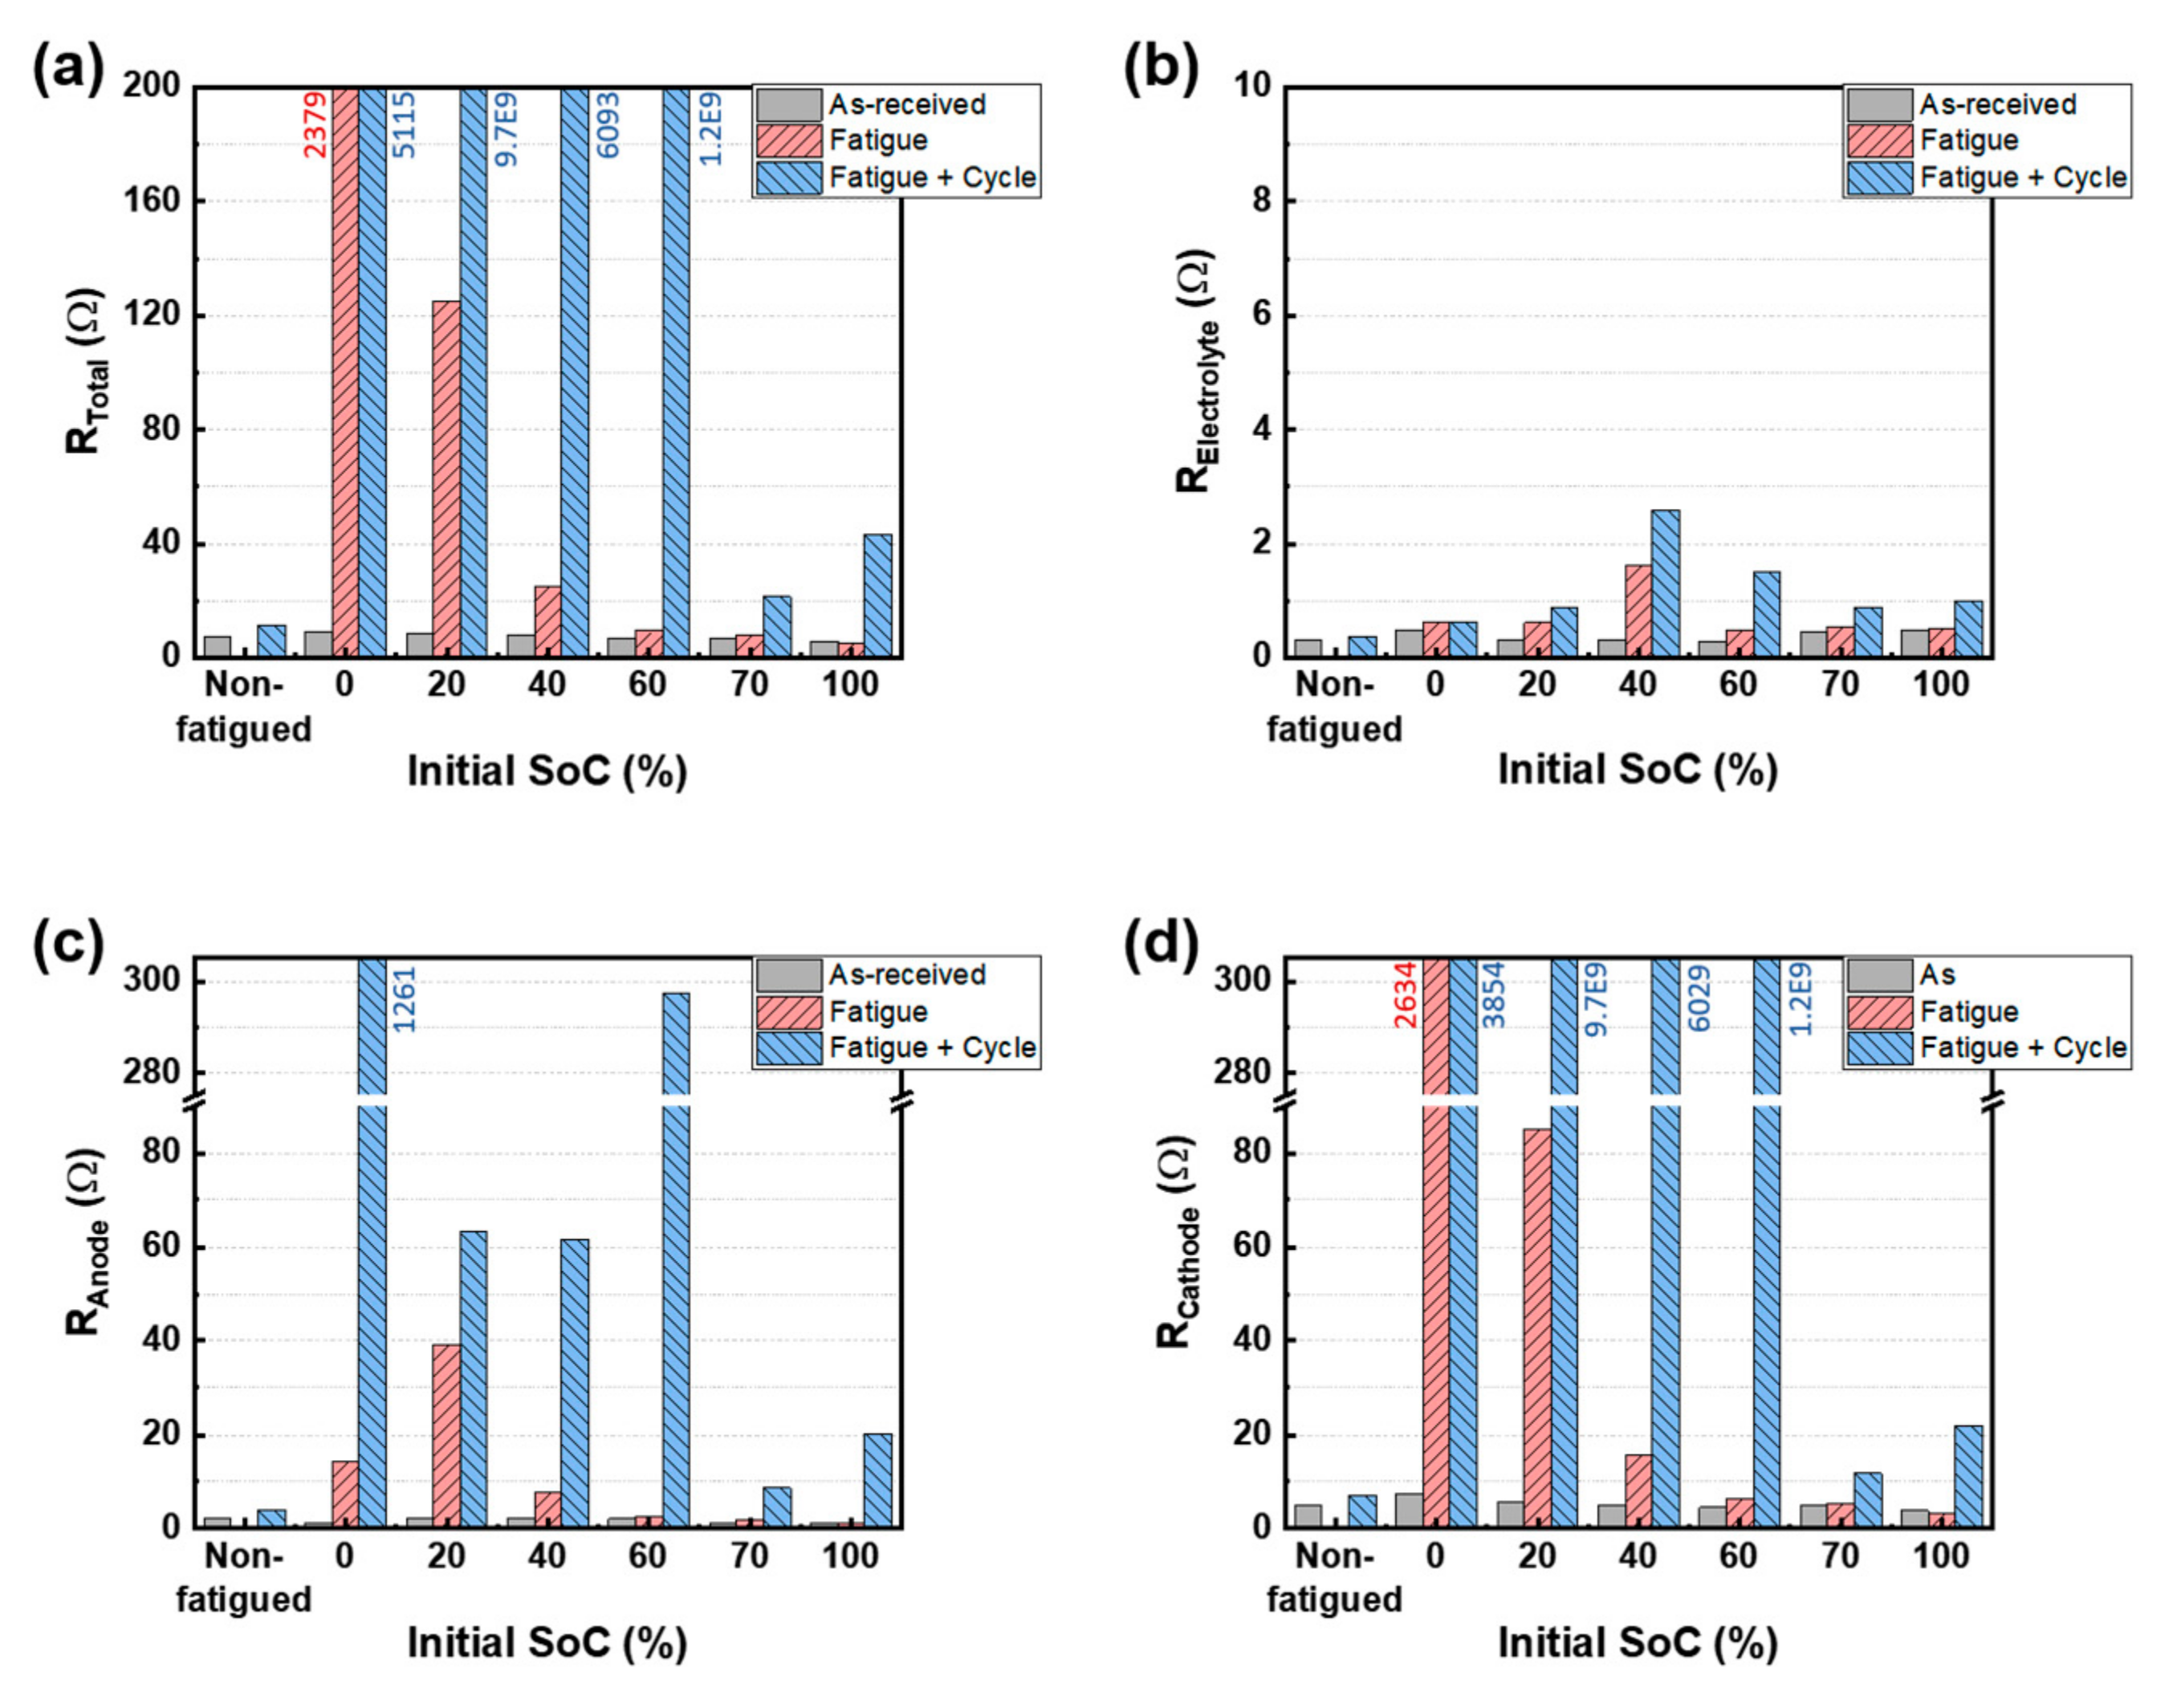
| Cell | Test Conditions | RE | RA | RC | RTotal |
|---|---|---|---|---|---|
| Without Fatigue | As-received | 0.323 | 2.202 | 4.857 | 7.382 |
| After cycling test | 0.370 | 3.954 | 7.046 | 11.37 | |
| SoC 0% | As-received | 0.489 | 1.347 | 7.466 | 9.302 |
| After fatigue test | 0.616 | 14.41 | 2364 | 2379 | |
| After fatigue and cycling test | 0.624 | 1261 | 3854 | 5115 | |
| SoC 20% | As-received | 0.309 | 2.377 | 5.673 | 8.359 |
| After fatigue test | 0.610 | 39.16 | 85.12 | 124.89 | |
| After fatigue and cycling test | 0.882 | 6.315 | 9.7 × 10⁹ | 9.7 × 10⁹ | |
| SoC 40% | As-received | 0.309 | 2.371 | 4.953 | 7.633 |
| After fatigue test | 1.609 | 7.774 | 15.74 | 25.12 | |
| After fatigue and cycling test | 2.579 | 61.67 | 6029 | 6093 | |
| SoC 60% | As-received | 0.284 | 2.071 | 4.485 | 6.840 |
| After fatigue test | 0.472 | 2.562 | 6.378 | 9.412 | |
| After fatigue and cycling test | 1.489 | 297.5 | 1.2 × 10⁹ | 1.2 × 10⁹ | |
| SoC 70% | As-received | 0.464 | 1.346 | 4.794 | 6.604 |
| After fatigue test | 0.543 | 1.965 | 5.338 | 7.846 | |
| After fatigue and cycling test | 0.891 | 8.744 | 11.80 | 21.44 | |
| SoC 100% | As-received | 0.477 | 1.251 | 3.850 | 5.578 |
| After fatigue test | 0.521 | 1.195 | 3.234 | 4.950 | |
| After fatigue and cycling test | 0.986 | 20.27 | 21.84 | 43.09 |
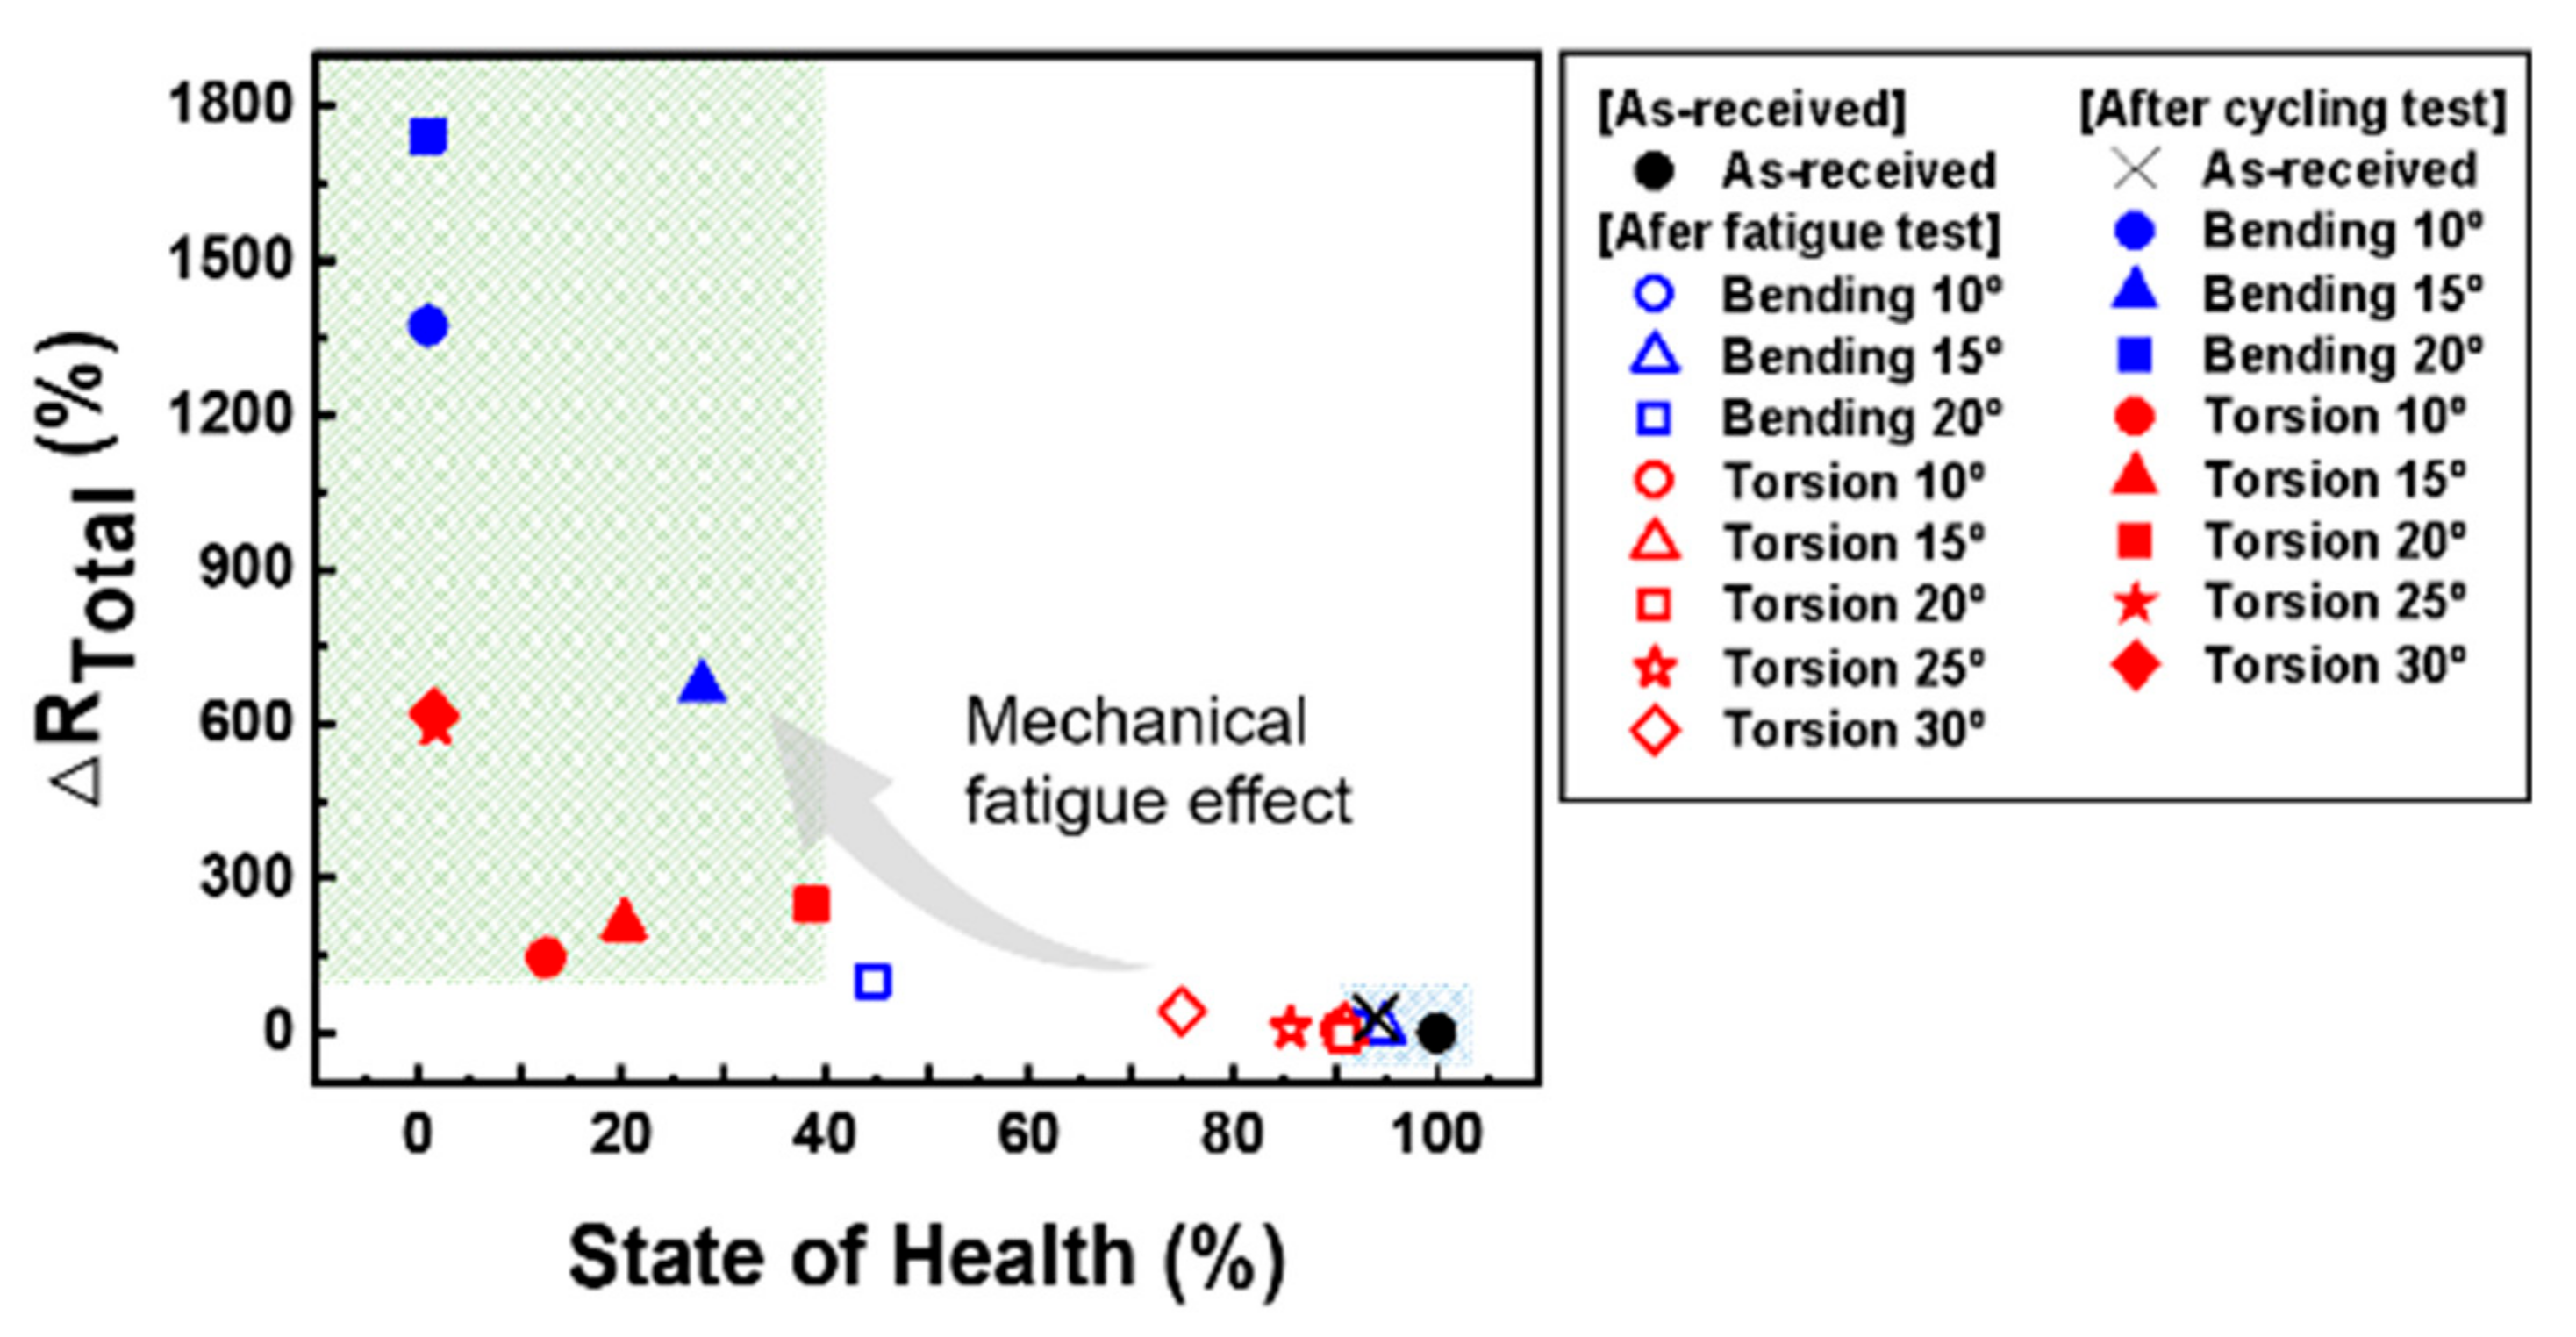
| SoC | Lithiation State | Damage Levels | Mainly Damaged Part (Underlying Damage Mechanism) | |
|---|---|---|---|---|
| Cathode | Anode | |||
| Low SoC | Highly lithiate | Highly delithiate | Most severe | Cathode electrode (Physical failure or accelerated electrochemical degradation) |
| Moderate SoC | Moderately lithiate | Moderately lithiate | Moderate | Cathode and anode electrode (Accelerated electrochemical degradation) |
| High SoC | Highly delithiate | Highly lithiate | Severe | |
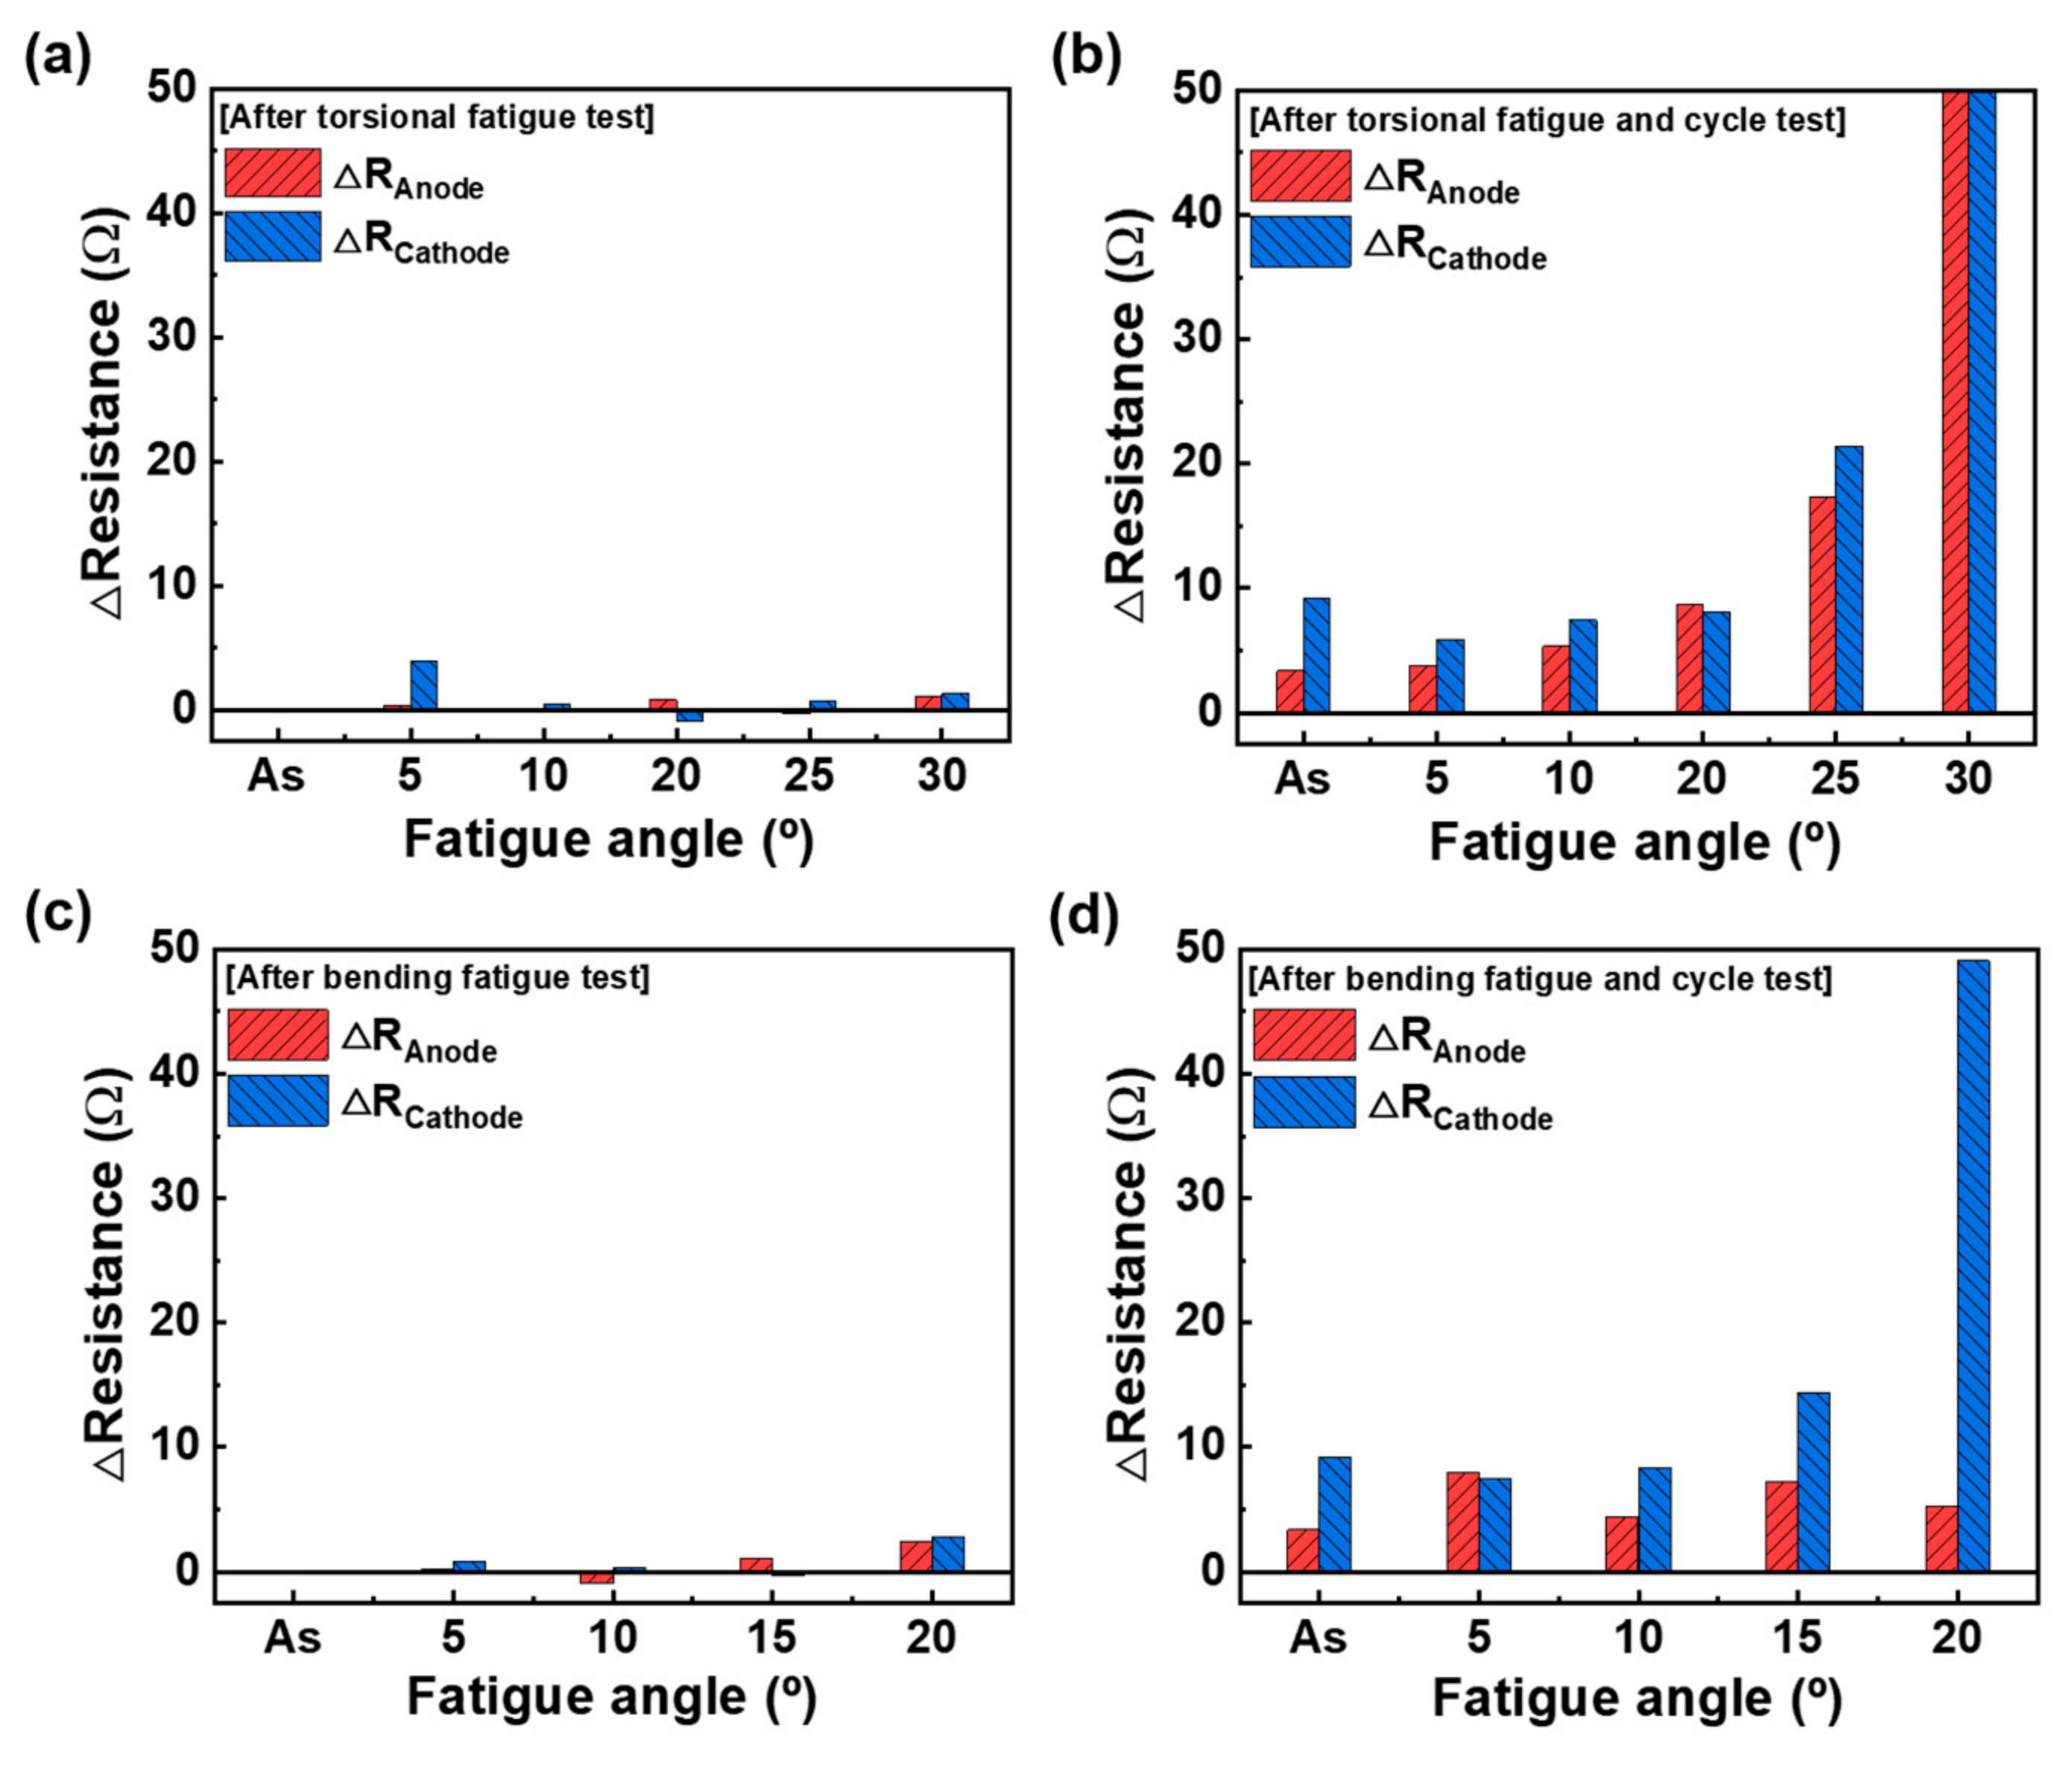
| Fatigue Angle | ∆Resistance | |||
|---|---|---|---|---|
| ∆RE | ∆RA | ∆RC | ∆RTotal | |
| As-received | 0.34 | 3.34 | 9.20 | 12.9 |
| 5 | 0.24 | 3.80 | 5.90 | 9.94 |
| 10 | 0.85 | 5.34 | 7.41 | 13.6 |
| 20 | 0.21 | 8.67 | 8.07 | 17.0 |
| 25 | 2.96 | 17.3 | 21.4 | 41.7 |
| 30 | 0.68 | 260 | 102,000 | 102,260 |
| Fatigue Angle | ∆Resistance | |||
|---|---|---|---|---|
| ∆RE | ∆RA | ∆RC | ∆RTotal | |
| As-received | 0.34 | 3.34 | 9.20 | 12.9 |
| 5 | 0.71 | 8.01 | 7.51 | 16.2 |
| 10 | 0.27 | 4.37 | 8.33 | 13.0 |
| 15 | 1.01 | 7.19 | 14.4 | 22.6 |
| 20 | 4.01 | 5.20 | 49.7 | 58.9 |
Publisher’s Note: MDPI stays neutral with regard to jurisdictional claims in published maps and institutional affiliations. |
© 2022 by the authors. Licensee MDPI, Basel, Switzerland. This article is an open access article distributed under the terms and conditions of the Creative Commons Attribution (CC BY) license (https://creativecommons.org/licenses/by/4.0/).
Share and Cite
Kim, J.-Y.; Kim, J.-Y.; Kim, Y.-J.; Lee, J.; Cho, K.-K.; Kim, J.-H.; Byeon, J.-W. Influence of Mechanical Fatigue at Different States of Charge on Pouch-Type Li-Ion Batteries. Materials 2022, 15, 5557. https://doi.org/10.3390/ma15165557
Kim J-Y, Kim J-Y, Kim Y-J, Lee J, Cho K-K, Kim J-H, Byeon J-W. Influence of Mechanical Fatigue at Different States of Charge on Pouch-Type Li-Ion Batteries. Materials. 2022; 15(16):5557. https://doi.org/10.3390/ma15165557
Chicago/Turabian StyleKim, Jin-Yeong, Jae-Yeon Kim, Yu-Jin Kim, Jaeheon Lee, Kwon-Koo Cho, Jae-Hun Kim, and Jai-Won Byeon. 2022. "Influence of Mechanical Fatigue at Different States of Charge on Pouch-Type Li-Ion Batteries" Materials 15, no. 16: 5557. https://doi.org/10.3390/ma15165557
APA StyleKim, J.-Y., Kim, J.-Y., Kim, Y.-J., Lee, J., Cho, K.-K., Kim, J.-H., & Byeon, J.-W. (2022). Influence of Mechanical Fatigue at Different States of Charge on Pouch-Type Li-Ion Batteries. Materials, 15(16), 5557. https://doi.org/10.3390/ma15165557