Article

Silica- Iron Oxide Nanocomposite Enhanced with Porogen Agent Used for Arsenic Removal

1
Faculty of Industrial Chemistry and Environmental Engineering, Polytechnic University of Timişoara, Victoriei Square, No. 2, 300006 Timisoara, Romania
2
National Institute for Research and Development in Electrochemistry and Condensed Matter, 144th Dr. A. P. Podeanu Street, 300569 Timisoara, Romania
3
Coriolan Drăgulescu’ Institute of Chemistry, Bv. Mihai Viteazul, No. 24, 300223 Timisoara, Romania
*
Authors to whom correspondence should be addressed.
Materials 2022, 15(15), 5366; https://doi.org/10.3390/ma15155366
Submission received: 28 June 2022 / Revised: 26 July 2022 / Accepted: 28 July 2022 / Published: 4 August 2022
(This article belongs to the Special Issue Adsorption and Desorption Behavior for Rare Earth Metal Ions)

Abstract

:
This study aims to remove arsenic from an aqueous medium by adsorption on a nanocomposite material obtained by the sol–gel method starting from matrices of silica, iron oxide and NaF (SiO2/Fe(acac)3/NaF). Initially, the study focused on the synthesis and characterization of the material by physico–chemical methods such as: X-ray diffraction, FT-IR spectroscopy, Raman spectroscopy, atomic force microscopy, and magnetization. Textural properties were obtained using nitrogen adsorption/desorption measurements. The zero load point, pHpZc, was also determined by the method of bringing the studied system into equilibrium. In addition, this study also provides a comprehensive discussion of the mechanism of arsenic adsorption by conducting kinetic, thermodynamic and equilibrium studies. Studies have been performed to determine the effects of adsorbent dose, pH and initial concentration of arsenic solution, material/arsenic contact time and temperature on adsorption capacity and material efficiency. Three theoretical adsorption isotherms were used, namely Langmuir, Freundlich and Sips, to describe the experimental results. The Sips isotherm was found to best describe the experimental data obtained, the maximum adsorption capacity being ~575 µg As(III)/g. The adsorption process was best described by pseudo-second order kinetics. Studies have been performed at different pH values to establish not only the optimal pH at which the adsorption capacity is maximum, but also which is the predominantly adsorbed species. The effect of pH and desorption studies have shown that ion exchange and the physiosorption mechanism are implicated in the adsorption process. From a thermodynamic point of view, parameters such as ΔG°, ΔH° and ΔS° were evaluated to establish the mechanism of the adsorption process. Desorption studies have been performed to determine the efficiency of the material and it has been shown that the material can be used successfully to treat a real-world example of deep water with a high arsenic content.

1. Introduction

Water is vital to human existence [1,2]. Arsenic it is a metalloid that naturally occurs in soil, and is one of the most dangerous elements from the natural environment [3]. Usually, arsenite ( AsO 3 3 ) is much more dangerous than arsenate ( AsO 4 3 ). This element can be turned into different sulfur-containing ores, where it is merged with nickel, copper, cobalt, lead and other metals. Because of their relatively high solubility, arsenic and its derivatives are portable in the global environment [4]. Theresence of arsenic in water, especially in groundwater, was recognized decades ago as a significant problem. The safety risks and higher toxicology associated with arsenic presence in water were identified decades ago [5]. Arsenic in the natural environment has both anthropogenic and natural origins [6]. Due to anthropogenic activities, arsenic contamination has been widely recognized as one of the most significant impacts on the environment. Arsenic toxicity is the focus of many institutions, including industry, environmental agencies, and the general public. The elimination of arsenic has an indisputable significance for flora and fauna, for humanity, but also for ecosystem life overall.
The development of new drugs for serious diseases involves the usage of arsenic derivatives for most conventional medicines, for example, promyelocytic leukemia has been controlled by the use of arsenic trioxide. After ingestion, arsenic absorption occurs mainly at the intestinal tract level, while a limited penetration occurs as a result of rupture of the skin and inhalation [7]. Exposure to arsenic by inhalation, in addition to causing lung discomfort, vomiting and skin damage, is responsible for various conditions such as digestive discomfort, neuropathic pain, anemia, arterial damage and various forms of cancer—lung, skin, kidney, liver and bladder [8]. In case of poisoning, arsenic presence can damage and affect the internal organs of the body, and especially the skin, as well as affecting the body’s immunity [9]. Arsenic can enter the human body through inhalation, ingestion or dermal exposure. It is scattered throughout the body in a variety of glands, the liver, kidneys, lungs and skin [10,11].
In regions with intense industrial production, the air represents a major source of arsenic poisoning [12]. It is recognized that low levels of arsenic in drinking water produce substantial harmful effects, emphasizing the relevance of arsenic removal. New water quality legislation under the European Environment Protection Agency is stricter and includes a reduction in the concentration of arsenic in drinking water down from 50 ppb to 10 ppb [13].
The natural arsenic pollution of groundwater occurs in different areas: in indoor or closed basins, in sparsely populated regions or quasi-regions, and groundwater-containing alluvial deposits [14].
During the last decades, numerous techniques and processes able to remove arsenic from the environment have been developed and presented. Some of them are adsorption processes, electrocoagulation, nanoredimediation, ion exchange, electrokinetic processes, phytoremediation, membrane technology, chemical precipitation coagulation, precipitation and flocculation, bioremediation, ozone oxidation, electrochemical treatments and phytobial remediation [5,15,16,17,18,19,20,21,22].
Adsorption represents a valuable method able to reduce the amount of aqueous contamination with arsenic in the environment [1,23]. While activated charcoal is a cheap, long-lasting, environmentally safe adsorbent with a high ability to remove harmful elements from water, including arsenic [24,25,26], outstanding results have been recorded using nanoadsorbents [27,28,29], materials based on TiO2 or iron oxides [30]. Arsenic removal from polluted water often uses nanozerovalent iron that can be coupled with many other techniques such as Fenton and/or other methods, although more specific studies on the immobilization function as well as several technological advances still need to be carried [31]. Unlike classical adsorbent materials, new innovatively produced materials such as metal organic frameworks, nanotubes, graphene oxide and various other synthetic materials, represent a very good alternative for the efficient removal of both As(V) and As(III) ions, determined by very good partition coefficient and by an improved reuse and recycling [32,33]. Some attractive materials used as adsorbents for the recovery of arsenic-contaminated water are represented by hydrothalcites [34].
The aim of this study is to remove arsenic from the aqueous medium by adsorption on a nanocomposite material obtained by the sol–gel method starting from silica, iron oxide and NaF-(SiO2/Fe(acac)3/NaF). Nanoparticles are of great interest since they can be utilized in multiple application. Beside their properties, Fe-based nanoparticles are affordable and stable under extreme conditions and exhibit a polar surface, which is also the main reason for its applicability in catalysis, data storage devices and environmental remediation [35,36,37,38]. The applications regarding the arsenic absorption are successfully achieved due to their surface area and porosity, which can be manipulated by the synthesis parameters. To our knowledge, the present material has not been studied so far in this combination, highlighting the novelty of the research and as well as their potential in adsorption.

2. Materials and Methods

2.1. Synthesis and Characterization Material SiO2/Fe(acac)3/NaF

To obtain the nanocomposite (SiO2/Fe(acac)3/NaF), sol–gel method was used. Thus: (i) a first solution of Fe(acac)3 is obtained by dissolving 4 g of Fe(III) acetylacetonate (Sigma–Aldrich, St. Louis, MO, USA) in 50 mL methanol (Chimopar, SC CHIMOPAR TRADING SRL, București, Romania) by mechanical stirring at 50 °C for 30 min; (ii) the second solution is obtained by dissolving in 10 mL of distilled water the silica precursor, 10 mL of tetraethyl-orthosilicate-TEOS, Si(OC2H5)4, (Sigma–Aldrich). The second solution was introduced over solution 1. It was mixed for 2 h at 50 °C at 400 rpm with the addition of a mixture of 0.5 g of sodium fluoride, NaF (Sigma–Aldrich), the gelling material was released as a release agent. After a week of aging process, crystals formed in the form of needles. The material has been dried at 100 °C for 24 h, and further heat treated at 200 °C. To provide information about the structural fingerprint by which the molecules of the material can be identified, the Raman spectrum was made using the Shamrock 500i Spectrograph (Andor, Belfast, UK) at room temperature using laser excitation at 514 nm. At the same time, the material was characterized by Fourier transform infrared spectroscopy, FT-IR, of JASCO FT/IR-4200 apparatus (SpectraLab, Shimadzu, Kyoto, Japan).
The material was also analyzed by atomic force microscopy (AFM). AFM images were obtained by using Scanning probe microscopy platform (MultiView-2000 system, Nanonics Imaging Ltd., Jerusalem, Israel), at room temperature (298 K), in normal conditions, using system intermittent mode. The analysis used a chromium doped tip with a 20 nm radius and 30–40 kHz resonance. Further, in order to highlight material morphology and to prove the compound formation, new prepared adsorbent material was characterized by scanning electron microscopy (SEM) coupled with energy dispersive X-ray spectroscopy (EDX) using a FEI Quanta FEG 250 scanning electron microscope.
The zero-load charge, pZc, has been determined by bringing the studied adsorbent system into equilibrium. In this case, 0.1 g of SiO2/Fe(acac)3/NaF material was mixed with 25 mL of 0.1 N KCl solution at 200 rpm and a temperature of 298 K, using a Julabo SW23 thermostated and stirred water bath. The pH of the KCl solutions was adjusted in the range of 2–12, using NaOH solutions with a concentration of between 0.05 N and 2 N or HNO3 solutions with a concentration of between 0.05 N and 2 N. Further, each sample was filtered and subsequently resulting solution pH was determined using a pH meter of the METTLER TOLEDO, Seven Compact, S 210 type.

2.2. Arsenic Adsorption Studies

In the present paper, the influence of the solution pH on the adsorption process of As(III) on SiO2/Fe(acac)3/NaF synthesized material, varying the pH, in the range 2–14, was determined. Thus, 0.1 g of material was contacted for 60 min at 298 K with a 25 mL solution of As(III) (As2O3, Fluka, pa, ≥99.5%) of initial concentration, C0 = 100 µg As(III)/L. During these experiments, the pH has been adjusted using HNO3 and NaOH solutions with concentrations in the range of 0.1–1 N, obtained by diluting 63% HNO3 (Carl Roth) and NaOH, pellets (Sigma–Aldrich, pa, ≥99.5%).
In order to determine the influence of contact time and temperature on the adsorption capacity of SiO2/Fe(acac)3/NaF synthesized material, 0.1 g of material was accurately weighed, and to which 25 mL of As(III) solution of initial concentration 100 µg/L was added. The samples were stirred and thermostated for different time periods (15, 30, 45, 60 and 90 min) in a water bath, and at different temperatures (298 K, 308 K, 318 K and 328 K), at 200 rpm.
To determine the effect of the initial concentration of As(III) on the adsorption capacity of the material SiO2/Fe(acac)3/NaF, solutions of As(III) concentrations of 100, 200, 400, 800, 1000, 2000, 3000 and 5000 µg/L were prepared. Working concentrations were obtained from a stock solution of As2O3 (1000 mg/L) by appropriate dilution. Adsorption studies were performed at a temperature of 298 K for 60 min, by keeping the solution pH between 7 and 8. As(III) residual concentration was measured using the graphite furnace atomic absorption spectrophotometer, AA 6800, Schimadzu (Kyoto, Japan).
In all the experiments, adsorption capacity of the used sorbent, q (mg g−1), has been determined by using the following equation:
q = ( C 0 C f ) V m
where: C0—initial concentration of As(III) from solution, (mg L−1); Cf—residual concentration of As(III) from solution, (mg L−1); V—volume solution, (L); m—adsorbent mass, (g).

2.3. Arsenic Desorption Studies

To determine the efficiency of the SiO2/Fe(acac)3/NaF material, regeneration studies were performed. Thus, 1 g of depleted material, following the process of adsorption of As(III), was stirred with 25 mL of 5% HCl. Residual As(III) concentration was measured using the graphite furnace atomic absorption spectrophotometer, AA 6800, Schimadzu.

2.4. Arsenic Removal from Real Ground Water

Starting from the adsorbent performance of the studied material, studies were performed on the removal of arsenic from real water in a static regime, using 2 g of SiO2/Fe(acac)3/NaF over which a sample of real water was passed. Real water used during present study have the composition presented in Table 1. The following parameters are established according to the standardized methods, specific to the determination of the drinking water quality. Ca2+, Mg2+, Na+, K+, Fen+ and Mnn+ were determined by atomic absorption spectrometry using the Varian Spectra AAS 280 FS spectrometer. NH 4 + , NO 2 , NO 3 , SO 4 2 ions were determined by UV-Vis spectroscopy using the Varian Carry 50 spectrophotometer. The As(III) concentration was determined using the graphite furnace atomic absorption spectrophotometer, AA 6800, Schimadzu.

3. Results and Discussion

3.1. Synthesis and Characterization Material SiO2/Fe(acac)3/NaF

X-ray Diffractogram

The X-ray diffractogram is shown in Figure 1.
Analyzing the data presented in Figure 1 demonstrates the presence of three different phases. Peaks observed at 38, 53 and 70 degrees are specific for NaF phase (reference code 00-001-1184). Peaks located at 32, 38, 45, 52, 63 are specific to the maghemite phase [39]. From comparisons with the literature [39], it can be observed that the specific peaks for the maghemite are slightly shifted to smaller angles. In order calculate the crystallite size was used the Scherrer equation, and for new synthesized SiO2/Fe(acac)3/NaF compound was founded that the mean crystallite size is 36 nm. The result indicates that the doping of materials with different ions metals influence the structure.

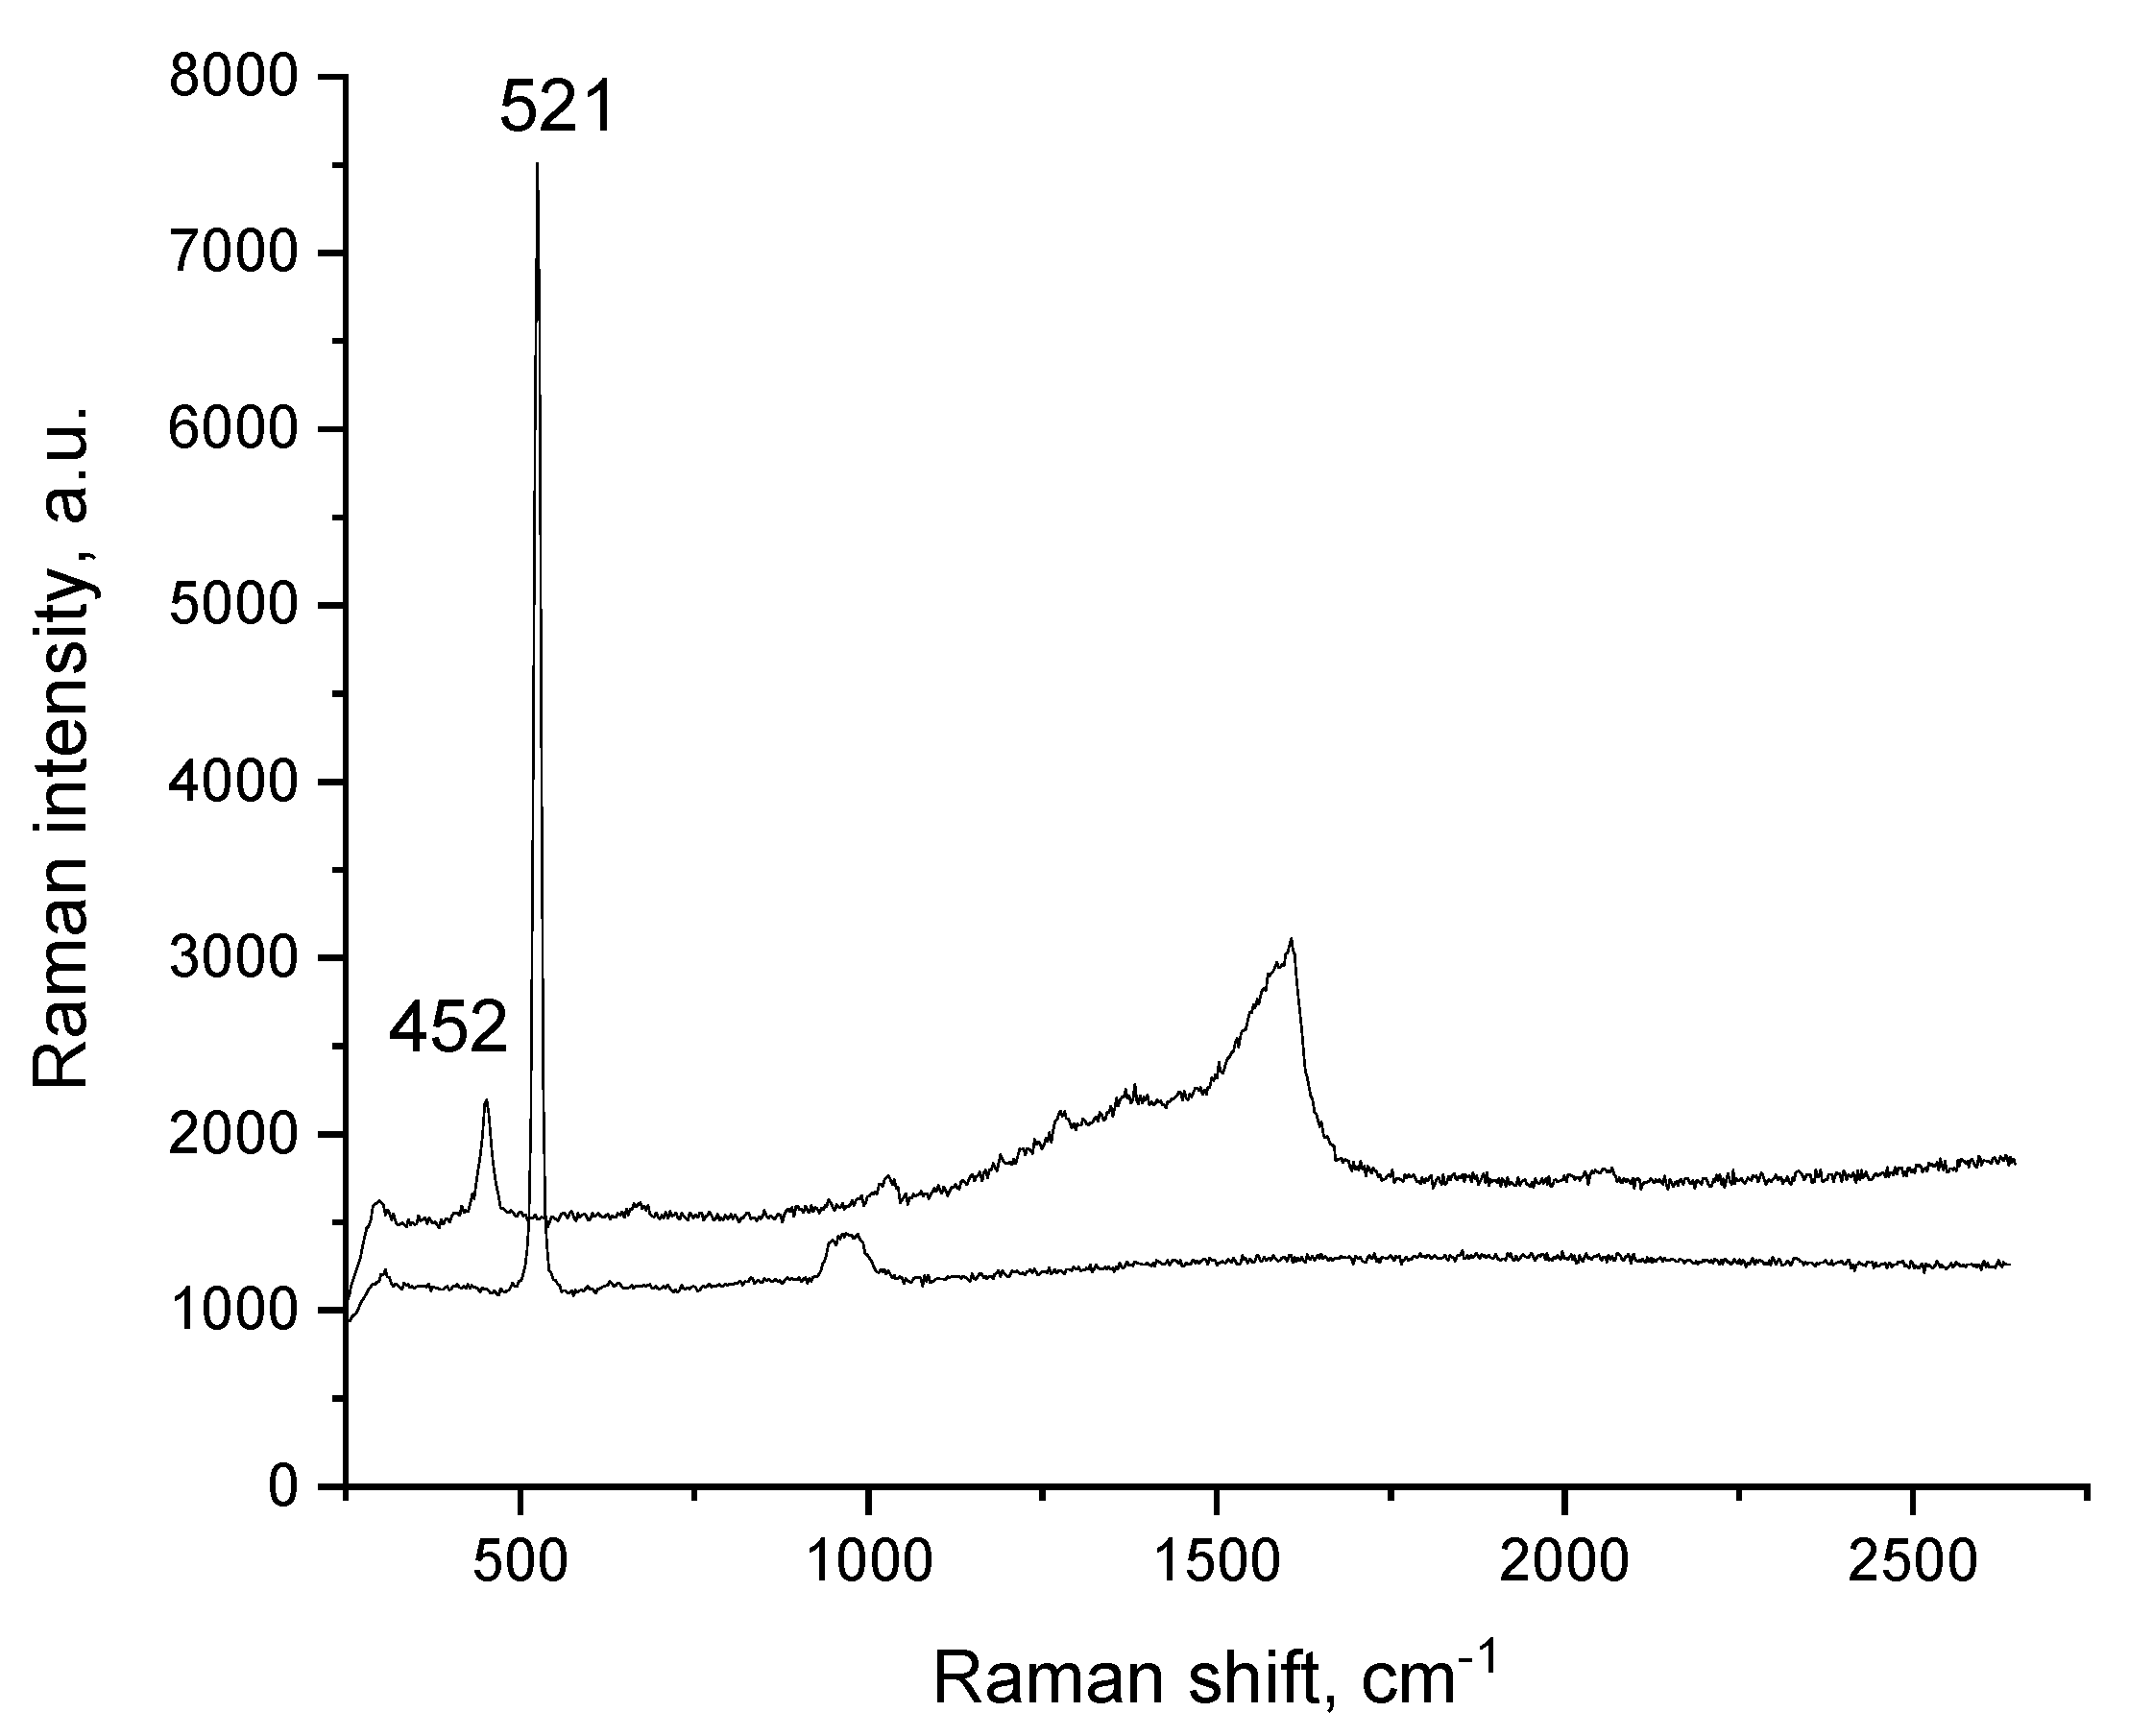
3.2. Raman and Infrared Spectroscopy
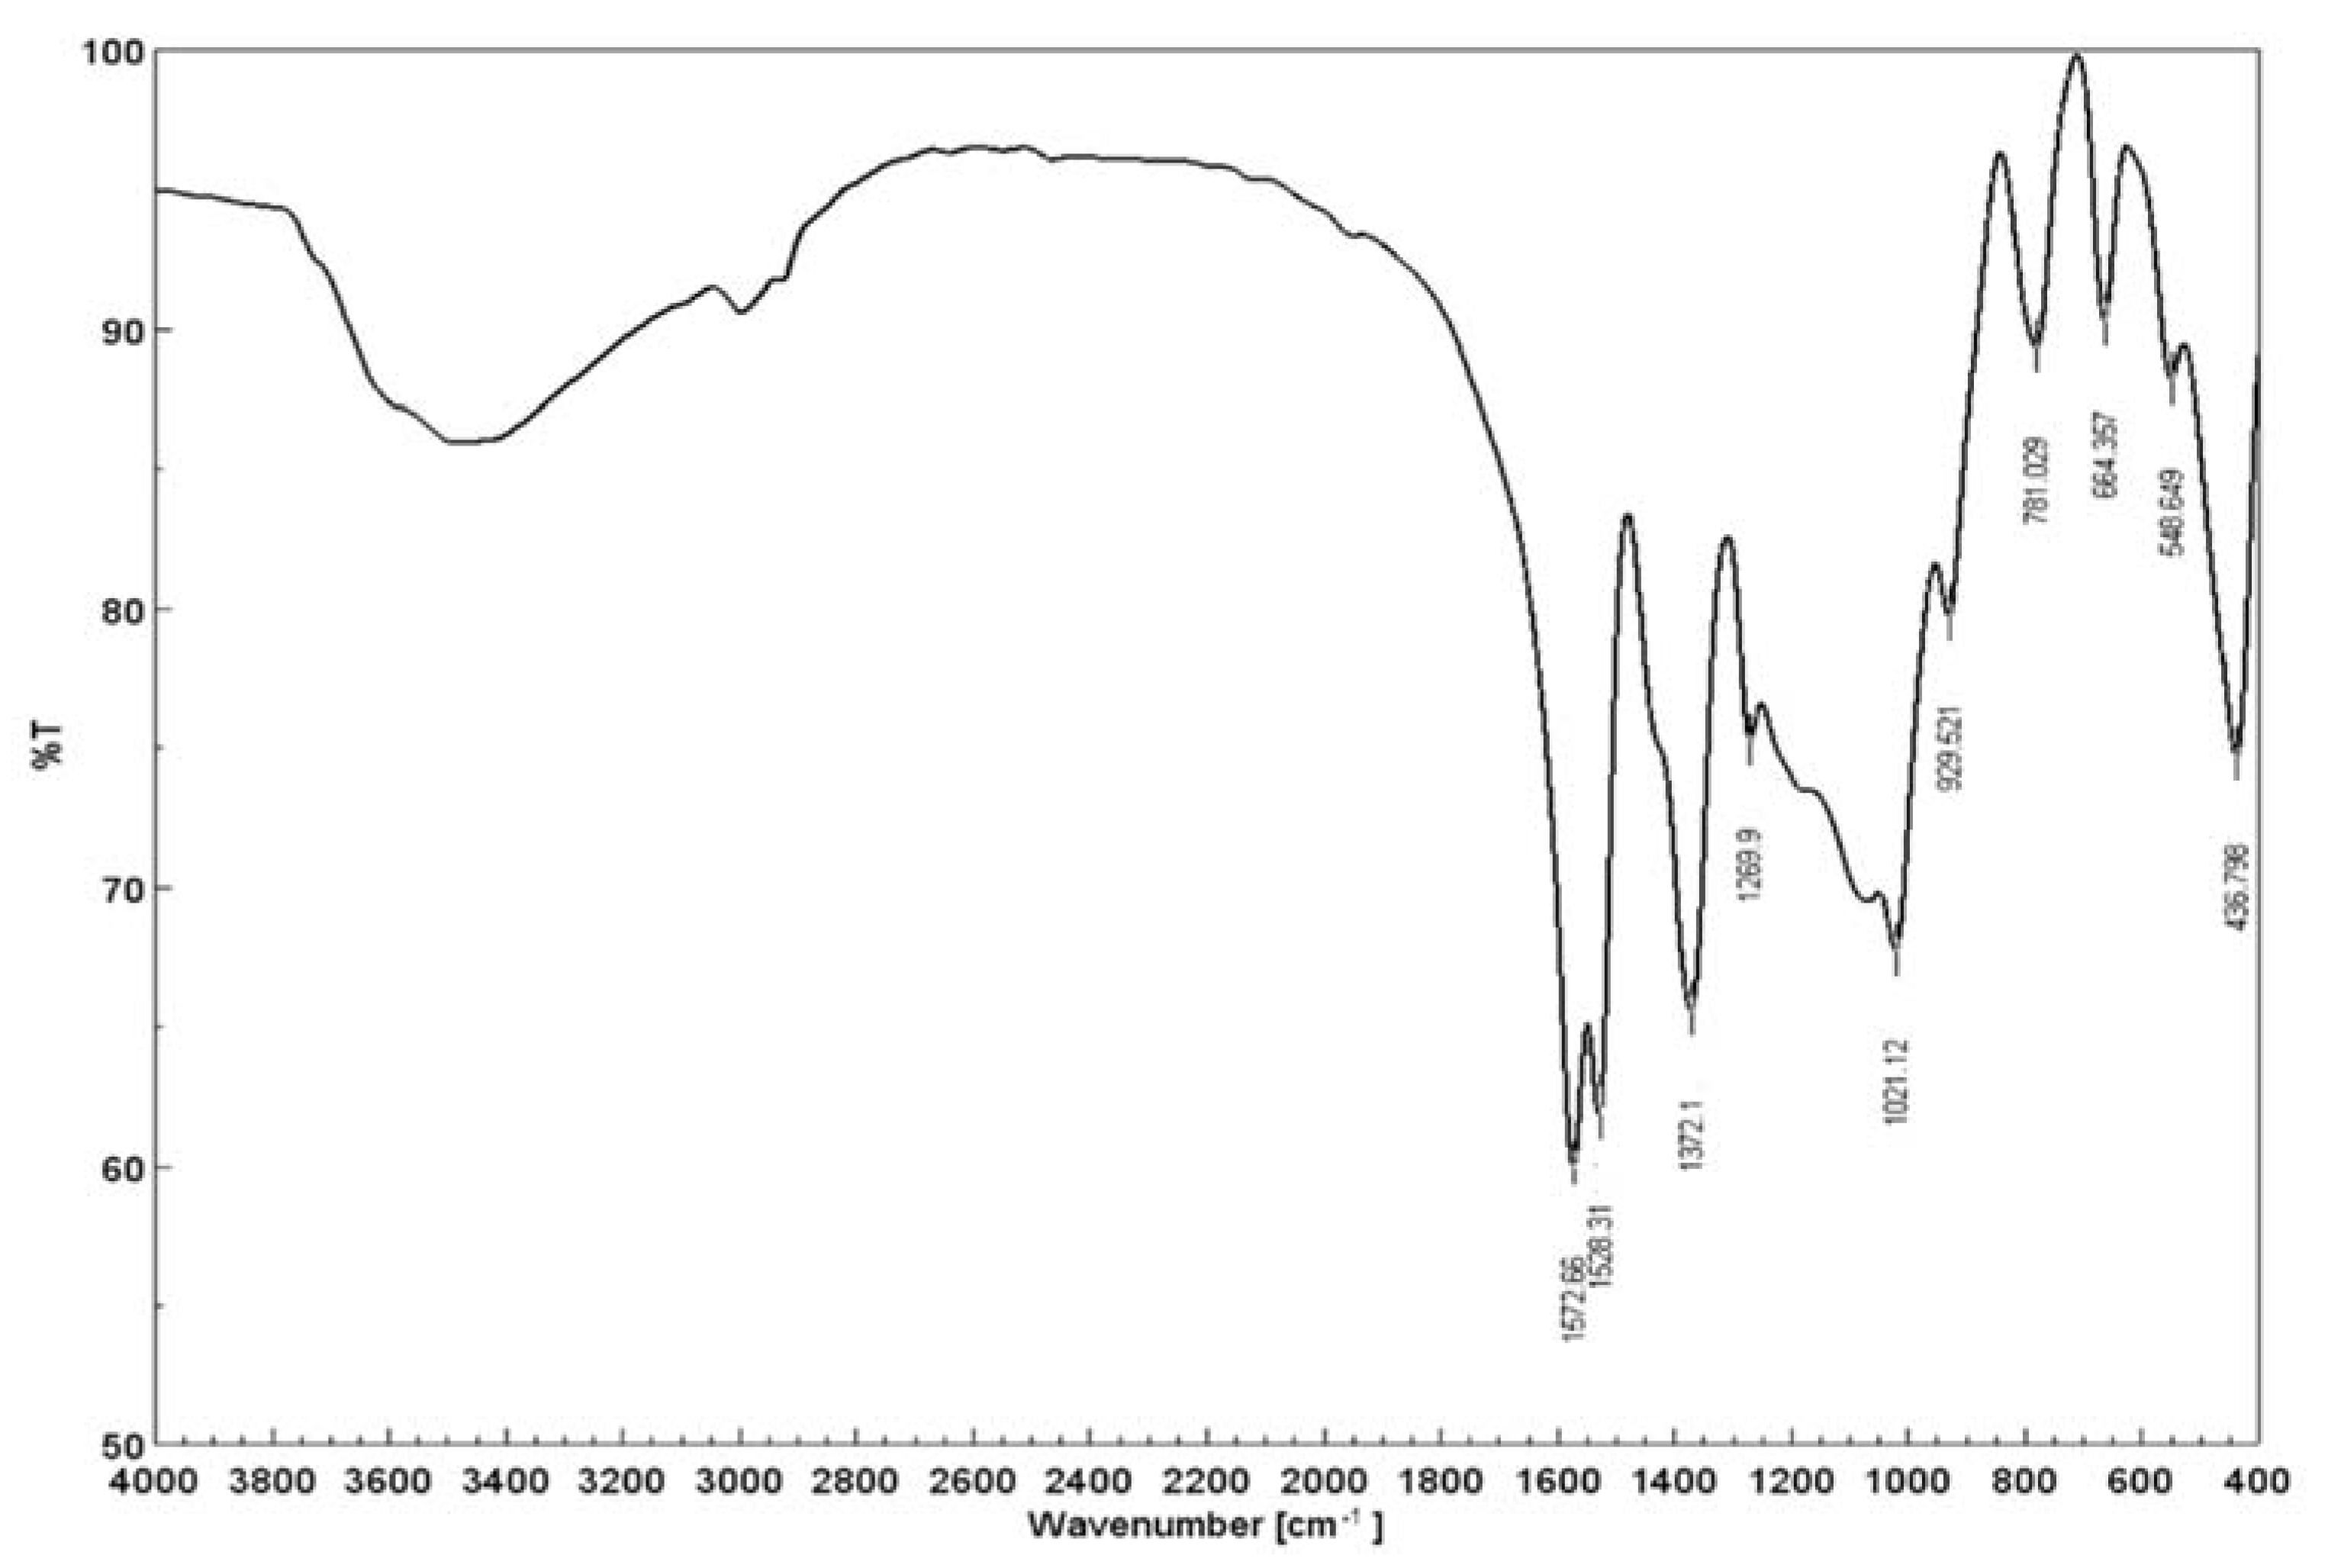
Taking into account that the sol–gel process implies hydrolysis and condensation, Raman spectroscopy is a useful tool for determining the changes in the material [40]. Taking into account the data presented in the literature, the most prominent peak is located around 1600 cm−1 as observed in our obtained spectra (Figure 2) [41].
The aforementioned band is attributed to the metal–acetylacetonato compounds with their specific C=O and C=C stretching vibration bonds, which have lower or higher value in dependence of the predominant bond placed between 1605–1560 cm−1 or around 1640 cm−1. Due to its specific and complex structure, the other acetylacetonato-specific peak is located at 1380 cm−1 indicating the C-H stretching vibration bond. Due to the C=C bonds, 1540 cm−1 and 1290 cm−1 bands are expected. In our spectra the 1540 cm−1 band is present as a broad low intensity shoulder whereas the 1290 cm−1 band is shifting from 1275 to 1283 cm−1. Krishnan et al. attributed the 1600 cm−1 band to the C–O stretching mode of the free enol form of acac [42,43]. The metal–oxygen stretching bonds are expected in the 450 cm−1 region, as indicated in the literature [42,43]. The 566–582 cm−1 may also be attributed to the metal–oxygen bonds [44]. The different intensity in the 566–582 cm−1 area associated with the M–O bond takes place as a result of different gelation and precipitation degree. Peaks located at 664–672 and 566–582 cm−1 are associated with the presence of Si-O bonds as explained in the literature [45], which can explain the inclusion of the silica in the structure of the new prepared adsorbent material. The decrease in the crystallite size is indicated by the broadening, asymmetry and red-shift of the peaks, a phenomenon that is visible when comparing the silica and the material’s final spectrum [46].

3.3. FT-IR Spectra

Regarding the FT-IR analysis (Figure 3) the following bands were observed: 1572, 1528, 1372, 1269, 1021, 929, 781, 664, 548, 436 cm−1.
Taking into account the similarities between the Raman and FT-IR, some of the vibrations are expected to tale place at the same spectral location, whereas some may also be absent. It is clear that the 430–460 cm−1 vibrations are assigned to the metal–oxygen bonds, almost at the same location as observed in the Raman spectra. The 548 cm−1 peak is also shifted in comparison to the Raman spectra, indicating the Si–O bonds. IR features found at 1572 cm−1 (O–H), 1372 cm−1 (CH3), the shoulders at 1207 cm−1 and 1529 cm−1 (C=C), 1021 cm−1 (C–C) and 664 cm−1 (O–H) were attributed to the acetylacetonate organic part [47]. The 795–780 cm−1 are assigned with the M–O bonds since it is well known that coordination complexes are difficult to detect due to the influence of metal coupling, which changes the vibration modes of the compound as the final result [42].

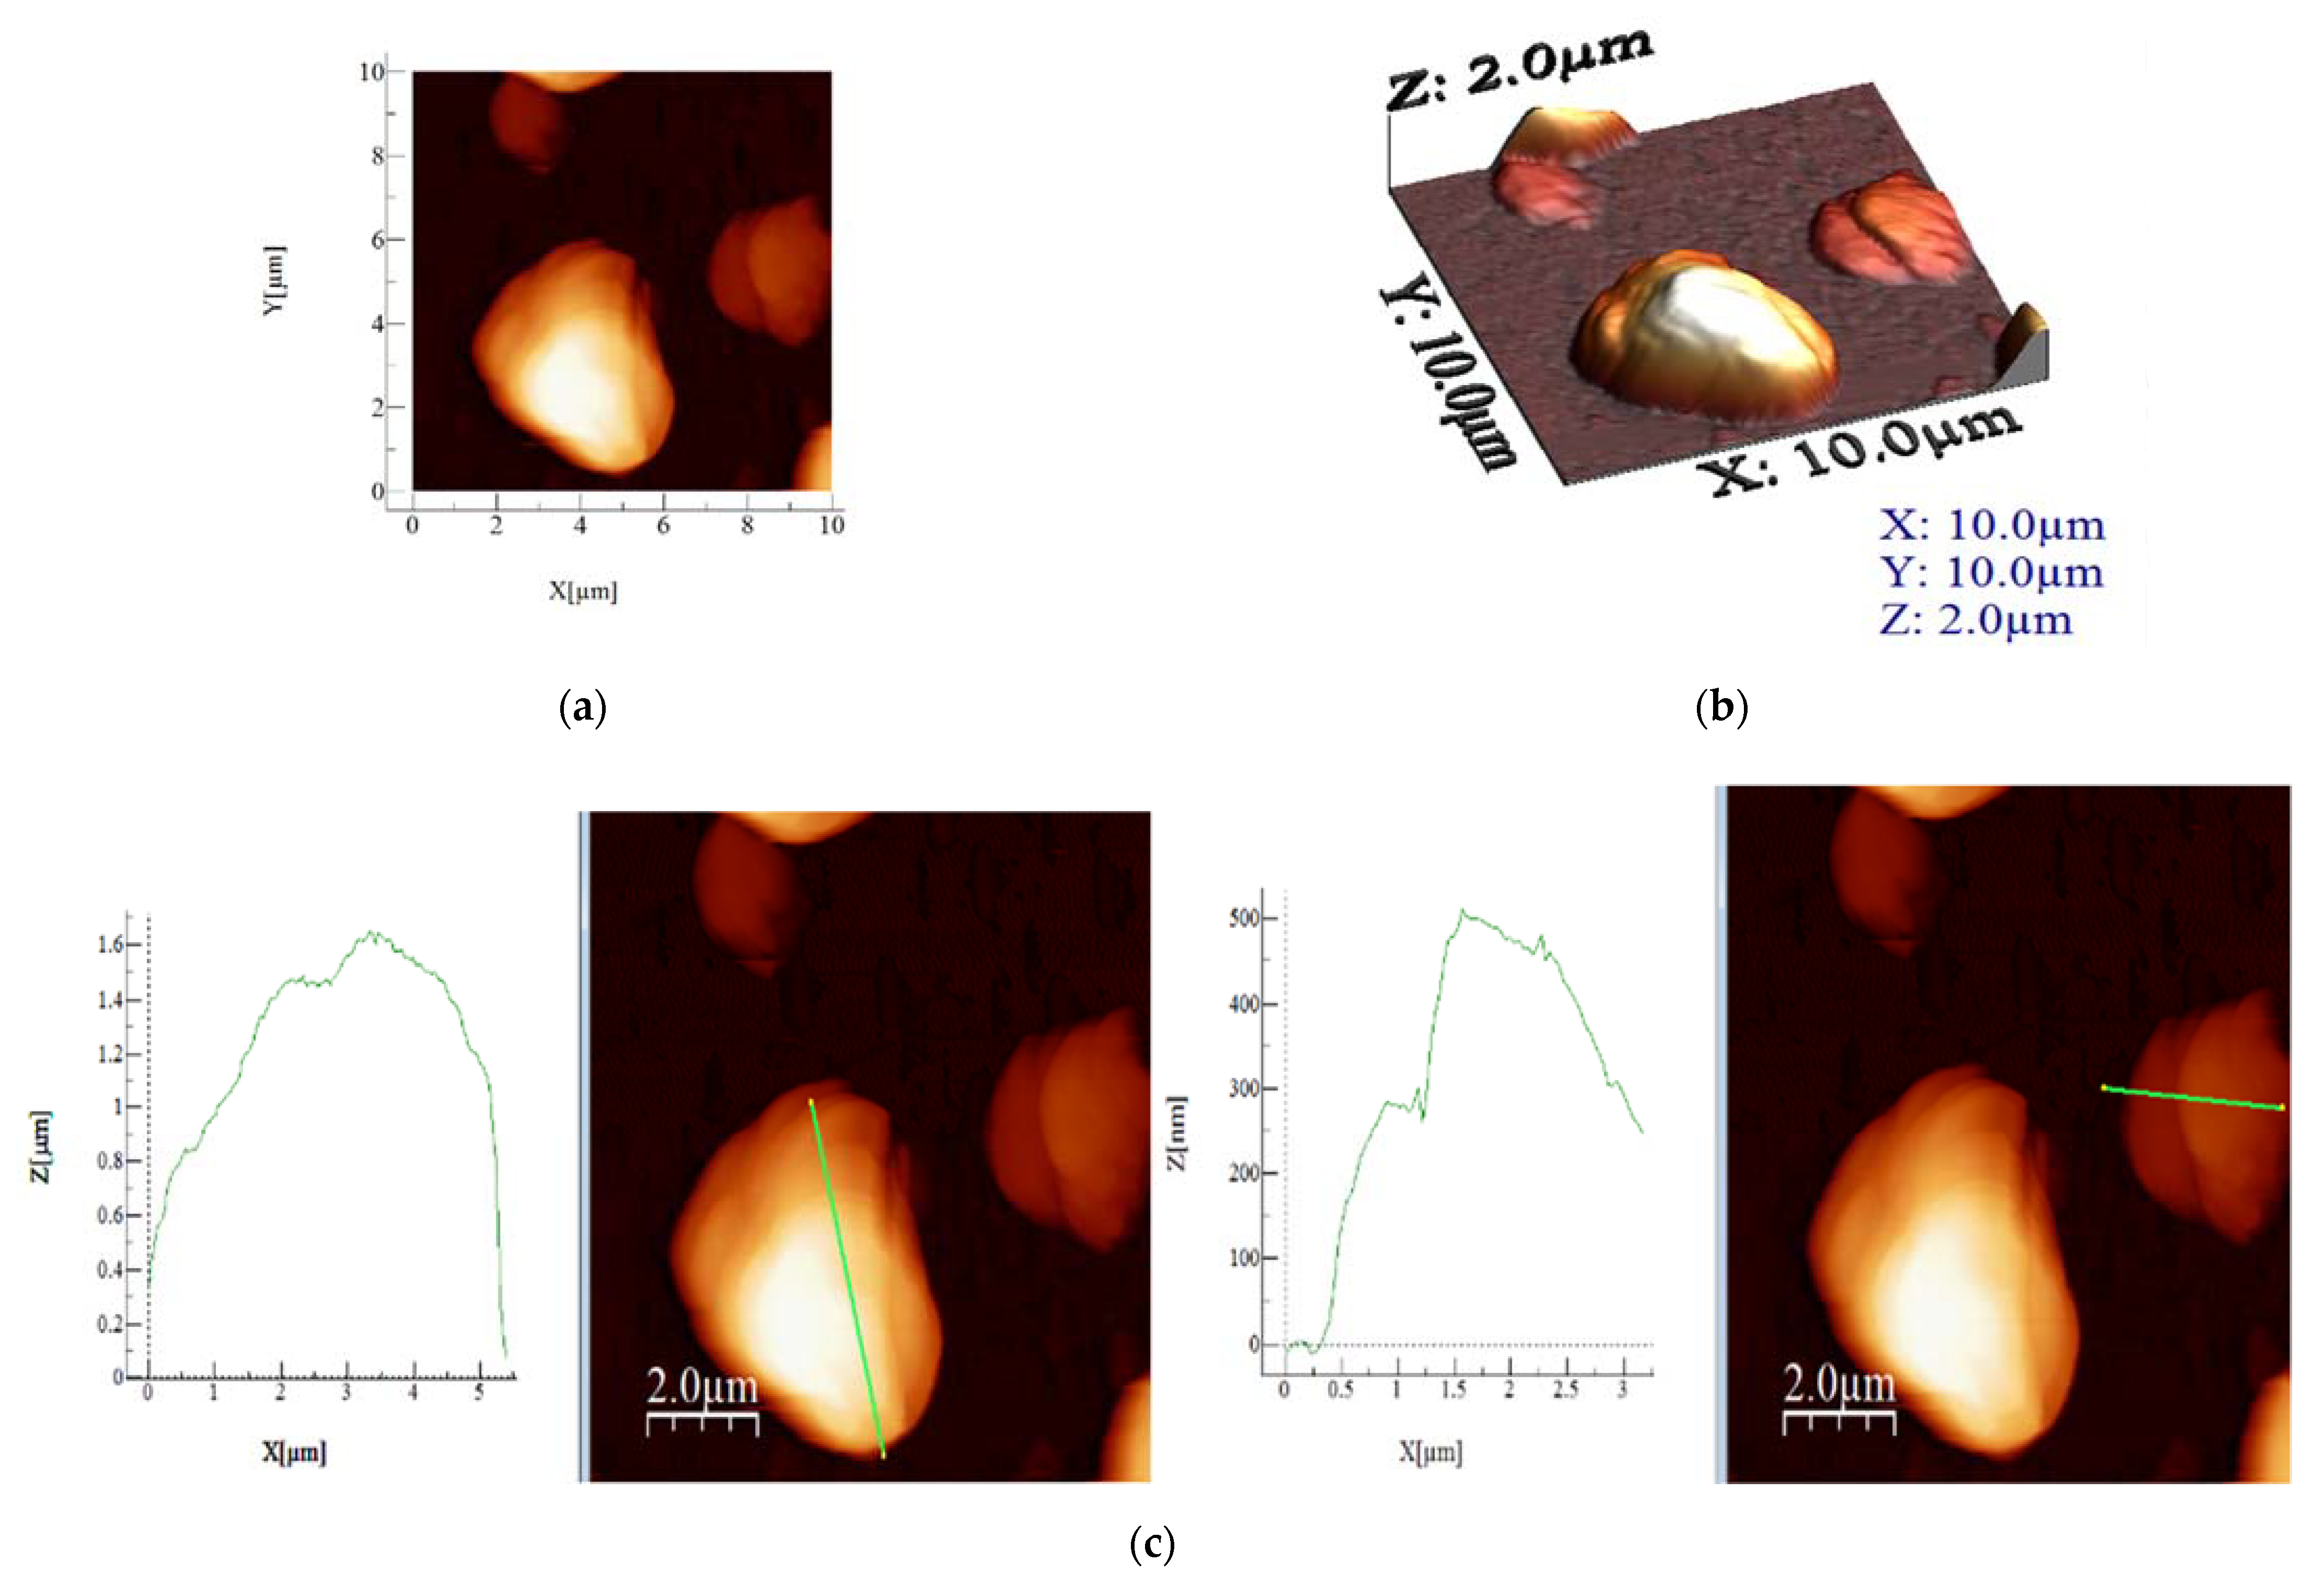
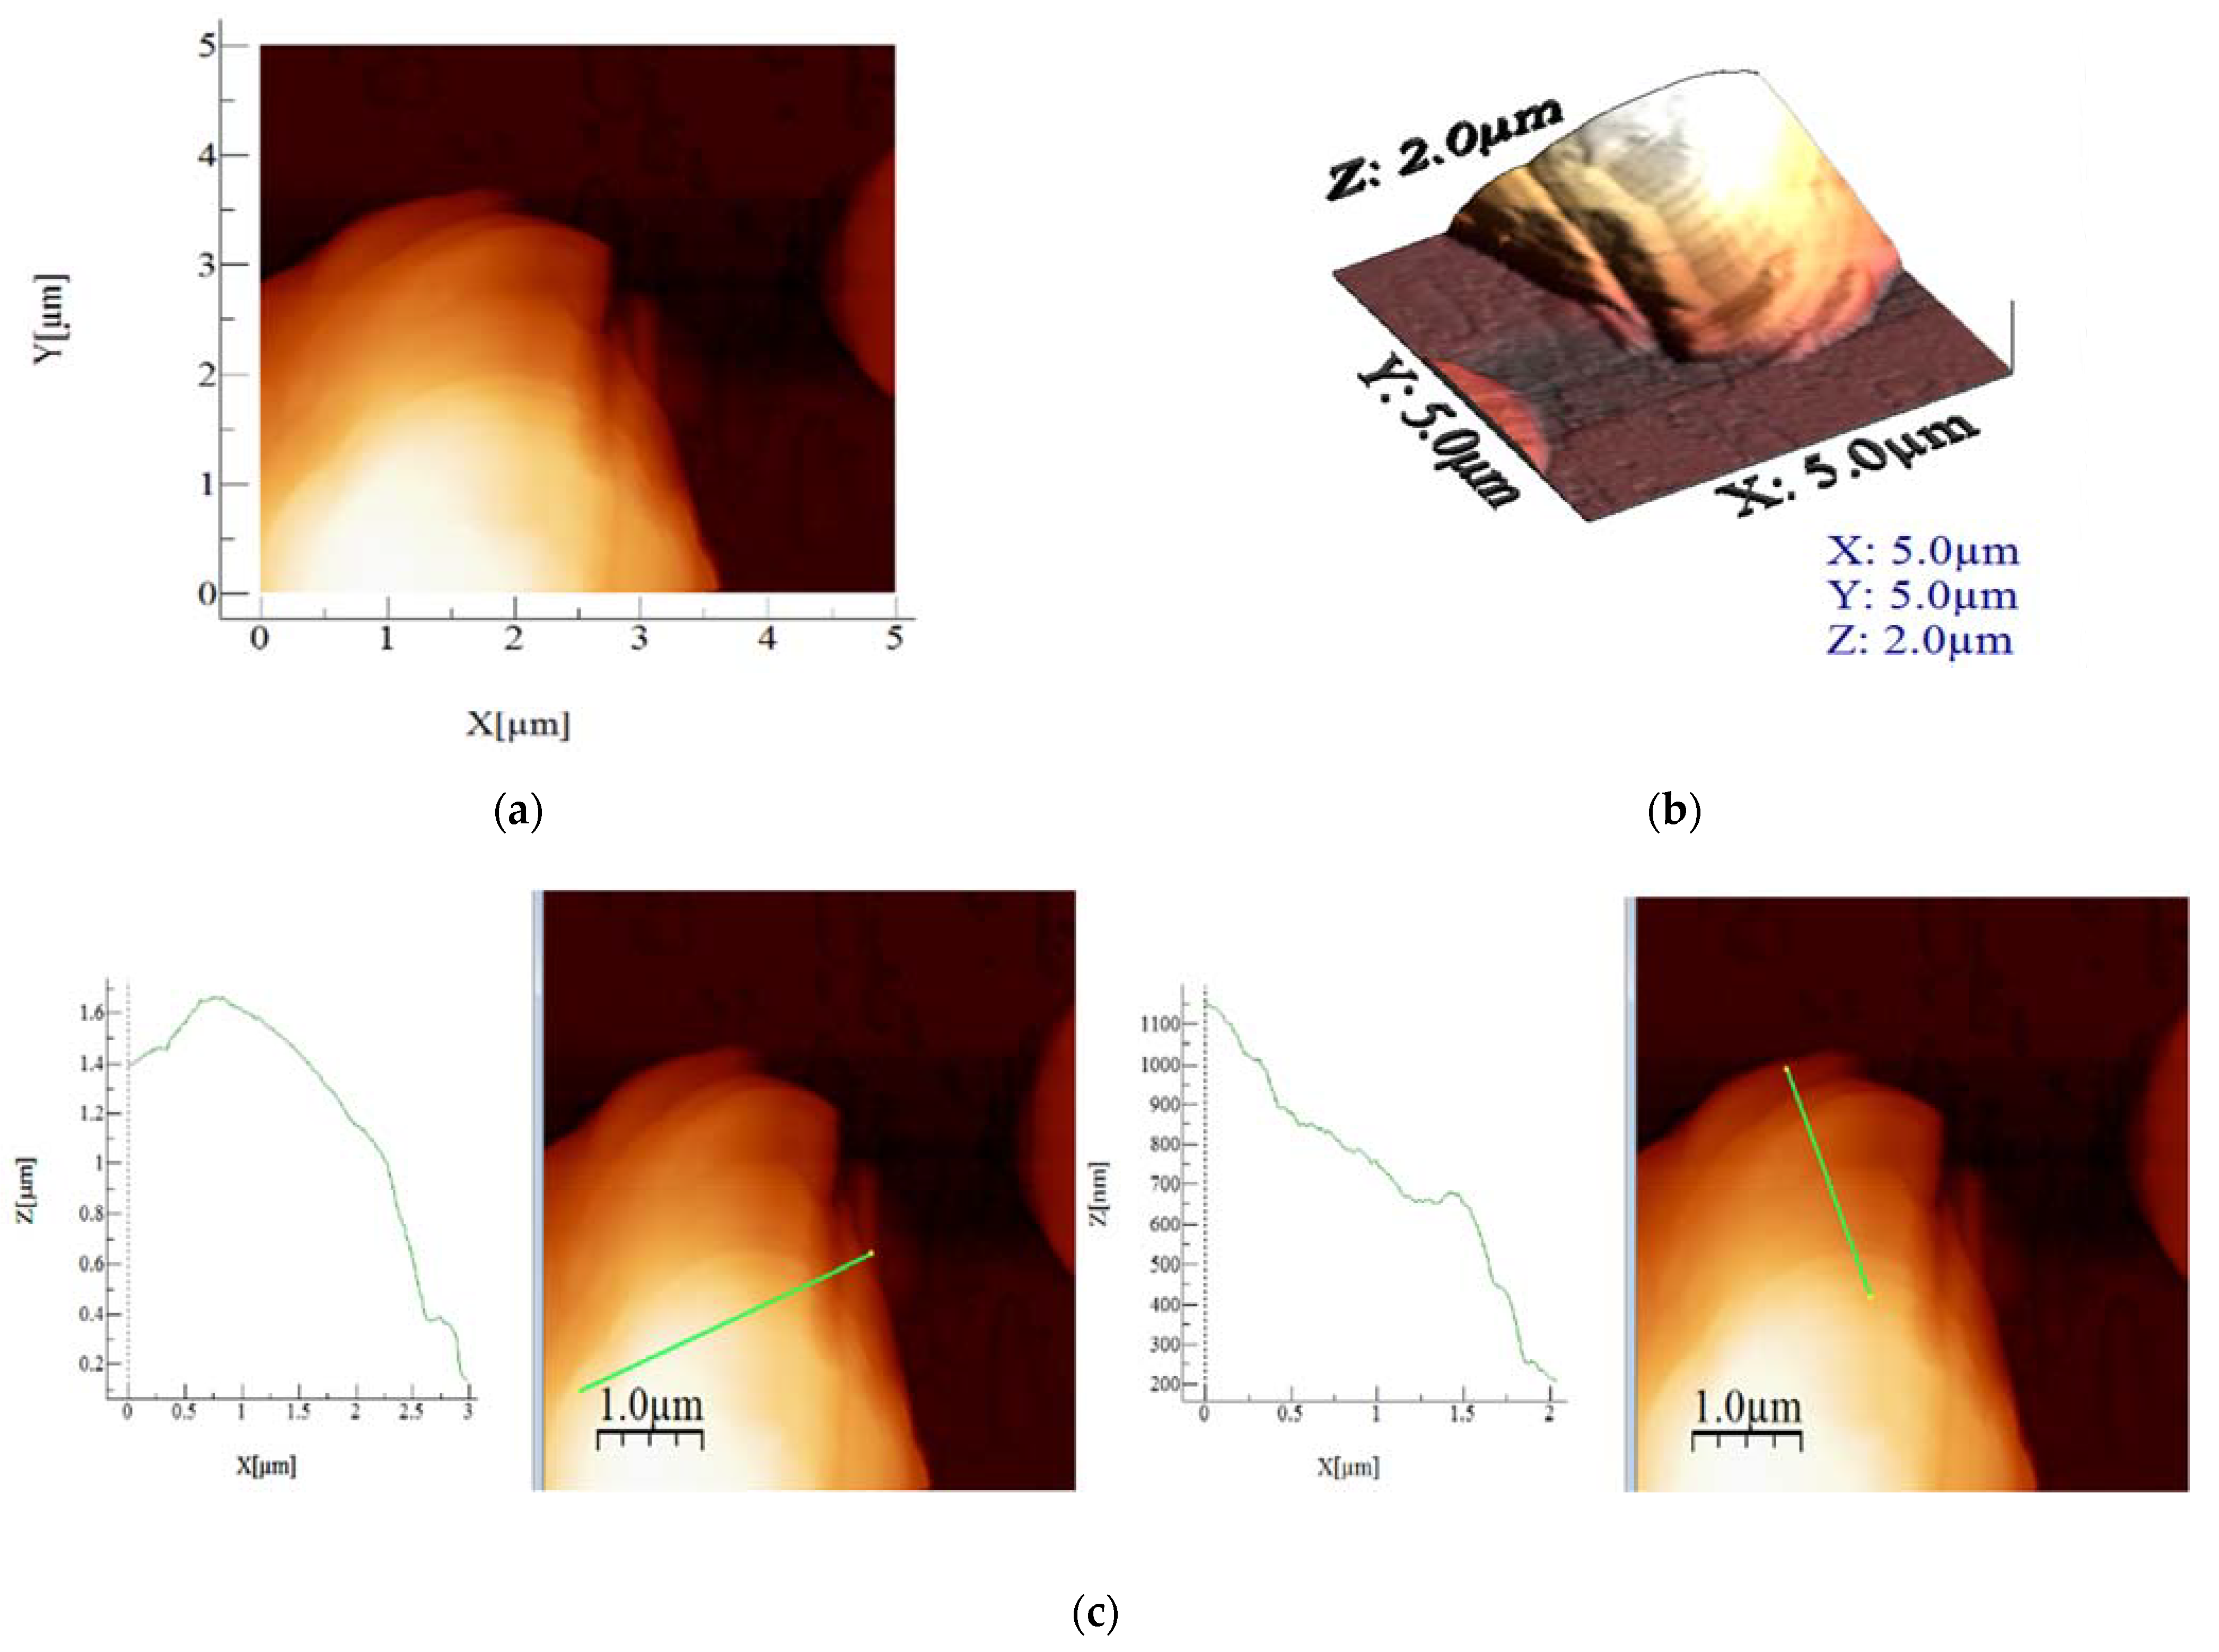
3.4. Morphological Study with Atomic Force Microscopy

Figure 4 presents the obtained crystals before the grinding, followed by the AFM images, and the 3D and height profile of material on the scale 10 µm × 10 µm (Figure 5) which were performed only for the grinded material. AFM analyses are useful for the surface determination, whereas the more homogenous materials with high porosity are better for the electrical measurements.
Scanning on a 5 µm × 5 µm scale was performed for closer observation of the round-shaped formations of material. Some differences were expected regarding the rugosity of materials in comparison to the 10 µm × 10 µm scale images, due to the more specific local area of analysis. Nonetheless, the 10 µm × 10 µm images should be considered more reliable, as they contain more features on a greater scale. This class of analysis material still has the one with the highest roughness values, as well as highest Sp, Sy and average height. It confirms the fact that this compound has the largest round formations, which is also visible in the height profile of the selected area.
Based on the recorded AFM images, the values for average roughness (Sa), mean square root roughness (Sq), maximum peak height (Sp), maximum valley depth (Sv), maximum peak-to-valley height (Sy) and average height were calculated, which are presented in Table 2. The images were scanned on a scale of 10 µm × 10 µm (Figure 5a) and 5 µm × 5 µm (Figure 6a), providing insight into the particularities of each sample. From the obtained results, highest roughness values (both Sa and Sq) were obtained. Interestingly, that material also has the maximum peak to valley height (Sy) and also highest maximum peak height (Sp) values.

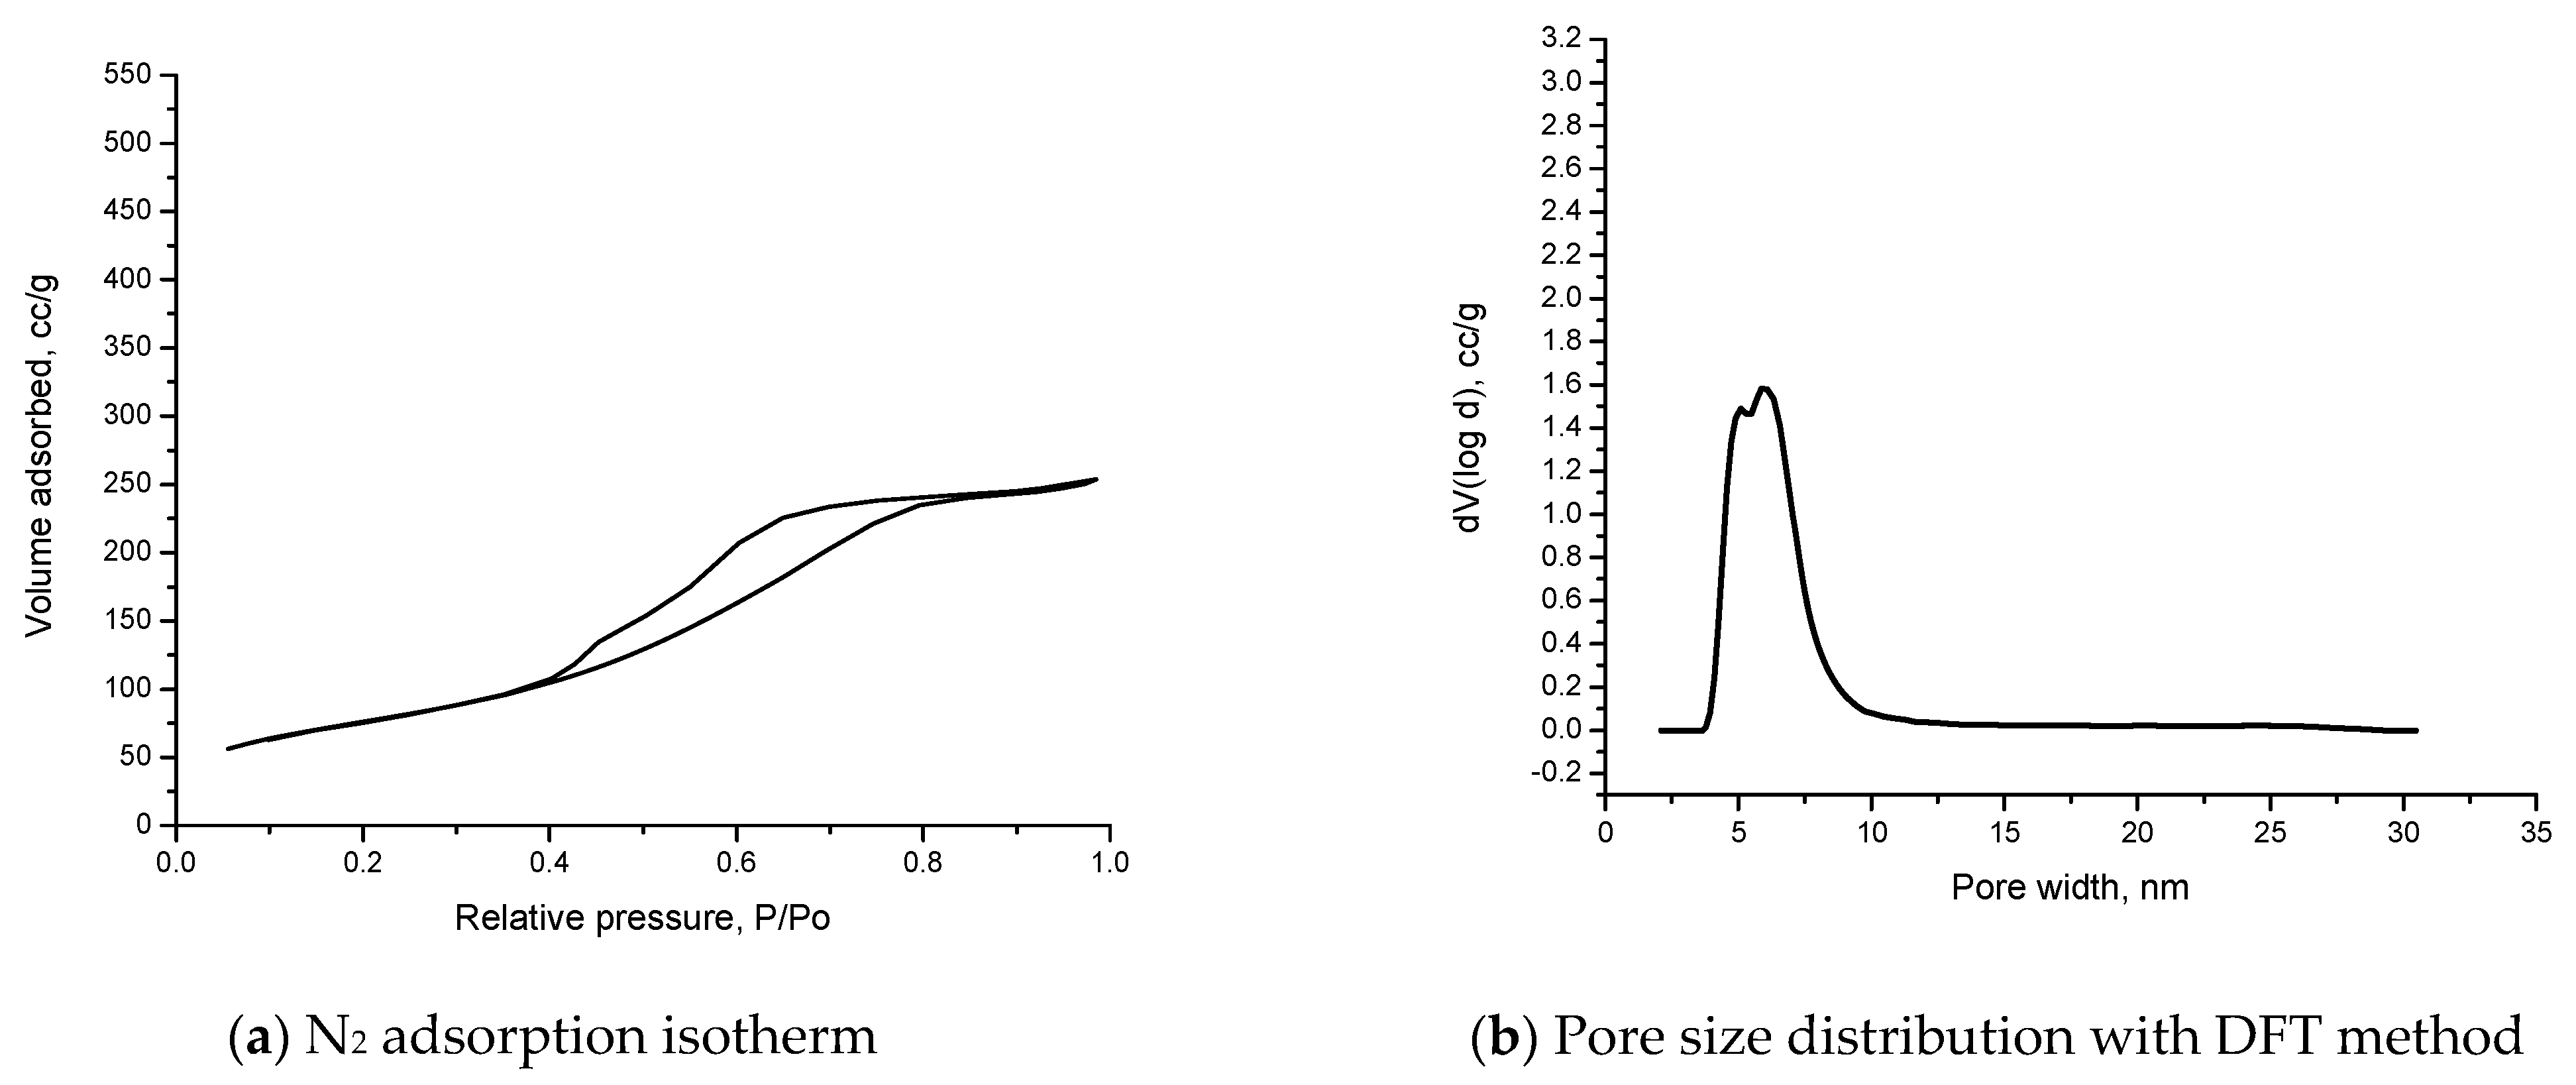
3.5. Nitrogen Adsorption–Desorption Isotherms

In order to observe the differences in textural structure, the nitrogen adsorption–desorption isotherms are performed. Figure 7 presents the N2 isotherm of the material.
After analyzing the data, the materials obtained indicate a type IV isotherm. The isotherm indicates that capillary condensation occurs and that the pore exceeds a critical width.
In Figure 7b, the pore size distribution is presented. The data parameter obtained indicates only mesoporous material in our case.
In Table 3, the textural parameters are presented.

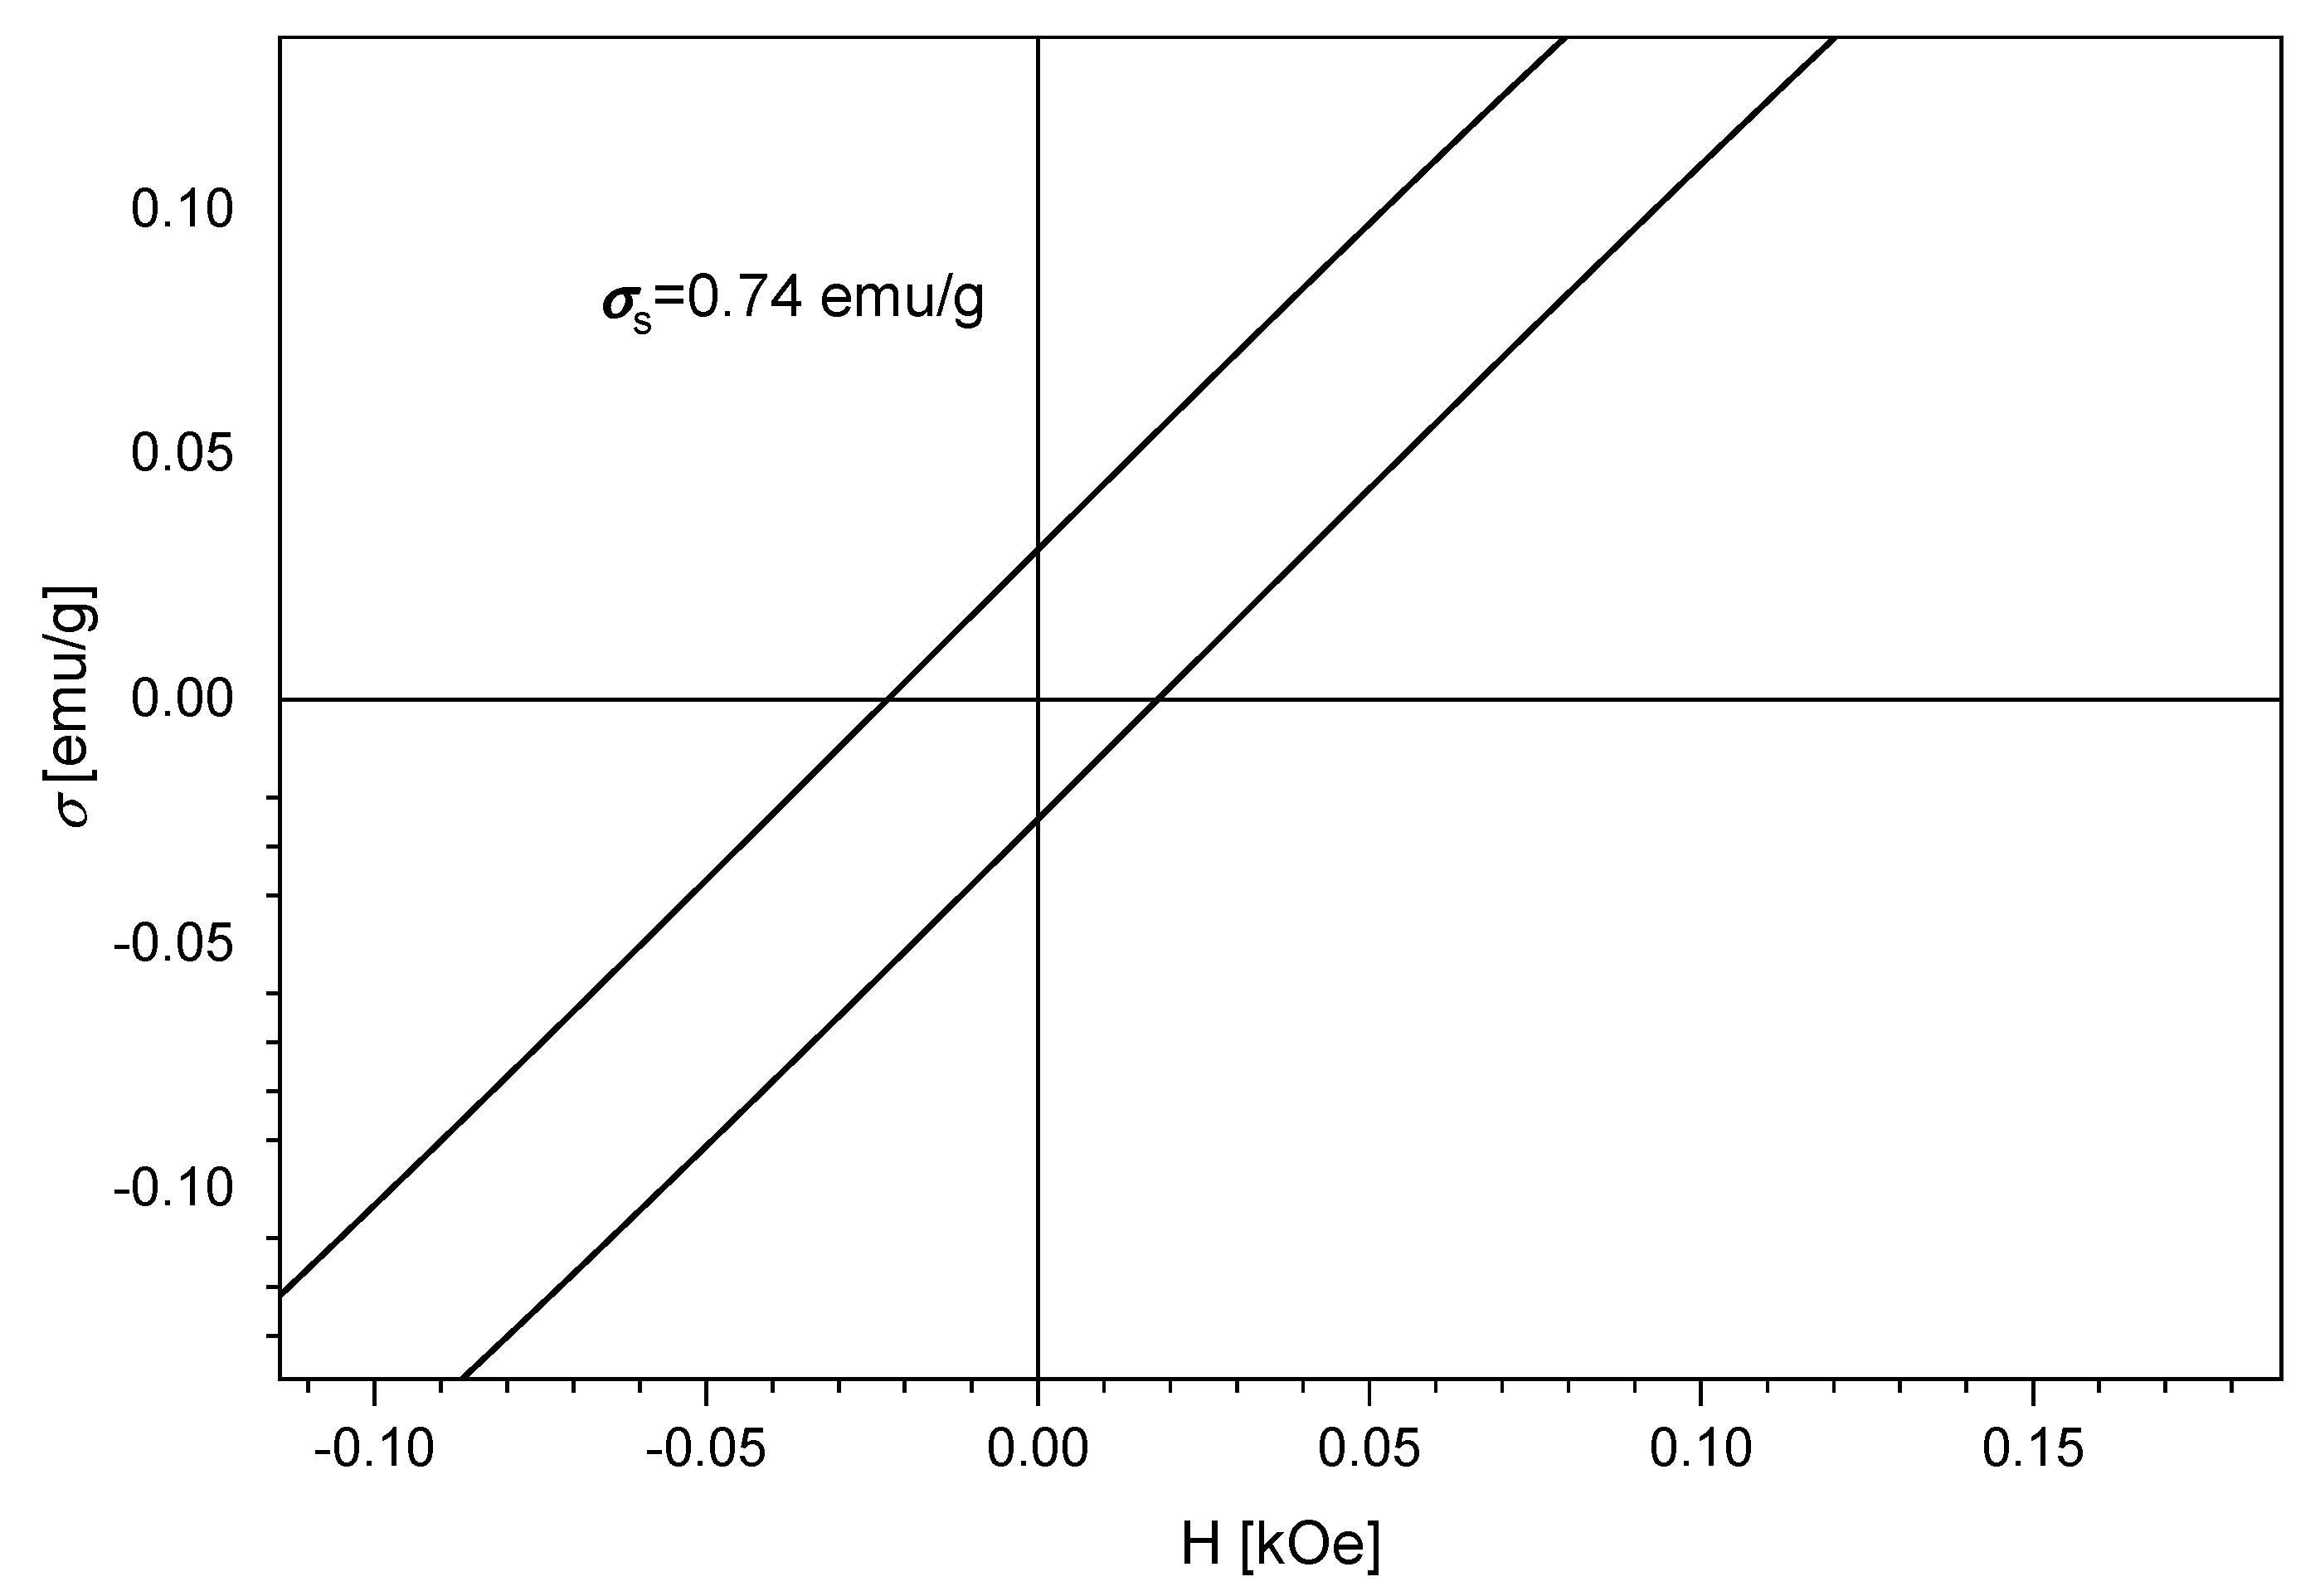
3.6. Magnetic Measurements

Figure 8 indicates the magnetic saturation curve with the extracted data using a homemade induction magnetometer with an AC field of 50 Hz and amplitude of 5 kOe. The fitting of the hysteresis loop branch was performed with Langevin-type transition functions [48].
By analyzing the results displayed in Figure 8, we observed that our material presents superparamagnetic behavior. The total saturation magnetization indicates a value of 0.74 emu/g. The remanent magnetization obtained indicates a value of 0.03 [emu/g] with a coercive field (H) of 0.01 [kOe].

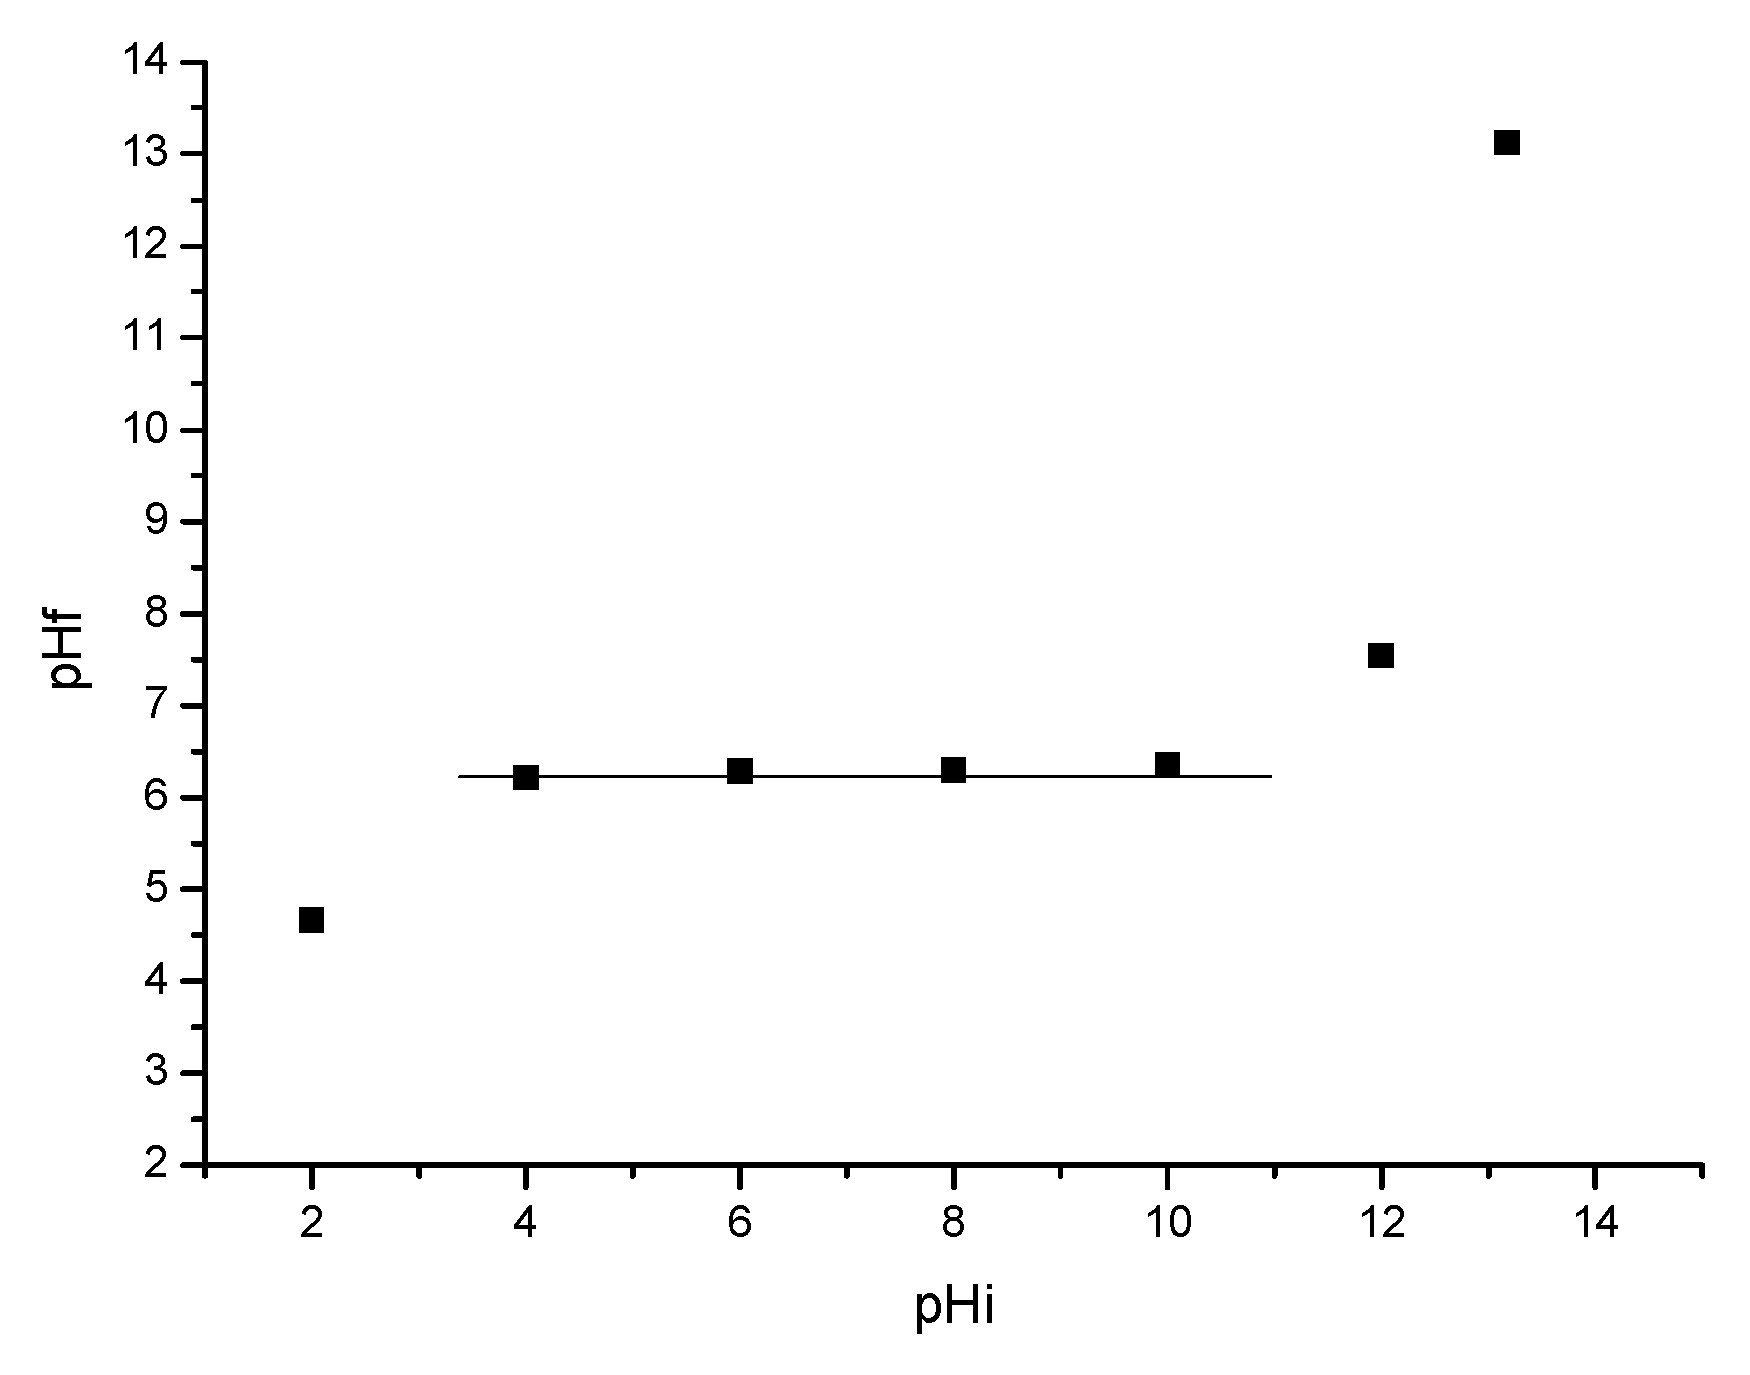
3.7. Point of Zero Charge Determination (pHpZc)

Figure 9 shows the relationship between the final pH and initial pH, establishing the pHpZc value of the material.
The point of zero charge (pzc) represents the value of the pH where the net charge of the material surface (i.e., adsorbent’s surface) is equal to zero at some specific ambient temperature, aqueous solution composition, and applied pressure [49].
In the case of SiO2/Fe(acac)3/NaF, the pHpZc is 6.3. If we work at pH~6, the As(III) species that are adsorbed can be neutral. If the pH is worked out in the range of 6–8 species, they can also be anionic, as the surface of the material is positively charged.

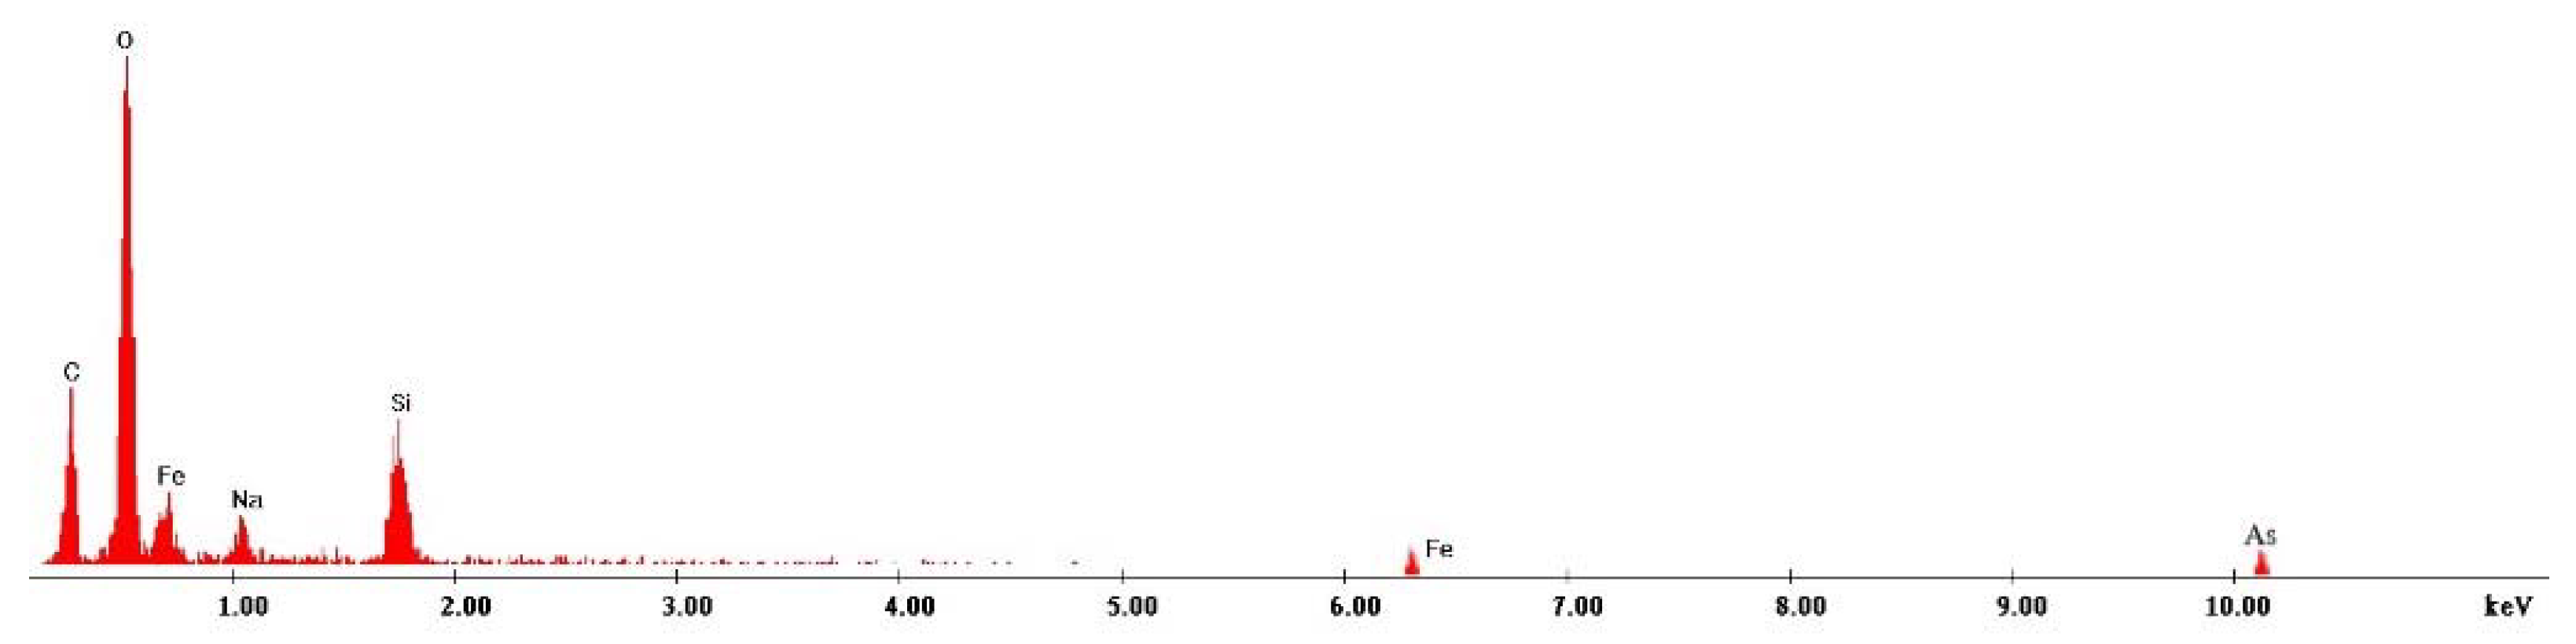
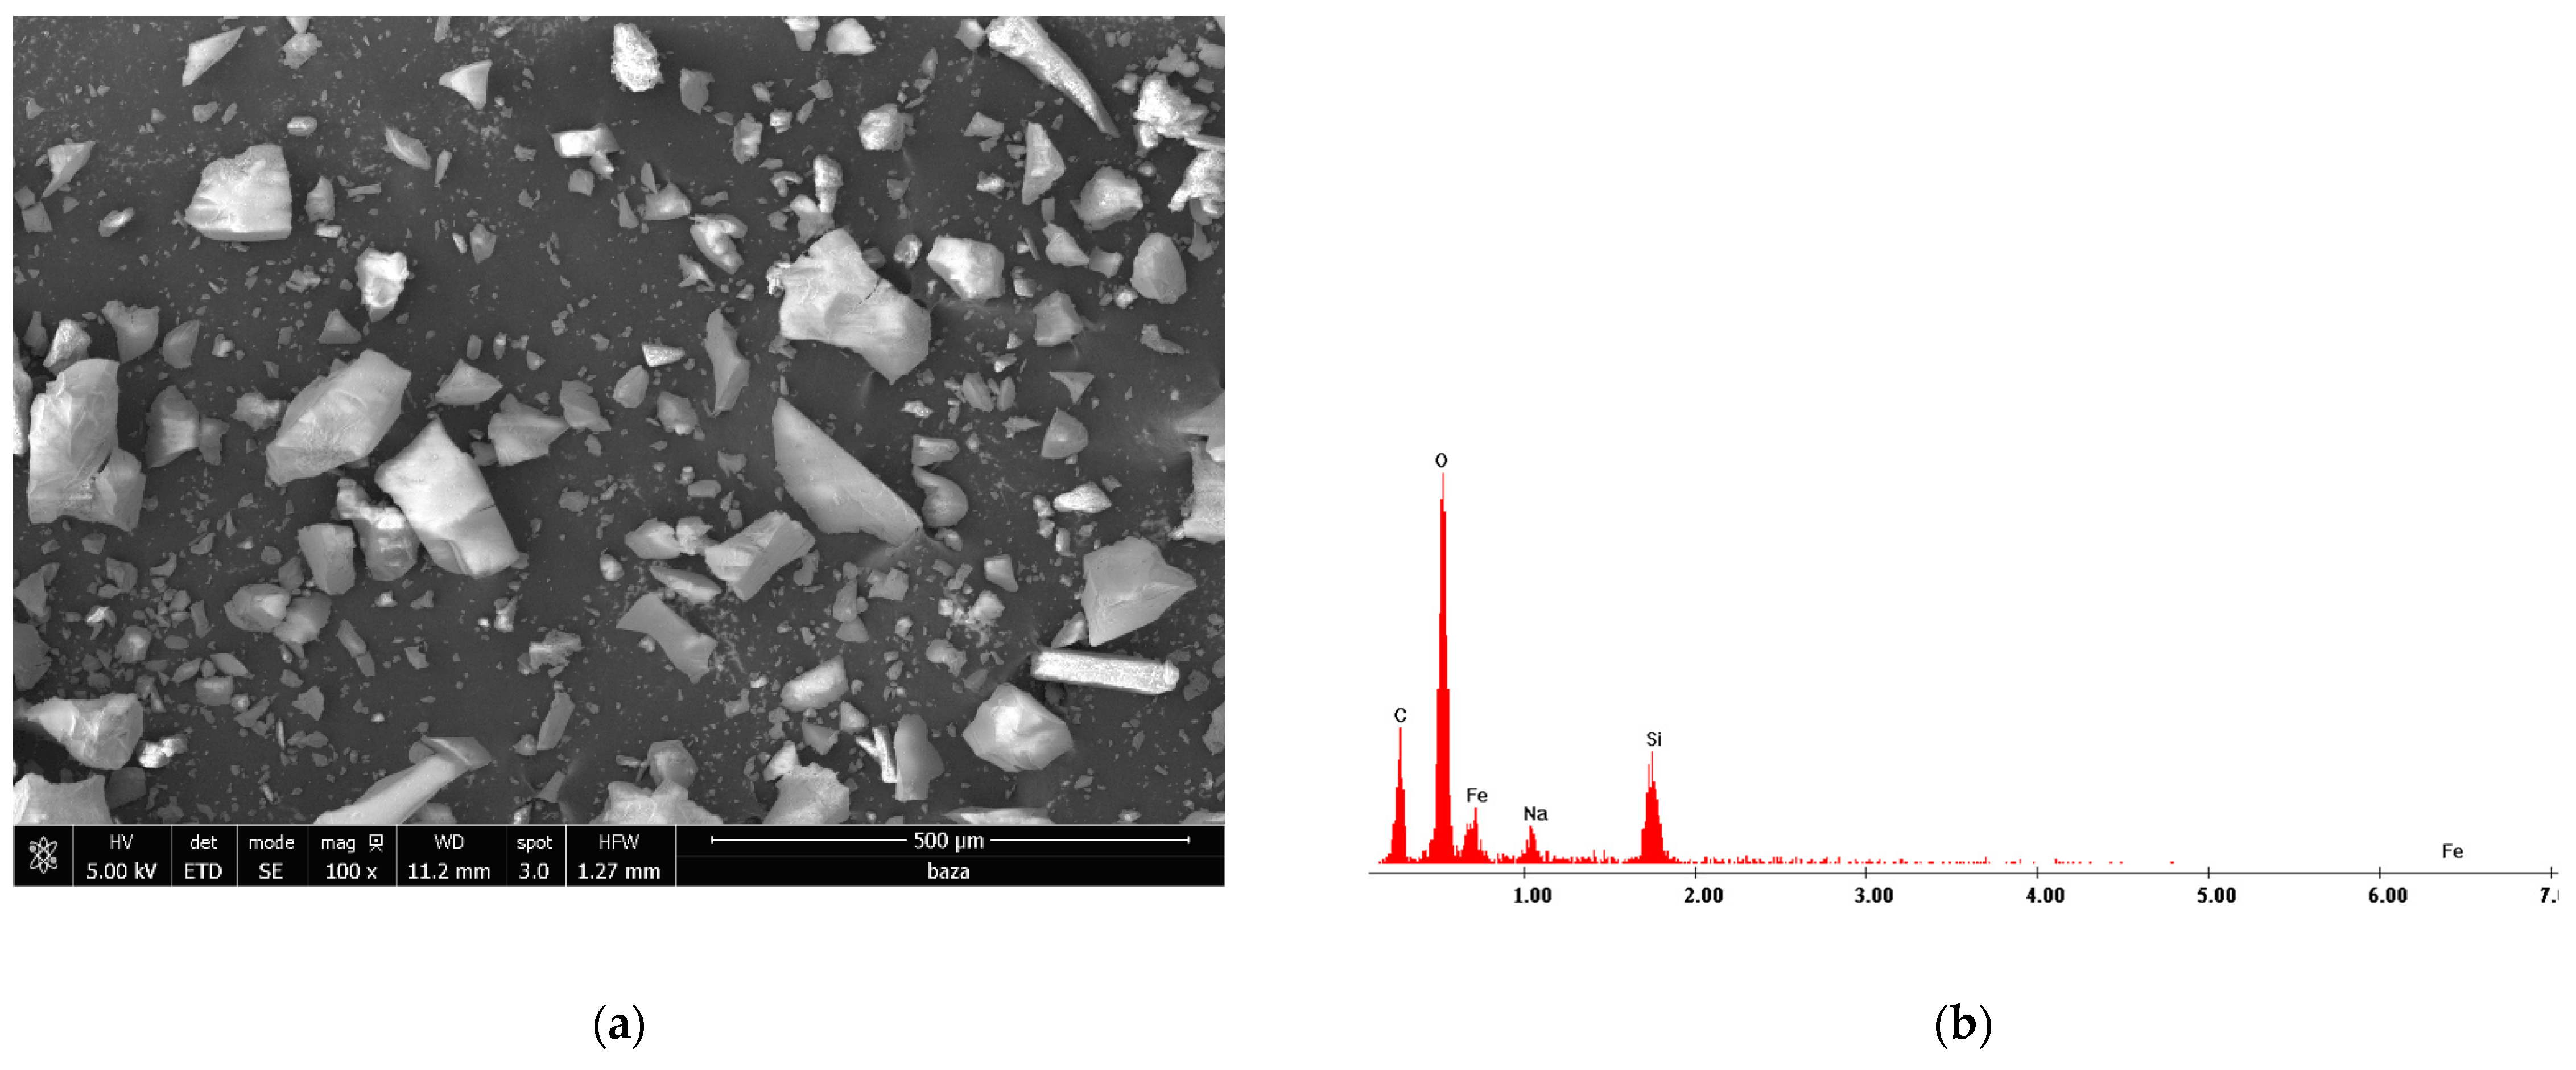
3.8. Scanning Electron Microscopy Characterization

To highlight the morphology of the new prepared adsorbent material, the SEM micrograph as recorded (Figure 10a). Furthermore, in order to prove the formation of the desired adsorbent material, the EDX spectrum was recorded (Figure 10b).
Analyzing data presented in Figure 10a, we can observe that the obtained adsorbent material presents a relatively homogenous structure, with well-defined crystals. Moreover, the EDX spectra confirm the formation of the desired adsorbent material.

3.9. Arsenic Adsorption Studies
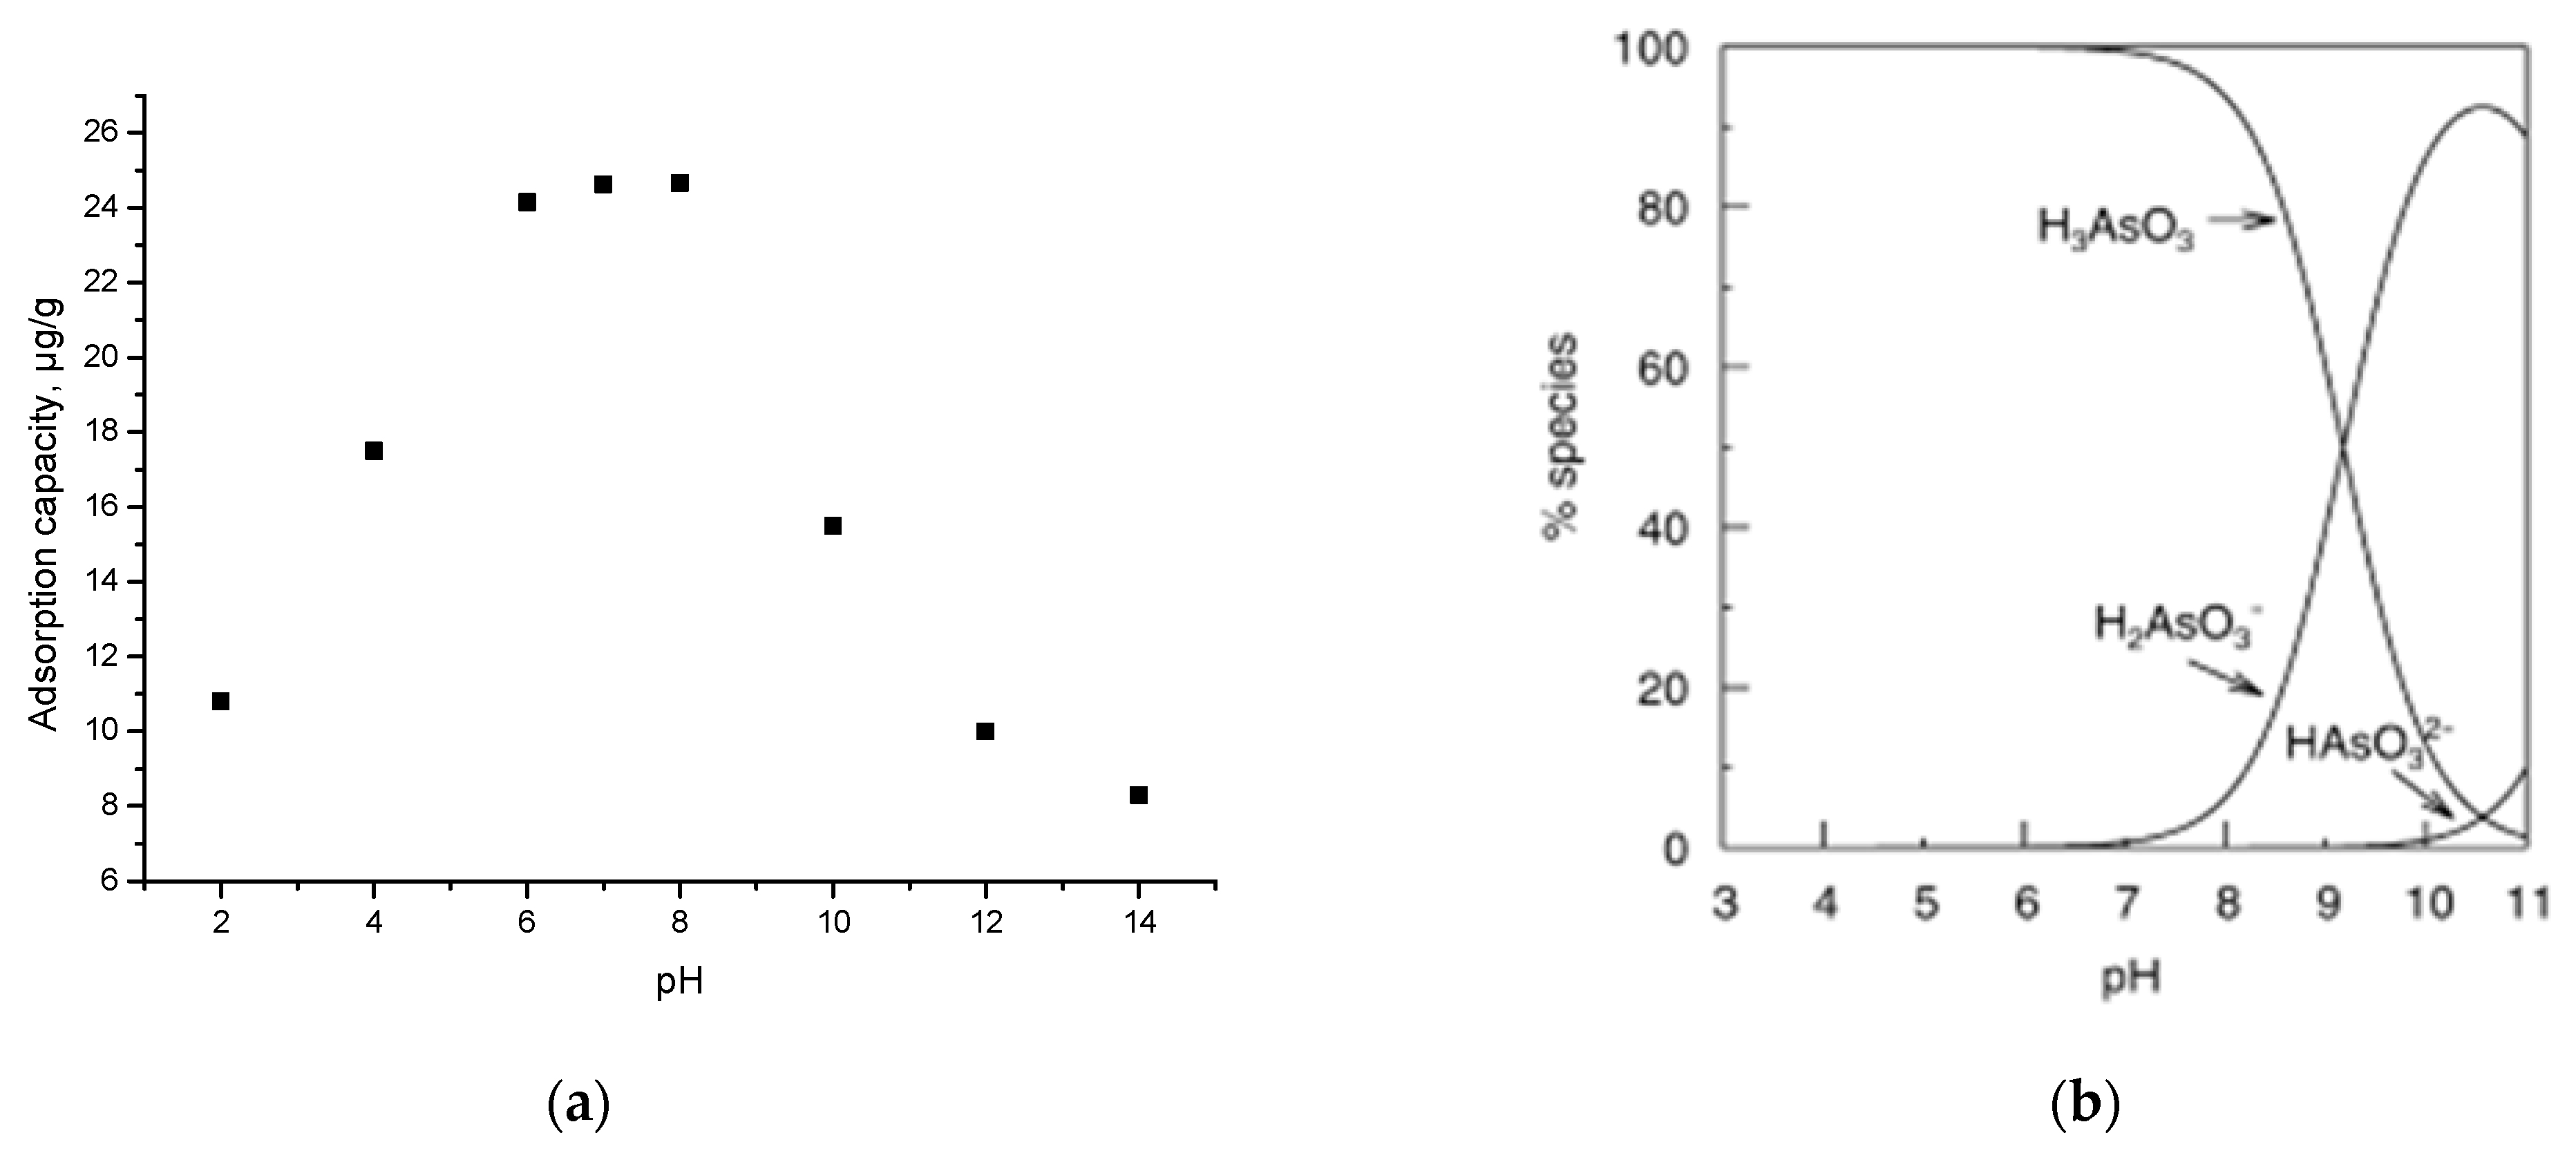
3.9.1. pH Effect

The data presented in Figure 11a shows how the maximum adsorption capacity of As(III) is influenced by the evolution of pH.
Thus, at pH < 6, the adsorption capacity increases with increasing pH. In the pH range 6–8, the adsorption capacity reaches maximum values (~24 µg As(III)/g material). At pH > 8, the adsorption capacity decreases.
Figure 11b presents the distributions of the As species as a function of pH. The species specific to the optimal pH of the adsorption process of As(III) on the SiO2/Fe(acac)3/NaF material are H3AsO3 and/or H2AsO3 [14].
The fact that the optimal pH coincides with the pHpZc of the material demonstrates that the process of removing As(III) by adsorption will proceed with good efficiency.
In order to prove that the new prepared material is able to adsorb the As(III) ions from the used aqueous solutions, we recorded the EDX spectrum for the exhausted adsorbent material (spectrum depicted in Figure 12). In this spectrum, the presence of the As(III) specific peak can be observed, confirming in this way our supposition that the new prepared material is suitable for As(III) removal.

3.9.2. Influence of the Adsorbent Dose

In order to establish the optimum conditions for As(III) ions removal, the influence of the adsorbent dose has been studied. In this context, different amounts of adsorbent material were weighed and mixed with 25 mL of arsenic solution. Obtained dates are presented in Figure 13.
Analyzing the information presented in Figure 12, it can be observed that by increasing the solid:liquid ratio from 0.05:25 at 0.1:25 g/mL, the adsorption efficiency can be increased from 80% at 91%. Any further increase in the solid:liquid ratio does not lead to any significant increase in the adsorption efficiency. Based on this observation, further experiments were carried out using 0.1:25 g/mL solid:liquid ratio.

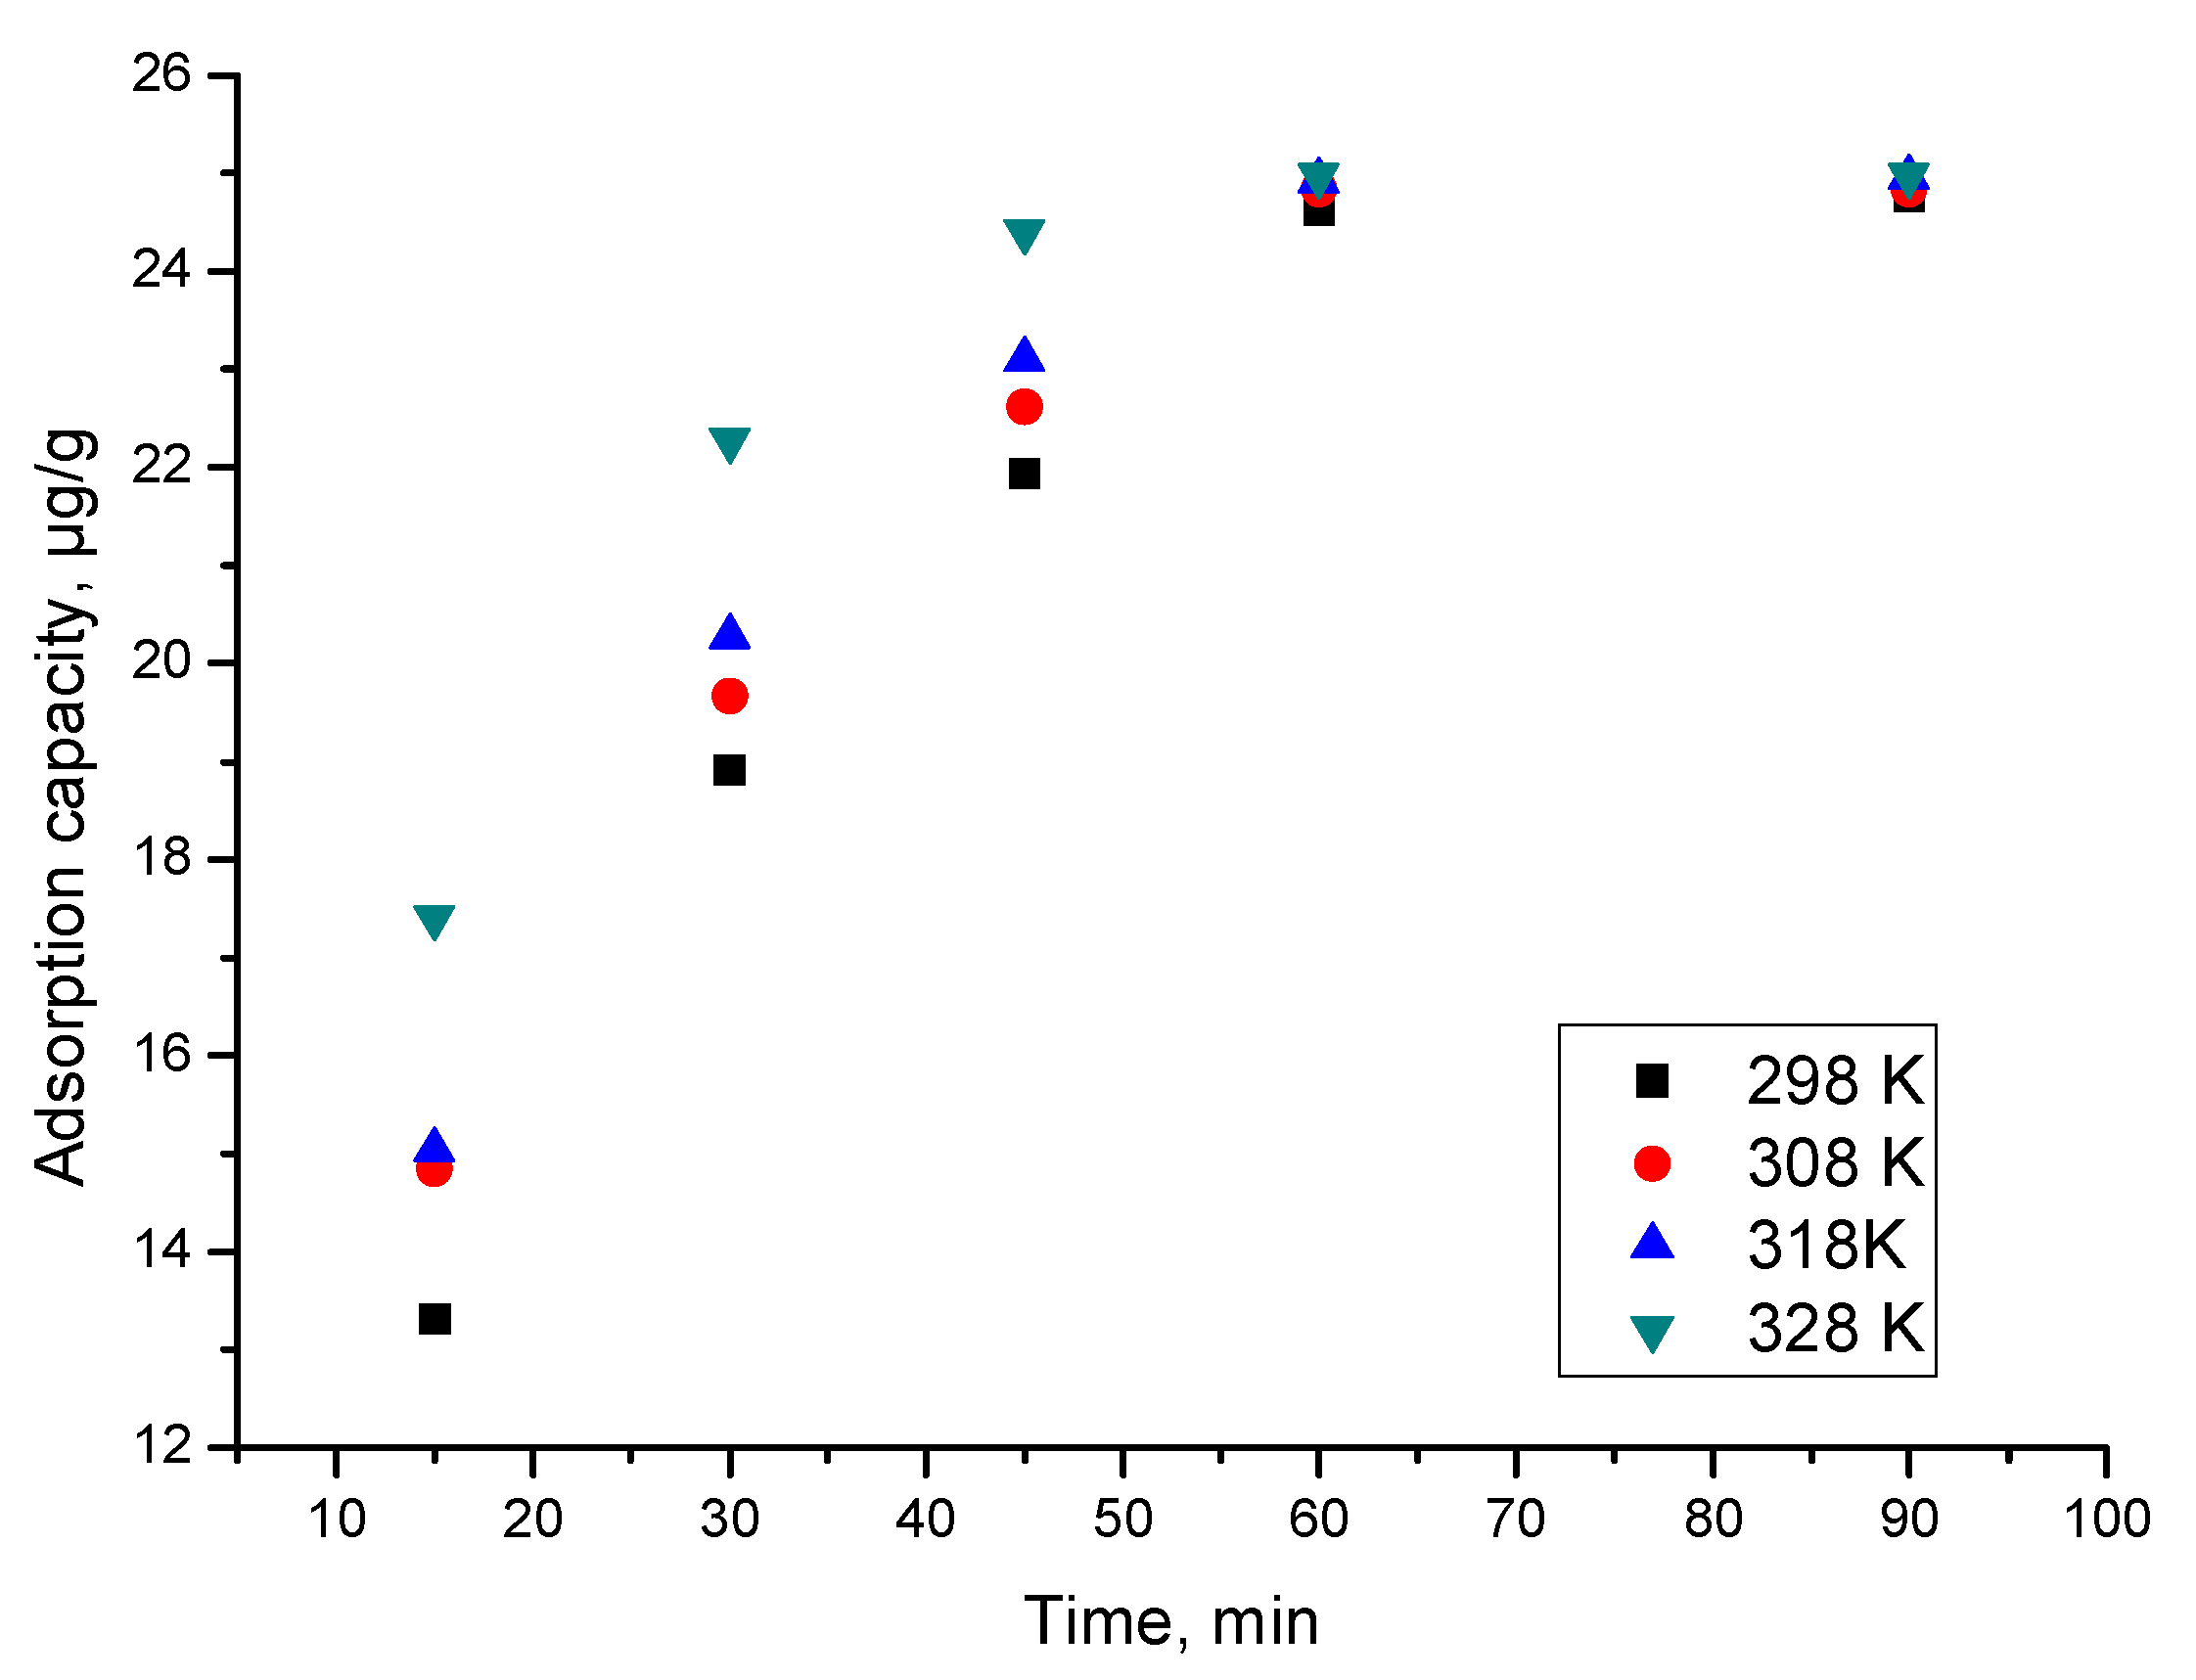
3.9.3. Contact Time Effect

The adsorption process is determined by the contact time and temperature, knowledge of these two parameters being very important in addition to the pH of the solution with As(III) ions and the concentration of As(III) ions in the solution.
The role of contact time and temperature is shown in Figure 14.
From the data presented in Figure 14, it can be observed that as the contact time increased, so did the adsorption capacity. After 60 min, the adsorption capacity remains approximately constant, meaning that a further increase in contact time is not justified.
Based on the fact that the adsorption capacity increased with the temperature increase, it can be deduced that the adsorption process of As(III) is influenced by temperature. However, it can also be seen that the increase in adsorption capacity with temperature increase is not significant, and further studies at temperatures above 298 K are not warranted.

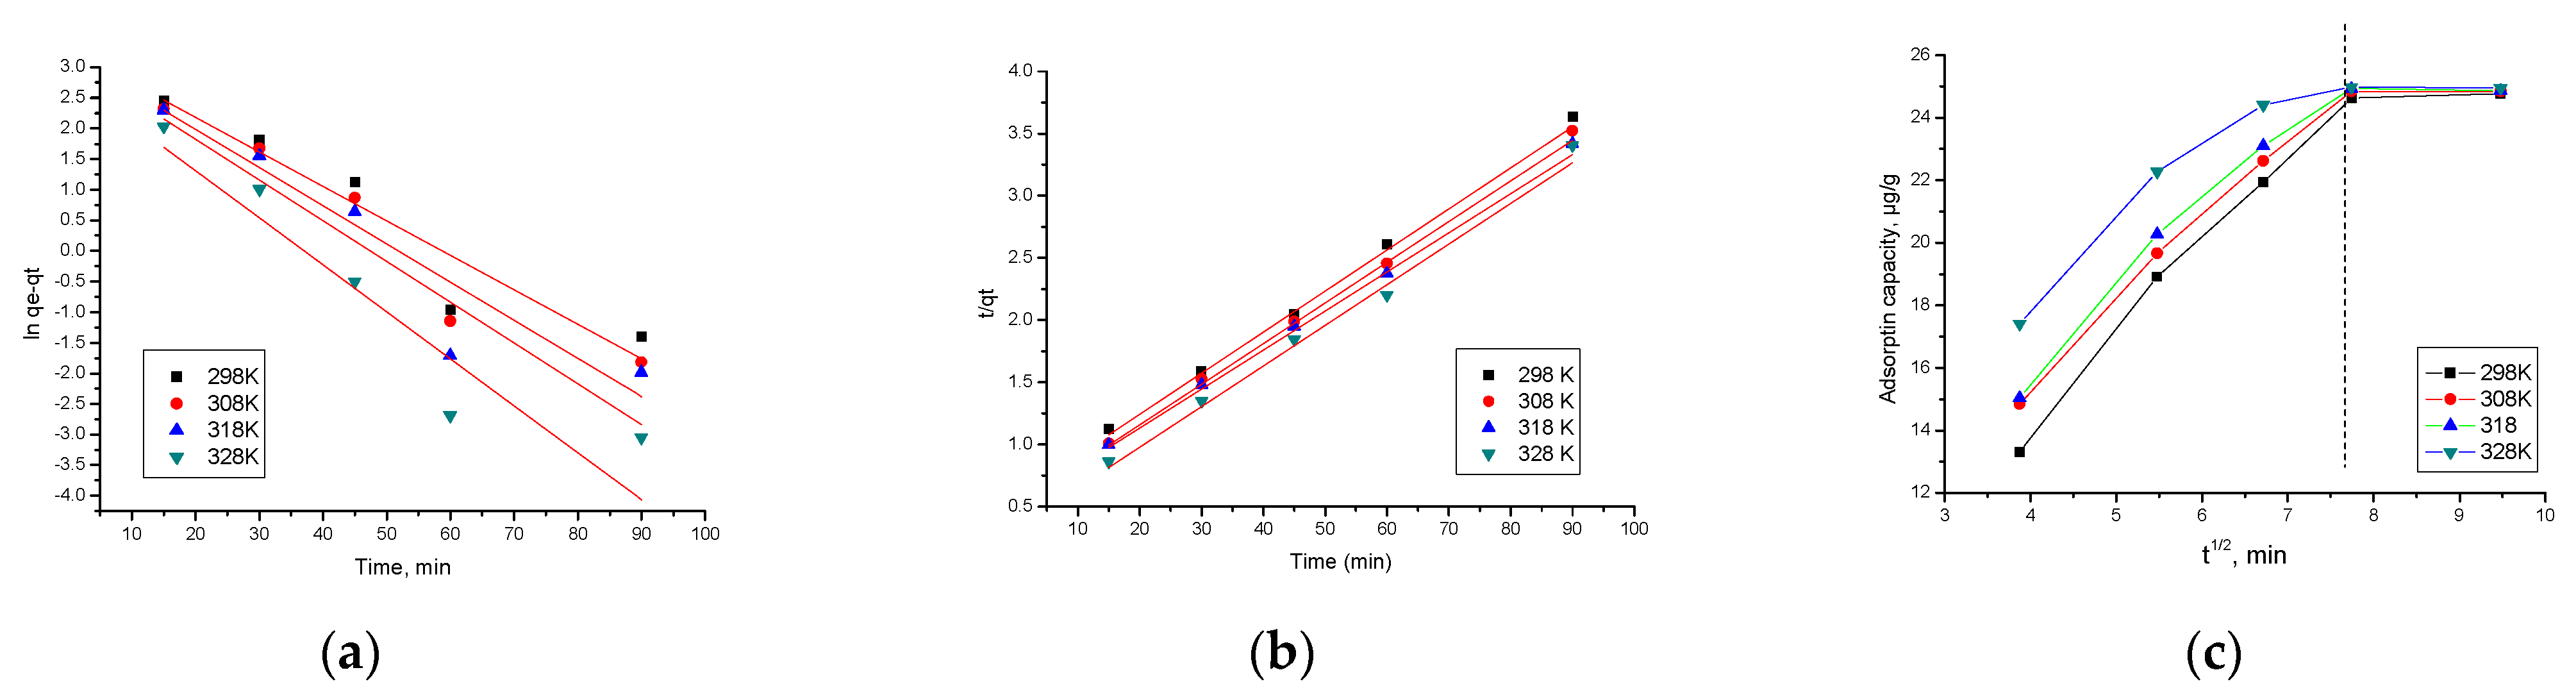
3.10. Kinetic Studies

In order to investigate the kinetics of the adsorption process of As(III) on SiO2 Fe(acac)3/NaF material, the obtained experimental data were modeled using the pseudo-first-order and pseudo-second-order kinetic equation.
Kinetic equations used to describe the pseudo-first-order model (Lagergren model) is [50]:
ln ( q e q t ) = lnq e k 1 t
where: qe—equilibrium adsorption capacity, µg/g; qt—adsorption capacity at t time, µg/g; k1—speed constant for pseudo-first order equation, 1/min; t—contact time, min.
For the pseudo-second-order one (model Ho and McKay) is [51]:
t q t = 1 k 2 q e 2 + t q e
where: qe—equilibrium adsorption capacity, µg/g; qt—adsorption capacity at t time, µg/g; k2—speed constant for pseudo-second order equation, g/µg∙min; t—contact time, min.
For the pseudo-first-order equation, the linear dependence ln(qe − qt) = f(t) was plotted, and from the equation k1 and qe,calc were calculated.
For the pseudo-second-order equation the linear dependence t/qt = f(t) was plotted. From the equation of the line, k2 and qe,calc were evaluated.
The kinetics of the adsorption process of As(III) on SiO2/Fe(acac)3/NaF material at different temperatures were studied. In Figure 15a,b pseudo-first-order and pseudo-second-order isotherms obtained at four different temperatures are shown.
In addition to the typical kinetic models, pseudo-first-order and pseudo-second-order, the intraparticle diffusion is also studied in this paper.
In order to distinguish whether film diffusion or intraparticle diffusion represent the speed determinant stage, the experimental data were modeled according to the Weber and Morris model [52]:
qt = kdiff·t1/2 + C
where: qt—adsorption capacity at t time, µg/g; kdiff—speed constant for intraparticle diffusion, µg/g·min1/2; C—constant correlated with the thickness of the liquid film surrounding the adsorbent particles.
Figure 15c shows the models for intraparticle diffusion at four different temperatures.
The values of speed constants, of the calculated adsorption capacity, as well as the values obtained for the kdiff and C parameters, following the modeling are presented in Table 4. The values of the regression coefficient, R2 are also presented in the same table.
Data presented in Table 4 demonstrate that the experimental data are modeled very well according to the pseudo-second-order kinetic model. This is supported by the value of the regression coefficient, R2~1 (0.9930–0.9973). In the case of modeling data according to the pseudo-first-order kinetic model, R2 is between 0.9076 and 0.8333. Furthermore, qe,calc based on the pseudo-second-order isotherm has values close to qe,exp. Temperature influences the values of the parameters k2, qe,calc, but not significantly, meaning that we consider it necessary to work at temperatures higher than 298 K.
At the same time, it can be observed from Figure 15c that the intraparticle diffusion graph present a multi-linearity of the As(III) adsorption, signifying that the entire adsorption process, can be divided into two different stages [53,54]. Based on the model proposed by Webber and Morris, if the intraparticle diffusion represents the limiting step, the dependence of qt = f(t1/2) must be a straight line passing through the origin [54,55]. The more pointed part of the graph is associated with the As(III) ions diffusion from the solution to the external surface of the used adsorbent. The second part of the adsorption process is associated with the adsorption process where the rate-limiting factor is the intraparticle diffusion process [54,55].
The adsorption rate is correlated with the slope of each linear segment presented in Figure 15c, a higher slope being correlated with a fasted adsorption of As(III) onto the studied adsorbent material [53,56]. From this figure, it can be observed that the slope of the first linear dependence is higher than the slope of the second linear dependence, meaning that stage 1 of the adsorption represents the velocity determinant stage, and the intraparticulate diffusion represents the limiting speed rate in stage two due to the low availability of the As(III) ions into the solution [54,57]. From the data presented in Table 4, it can be observed that with increasing temperature, the kdiff value also increases.

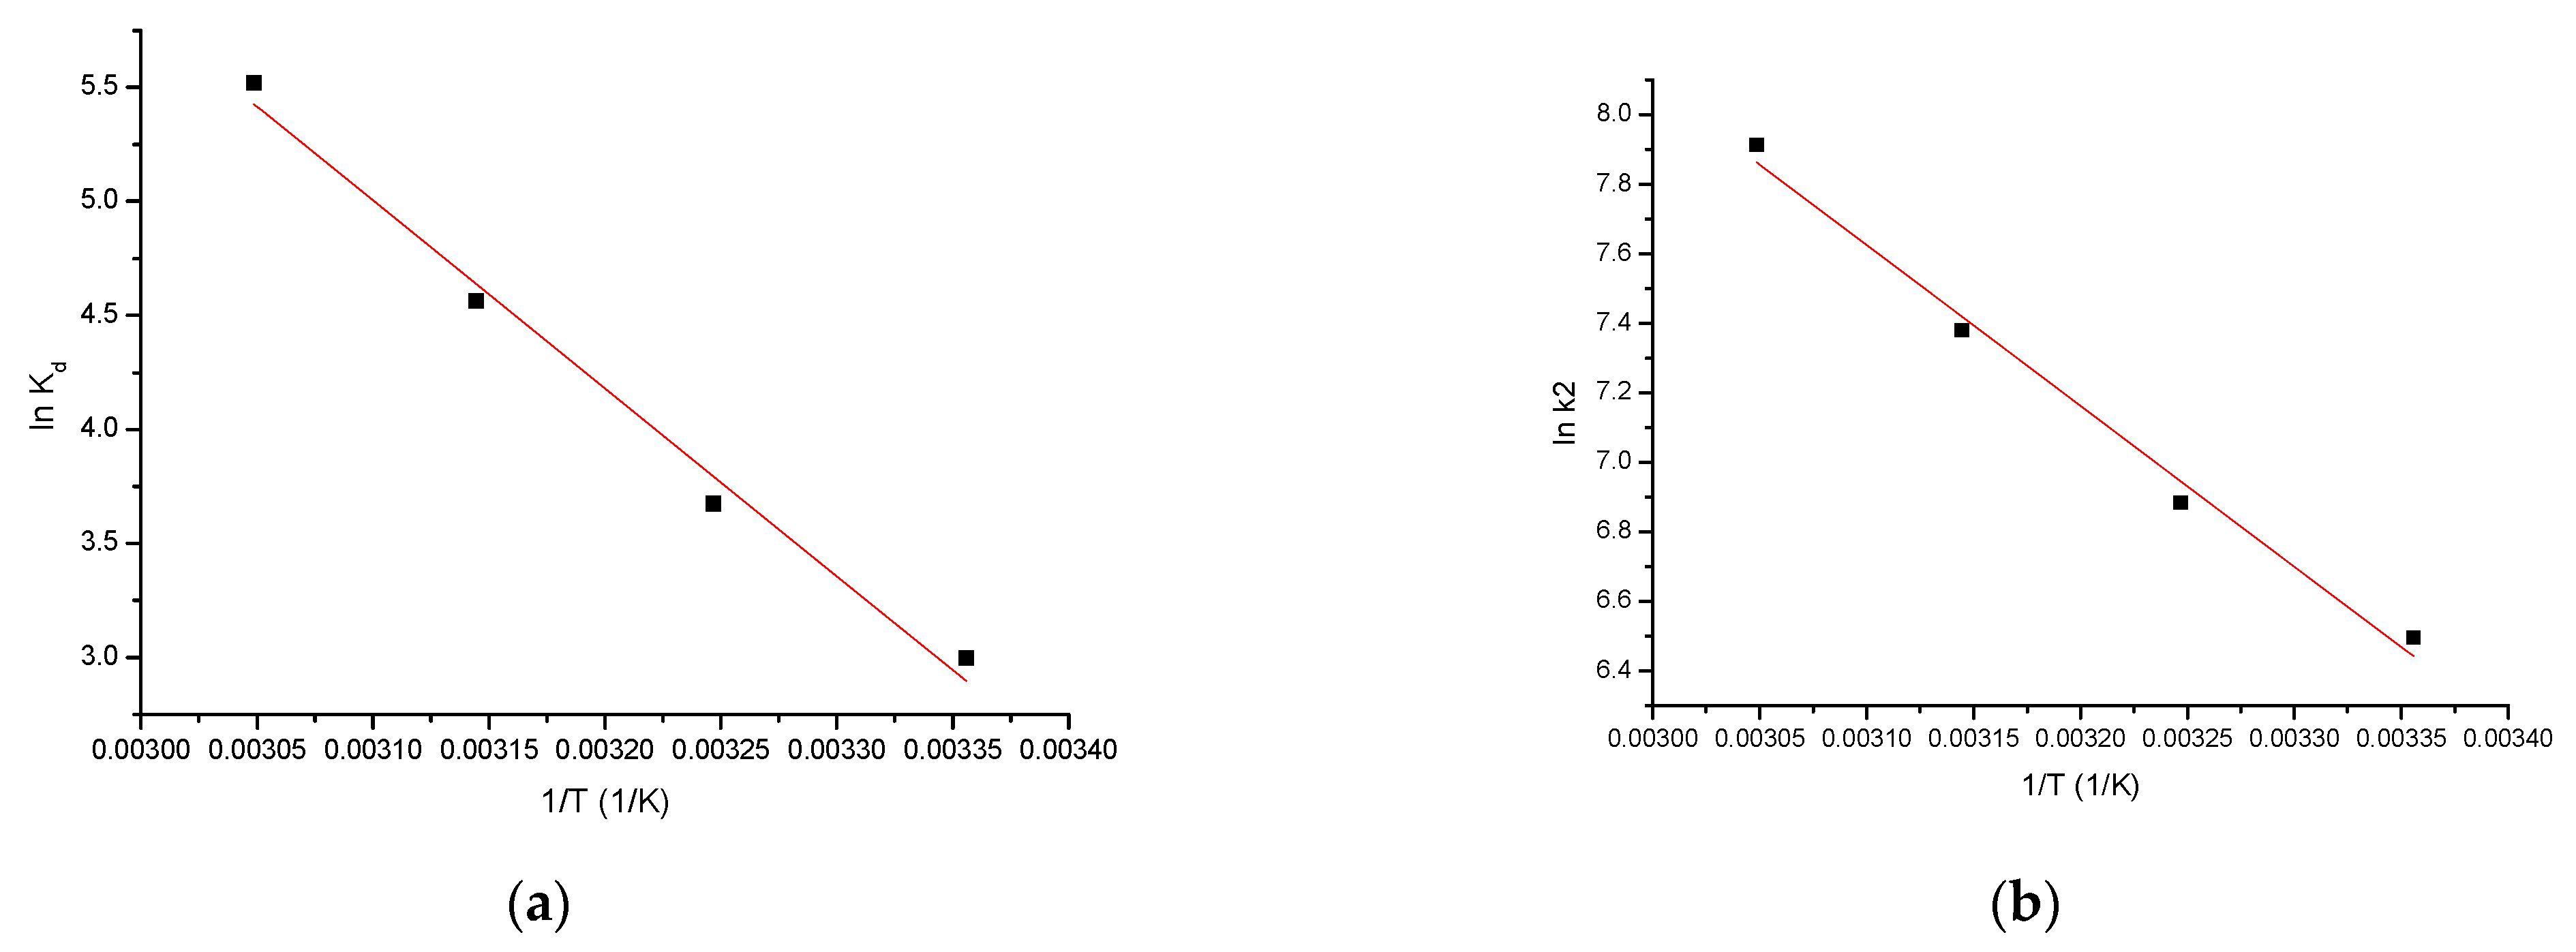
3.11. Theromdinamic Studies

Thermodynamic studies were performed in the temperature range 298–328 K. The value of the Gibbs free energy was calculated using the Gibbs-Helmholtz equation [58].
Δ G = Δ H T Δ S
where: ΔG°—standard Gibbs free energy variation, kJ/mol; ΔH°—standard enthalpy variation, kJ/mol; ΔS°—standard entropy variation, J/mol∙K; T—absolute temperature, K.
Firstly, the values of standard variation of the entropy ΔS° and the standard variation of the enthalpy ΔH° were evaluated, from the linear dependence ln Kd = f(1/T) (based on van’t Hoff equation):
ln K d = Δ S R Δ H RT
where: Kd—equilibrium constant; ΔS°—standard entropy variation, J/mol∙K; ΔH°—standard enthalpy variation, kJ/mol; R—the ideal gas constant, 8.314 J/mol∙K.
The equilibrium constant is the ratio between the adsorption capacity at equilibrium qe and the equilibrium concentration Ce.
K d = q e C e
In Figure 16a, the line ln Kd = f(1/T) will be represented.
For the adsorption of As(III) by the SiO2/Fe(acac)3/NaF material, the activation energy Ea was calculated, using the Arrhenius equation and the velocity constant from the pseudo-second-order kinetic model.
ln k 2 = lnA E a RT
where: k2—Speed constant, g/min∙mg; A—Arrhenius constant, g∙min/mg; Ea—Activation energy, kJ/mol; T—absolute temperature, K; R—The ideal gas constant, 8.314 J/mol∙K.
Th value of activation energy can provide information about the nature of the adsorption process, including whether it is physical or chemical. The value of the activation energy for the As(III) adsorption on SiO2/Fe(acac)3/NaF was calculated from the equation of the linear dependence between ln k2 and (1/T) (Figure 16b).
Table 5 shows the thermodynamic parameters resulting from the three temperatures.
From the resulting data, it can be observed that ΔH0 has a positive value, which means that the adsorption process is endothermic. At the same time, when the is value between 80 and 400 kJ/mol, the process can be considered physical [59].
It is also observed that ΔG0 has negative values and increases in absolute value with temperature increase, which indicates that the adsorption process is spontaneous and influenced by temperature. A positive value of ΔS0 indicates the favorability of the adsorption process, operating at the interface of the material SiO2/Fe(acac)3/NaF/solution and As(III).
It is observed that the activation energy (4.13 kJ/mol) is < 40 kJ/mol, which means that the adsorption process is physical in nature [59].

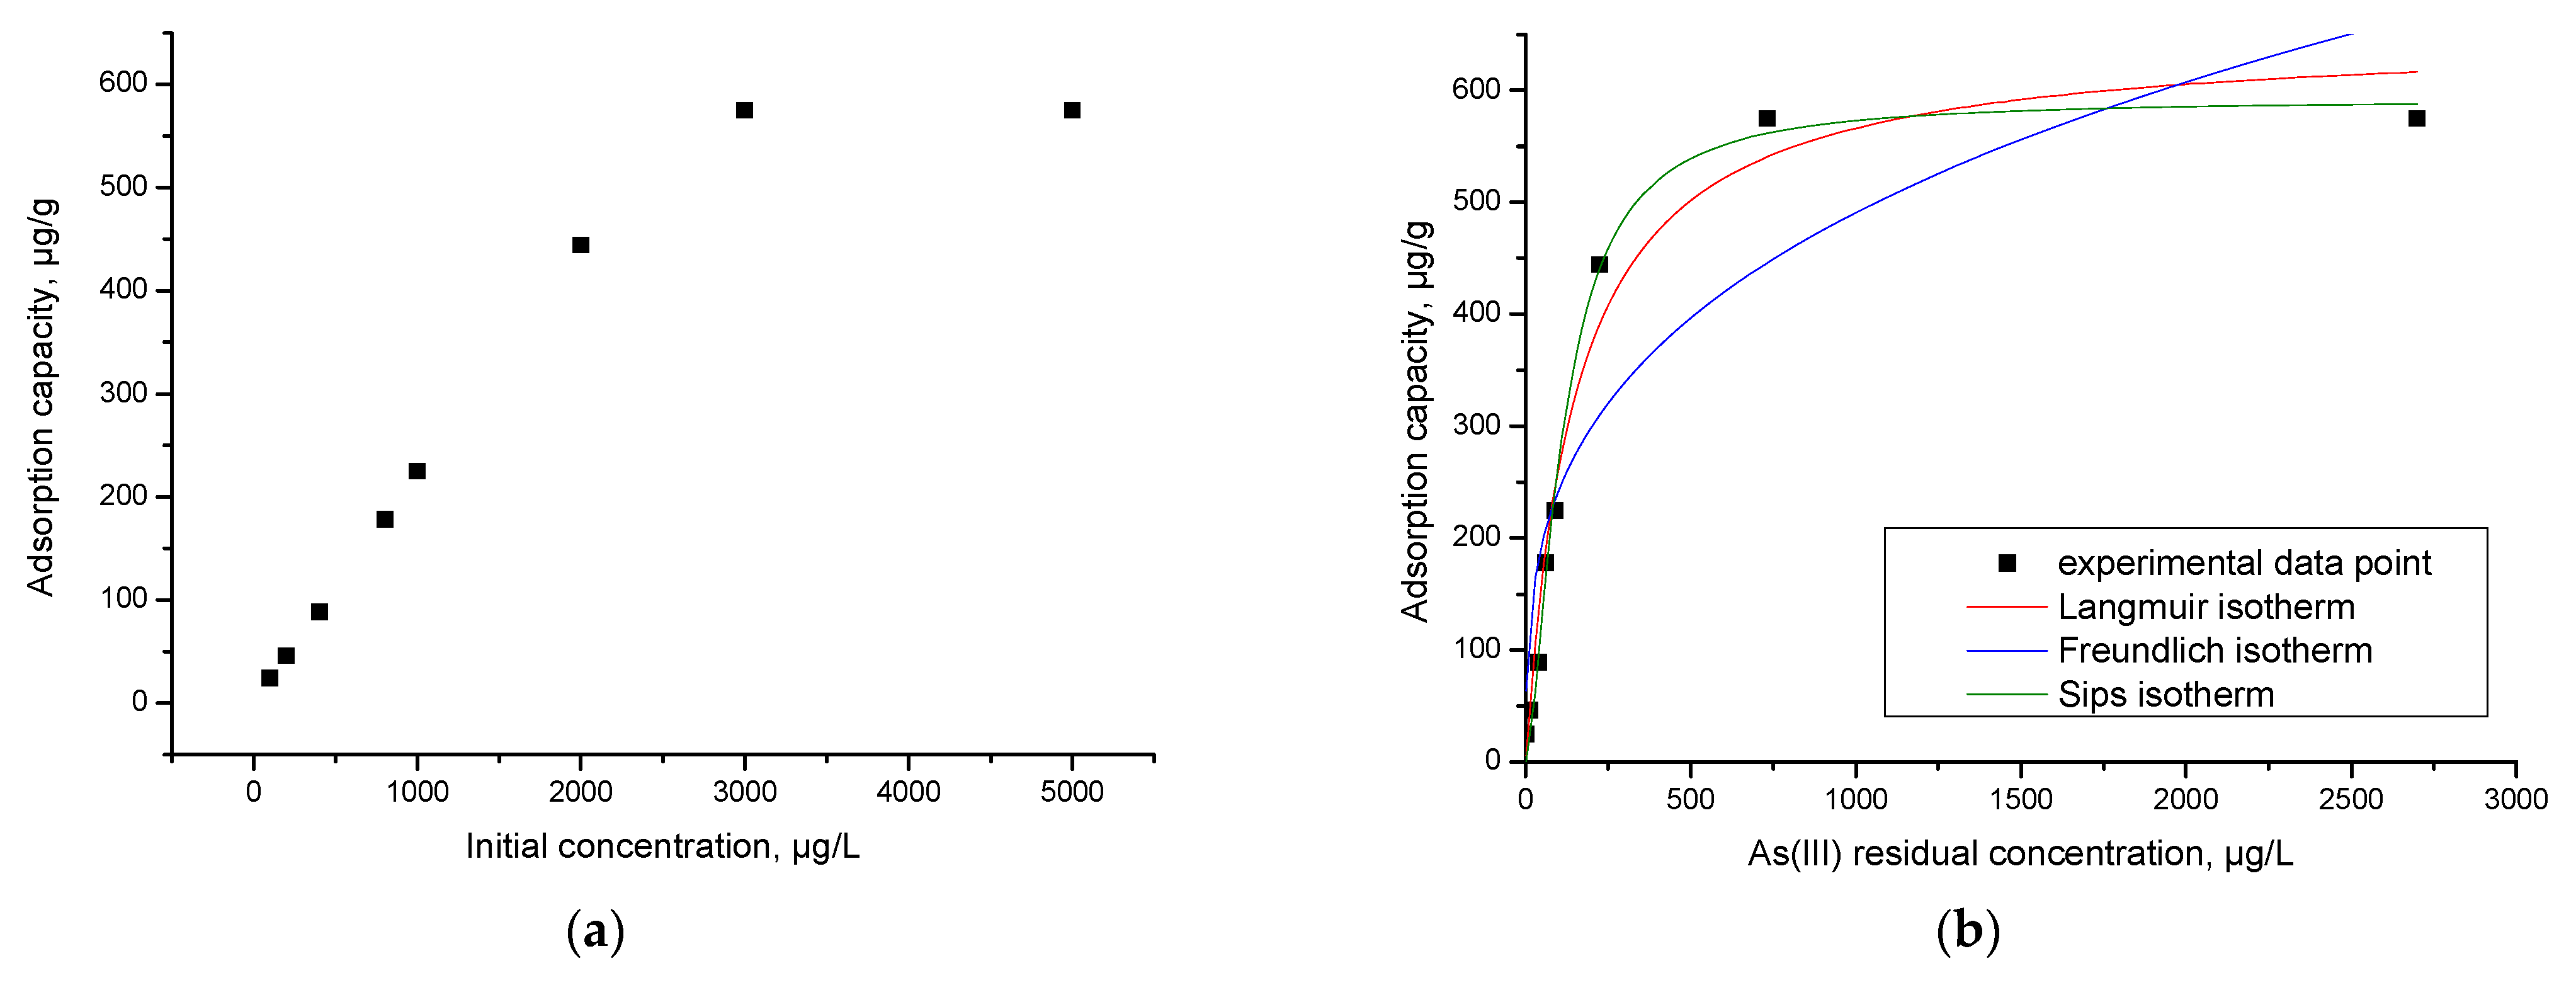
3.12. Initial Concentration Effect. Equilibrium Studies

The maximum adsorption capacity at equilibrium can be evaluated by taking into account the distribution of As(III) ions between the prepared adsorbent and arsenic aqueous solution. In this context, another parameter which influences the adsorption process is the initial concentration of the As(III) ions into the solution. In this case, the obtained experimental data are depicted in Figure 17a. In order to establish the adsorption mechanism, the obtained experimental data were modeled using three different isotherms: Langmuir, Freundlich and Sips. The Langmuir isotherm [60] assumes that the adsorbents have an ideal surface, and the adsorbate presents ideal gas behavior. Based on this model, the maximum adsorption capacity of the material by using the nonlinear expression can be determined by:
q e = q L K L C e 1 + K L C e
where: qL—Langmuir maximum adsorption capacity, mg/g; KL—Langmuir constant.
The linearized form of the Langmuir isotherm used for modeling is:
C e q e = 1 q L K L + C e q L
The Freundlich isotherm model assumes that the surface area of the material with adsorbent properties is heterogeneous, meaning that the heat distribution required for the adsorption process on the surface of the adsorbent material is uneven, and multilayer adsorption can occur due to unlimited active centers. The Freundlich isotherm is an empirical isotherm [61] given by the relationship:
q e = K F C e 1 / n F
where: KF and nF—characteristic constants that may be related to the relative adsorption capacity of the adsorbent and the adsorption intensity.
The linear shape of the Freundlich isotherm is:
logq e =   logK F + 1 / n F logC e
Sips Isotherm [62] was derived from the isotherms Langmuir and Freundlich. In the case of low adsorbate concentrations, Sips isotherm is reduced to that of Freundlich, and in the case of higher adsorbate concentration it is reduced to the Langmuir isotherm. Therefore, this isotherm can be used to calculate the adsorption capacity. The nonlinear equation of the Sips isotherm is:
q e = q S K S C e 1 / n S 1 + K s C e 1 / n S
where: KS—constant related to the adsorption capacity of the adsorbent; nS—heterogeneity factor.
The isotherms obtained by the graphical representation of qe = f(Ce) are shown in Figure 17b.
Analyzing the obtained experimental data presented in Figure 17a reveals that the maximum adsorption capacity increases with the increase in the As(III) initial concentration until a maximum adsorption capacity (575.1 μg/g) was obtained.
The specific parameters of each isotherm used to model the experimental data are obtained from the slopes of the straight line and by using the ordinate from the origin (Table 6).
The dependence between the equilibrium concentration (Ce) of As(III) and the adsorption capacity demonstrates that at the increase in the equilibrium concentration, the maximum adsorption capacity (qe, exp) also increases until equilibrium is reached.
According to the data in Table 6, the model that best describes the adsorption process is the Sips isotherm, because the regression coefficient, R2, is closest to 1 (R2 = 0.9916).
It is well known that the Sips model is a combination of the Langmuir and Freundlich models, which can be identified if: (i) the studied adsorption is an homogeneous process; (ii) adsorption occurs by the interaction of a solute molecule with an active centre from the sorbent surface; (iii) the sorbent surface contains a limited number of active centres; (iv) at equilibrium they are only partially occupied, regardless of the temperature at which the adsorption process is taking place; (v) the adsorption takes place on the surface of the sorbent resulting in a monolayer, the solute molecules being retained only on the sorbent-free surface; (vi) not all active centres on the surface of the sorbent are equal in energy; (vii) there may be some interactions between the solute molecules, and, therefore, once the sorbent surface is coated, additional solute molecules may still be adsorbed; and (viii) it can be used to describe the adsorption processes of solute molecules in multilayer [63]. The maximum adsorption capacity of As(III) on the adsorbent material was q = 575.1 µg/g for an initial concentration of C = 500 µg/L.
Based on data from the literature, a comparison of the material studied for the recovery of As(III) with other materials (Table 7) was showed that the SiO2/Fe(acac)3/NaF material has good adsorption capacity.

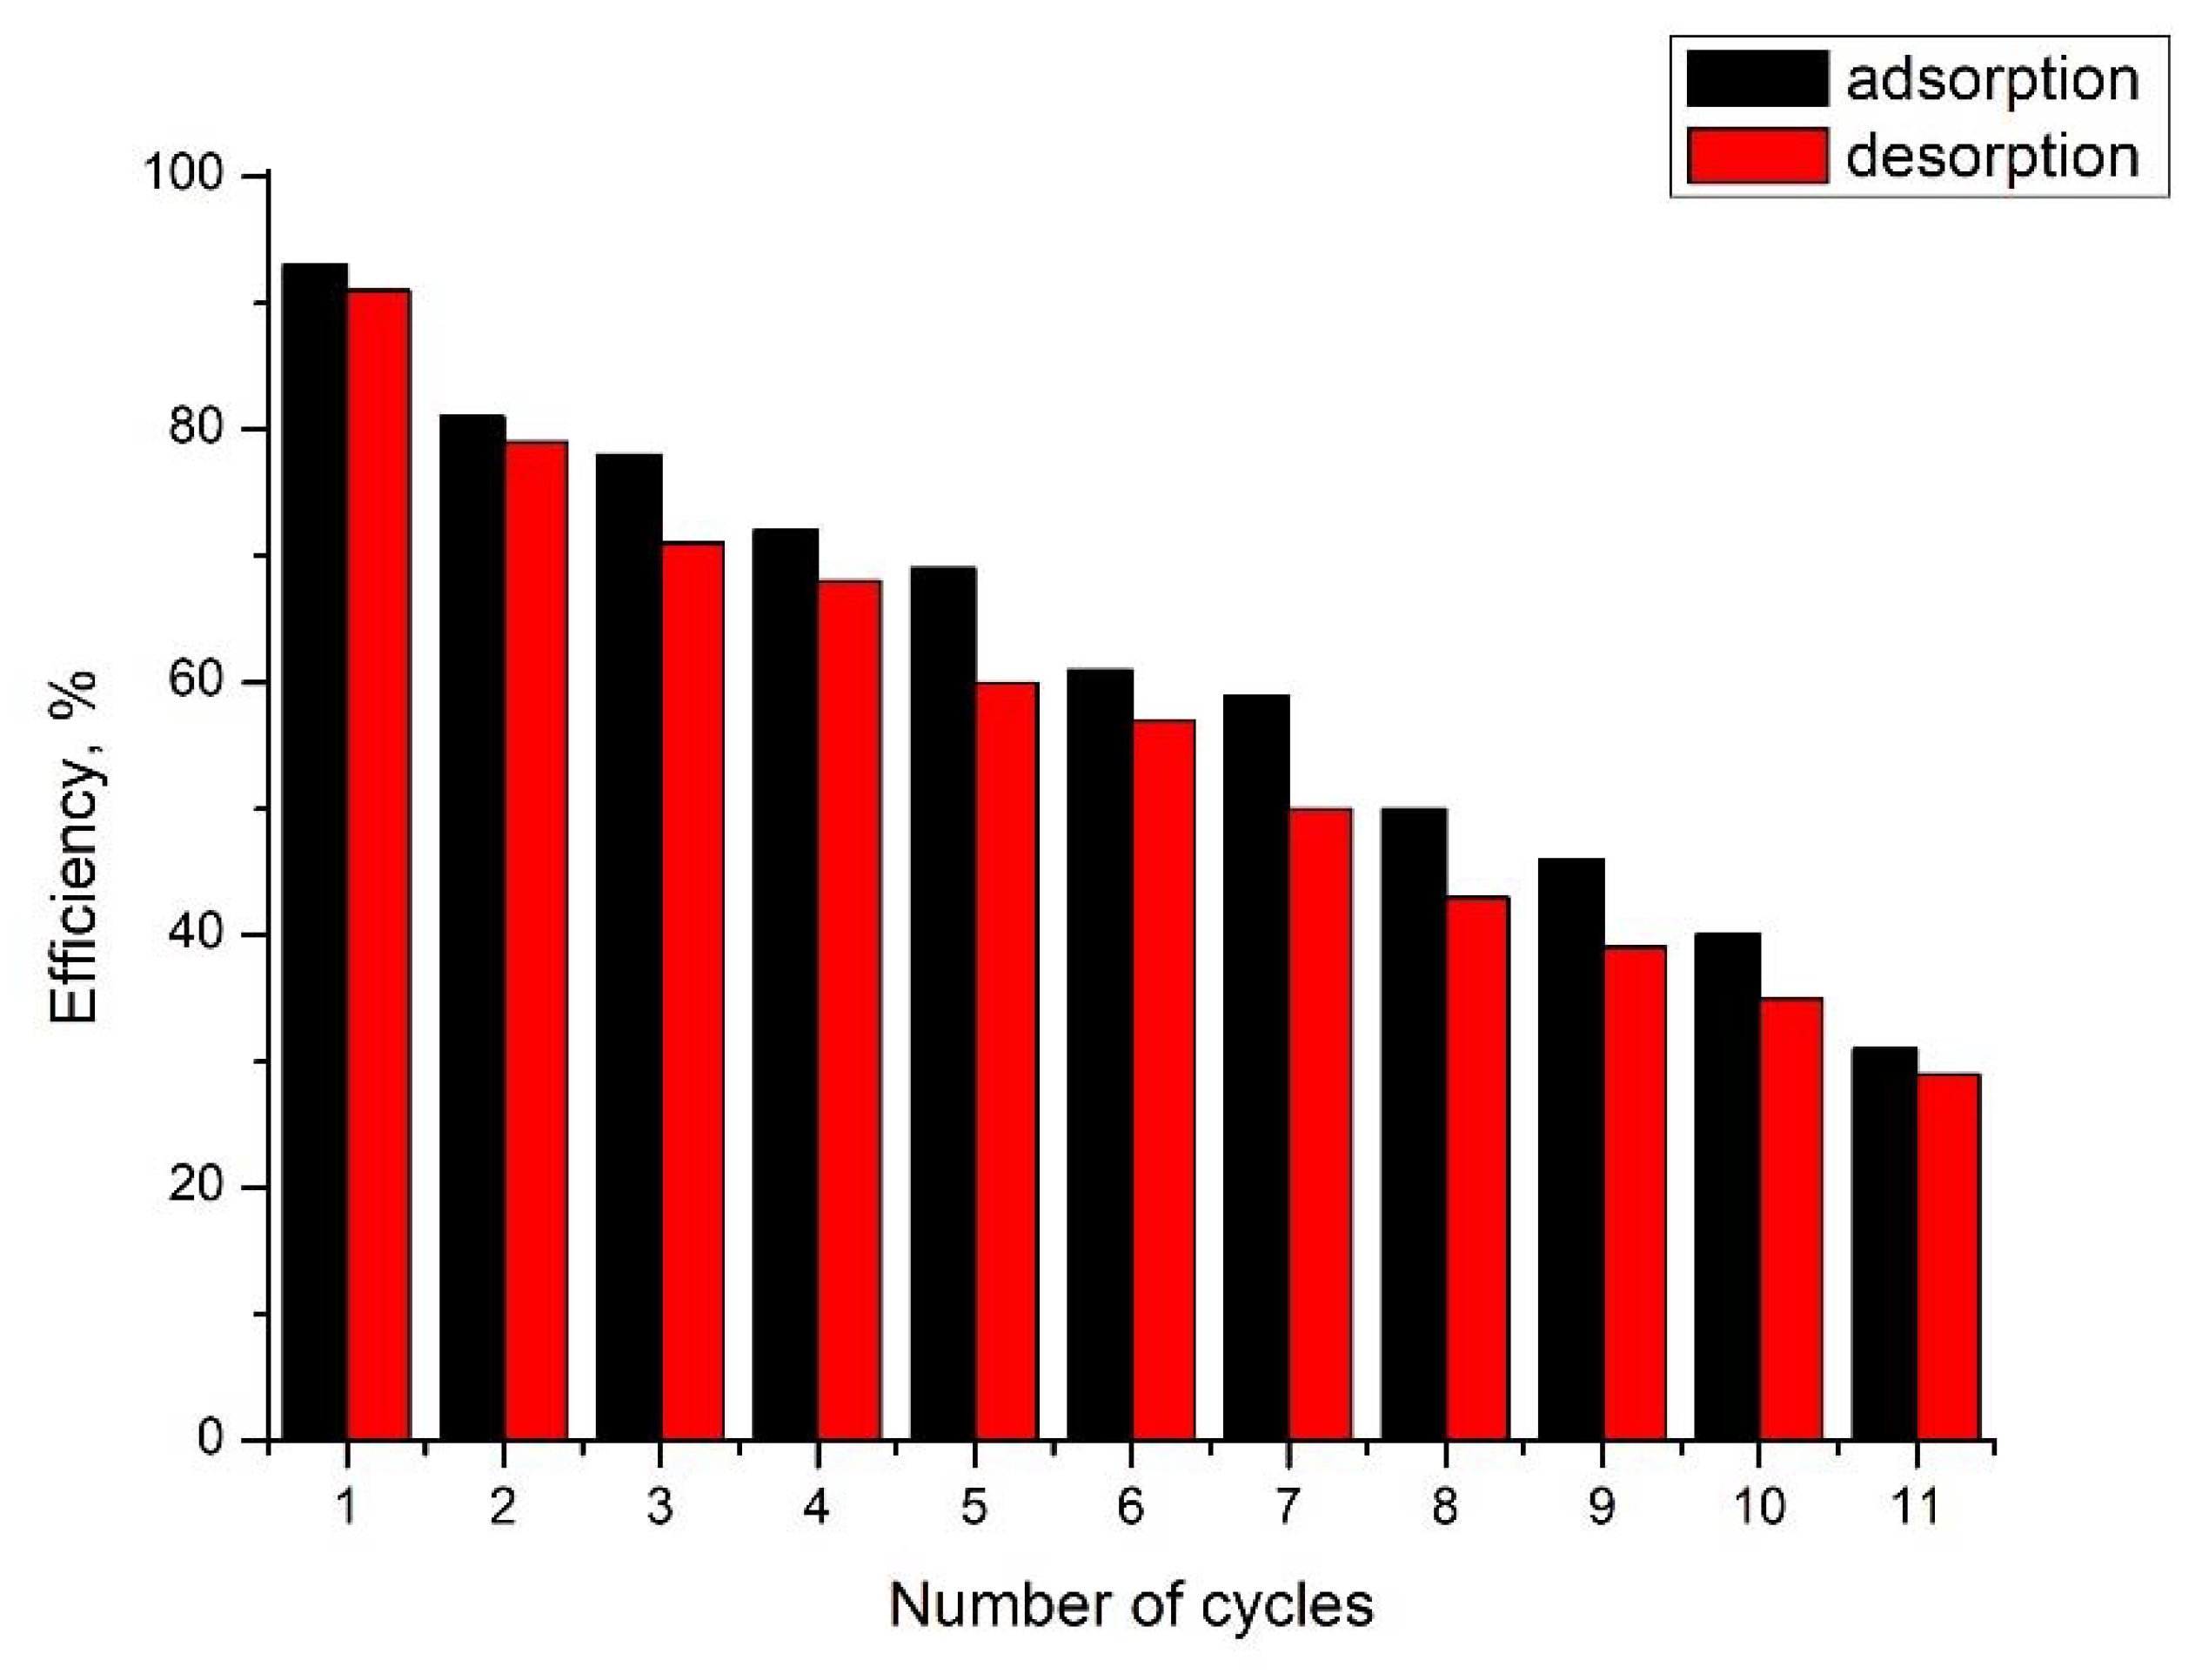
3.13. Arsenic Adsorption/Desorption Studies

Desorption studies have shown that 93% of the adsorbed As(III) can be desorbed from the material using 5% HCl. Data regarding adsorption/desorption cycles are presented in Figure 18. Analyzing the data presented in Figure 18 allows us to observe that the newly produced adsorbent material can be reused with good efficiency for 11 adsorption/desorption cycles.

Arsenic Removal from Real Ground Water, Competing Ions Influence

From the obtained experimental data, it was found that the use of SiO2/Fe(acac)3/NaF material allows the removal of As(III) from real water (Table 8). From this, we can conclude that following the adsorption process, the content of foreign ions present in the water positively influences the process. Thus, the content of As(III) decreases reaching the limits allowed by the World Health Organization, WHO [70].
At the same time, the concentration of Mnn+ and Fen+ decreases, reaching the limits allowed by the legislation.

4. Conclusions

In our study, we obtained a novel material based on SiO2, Fe(acac)3 and NaF as a porogenic agent, which was studied from the phase composition point of view, indicating that no impurities were found in the materials, as well as providing the proof that the bonds were formed between the compounds as observed in the Raman and FT-IR spectra. The AFM studies provided us the information regarding the surface of the material, indicating that our material is porous and formed layer-by-layer by sheets forming in round clusters. The surface area of SiO2/Fe(acac)3/NaF determined with BET method indicates a value of 276 m2/g. The magnetization saturation indicates a value of 0.74 emu/g.
The arsenic recovery process takes place under the following conditions: pH in the range of 6–8, contact time 60 min and temperature 298 K. Based on the results obtained, kinetic, thermodynamic and equilibrium studies were performed. By modeling the experimental data, we can observe that the pseudo-second-order isotherm model is the one that best describes the process.
To distinguish whether film diffusion or intraparticle diffusion is the determinant speed step, the kinetic experimental data were processed using the Weber–Morris model.
For SiO2/Fe(acac)3/NaF material, the porous structure allows the adsorption sites to be placed inside the surface of the adsorbent channels, which indicates that As(III) is adsorbed on the surface of SiO2/Fe(acac)3/NaF (step 1), and then the adsorption process reaches equilibrium (step 2), which means that the intraparticle diffusion is not a limiting step during adsorption. Adsorption is performed in the film. The activation energy, Ea, was also determined by the fact that the adsorption process is of a physical nature.
Thermodynamic studies have established that the adsorption process is endothermic, spontaneous and influenced by temperature, and that the adsorption process takes place at the interface of the material SiO2/Fe(acac)3/NaF/solution with As(III). Following the equilibrium studies, the Sips model is the one that best describes the adsorption process, establishing the maximum adsorption capacity of SiO2FexOy SiO2/Fe(acac)3/NaF material as 575.1 µg As(III)/g material. Desorption studies have confirmed that the adsorption process is controlled by pH, so that if the process proceeds at pH = 6–8, the material can be recovered and reused with high efficiency.
We can conclude that the SiO2/Fe(acac)3/NaF material can be successfully used for the recovery of As(III) from aqueous solutions, by adsorption. At the same time, the material can be used to obtain drinking water, which complies with the WHO recommendations in terms of arsenic content. Repeated cycles of adsorption/desorption may also be used.

Author Contributions

Investigation, G.M., M.C., P.N., P.I. and C.I.; Methodology, C.I.; Validation, M.C., A.N. and N.D.; Writing—original draft, A.N. and N.D.; Writing—review & editing, N.D. All authors have read and agreed to the published version of the manuscript.

Funding

This work was supported by a grant of the Romanian Ministry of Research, Innovation and Digitalization, project number PFE 26/30.12.2021, PERFORM-CDI@UPT100- The increasing of the performance of the Polytechnic University of Timișoara by strengthening the research, development and technological transfer capacity in the field of “Energy, Environment and Climate Change” at the beginning of the second century of its existence, within Program 1-Development of the national system of Research and Development, Subprogram 1.2-Institutional Performance—Institutional Development Projects-Excellence Funding Projects in RDI, PNCDI III”.

Conflicts of Interest

The authors declare no conflict of interest.

References

  1. Rathi, B.S.; Kumar, P.S. A review on sources, identification and treatment strategies for the removal of toxic Arsenic from water system. J. Hazard. Mater. 2021, 418, 126299. [Google Scholar] [CrossRef]
  2. Abhinaya, M.; Parthiban, R.; Kumar, P.S.; Vo, D.-V.N. A review on cleaner strategies for extraction of chitosan and its application in toxic pollutant removal. Environ. Res. 2021, 196, 110996. [Google Scholar] [CrossRef] [PubMed]
  3. Kumar, M.; Goswami, R.; Patel, A.K.; Srivastava, M.; Das, N. Scenario, perspectives and mechanism of arsenic and fluoride Co-occurrence in the groundwater: A review. Chemosphere 2020, 249, 126126. [Google Scholar] [CrossRef]
  4. Mandal, B.K.; Suzuki, K.T. Arsenic round the world: A review. Talanta 2002, 58, 201–235. [Google Scholar] [CrossRef]
  5. Alka, S.; Shahir, S.; Ibrahim, N.; Ndejiko, M.J.; Vo, D.-V.N.; Manan, F.A. Arsenic removal technologies and future trends: A mini review. J. Clean. Prod. 2021, 278, 123805. [Google Scholar] [CrossRef]
  6. Garelick, H.; Jones, H.; Dybowska, A.; Valsami-Jones, E. Arsenic Pollution Sources. In Reviews of Environmental Contamination Volume 197: International Perspectives on Arsenic Pollution and Remediation; Springer: New York, NY, USA, 2008; pp. 17–60. [Google Scholar]
  7. Ratnaike, R.N. Acute and chronic arsenic toxicity. Postgrad. Med. J. 2003, 79, 391–396. [Google Scholar] [CrossRef] [PubMed]
  8. Szymańska-Chabowska, A.; Antonowicz-Juchniewicz, J.; Andrzejak, R. Some aspects of arsenic toxicity and carcinogenicity in living organism with special regard to its influence on cardiovascular system, blood and bone marrow. Int. J. Occup. Med. Environ. Health 2002, 15, 101–116. [Google Scholar] [PubMed]
  9. Duker, A.A.; Carranza, E.J.M.; Hale, M. Arsenic geochemistry and health. Environ. Int. 2005, 31, 631–641. [Google Scholar] [CrossRef] [PubMed]
  10. Kapaj, S.; Peterson, H.; Liber, K.; Bhattacharya, P. Human Health Effects From Chronic Arsenic Poisoning–A Review. J. Environ. Sci. Health Part A 2006, 41, 2399–2428. [Google Scholar] [CrossRef]
  11. Berg, M.; Tran, H.C.; Nguyen, T.C.; Pham, H.V.; Schertenleib, R.; Giger, W. Arsenic Contamination of Groundwater and Drinking Water in Vietnam:  A Human Health Threat. Environ. Sci. Technol. 2001, 35, 2621–2626. [Google Scholar] [CrossRef] [Green Version]
  12. Chung, J.-Y.; Yu, S.-D.; Hong, Y.-S. Environmental Source of Arsenic Exposure. J. Prev. Med. Public Health 2014, 47, 253–257. [Google Scholar] [CrossRef] [Green Version]
  13. Choong, T.S.Y.; Chuah, T.G.; Robiah, Y.; Gregory Koay, F.L.; Azni, I. Arsenic toxicity, health hazards and removal techniques from water: An overview. Desalination 2007, 217, 139–166. [Google Scholar] [CrossRef]
  14. Smedley, P.L.; Kinniburgh, D.G. A review of the source, behaviour and distribution of arsenic in natural waters. Appl. Geochem. 2002, 17, 517–568. [Google Scholar] [CrossRef] [Green Version]
  15. Vaclavikova, M.; Gallios, G.P.; Hredzak, S.; Jakabsky, S. Removal of arsenic from water streams: An overview of available techniques. Clean Technol. Environ. Policy 2008, 10, 89–95. [Google Scholar] [CrossRef]
  16. Ungureanu, G.; Santos, S.; Boaventura, R.; Botelho, C. Arsenic and antimony in water and wastewater: Overview of removal techniques with special reference to latest advances in adsorption. J. Environ. Manag. 2015, 151, 326–342. [Google Scholar] [CrossRef] [PubMed]
  17. Rathi, B.S.; Kumar, P.S.; Show, P.-L. A review on effective removal of emerging contaminants from aquatic systems: Current trends and scope for further research. J. Hazard. Mater. 2021, 409, 124413. [Google Scholar] [CrossRef] [PubMed]
  18. Rathi, B.S.; Kumar, P.S.; Ponprasath, R.; Rohan, K.; Jahnavi, N. An effective separation of toxic arsenic from aquatic environment using electrochemical ion exchange process. J. Hazard. Mater. 2021, 412, 125240. [Google Scholar] [CrossRef]
  19. Saravanan, A.; Karishma, S.; Kumar, P.S.; Varjani, S.; Yaashikaa, P.R.; Jeevanantham, S.; Ramamurthy, R.; Reshma, B. Simultaneous removal of Cu(II) and reactive green 6 dye from wastewater using immobilized mixed fungal biomass and its recovery. Chemosphere 2021, 271, 129519. [Google Scholar] [CrossRef]
  20. Saravanan, A.; Kumar, P.S.; Jeevanantham, S.; Karishma, S.; Yaashikaa, P.R. Modeling analysis on the effective elimination of toxic pollutant from aquatic environment using pyrolysis assisted palmyra palm male inflorescence. Environ. Res. 2021, 197, 111146. [Google Scholar] [CrossRef] [PubMed]
  21. Saravanan, A.; Kumar, P.S.; Yaashikaa, P.R.; Karishma, S.; Jeevanantham, S.; Swetha, S. Mixed biosorbent of agro waste and bacterial biomass for the separation of Pb(II) ions from water system. Chemosphere 2021, 277, 130236. [Google Scholar] [CrossRef]
  22. Saravanan, A.; Senthil Kumar, P.; Jeevanantham, S.; Karishma, S.; Tajsabreen, B.; Yaashikaa, P.R.; Reshma, B. Effective water/wastewater treatment methodologies for toxic pollutants removal: Processes and applications towards sustainable development. Chemosphere 2021, 280, 130595. [Google Scholar] [CrossRef] [PubMed]
  23. Gulledge, J.H.; O’Connor, J.T. Removal of Arsenic (V) From Water by Adsorption on Aluminum and Ferric Hydroxides. J. AWWA 1973, 65, 548–552. [Google Scholar] [CrossRef]
  24. Amen, R.; Bashir, H.; Bibi, I.; Shaheen, S.M.; Niazi, N.K.; Shahid, M.; Hussain, M.M.; Antoniadis, V.; Shakoor, M.B.; Al-Solaimani, S.G.; et al. A critical review on arsenic removal from water using biochar-based sorbents: The significance of modification and redox reactions. Chem. Eng. J. 2020, 396, 125195. [Google Scholar] [CrossRef]
  25. Gayathri, R.; Gopinath, K.P.; Kumar, P.S. Adsorptive separation of toxic metals from aquatic environment using agro waste biochar: Application in electroplating industrial wastewater. Chemosphere 2021, 262, 128031. [Google Scholar] [CrossRef]
  26. Yaashikaa, P.R.; Kumar, P.S.; Varjani, S.; Saravanan, A. A critical review on the biochar production techniques, characterization, stability and applications for circular bioeconomy. Biotechnol. Rep. 2020, 28, e00570. [Google Scholar] [CrossRef]
  27. Lata, S.; Samadder, S.R. Removal of arsenic from water using nano adsorbents and challenges: A review. J. Environ. Manag. 2016, 166, 387–406. [Google Scholar] [CrossRef]
  28. Arora, R. Nano adsorbents for removing the arsenic from waste/ground water for energy and environment management—A review. Mater. Today Proc. 2021, 45, 4437–4440. [Google Scholar] [CrossRef]
  29. Thekkudan, V.N.; Vaidyanathan, V.K.; Ponnusamy, S.K.; Charles, C.; Sundar, S.; Vishnu, D.; Anbalagan, S.; Vaithyanathan, V.K.; Subramanian, S. Review on nanoadsorbents: A solution for heavy metal removal from wastewater. IET Nanobiotechnol. 2017, 11, 213–224. [Google Scholar] [CrossRef]
  30. Gallegos-Garcia, M.; Ramírez-Muñiz, K.; Song, S. Arsenic Removal from Water by Adsorption Using Iron Oxide Minerals as Adsorbents: A Review. Miner. Process. Extr. Metall. Rev. 2012, 33, 301–315. [Google Scholar] [CrossRef]
  31. Habuda-Stanić, M.; Nujić, M. Arsenic removal by nanoparticles: A review. Environ. Sci. Pollut. Res. 2015, 22, 8094–8123. [Google Scholar] [CrossRef]
  32. Liu, B.; Kim, K.-H.; Kumar, V.; Kim, S. A review of functional sorbents for adsorptive removal of arsenic ions in aqueous systems. J. Hazard. Mater. 2020, 388, 121815. [Google Scholar] [CrossRef] [PubMed]
  33. Liu, X.; Xu, H.; Wang, L.; Qu, Z.; Yan, N. Surface nano-traps of Fe0/COFs for arsenic(III) depth removal from wastewater in non-ferrous smelting industry. Chem. Eng. J. 2020, 381, 122559. [Google Scholar] [CrossRef]
  34. Dias, A.C.; Fontes, M.P.F. Arsenic (V) removal from water using hydrotalcites as adsorbents: A critical review. Appl. Clay Sci. 2020, 191, 105615. [Google Scholar] [CrossRef]
  35. Toyos-Rodríguez, C.; Calleja-García, J.; Torres-Sánchez, L.; López, A.; Abu-Dief, A.M.; Costa, A.; Elbaile, L.; Crespo, R.D.; Garitaonandia, J.S.; Lastra, E.; et al. A Simple and Reliable Synthesis of Superparamagnetic Magnetite Nanoparticles by Thermal Decomposition of Fe(acac)3. J. Nanomater. 2019, 2019, 2464010. [Google Scholar] [CrossRef] [Green Version]
  36. Khanna, S.; Utsav; Marathey, P.; Paneliya, S.; Vanpariya, A.; Ray, A.; Banerjee, R.; Mukhopadhyay, I. Fabrication of silicon nanohorns via soft lithography technique for photoelectrochemical application. Int. J. Hydrogen Energy 2021, 46, 16404–16413. [Google Scholar] [CrossRef]
  37. Nandanwar, R.; Bamne, J.; Singh, N.; Sharma, P.K.; Singh, P.; Umar, A.; Haque, F.Z. Synthesis of Titania/Silica Nanocomposite for Enhanced Photodegradation of Methylene Blue and Methyl Orange Dyes under UV and Mercury Lights. ES Mater. Manuf. 2022, 16, 78–88. [Google Scholar] [CrossRef]
  38. Utsav; Khanna, S.; Makani, N.H.; Paneliya, S.; Mukhopadhyay, I.; Banerjee, R. Thermal crowning mechanism in gold–silica nanocomposites: Plasmonic-photonic pairing in archetypal two-dimensional structures. Phys. Chem. Chem. Phys. 2021, 23, 17197–17207. [Google Scholar] [CrossRef]
  39. Ianăşi, C.; Picioruş, M.; Nicola, R.; Ciopec, M.; Negrea, A.; Nižňanský, D.; Len, A.; Almásy, L.; Putz, A.-M. Removal of cadmium from aqueous solutions using inorganic porous nanocomposites. Korean J. Chem. Eng. 2019, 36, 688–700. [Google Scholar] [CrossRef]
  40. Abdel-Khalek, H.; Abd-El Salam, M.; El-Mahalawy, A.M. The Electrical Conductivity and Dielectric Response of Cupric Acetylacetonate Thin Films. J. Electron. Mater. 2019, 48, 3736–3752. [Google Scholar] [CrossRef]
  41. Jović Orsini, N.; Babić-Stojić, B.; Spasojević, V.; Calatayud, M.P.; Cvjetićanin, N.; Goya, G.F. Magnetic and power absorption measurements on iron oxide nanoparticles synthesized by thermal decomposition of Fe(acac)3. J. Magn. Magn. Mater. 2018, 449, 286–296. [Google Scholar] [CrossRef]
  42. Socrates, G. Infrared and Raman Characteristic Group Frequencies: Tables and Charts, 3rd ed.; Wiley: Hoboken, NJ, USA, 2004; 368p. [Google Scholar]
  43. Bauer, M.; Kauf, T.; Christoffers, J.; Bertagnolli, H. Investigations into the metal species of the homogeneous iron(iii) catalyzed Michael addition reactions. Phys. Chem. Chem. Phys. 2005, 7, 2664–2670. [Google Scholar] [CrossRef] [PubMed]
  44. Hester, R.E.; Plane, R.A. Metal-Oxygen Bonds in Complexes: Raman Spectra of Trisacetylacetonato and Trisoxalato Complexes of Aluminum, Gallium, and Indium. Inorg. Chem. 1964, 3, 513–517. [Google Scholar] [CrossRef]
  45. Krishnan, V.; Gross, S.; Müller, S.; Armelao, L.; Tondello, E.; Bertagnolli, H. Structural Investigations on the Hydrolysis and Condensation Behavior of Pure and Chemically Modified Alkoxides. 2. Germanium Alkoxides. J. Phys. Chem. B 2007, 111, 7519–7528. [Google Scholar] [CrossRef]
  46. Loridant, S. Raman spectroscopy as a powerful tool to characterize ceria-based catalysts. Catal. Today 2021, 373, 98–111. [Google Scholar] [CrossRef]
  47. Ianasi, C.; Costisor, O.; Putz, A.-M.; Lazau, R.; Adina, N.; Niznansky, D.; Sacarescu, L.; Savii, C. Low temperature superparamagnetic nanocomposites obtained by Fe(acac)3-SiO2-PVA hybrid xerogel thermolysis. Process. Appl. Ceram. 2016, 10, 265. [Google Scholar] [CrossRef]
  48. Ercuta, A. Sensitive AC Hysteresigraph of Extended Driving Field Capability. IEEE Trans. Instrum. Meas. 2020, 69, 1643–1651. [Google Scholar] [CrossRef]
  49. Sposito, G. On Points of Zero Charge. Environ. Sci. Technol. 1998, 32, 2815–2819. [Google Scholar] [CrossRef]
  50. Lagergren, S. About the theory of so-called adsorption of soluble substabces. Kungl. Sven. Vetensk. Handl. 1898, 24, 1–39. [Google Scholar]
  51. Ho, Y.S. Review of second-order models for adsorption systems. J. Hazard. Mater. 2006, 136, 681–689. [Google Scholar] [CrossRef] [Green Version]
  52. Weber, W.J.; Morris, J.C. Equilibria and Capacities for Adsorption on Carbon. J. Sanit. Eng. Div. 1964, 90, 79–108. [Google Scholar] [CrossRef]
  53. Huang, Y.; Lee, X.; Grattieri, M.; Macazo, F.C.; Cai, R.; Minteer, S.D. A sustainable adsorbent for phosphate removal: Modifying multi-walled carbon nanotubes with chitosan. J. Mater. Sci. 2018, 53, 12641–12649. [Google Scholar] [CrossRef]
  54. Ofomaja, A.E. Intraparticle diffusion process for lead(II) biosorption onto mansonia wood sawdust. Bioresour. Technol. 2010, 101, 5868–5876. [Google Scholar] [CrossRef] [PubMed]
  55. Weber, W.J.; Morris, J.C. Kinetics of Adsorption on Carbon from Solution. J. Sanit. Eng. Div. 1963, 89, 31–59. [Google Scholar] [CrossRef]
  56. Bhaumik, M.; Agarwal, S.; Gupta, V.K.; Maity, A. Enhanced removal of Cr(VI) from aqueous solutions using polypyrrole wrapped oxidized MWCNTs nanocomposites adsorbent. J. Colloid Interface Sci. 2016, 470, 257–267. [Google Scholar] [CrossRef]
  57. Zhang, S.; Ning, S.; Liu, H.; Zhou, J.; Wang, S.; Zhang, W.; Wang, X.; Wei, Y. Highly-efficient separation and recovery of ruthenium from electroplating wastewater by a mesoporous silica-polymer based adsorbent. Microporous Mesoporous Mater. 2020, 303, 110293. [Google Scholar] [CrossRef]
  58. Atkins, P.; de Paula, J. Atkins’ Physical Chemistry; Oxford University Press: Oxford, UK, 2005; 1008p. [Google Scholar]
  59. Zhang, Y.; Yu, F.; Cheng, W.; Wang, J.; Ma, J. Adsorption Equilibrium and Kinetics of the Removal of Ammoniacal Nitrogen by Zeolite X/Activated Carbon Composite Synthesized from Elutrilithe. J. Chem. 2017, 2017, 1936829. [Google Scholar] [CrossRef]
  60. Langmuir, I. The adsorption of gases on plane surfaces of glass, mica and platinum. J. Am. Chem. Soc. 1918, 40, 1361–1403. [Google Scholar] [CrossRef] [Green Version]
  61. Freundlich, H.M.F. Over the adsorption in solution. J. Phys. Chem. 1906, 57, 385–470. [Google Scholar]
  62. Sips, R. On the Structure of a Catalyst Surface. J. Chem. Phys. 1948, 16, 490–495. [Google Scholar] [CrossRef]
  63. Kucuker, M.A.; Wieczorek, N.; Kuchta, K.; Copty, N.K. Biosorption of neodymium on Chlorella vulgaris in aqueous solution obtained from hard disk drive magnets. PLoS ONE 2017, 12, e0175255. [Google Scholar] [CrossRef]
  64. Khosa, M.A.; Ullah, A. In-situ modification, regeneration, and application of keratin biopolymer for arsenic removal. J. Hazard. Mater. 2014, 278, 360–371. [Google Scholar] [CrossRef] [PubMed]
  65. Prabhakar, R.; Samadder, S.R. Low cost and easy synthesis of aluminium oxide nanoparticles for arsenite removal from groundwater: A complete batch study. J. Mol. Liq. 2018, 250, 192–201. [Google Scholar] [CrossRef]
  66. Gupta, V.K.; Saini, V.K.; Jain, N. Adsorption of As(III) from aqueous solutions by iron oxide-coated sand. J. Colloid Interface Sci. 2005, 288, 55–60. [Google Scholar] [CrossRef]
  67. Singh, T.S.; Pant, K.K. Equilibrium, kinetics and thermodynamic studies for adsorption of As(III) on activated alumina. Sep. Purif. Technol. 2004, 36, 139–147. [Google Scholar] [CrossRef]
  68. Khosa, M.; Ullah, A. A Sustainable Role of Keratin Biopolymer in Green Chemistry: A Review. J. Food Process. Beverages 2013, 1, 8. [Google Scholar]
  69. Ranjan, D.; Talat, M.; Hasan, S.H. Biosorption of arsenic from aqueous solution using agricultural residue ‘rice polish’. J. Hazard. Mater. 2009, 166, 1050–1059. [Google Scholar] [CrossRef] [PubMed]
  70. World Health Organization. World Water Day 2022: Groundwater, Invisible but Vital to Health. Available online: https://www.who.int/news-room/feature-stories/detail/world-water-day-2022-groundwater-invisible-but-vital-to-health (accessed on 24 May 2022).
Figure 1. XRD of SiO2/Fe(acac)3/NaF.
Materials 15 05366 g001
Figure 2. Raman spectra for SiO2/Fe(acac)3/NaF.
Materials 15 05366 g002
Figure 3. FT-IR spectra for SiO2/Fe(acac)3/NaF.
Materials 15 05366 g003
Figure 4. Image of crystals for SiO2/Fe(acac)3/NaF.
Materials 15 05366 g004
Figure 5. AFM images (a), 3D images (b) and height profile (c) of material on scale 10 µm × 10 µm.
Materials 15 05366 g005
Figure 6. AFM images (a), 3D images (b) and height profile (c) of material on scale 5 µm × 5 µm.
Materials 15 05366 g006
Figure 7. N2 adsorption isotherm (a) and pore size distribution (b) of material SiO2/Fe(acac)3/NaF.
Materials 15 05366 g007
Figure 8. Measured magnetic saturation.
Materials 15 05366 g008
Figure 9. Determination of pHpZc. for new synthesized material.
Materials 15 05366 g009
Figure 10. (a) SEM micrograph; (b) EDX spectrum.
Materials 15 05366 g010
Figure 11. pH (a) and speciation as a function of pH (reprinted with permission from [14]) (b).
Materials 15 05366 g011
Figure 12. EDX spectrum recorded for the exhausted adsorbent material.
Materials 15 05366 g012
Figure 13. Effect of solid:liquid ratio.
Materials 15 05366 g013
Figure 14. Contact time effect at different temperatures.
Materials 15 05366 g014
Figure 15. Kinetic studies of As(III) adsorption. (a) Pseudo-first-order; (b) Pseudo-second-order; (c) intraparticle diffusion.
Materials 15 05366 g015
Figure 16. Thermodynamic studies. (a) ln Kd vs. 1/T; (b) ln k2 vs. 1/T.
Materials 15 05366 g016
Figure 17. (a) Influence of the initial concentration influence. (b) Equilibrium studies.
Materials 15 05366 g017
Figure 18. Adsorption/desorption cycles.
Materials 15 05366 g018
Table 1. Real water composition.
ParametersContent
Ca2+ (mg/L)89 ± 8.9
Mg2+ (mg/L)44 ± 4.4
Na+ (mg/L)120 ± 12
K+ (mg/L)1.75 ± 0.17
Fen+ (mg/L)0.6 ± 0.06
Mnn+ (mg/L)0.4 ± 0.04
Ptotal, (mg/L)5.6 ± 0.56
NH 4 + , (mg/L)4.4 ± 0.44
NO 3 , (mg/L)12.3 ± 1.23
NO 2 , (mg/L)0.74 ± 0.07
SO 4 2 , (mg/L)8.2 ± 0.82
As(III) (μg/L)104 ± 10.4
Table 2. Values obtained from AFM analysis on scale of 5 µm × 5 µm.
Sample NameIroned Area (µm2)Sa
(µm)
Sq
(µm)
Sp
(µm)
Sv
(µm)
Sy
(µm)
Average Height (µm)
Material (10 µm × 10 µm)141.8510.33580.46181.9228−0.06481.98760.2449
Material (5 µm × 5 µm)40.8070.50470.58781.8672−0.11811.98530.4144
Table 3. Textural parameters for SiO2/Fe(acac)3/NaF.
SampleSurface Area, m2/gPore Size Distribution, DFT Method, nmTotal Pore VolumeFhh Value
Material2765.5643.940 e−1 cc/g for pores smaller than 130.1 nm2.6644
Table 4. Kinetic parameters for the adsorption of As(III) onto SiO2/Fe(acac)3/NaF.
Pseudo-First Order Kinetic Model
Temperature (K)qe,exp
(µg/g)
k1
(min−1)
qe,calc
(µg/g)
R2
29824.620.056410.050.9076
30824.840.062411.390.8437
31824.930.064513.070.7943
32824.980.076819.000.8333
Pseudo-second order kinetic model
Temperature (K)qe,exp
(µg g−1)
k2
(g µg−1∙min−1)
qe,calc
(µg g−1)
R2
29824.62661.519.600.9930
30824.84975.821.270.9952
31824.931601.726.110.9951
32824.982727.226.250.9973
Intraparticle diffusion model
Temperature (K)kdiff
(mg·g−1 min−1/2)
CR2
2981.326.710.8492
3081.789.050.8373
3181.849.580.8019
3282.1014.010.8345
Table 5. Thermodynamic parameters for adsorption of As(III) onto SiO2/Fe(acac)3/NaF.
ΔH°
(kJ/mol)
ΔS° (J/mol∙K)ΔG°
(kJ/mol)
R2
68.56254.6298 K308 K318 K328 K0.9906
−75.67−78.21−80.75−83.29
Table 6. Parameters of isotherm model for adsorption of As(III) onto SiO2/Fe(acac)3/NaF.
Langmuir Isotherm
qm,exp (µg/g)KL (L/µg)qL (µg/g)R2
574.90.067650.280.9711
Freundlich isotherm
KF (µg/g)1/nFR2
58.610.310.8065
Sips isotherm
KSqS (µg/g)1/nSR2
6.21591.90.560.9916
Table 7. Comparison of adsorption performance with other material for As(III) adsorption.
Materialsq, µg/gReferences
Allyl alcohol treated chicken feathers0.115[64]
TrisilanolCyclohexyl treated chicken feathers0.110[64]
Aluminum oxide NPs0.500[65]
Iron oxide-coated sand0.029[66]
Activated alumina0.180[67]
Modified chicken feathers0.130[64,68].
Rice polish0.140[69]
SiO2/Fe(acac)3/NaF575.100This paper
Table 8. Water composition after adsorption process.
ParametersContent
Ca2+ (mg/L)8.90 ± 0.89
Mg2+ (mg/L)41.20 ± 4.12
Na+ (mg/L)119.00 ± 11.9
K+ (mg/L)0.85 ± 0.08
Fen+ (mg/L)0.20 ± 0.02
Mnn+ (mg/L)0.03 ± 0.003
Ptotal, (mg/L)2.60 ± 0.26
NH 4 + , (mg/L)2.40 ± 0.24
NO 3 , (mg/L)11.30 ± 1.13
NO 2 , (mg/L)0.34 ± 0.03
SO 4 2 , (mg/L)4.20 ± 0.42
As(III) (μg/L)9.30 ± 0.93
Publisher’s Note: MDPI stays neutral with regard to jurisdictional claims in published maps and institutional affiliations.

