
A Workability Characterization of Innovative Rubber Concrete as a Grouting Material


Abstract
:1. Introduction
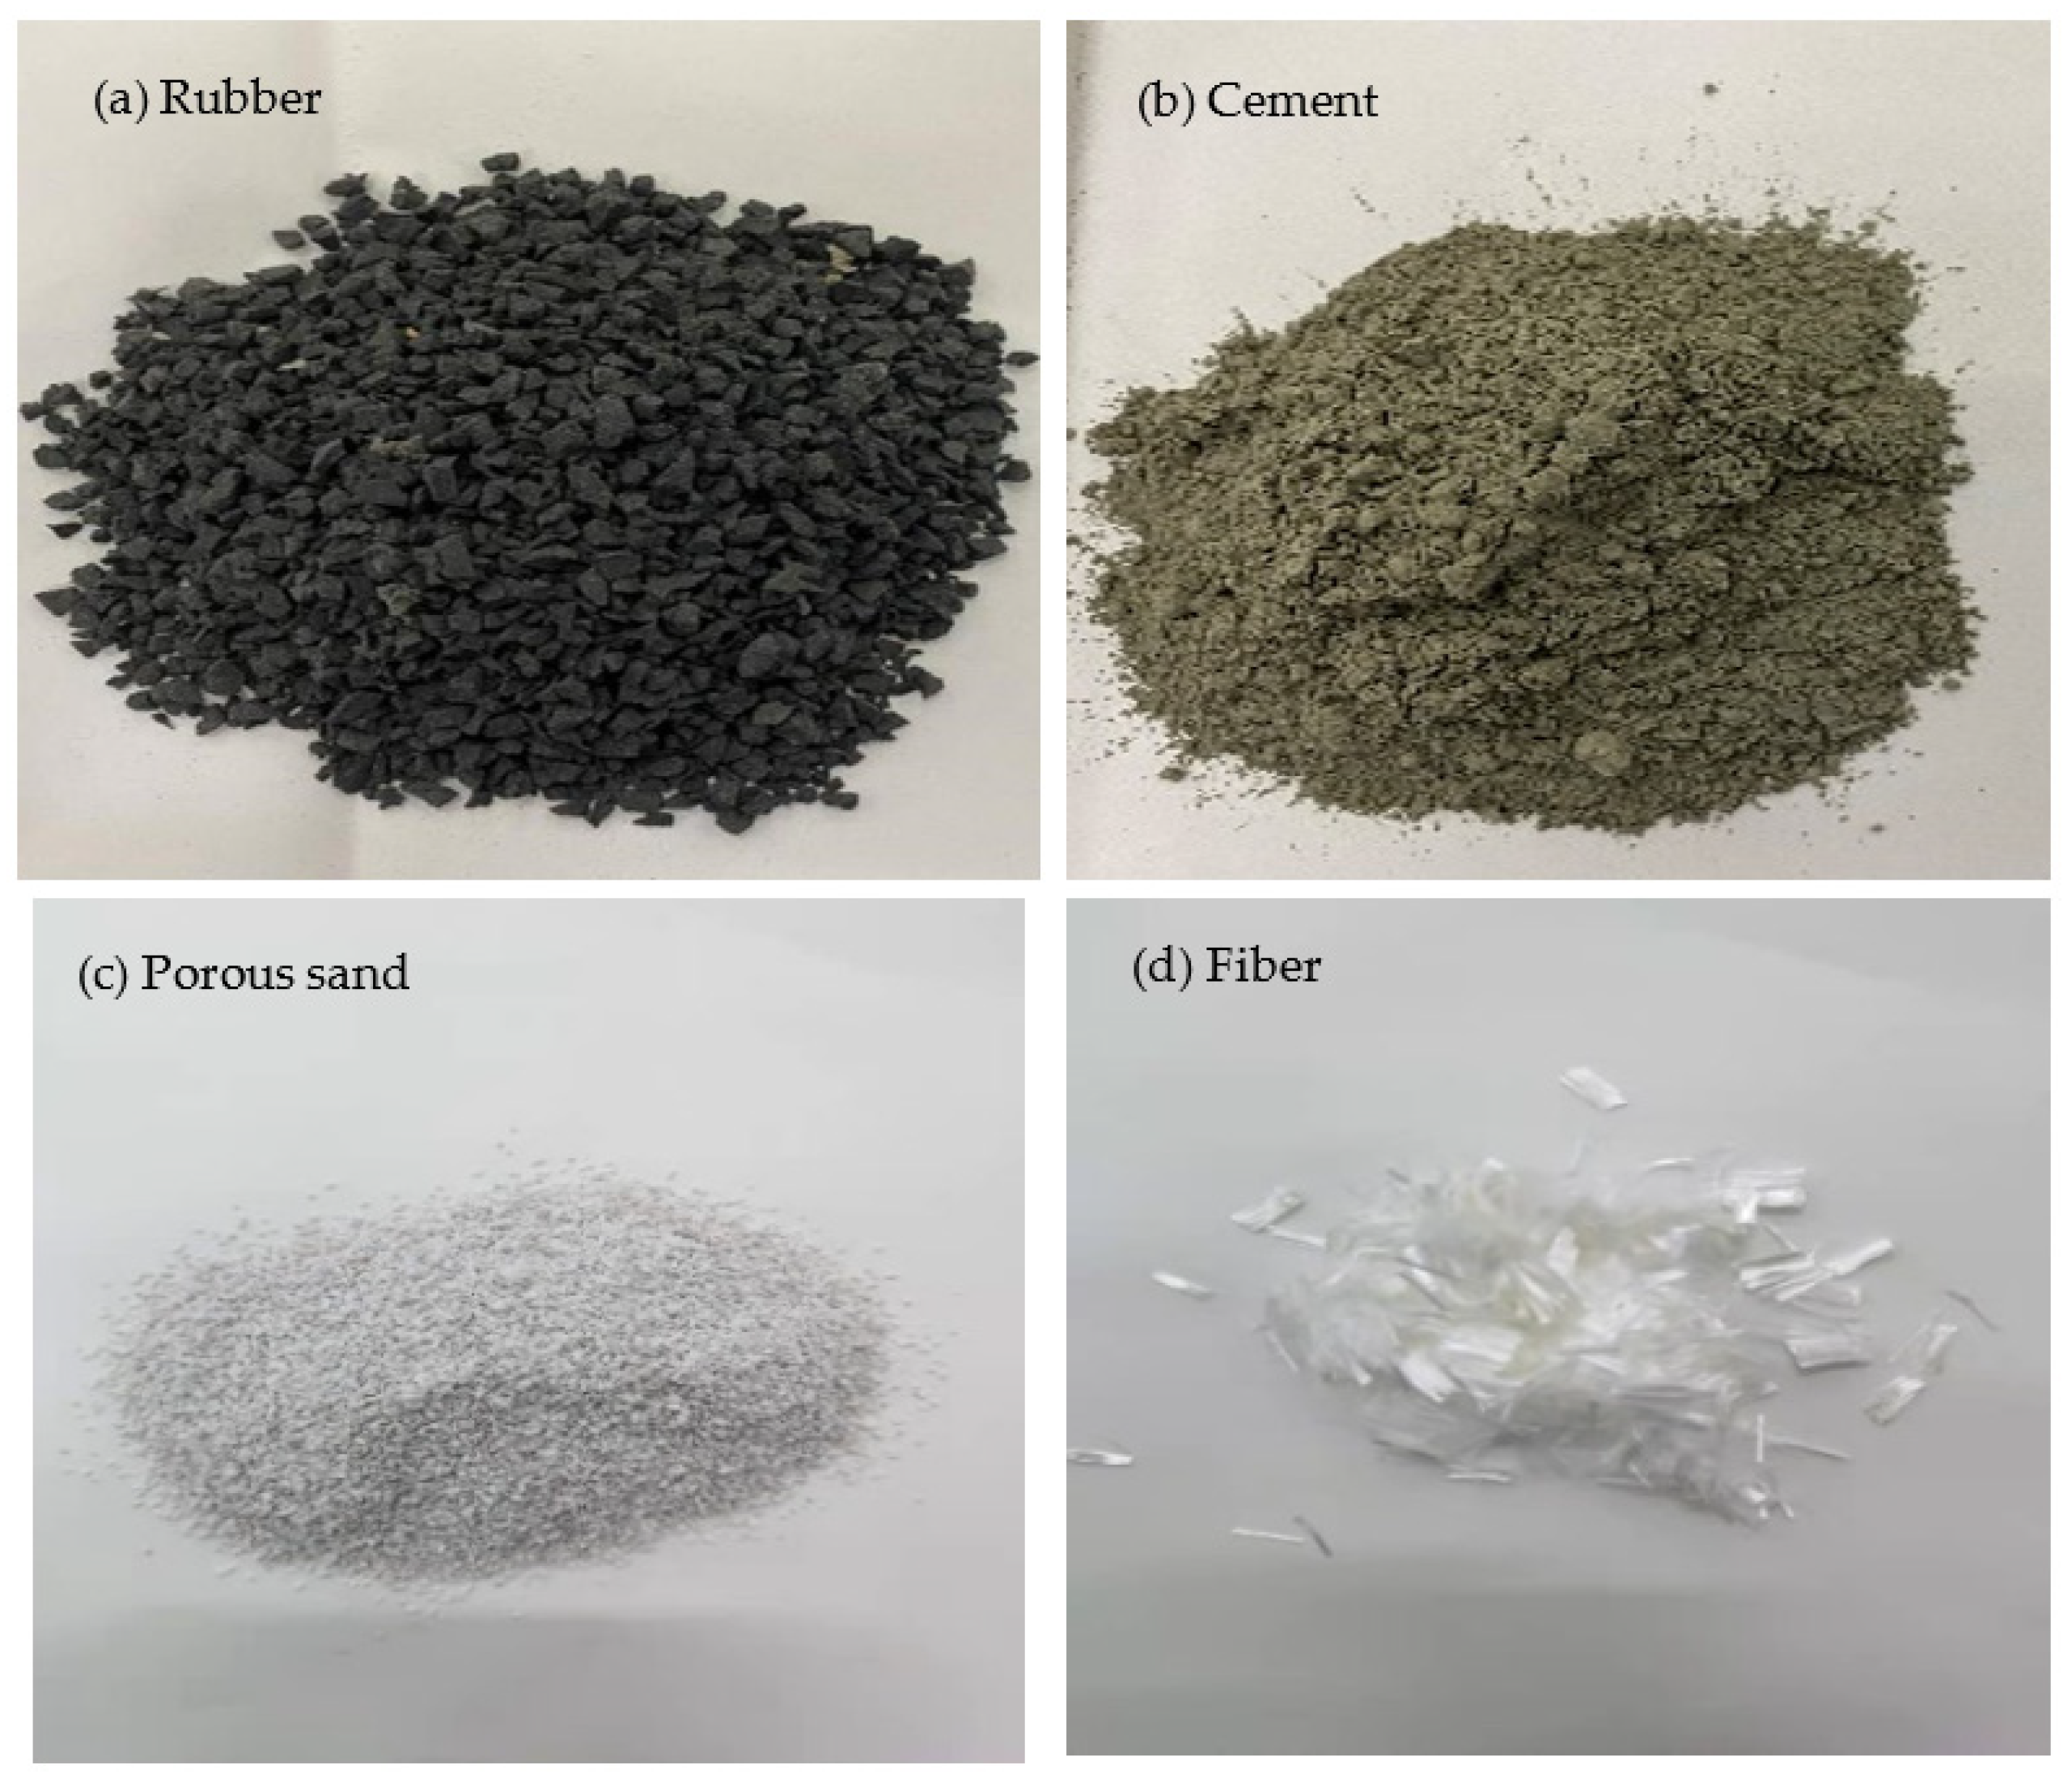
2. Materials
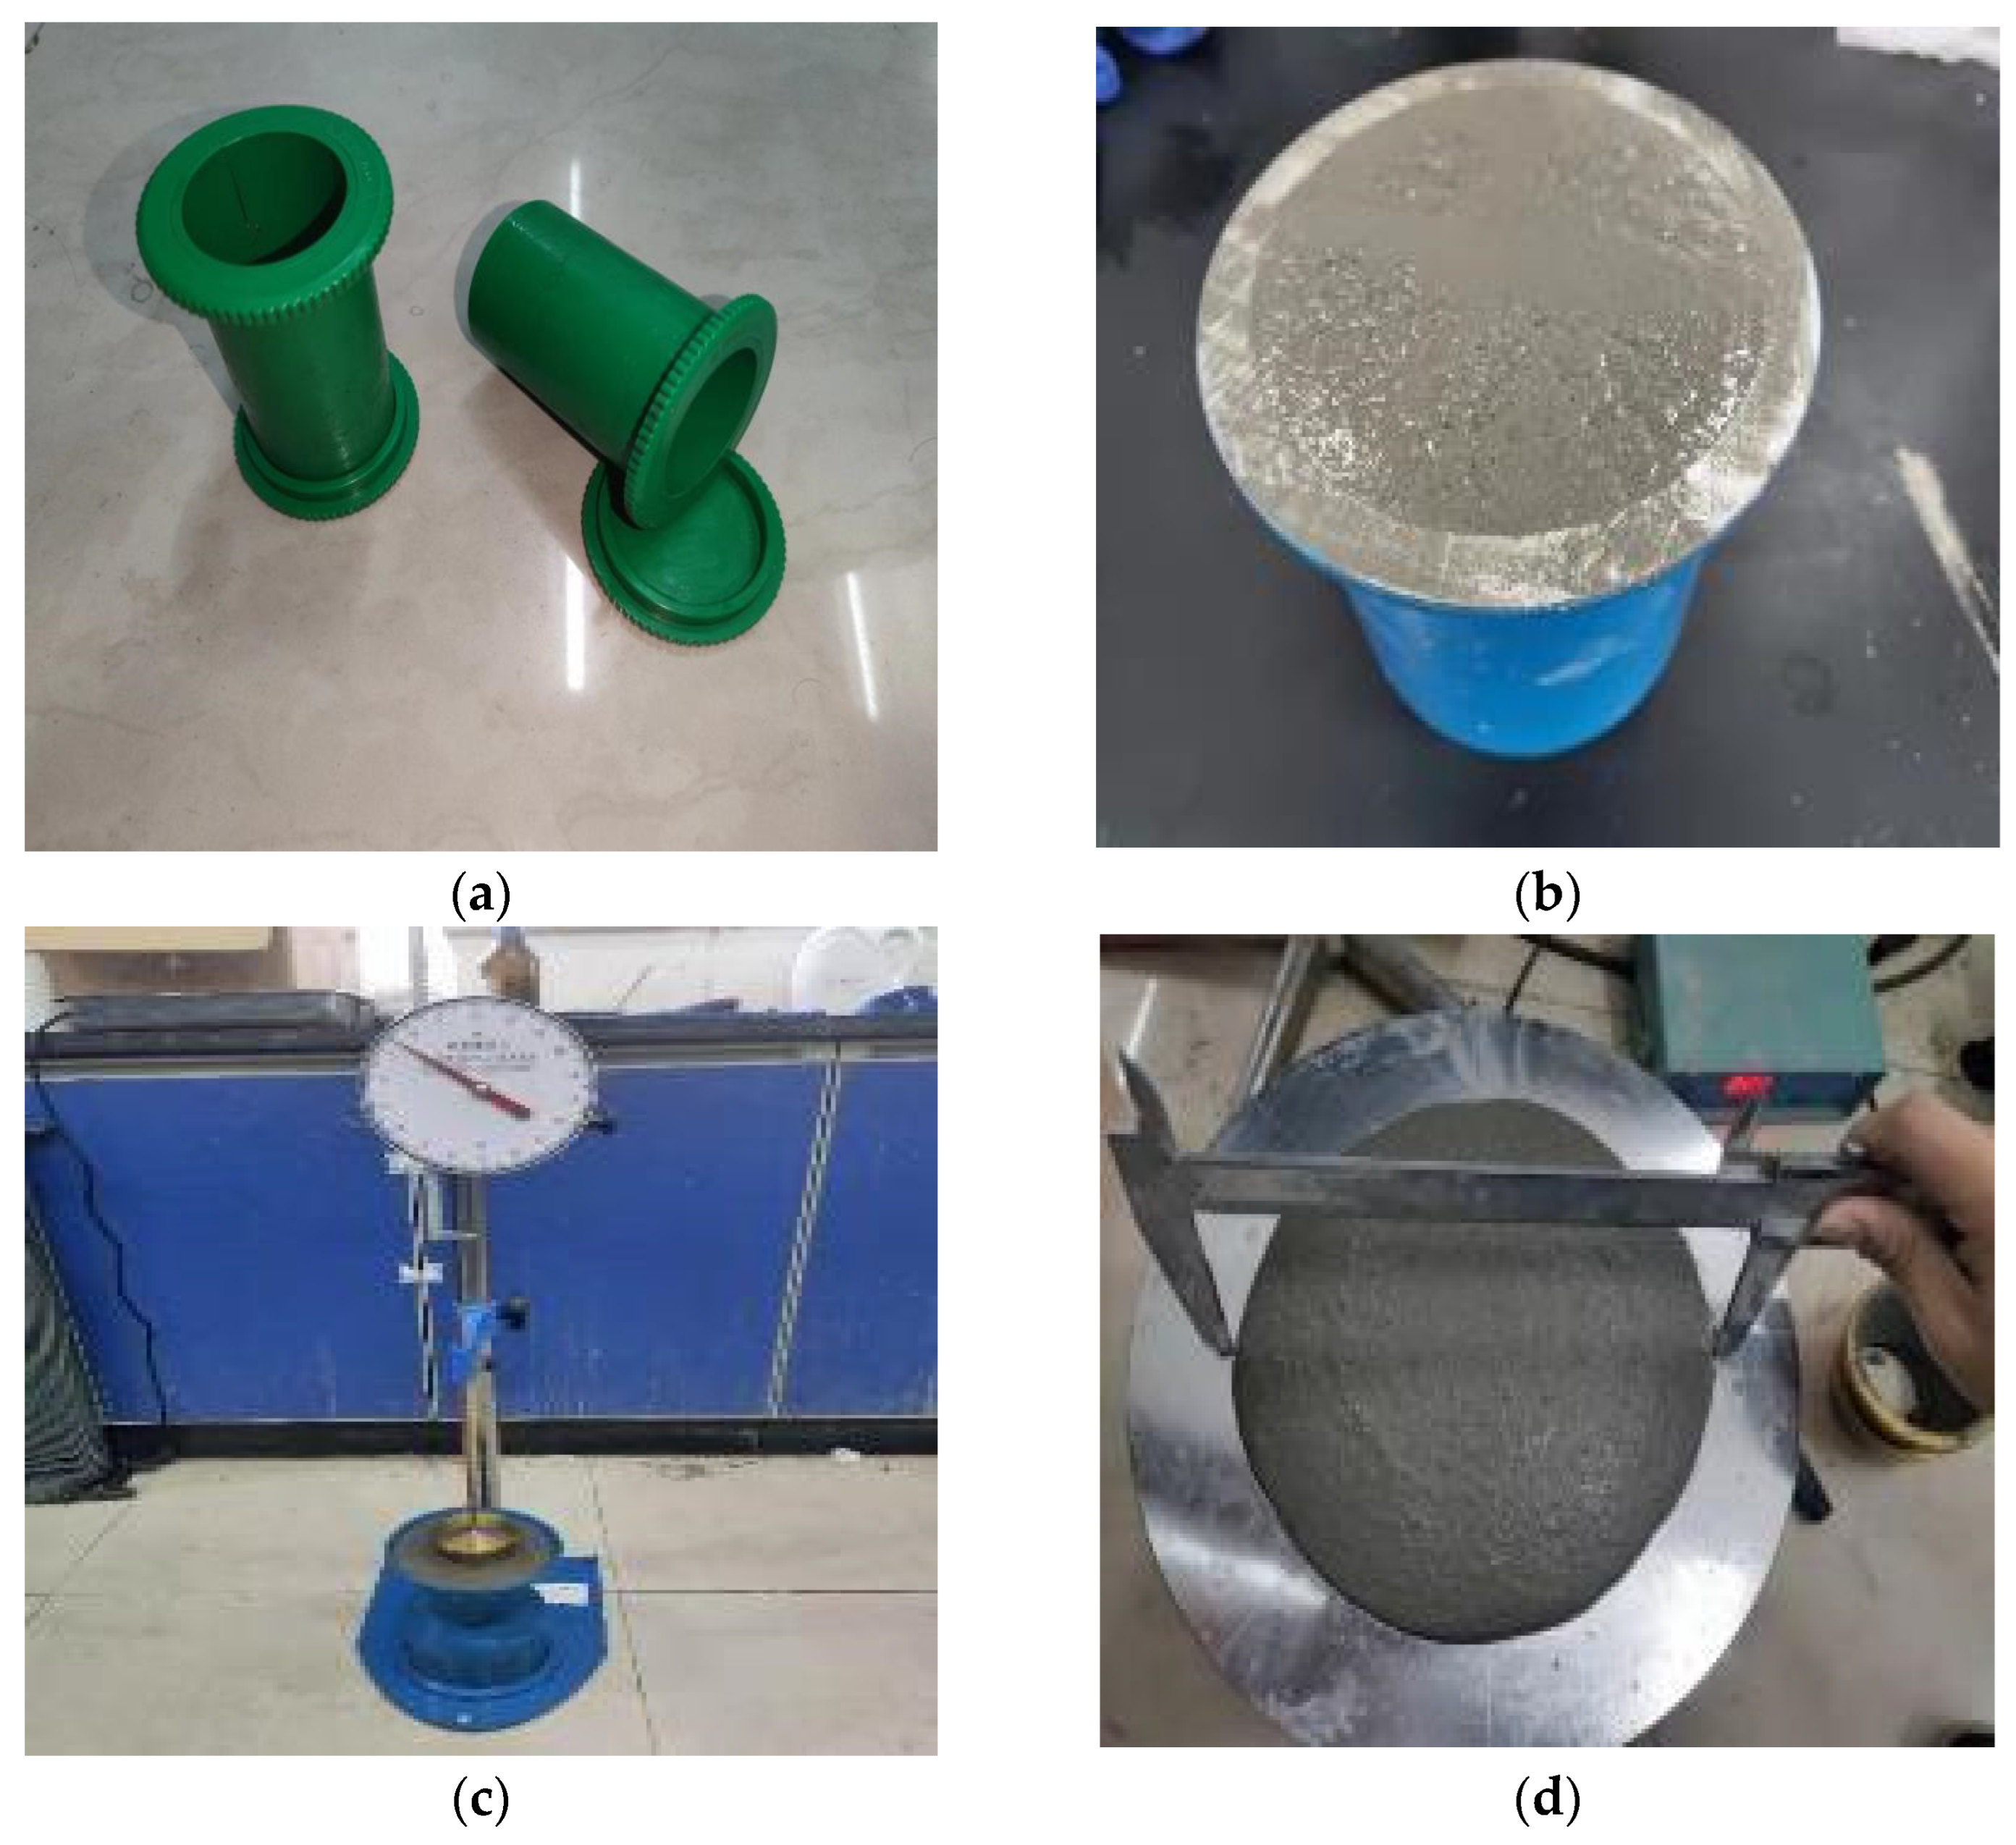
3. Specimen Preparation and Experimental Program
4. Workability Evaluation
4.1. Slurry Density Test
4.2. Consistency Test
4.3. Fluidity Test
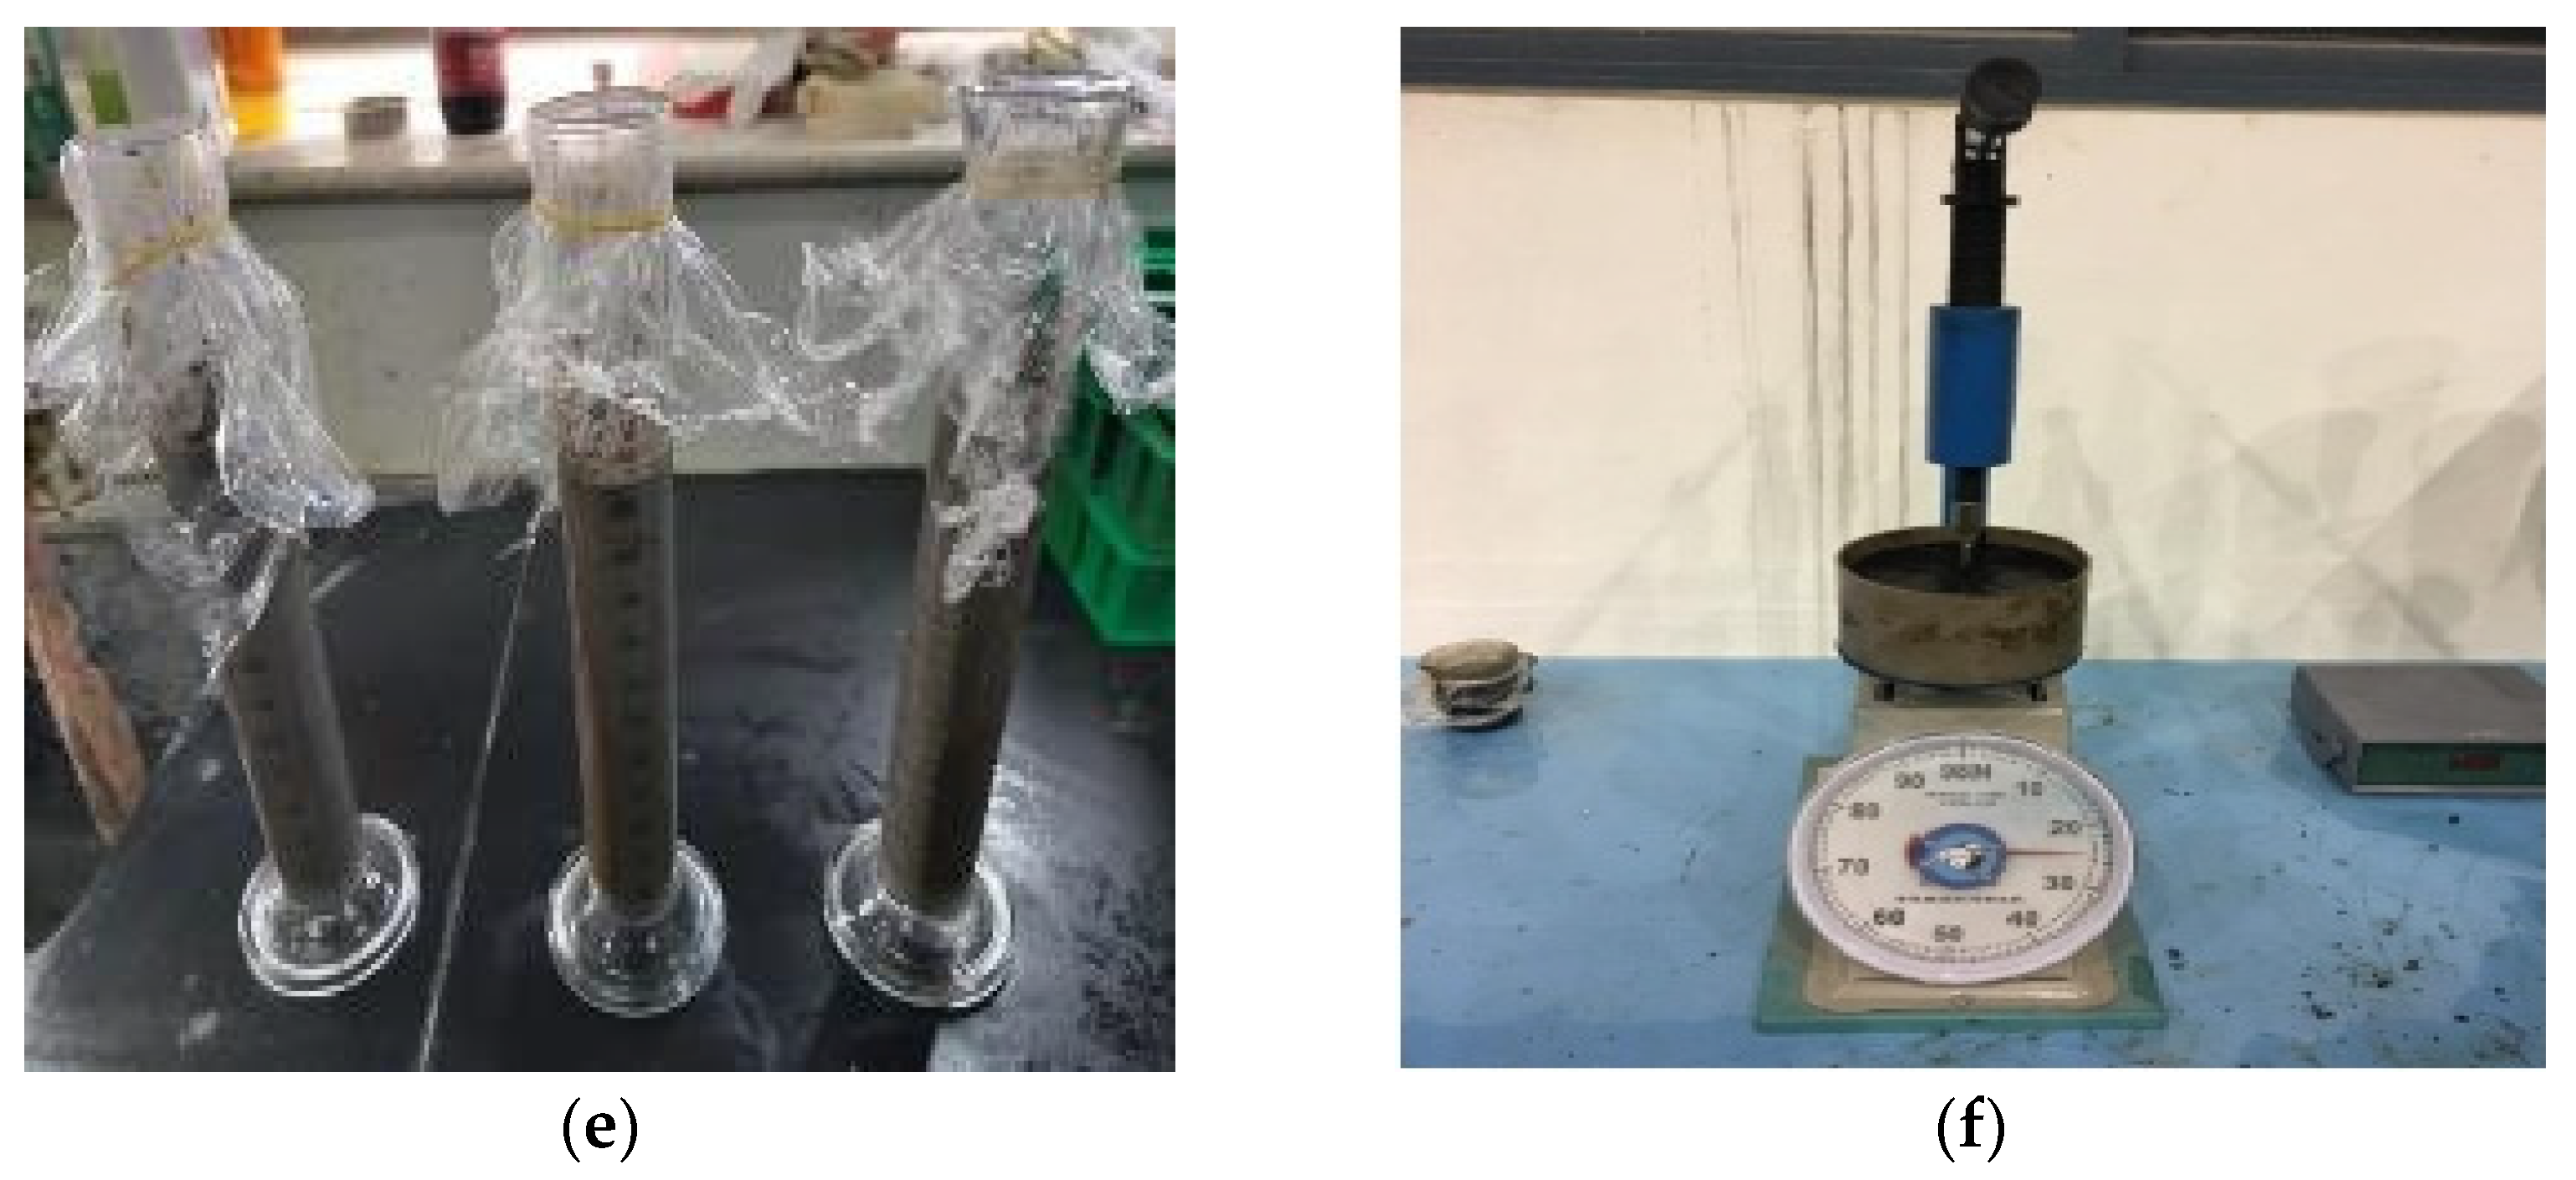
4.4. Bleeding Rate Test
4.5. Consolidation Shrinkage Rate Test
4.6. Setting Time Test
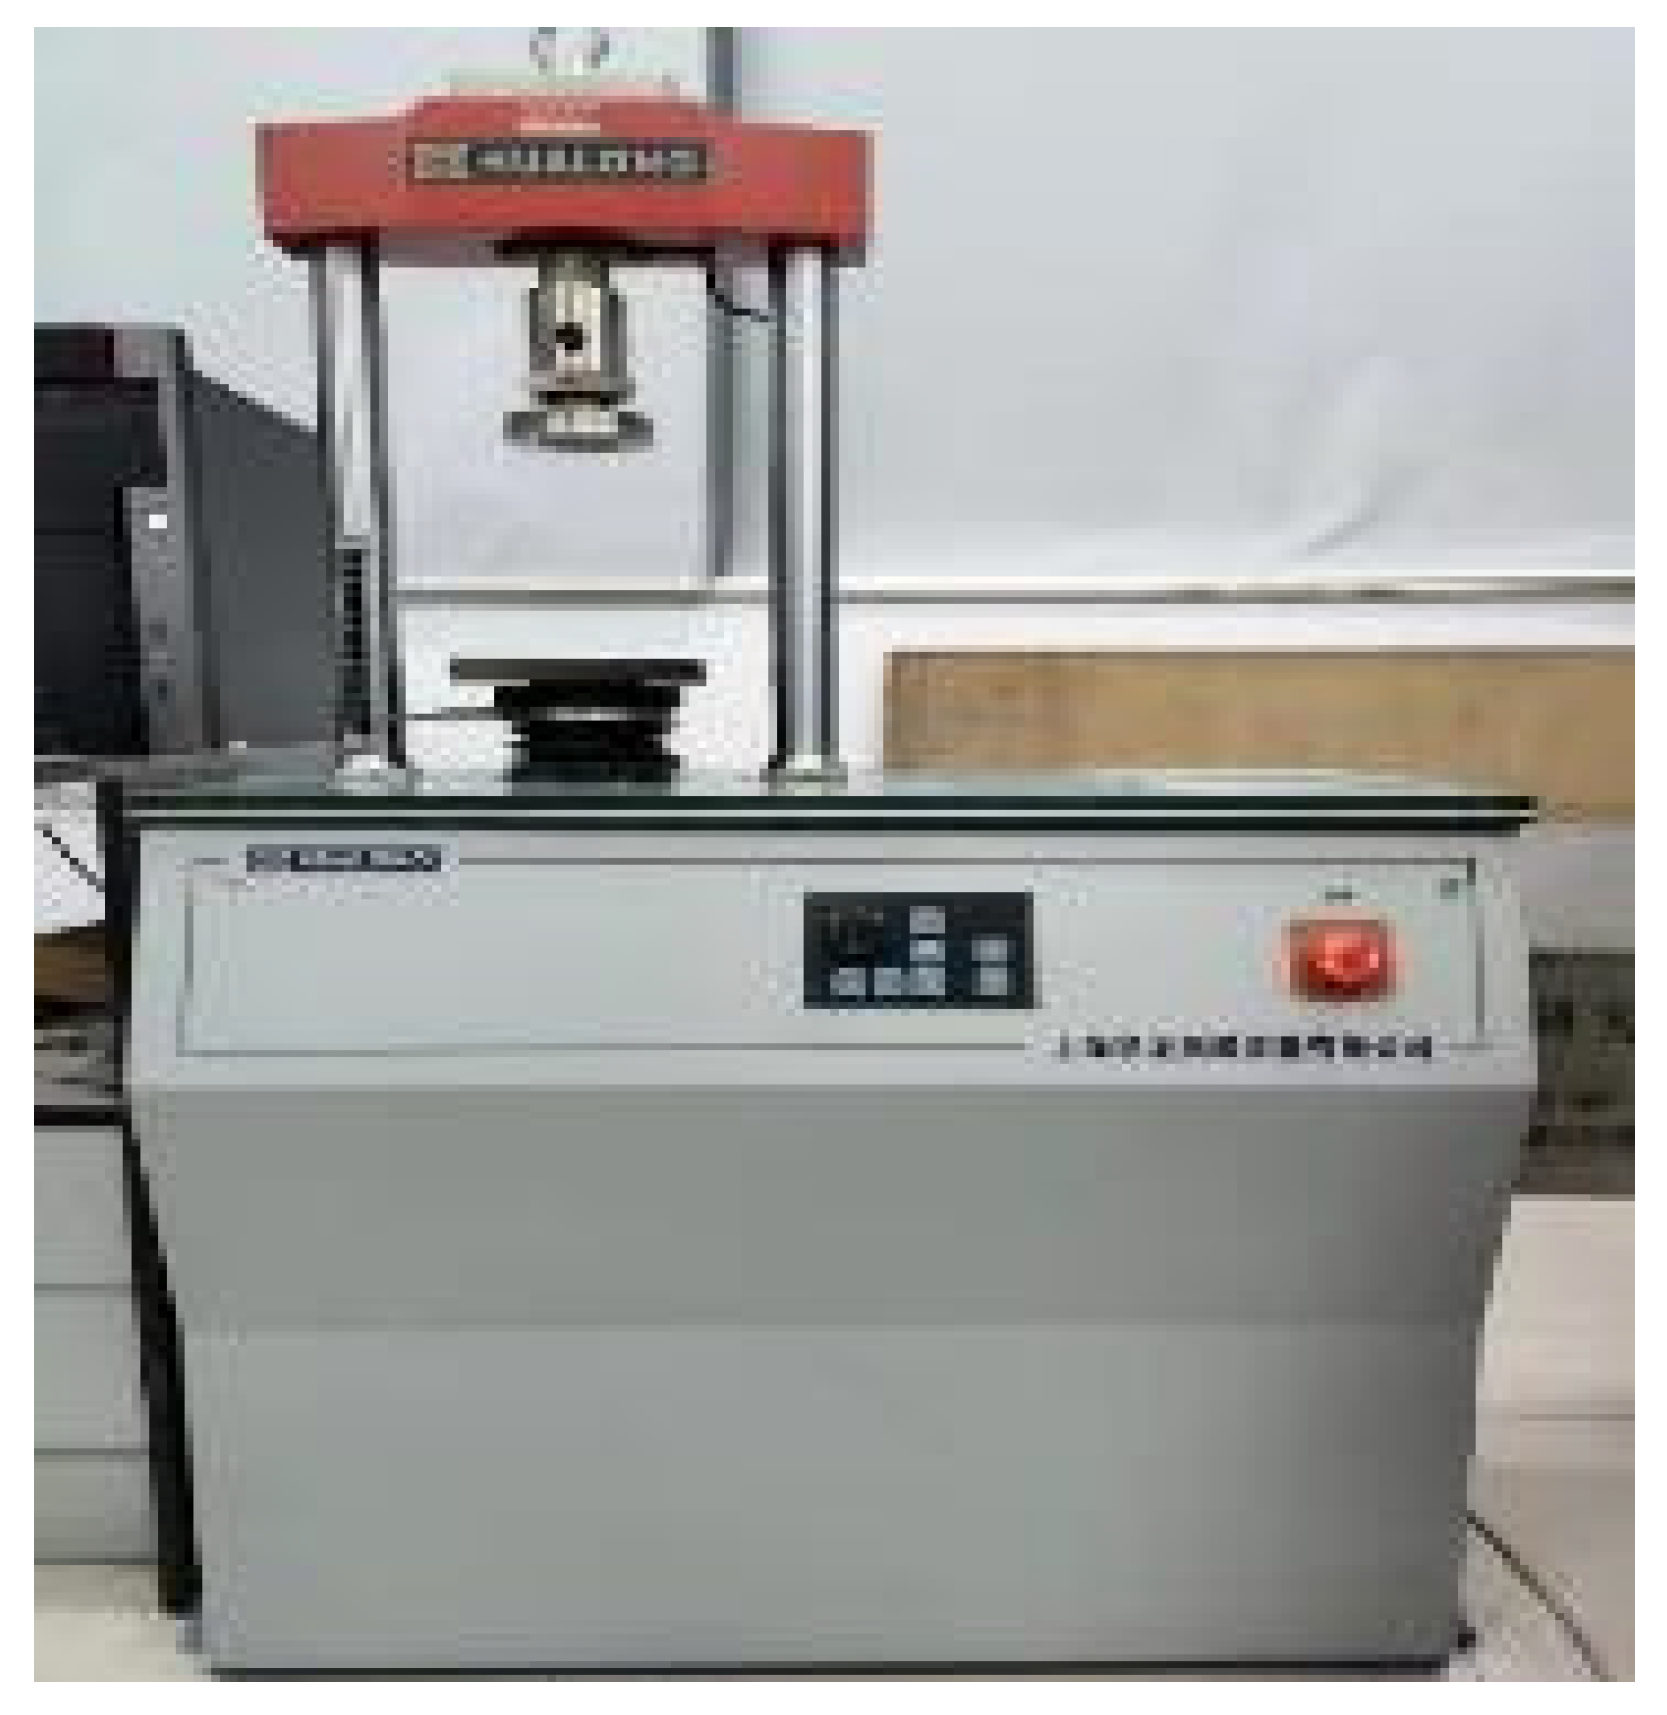
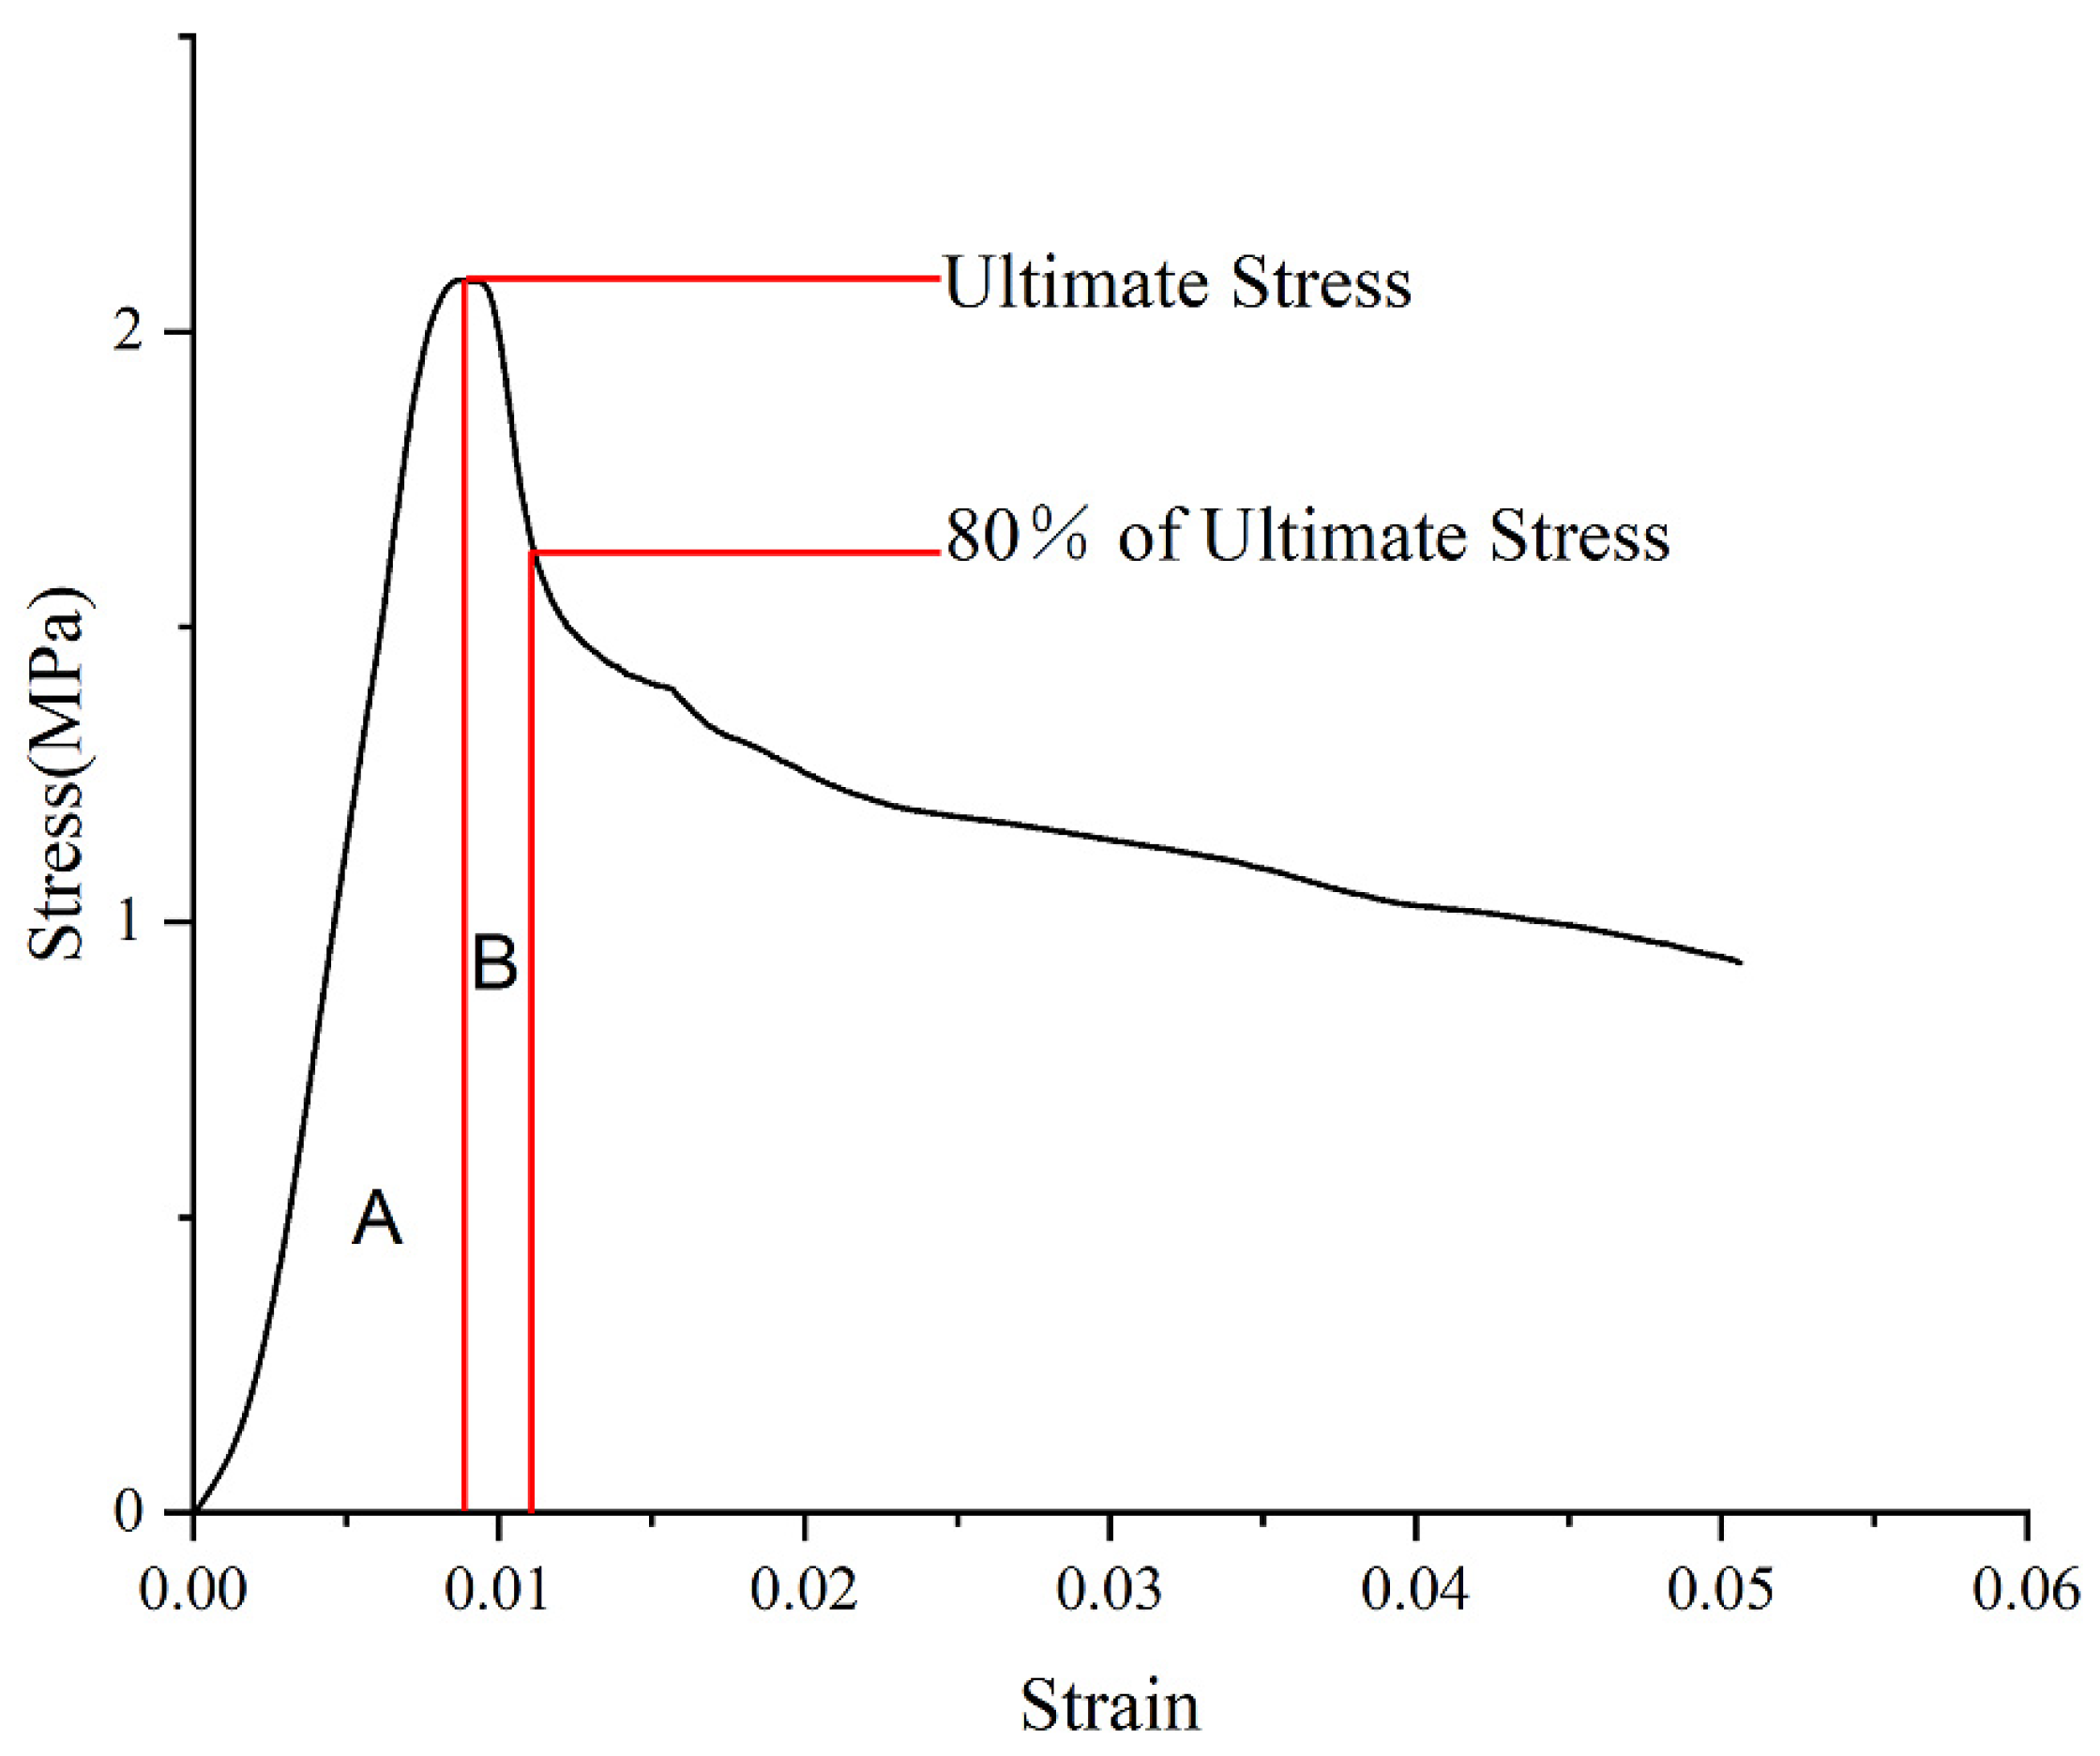
4.7. Unconfined Compressive Strength (UCS) Test
5. Results and Discussions
5.1. Verification of Repeatability
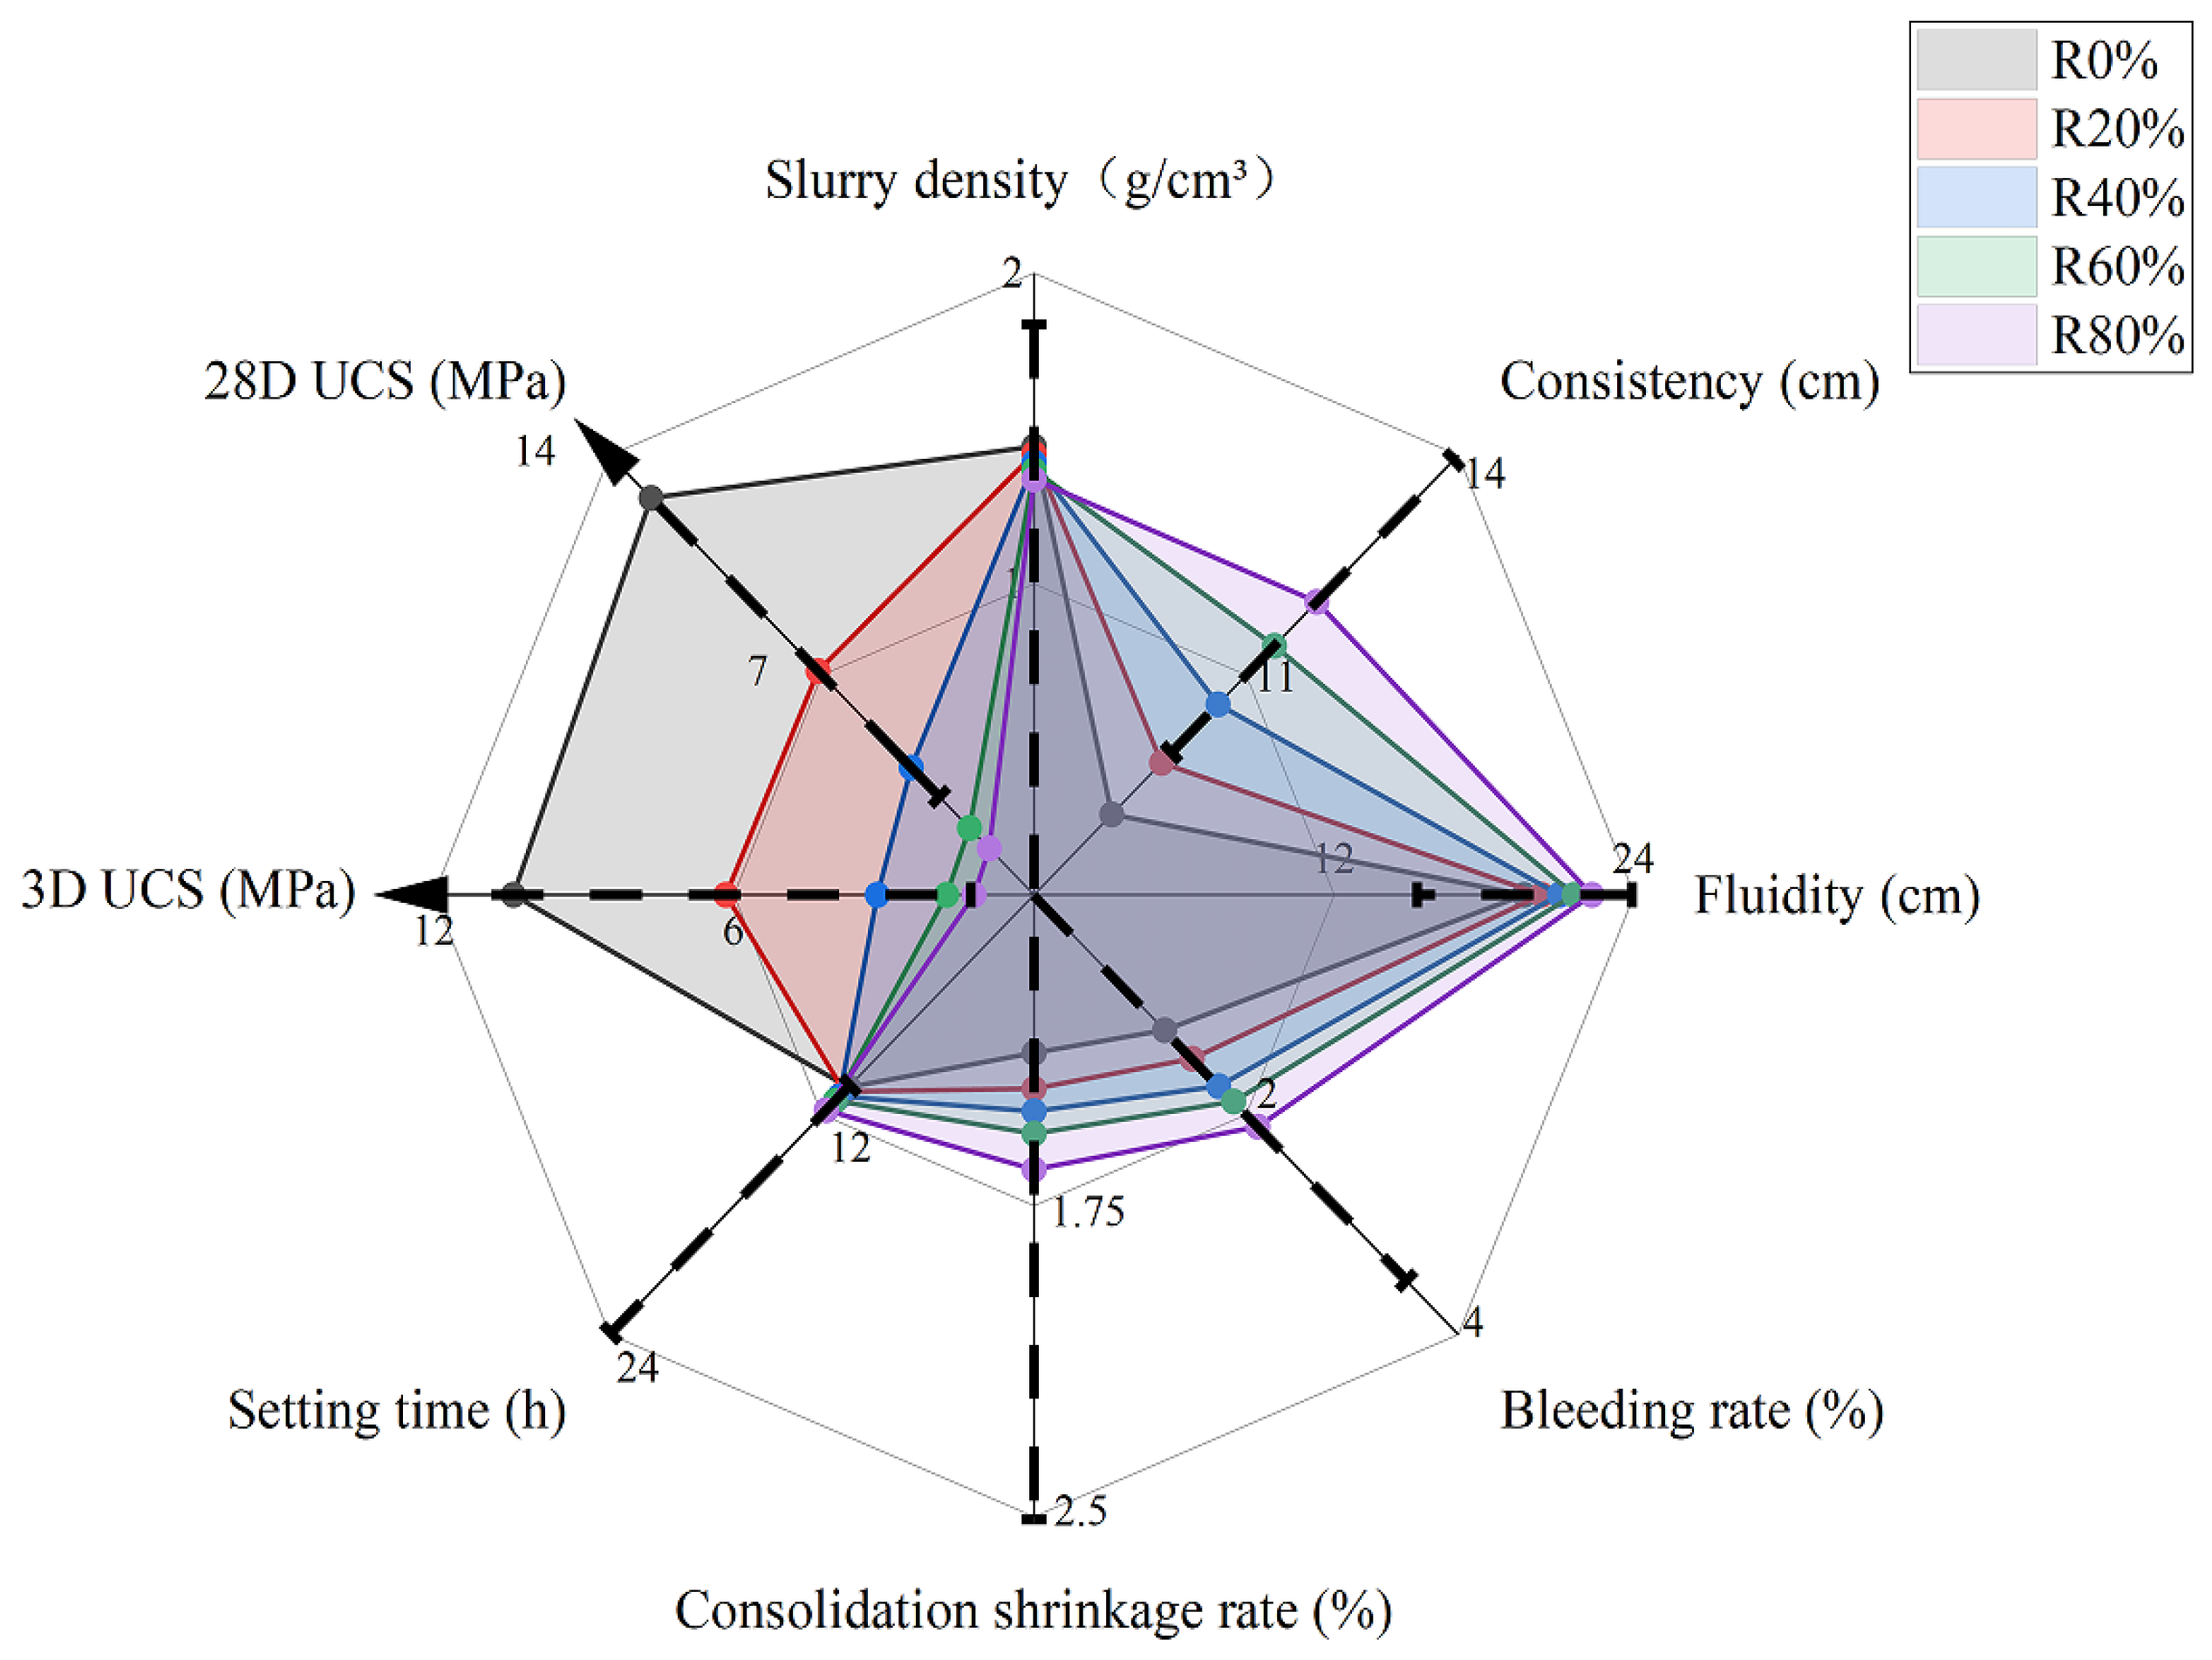
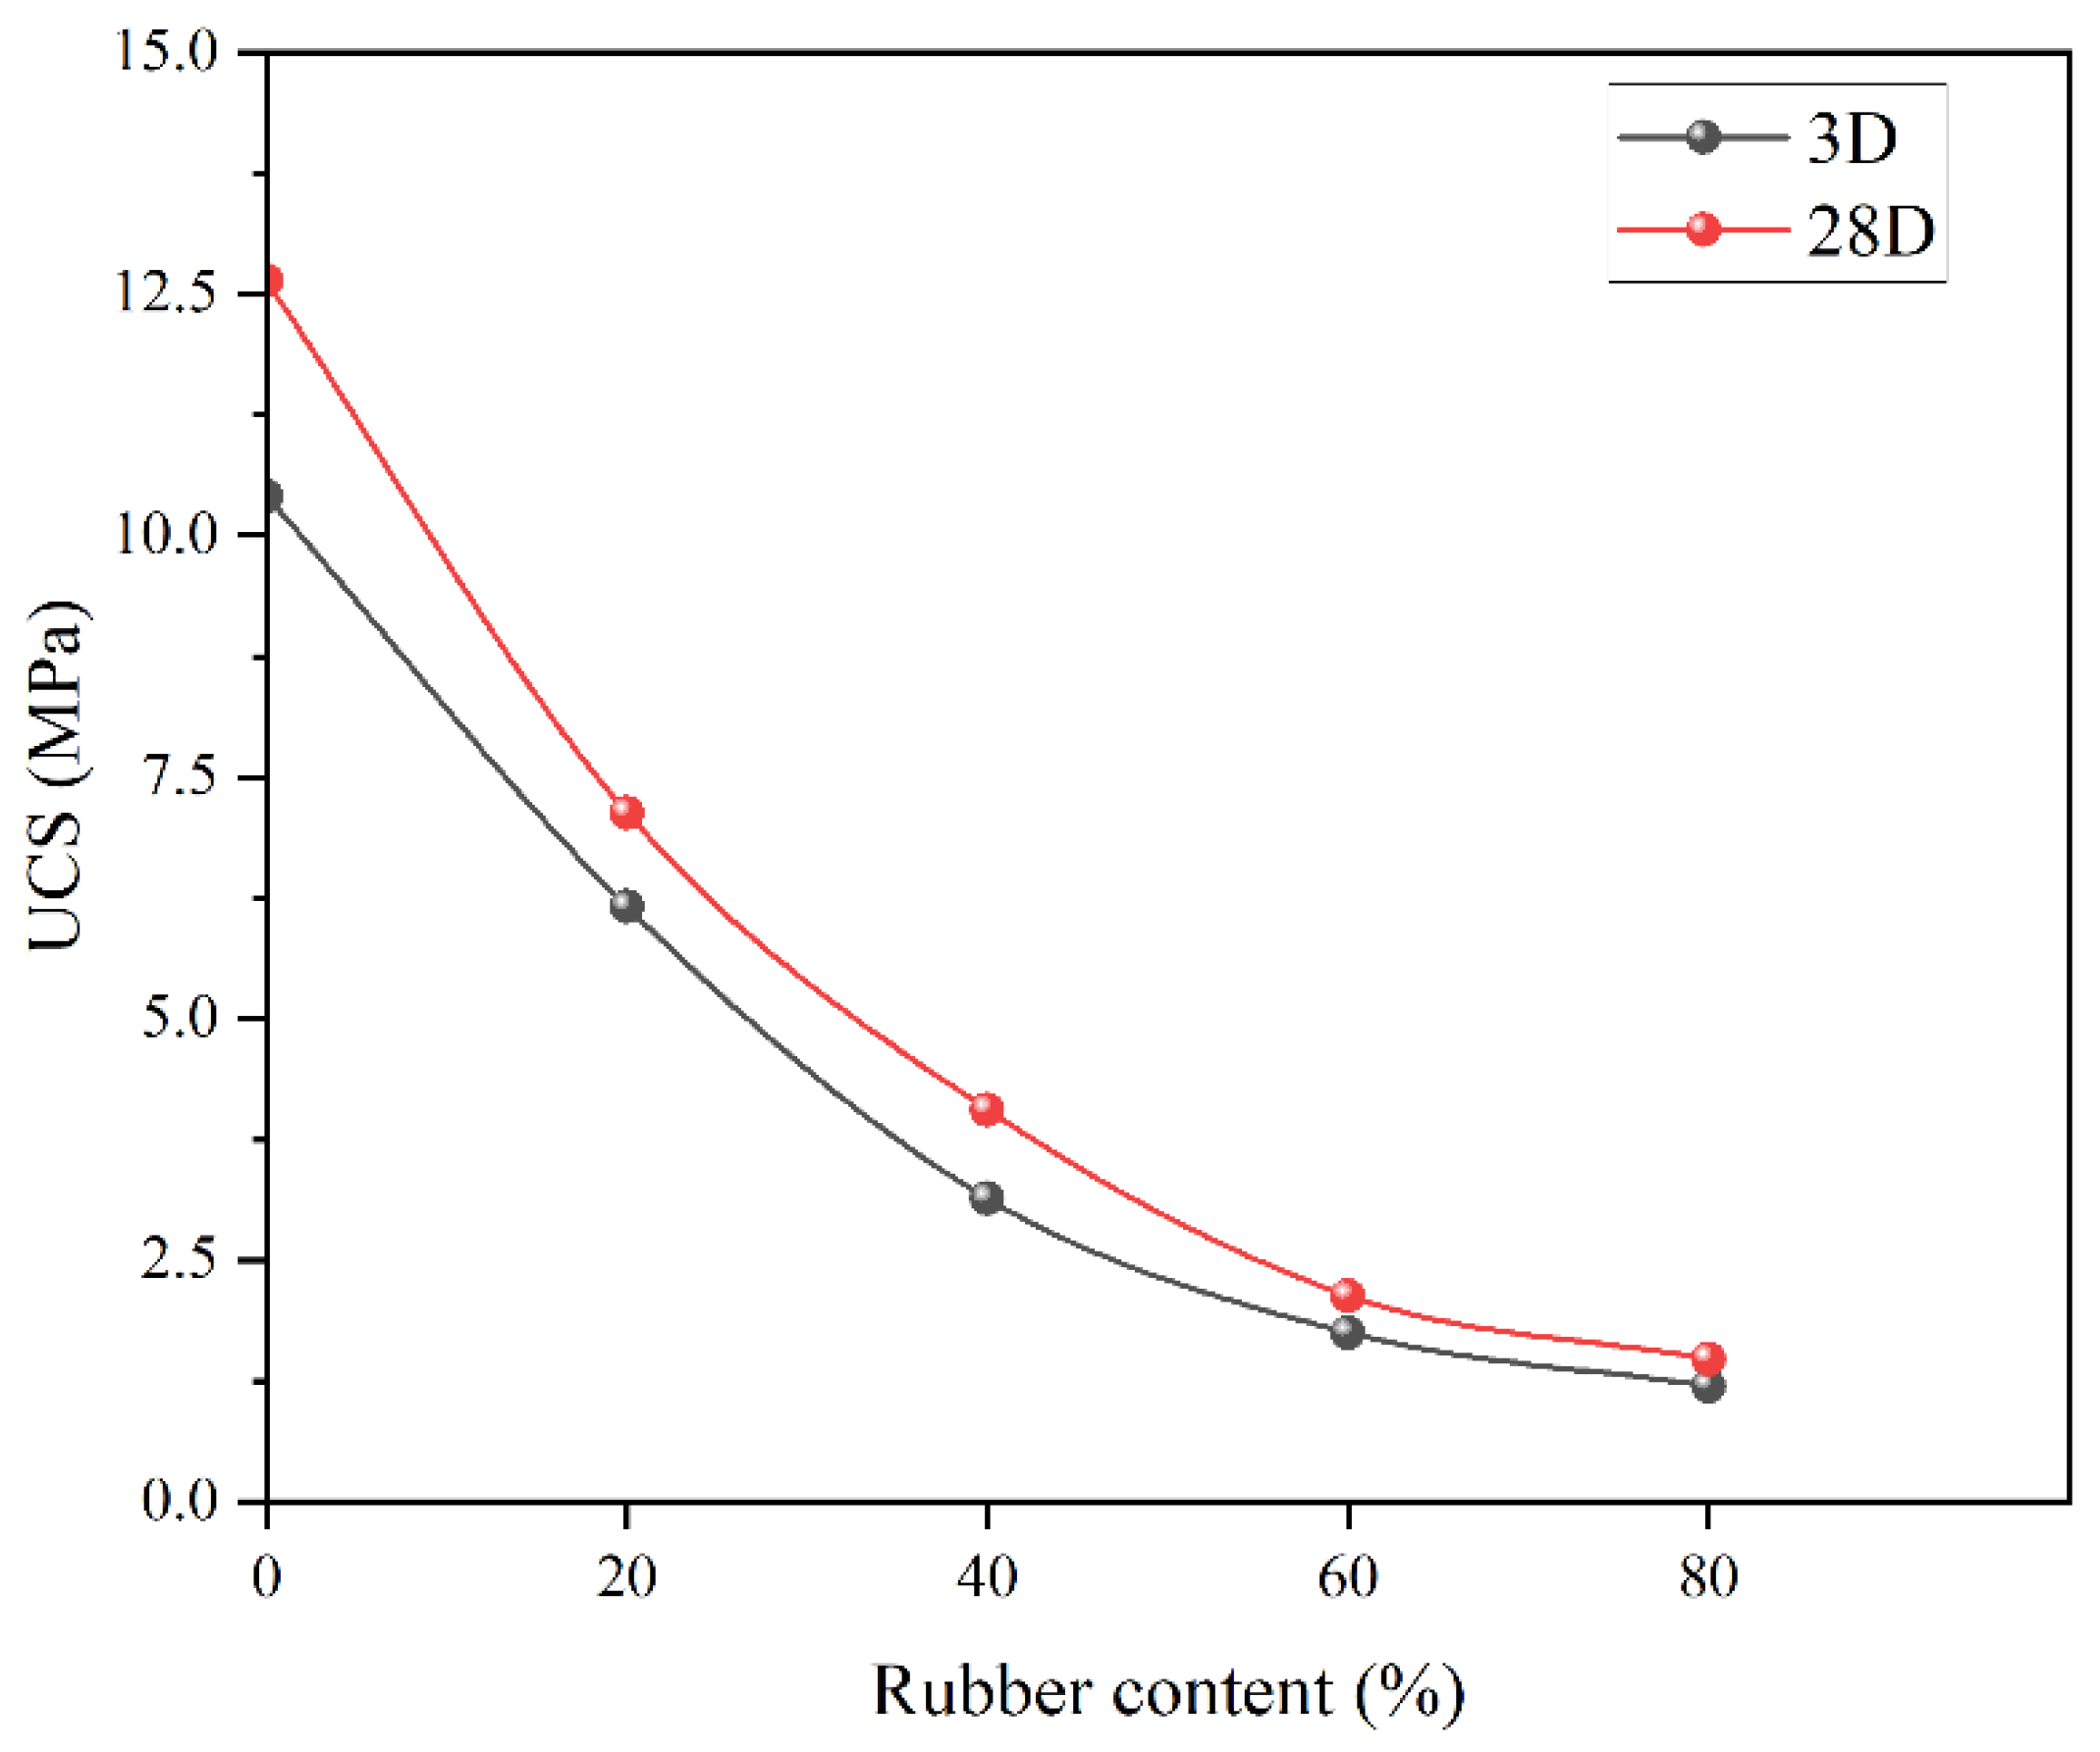
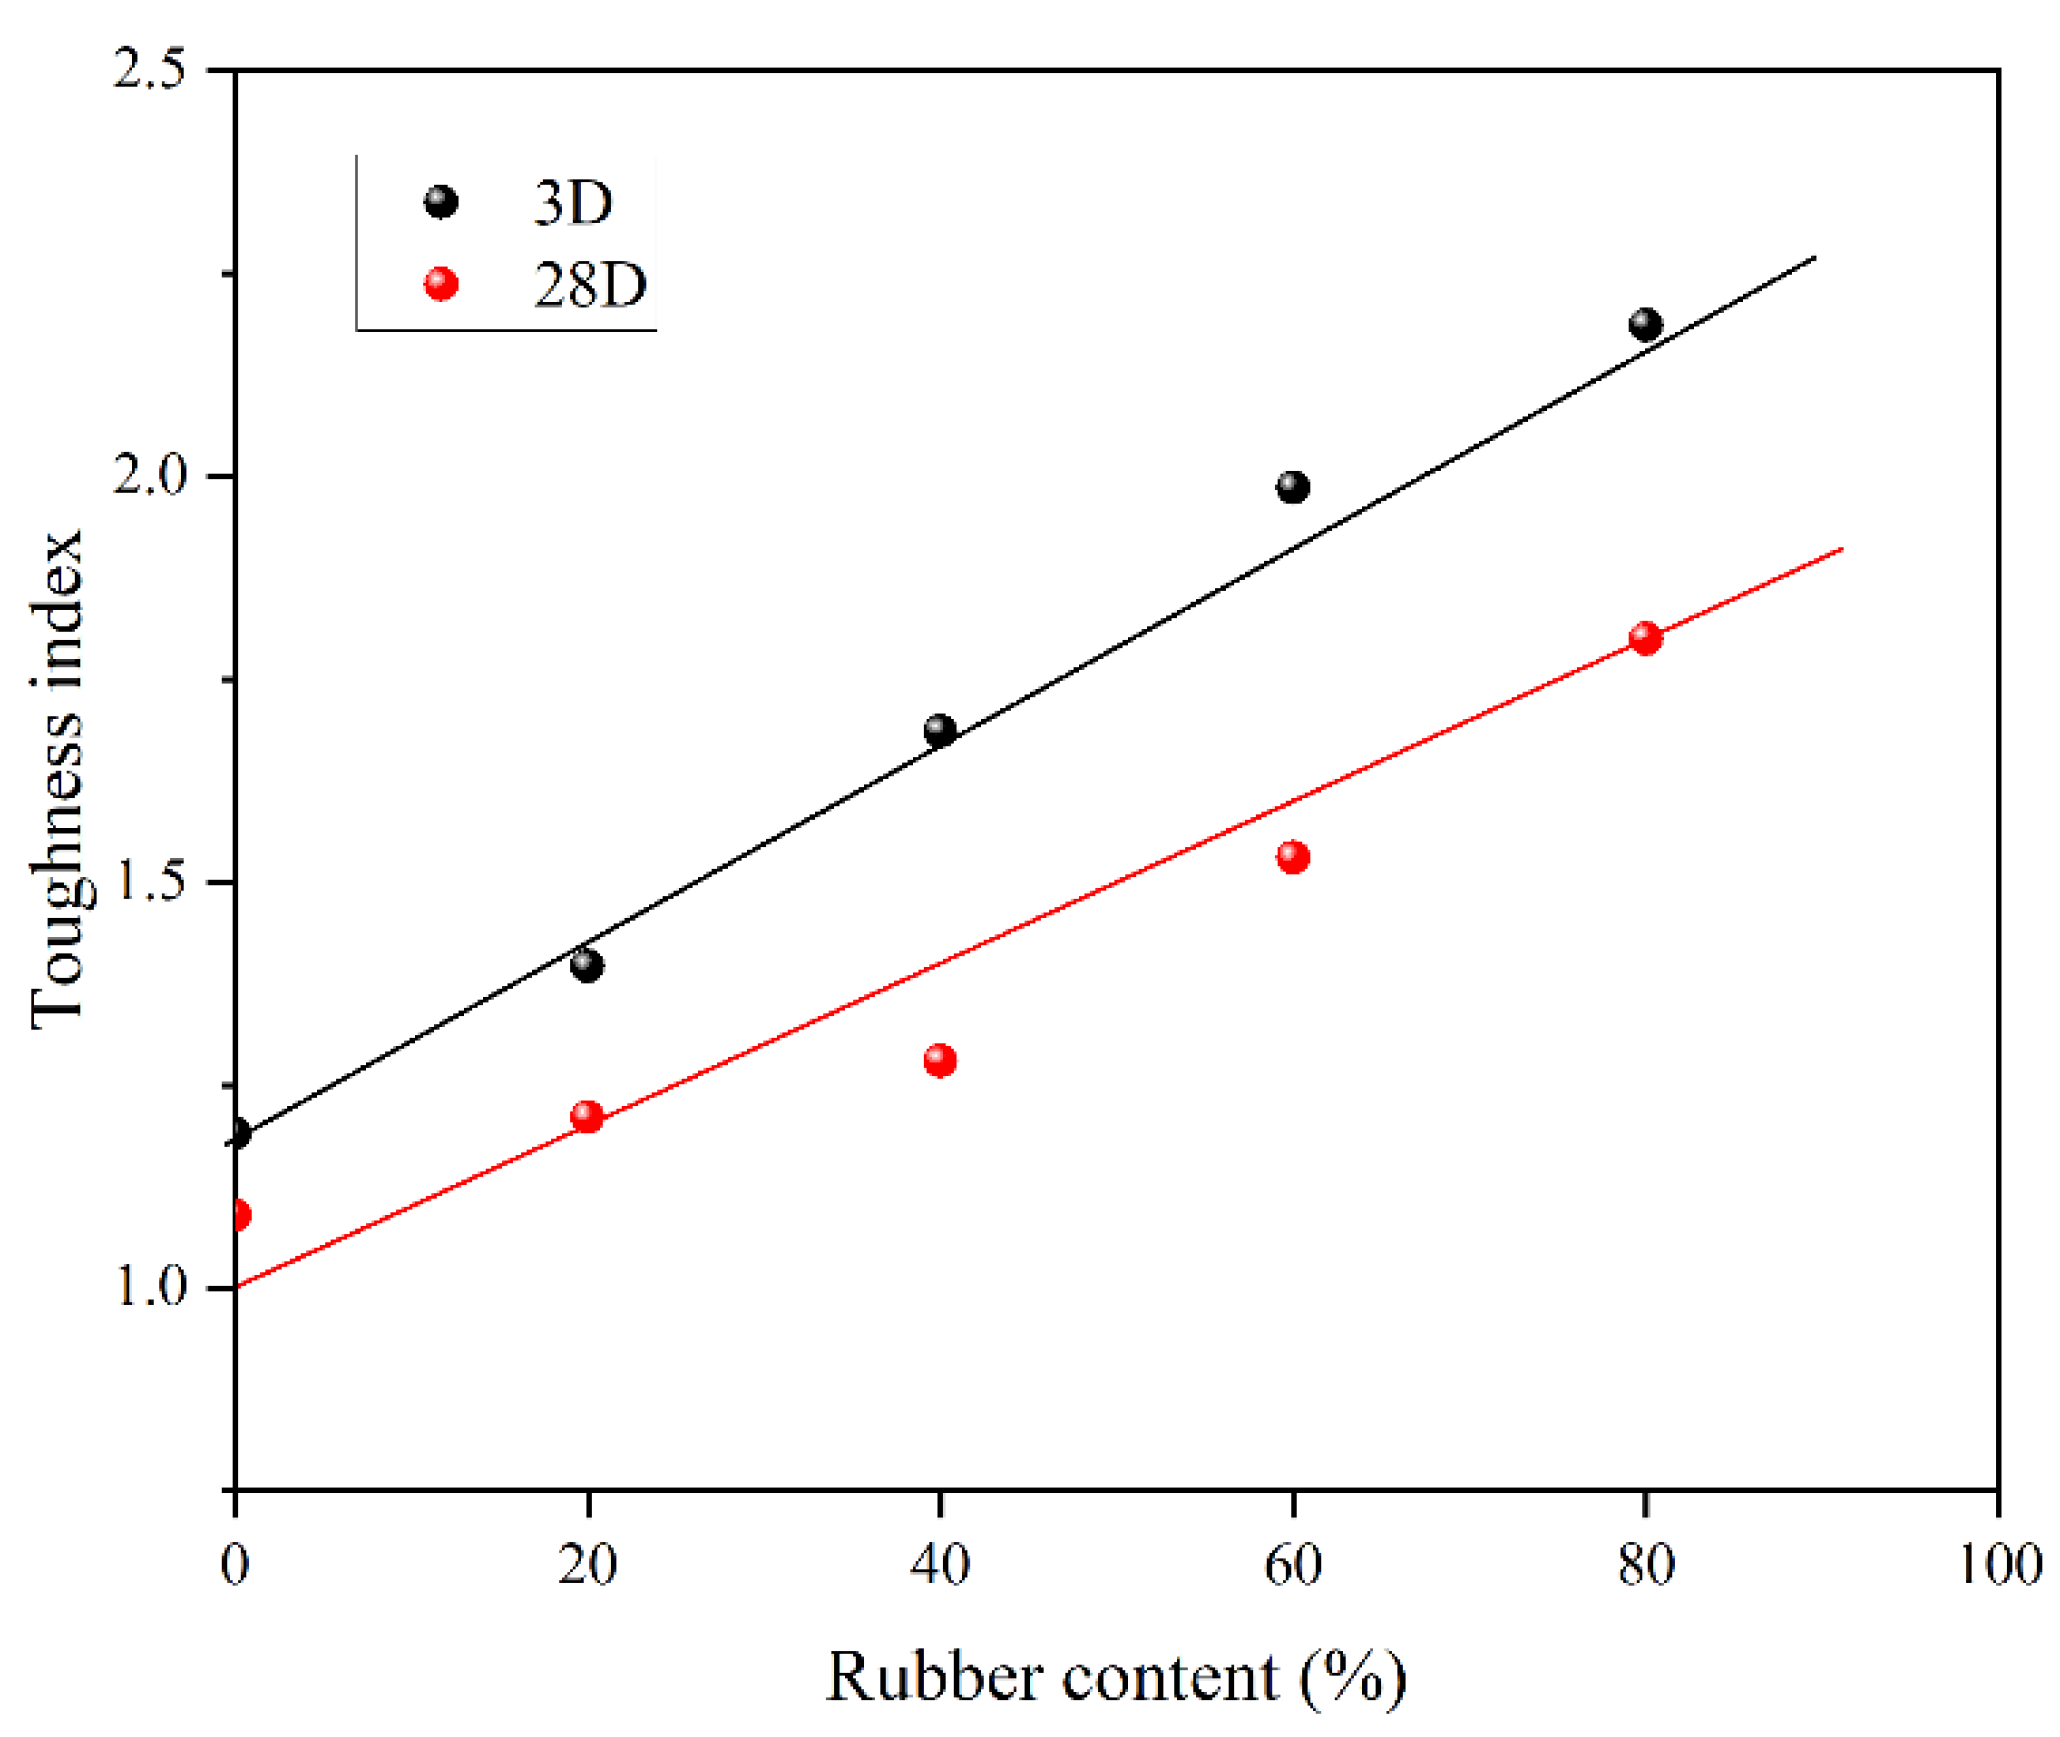
5.2. Effect of Rubber and Porous Sand on Aggregate
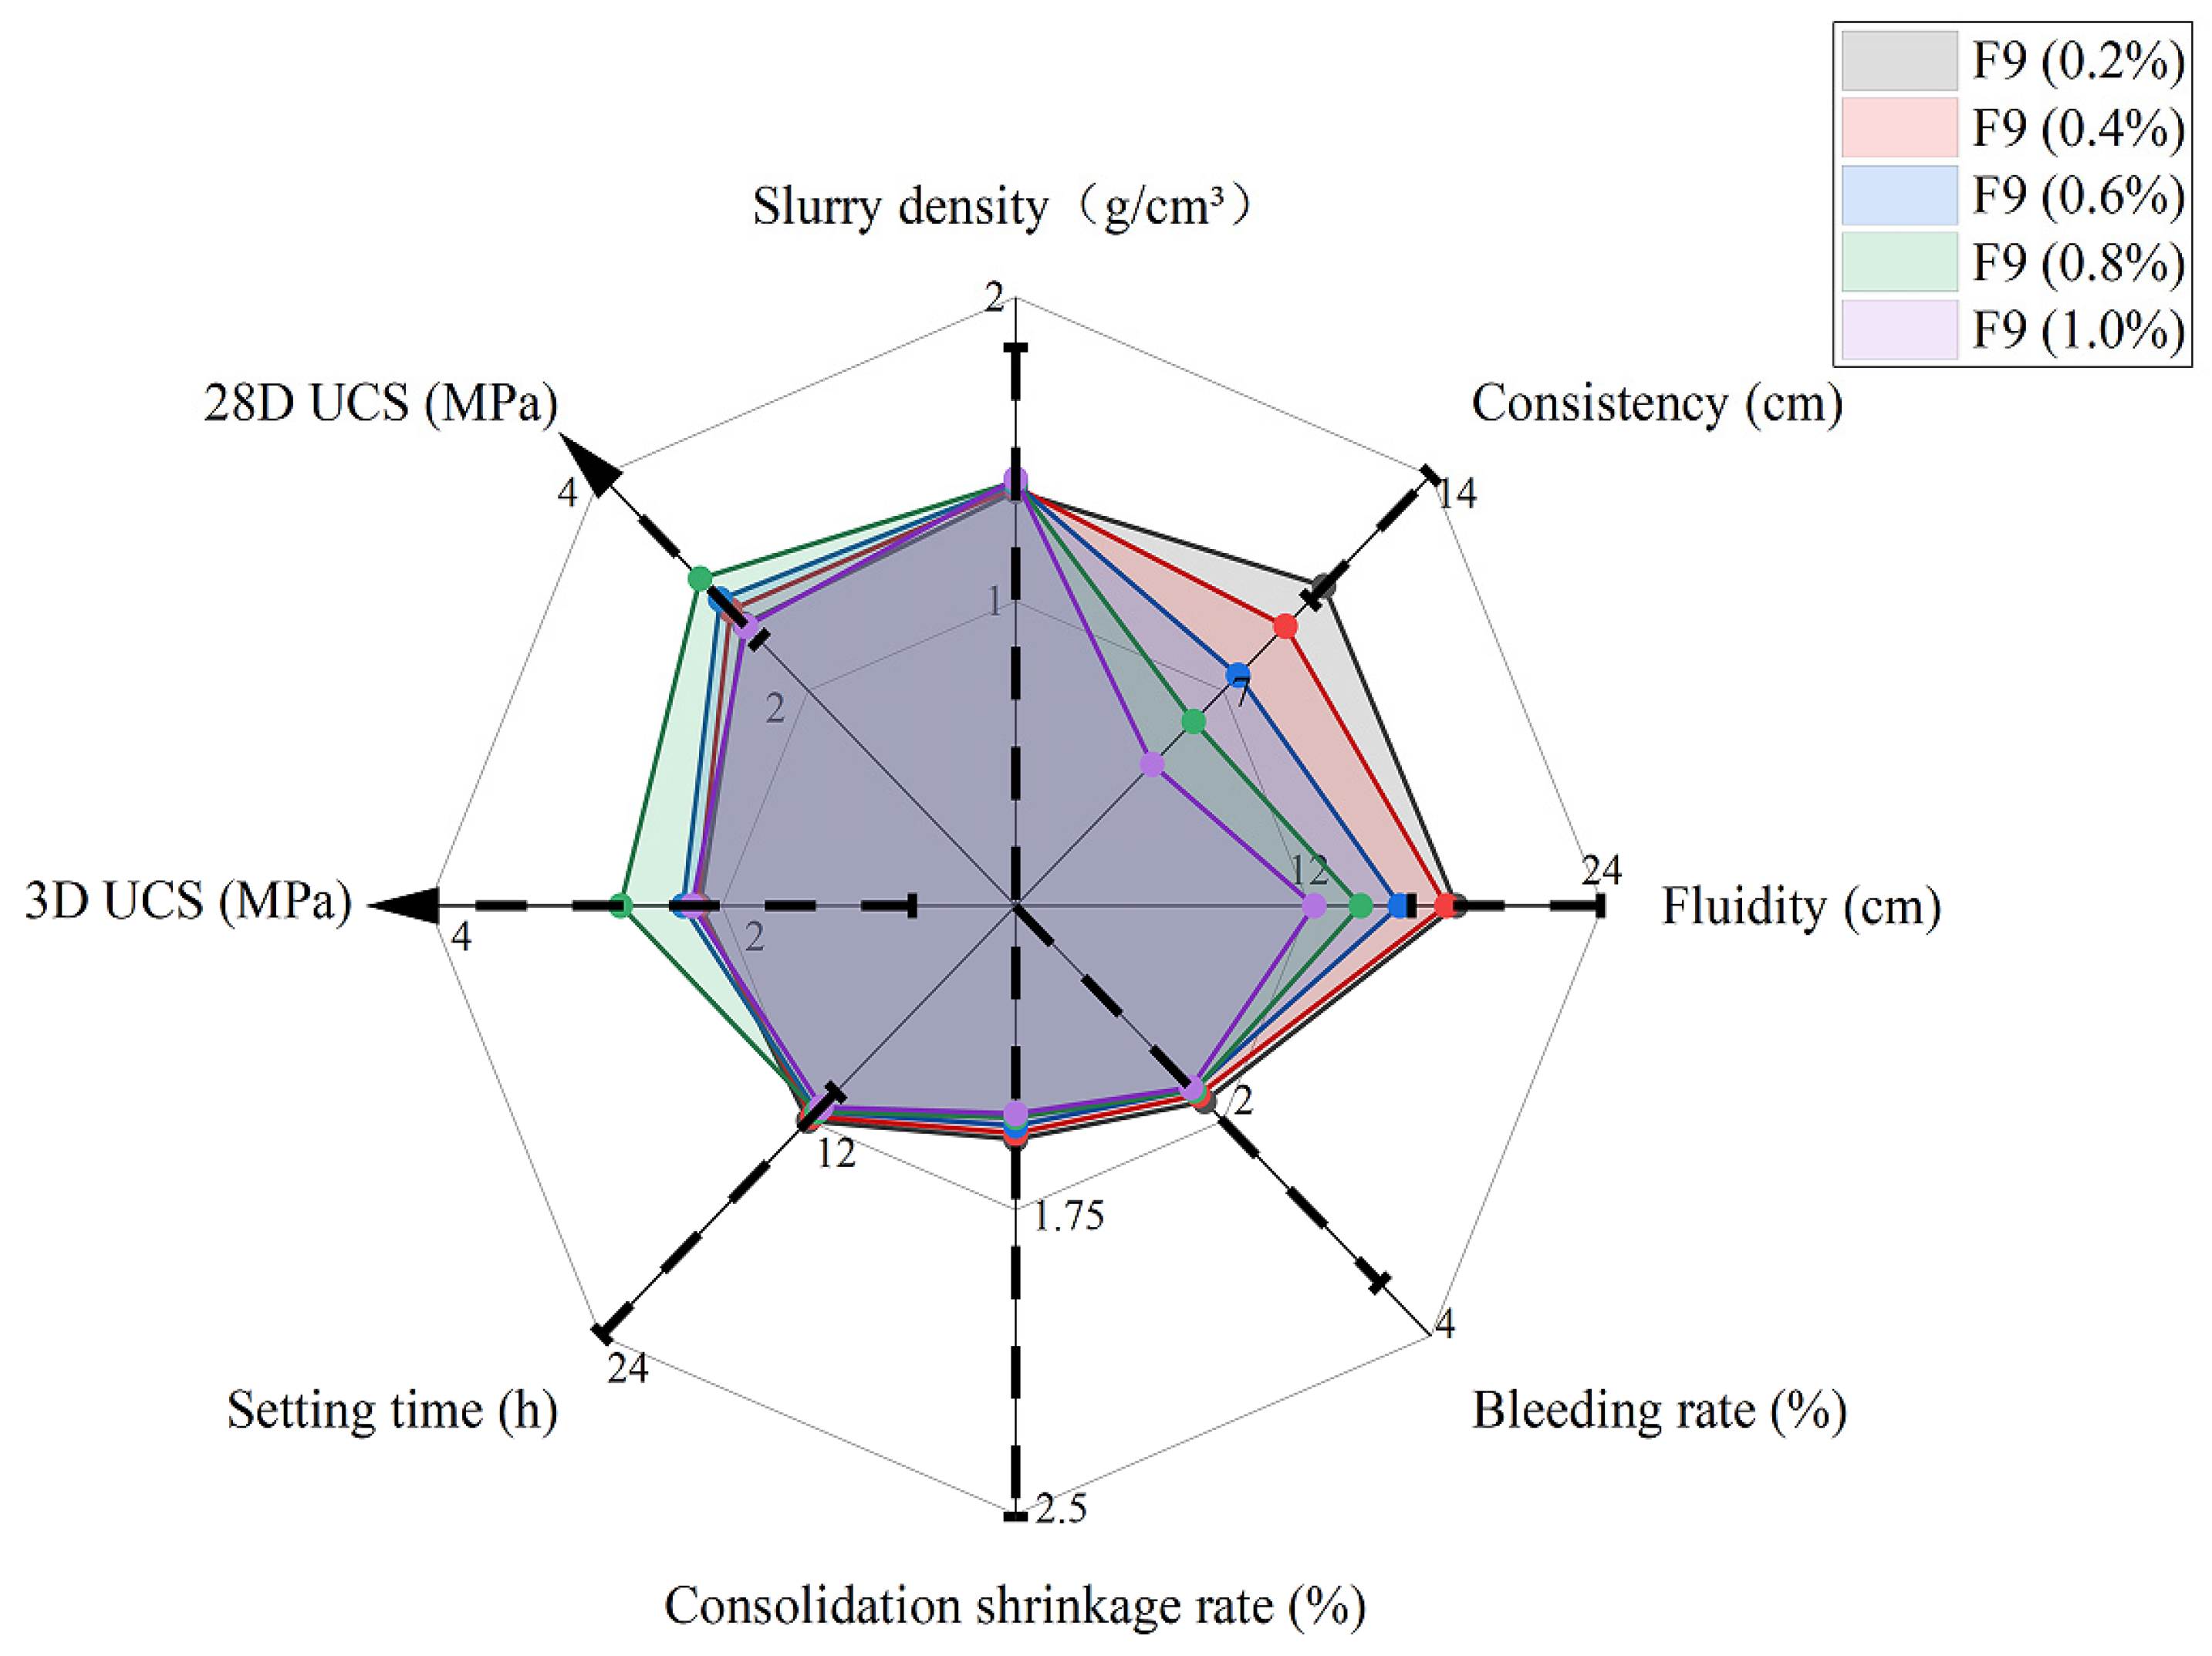
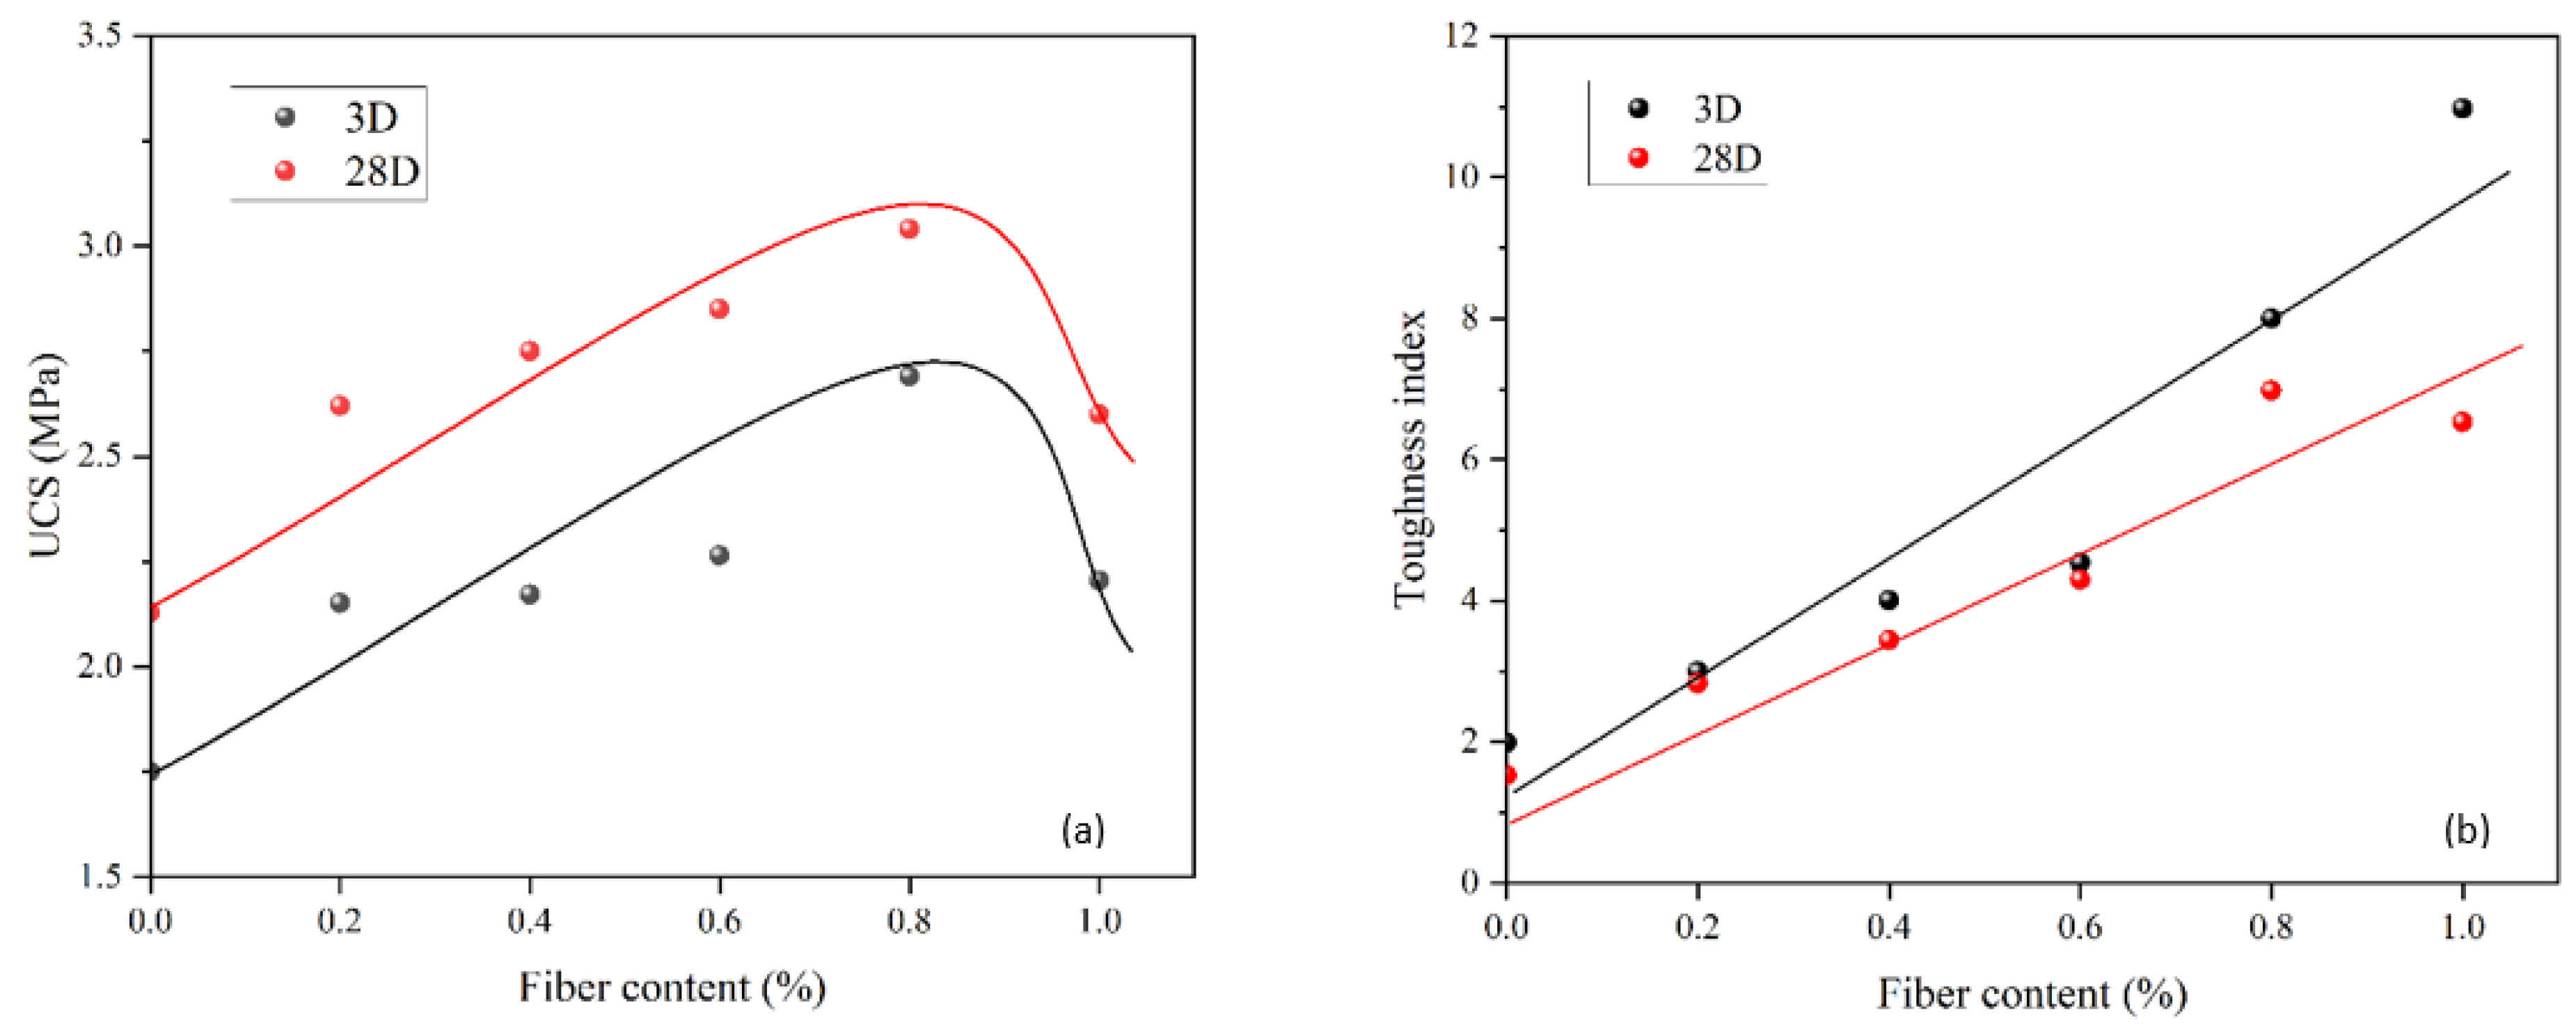
5.3. Effect of Fiber Content
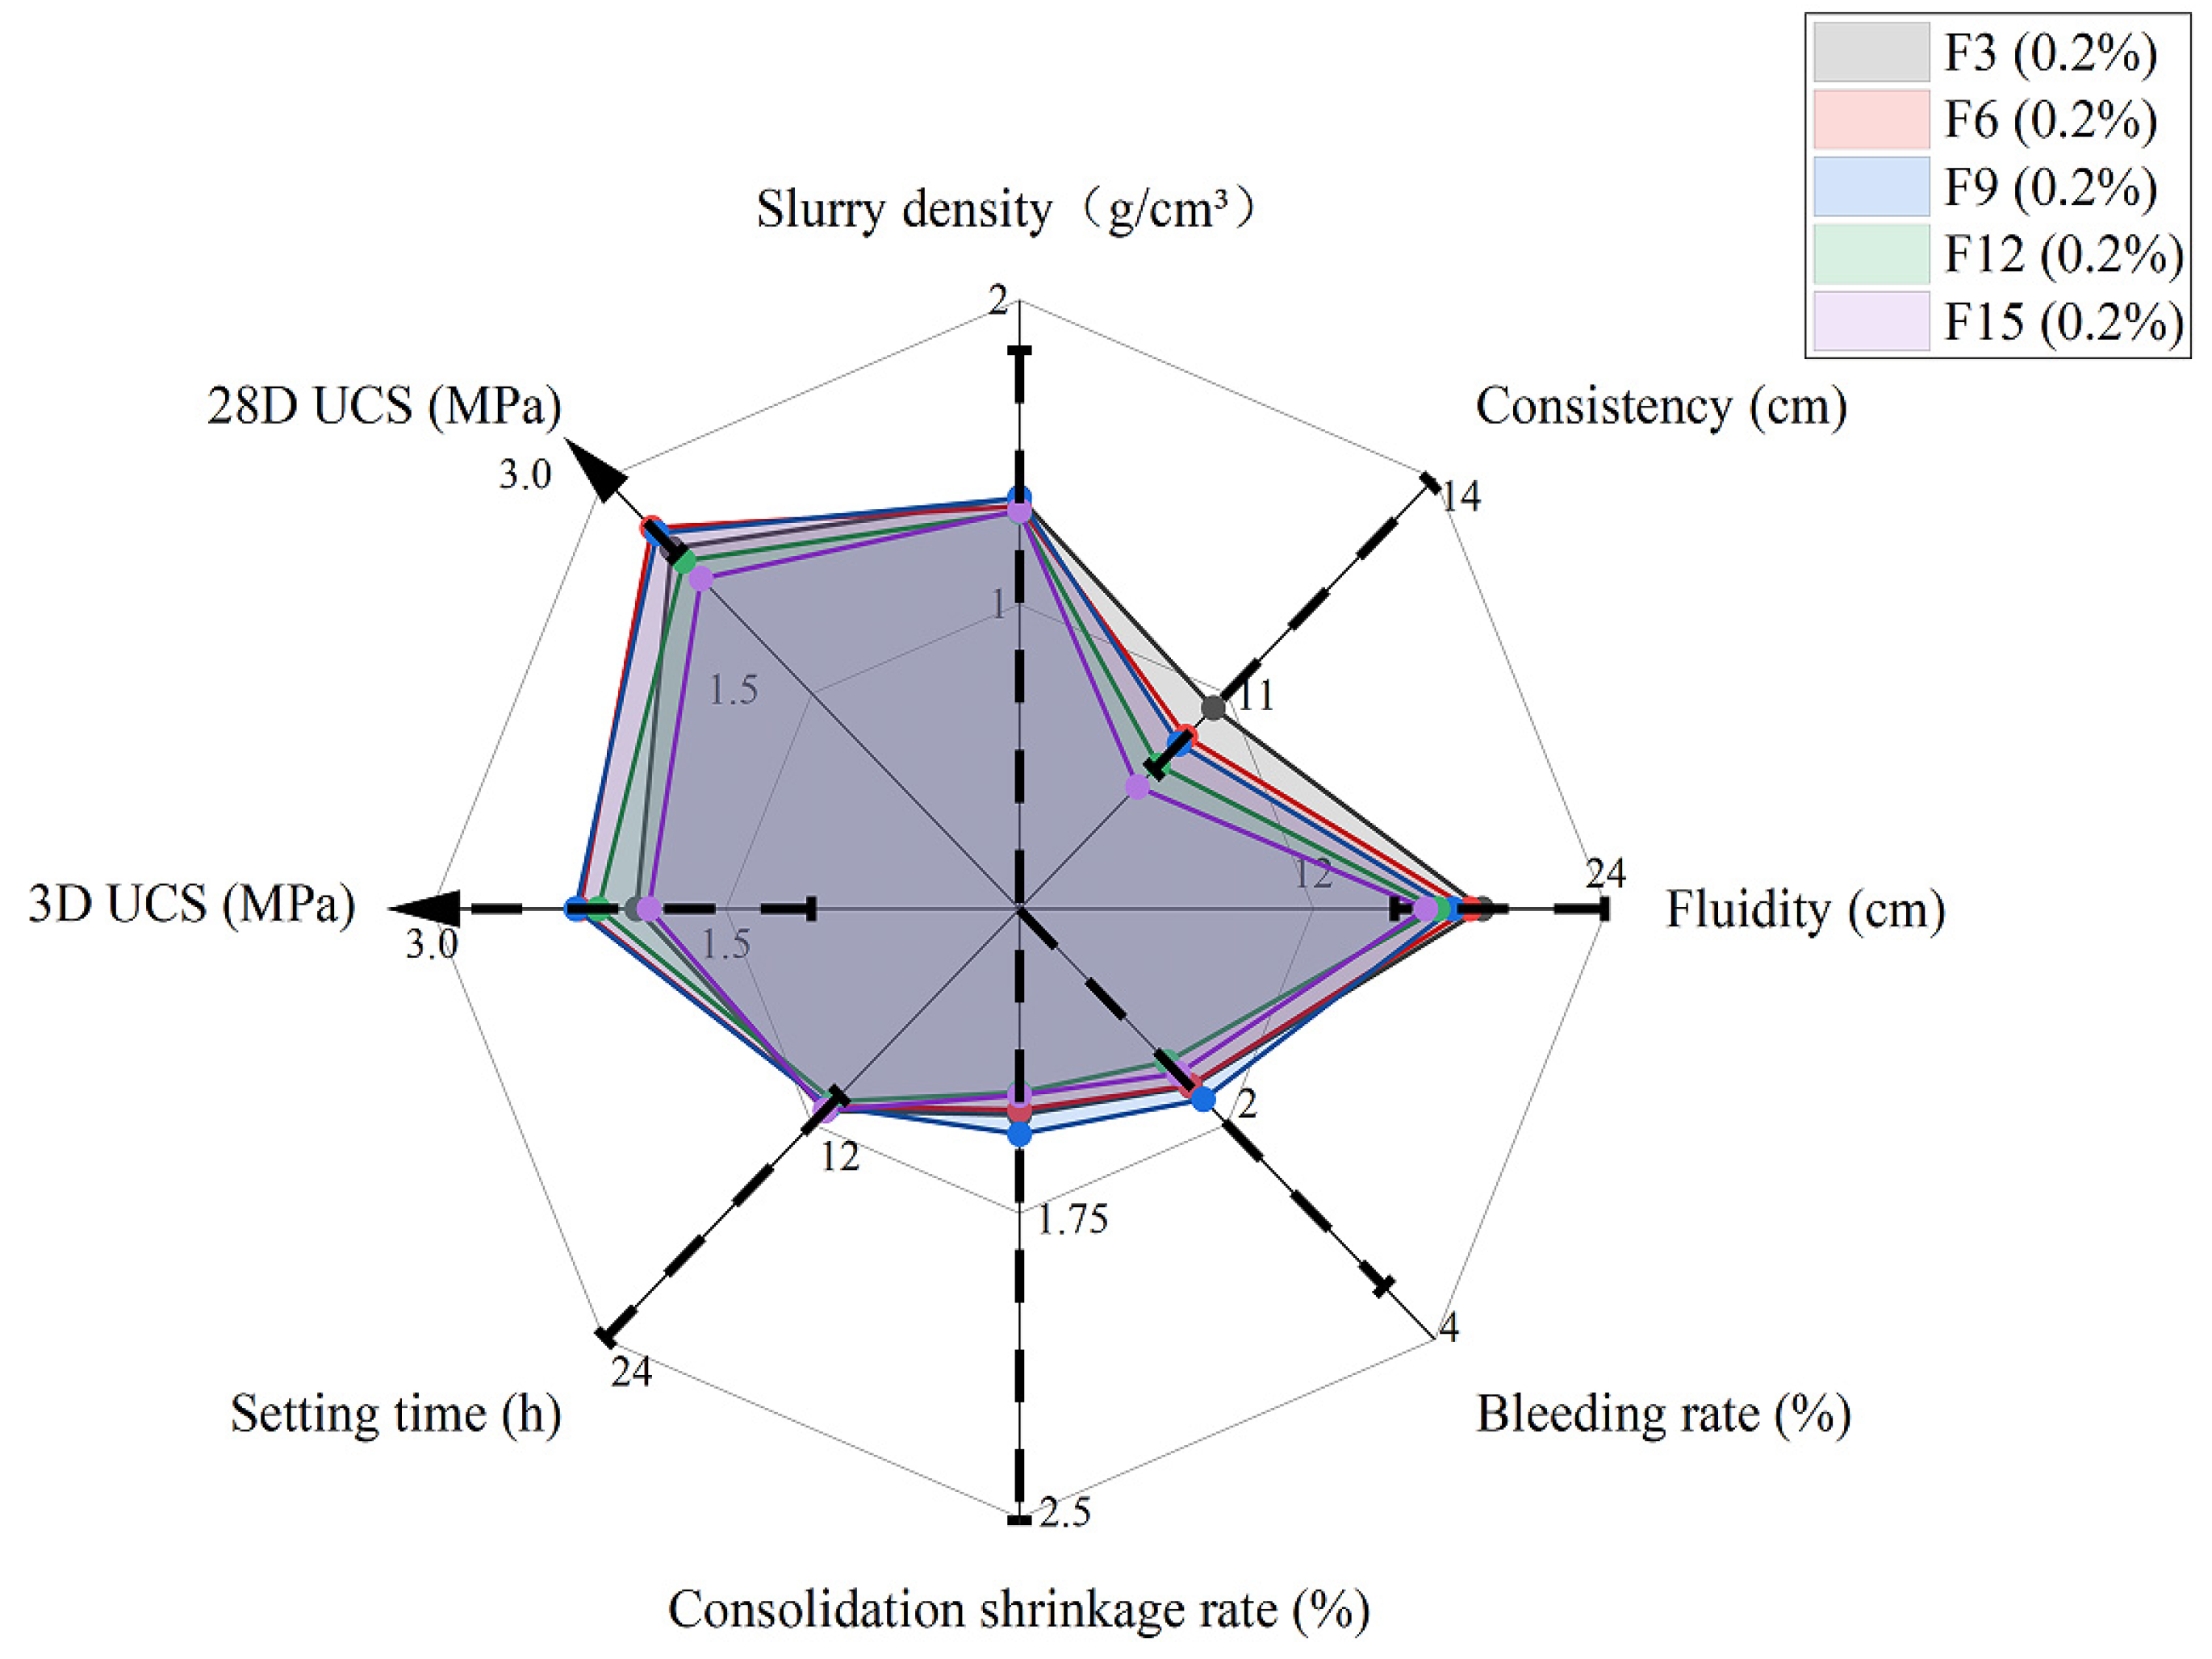
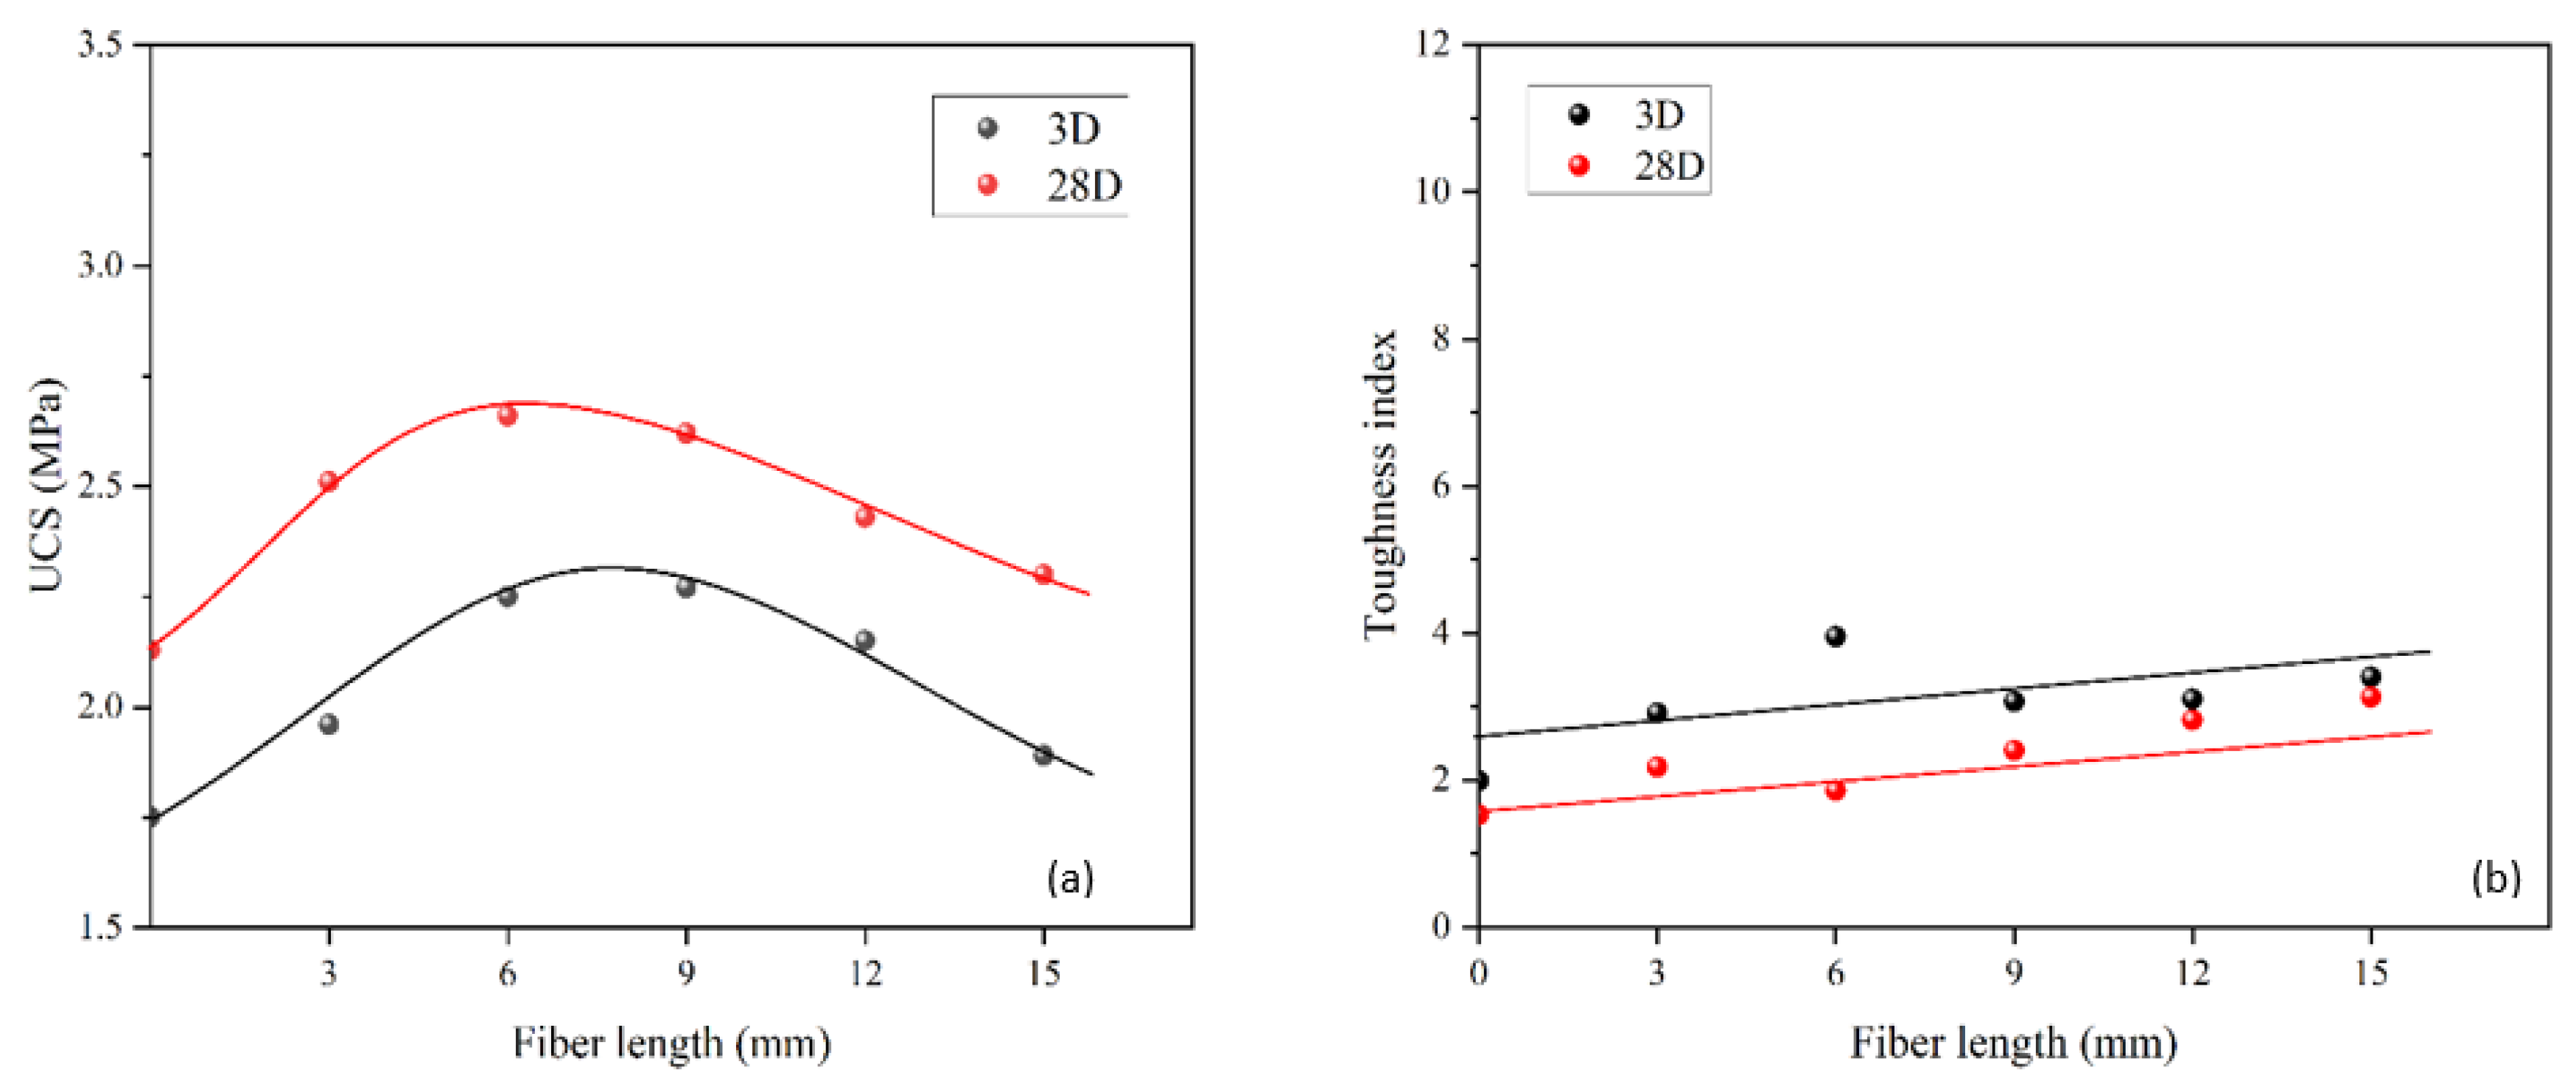
5.4. Effect of Fiber Length
6. Conclusions
Author Contributions
Funding
Institutional Review Board Statement
Informed Consent Statement
Data Availability Statement
Conflicts of Interest
References
- Mao, J.H.; Yuan, D.J.; Jin, D.L.; Zeng, J.F. Optimization and Application of Backfill Grouting Material for Submarine Tunnel. Constr. Build. Mater. 2020, 265, 120281. [Google Scholar] [CrossRef]
- Ye, F.; Yang, T.; Mao, J.H.; Qin, X.Z.; Zhao, R.L. Half-Spherical Surface Diffusion Model of Shield Tunnel Back-Fill Grouting Based on Infiltration Effect. Tunn. Undergr. Space Technol. 2019, 83, 274–281. [Google Scholar] [CrossRef]
- Liu, J.L.; Hamza, O.; Davies-Vollum, K.S.; Liu, J.Q. Repairing a Shield Tunnel Damaged by Secondary Grouting. Tunn. Undergr. Space Technol. 2018, 80, 313–321. [Google Scholar] [CrossRef] [Green Version]
- Ding, W.Q.; Duan, C.; Zhu, Y.H.; Zhao, T.C.; Huang, D.Z.; Li, P.N. The Behavior of Synchronous Grouting in a Quasi-Rectangular Shield Tunnel Based on a Large Visualized Model Test. Tunn. Undergr. Space Technol. 2019, 83, 409–424. [Google Scholar] [CrossRef]
- Cardinale, T.; D’Amato, M.; Sulla, R.; Cardinale, N. Mechanical and Physical Characterization of Papercrete as New Eco-Friendly Construction Material. Appl. Sci. 2021, 11, 1011. [Google Scholar] [CrossRef]
- Lu, S.; Koopialipoor, M.; Asteris, P.G.; Bahri, M.; Armaghani, D.J. A Novel Feature Selection Approach Based on Tree Models for Evaluating the Punching Shear Capacity of Steel Fiber-Reinforced Concrete Flat Slabs. Materials 2020, 13, 3902. [Google Scholar] [CrossRef]
- Zhang, C.; Fu, J.Y.; Yang, J.S.; Ou, X.F.; Ye, X.T.; Zhang, Y. Formulation and Performance of Grouting Materials for Underwater Shield Tunnel Construction in Karst Ground. Constr. Build. Mater. 2018, 187, 327–338. [Google Scholar] [CrossRef]
- Wang, S.; He, C.; Nie, L.; Zhang, G. Study on the Long-Term Performance of Cement-Sodium Silicate Grout and Its Impact on Segment Lining Structure in Synchronous Backfill Grouting of Shield Tunnels. Tunn. Undergr. Space Technol. 2019, 92, 103015. [Google Scholar] [CrossRef]
- Farzampour, A. Compressive Behavior of Concrete under Environmental Effects. In Compressive Strength of Concrete; IntechOpen: London, UK, 2019; pp. 92–104. [Google Scholar]
- Farzampour, A. Temperature and Humidity Effects on Behavior of Grouts. Adv. Concr. Constr. 2017, 5, 659. [Google Scholar]
- Kasper, T.; Meschke, G. A Numerical Study of the Effect of Soil and Grout Material Properties and Cover Depth in Shield Tunnelling. Comput. Geotech. 2006, 33, 234–247. [Google Scholar] [CrossRef]
- Song, W.L.; Zhu, Z.D.; Pu, S.Y.; Wan, Y.; Huo, W.W.; Peng, Y.Y. Preparation and Engineering Properties of Alkali-Activated Filling Grouts for Shield Tunnel. Constr. Build. Mater. 2022, 314, 125620. [Google Scholar] [CrossRef]
- Wan, Y.; Zhu, Z.; Song, L.; Song, S.; Zhang, J.; Gu, X.; Xu, X. Study on Temporary Filling Material of Synchronous Grouting in the Middle of Shield. Constr. Build. Mater. 2021, 273, 121681. [Google Scholar] [CrossRef]
- Todaro, C.; Carigi, A.; Martinelli, D.; Peila, D. Study of the Shear Strength Evolution over Time of Two-Component Backfilling Grout in Shield Tunnelling. Case Stud. Constr. Mater. 2021, 15, e00689. [Google Scholar] [CrossRef]
- Chalangaran, N.; Farzampour, A.; Paslar, N.; Fatemi, H. Experimental Investigation of Sound Transmission Loss in Concrete Containing Recycled Rubber Crumbs; Technopress: Vicenza, Italy, 2021. [Google Scholar]
- Chalangaran, N.; Farzampour, A.; Paslar, N. Nano Silica and Metakaolin Effects on the Behavior of Concrete Containing Rubber Crumbs. CivilEng 2020, 1, 264–274. [Google Scholar] [CrossRef]
- Mansouri, I.; Shahheidari, F.S.; Hashemi, S.M.A.; Farzampour, A. Investigation of Steel Fiber Effects on Concrete Abrasion Resistance. Adv. Concr. Constr. 2020, 9, 367–374. [Google Scholar]
- Guyonnet, D.; Touze-Foltz, N.; Norotte, V.; Pothier, C.; Didier, G.; Gailhanou, H.; Blanc, P.; Warmont, F. Performance-Based Indicators for Controlling Geosynthetic Clay Liners in Landfill Applications. Geotext. Geomembr. 2009, 27, 321–331. [Google Scholar] [CrossRef]
- Zou, Y.; Zhang, Y.; Liu, H.; Liu, H.; Miao, Y. Performance-Based Seismic Assessment of Shield Tunnels by Incorporating a Nonlinear Pseudostatic Analysis Approach for the Soil-Tunnel Interaction. Tunn. Undergr. Space Technol. 2021, 114, 103981. [Google Scholar] [CrossRef]
- Li, C.; Zhang, W.; Wang, X.; Pan, B.; Spencer, B.F. Modeling Dynamic Responses of a Cross-River Road Shield Tunnel under Stochastic Vehicle Loads. Tunn. Undergr. Space Technol. 2020, 102, 103432. [Google Scholar] [CrossRef]
- Liu, H.; Liu, H.; Zhang, Y.; Zou, Y.; Yu, X. Coupling Effects of Surface Building and Earthquake Loading on In-Service Shield Tunnels. Transp. Geotech. 2020, 26, 100453. [Google Scholar] [CrossRef]
- Liang, J.; Cui, J.; Lu, Y.; Li, Y.; Shan, Y. Limit Analysis of Shallow Tunnels Collapse Problem with Optimized Solution. Appl. Math. Model. 2022, 109, 98–116. [Google Scholar] [CrossRef]
- Ali, R.; Khaloo, M.; Dehestani, P. Rahmatabadi Mechanical Properties of Concrete Containing a High Volume of Tire-Rubber Particles. Waste Manag. 2008, 28, 2472–2482. [Google Scholar]
- Gravina, R.J.; Xie, T.Y. Toward the Development of Sustainable Concrete with Crumb Rubber: Design-Oriented Models, Life-Cycle-Assessment and a Site Application. Constr. Build. Mater. 2022, 315, 125565. [Google Scholar] [CrossRef]
- He, L.; Cai, H.D.; Huang, Y.; Ma, Y.; van den Bergh, W.; Gaspar, L.; Valentin, J.; Vasiliev, Y.E.; Kowalski, K.J.; Zhang, J.H. Research on the Properties of Rubber Concrete Containing Surface-Modified Rubber Powders. J. Build. Eng. 2021, 35, 101991. [Google Scholar] [CrossRef]
- Yu, Z.; Tang, R.; Li, F.; Hu, Y.; Liu, G.; Qin, Y.; Huang, Q. Experimental Study and Failure Criterion Analysis on Combined Compression-Shear Performance of Rubber Concrete (RC) with Different Rubber Replacement Ratio. Constr. Build. Mater. 2021, 288, 123105. [Google Scholar] [CrossRef]
- Assaggaf, R.A.; Al-Dulaijan, S.U.; Maslehuddin, M.; Al-Amoudi, O.S.B.; Ahmad, S.; Ibrahim, M. Effect of Different Treatments of Crumb Rubber on the Durability Characteristics of Rubberized Concrete. Constr. Build. Mater. 2022, 318, 126030. [Google Scholar] [CrossRef]
- Feng, W.H.; Liu, F.; Yang, F.; Jing, L.; Li, L.J.; Li, H.Z.; Chen, L. Compressive Behaviour and Fragment Size Distribution Model for Failure Mode Prediction of Rubber Concrete under Impact Loads. Constr. Build. Mater. 2021, 273, 121767. [Google Scholar] [CrossRef]
- Khan, I.; Shahzada, K.; Bibi, T.; Ahmed, A.; Ullah, H. Seismic Performance Evaluation of Crumb Rubber Concrete Frame Structure Using Shake Table Test. Structures 2021, 30, 41–49. [Google Scholar] [CrossRef]
- Wang, J.Q.; Dai, Q.L.; Si, R.Z.; Guo, S.C. Investigation of Properties and Performances of Polyvinyl Alcohol (PVA) Fiber-Reinforced Rubber Concrete. Constr. Build. Mater. 2018, 193, 631–642. [Google Scholar] [CrossRef]
- Al-Tayeb, M.M.; Abu Bakar, B.H.; Ismail, H.; Akil, H.M. Effect of Partial Replacement of Sand by Fine Crumb Rubber on Impact Load Behavior of Concrete Beam: Experiment and Nonlinear Dynamic Analysis. Mater Struct 2013, 46, 1299–1307. [Google Scholar] [CrossRef]
- Hassanli, R.; Youssf, O.; Mills, J.E. Experimental Investigations of Reinforced Rubberized Concrete Structural Members. J. Build. Eng. 2017, 10, 149–165. [Google Scholar] [CrossRef]
- Shao, J.W.; Zhu, H.; Zhao, B.; Haruna, S.I.; Xue, G.; Jiang, W.L.X.; Wu, K.X.; Yang, J. Combined Effect of Recycled Tire Rubber and Carbon Nanotubes on the Mechanical Properties and Microstructure of Concrete. Constr. Build. Mater. 2022, 322, 126493. [Google Scholar] [CrossRef]
- Li, H.; Han, D.H.; Gao, J.H.; Yuan, H.M.; Wang, Y. Pressure Loading Histories and Clay Fraction Effects on the Static and Dynamic Elastic Properties of Sand-Clay Synthetic Sediments. Powder Technol. 2019, 345, 804–814. [Google Scholar] [CrossRef]
- Zhao, W.S.; Chen, W.Z.; Ma, S.S.; Zhao, K.; Song, W.P.; Li, C. Isolation effect of foamed concrete layer on the seismic responses of tunnel. Rock Soil Mech. 2018, 39, 1027–1036. [Google Scholar] [CrossRef]
- Lu, Y.; Abuel-Naga, H.; Leong, E.-C.; Bouazza, A.; Lock, P. Effect of Water Salinity on the Water Retention Curve of Geosynthetic Clay Liners. Geotext. Geomembr. 2018, 46, 707–714. [Google Scholar] [CrossRef]
- Lu, Y.; Abuel-Naga, H.; Bouazza, A. Water Retention Curve of GCLs Using a Modified Sample Holder in a Chilled-Mirror Dew-Point Device. Geotext. Geomembr. 2017, 45, 23–28. [Google Scholar] [CrossRef]
- Lu, Y.; Abuel-Naga, H.; Leong, E.-C. Mechanical and Osmotic Consolidation of Geosynthetic Clay Liners: A Laboratory Study. Geosynth. Int. 2020, 27, 1–27. [Google Scholar] [CrossRef]
- Si, W.; Cao, M.L.; Li, L. Establishment of Fiber Factor for Rheological and Mechanical Performance of Polyvinyl Alcohol (PVA) Fiber Reinforced Mortar. Constr. Build. Mater. 2020, 265, 120347. [Google Scholar] [CrossRef]
- Dong, Z.F.; Deng, M.K.; Zhang, C.; Zhang, Y.X.; Sun, H.Z. Tensile Behavior of Glass Textile Reinforced Mortar (TRM) Added with Short PVA Fibers. Constr. Build. Mater. 2020, 260, 119897. [Google Scholar] [CrossRef]
- Ling, Y.; Zhang, P.; Wang, J.; Chen, Y. Effect of PVA Fiber on Mechanical Properties of Cementitious Composite with and without Nano-SiO2. Constr. Build. Mater. 2019, 229, 117068. [Google Scholar] [CrossRef]
- Lang, L.; Chen, B.; Duan, H. Modification of Nanoparticles for the Strength Enhancing of Cement- Stabilized Dredged Sludge. J. Rock Mech. Geotech. Eng. 2021, 13, 694–704. [Google Scholar] [CrossRef]
- Lang, L.; Song, C.; Xue, L.; Chen, B. Effectiveness of Waste Steel Slag Powder on the Strength Development and Associated Micro-Mechanisms of Cement-Stabilized Dredged Sludge. Constr. Build. Mater. 2020, 240, 117975. [Google Scholar] [CrossRef]
- Du, Y.-J.; Horpibulsuk, S.; Wei, M.-L.; Suksiripattanapong, C.; Liu, M.D. Modeling Compression Behavior of Cement-Treated Zinc-Contaminated Clayey Soils. Soils Found. 2014, 54, 1018–1026. [Google Scholar] [CrossRef] [Green Version]
- Al Rashid, Q.A.; Abuel-Naga, H.M.; Leong, E.C.; Lu, Y.; Abadi, H.A. Experimental-Artificial Intelligence Approach for Characterizing Electrical Resistivity of Partially Saturated Clay Liners. Appl. Clay Sci. 2018, 156, 1–10. [Google Scholar] [CrossRef]
- JGJ/T 70-2009; Standard for Test Method of Basic Properties of Construction Mortar. Standards Press of China: Beijing, China, 2009. (In Chinese)
- Li, W.; Lang, L.; Wang, D.; Wu, Y.; Li, F. Investigation on the Dynamic Shear Modulus and Damping Ratio of Steel Slag Sand Mixtures. Constr. Build. Mater. 2018, 162, 170–180. [Google Scholar] [CrossRef]
- GB/T 2419-2005; Test Method for Fluidity of Cement Mortar. China Standardization Administration: Beijing, China, 2005. (In Chinese)
- T/CECS 563; Technical Specification for Simultaneous Grouting Material in Shield Projects. China Standardization Administration: Beijing, China, 2018. (In Chinese)
- GB/T 50266-2013; Standard for Test Methods of Engineering Rock Mass. Mohurd: Beijing, China, 2013. (In Chinese)
- Topçu, I.B. The Properties of Rubberized Concretes. Cem. Concr. Res. 1995, 25, 304–310. [Google Scholar] [CrossRef]
- Assaggaf, R.; Maslehuddin, M.; Al-Osta, M.A.; Al-Dulaijan, S.U.; Ahmad, S. Properties and Sustainability of Treated Crumb Rubber Concrete. J. Build. Eng. 2022, 51, 104250. [Google Scholar] [CrossRef]
- Qaidi, S.M.A.; Dinkha, Y.Z.; Haido, J.H.; Ali, M.H.; Tayeh, B.A. Engineering Properties of Sustainable Green Concrete Incorporating Eco-Friendly Aggregate of Crumb Rubber: A Review. J. Clean. Prod. 2021, 324, 129251. [Google Scholar] [CrossRef]


| Composition | Content (%) |
|---|---|
| CaO | 61.11 |
| SiO2 | 24.3 |
| Al2O3 | 5.33 |
| Fe2O3 | 4.38 |
| SO3 | 2.24 |
| MgO | 1.36 |
| Loss on ignition | 1.28 |
| Diameter (mm) | Modulus of Elasticity (MPa) | Tensile Strength (MPa) | Elongation at Break (%) | Density (g/cm3) |
|---|---|---|---|---|
| 0.2 | 15,000 | 950 | 27 | 0.91 |
| Size (mm) | Bulk Density (g/cm3) | Maximum Absorbed Water (%) |
|---|---|---|
| 1–1.5 | 117 | 43 |
| Test No. | Abbreviation | Water (g) | Cement (g) | Porous Sand (g) | Rubber (g) | Rubber Content (%) | Fiber (g) | Fiber Content (%) | Fiber Length (mm) |
|---|---|---|---|---|---|---|---|---|---|
| A1 | R0% | 1 | 1.67 | 0.19 | 0.00 | 0% | / | / | / |
| A2 | R20% | 1 | 1.67 | 0.15 | 0.26 | 20% | / | / | / |
| A3 | R40% | 1 | 1.67 | 0.11 | 0.53 | 40% | / | / | / |
| A4 | R60% | 1 | 1.67 | 0.08 | 0.79 | 60% | / | / | / |
| A5 | R80% | 1 | 1.67 | 0.04 | 1.06 | 80% | / | / | / |
| B1 | F9(0.2%) | 1 | 1.67 | 0.08 | 0.79 | 60% | 0.0086 | 0.20% | 9 |
| B2 | F9(0.4%) | 1 | 1.67 | 0.08 | 0.79 | 60% | 0.0172 | 0.40% | 9 |
| B3 | F9(0.6%) | 1 | 1.67 | 0.08 | 0.79 | 60% | 0.0259 | 0.60% | 9 |
| B4 | F9(0.8%) | 1 | 1.67 | 0.08 | 0.79 | 60% | 0.0346 | 0.80% | 9 |
| B5 | F9(1%) | 1 | 1.67 | 0.08 | 0.79 | 60% | 0.0434 | 1.00% | 9 |
| C1 | F3(0.2%) | 1 | 1.67 | 0.08 | 0.79 | 60% | 0.0086 | 0.20% | 3 |
| C2 | F6(0.2%) | 1 | 1.67 | 0.08 | 0.79 | 60% | 0.0086 | 0.20% | 6 |
| B1 | F9(0.2%) | 1 | 1.67 | 0.08 | 0.79 | 60% | 0.0086 | 0.20% | 9 |
| C3 | F12(0.2%) | 1 | 1.67 | 0.08 | 0.79 | 60% | 0.0086 | 0.20% | 12 |
| C4 | F15(0.2%) | 1 | 1.67 | 0.08 | 0.79 | 60% | 0.0086 | 0.20% | 15 |
| Test | Standard for the Experiment | Recommended Requirement |
|---|---|---|
| Slurry density (g/cm3) | JGJ/T 70-2009 [38] | ≤1.9 |
| Consistency (cm) | JGJ/T 70-2009 [38] | 10–14 |
| Fluidity (cm) | GB/T 2419-2005 [42] | 16–24 |
| Bleeding rate (%) | T/CECS 563-2018 [43] | ≤3.5 |
| Consolidation shrinkage rate (%) | T/CECS 563-2018 [43] | 5 |
| Setting time (h) | JGJ/T 70-2009 [38] | 12–24 |
| 3D compressive strength (MPa) | GB/T 50266-2013 [44] | ≥0.5 |
| 28D compressive strength (MPa) | GB/T 50266-2013 [44] | ≥2.5 |
Publisher’s Note: MDPI stays neutral with regard to jurisdictional claims in published maps and institutional affiliations. |
© 2022 by the authors. Licensee MDPI, Basel, Switzerland. This article is an open access article distributed under the terms and conditions of the Creative Commons Attribution (CC BY) license (https://creativecommons.org/licenses/by/4.0/).
Share and Cite
Lu, Y.; Li, C.; Zhang, X.; Huang, X.; Zhao, Z. A Workability Characterization of Innovative Rubber Concrete as a Grouting Material. Materials 2022, 15, 5319. https://doi.org/10.3390/ma15155319
Lu Y, Li C, Zhang X, Huang X, Zhao Z. A Workability Characterization of Innovative Rubber Concrete as a Grouting Material. Materials. 2022; 15(15):5319. https://doi.org/10.3390/ma15155319
Chicago/Turabian StyleLu, Yi, Cong Li, Xiaoyu Zhang, Xiangyun Huang, and Zhongyin Zhao. 2022. "A Workability Characterization of Innovative Rubber Concrete as a Grouting Material" Materials 15, no. 15: 5319. https://doi.org/10.3390/ma15155319
APA StyleLu, Y., Li, C., Zhang, X., Huang, X., & Zhao, Z. (2022). A Workability Characterization of Innovative Rubber Concrete as a Grouting Material. Materials, 15(15), 5319. https://doi.org/10.3390/ma15155319