
Blown Composite Films of Low-Density/Linear-Low-Density Polyethylene and Silica Aerogel for Transparent Heat Retention Films and Influence of Silica Aerogel on Biaxial Properties

 ,
,  , and
, and
Abstract
:1. Introduction
2. Experimental Section
2.1. Materials
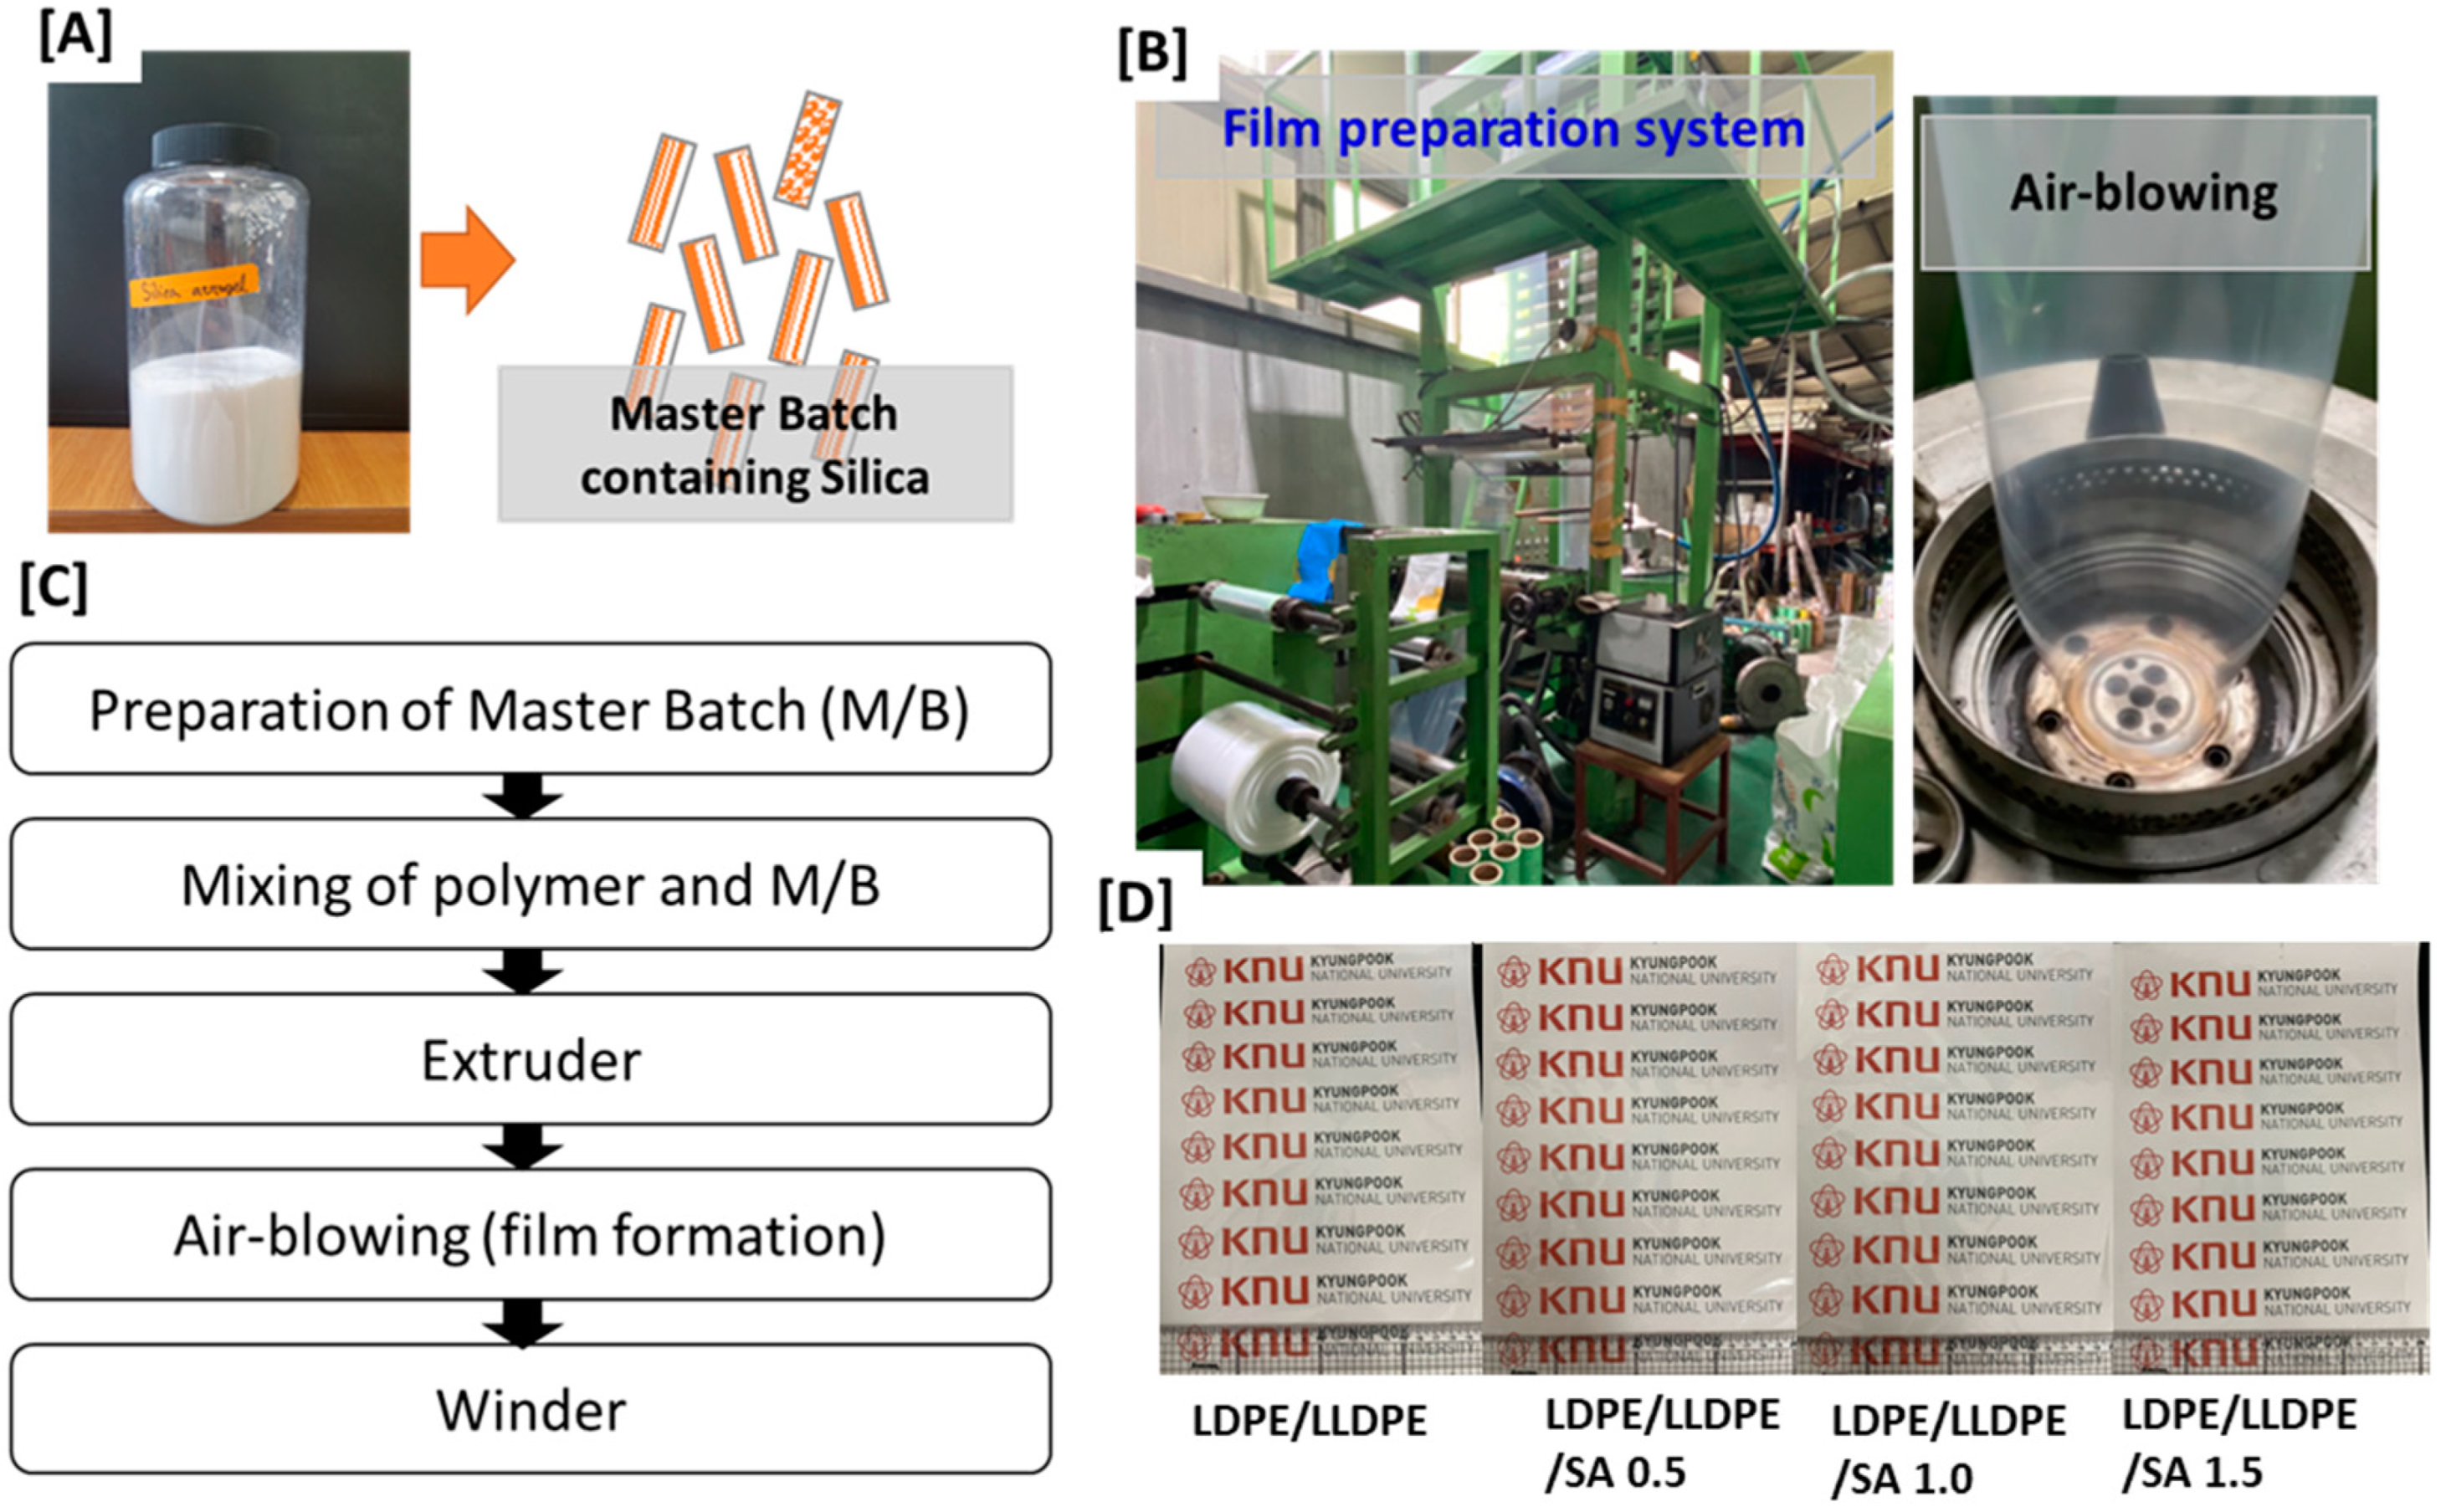
2.2. Preparation of LDPE/LLDPE/SA (0–1.5 wt.%) Extruded Blown Composite Film
2.3. Instrumental Analysis
3. Results and Discussion
4. Conclusions
Author Contributions
Funding
Institutional Review Board Statement
Informed Consent Statement
Data Availability Statement
Conflicts of Interest
References
- Campuzano, J.; Lopez, I. Study of the effect of dicumyl peroxide on morphological and physical properties of foam injection molded poly (lactic acid)/poly (butylene succinate) blends. Express Polym. Lett. 2020, 14, 673–684. [Google Scholar] [CrossRef]
- Zhang, Q.; Chen, W.; Zhao, H.; Ji, Y.; Meng, L.; Wang, D.; Li, L. In-situ tracking polymer crystallization during film blowing by synchrotron radiation X-ray scattering: The critical role of network. Polymer 2020, 198, 122492. [Google Scholar] [CrossRef]
- Delgadillo-Velázquez, O.; Hatzikiriakos, S.; Sentmanat, M. Thermorheological properties of LLDPE/LDPE blends: Effects of production technology of LLDPE. J. Polym. Sci. Part B Polym. Phys. 2008, 46, 1669–1683. [Google Scholar] [CrossRef]
- Fang, Y.; Carreau, P.J.; Lafleur, P.G. Thermal and rheological properties of mLLDPE/LDPE blends. Polym. Eng. Sci. 2005, 45, 1254–1264. [Google Scholar] [CrossRef]
- Hussein, I.A.; Williams, M.C. Rheological study of the influence of branch content on the miscibility of octene m-LLDPE and ZN-LLDPE in LDPE. Polym. Eng. Sci. 2004, 44, 660–672. [Google Scholar] [CrossRef]
- Schlund, B.; Utracki, L. Linear low density polyethylenes and their blends: Part 3. Extensional flow of LLDPE’s. Polym. Eng. Sci. 1987, 27, 380–386. [Google Scholar] [CrossRef]
- Al-Attar, F. Thermal, Mechanical and Rheological Properties of Low Density/Linear Low Density Polyethylene Blend for Packing Application. J. Mater. Sci. Chem. Eng. 2018, 6, 32. [Google Scholar] [CrossRef] [Green Version]
- Monwar, M.; Yu, Y. Determination of the Composition of LDPE/LLDPE Blends via 13C NMR. In Macromolecular Symposia; Wiley: Hoboken, NJ, USA, 2020; p. 1900013. [Google Scholar]
- Busu, W.N.W.; Chen, R.S.; Shahdan, D.; Yusof, M.J.M.; Saad, M.J.; Ahmad, S. Statistical Optimization Using Response Surface Methodology for Enhanced Tensile Strength of Polyethylene/Graphene Nanocomposites. Int. J. Integr. Eng. 2021, 13, 109–117. [Google Scholar]
- Al Sheheri, S.Z.; Al-Amshany, Z.M.; Al Sulami, Q.A.; Tashkandi, N.Y.; Hussein, M.A.; El-Shishtawy, R.M. The preparation of carbon nanofillers and their role on the performance of variable polymer nanocomposites. Des. Monomers Polym. 2019, 22, 8–53. [Google Scholar] [CrossRef] [Green Version]
- Deng, J.; Ding, Q.M.; Li, W.; Wang, J.H.; Liu, D.M.; Zeng, X.X.; Liu, X.Y.; Ma, L.; Deng, Y.; Su, W. Preparation of nano-silver-containing polyethylene composite film and Ag Ion migration into food-simulants. J. Nanosci. Nanotechnol. 2020, 20, 1613–1621. [Google Scholar] [CrossRef] [PubMed]
- Zolfaghari, S.; Paydayesh, A.; Jafari, M. Mechanical and thermal properties of polypropylene/silica aerogel composites. J. Macromol. Sci. Part B 2019, 58, 305–316. [Google Scholar] [CrossRef]
- Chen, Y.; Klima, K.; Brouwers, H.; Yu, Q. Effect of silica aerogel on thermal insulation and acoustic absorption of geopolymer foam composites: The role of aerogel particle size. Compos. Part B Eng. 2022, 242, 110048. [Google Scholar] [CrossRef]
- Tang, R.; Hong, W.; Srinivasakannan, C.; Liu, X.; Wang, X.; Duan, X. A novel mesoporous Fe-silica aerogel composite with phenomenal adsorption capacity for malachite green. Sep. Purif. Technol. 2022, 281, 119950. [Google Scholar] [CrossRef]
- Yi, Z.; Zhang, X.; Yan, L.; Huyan, X.; Zhang, T.; Liu, S.; Guo, A.; Liu, J.; Hou, F. Super-insulated, flexible, and high resilient mullite fiber reinforced silica aerogel composites by interfacial modification with nanoscale mullite whisker. Compos. Part B Eng. 2022, 230, 109549. [Google Scholar] [CrossRef]
- Ahmed, S.S.A.M. A Sustainable Approach to Reduce Environmental Threats of Oxidative Degradation of Plastic Films. Ph.D. Thesis, Sudan University of Science & Technology, Khartoum, Sudan, 2021. [Google Scholar]
- Van de Voorde, B.; Katalagarianakis, A.; Huysman, S.; Toncheva, A.; Raquez, J.-M.; Duretek, I.; Holzer, C.; Cardon, L.; Bernaerts, K.V.; van Hemelrijck, D. Effect of extrusion and fused filament fabrication processing parameters of recycled poly (ethylene terephthalate) on the crystallinity and mechanical properties. Addit. Manuf. 2022, 50, 102518. [Google Scholar] [CrossRef]
- Yeasmin, S.; Yeum, J.H.; Yang, S.B. Fabrication and characterization of pullulan-based nanocomposites reinforced with montmorillonite and tempo cellulose nanofibril. Carbohydr. Polym. 2020, 240, 116307. [Google Scholar] [CrossRef]
- Oh, S.; Shin, C.; Kwak, D.; Kim, E.; Kim, J.; Bae, C.; Kim, T. Effect of ionic strength on amorphous carbon during chemical mechanical planarization. Diam. Relat. Mater. 2022, 127, 109124. [Google Scholar] [CrossRef]
- Alghdeir, M.; Mayya, K.; Dib, M. Nanosilica Composite for Greenhouse Application. In Composite and Nanocomposite Materials-From Knowledge to Industrial Applications; IntechOpen: London, UK, 2020. [Google Scholar]
- Gaabour, L.H. Influence of silica nanoparticles incorporated with chitosan/polyacrylamide polymer nanocomposites. J. Mater. Res. Technol. 2019, 8, 2157–2163. [Google Scholar] [CrossRef]
- Bokobza, L. Infrared Linear Dichroism for the Analysis of Molecular Orientation in Polymers and in Polymer Composites. Polymers 2022, 14, 1257. [Google Scholar] [CrossRef]
- An, Z.; Wang, H.; Zhu, C.; Cao, H.; Xue, J. Synthesis and formation mechanism of porous silicon carbide stacked by nanoparticles from precipitated silica/glucose composites. J. Mater. Sci. 2019, 54, 2787–2795. [Google Scholar] [CrossRef]
- Phothisarattana, D.; Harnkarnsujarit, N. Characterizations of Cassava Starch and Poly (butylene adipate-co-terephthalate) Blown Film with Silicon Dioxide Nanocomposites. Int. J. Food Sci. Technol. 2022, 57, 5078–5089. [Google Scholar] [CrossRef]
- Liu, X.; Zou, L.; Chang, B.; Shi, H.; Yang, Q.; Cheng, K.; Li, T.; Schneider, K.; Heinrich, G.; Liu, C. Strain dependent crystallization of isotactic polypropylene during solid-state stretching. Polym. Test. 2021, 104, 107404. [Google Scholar] [CrossRef]
- Ahmed, W.; Siraj, S.; Al-Marzouqi, A.H. Comprehensive characterization of polymeric composites reinforced with silica microparticles using leftover materials of fused filament fabrication 3D printing. Polymers 2021, 13, 2423. [Google Scholar] [CrossRef] [PubMed]
- Botta, L.; Teresi, R.; Titone, V.; Salvaggio, G.; La Mantia, F.P.; Lopresti, F. Use of biochar as filler for biocomposite blown films: Structure-processing-properties relationships. Polymers 2021, 13, 3953. [Google Scholar] [CrossRef]
- Chavan, C.; Bhajantri, R.F.; Cyriac, V.; Bulla, S.; Ravikumar, H.; Raghavendra, M.; Sakthipandi, K. Exploration of free volume behavior and ionic conductivity of PVA: x (x = 0, Y2O3, ZrO2, YSZ) ion-oxide conducting polymer ceramic composites. J. Non Cryst. Solids 2022, 590, 121696. [Google Scholar] [CrossRef]
- Lin, B.; Li, C.; Chen, F.; Liu, C. Continuous Blown Film Preparation of High Starch Content Composite Films with High Ultraviolet Aging Resistance and Excellent Mechanical Properties. Polymers 2021, 13, 3813. [Google Scholar] [CrossRef]
- Muñoz, P.; de Oliveira, C.; Amurin, L.; Rodriguez, C.; Nagaoka, D.; Tavares, M.; Domingues, S.; Andrade, R.; Fechine, G. Novel improvement in processing of polymer nanocomposite based on 2D materials as fillers. Express Polym. Lett. 2018, 12, 930–945. [Google Scholar] [CrossRef]
- Gigante, V.; Aliotta, L.; Coltelli, M.B.; Cinelli, P.; Botta, L.; La Mantia, F.P.; Lazzeri, A. Fracture behavior and mechanical, thermal, and rheological properties of biodegradable films extruded by flat die and calender. J. Polym. Sci. 2020, 58, 3264–3282. [Google Scholar] [CrossRef]
- Wang, X.; Pan, H.; Jia, S.; Wang, Z.; Tian, H.; Han, L.; Zhang, H. In-situ reaction compatibilization modification of poly (butylene succinate-co-terephthalate)/polylactide acid blend films by multifunctional epoxy compound. Int. J. Biol. Macromol. 2022, 213, 934–943. [Google Scholar] [CrossRef]
- Cho, S.H. Role of Tie Molecules in Ductility and Chain Deformation of Polyethylene. Ph.D. Thesis, Princeton University, Princeton, NJ, USA, 2022. [Google Scholar]
- Karami, S.; Ahmadi, Z.; Nazockdast, H.; Rabolt, J.F.; Noda, I.; Chase, B.D. The effect of well-dispersed nanoclay on isothermal and non-isothermal crystallization kinetics of PHB/LDPE blends. Mater. Res. Express 2018, 5, 015316. [Google Scholar] [CrossRef]
- Li, T.; Sun, H.; Lei, F.; Li, D.; Leng, J.; Chen, L.; Huang, Y.; Sun, D. High performance linear low density polyethylene nanocomposites reinforced by two-dimensional layered nanomaterials. Polymer 2019, 172, 142–151. [Google Scholar] [CrossRef]
- Wang, Z.-Q.; Zhang, Y.-F.; Li, Y.; Zhong, J.-R. Effect of sodium lignosulfonate/nano calcium carbonate composite filler on properties of isotactic polypropylene. Polym. Bull. 2022, 29, 1–15. [Google Scholar] [CrossRef]
- Troisi, E.; van Drongelen, M.; Caelers, H.; Portale, G.; Peters, G. Structure evolution during film blowing: An experimental study using in-situ small angle X-ray scattering. Eur. Polym. J. 2016, 74, 190–208. [Google Scholar] [CrossRef] [Green Version]


| a. | |||||||
| Name | Quantity (g) Used for Blown Film Preparation | Grade | Melt Flow Index | Density | Melting Point (°C) | Haze (%) | Gloss (GU) |
| LDPE | 15,000 | LDPE 150E | 0.25 g/10 min | 0.921 g/cm3 | 96 | - | - |
| LLDPE | 35,000 | CEFOR 1221P | 2.0 g/10 min | 0.918 g/cm3 | 116 | 0.56 | 151 |
| b. | |||||||
| Particle Size | Pore Diameter | BULK DENSITY | Surface Chemistry | BET(Brunauer–Emmett–Teller) Surface Area | Porosity | Heavy Metal | |
| 20–30 μm | 20–30 μm | 100 kg/m2 | Hydrophobic | 500 m2/g | Less than 90% | N/A | |
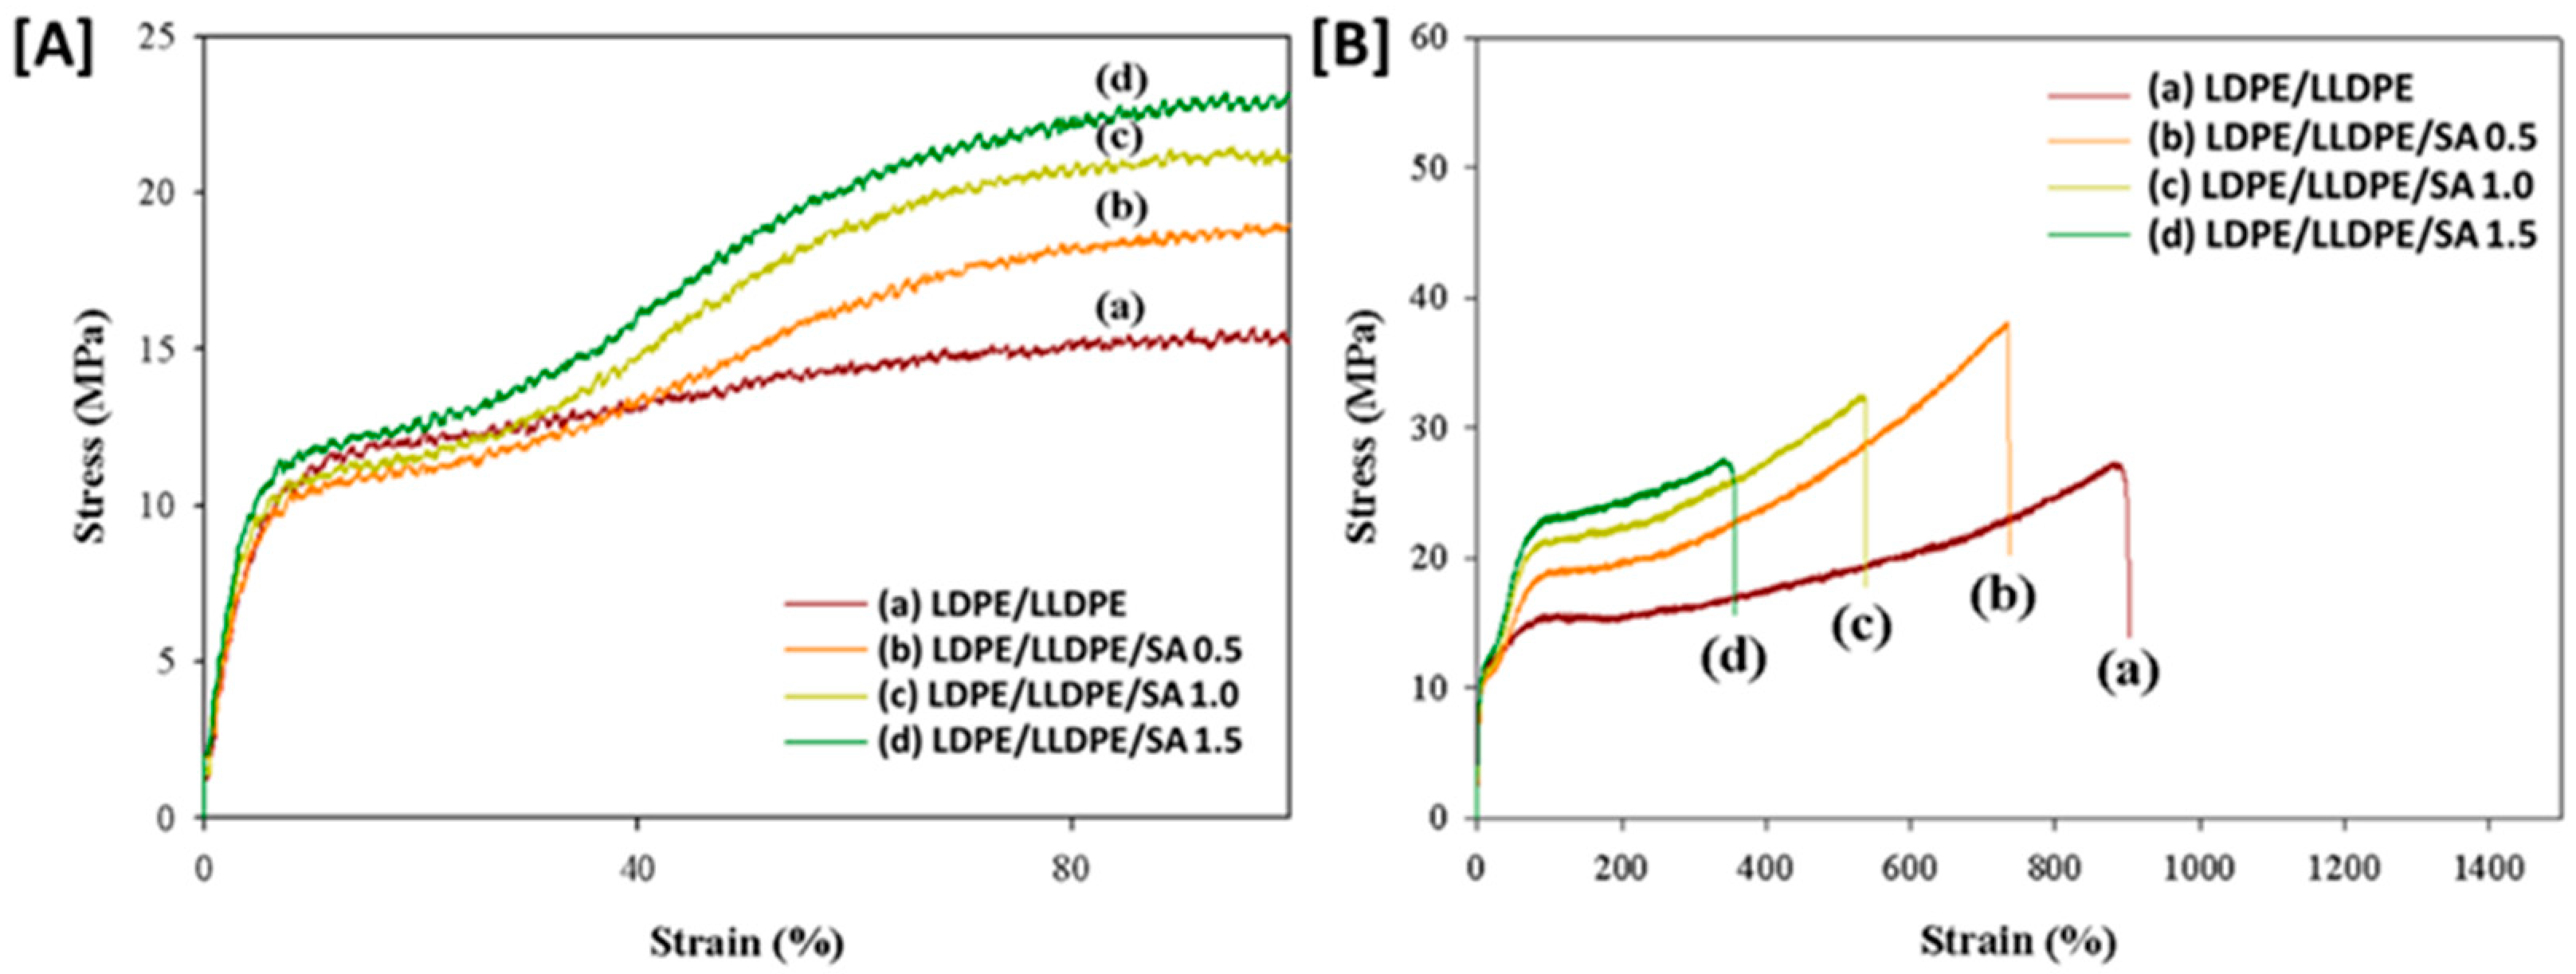
| Specimen | Thickness (µm) | Yield Strain (%) | Yield Stress (MPa) | Stress at Break (MPa) | Strain at Break (%) | Young Modulus (MPa) |
|---|---|---|---|---|---|---|
| LDPE/LLDPE | 20 ± 10 | 8.04 | 10.75 | 27.56 | 882.18 | 139.55 |
| LDPE/LLDPE/SA 0.5 wt.% | 20 ± 11 | 6.34 | 9.92 | 37.96 | 742.53 | 152.44 |
| LDPE/LLDPE/SA 1 wt.% | 20.8 ± 12 | 6.60 | 10.40 | 32.32 | 526.72 | 198.55 |
| LDPE/LLDPE/SA 1.5 wt.% | 21.5 ± 13 | 7.13 | 11.49 | 27.73 | 349.014 | 222.01 |
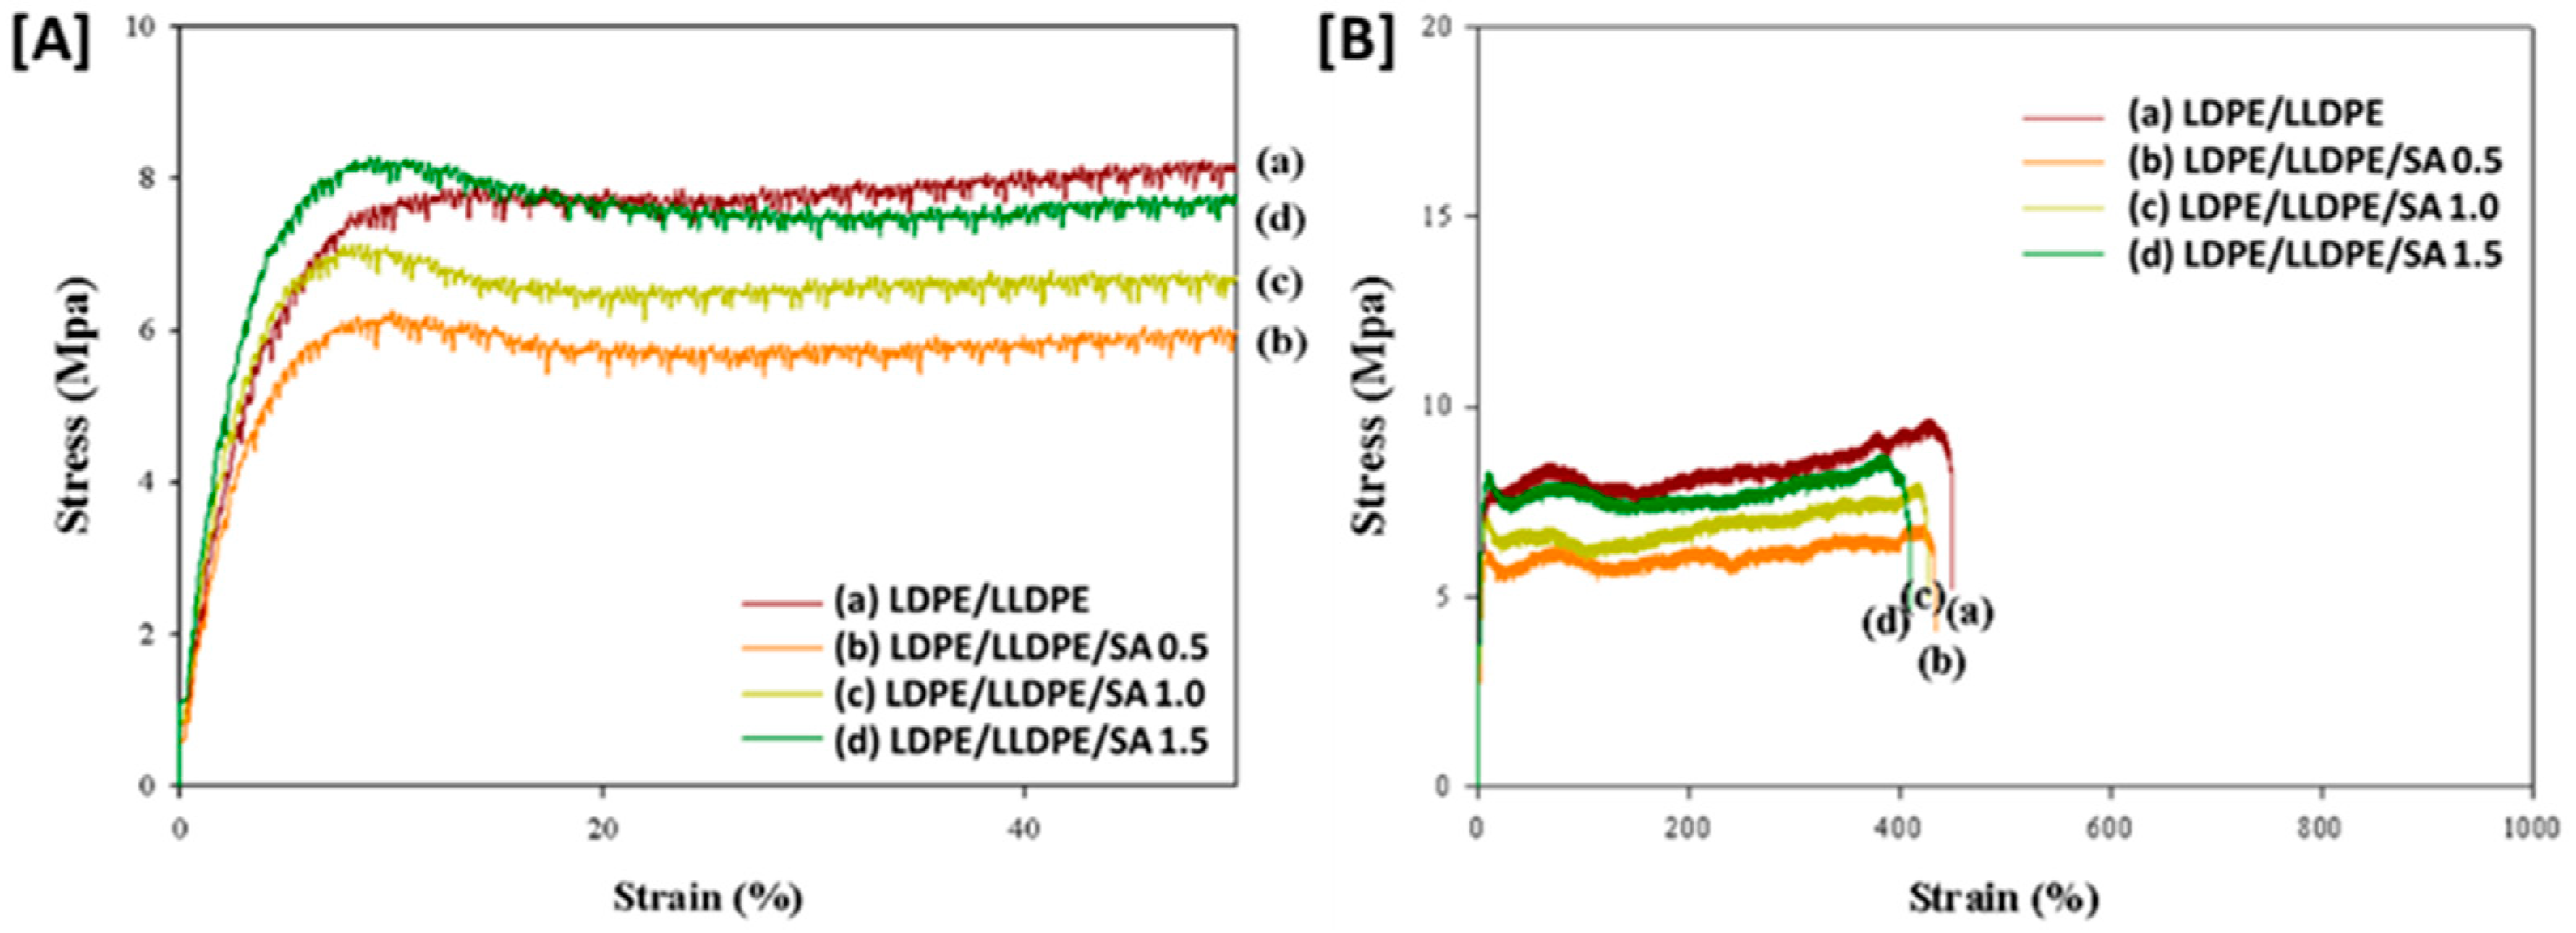
| Specimen | Thickness (µm) | Yield Strain (%) | Yield Stress (MPa) | Stress at Break (MPa) | Strain at Break (%) | Young Modulus (MPa) |
|---|---|---|---|---|---|---|
| LDPE/LLDPE | 20 ± 10 | 10.42 | 7.75 | 8.61 | 448.202 | 64.84 |
| LDPE/LLDPE/SA 0.5 wt.% | 20 ± 11 | 7.77 | 6.11 | 6.31 | 430.64 | 66.13 |
| LDPE/LLDPE/SA 1 wt.% | 20.8 ± 12 | 7.80 | 7.10 | 7.88 | 417.76 | 88.98 |
| LDPE/LLDPE/SA 1.5 wt.% | 21.5 ±13 | 8.28 | 8.25 | 8.05 | 403.52 | 94.93 |
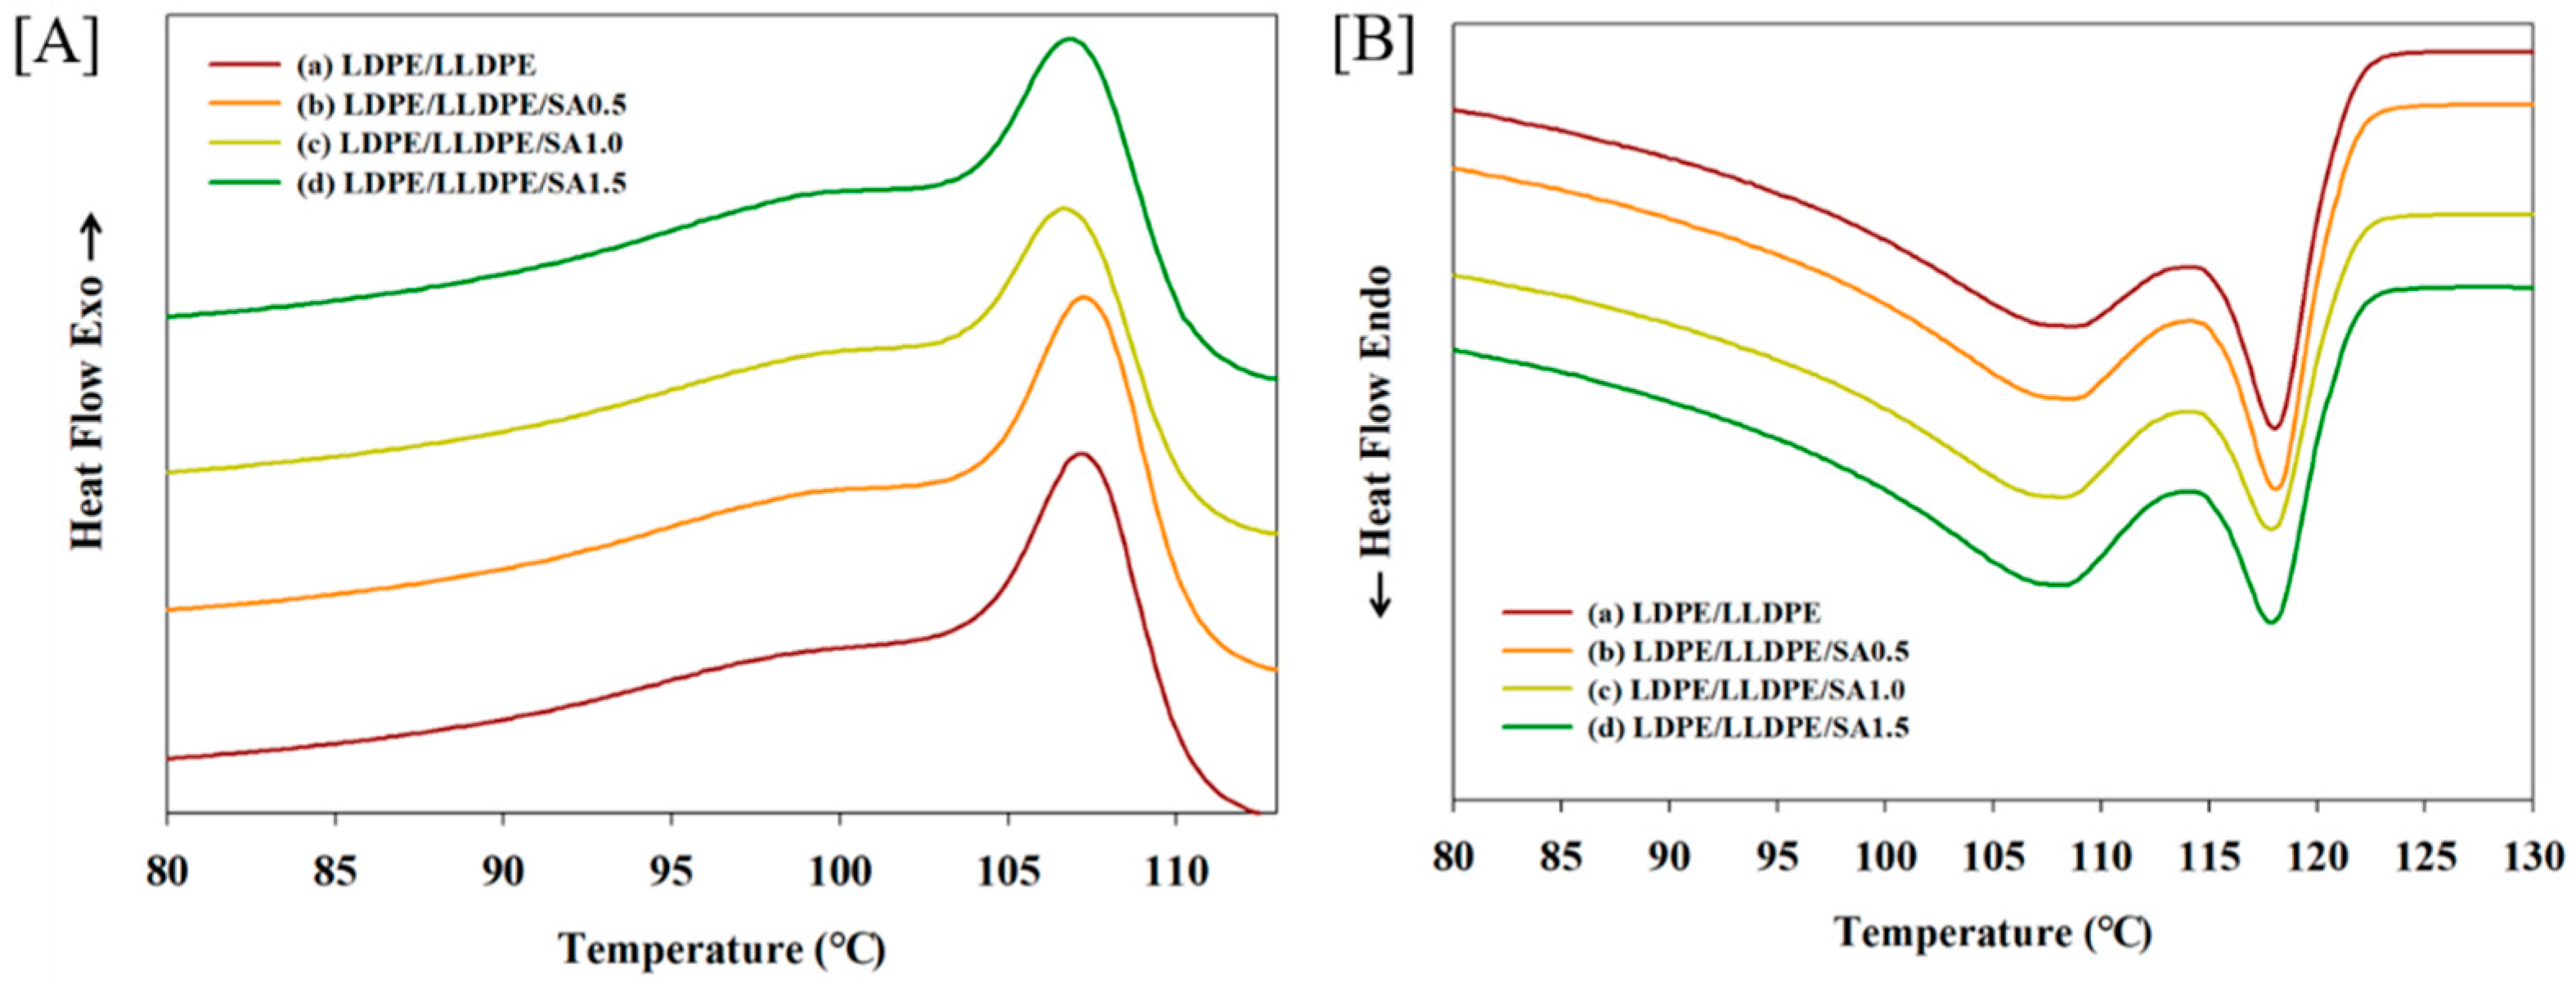
| Sample Type | Tonset (°C) | Tendset (°C) | Tpeak (°C) | ∆T (°C) | Tm1 (°C) | Tm2 (°C) | ∆Hc (J/g) | Xc (%) |
|---|---|---|---|---|---|---|---|---|
| LDPE/LLDPE | 110.48 | 63.87 | 107.21 | 3.27 | 108.58 | 118.05 | 95.75 | 32.67 |
| LDPE/LLDPE/SA(0.5) | 110.55 | 63.90 | 107.25 | 3.3 | 108.54 | 118.02 | 97.03 | 33.11 |
| LDPE/LLDPE/SA(1.0) | 110.38 | 63.42 | 106.74 | 3.64 | 108.19 | 117.86 | 94.26 | 32.17 |
| LDPE/LLDPE/SA(1.5) | 110.51 | 63.75 | 106.91 | 3.6 | 108.03 | 117.86 | 94.02 | 32.02 |
Publisher’s Note: MDPI stays neutral with regard to jurisdictional claims in published maps and institutional affiliations. |
© 2022 by the authors. Licensee MDPI, Basel, Switzerland. This article is an open access article distributed under the terms and conditions of the Creative Commons Attribution (CC BY) license (https://creativecommons.org/licenses/by/4.0/).
Share and Cite
Yang, S.B.; Lee, J.; Yeasmin, S.; Park, J.M.; Han, M.D.; Kwon, D.-J.; Yeum, J.H. Blown Composite Films of Low-Density/Linear-Low-Density Polyethylene and Silica Aerogel for Transparent Heat Retention Films and Influence of Silica Aerogel on Biaxial Properties. Materials 2022, 15, 5314. https://doi.org/10.3390/ma15155314
Yang SB, Lee J, Yeasmin S, Park JM, Han MD, Kwon D-J, Yeum JH. Blown Composite Films of Low-Density/Linear-Low-Density Polyethylene and Silica Aerogel for Transparent Heat Retention Films and Influence of Silica Aerogel on Biaxial Properties. Materials. 2022; 15(15):5314. https://doi.org/10.3390/ma15155314
Chicago/Turabian StyleYang, Seong Baek, Jungeon Lee, Sabina Yeasmin, Jae Min Park, Myung Dong Han, Dong-Jun Kwon, and Jeong Hyun Yeum. 2022. "Blown Composite Films of Low-Density/Linear-Low-Density Polyethylene and Silica Aerogel for Transparent Heat Retention Films and Influence of Silica Aerogel on Biaxial Properties" Materials 15, no. 15: 5314. https://doi.org/10.3390/ma15155314
APA StyleYang, S. B., Lee, J., Yeasmin, S., Park, J. M., Han, M. D., Kwon, D.-J., & Yeum, J. H. (2022). Blown Composite Films of Low-Density/Linear-Low-Density Polyethylene and Silica Aerogel for Transparent Heat Retention Films and Influence of Silica Aerogel on Biaxial Properties. Materials, 15(15), 5314. https://doi.org/10.3390/ma15155314