Article

The Effect of ECAP Processing Conditions on Microstructural Evolution and Mechanical Properties of Pure Magnesium—Experimental, Mathematical Empirical and Response Surface Approach

by
Abdulrahman I. Alateyah
1,
Waleed H. El-Garaihy
1,2,*,
Majed O. Alawad
3,*,
Samar El Sanabary
4,
Sally Elkatatny
2,
Hany A. Dahish
5,6 and
Hanan Kouta
4
1
Department of Mechanical Engineering, College of Engineering, Qassim University, Unaizah 56452, Saudi Arabia
2
Mechanical Engineering Department, Faculty of Engineering, Suez Canal University, Ismailia 41522, Egypt
3
Materials Science Research Institute, King Abdulaziz City for Science and Technology (KACST), Riyadh 12354, Saudi Arabia
4
Department of Production Engineering and Mechanical Design, Port Said University, Port Fuad 42526, Egypt
5
Department of Civil Engineering, College of Engineering, Qassim University, Unaizah 56452, Saudi Arabia
6
Civil Engineering Department, Faculty of Engineering, Fayoum University, Fayoum 63514, Egypt
*
Authors to whom correspondence should be addressed.
Materials 2022, 15(15), 5312; https://doi.org/10.3390/ma15155312
Submission received: 19 June 2022 / Revised: 11 July 2022 / Accepted: 27 July 2022 / Published: 2 August 2022
(This article belongs to the Special Issue Properties and Characterizations of Mg Alloys)

Abstract

:
In this study, a quantitative evaluation approach was used to investigate how certain ECAP processing parameters affect the microstructural evolution, Vicker’s microhardness values and tensile properties of pure Mg. The ECAP processing parameters were number of passes, ECAP die channel angle and processing route type. The response surface methodology (RSM) technique was used to design 16 runs of the experiment using Stat-Ease design expert software. Billets of pure Mg were processed up to four passes of routes Bc, A and C at 225 °C. Two ECAP dies were used with internal channel angles of 90° and 120°. Experimental findings were used to establish empirical models to assess the influence of the ECAP processing parameters on grain size and mechanical properties of ECAPed billets. The established relationships were examined and validated for their adequacy and significance using ANOVA as well as several statistical criteria. Response surface plots and contour graphs were established to offer better understanding of the intended relationships. In addition, the optimum processing parameters for grain size, hardness values and tensile properties were defined. Both experimental results and the theoretical model revealed that route Bc is the most effective route in grain refining. The experimental findings showed that four passes of route Bc through the die channel angle 90° revealed a significant reduction in the grain size by 86% compared to the as-annealed counterparts. Similar to the grain size refining, four-passes processing through the ECAP die with an internal channel angle of 90° leads to improved Vicker’s microhardness values. Additionally, four passes of route Bc using the 90° die angle recorded a significant HV increase at the edge and central areas by 112% and 78%, respectively, compared to the as-annealed counterpart. On the other hand, according to the optimization findings, two passes of route Bc using a die angle of 120° resulted in the best ultimate tensile strength for pure Mg, whereas four passes of route Bc revealed the optimum ductility at fracture.

1. Introduction

Magnesium (Mg) and its alloys are widely considered ultra-light alloys due to their superior strength to weight ratio. Their densities are two thirds, and one quarter, respectively, of that of aluminum alloys and steel [1,2,3]. Mg alloys display unique properties, such as high specific stiffness, good recyclability and excellent specific strength, which increase the demand for them in transportation industries [4,5,6,7,8,9]. Furthermore, the usage of Mg alloys in automotive is an effective means of reducing carbon dioxide emissions and fuel usage. Mg alloys’ high specific strength results in decreased car weights; reducing a car’s weight by 10%, for example, results in saving 5–10% fuel [10]. However, the most significant disadvantage of employing Mg alloys is their low formability. This consequently diminishes their performance in automobile applications.
The available deformation modes of Mg alloys are restricted due to the nature of the Mg crystal’s hexagonal close-packed (HCP) structure [11]. Namely, the significant discrepancy in resolved shear stresses between the slip systems decreases the deformability of Mg alloys [5,12,13,14]. Therefore, Mg alloys fracture when subjected to traditional deformation methods, such as extrusion and rolling at room temperature [15]. However, Mg alloys’ deformability increases at higher temperatures. The drawback to hot working is that the dynamic recrystallization and recovery processes associated with it mitigate the effects of deformation hardening [16,17,18]. Several fruitful efforts have been made to develop Mg alloys with useful strength–ductility combinations [19,20] and with better corrosion resistance [20,21]. These attempts to improve Mg alloys’ formability showed that controlling the texture using plastic deformation techniques is a well-suited approach to formability enhancement.
Severe plastic deformation (SPD) techniques have great potential for ambient temperature deformation of Mg alloys [22,23]. SPD includes several techniques applicable to a wide range of materials; one such technique is equal channel angular pressing (ECAP) [24,25,26,27]. ECAP possesses several desirable features: its ability to produce ultra-fine-grain (UFG) structures, its capability to fabricate nanostructures efficiently and its applicability to industry [28,29,30,31].
Several studies have been investigated to study the ECAP process parameters and their impact on deformation behavior as the mechanical and microstructural characteristics depend on the degree of plastic deformation. The equivalent strain ( ε e q ) can be theoretically modeled as a function of the die geometry using Equation (1) [31,32]. The strain is affected by the internal channel angle (ϕ), the outer corner angle (Ψ) and number of passes (N).
ε e q = N 3   [ 2   c o t ( φ + Ψ 2 ) + Ψ   c o s e c ( φ + Ψ 2 ) ]
Furthermore, the ECAP strain is affected by whether the processed material billets were rotated along its longitudinal axis between passes or not. Different combinations of billet rotations define the ECAP routes. The common ECAP routes are route A, Bc and C. Figure 1 presents the differences among the different ECAP routes. In route A, the rod is not rotated. The rod in route Bc is rotated by 90° between passes. Finally, in route C, the billet is rotated by 180° between subsequent passes [33]. ECAP processing using multiple passes and different routes produces the most grain refinement but also results in significant changes in the shear plane over the entire process [34].
Previous research shows that the compressive mechanical properties of pure Mg deteriorated after the second ECAP pass at room temperature using route Bc and ϕ = 90°. This reduction is explained by the activation of the non-basal slipping systems, and by the newly formed texture. However, the mechanical properties improved after the fourth pass due to grain refinement [35]. In addition, Venkatachalam et al. [36] applied the ECAP process to the AA2014 aluminum alloy. The mechanical properties were substantially enhanced by processing using route Bc compared to processing via other routes A, C and Ba as the effective strain was homogenized among all the planes. A.I. Alateyah et al. [37] studied the effect of different internal channel angle on the strain homogeneity, microstructural evolution, crystallographic texture and mechanical properties of pure magnesium. The study was conducted experimentally using ϕ = 90° and 120° on samples processed for four passes through route Bc at 225°. A numerical finite element analysis approach was conducted using Simufact-forming software. FE simulation showed that the ϕ = 90 sample had a more homogenous distribution of stress compared to the 120° one. In addition, investigation of the microstructural evolution and mechanical properties revealed that the ϕ = 90° sample showed stronger texture and a higher ultimate strength than the 120° one.
Previous research inquiries optimized ECAP analysis using response surface methodology (RSM). RSM is an empirical set of mathematical and statistical tools that can be used to build, modify and optimize the processes. RSM combines real and modelled responses’ efficiency behavior with a set of effective parameters based on their individual and interactive effects. The RSM is optimized using a genetic algorithm (GA) that avoids localized optimum point uncertainty [38].
Daryadel [39] simulated the ECAP process on the 7075 aluminum alloy with copper casing using the finite element method. RSM was used to design 31 experiments to investigate the effect of four processing (explanatory) parameters on the maximum required force and strain. The simulated results were verified by comparing the experimental and simulation maximum force. On the maximum required force and strain, the effects of four ECAP parameters (channel angle, corner angle, friction coefficient and casing thickness) were investigated. The regression models for computing the maximal forming force and strain are illustrated using analysis of variance (ANOVA). The author concluded that channel angle affects resultant force the most. Similarly, the strain was affected by channel and corner angle, and the friction coefficient and the thickness of copper on strain had no significant effect. Finally, the predicted optimal ECAP conditions for reducing the maximum forming force and increasing the strain were 93.64°, 0°, 0.001 and 1.62 mm for channel angle, corner angle, friction coefficient and casing thickness, respectively. Abbas et.al. [40] investigated the machining processes of recycled billets Al6061 chip. The billets underwent a three-step process: cold compact, hot extrusion and, finally, ECAP to improve the mechanical properties. Surface roughness and metal removal rate were measured as performance characteristics against various cutting parameters and the number of ECAP passes. The authors concluded that feed was the most influential parameter on the generated surface. Optimum values of MRR and generated surface roughness were obtained using a desirability function approach. The minimum values of surface roughness and maximum MRR were obtained at a cutting velocity of 195 m/min, a feed of 0.073 mm/rev, a depth of cut of 0.4 mm and three passes of ECAP process.
Under RSM, central composite design (CCD) is used for modelling and optimization. To optimize the response performance of any process without localized uncertain optimum point confusion, CCD, desirability function (DF) and GA can be used [38]. Many studies have used GA and hybrid RSM-GA to optimize the process condition. Deshwal et al. [41] investigated the tensile strength of a PLA-fabricated part produced by fused deposition modeling (FDM)—a powerful 3D printing technique—using a statistical technique equipped with numerous hybrid static tools. The contribution of each of the FDM parameters (infill density, temperature and speed) on the maximum performance tensile strength was investigated. To optimize FDM process parameters, hybrid optimization approaches, such as genetic algorithm-artificial neural network (GA-ANN), genetic algorithm-response surface methodology (GA-RSM) and genetic algorithm-adaptive neuro fuzzy interface system (GA-ANFIS), are used. The author concluded that the percentage accuracies of GA-ANN, GA-RSM and GA-ANFIS are 99.89%, 99.3% and 99.55%, respectively. Moreover, the maximum tensile strength of PLA obtained by GA-ANN was 47.0212 MPa, and the optimal conditions were infill density 100 %, temperature 210°C and speed 124.778 mm/s.
A limited number of studies examining ECAP performance numerically were found. However, the experimental studies investigating the effect of ECAP process on pure Mg are limited due to its poor deformability, and mostly focus on ECAP of Mg alloys at ϕ of ≤90°. Therefore, the present study investigates the ECAP conditions necessary for optimum performance characteristics. These characteristics are grain size (GR), hardness measurement at two positions of specimen: center (HC) and edge (HE), and tensile characteristics, namely ultimate tensile strength (σu) and ductility (D). In addition, an experimental investigation is conducted on pure Mg under various ECAP conditions, such as number of passes (N), ECAP die angle (ϕ) and the type of processing route. A complete analysis of ECAP’s effect on microstructural evolution and mechanical properties was considered. The research’s design is based on RSM, which is used to identify the optimum ECAP parameter levels by analyzing the impact of ECAP conditions on responses. A second-order regression model and analysis of variance (ANOVA) were created to analyze the ECAP condition of optimum responses. GA was applied to optimize the ECAP condition. Finally, hybrid RSM-GA was created to improve the optimization of ECAP responses, and corresponding conditions were evaluated using GA.

2. Materials and Methods

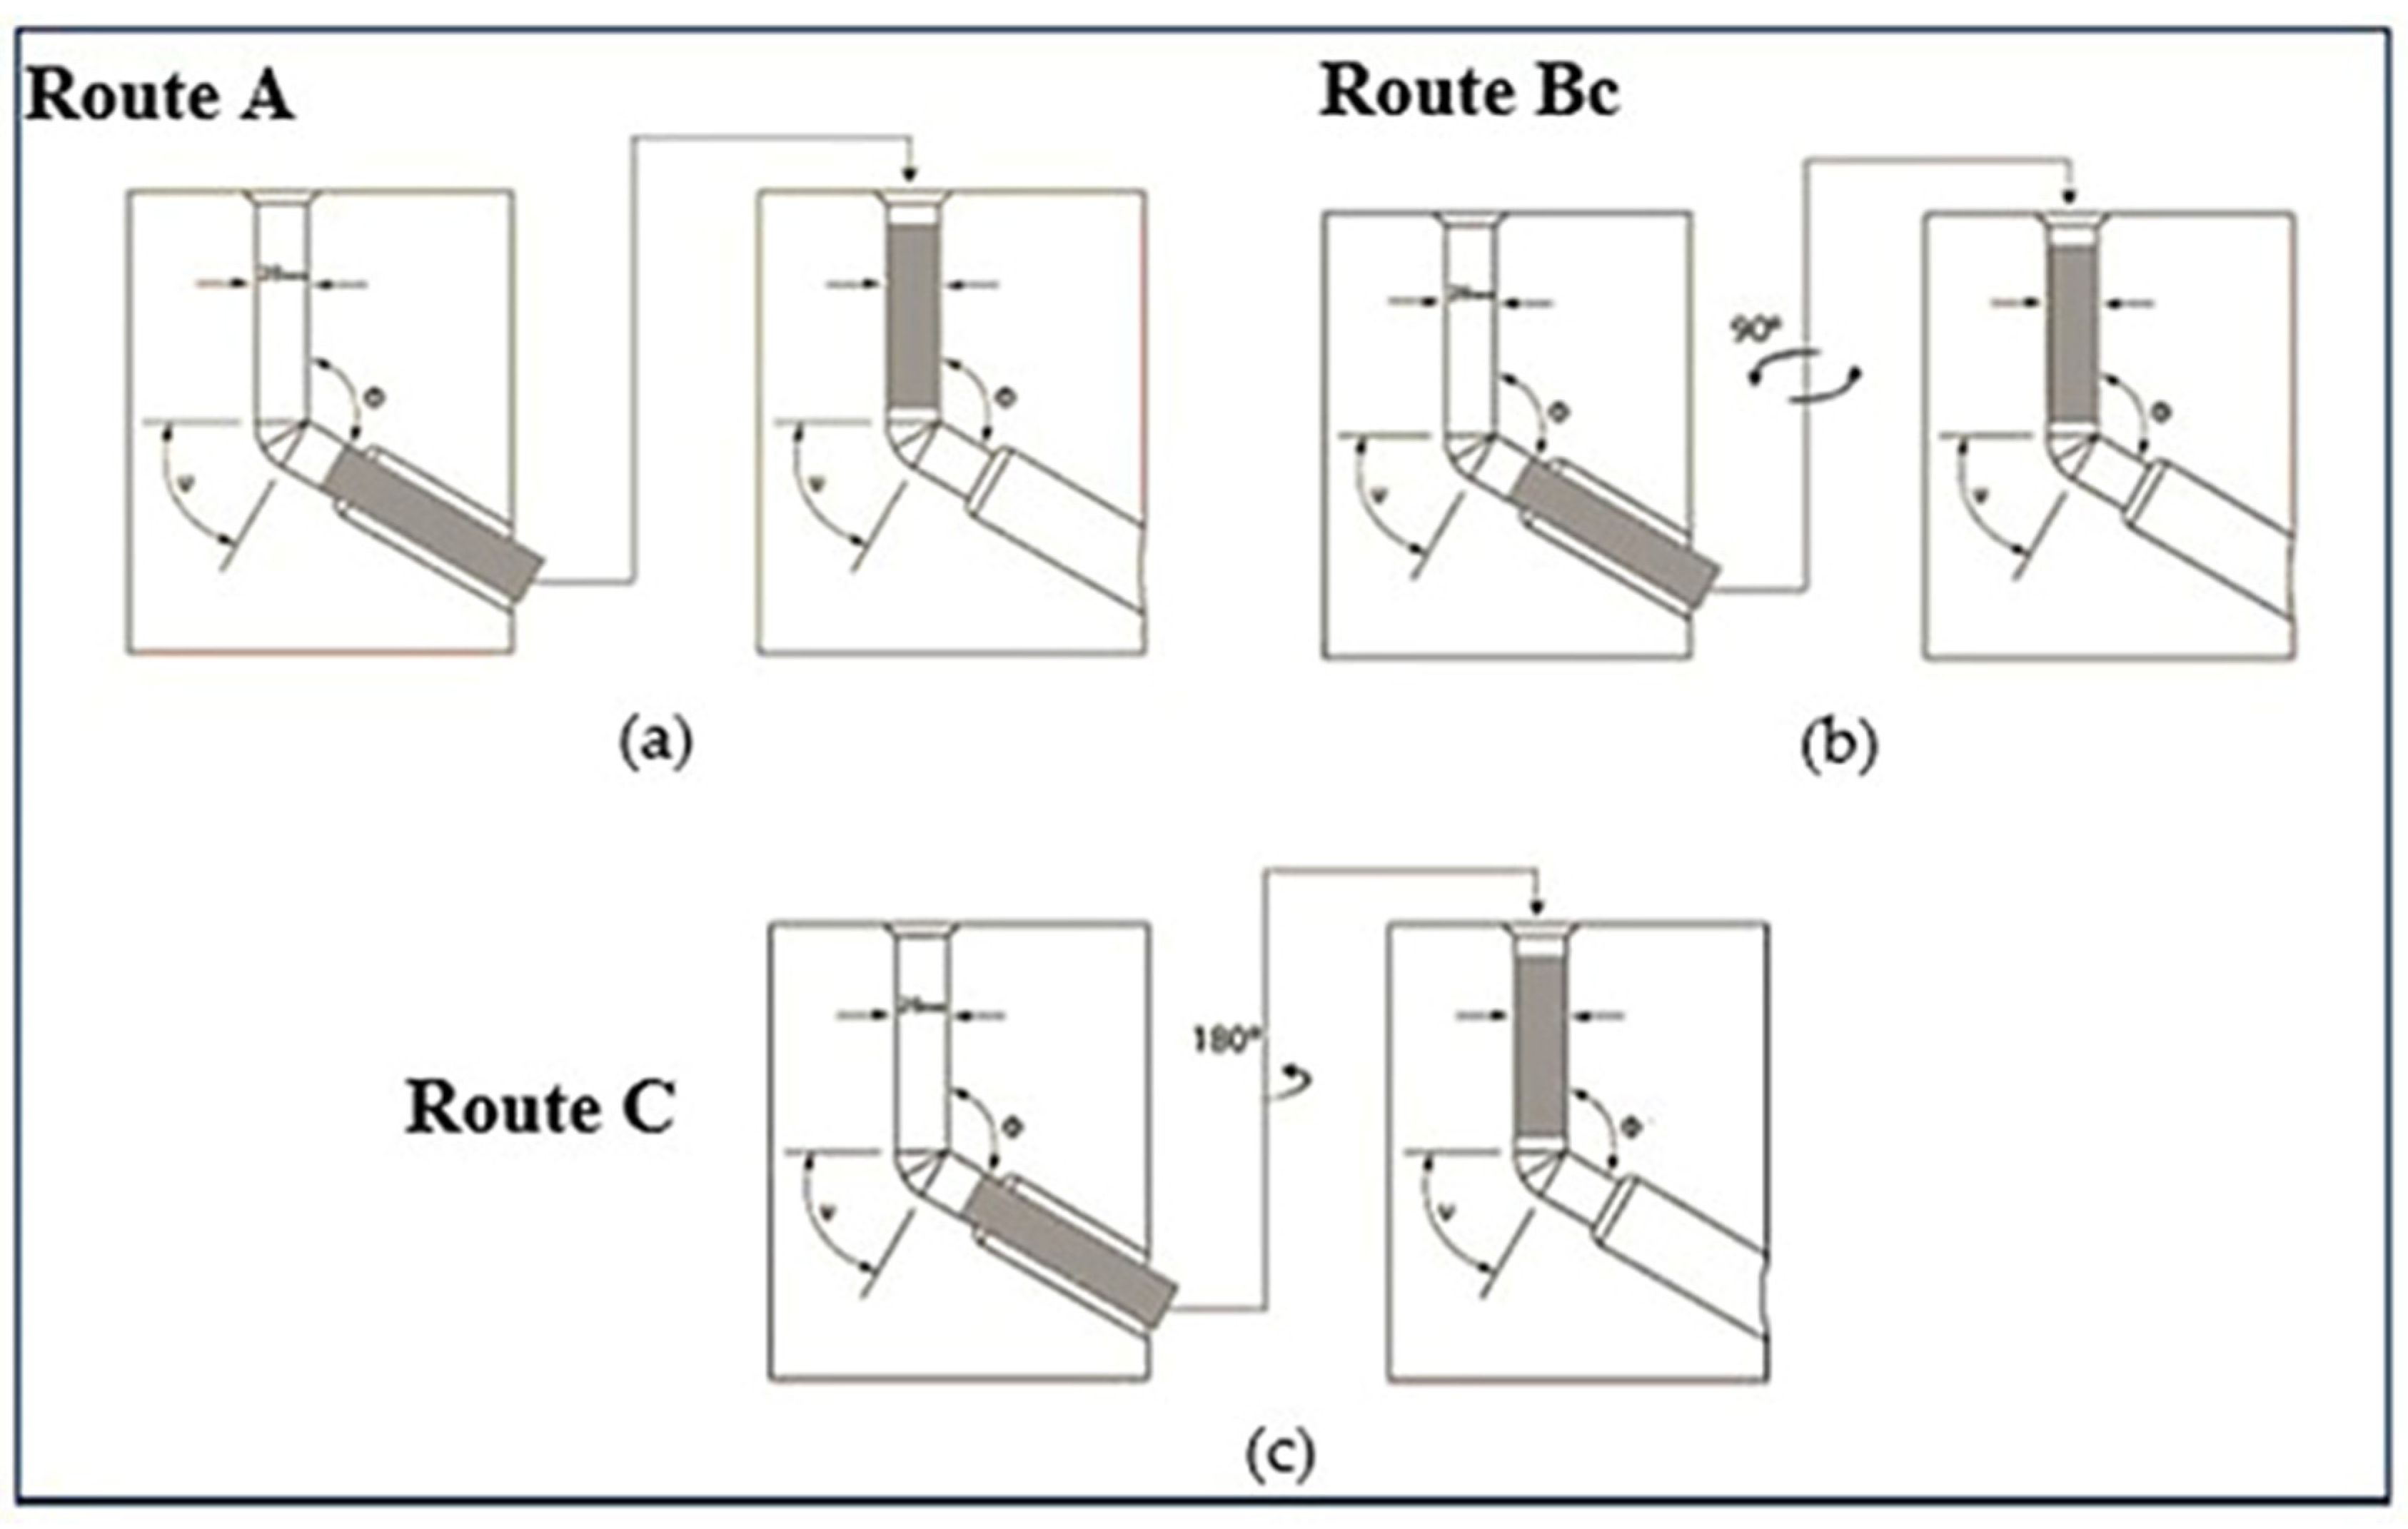
2.1. Experimental Design

In this study, the effect of 3 ECAP parameters on pure Mg’s microstructure and mechanical properties are investigated. The 3 parameters are: number of passes (N), ECAP die angle (ϕ) and the type of processing route, as shown in Table 1. In this investigation, the combinations of ECAP parameter values used were designed using response surface methodology (RSM). A total of 16 runs were carried out to investigate various ECAP responses. The explanatory variables are grain size (GR), hardness measurements at the center (HC) and edge (HE) of the specimen and tensile characteristics—namely ultimate tensile strength (σu) and ductility (D). Experimental data obtained from the microstructural evolution, Vicker’s hardness and tensile tests are shown in Table A1 in Appendix A. The RSM technique was used to analyze three factors with a small number of tests in order to model a second-order response surface. After that, the genetic algorithm is employed to figure out which fitness value is the best.

2.2. Material and Methodology

In the present study, rolled billets of pure Mg 20 mm in diameter and 60 mm in length were used. Before ECAP processing, the billets were annealed at 250 °C for 1h, followed by furnace cooling. The pure Mg billets were deformed by ECAP at 225 °C with different numbers of passes (1, 2 and 4 passes) through different routes (A, Bc and C), with 0.05 mm/s ram speed. The ECAP die consists of two channels intersecting with an outer die angle (Ψ) of 20° and with different inner angles ϕ (90° and 120°). A graphite-based lubricant was used to reduce friction between the billets and die walls. The samples after ECAP processing were centrically cut along their LS along the plane perpendicular to the die entry channel and parallel to the flow plane (pressing direction). The reference axes were labeled according to the ECAP direction: the transversal direction “X” (TD), the normal direction “Z” (ND) and “Y” (ED).
Microstructural and crystallographic texture of Mg billets after ECAP were studied using a field emission scanning electron microscope (FESEM, Hitachi, Ltd., Tokyo, Japan) that is equipped with a NordlysMax2 electron back-scatter diffraction (EBSD) detector. EBSD was performed on the top surface, the TD-ED plane, using a SU-70 SEM (Hitachi, Ltd., Tokyo, Japan) operating at 15 kV and with a typical current of 1.5 nA. The samples’ surfaces were prepared before the EBSD by grinding and mechanically polishing down to 1 µm using a tripod polisher, then polished chemically with colloidal silica (0.05 µm) for 24 h. by a BUEHLER Vibrometer (Buehler, Tucson, AZ, USA).
Mechanical characterization of the ECAPed samples was measured using the Vickers micro-hardness tester (Shimadzu HMV-FA) under a load of 1 kg for a loading time of 15 s. Additionally, tensile properties at room temperature were measured using uniaxial tensile tests conducted by a universal testing machine (Instron 4210, Norwood, MA, USA) at a strain rate of 10−3 s−1. Dimensions of tensile samples were set based on the E8M/ASTM standard. Three specimens per ECAP processing condition were tested to confirm the accuracy of the results. Tensile specimens were sectioned from the center of the ECAPed rods.

2.3. Regression Model

Response surface methodology (RSM) is a powerful tool used to formulate, model, analyze, design and improve optimization processes by a set of statistical and mathematical tools. RSM consists of three main steps. First, conducting multiple runs of the experiment technique with different ECAP process parameters values. Second, developing an appropriate interaction between ECAP response and input factors by regression modelling. Finally, optimizing to identify the contribution of each ECAP process parameter on the appropriate output ECAP response [42,43]. The regression model provides the interaction between the process response and explanatory variables by fitting them into a second-order polynomial equation [44].
Stat-Ease Design Expert software (version 13.0.5, Stat-Ease, Inc., Minneapolis, MN, USA) is a useful tool for optimizing complicated systems for scientific and industrial applications and was, therefore, used to analyze the experimental data [45,46]. The regression transformations available from Design Expert include linear, square root, natural logarithm, logarithmic with base 10, inverse square root, inverse, power, logit and arcsine square root.
In this study, ECAP parameters were classified into numeric parameters, such as N and φ, and categorical parameters, such as processing route. To transform the categorical parameters to numerical ones, dummy coding and binary coding were utilized. In many forms of estimating models, such as linear regression, dummy coding is one approach of using categorical predictor variables. It also uses only ones and zeros to transmit all of the necessary information regarding group membership. Dummy variables are the coded categories that are generated for a category variable. A combination of K-1 dummy variables is required to develop mutually exclusive and comprehensive dummy variables that represent a certain categorical variable with K groupings [47]. For categorical variables route A, route Bc and route C, the dummy variables were coded by X1 and X2, as shown by matrix in Equation (2). If X1 = 1 and X2 = 0, then the route type is A; if X1 = 0 and X2 = 1, then the route type is Bc and if X1 = 0 and X2 = 1, then the route type is C.
  X 1 X 2 A B c C = [ 1 0 0 1 0 0 ]
Many trails of regression transformation from and interaction between independent variables were examined in order to model the output responses of ECAP. The best regression coefficient (R2) indicates that the models generated in the experimental research are statistically significant.

2.4. Genetic Algorithm (GA)

Genetic algorithms (GA) have been used in science and engineering as an intelligent and efficient method for addressing real-world optimization problems in a cost-effective approach. In each individual, the genetic algorithm generates an optimization algorithm and a random number of generations, whereas conventional algorithms generate only a single point and use a deterministic rule to determine the next generation. Every individual’s fitness function is assessed in each generation. The GA uses criteria to determine a global minimum value for a fitness function and ensures that the result converges [43,48].

3. Results and Discussion

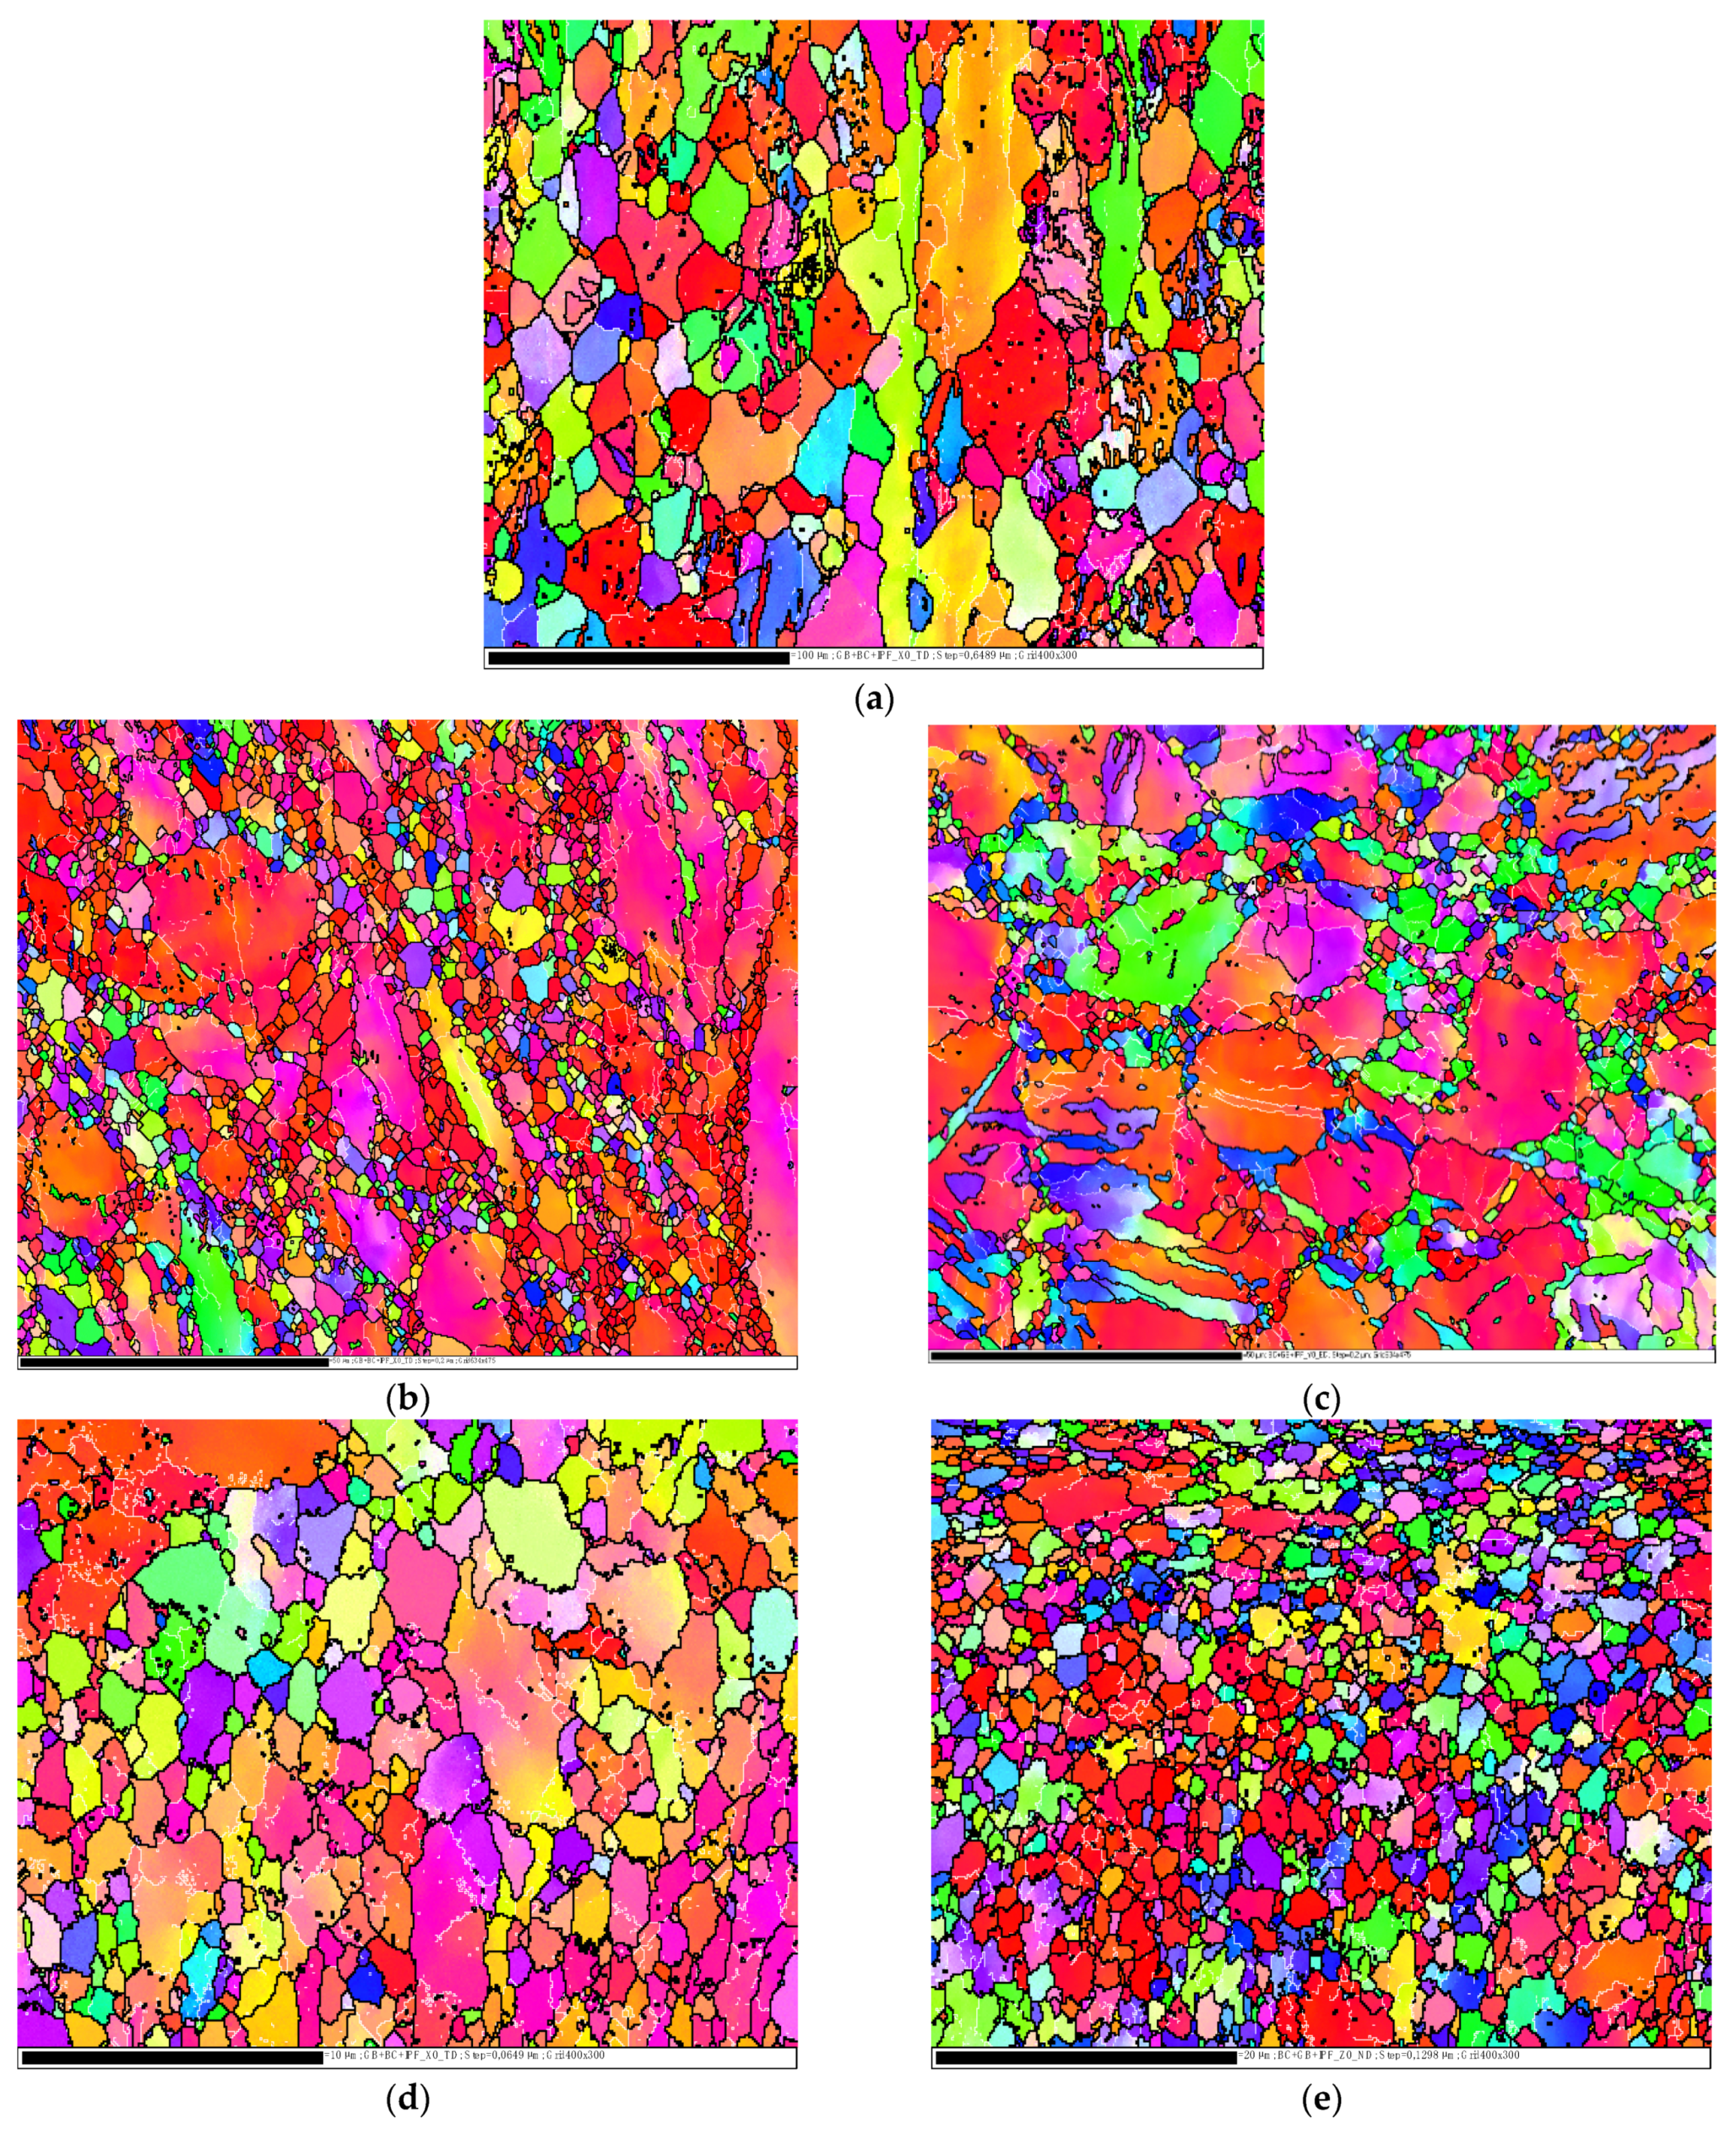
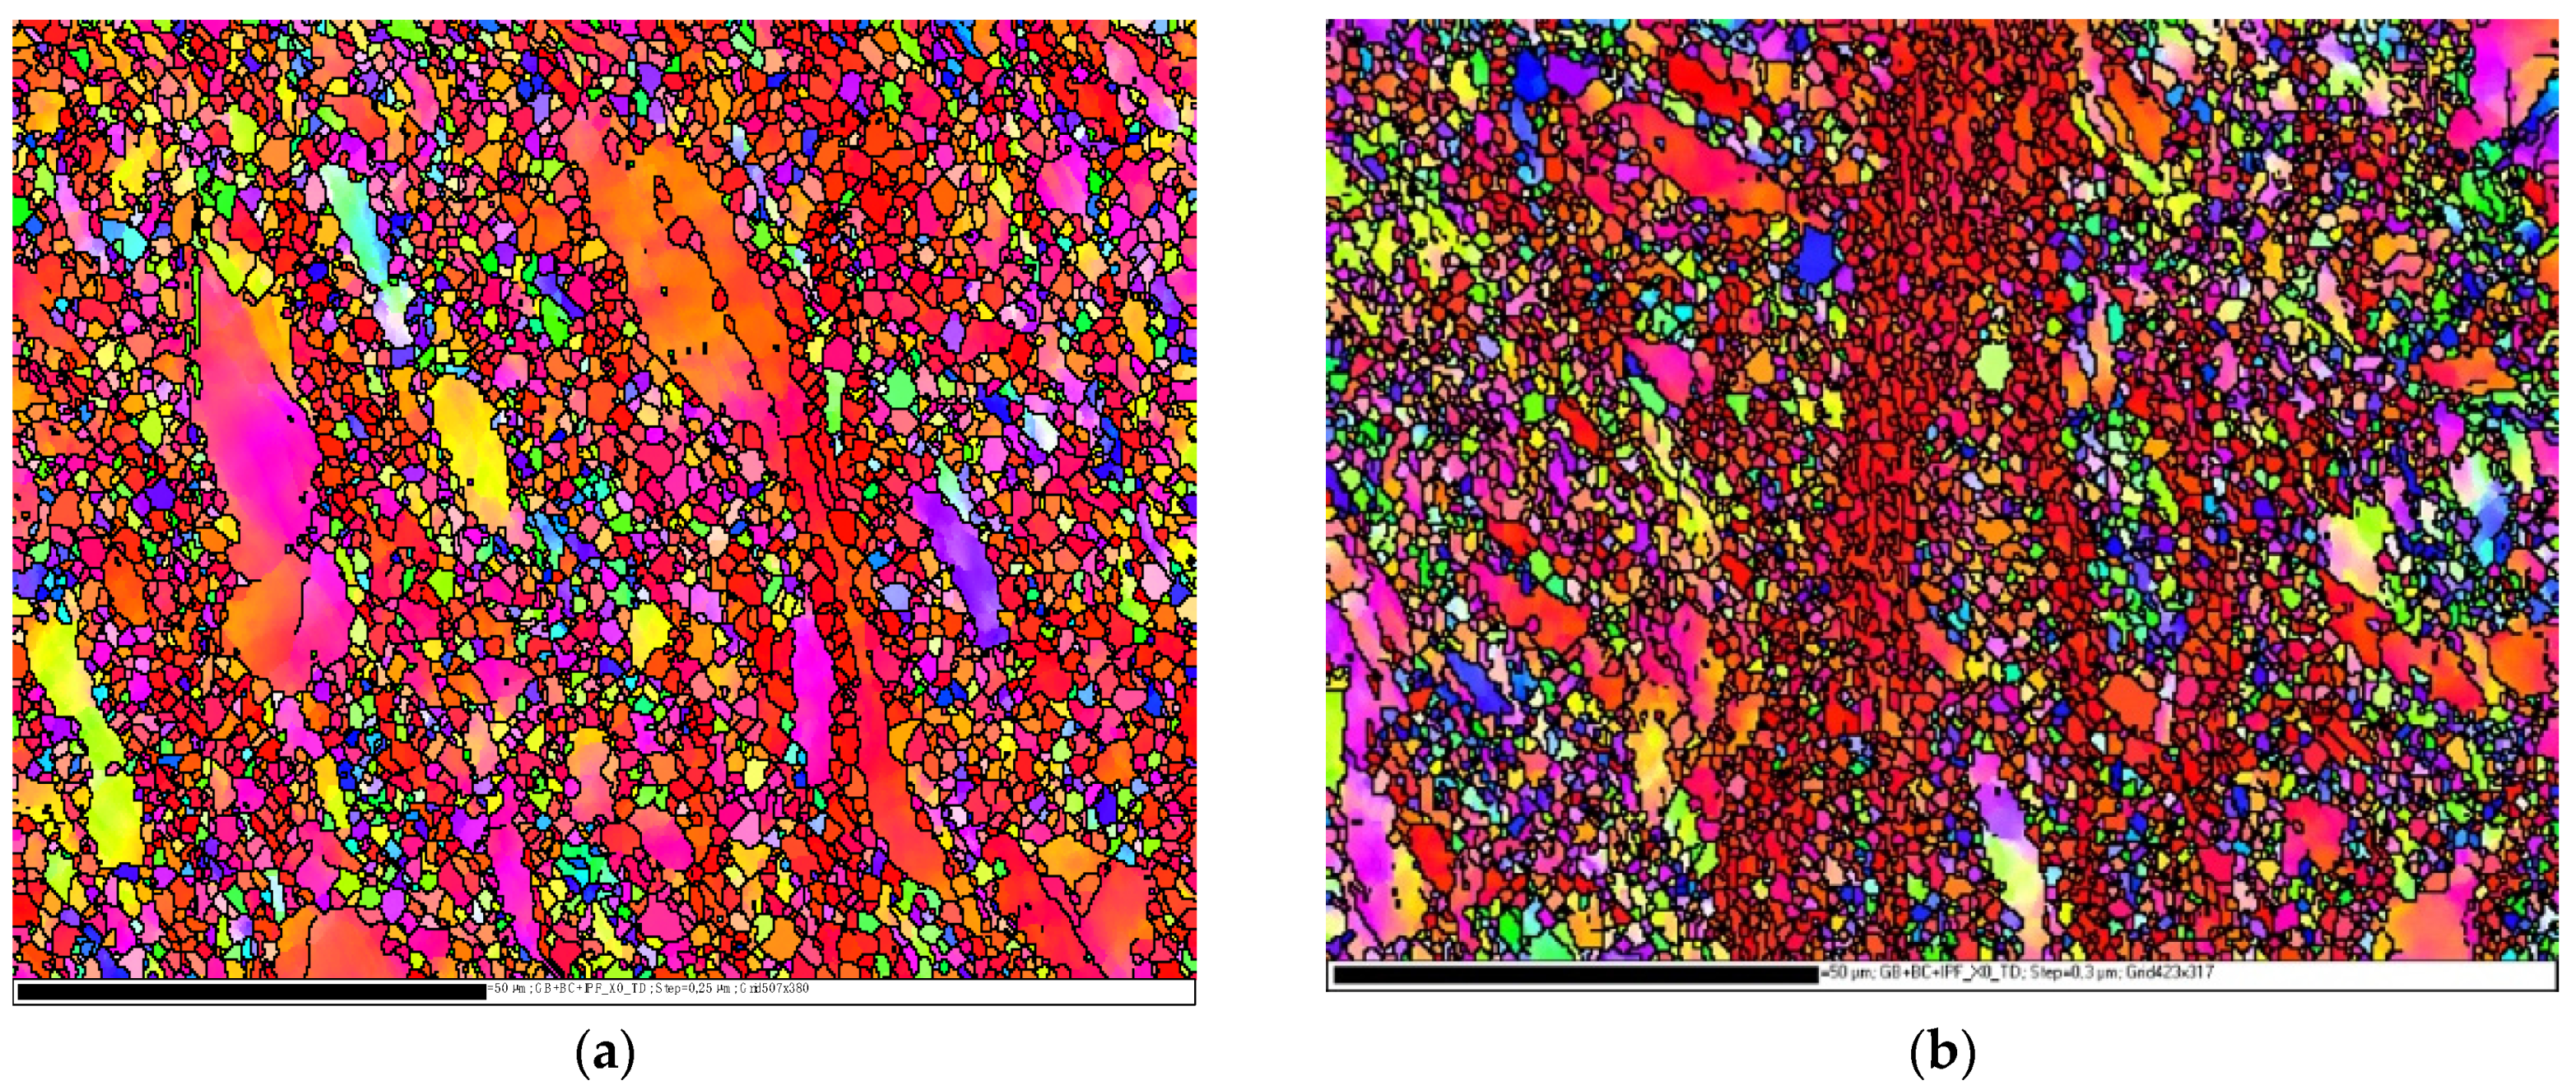
3.1. Microstructural Evolution

In the current study, EBSD was used to characterize the microstructural evolution of as-annealed Mg (AA-Mg) after ECAP processing to study how it was affected by the different processing parameters. Figure 2 illustrates the inverse pole figure (IPF) maps of the AA-Mg and the ECAPed samples using route Bc for one pass (1P) and four passes (4P), with different die angles, ϕ = 90° and 120°.
The IPF map of AA-Mg clearly shows that it has inhomogeneous coarse grains, as presented in Figure 2a, after the first ECAP pass grain refinement was observed, regardless of die angle. However, using die angle 90° led to higher refinement, as shown in Figure 2b. This can be argued to relate to the higher strain experienced using the 90° die angle relative to that experienced using the 120° die angle [37]. Table 2 illustrates the grain sizes corresponding to each number of passes and to each die angle through route Bc. Increasing the number of passes up to 4P resulted in even further refinement as the grain size reduced from 1.492 to 0.88 µm using ϕ= 90° and from 2.62 to 1.896 µm using ϕ= 120°.
Figure 3 presents the IPF maps of the 2P ECAPed samples using routes A and C. It is shown that the route A sample contains coarser grains than route C as the maximum grain sizes were 22.62 µm and 11.052 µm, respectively. However, the average grain size was approximately the same, 1.492 µm and 1.374 µm, in route A and C, respectively.
Equation (3) represents the predicted linear model of Mg’s GR based on data from the experiments. The regression coefficient of grain size is (R2 > 0.9934), and the adjusted value of R2 is 0.9889. Figure 4 presents a comparison between predicted and actual GR.
GR = 0.570139 − 0.649646 × N + 0.0204069 × φ − 0.12025 × X1 − 0.261167 × X2 + 0.00261528 × N × φ + 0.0249236 N2
In addition, the three-dimensional plot, Figure 5, illustrates GR as a function of N and ϕ through the different studied routes. For routes A, Bc and C, the increase in ECAP die angle results in an increase in GR, which lies in good agreement with the experimental results. On the contrary, there is an inverse relationship between the number of passes and GR. The minimum optimum GR was obtained at four passes and 90° ECAP die angle. The values of GR are 0.98 µm, 0.88 µm and 1.22 µm for route A, Bc and C, respectively, as shown in Figure 5.

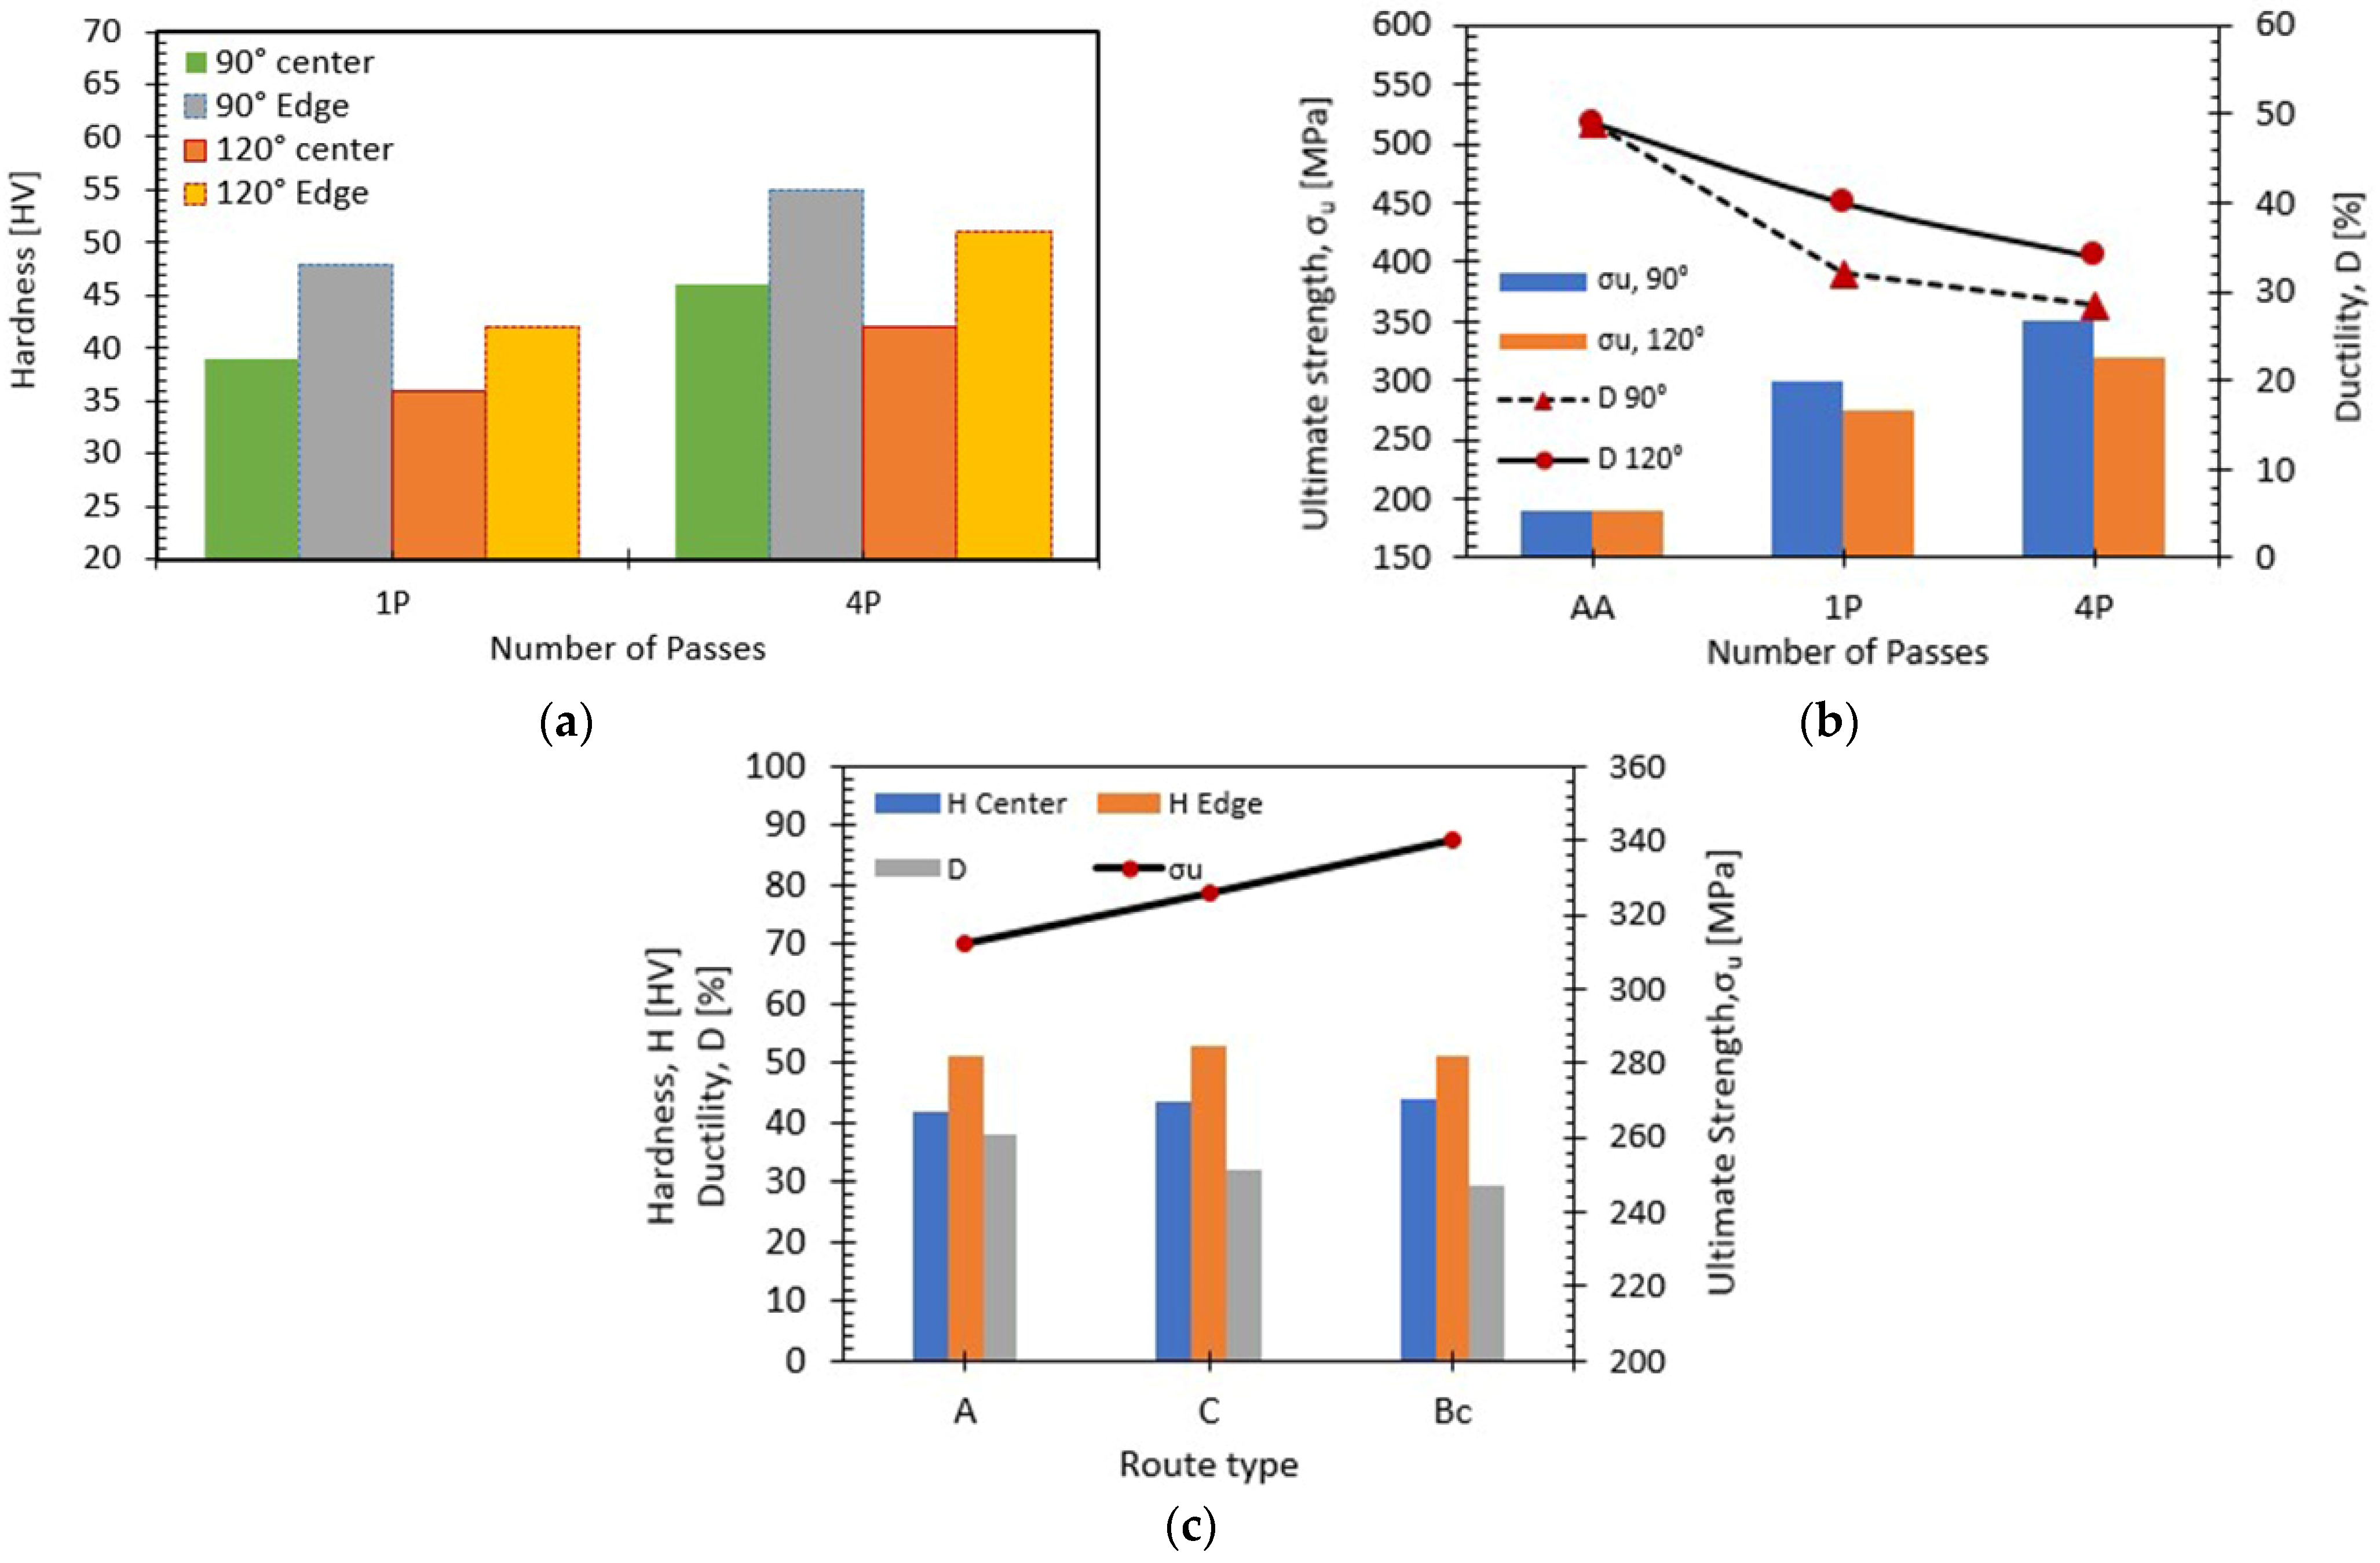
3.2. Mechanical Properties

Vicker’s microhardness tests across the central and edge regions of the ECAPed billets were used to evaluate the homogeneity of hardness. The hardness values of the ECAPed Mg billets processed via route Bc are plotted in Figure 6a as a function of the number of passes, with the different internal die angles taken into account. Figure 6a shows that the AA-Mg hardness significantly increased with increasing the number of passes in both the central and edge areas. The 90° die recorded higher HV-values in the central and edge regions compared to the ϕ = 120°. ECAP processing through 1P with an internal angle of 90° die revealed an increase in the HV by 84% at the edge and 50% at the central regions compared to the AA-Mg counterpart. This discrepancy in HV increase between the edge and the center could be argued to relate to the friction between the die walls and the sample, which led to more strain hardening. Processing through 1P using 90° die angle showed an increase in the HV by 15% and 8% at the edge and central regions, respectively, compared to ECAP processing with the same conditions using the 120° die, as presented in Figure 6a. The decrease in HV values with increasing ϕ can be argued to relate to the decrease in the plastic strain. Additionally, increasing the plastic strain up to 4Bc using the 90° die angle recorded a significant HV increase at the edge and central areas by 112% and 78%, respectively, compared to the AA-Mg counterpart. Comparatively, the 4Bc condition of the 90° die displayed 8% and 9% increase in the HV-values at the edge and central regions, respectively, compared to the 120° ϕ counterparts. This discrepancy can be argued to relate to the grain refinement mentioned above. Finally, a conclusion can be reached that strain hardening assisted in enhancing the HV-values with increasing the passes number.
Equations (4) and (5) show the predicted modeling of the inverse of HC and HE. The regression coefficients of HC and HE are 0.9657 and 0.9741, respectively.
1/HC = 0.0171726 − 0.000110407 × N + 0.000107254 × φ − 0.000901199 × X1 − 0.00320891 × X2 – 0.00000961846
× N × φ + 0.000507579 × N × X2
1/HE = 0.0159481 − 0.000941798 × N + 0.0000850833 × φ − 0.00033721 × X1 − 0.000736064 × X2 – 0.000014373 ×
N × φ + 0.000288905 × N2
Figure 7 compares actual and predicted hardness values at central and edge areas. Moreover, Figure 8 shows a three-dimensional response surface plot of HC, and HE responses against N and ϕ at a constant processing route. For routes A, Bc and C, the increase in ECAP die angle resulted in a decrease in both HC and HE. On the contrary, there is a proportional relationship between the number of passes and both HC and HE. The maximum optimum HC and HE were obtained at four passes and 90° ECAP die angle. The optimum HC values are 52.8 HV, 46 HV and 43 HV for route A, Bc and C, respectively, while the maximum values of HE are 46.5 HV, 55 HV and 51.2 HV for route A, Bc and C, respectively.
Tensile tests were conducted for AA-Mg before and after ECAP processing with the different studied conditions. The ultimate tensile stress (σu) and ductility (D) of the ECAPed samples are plotted in Figure 6b,c. As seen in Figure 2, increasing the ECAP passes results in a significant reduction in grain size, which consequently increases the ultimate strength. Figure 6b shows that, using ϕ = 90°, the 1P sample showed an enhancement in σu by 58%; however, ductility was decreased by ~ 35% compared to the AA-Mg counterpart. On the other hand, 1P at ϕ = 120° resulted in a rise in σu by 44%. Increasing the number of ECAP passes up to 4P showed additional enhancement in the σu by 15% compared to 1P counterpart. The 4Bc condition yielded further improvement in σu by 16% and a decline in ductility by 10%. Finally, using routes A, C and Bc resulted in increase in σu by 64%, 71% and 79%, respectively, compared to AA-Mg.
The increase in σu is a direct consequence of the ultra-fine grains, which can be described using Hughes’ theoretical model [49]. The imposed strain from ECAP processing leads to dislocation motion. As the strain increases, more and more dislocations are absorbed by the low-angle grain boundaries, gradually transforming the low-angle grain boundaries into stable high-angle grain boundaries. Therefore, the grains are refined because of the high-angle grain boundaries formation. However, severe plastic deformation techniques, such as ECAP processing, led to high dislocation density, which delayed the dislocation mobility [50,51,52,53,54,55,56,57], consequently improving the hardness and tensile strength of the ECAPed AA-Mg billets.
Moreover, the significant grain refinement provides the grain boundary strengthening mechanism, thus enhancing the mechanical properties in good agreement with Ref. [58]. As mentioned above, using ϕ = 90° led to finer grain size compared to 120°, which resulted in higher ultimate strength. However, the ductility reduction obtained in ϕ = 90° and 120° with increasing the number of passes was attributed to smaller grains size, which led to increasing the grain boundary area per unit volume. Consequently, increasing the strengthening results in ductility drop, and similar findings were mentioned in previous work [59]. However, 120° ϕ showed higher ductility compared to 90° die, as presented in Figure 6b, which could be argued that the lower strain occurred when using the 120° die angle compared to ϕ= 90°.
In addition, the tensile responses of Mg specimen are σu and D%. Equations (6) and (7) represent the linear modelling of tensile response. The regression coefficients of σu and D% are 0.9948 and 0.9752, respectively.
σu = −553.75000 + 324.62500 × N + 5.15000 × φ + 736.00000 × X1 + 207.50000 × X2 − 1.42500 × N × φ –
75.50000 × N × X1 − 49.75000 × N × X 2– 4.82500 × φ × X1 – 22.87500 × N2
D = 68.26667 − 8.10000 × N − 0.353333× φ − 6.90000× X1 − 13.40000 × X2 + 0.143333 × N × φ + 0.056667 × φ ×
X1 + 0.103333 × φ × X2 − 1.41667 × N2
The relationships between the actual and predicted responses σu and D are shown in Figure 9. In addition, Figure 10 shows the three-dimensional interaction effect of ECAP parameters on σu and D while generating interaction graphs and response surface plots between two variables at constant processing route. For route A, Bc and C, there are slight effects of ECAP die angle on σu of specimen. However, there are different relations between the number of ECAP passes and σu in each route. For route A, increasing ECAP number of passes will decrease the σu. The maximum σu at route A (330 MPa) was obtained at four passes and 90° die angle.
Moreover, there is a proportional relationship between N and σu at route Bc until we reach two passes, and a decrease in σu occurs. The maximum σu at route Bc (388 MPa) was obtained at two passes and 120° die angle. Finally, for route C, the maximum σu at route C (327 MPa) was obtained at four passes and 90° die angle. For route A, Bc and C, there are slight effects of ECAP die angle on D of specimen. However, there are different relations between the number of ECAP passes and D in each route. For route A, Bc and C, there is a proportional relationship between N and D until we reach two passes, and a decrease in D occurs. The minimum D values at route A, Bc and C are 31%, 28% and 39.5%, respectively. The optimum D for all three processing routes was obtained at four passes and 90° die angle.
Furthermore, analysis of variance (ANOVA) is used to examine independent parameters, N, φ, X1 and X2, in order to determine which ones have a significant impact on performance parameters, GR, HC, HE, σu and D [60]. The significant effects with p-values less than 0.05 indicate that the independent parameters, as well as the individual model coefficients and interaction terms, are statistically different from zero at the 95% confidence level [61]. Table 3 presents the significant parameters of the five responses after eliminating the insignificant effects using multiple regression analysis on experimental data.
Table 4 presents the statistical tests, namely F-value, p-value, lack of fit, adequate precision, regression coefficient (R2), adjusted R2 and predicted R2 of the five models. The F-value is the difference between the variation attributed to individual factors and the variance due to the error term. F-values of ECAP responses greater than 4 indicate that changing an input ECAP parameter has a significant impact on the response quality criterion [62]. Die angle has the greatest impact on GR, HC and D. Otherwise, number of passes and route type have a significant effect on HE and σu, respectively.
The model significant (p-values) are less than 0.05 for all ECAP responses, indicating that the independent parameters, as well as the individual model coefficients and interaction terms, are statistically different from zero at the 95% confidence level. The ECAP responses’ lack of fit is greater than 0.05, implying that the model is good [63]. The signal to noise (S/N) ratio is computed with “adequate precision” to determine the model’s validity. It is recommended that the ratio exceed four [62]. The ECAP responses’ adequate precision is greater than four and indicates that there is sufficient signal and the model can be applicable to navigate the design space. The regression coefficient R2 is high and indicates that the ECAP responses’ model created by the experiment is desirable. The adjusted R2 for the five responses is close to the predicted coefficient R2.

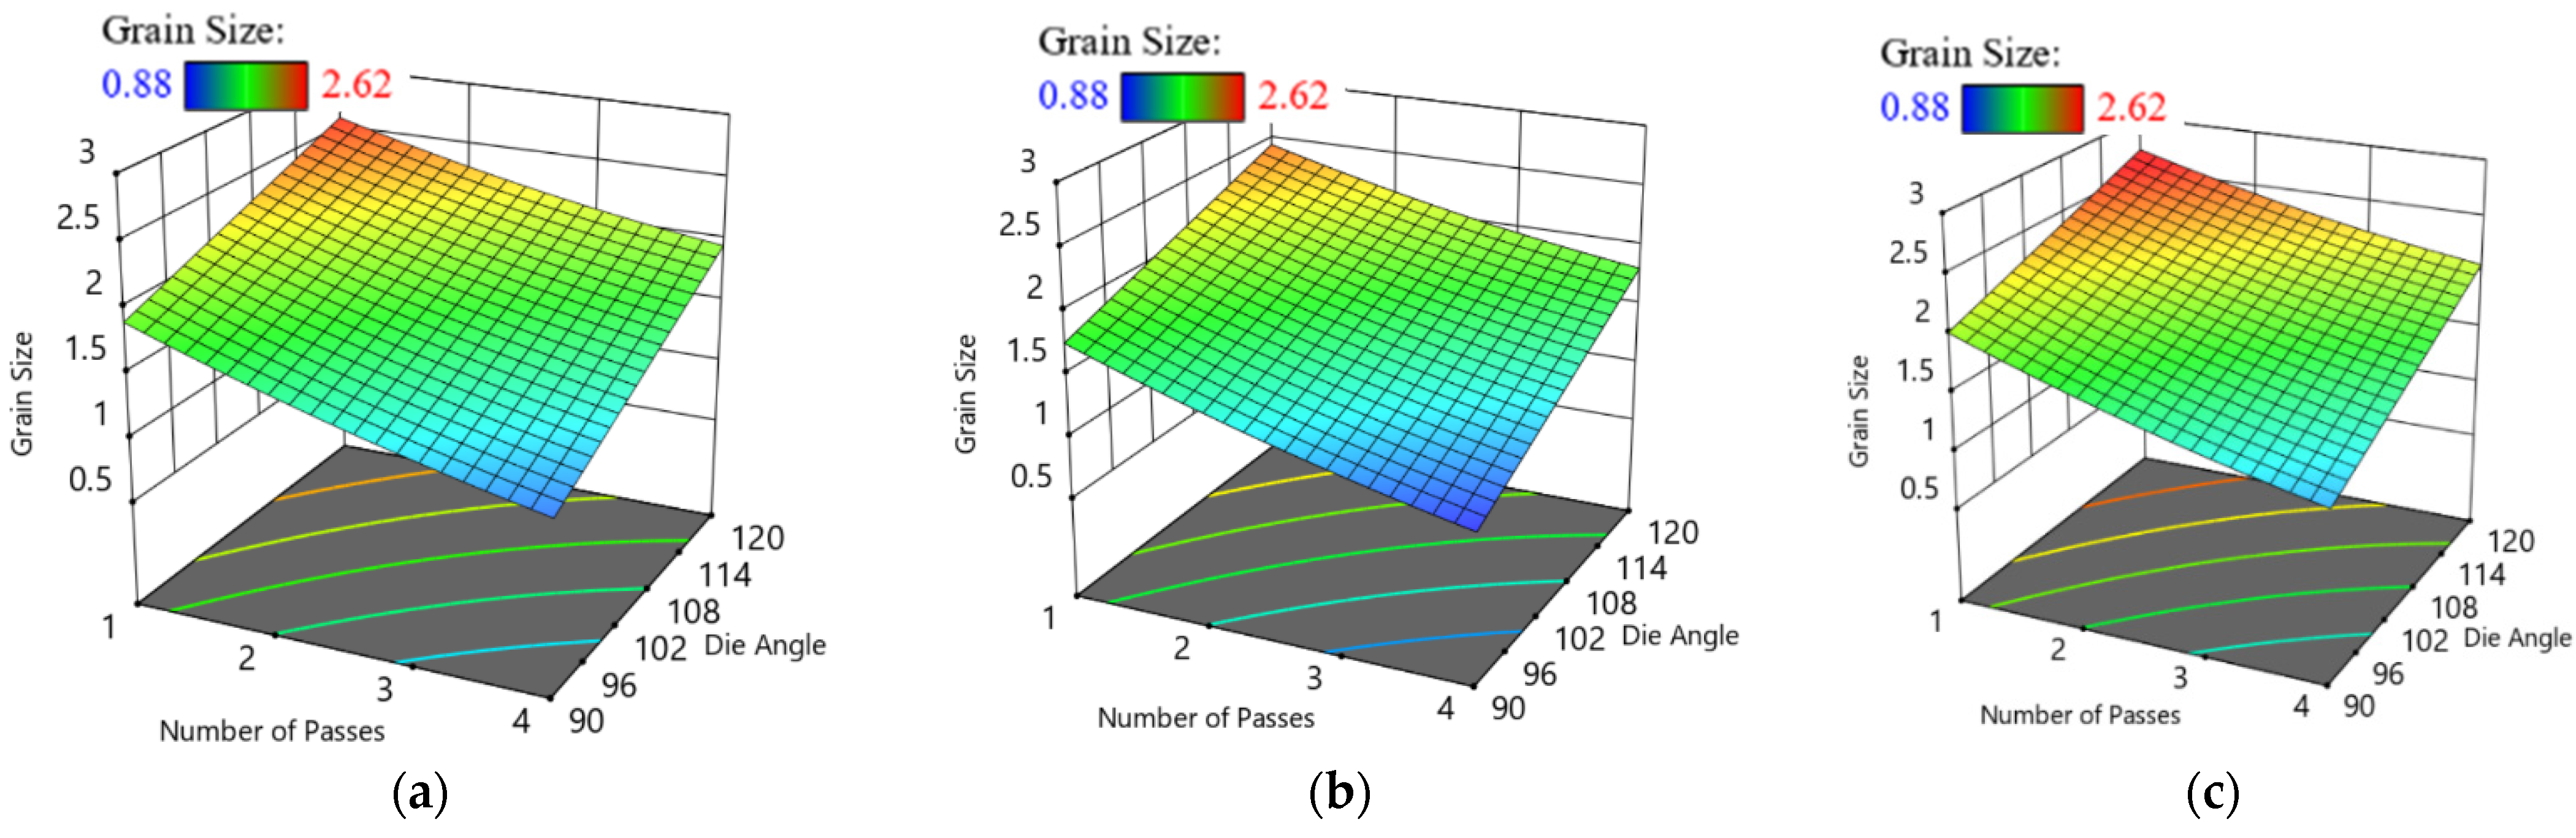
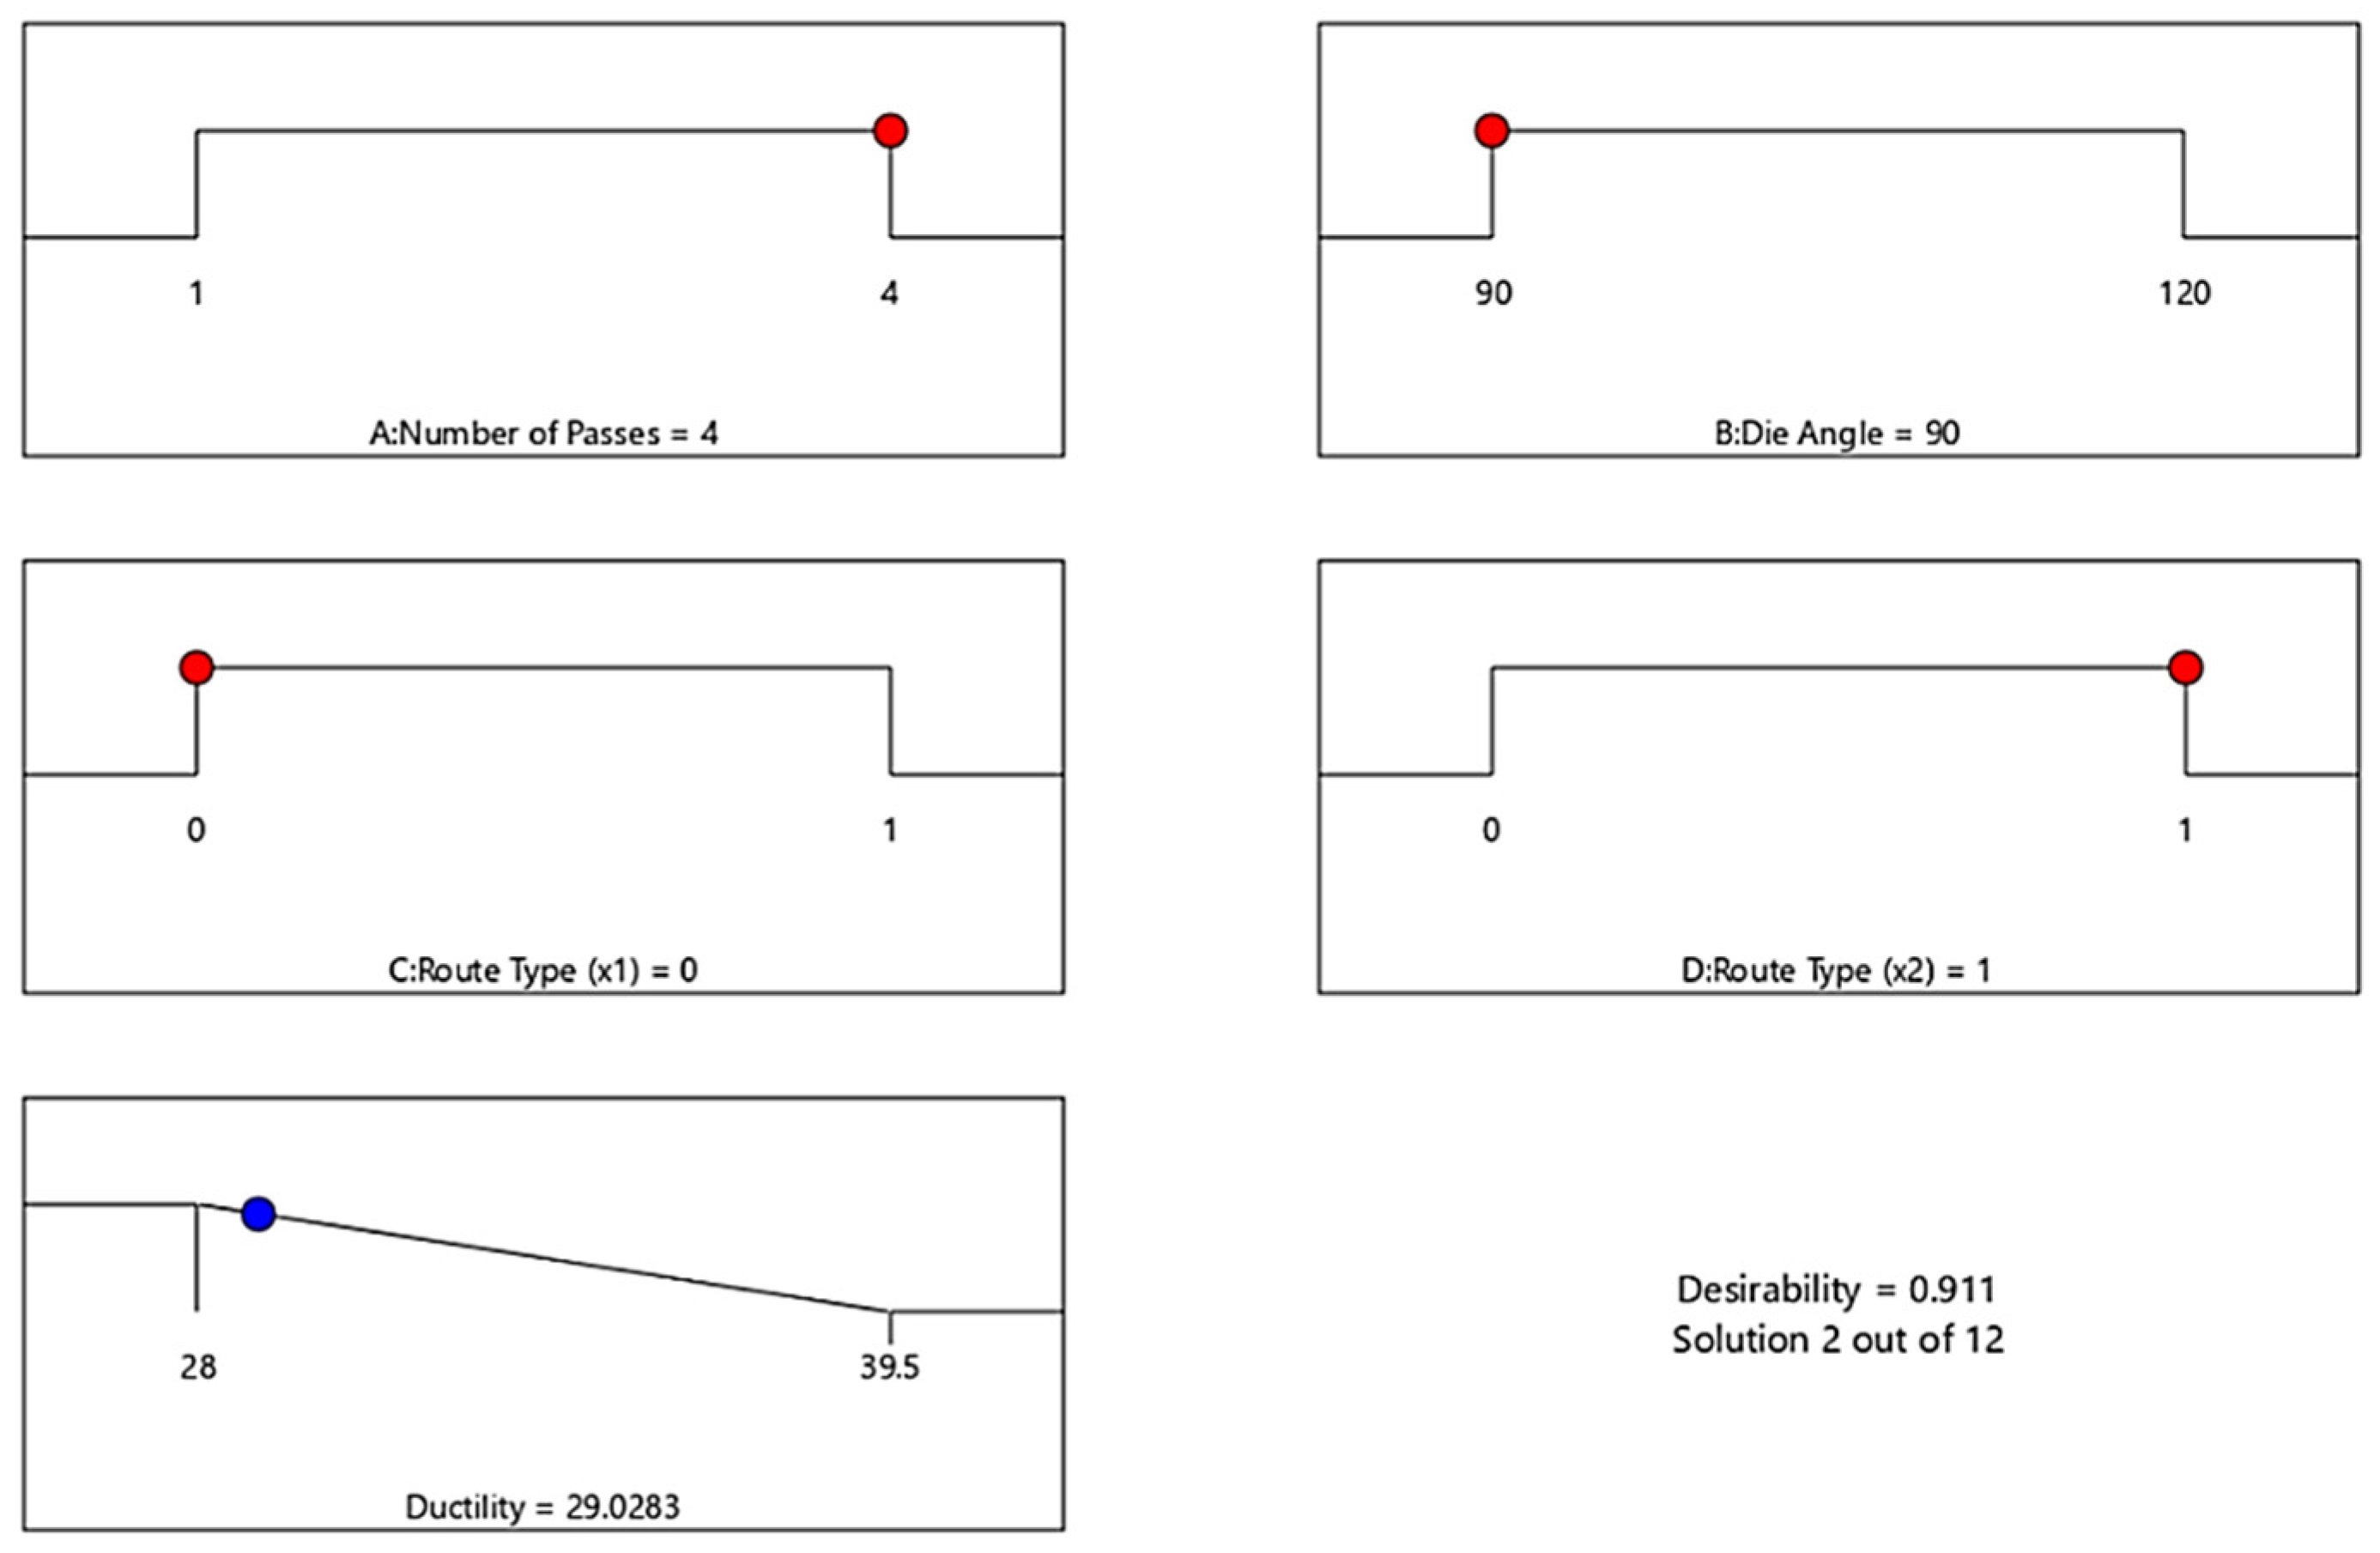
3.3. Optimization Results
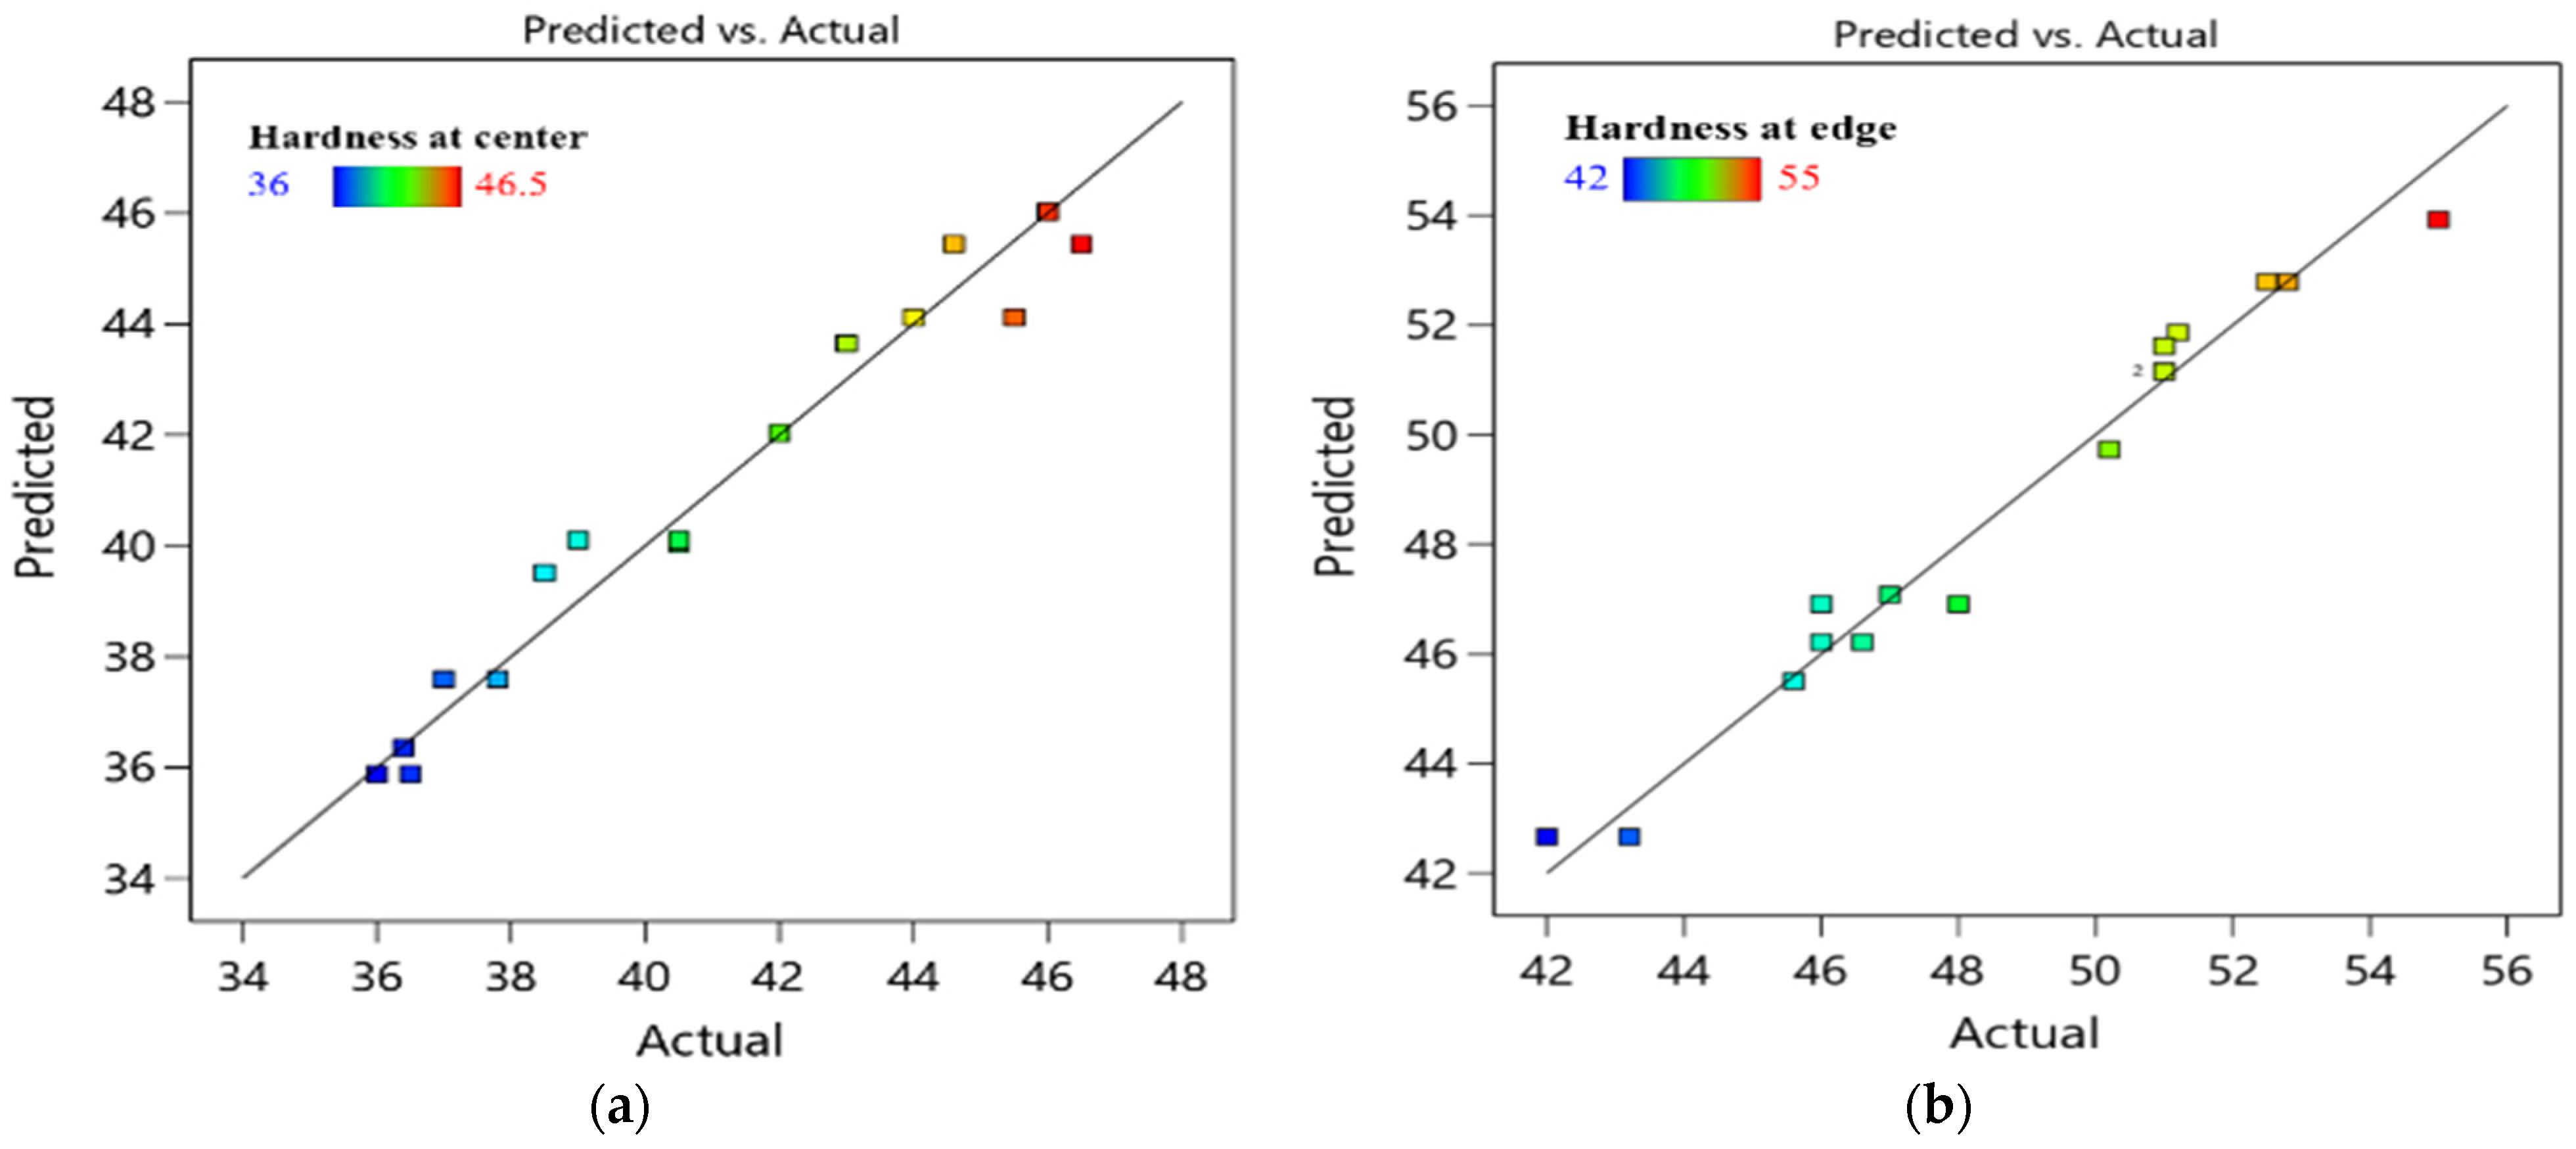
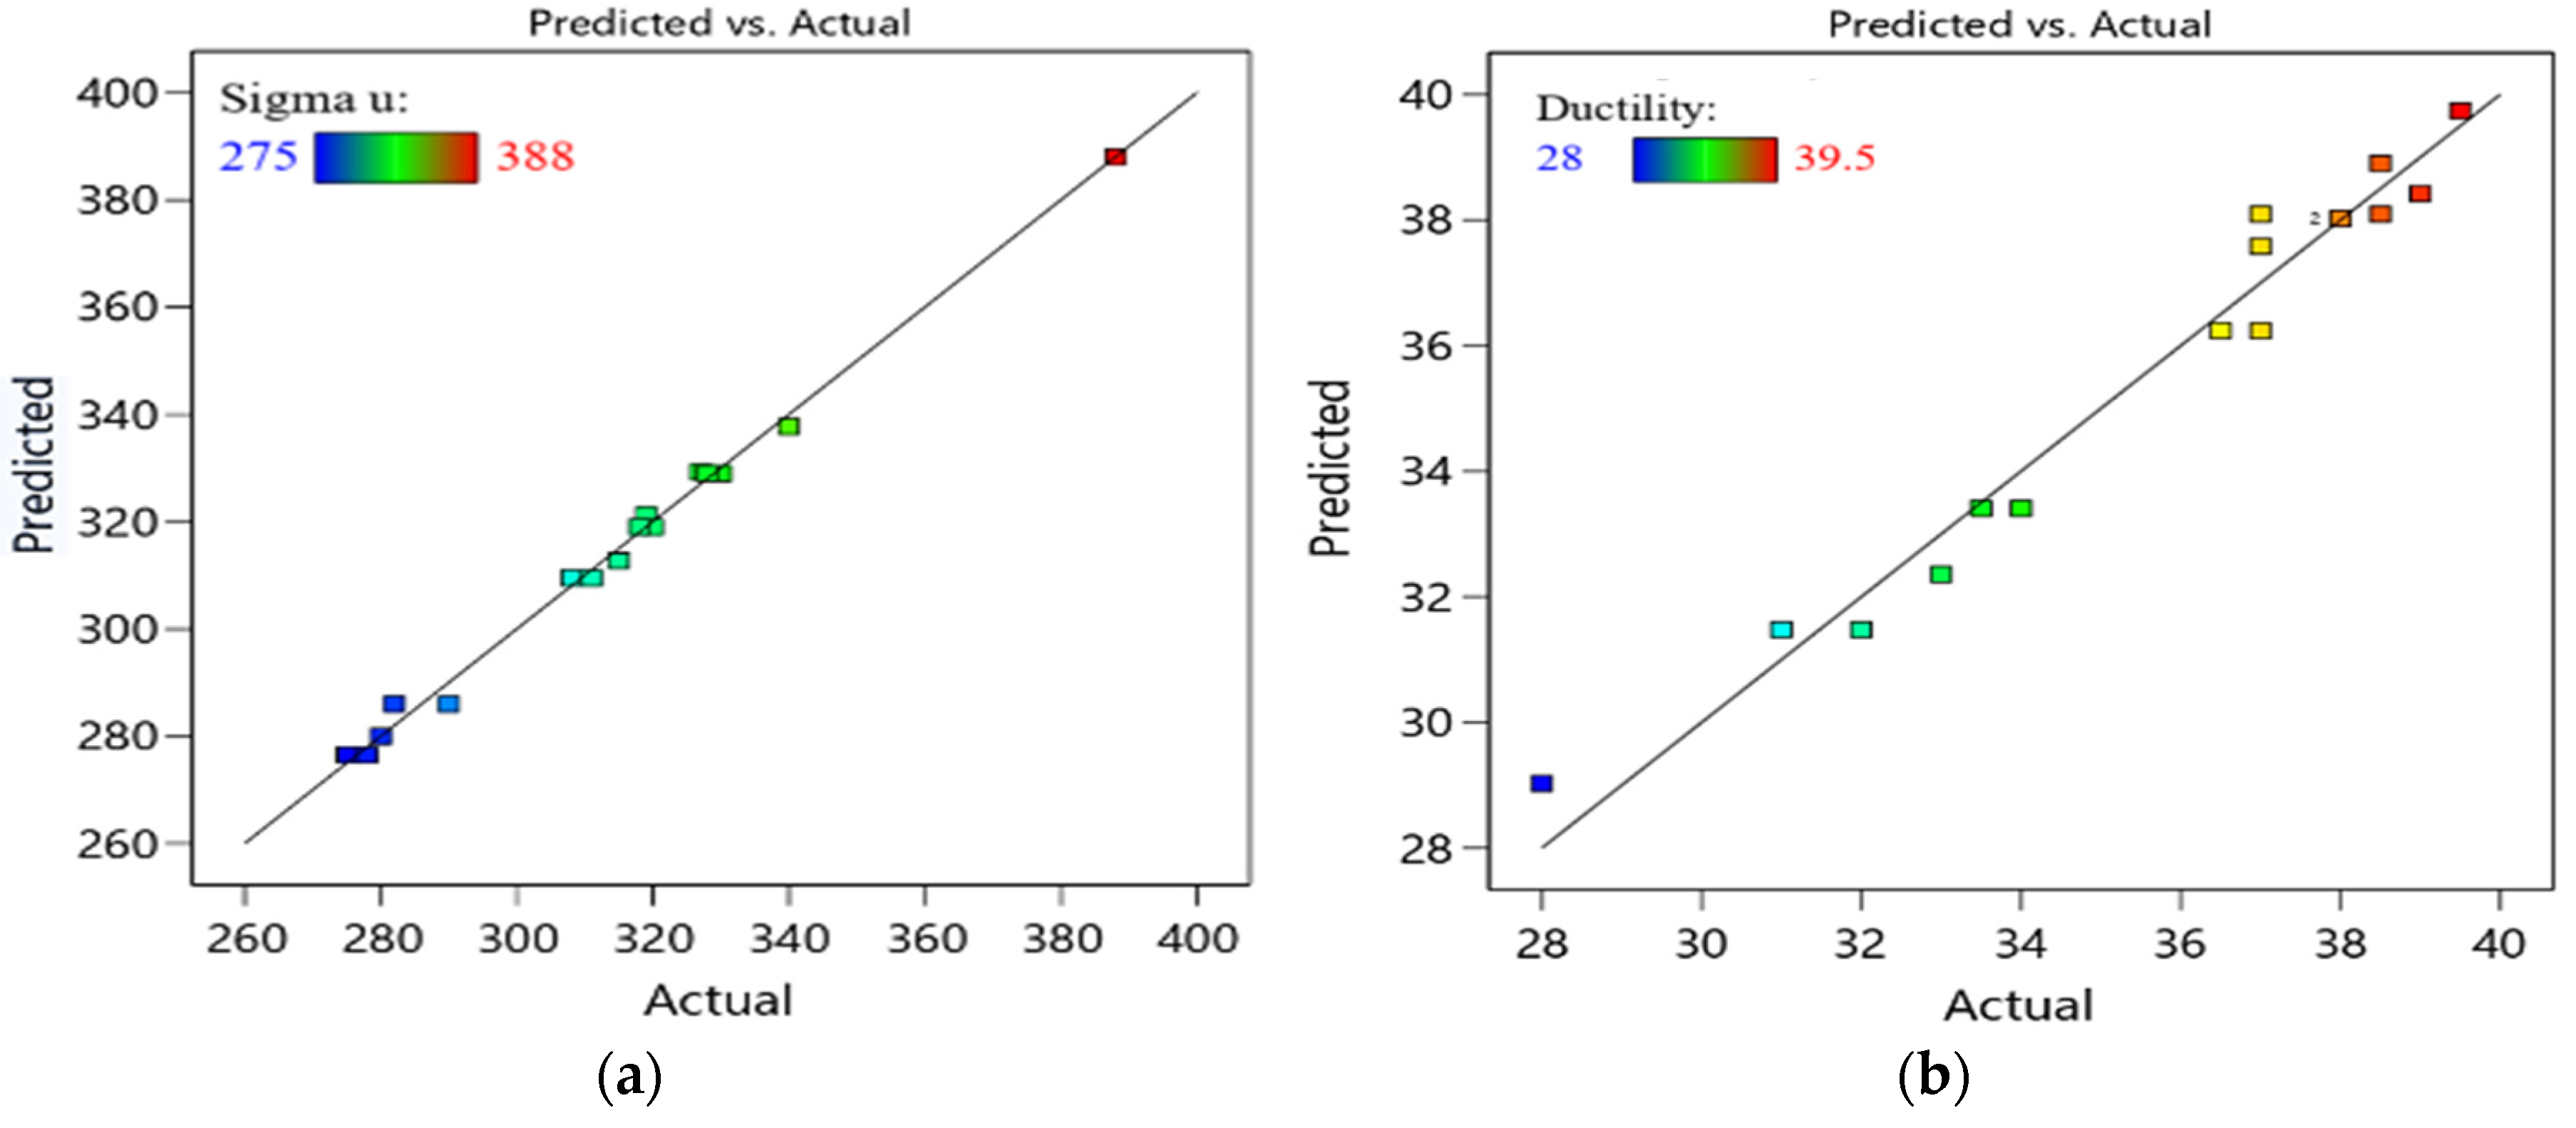
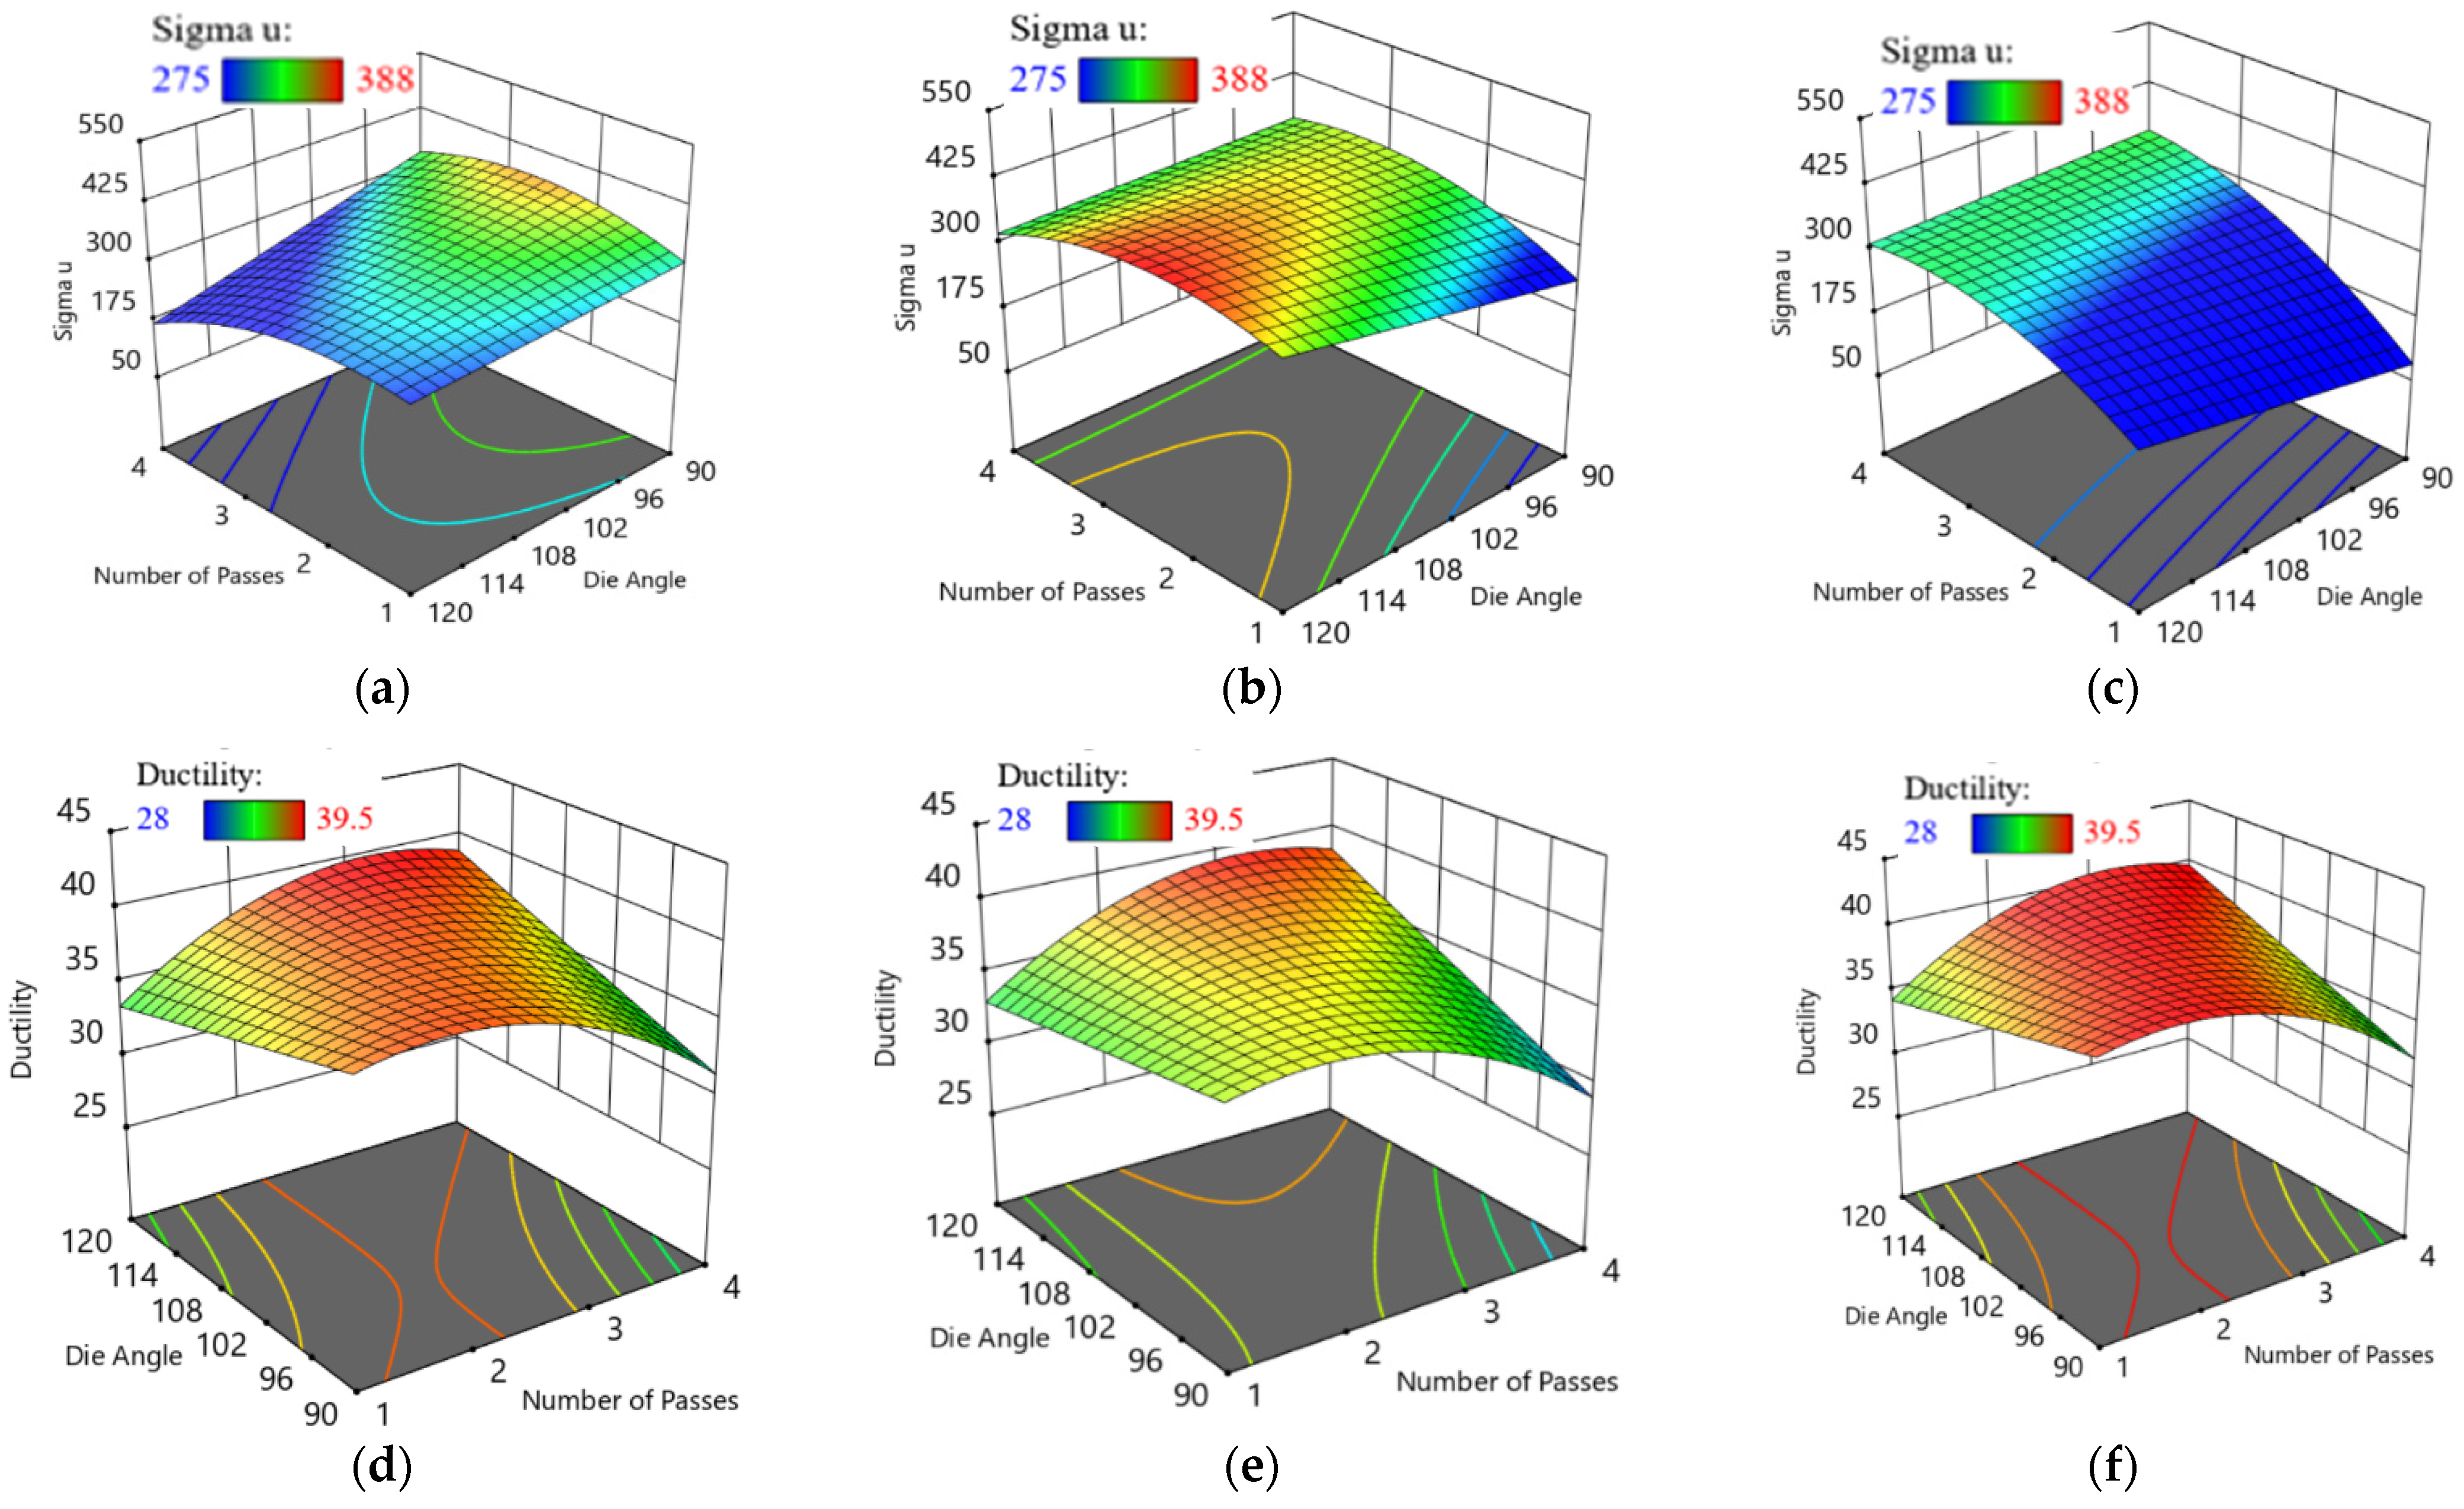
3.3.1. RSM Results

This section presented the optimal ECAP condition of the desire response. Stat-Ease Design Expert software (version 13.0.5) is a useful tool for optimizing the ECAP condition. Figure 11 shows the optimal GR response of ECAP process and corresponding conditions. For all the following optimization findings the red dot and the blue dotes the indicated the ECAP processing condition and ECAP response, respectively. The optimization target is set to “In range”, and the solution destination is set to “Minimize.” The desirability function’s predicted output is in the form of “smaller-is-better” characteristics. The optimal process condition values include number of passes (A) = 4 passes, die angle (B) = 90°, dummy variable X1(C) = 0 and dummy variable X2(D) = 1 for minimum GR value of 0.8872 µm. The optimum value of GR was obtained in the range between 0.88 and 2.62 µm.
In addition, the optimal HC response of ECAP process and corresponding conditions is presented in Figure 12. The optimization target is set to “In range”, and the solution destination is set to “Maximize.” The desirability function’s predicted output is in the form of “larger-is-better” characteristics. The optimal process condition values include number of passes (A) = 4 passes, die angle (B) = 90°, dummy variable X1(C) = 0 and dummy variable X2(D) = 1 for maximum HC value of 46.02 HV. The optimum value of HC was obtained in the range between 36 and 46.5 HV.
Furthermore, Figure 13 illustrates the optimal HE response of ECAP process and corresponding conditions. The optimization target is set to “In range”, and the solution destination is set to “Maximize.” The desirability function’s predicted output is in the form of “larger-is-better” characteristics. The optimal process condition values include number of passes (A) = 4 passes, die angle (B) = 90°, dummy variable X1(C) = 0 and dummy variable X2(D) = 1 for maximum HE value of 53.924 HV. The optimum value of HE was obtained in the range between 42 and 55 HV.
Figure 14 presents the optimal σu response of ECAP process and corresponding conditions. The optimization target is set to “In range”, and the solution destination is set to “Maximize.” The desirability function’s predicted output is in the form of “larger-is-better” characteristics. The optimal process condition values include number of passes (A) = 2 passes, die angle (B) = 120°, dummy variable X1(C) = 0 and dummy variable X2(D) = 1 for maximum σu value of 388 MPa. The optimum value of σu was obtained in the range between 275 and 388 MPa.
Finally, Figure 15 shows the optimal D response of ECAP process and corresponding conditions. The optimization target is set to “In range”, and the solution destination is set to “Minimize.” The desirability function’s predicted output is in the form of “smaller-is-better” characteristics. The optimal process condition values include number of passes (A) = 4 passes, die angle (B) = 90°, dummy variable X1(C) = 0 and dummy variable X2(D) = 1 for minimum D value of 29.0283%. The optimum value of D was obtained in the range between 28 and 39.5%. For a confirmation test, these optimum conditions of ECAP and responses are compared to the GA results obtained in the next step.

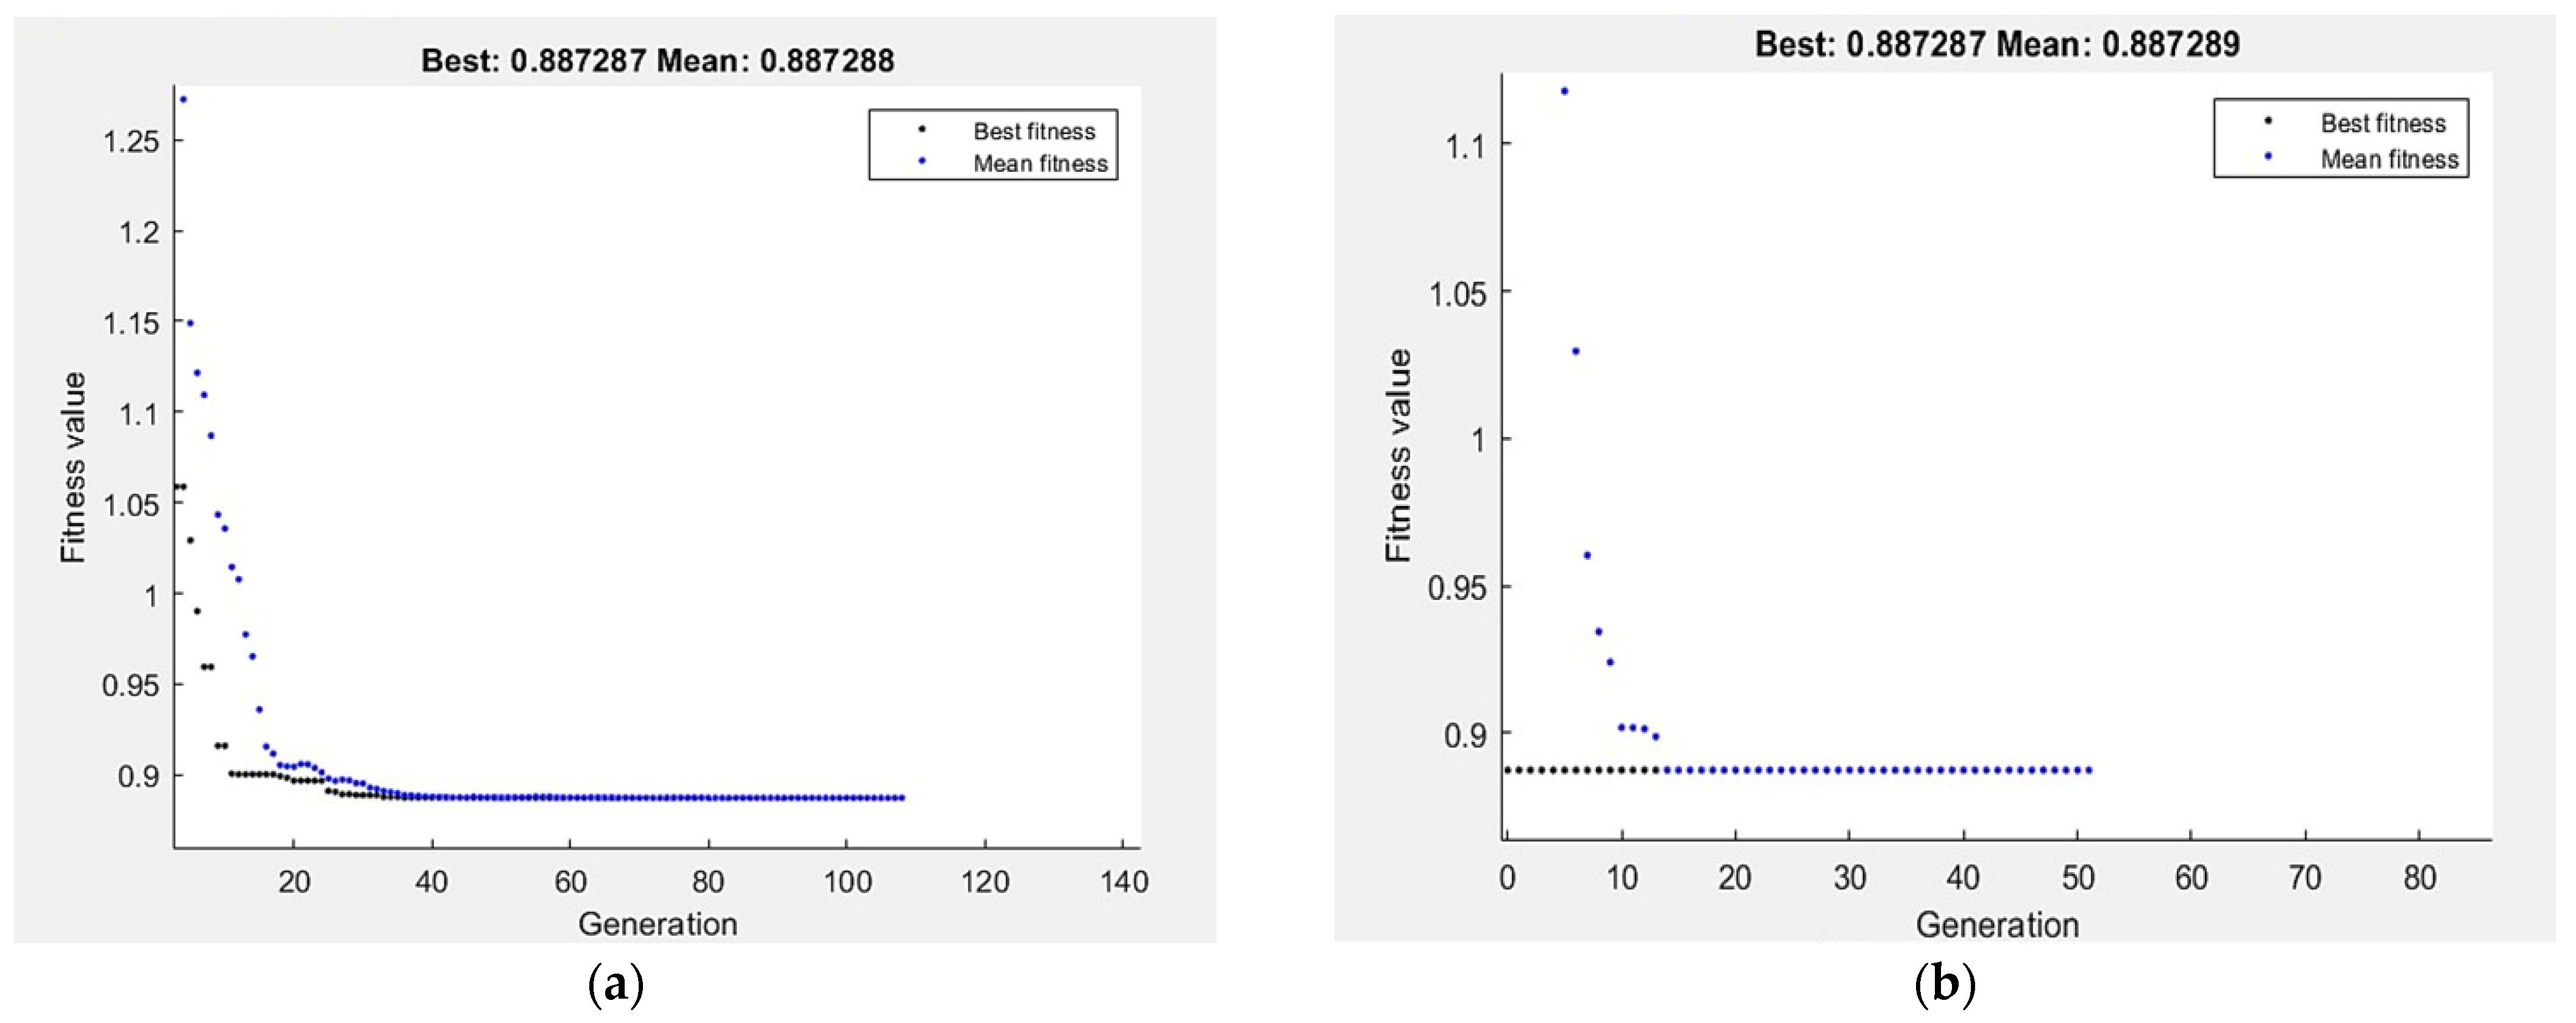
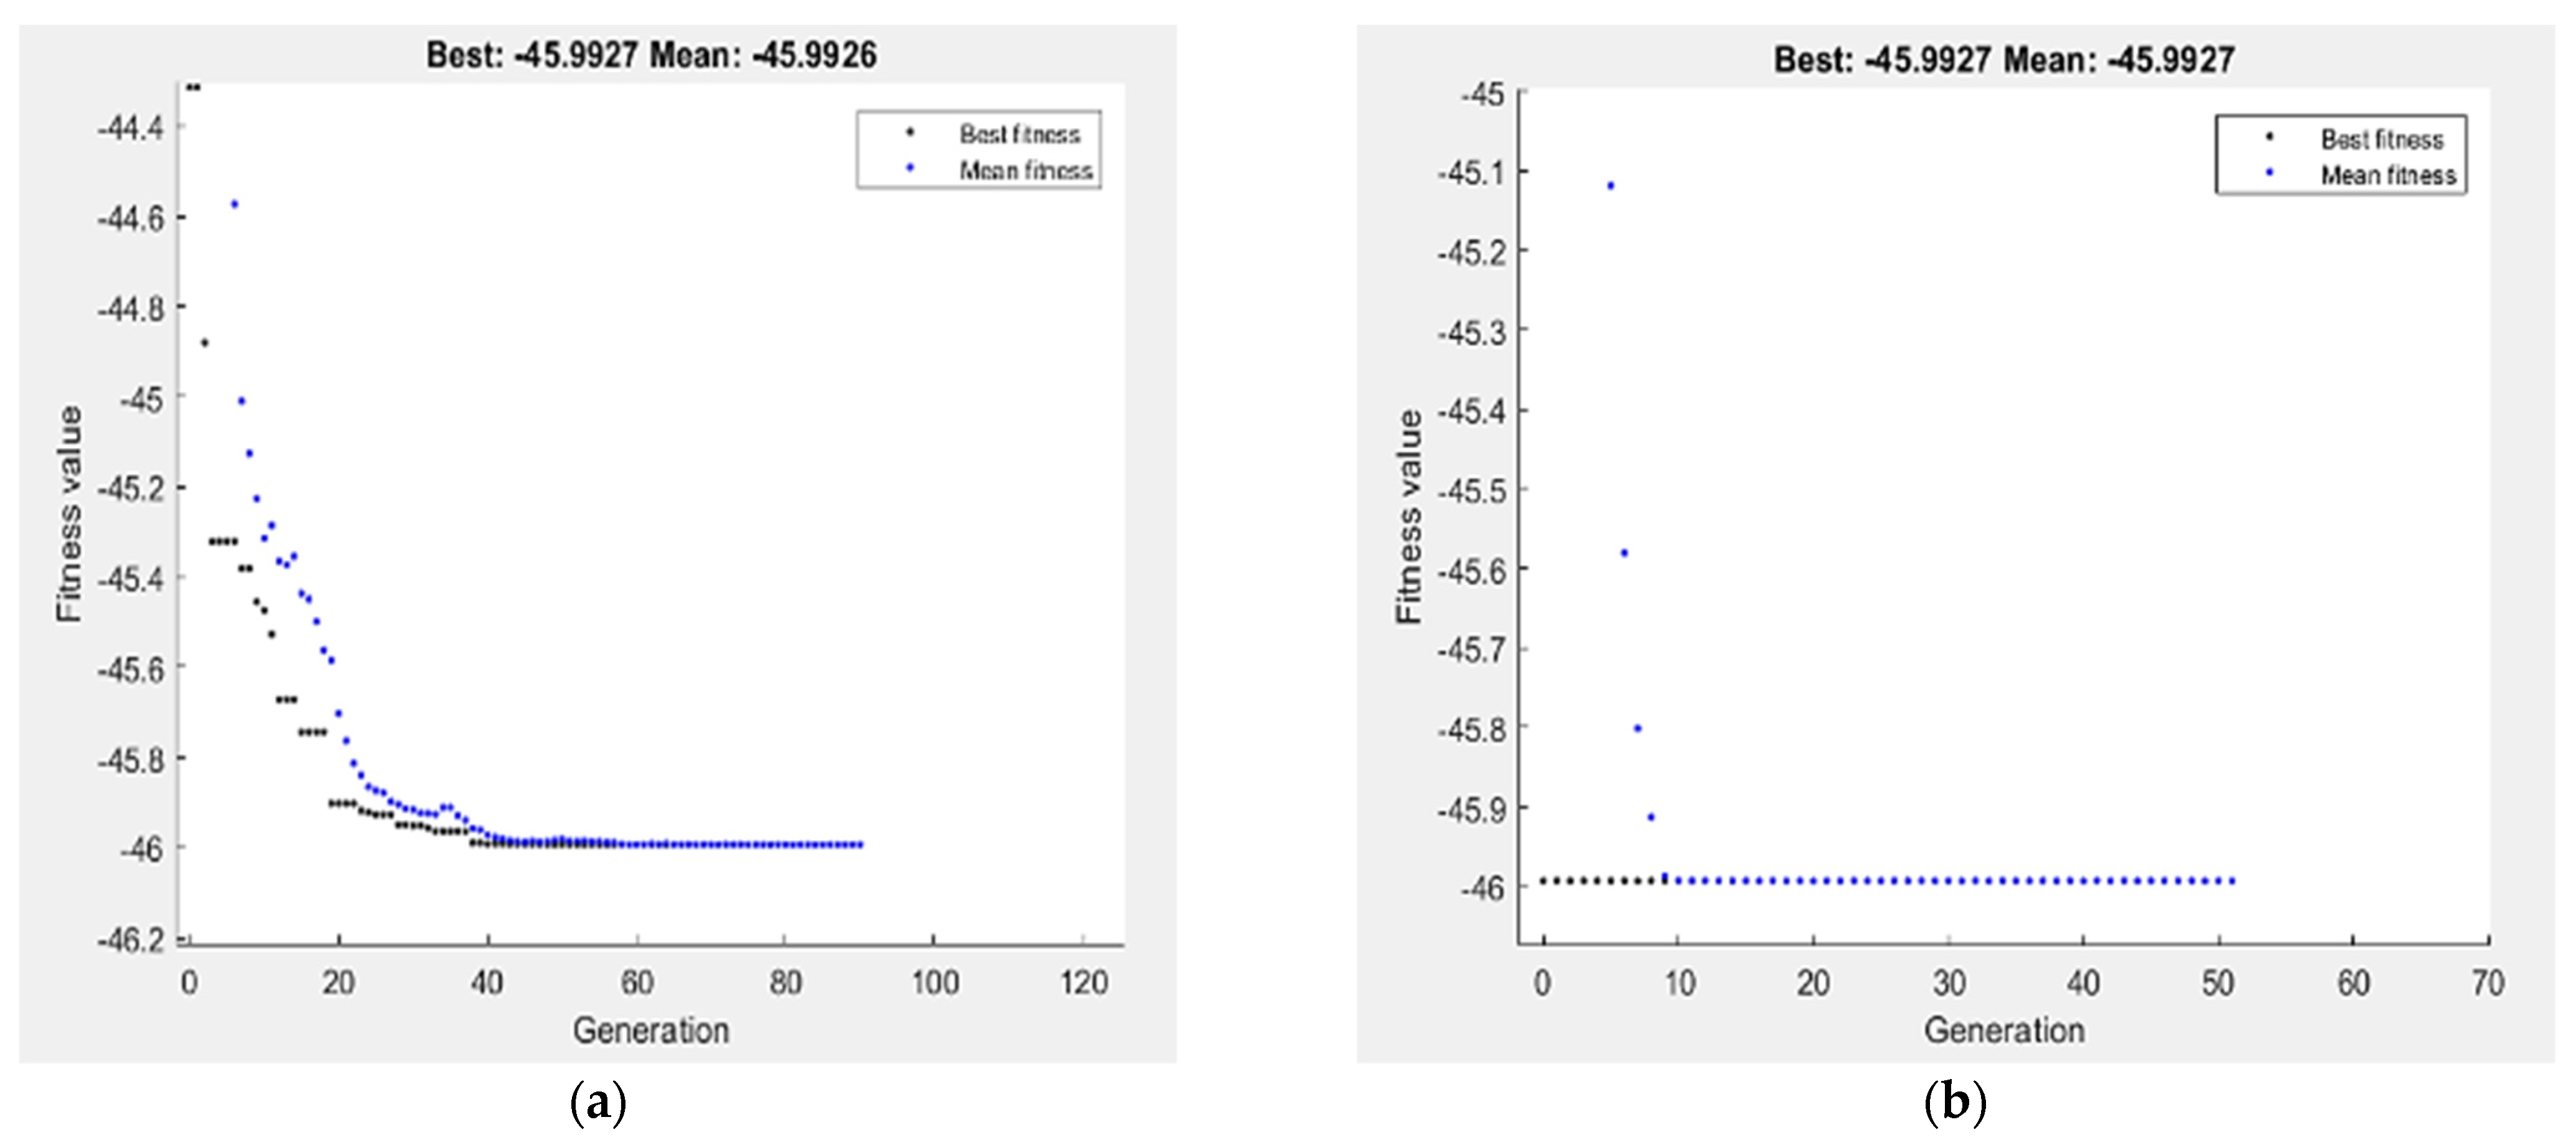
3.3.2. GA and Hybrid RSM-GA Results

Genetic algorithm (GA) used to determine the optimum set of the ECAP independent variables that contribute to the lowest possible GR and D and the higher possible HC, HE and σu. Each ECAP response proposed in Equation (3) to Equation (7) is taken as the objective function and subjected to the ECAP boundary condition, N, φ, X1 and X2 by using genetic algorithm can be expressed as:
Minimize ECAP (number of passes. ECAP die angle, X1, X2). Subjected to ranges of ECAP condition;
1 ≤ N ≤ 4 (pass)
90 ≤ φ ≤ 120 (°)
X1ϵ [0,1]
X2 ϵ [0,1]
For GA optimization technique, the performance of fitness value and run solver view results from MATLAB show the best GR and corresponding ECAP conditions. The best value of GR by GA is 0.8872 µm obtained at four passes, 90° die angle and route Bc for N, φ and processing route type, respectively, as shown in Figure 16. In order to improve the results of GA, hybrid of response surface methodology and GA (RSM-GA) was performed. An initial population of hybrid RSM-GA based on RSM optimum ECAP condition of N, φ, X1 and X2 are four passes, 90°, 0 and 1, respectively. The minimum optimum GR by hybrid RSM-GA is 0.8872 µm obtained at four passes, 90° and route Bc.
The optimization of hardness response by GA is presented in Figure 17. The maximization of HC and HE proposed in Equations (4) and (5) is taken as the fitness function and subjected to the ECAP boundary condition. The best value of HC and HE by GA is 45.9927 HV and 53.9068 HV, respectively, obtained at four passes, 90° die angle and route Bc. Hybrid (RSM-GA) of HC and HE was performed to improve the results of GA. The maximum optimum HC and HE by hybrid RSM-GA are 45.9927 HV and 53.9068 HV, respectively, obtained at four passes, 90° die angle and route Bc, as shown in Figure 17.
The optimization of tensile response, σu and D, by GA is presented in Figure 18. The maximization of σu proposed in Equation (6) is taken as the fitness function and subjected to the ECAP boundary condition. The best value of σu by GA is 388 MPa obtained at two passes, 120° die angle and route Bc.
On the other hand, the minimization of D% proposed in Equation (7) is taken as the fitness function and subjected to the ECAP boundary condition. The best value of D% by GA is 28.99% obtained at four passes, 90.29° die angle and route Bc. The maximum σu by hybrid RSM-GA is 388 MPa obtained at two passes, 120° die angle and route Bc. Moreover, minimum optimum D% by hybrid RSM-GA is 28.899 % obtained at four passes, 90° die angle and route Bc, as shown in Figure 18. Table 5 summarized the comparison of ECAP responses values at experimental, RSM, GA and hybrid RSM-GA.

3.3.3. Validation of GA

This section proposed the optimal ECAP parameters of different responses, namely GR, HC, HE, σu and D. The presented optimal ECAP parameters, such as N, φ and processing route type, are based on previous studies of pure Mg that recommended the number of passes from one to twelve passes and ECAP die angle from 70° to 135° [64,65,66,67]. Table 6 presents the optimal condition of ECAP process of different responses by genetic algorithm (GA) and hybrid RSM and GA.

4. Conclusions

Billets of pure Mg were processed through ECAP up to four passes of routes Bc, A and C using two dies with channel angles of 90° and 120° at a temperature of 225 °C.
Many empirical models were developed to assess the effect of ECAP processing parameters on the microstructural evolution and mechanical properties of Mg billets. The following conclusions can be extracted:
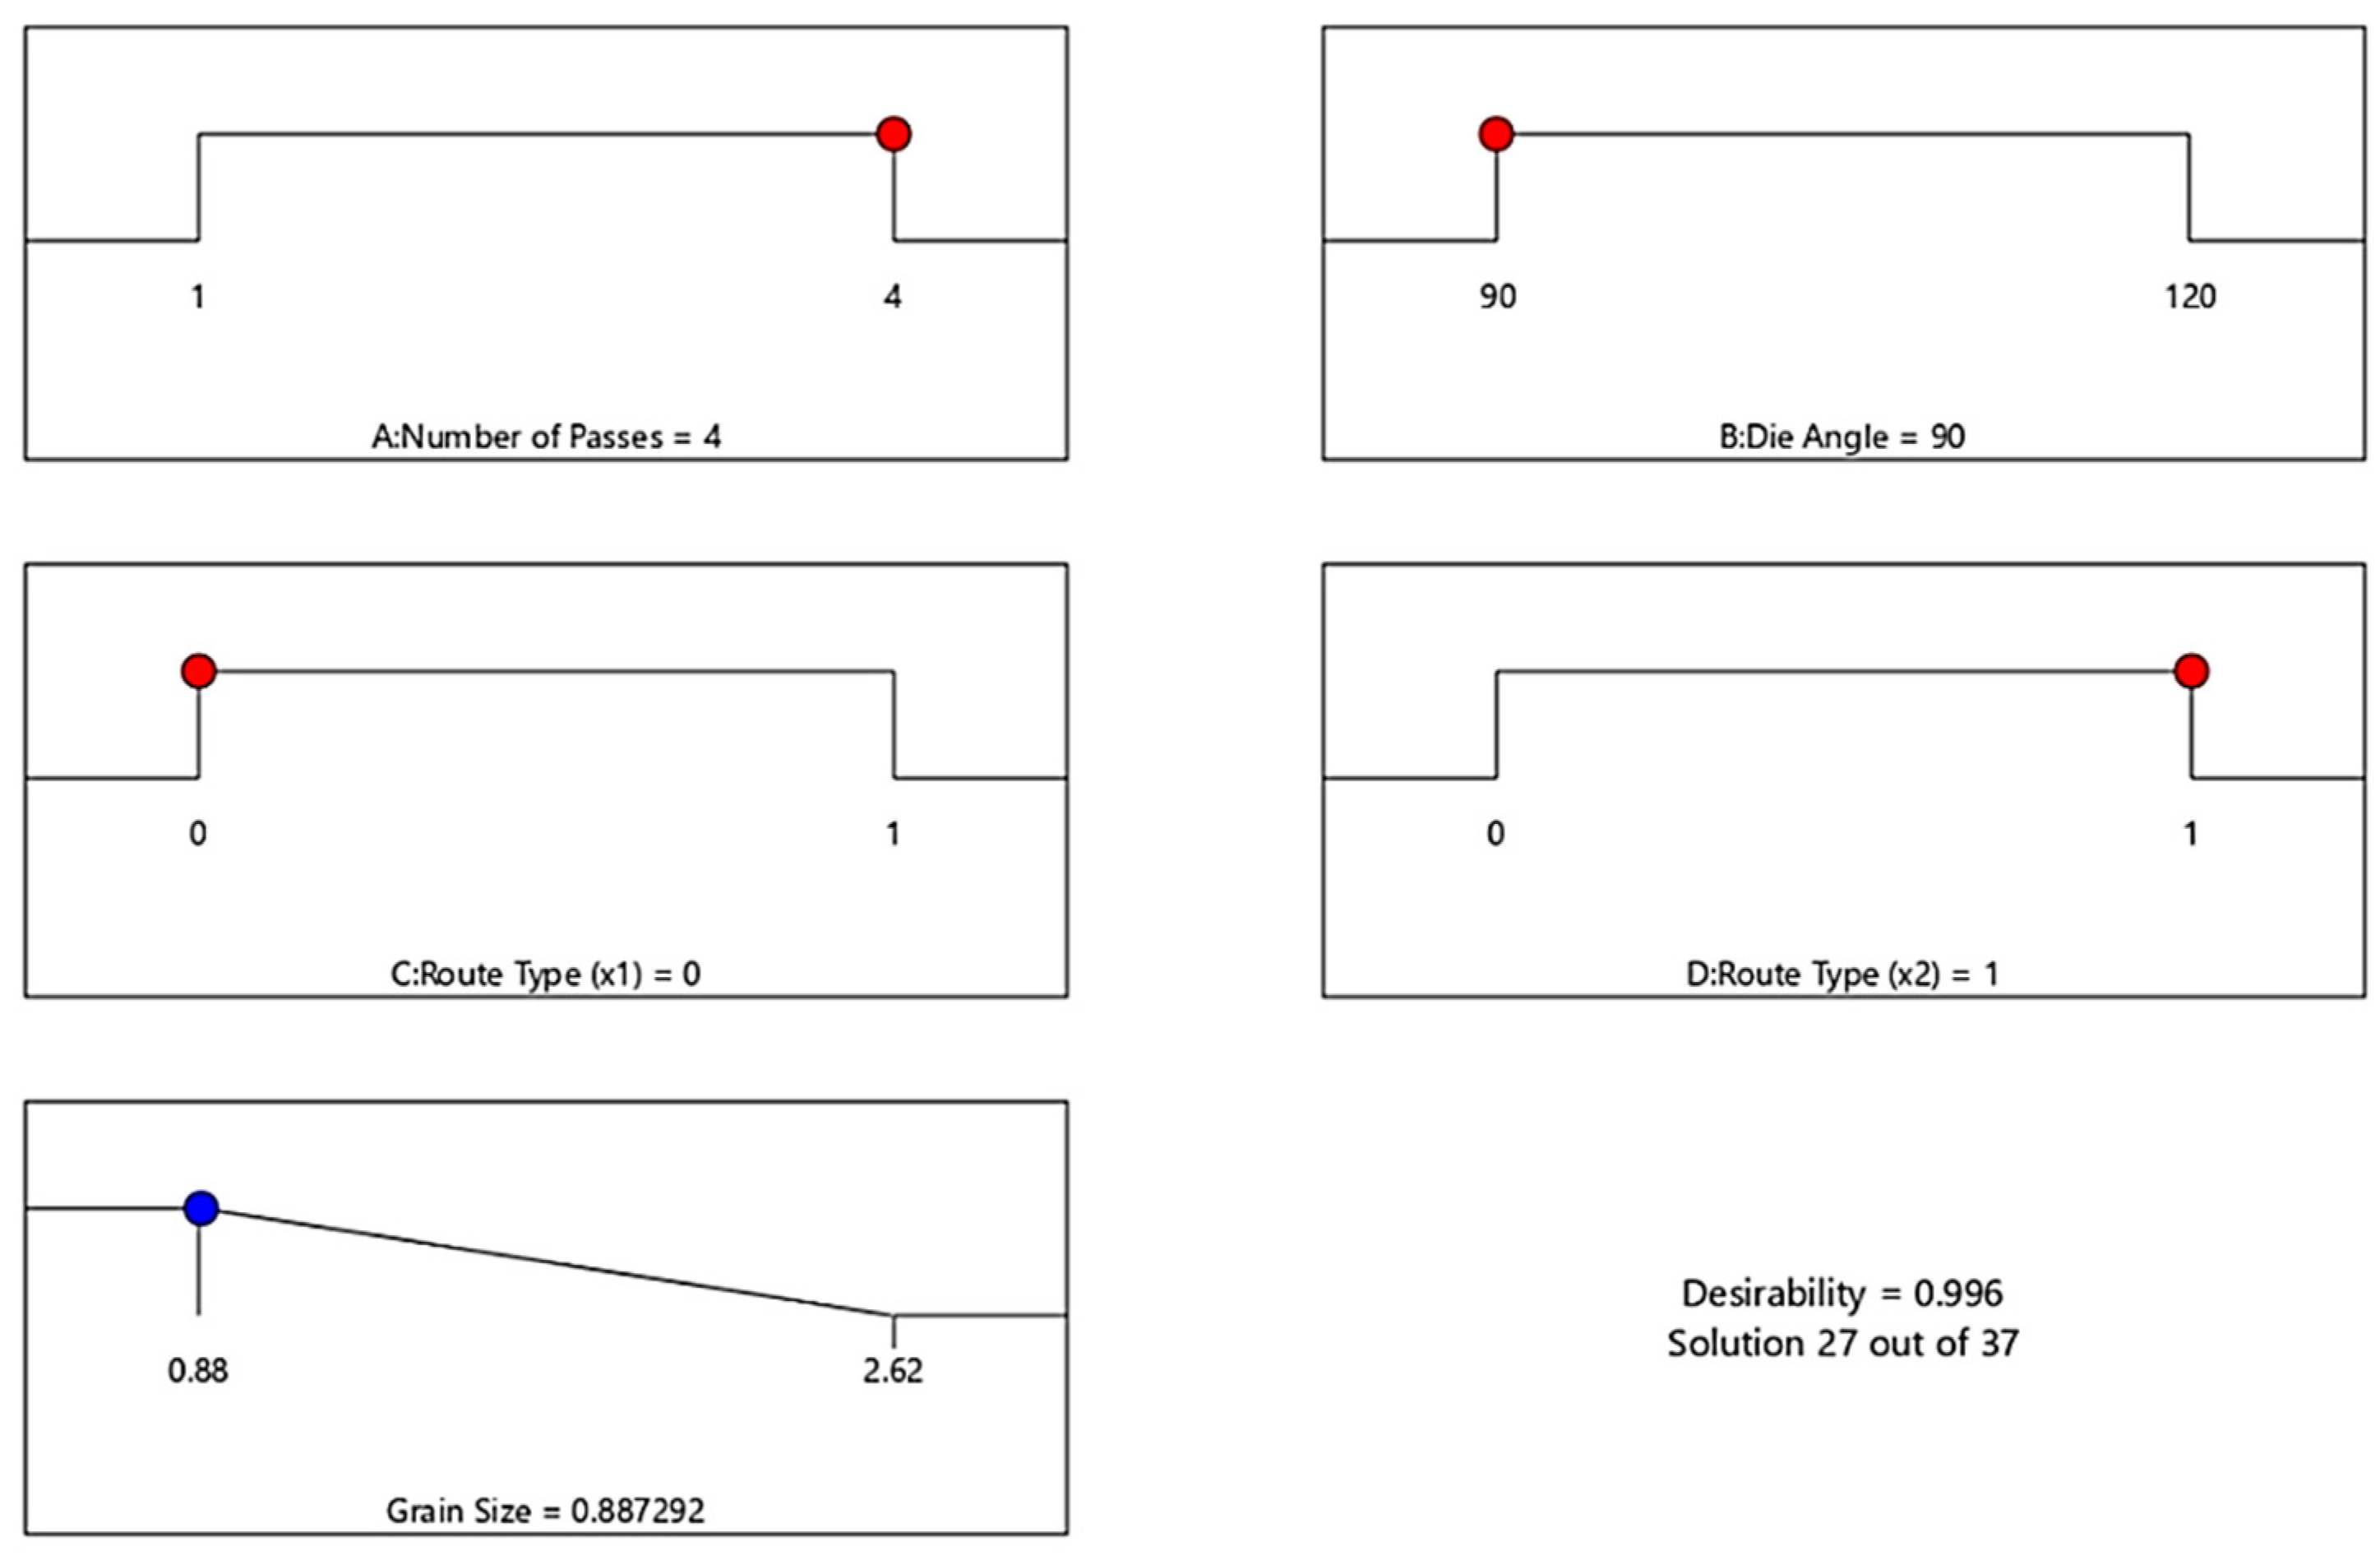
  • ECAP parameters of four passes, ϕ = 90° and route Bc produce the most significant grain refinement.
  • 4-Bc experienced a significant reduction in the grain size by 86% compared to the as-annealed counterparts.
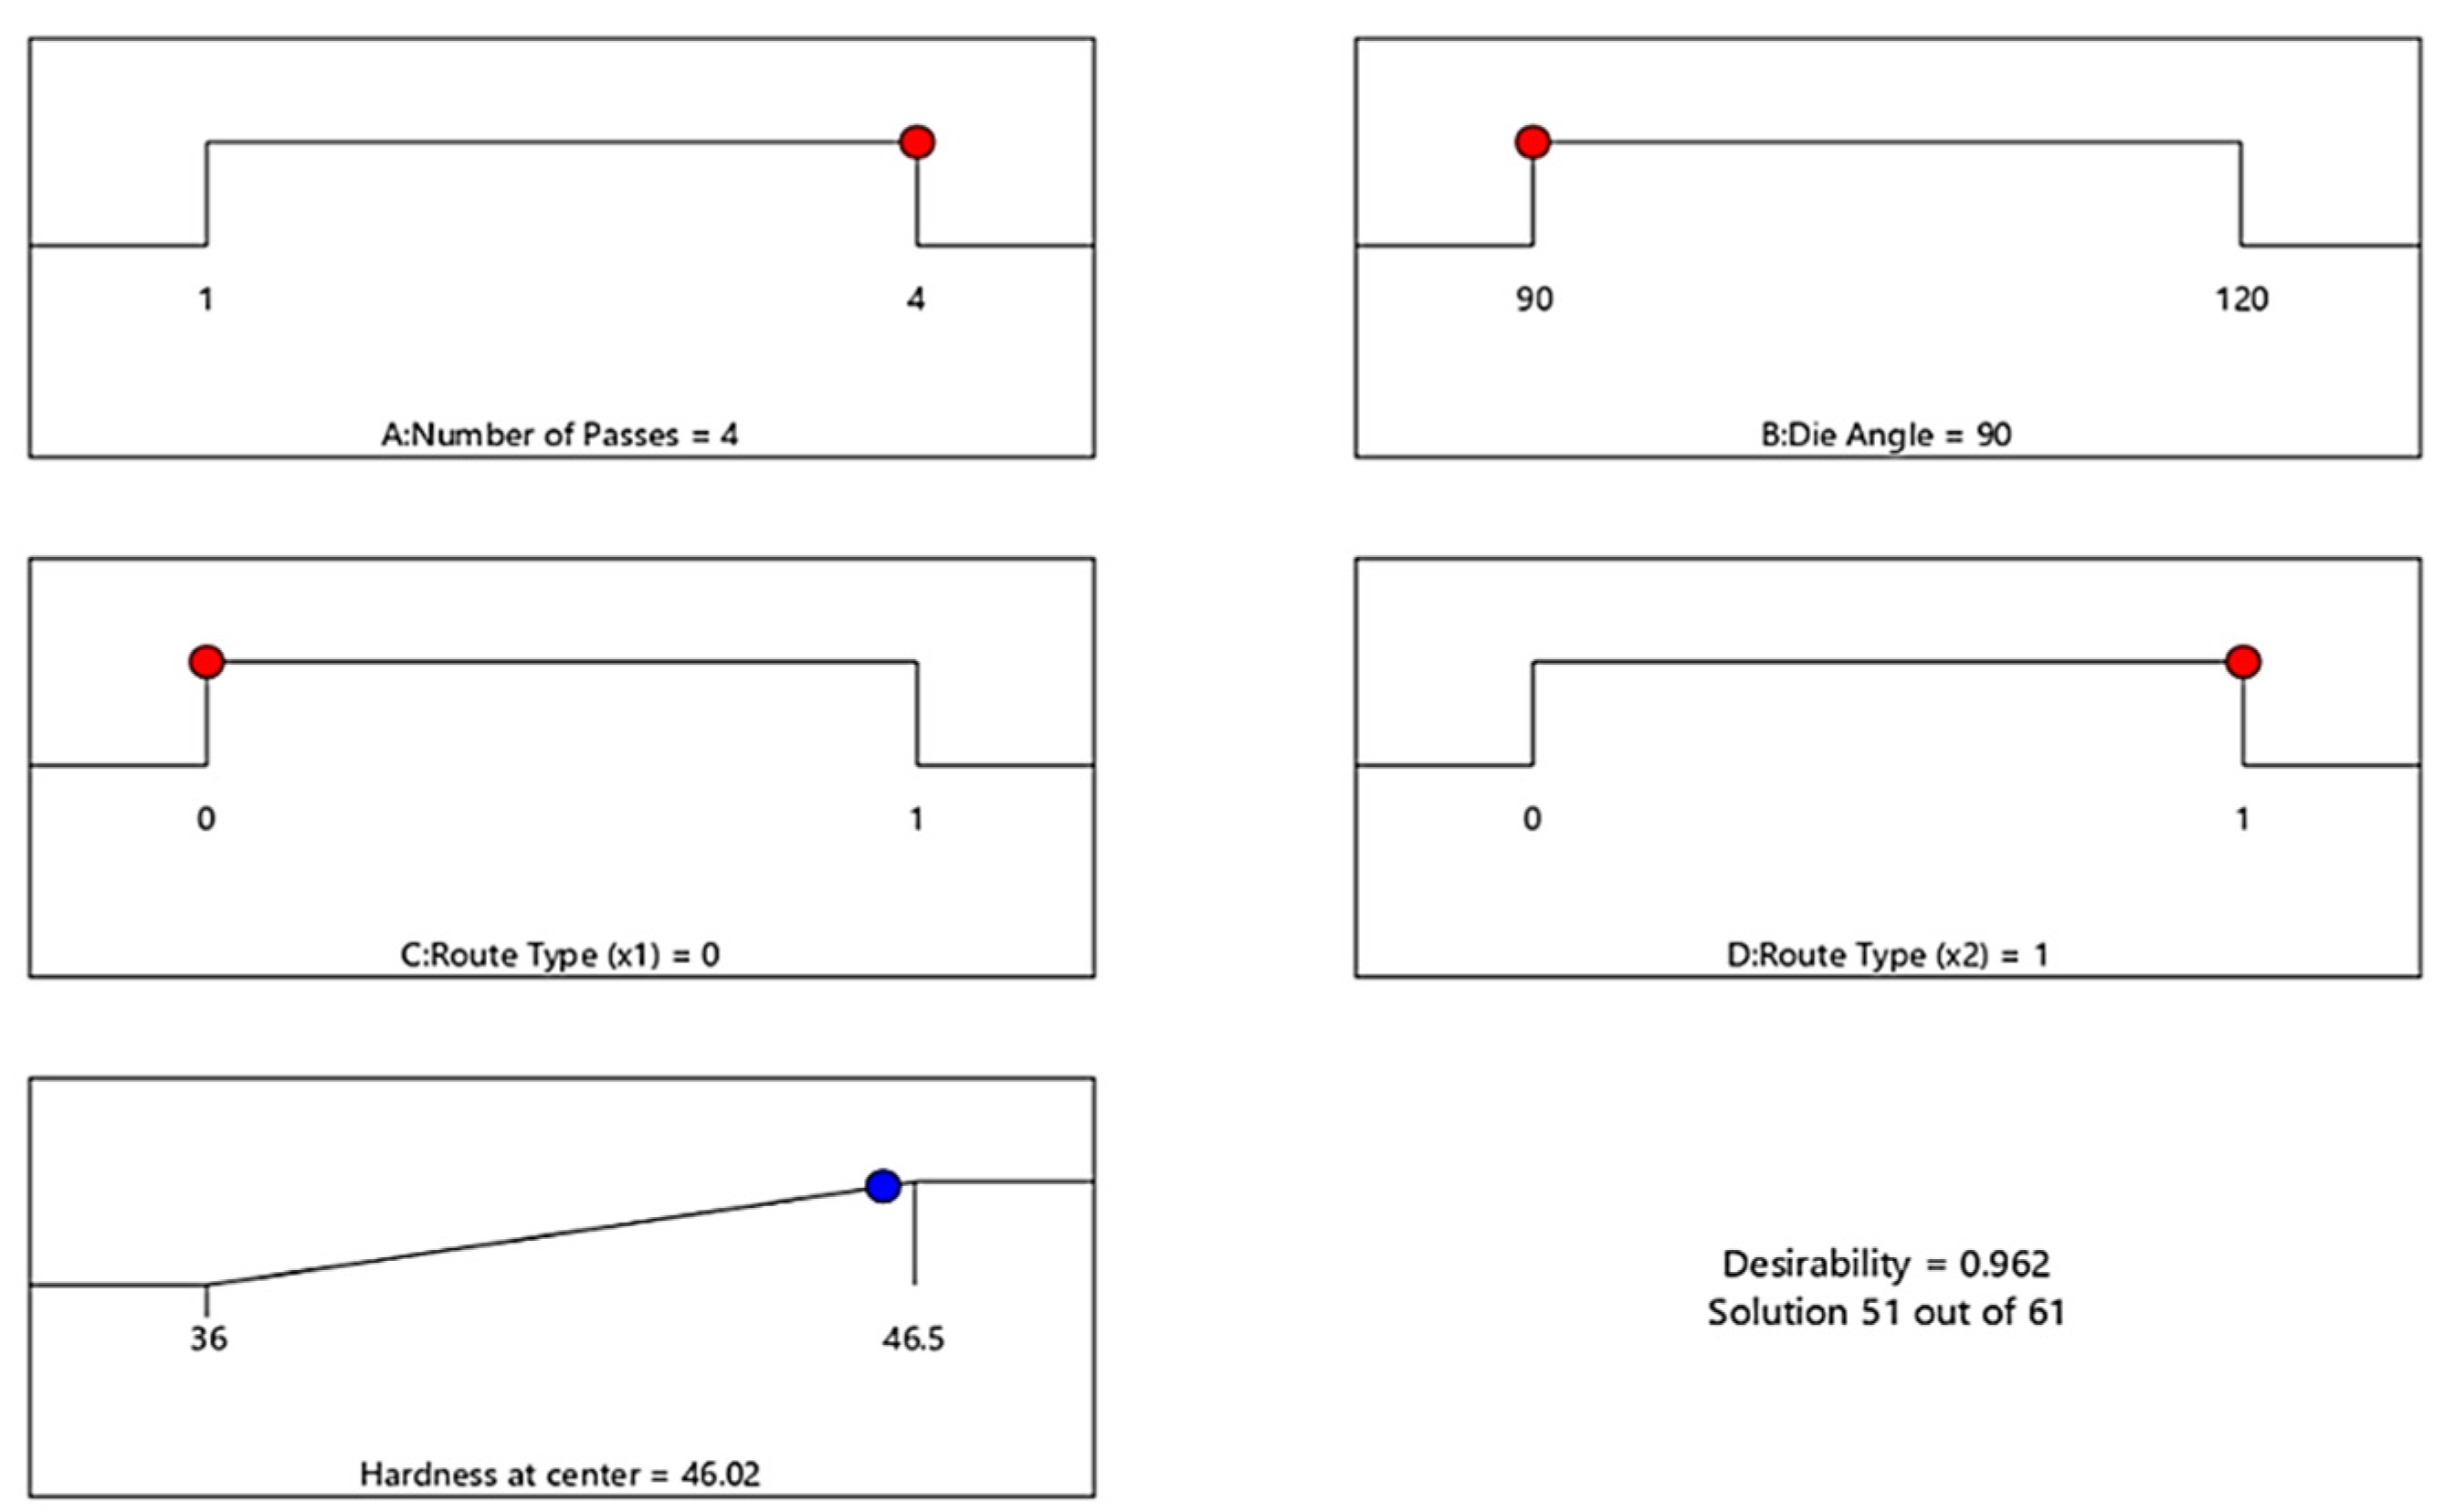
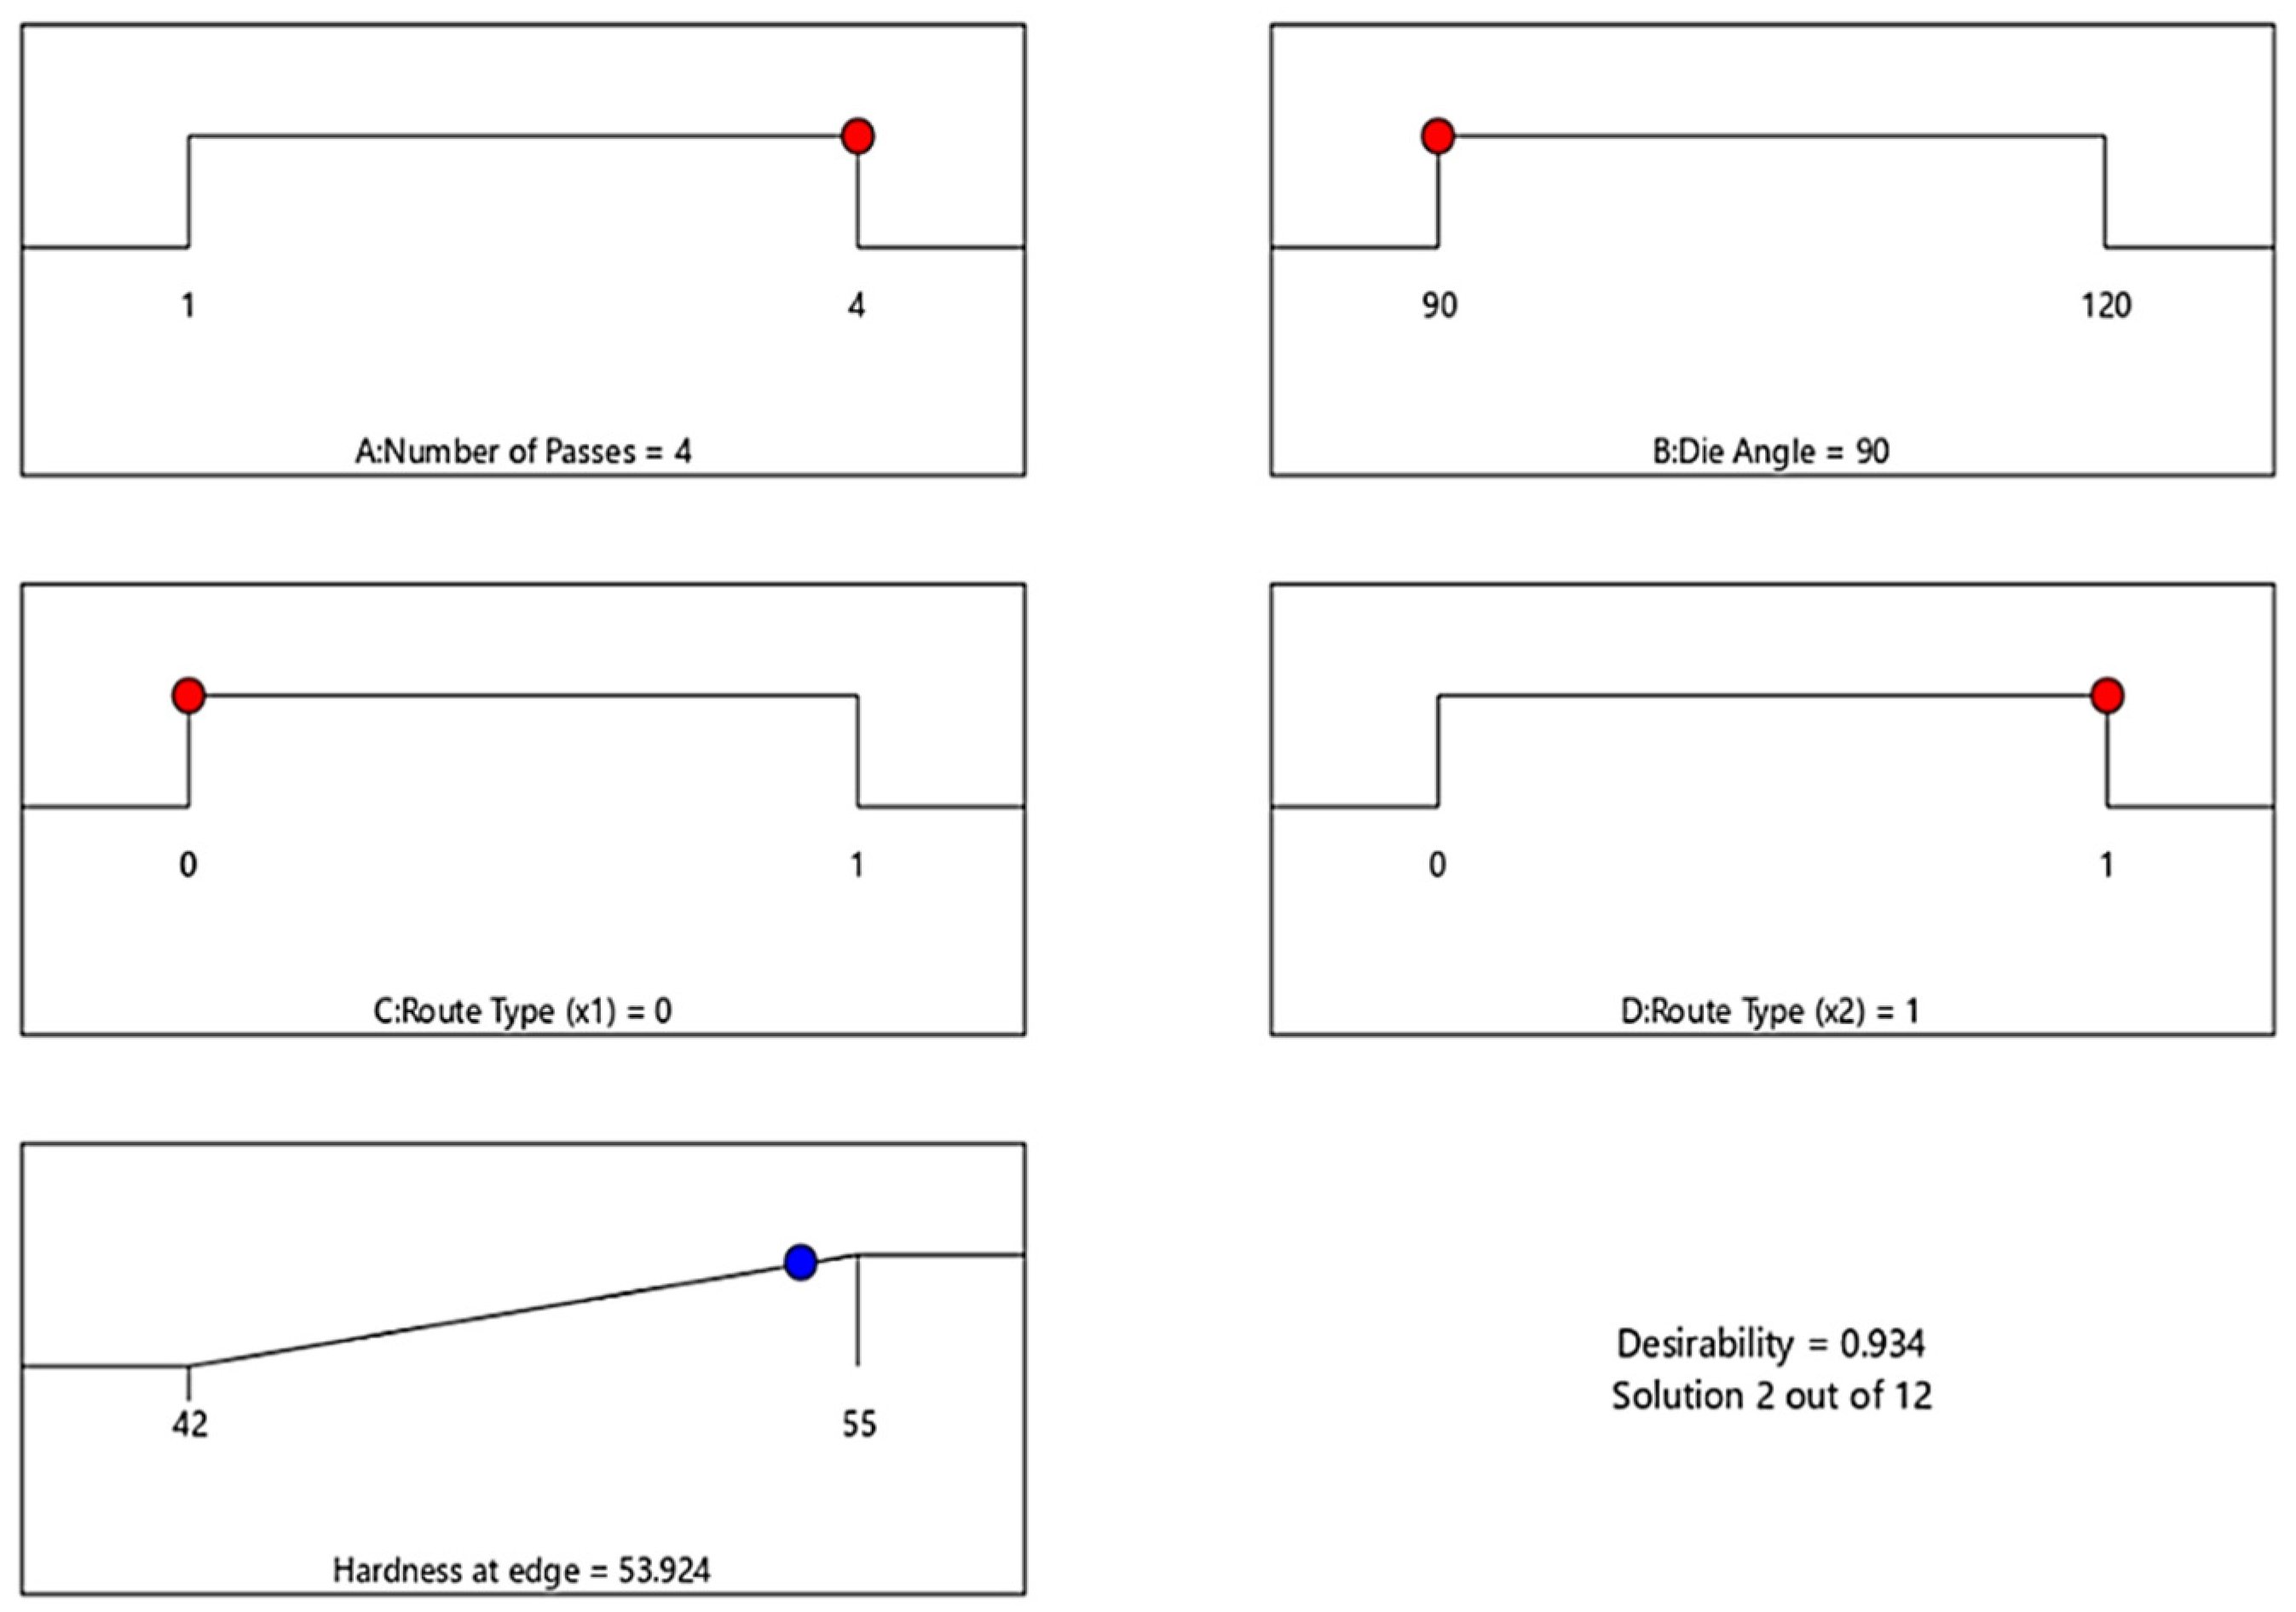
  • ECAP parameters of four passes, ϕ = 90° and route Bc resulted in the best Vicker’s microhardness values at both the central and the peripheral regions.
  • 4-Bc processing through the 90° die angle recorded a significant HV increase at the edge and central areas by 112% and 78%, respectively, compared to the as-annealed counterpart.
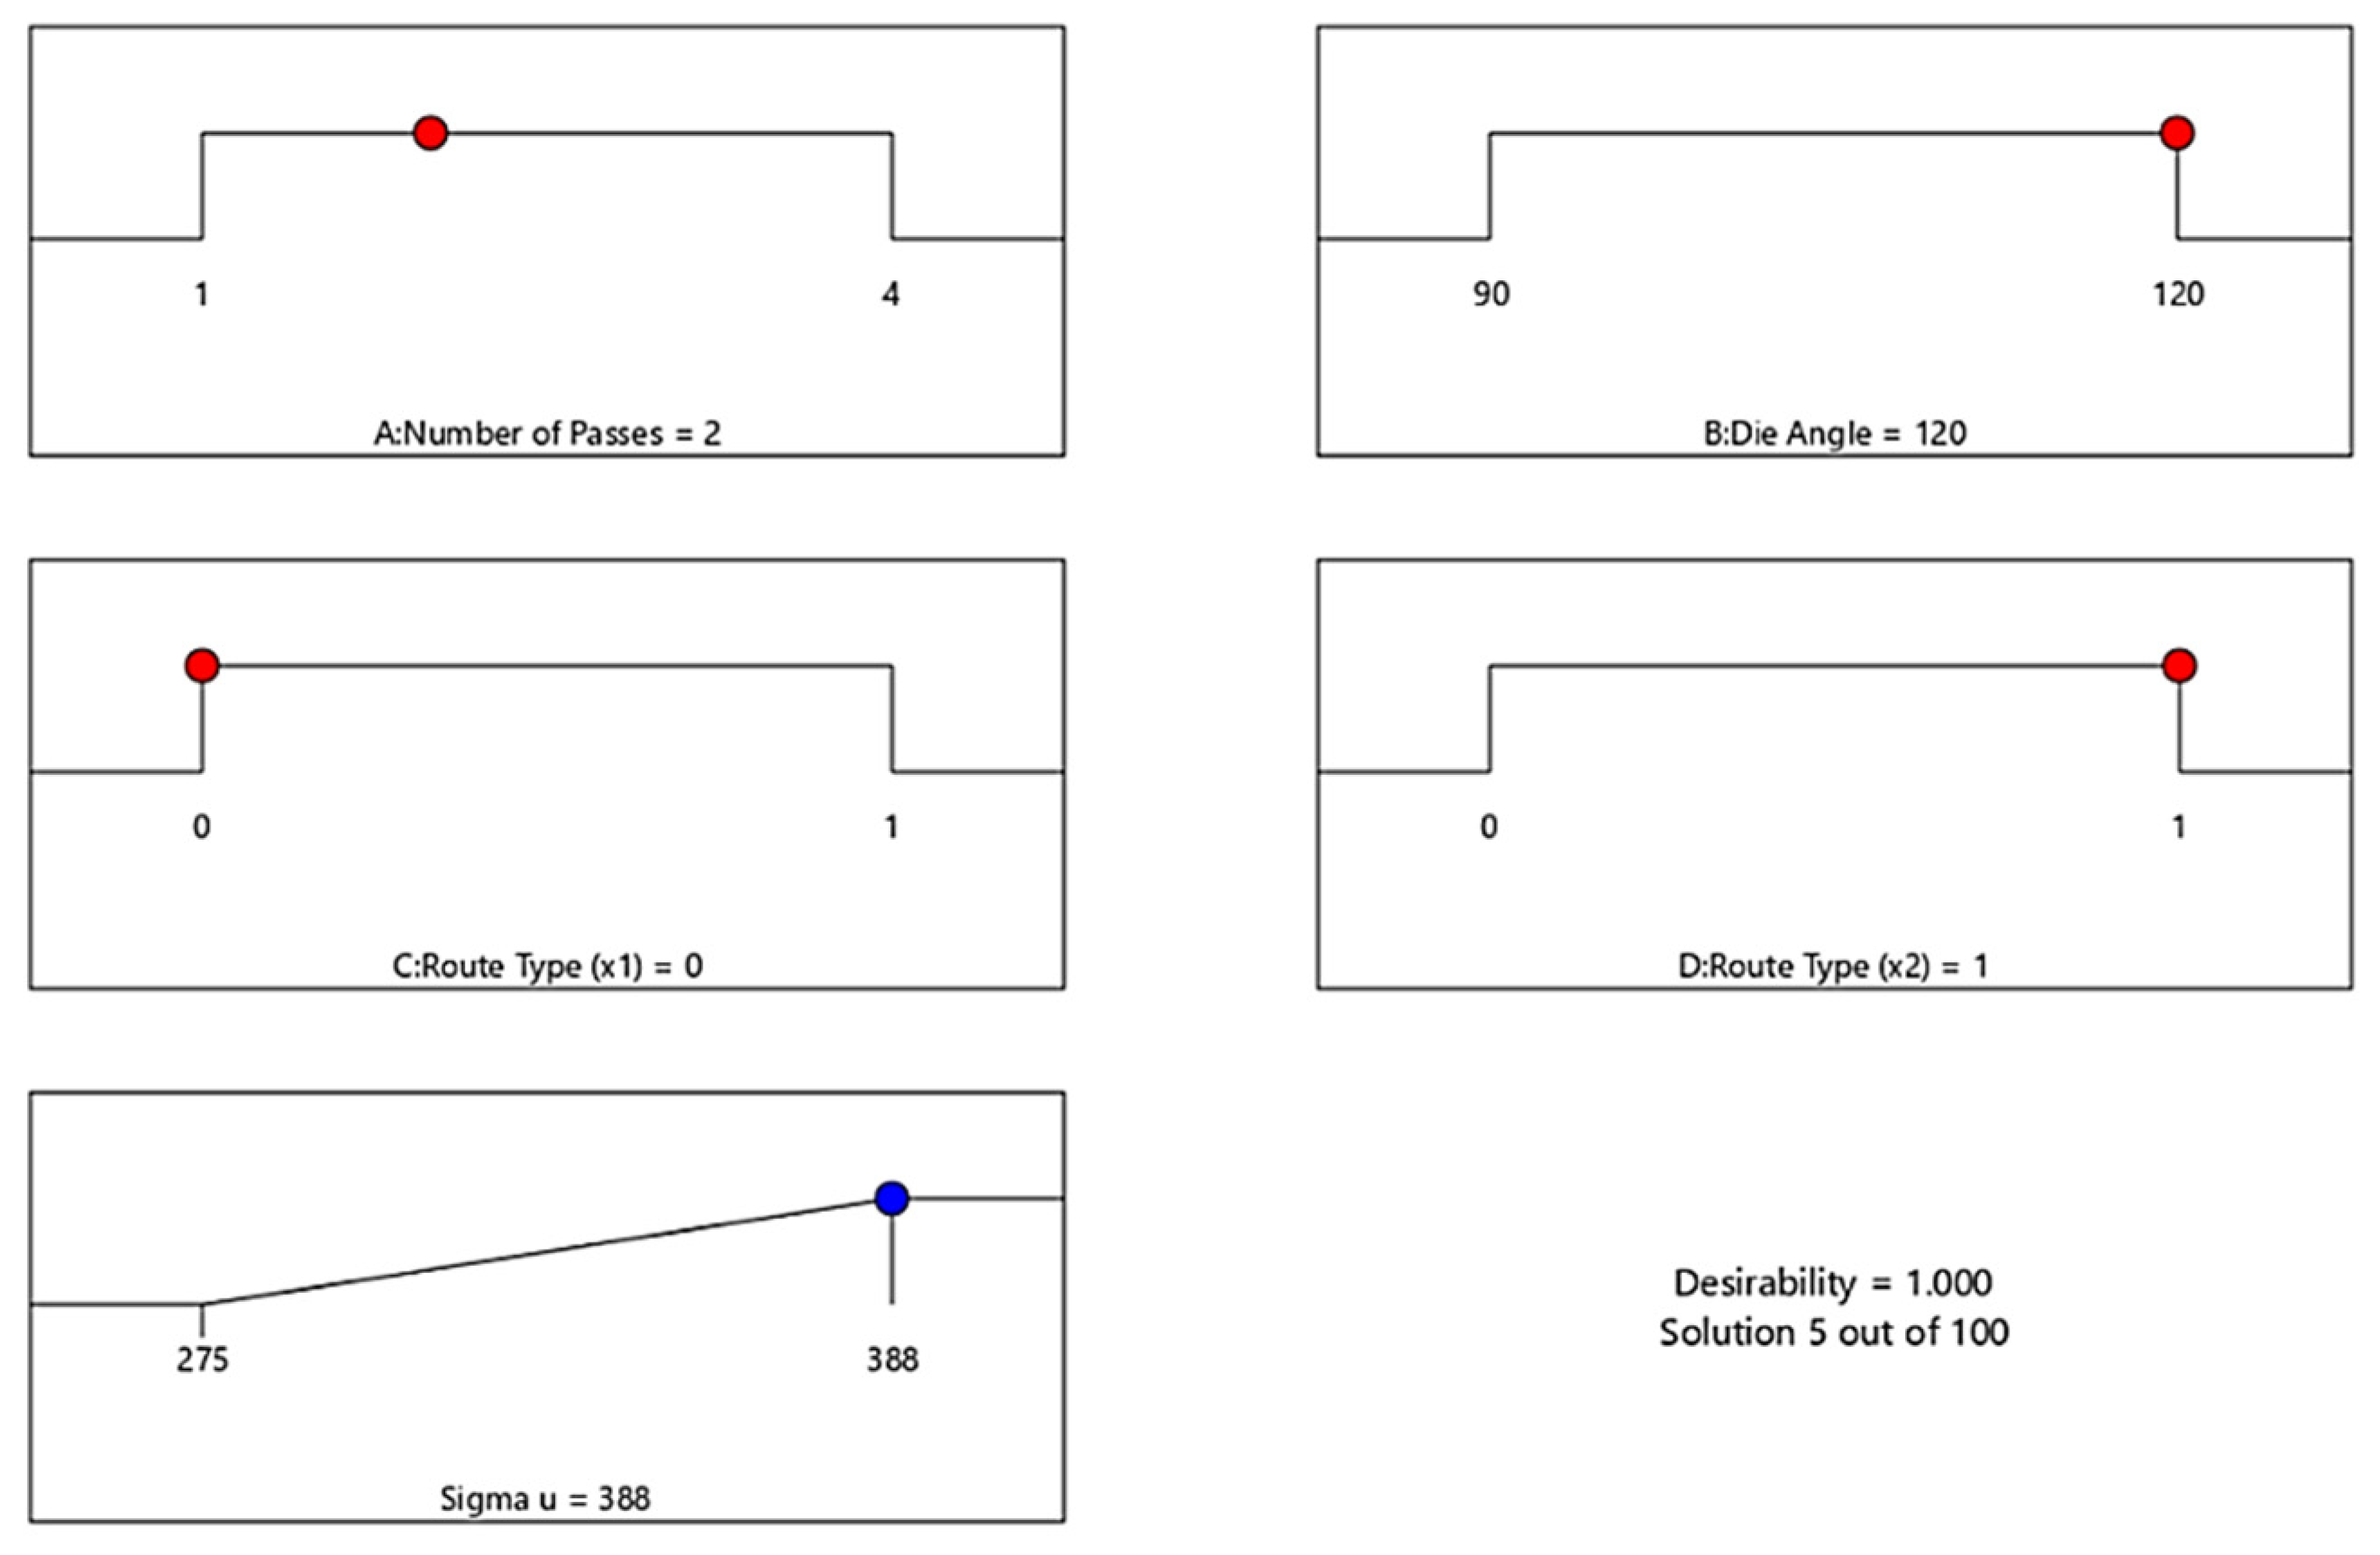
  • ECAP parameters of two passes, ϕ = 120° and route Bc resulted in the highest ultimate tensile strength.
  • ECAP parameters of four passes, ϕ = 90° showed the most enhancement in the ductility at fracture of the Mg billets.

Author Contributions

Conceptualization, A.I.A., W.H.E.-G. and M.O.A.; methodology, A.I.A., W.H.E.-G., H.A.D. and M.O.A.; validation A.I.A., S.E., H.K., S.E.S., M.O.A., H.A.D. and W.H.E.-G. formal analysis, S.E., H.K., S.E.S. and H.A.D.; investigation, A.I.A., W.H.E.-G. and M.O.A.; data curation, S.E., H.K., S.E.S. and H.A.D., writing—original draft preparation S.E.; H.K. and S.E.S.; writing—review and editing, A.I.A. and W.H.E.-G. project administration, A.I.A. and W.H.E.-G. All authors have read and agreed to the published version of the manuscript.

Funding

This research received no external funding.

Institutional Review Board Statement

Not applicable.

Informed Consent Statement

Not applicable.

Data Availability Statement

All the raw data supporting the conclusion of this paper were provided by the authors.

Acknowledgments

Researchers would like to thank the Deanship of Scientific Research, Qassim University, for funding publication of this project.

Conflicts of Interest

The authors declare no conflict of interest.

Nomenclature

ECAPequal channel angular pressing
RSMresponse surface methodology
ANOVAanalysis of variance
HCPhexagonal close-packed
SPDsevere plastic deformation
UFGultra-fine grain
ε e q the equivalent strain
ϕecap die angle
Ψouter corner angle
Nnumber of passes
FESEMfield emission scanning electron microscope
EBSDElectron back-scatter diffraction
1P and 4Pone pass and 4 passes
AAas-annealed
IPFinverse pole figure
Hvvicker’s microhardness
CCDcentral composite design
DFdesirability function
GAgenetic algorithm
FDMfused deposition modeling
GA-ANNgenetic algorithm-artificial neural network
GA-RSMgenetic algorithm-response surface methodology
GA-ANFISgenetic algorithm-adaptive neuro fuzzy interface system
GRgrain size
HChardness measurement at center
HEhardness measurement at edge
σuultimate tensile strength
Dductility
X1 and X2dummy variables
R2regression coefficient
S/Nsignal to noise

Appendix A

Table A1. Design of experiment of ECAP parameters and their response.
RunECAP ParametersResponse
ABCGrain Size
GR
(μm)
HardnessTensile Strength
NφRoute TypeHE
(HV)
HC
(HV)
σu
(MPa)
D
(%)
11120A2.62423627833.5
22120A2.3346.63728238
3490C1.2251.24332733
42120C2.4645.636.428038.5
5290Bc1.385145.532036.5
62120A2.384637.829038
7290Bc1.43514431837
84120Bc1.89514231939
94120C1.9950.240.531539.5
102120Bc2.144738.538837
111120A2.5443.236.527534
12490Bc0.88554634028
13190A1.95483930838.5
14490A0.9852.546.533031
15490A1.0252.844.632832
16190A1.864640.531137

References

  1. Witte, F. The history of biodegradable magnesium implants: A review. Acta Biomater. 2010, 6, 1680–1692. [Google Scholar] [CrossRef] [PubMed]
  2. Mostaed, E.; Vedani, M.; Hashempour, M.; Bestetti, M. Influence of ECAP process on mechanical and corrosion properties of pure Mg and ZK60 magnesium alloy for biodegradable stent applications. Biomatter 2014, 4, e28283. [Google Scholar] [CrossRef] [Green Version]
  3. Amani, S.; Faraji, G. Recrystallization and mechanical properties of WE43 magnesium alloy processed via cyclic expansion extrusion. Int. J. Miner. Met. Mater. 2018, 25, 672–681. [Google Scholar] [CrossRef]
  4. Mordike, B.L.; Ebert, T. Magnesium: Properties—Applications—Potential. Mater. Sci. Eng. A 2001, 302, 37–45. [Google Scholar] [CrossRef]
  5. Shapiro, A.E. Magnesium and magnesium alloys. In ASM Speciality Handbook; ASM International: Almere, The Netherlands, 1999; pp. 106–118. [Google Scholar]
  6. Kainer, K.U. Magnesium Alloys and Their Applications; Wiley-VCH Verlag GmbH: Hoboken, NJ, USA, 2000. [Google Scholar]
  7. Gupta, M.; Sharon, N.M.L. Magnesium alloys. In Magnesium, Magnesium Alloys, and Magnesium Composites; John Wiley & Sons, Ltd: Hoboken, NJ, USA, 2011; pp. 39–85. [Google Scholar] [CrossRef]
  8. Kojima, Y. Platform Science and Technology for Advanced Magnesium Alloys. Mater. Sci. Forum 2000, 350–351, 3–18. [Google Scholar] [CrossRef]
  9. Kuwahara, H.; Al-Abdullat, Y.; Ohta, M.; Tsutsumi, S.; Ikeuchi, K.; Mazaki, N.; Aizawa, T. Surface Reaction of Magnesium in Hank’s Solutions. Mater. Sci. Forum 2000, 350–351, 349–358. [Google Scholar] [CrossRef]
  10. Kim, J.J.; Han, D.S. Recent Development and Applications of Magnesium Alloys in the Hyundai and Kia Motors Corporation. Mater. Trans. 2008, 49, 894–897. [Google Scholar] [CrossRef] [Green Version]
  11. Agnew, S.R.; Duygulu, Ö. Plastic anisotropy and the role of non-basal slip in magnesium alloy AZ31B. Int. J. Plast. 2005, 21, 1161–1193. [Google Scholar] [CrossRef]
  12. Agnew, S.R. Deformation mechanisms of magnesium alloys. In Advances in Wrought Magnesium Alloys; Bettles, C., Barnett, M., Eds.; Woodhead Publishing: Sawston, UK, 2012; pp. 63–104. [Google Scholar] [CrossRef]
  13. Chulist, R.; Czaja, P.; Tokarski, T.; Kuksgauzen, I.; Chumlyakov, Y. Orthogonal shear process in Ni-Mn-Sn single crystal. Int. J. Plast. 2019, 114, 63–71. [Google Scholar] [CrossRef]
  14. Sułkowski, B.; Chulist, R. Twin-induced stability and mechanical properties of pure magnesium. Mater. Sci. Eng. A 2019, 749, 89–95. [Google Scholar] [CrossRef]
  15. Hadadzadeh, A.; Wells, M.A. Analysis of the hot deformation of ZK60 magnesium alloy. J. Magnes. Alloy. 2017, 5, 369–387. [Google Scholar] [CrossRef]
  16. Rao, K.P.; Prasad, Y.V.R.K.; Dzwończyk, J.; Hort, N.; Kainer, K.U. Hot Deformation Mechanisms in AZ31 Magnesium Alloy Extruded at Different Temperatures: Impact of Texture. Metals 2012, 2, 292–312. [Google Scholar] [CrossRef] [Green Version]
  17. Al-Samman, T.; Molodov, K.D.; Molodov, D.A.; Gottstein, G.; Suwas, S. Softening and dynamic recrystallization in magnesium single crystals during c-axis compression. Acta Mater. 2012, 60, 537–545. [Google Scholar] [CrossRef]
  18. Wang, H.; Yu, Z.; Zhang, L.; Liu, C.; Zha, M.; Wang, C.; Jiang, Q. Achieving high strength and high ductility in magnesium alloy using hard-plate rolling (HPR) process. Sci. Rep. 2015, 5, 17100. [Google Scholar] [CrossRef] [PubMed] [Green Version]
  19. Xu, W.; Birbilis, N.; Sha, G.; Wang, Y.; Daniels, J.; Xiao, Y.; Ferry, M. A high-specific-strength and corrosion-resistant magnesium alloy. Nat. Mater. 2015, 14, 1229–1235. [Google Scholar] [CrossRef]
  20. Alateyah, A.; Aljohani, T.; Alawad, M.; Elkatatny, S.; El-Garaihy, W. Improving the Corrosion Behavior of Biodegradable AM60 Alloy through Plasma Electrolytic Oxidation. Metals 2021, 11, 953. [Google Scholar] [CrossRef]
  21. Wang, L.-P.; Chen, T.; Jiang, W.-Y.; Feng, Y.-C.; Cao, G.-J.; Zhu, Y. Microstructure and mechanical properties of AM60B magnesium alloy prepared by cyclic extrusion compression. Trans. Nonferrous Met. Soc. China 2013, 23, 3200–3205. [Google Scholar] [CrossRef]
  22. Chen, X.; Li, L.; Chen, W.; Zhang, W.; Zhang, L.; Qiao, Y.; Wang, E. Fine-grained structure and recrystallization at ambient temperature for pure magnesium subjected to large cold plastic deformation. Mater. Sci. Eng. A 2017, 708, 351–359. [Google Scholar] [CrossRef]
  23. Nassef, A.; Samy, S.; El-Garaihy, W.H. Enhancement of mechanical properties for Al-Mg-Si alloy using equal channel angular pressing. Int. J. Chem. Nucl. Mater. Metall. Eng. 2015, 9, 131–136. [Google Scholar]
  24. El-Garaihy, W.H.; Alateyah, A.I.; Alawad, M.O.; Aljohani, T.A. Improving the corrosion behavior and mechanical properties of biodegradable Mg-Zn-Zr alloys through ECAP for usage in biomedical applications. In The Minerals, Metals & Materials Series; Magnesium Technology; Springer: Berlin/Heidelberg, Germany, 2022; pp. 259–269. [Google Scholar] [CrossRef]
  25. Alateyah, A.; Alharbi, M.; El-Hafez, H.A.; El-Garaihy, W. The Effect of Equal-Channel Angular Pressing Processing on Microstructural Evolution, Hardness Homogeneity, and Mechanical Properties of Pure Aluminum. SAE Int. J. Mater. Manuf. 2021, 14, 113–125. [Google Scholar] [CrossRef]
  26. Alateyah, A.; Aljohani, T.; Alawad, M.; El-Hafez, H.; Almutairi, A.; Alharbi, E.; Alhamada, R.; El-Garaihy, B.; El-Garaihy, W. Improved Corrosion Behavior of AZ31 Alloy through ECAP Processing. Metals 2021, 11, 363. [Google Scholar] [CrossRef]
  27. Alateyah, A.; Ahmed, M.; Zedan, Y.; El-Hafez, H.; Alawad, M.; El-Garaihy, W. Experimental and Numerical Investigation of the ECAP Processed Copper: Microstructural Evolution, Crystallographic Texture and Hardness Homogeneity. Metals 2021, 11, 607. [Google Scholar] [CrossRef]
  28. El-Shenawy, M.; Ahmed, M.; Nassef, A.; El-Hadek, M.; Alzahrani, B.; Zedan, Y.; El-Garaihy, W. Effect of ECAP on the Plastic Strain Homogeneity, Microstructural Evolution, Crystallographic Texture and Mechanical Properties of AA2xxx Aluminum Alloy. Metals 2021, 11, 938. [Google Scholar] [CrossRef]
  29. Shuai, G.; Li, Z.; Zhang, D.; Tong, Y.; Li, L. The mechanical property and electrical conductivity evolution of Al–Fe alloy between room temperature and elevated temperature ECAP. Vacuum 2021, 183, 109813. [Google Scholar] [CrossRef]
  30. Alawadhi, M.Y.; Sabbaghianrad, S.; Huang, Y.; Langdon, T.G. Evaluating the paradox of strength and ductility in ultrafine-grained oxygen-free copper processed by ECAP at room temperature. Mater. Sci. Eng. A 2021, 802, 140546. [Google Scholar] [CrossRef]
  31. Segal, V. Materials processing by simple shear. Mater. Sci. Eng. A 1995, 197, 157–164. [Google Scholar] [CrossRef]
  32. Iwahashi, Y.; Wang, J.T.; Horita, Z.; Nemoto, M.; Langdon, T.G. Principle of equal-channel angular pressing for the processing of ultra-fine grained materials. Scr. Mater. 1996, 35, 143–146. [Google Scholar] [CrossRef]
  33. Naik, G.M.; Narendranath, S.; Kumar, S.S.S. Effect of ECAP Die Angles on Microstructure Mechanical Properties and Corrosion Behavior of AZ80 Mg Alloy. J. Mater. Eng. Perform. 2019, 28, 2610–2619. [Google Scholar] [CrossRef]
  34. Shaeri, M.H.; Salehi, M.T.; Seyyedein, S.; Abutalebi, M.; Park, J. Characterization of microstructure and deformation texture during equal channel Angular pressing of Al–Zn–Mg–Cu alloy. J. Alloy. Compd. 2013, 576, 350–357. [Google Scholar] [CrossRef]
  35. Lei, W.; Zhang, H. Analysis of microstructural evolution and compressive properties for pure Mg after room-temperature ECAP. Mater. Lett. 2020, 271, 127781. [Google Scholar] [CrossRef]
  36. Venkatachalam, P.; Kumar, S.R.; Ravisankar, B.; Paul, V.T.; Vijayalakshmi, M. Effect of processing routes on microstructure and mechanical properties of 2014 Al alloy processed by equal channel angular pressing. Trans. Nonferrous Met. Soc. China 2010, 20, 1822–1828. [Google Scholar] [CrossRef]
  37. Alateyah, A.; Ahmed, M.M.; Alawad, M.O.; Elkatatny, S.; Zedan, Y.; Nassef, A.; El-Garaihy, W. Effect of ECAP die angle on the strain homogeneity, microstructural evolution, crystallographic texture and mechanical properties of pure magnesium: Numerical simulation and experimental approach. J. Mater. Res. Technol. 2022, 17, 1491–1511. [Google Scholar] [CrossRef]
  38. Ghaedi, M.; Azad, F.N.; Dashtian, K.; Hajati, S.; Goudarzi, A.; Soylak, M. Central composite design and genetic algorithm applied for the optimization of ultrasonic-assisted removal of malachite green by ZnO Nanorod-loaded activated carbon. Spectrochim. Acta Part A Mol. Biomol. Spectrosc. 2016, 167, 157–164. [Google Scholar] [CrossRef] [PubMed]
  39. Daryadel, M. Study on Equal Channel Angular Pressing Process of AA7075 with Copper Casing by Finite Element-response Surface Couple Method. Int. J. Eng. 2020, 33, 2538–2548. [Google Scholar]
  40. Abbas, A.T.; Taha, M.A.; Ragab, A.E.; El-Danaf, E.A.; El Aal, M.I.A. Effect of Equal Channel Angular Pressing on the Surface Roughness of Solid State Recycled Aluminum Alloy 6061 Chips. Adv. Mater. Sci. Eng. 2017, 2017, 5131403. [Google Scholar] [CrossRef] [Green Version]
  41. Deshwal, S.; Kumar, A.; Chhabra, D. Exercising hybrid statistical tools GA-RSM, GA-ANN and GA-ANFIS to optimize FDM process parameters for tensile strength improvement. CIRP J. Manuf. Sci. Technol. 2020, 31, 189–199. [Google Scholar] [CrossRef]
  42. Kilickap, E.; Huseyinoglu, M.; Yardimeden, A. Optimization of drilling parameters on surface roughness in drilling of AISI 1045 using response surface methodology and genetic algorithm. Int. J. Adv. Manuf. Technol. 2011, 52, 79–88. [Google Scholar] [CrossRef]
  43. Dadrasi, A.; Fooladpanjeh, S.; Gharahbagh, A.A. Interactions between HA/GO/epoxy resin nanocomposites: Optimization, modeling and mechanical performance using central composite design and genetic algorithm. J. Braz. Soc. Mech. Sci. Eng. 2019, 41, 63. [Google Scholar] [CrossRef]
  44. Hazir, E.; Ozcan, T. Response Surface Methodology Integrated with Desirability Function and Genetic Algorithm Approach for the Optimization of CNC Machining Parameters. Arab. J. Sci. Eng. 2019, 44, 2795–2809. [Google Scholar] [CrossRef]
  45. Munusamy, T.D.; Chin, S.Y.; Khan, M.R. Photoreforming hydrogen production by carbon doped exfoliated g-C3N4: Optimization using design expert®software. Mater. Today Proc. 2021, 57, 1162–1168. [Google Scholar] [CrossRef]
  46. Rezić, I. Prediction of the surface tension of surfactant mixtures for detergent formulation using Design Expert software. Mon. Für Chem.-Chem. Mon. 2011, 142, 1219–1225. [Google Scholar] [CrossRef]
  47. Makki, A.A.; Stewart, R.A.; Panuwatwanich, K.; Beal, C. Development of a domestic water end use consumption forecasting model for South-East Queensland, Australia. In Proceedings of the 6th IWA Specialist Conference on Efficient Use and Management of Water, Dead Sea, Jordan, 29 March–2 April 2011. [Google Scholar]
  48. Santhosh, A.J.; Tura, A.D.; Jiregna, I.T.; Gemechu, W.F.; Ashok, N.; Ponnusamy, M. Optimization of CNC turning parameters using face centred CCD approach in RSM and ANN-genetic algorithm for AISI 4340 alloy steel. Results Eng. 2021, 11, 100251. [Google Scholar] [CrossRef]
  49. Hughes, D.A.; Hansen, N. High angle boundaries formed by grain subdivision mechanisms. Acta Mater. 1997, 45, 3871–3886. [Google Scholar] [CrossRef]
  50. Tolaminejad, B.; Dehghani, K. Microstructural characterization and mechanical properties of nanostructured AA1070 aluminum after equal channel angular extrusion. Mater. Des. 2012, 34, 285–292. [Google Scholar] [CrossRef]
  51. Almenaif, O.; Alhumaydani, Y.; Alnafisah, M.; Aldhalaan, M.; Alateyah, A.; El-Garaihy, W. A Computational Investigation into the Effect of Equal Channel Angular Processing on the Mechanical Properties of Severely Deformed ZK 60 Alloy Validated by Experiments. Am. J. Eng. Appl. Sci. 2020, 13, 296–310. [Google Scholar] [CrossRef]
  52. El-Garaihy, W.; Rassoul, E.S.M.; Salem, H.G. Consolidation of High Performance AA6061 and AA6061-SiCp Composite Processed by High Pressure Torsion. Mater. Sci. Forum 2014, 783–786, 2623–2628. [Google Scholar] [CrossRef]
  53. Salem, H.G.; El-Garaihy, W.H.; Al-Rassoul, E.S.M. Influence of high pressure torsion on the consolidation behavior and mechanical properties of AA6061-SiCp composite powders. In Supplemental Proceedings; John Wiley & Sons, Ltd.: Hoboken, NJ, USA, 2012; pp. 553–560. [Google Scholar] [CrossRef]
  54. El-Garaihy, W.H.; Fouad, D.M.; Salem, H.G. Multi-channel Spiral Twist Extrusion (MCSTE): A Novel Severe Plastic Deformation Technique for Grain Refinement. Met. Mater. Trans. A 2018, 49, 2854–2864. [Google Scholar] [CrossRef]
  55. Fouad, D.; Moataz, A.; El-Garaihy, W.; Salem, H. Numerical and experimental analysis of multi-channel spiral twist extrusion processing of AA5083. Mater. Sci. Eng. A 2019, 764, 138216. [Google Scholar] [CrossRef]
  56. Fouad, D.M.; El-Garaihy, W.H.; Ahmed, M.M.Z.; Seleman, M.E.-S.; Salem, H.G. Influence of multi-channel spiral twist extrusion (MCSTE) processing on structural evolution, crystallographic texture and mechanical properties of AA1100. Mater. Sci. Eng. A 2018, 737, 166–175. [Google Scholar] [CrossRef]
  57. Fouad, D.M.; El-Garaihy, W.H.; Ahmed, M.M.Z.; Albaijan, I.; Seleman, M.M.E.; Salem, H.G. Grain Structure Evolution and Mechanical Properties of Multi-Channel Spiral Twist Extruded AA5083. Metals 2021, 11, 1276. [Google Scholar] [CrossRef]
  58. Cheng, W.; Tian, L.; Ma, S.; Bai, Y.; Wang, H. Influence of Equal Channel Angular Pressing Passes on the Microstructures and Tensile Properties of Mg-8Sn-6Zn-2Al Alloy. Materials 2017, 10, 708. [Google Scholar] [CrossRef] [Green Version]
  59. Fan, G.; Zheng, M.; Hu, X.; Xu, C.; Wu, K.; Golovin, I. Improved mechanical property and internal friction of pure Mg processed by ECAP. Mater. Sci. Eng. A 2012, 556, 588–594. [Google Scholar] [CrossRef]
  60. Elsanabary, S.; Kouta, H.K. Optimization of Inertia Friction Welding of Dissimilar Polymeric PA6-PVC Hollow Cylinders by Genetic Algorithm. Port-Said Eng. Res. J. 2021, 25, 91–100. [Google Scholar] [CrossRef]
  61. Dritsa, V.; Rigas, F.; Doulia, D.; Avramides, E.J.; Hatzianestis, I. Optimization of Culture Conditions for the Biodegradation of Lindane by the Polypore Fungus Ganoderma australe. Water Air Soil Pollut. 2009, 204, 19–27. [Google Scholar] [CrossRef]
  62. Gopal, M. Optimization of Machining Parameters on Temperature Rise in CNC Turning Process of Aluminium–6061 Using RSM and Genetic Algorithm. Int. J. Mod. Manuf. Technol. 2020, 12, 36–43. [Google Scholar]
  63. Asghar, A.; Raman, A.A.A.; Daud, W.M.A.W. A Comparison of Central Composite Design and Taguchi Method for Optimizing Fenton Process. Sci. World J. 2014, 2014, 869120. [Google Scholar] [CrossRef] [Green Version]
  64. Yuan, Y.; Ma, A.; Gou, X.-F.; Jiang, J.; Arhin, G.; Song, D.; Liu, H. Effect of heat treatment and deformation temperature on the mechanical properties of ECAP processed ZK60 magnesium alloy. Mater. Sci. Eng. A 2016, 677, 125–132. [Google Scholar] [CrossRef]
  65. Mostaed, E.; Hashempour, M.; Fabrizi, A.; Dellasega, D.; Bestetti, M.; Bonollo, F.; Vedani, M. Microstructure, texture evolution, mechanical properties and corrosion behavior of ECAP processed ZK60 magnesium alloy for biodegradable applications. J. Mech. Behav. Biomed. Mater. 2014, 37, 307–322. [Google Scholar] [CrossRef] [PubMed]
  66. Huang, S.-J.; Chiu, C.; Chou, T.-Y.; Rabkin, E. Effect of equal channel angular pressing (ECAP) on hydrogen storage properties of commercial magnesium alloy AZ61. Int. J. Hydrog. Energy 2018, 43, 4371–4380. [Google Scholar] [CrossRef]
  67. Minárik, P.; Zimina, M.; Čížek, J.; Stráska, J.; Krajňák, T.; Cieslar, M.; Vlasák, T.; Bohlen, J.; Kurz, G.; Letzig, D. Increased structural stability in twin-roll cast AZ31 magnesium alloy processed by equal channel angular pressing. Mater. Charact. 2019, 153, 199–207. [Google Scholar] [CrossRef]
Figure 1. Schematic of the different routes of ECAP through multiple passes; (a) route A, (b) route Bc, and (c) route C.
Materials 15 05312 g001
Figure 2. EBSD inverse pole figure (IPF) maps for the AA-Mg (a), and after the ECAP processed using route Bc for different passes, (b,c) 1P, (d,e) 4P, with different die angle, ϕ= 90° (b,d) and ϕ = 120° (c,e).
Materials 15 05312 g002
Figure 3. EBSD inverse pole figure (IPF) maps of the AA-Mg after ECAP process for two passes using ϕ= 90° and different routes, route A (a) and route C (b).
Materials 15 05312 g003
Figure 4. Predicted and actual value of ECAP responses GR.
Materials 15 05312 g004
Figure 5. Three-dimensional plot of GR with N and ϕ at route A (a), Bc (b) and C (c).
Materials 15 05312 g005
Figure 6. Mechanical properties of the AA-Mg after ECAP process at the different conditions; effect of number of passes and die angle using route Bc (a,b), and effect different routes, A, C and Bc using ϕ = 90° for two passes (c).
Materials 15 05312 g006
Figure 7. Predicted and actual value of ECAP responses HC (a), HE (b).
Materials 15 05312 g007
Figure 8. Three-dimensional plot of HC (ac) and HE (df) with N and ϕ at route A (a,d), Bc (b,e) and C (d,f).
Materials 15 05312 g008
Figure 9. Predicted and actual value of ECAP responses σu (a) and D (b).
Materials 15 05312 g009
Figure 10. Three-dimensional plot of σu (ac) and D (df) with N and ϕ at route A (a,d), Bc (b,e) and C (c,f).
Materials 15 05312 g010
Figure 11. Optimal ECAP process parameter of GR. Red dots: ECAP condition. Blue dots: ECAP response.
Materials 15 05312 g011
Figure 12. Optimal ECAP process parameter of Hc. Red dots: ECAP condition. Blue dots: ECAP response.
Materials 15 05312 g012
Figure 13. Optimal ECAP process parameter of HE. Red dots: ECAP condition. Blue dots: ECAP responce.
Materials 15 05312 g013
Figure 14. Optimal ECAP process parameter of σu. Red dots: ECAP condition. Blue dots: ECAP response.
Materials 15 05312 g014
Figure 15. Optimal ECAP process parameter of D. Red dots: ECAP condition. Blue dots: ECAP response.
Materials 15 05312 g015
Figure 16. Optimum GR by GA (a), and hybrid RSM-GA (b).
Materials 15 05312 g016
Figure 17. Optimum HC (a,b), and HE (c,d) by GA (a,c), and hybrid RSM-GA (b,d).
Materials 15 05312 g017aMaterials 15 05312 g017b
Figure 18. Optimum σu (a,b), and D (c,d) by GA (a,c), and hybrid RSM-GA (b,d).
Materials 15 05312 g018
Table 1. ECAP parameters levels.
ECAP ParametersParameters Levels
L1L2L3
Number of passes (N)124
ECAP die angle (ϕ)90120
Processing route type ABcC
Table 2. Grain size (GR) of AA-Mg and after ECAP process through route Bc using two different die angles (ϕ).
Data, µmAA-MgRoute Bc
1P4P
ϕ 90°ϕ 120°ϕ 90°ϕ 120°
Min. grain size1.1060.5070.5050.210.81
Max. grain size34.029.29122.7277.1420.15
Average grain size6.3381.4922.620.881.89
Standard deviation5.8150.9451.4330.731.11
Table 3. Significant independent parameters for each ECAP response.
Significant Effect
ResponseGRN, φ, X1, X2, N φ
HCN, φ, X2
HEN, φ, X2, N φ, N2
σuφ, X1, X2, N φ, N X1, N X2, φ X1, N2
Dφ, X2, N φ, φ X2, N2
Table 4. Statistical tests of ECAP responses.
ResponseF-Value
(F > 4)
Model Significant (p < 0.05)Lack of Fit (p > 0.05)Adeq Precision (Ratio > 4)R2Adjusted R2Predicted R2
GR224.52<0.00010.139541.39550.99340.98890.968
HC42.22<0.00010.473917.49060.96570.94280.895
HE56.44<0.00010.695922.390.97410.95690.9063
σu126.59<0.00010.193942.76810.99480.98690.9894
D34.41<0.00010.137218.52880.97520.94690.9553
Table 5. Summary results of pure Mg ECAP process.
ResponseExperimentalRSMGARSM-GA
GRValue0.880.88720.88720.887287
Cond.4passes, 90°, Route Bc4passes, 90°, Route Bc4passes, 90°, Route Bc4passes, 90°, Route Bc
HCValue46.546.0245.992745.9927
Cond.4passes, 90°, Route A4passes, 90°, Route Bc4passes, 90°, Route Bc4passes, 90°, Route Bc
HEValue5553.92453.906853.9068
Cond.4passes, 90°, Route Bc4passes, 90°, Route Bc4passes, 90°, Route Bc4passes, 90°, Route Bc
σuValue388388388388
Cond.2passes, 120°, Route Bc2passes, 120°, Route Bc2passes, 120°, Route Bc2passes, 120°, Route Bc
DValue2829.028328.995628.899
Cond.4passes, 90°, Route Bc4passes, 90°, Route Bc4passes, 90°, Route Bc4passes, 90°, Route Bc
Table 6. Validated ECAP response based on previous studies.
ResponseGARSM-GA
GR (µm)Value0.2699270.269927
Cond.4passes, 70°, Route Bc4passes, 70°, Route Bc
HC (HV)Value47.495147.4951
Cond.4passes, 80°, Route Bc4passes, 80°, Route Bc
HE (HV)Value54.720754.7207
Cond.4passes, 80°, Route Bc4passes, 80°, Route Bc
σu (MPa)Value422.5422.5
Cond.2passes, 135°, Route Bc2passes, 135°, Route Bc
D (%)Value4.08464.0846
Cond.6passes, 80°, Route Bc6passes, 80°, Route Bc
Publisher’s Note: MDPI stays neutral with regard to jurisdictional claims in published maps and institutional affiliations.

