
The Use of Nanoscale Montmorillonite (MMT) as Reinforcement for Polylactide Acid (PLA) Prepared by Fused Deposition Modeling (FDM)—Comparative Study with Biocarbon and Talc Fillers


Abstract
1. Introduction
2. Materials and Methods
2.1. Materials
- −
- PLA—Poly(lactic acid) granules, variety Ingeo 2500D (NatureWorks, Minetonka, Minneapolis, MN, USA), MFI = 8 g/10 min (210 °C; 2.16 kg),
- −
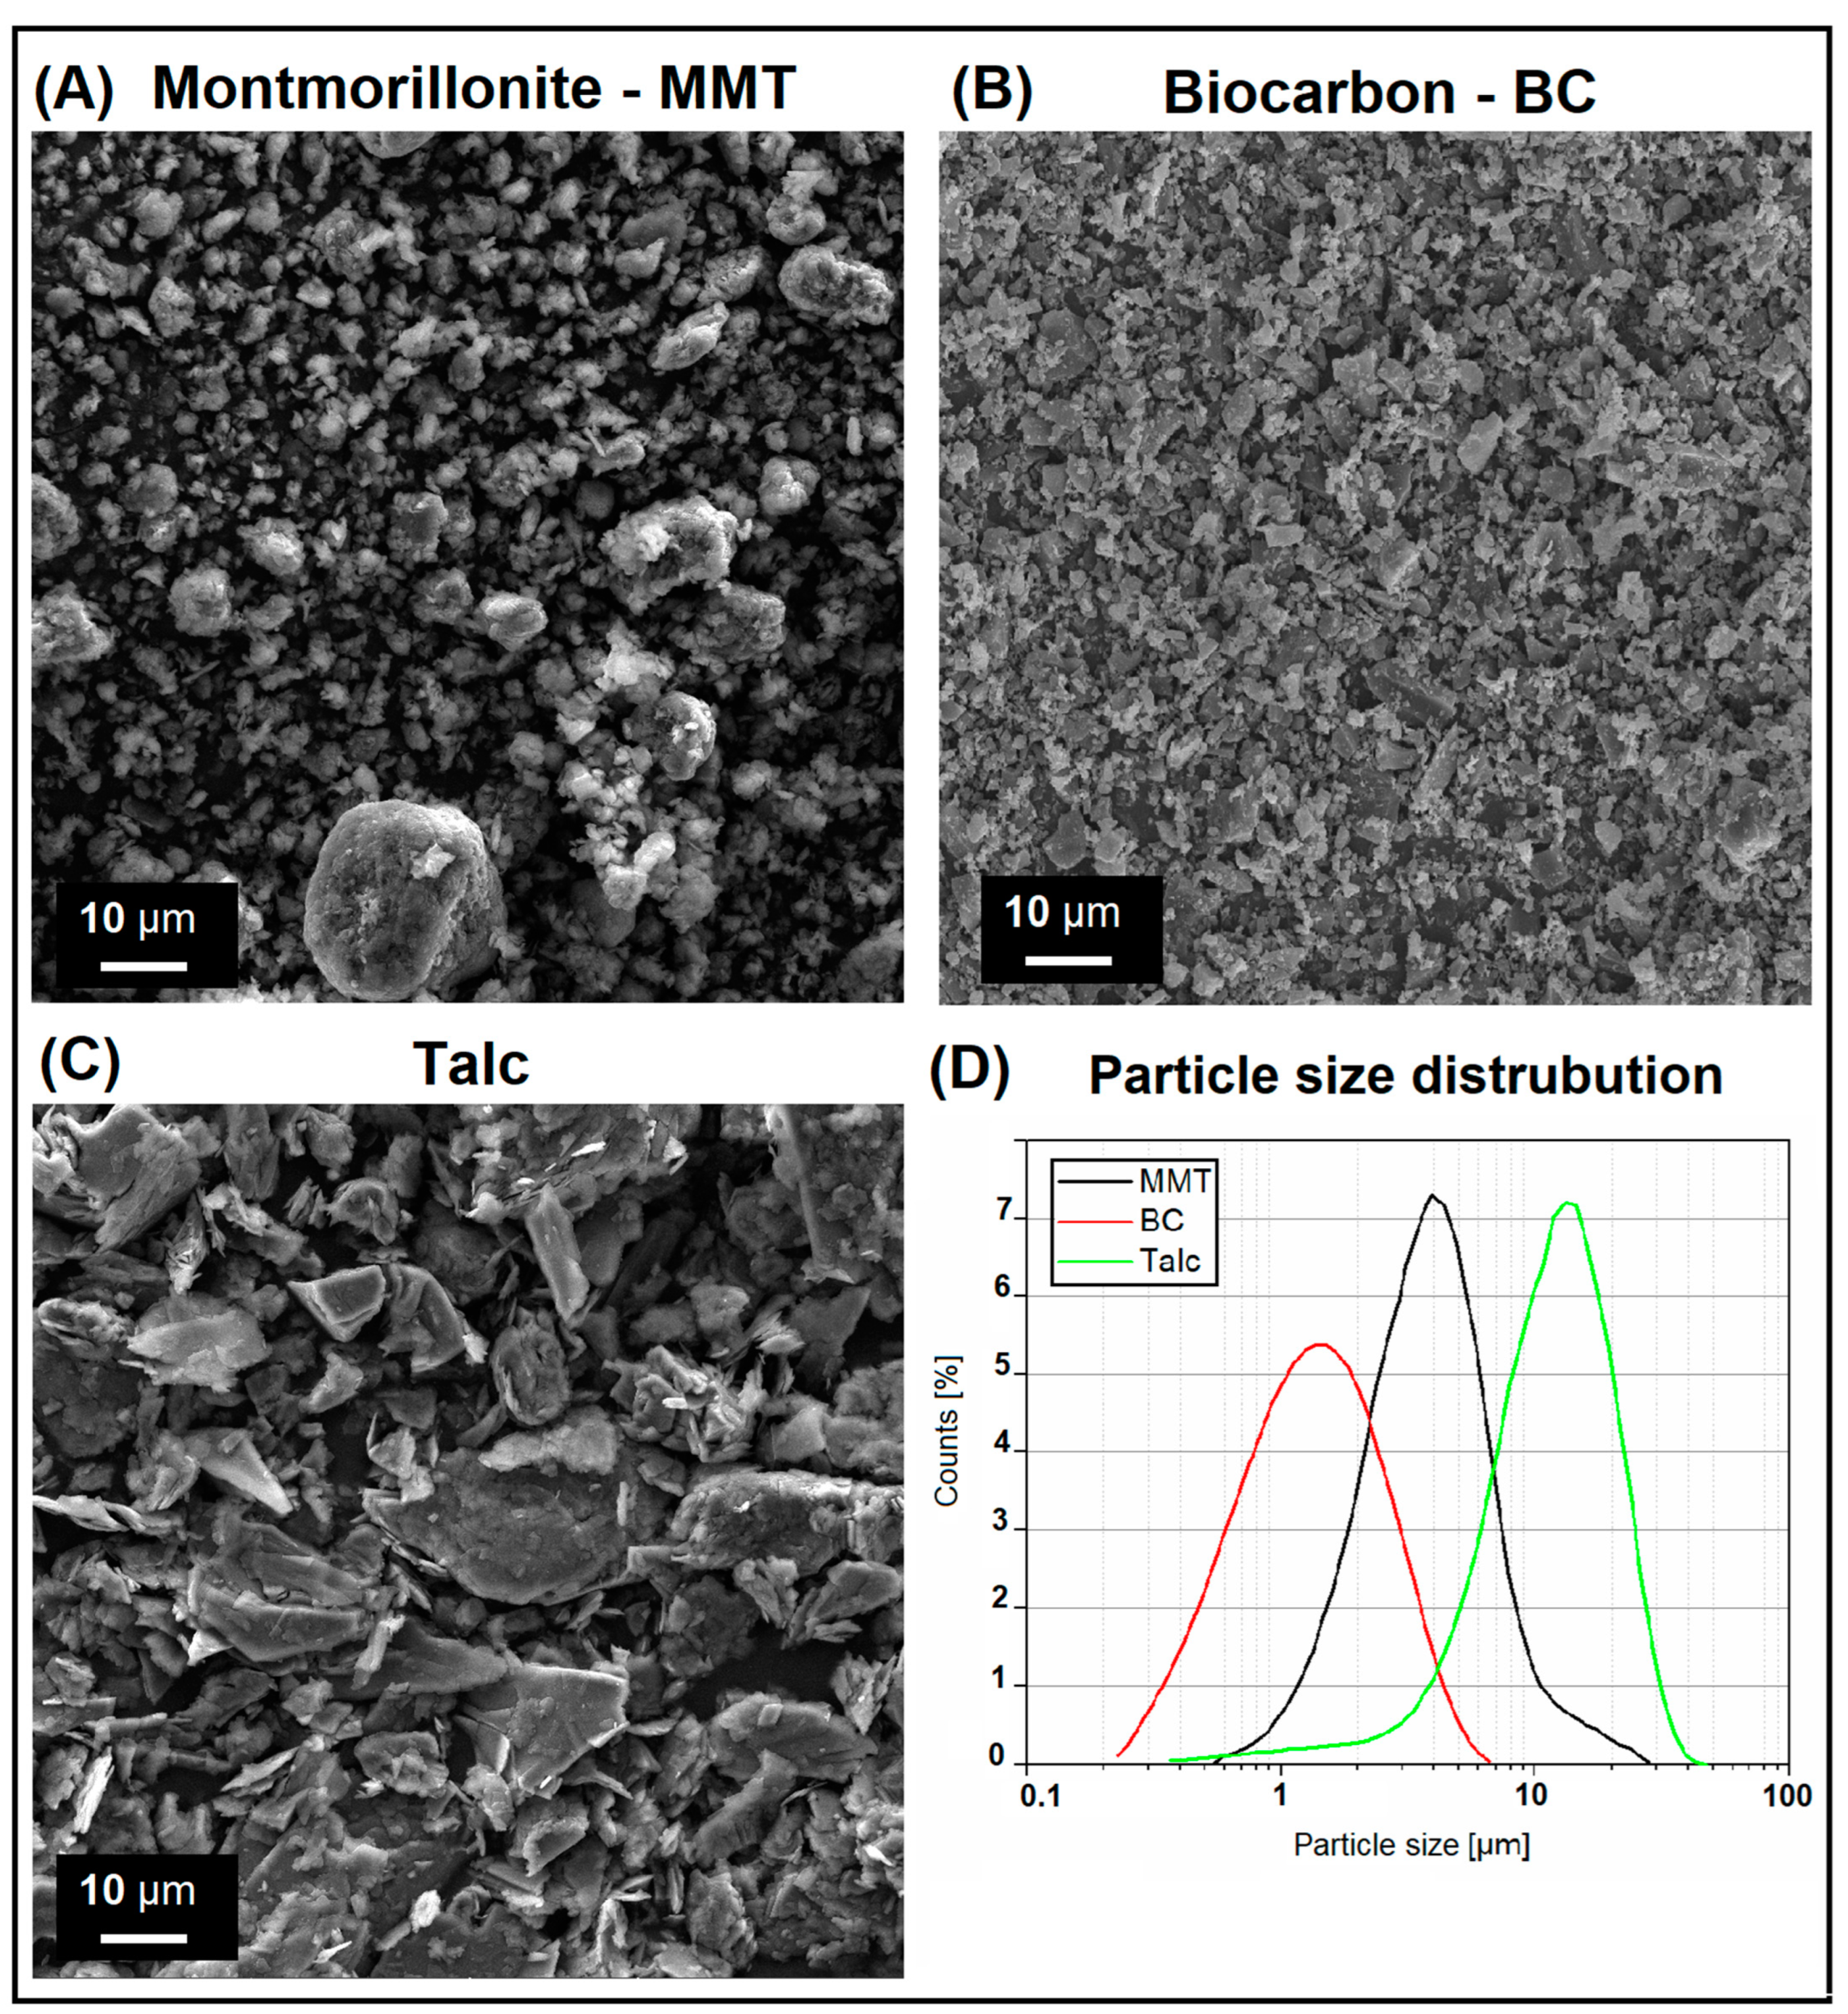
- MMT—Montmorillonite nano-clay from Sigma-Aldrich, particles were surface-treated with 0.5–5 wt% aminopropyltriethoxysilane, 15–35 wt% octadecylamine,
- −
- Talc—the talcum clay filler (magnesium hydrogen metasilicate), producer: Biomus,
- −
- BC—Biocarbon powder, obtained during the pyrolysis process at 650 °C, particular filler was prepared from the wood chips. Before using the filler was ball milled for 24 h, the procedure and properties of biochar was described in our previous work [23]. Producer: Fluid S.A.
2.2. Sample Preparation
2.3. Characterization
3. Results
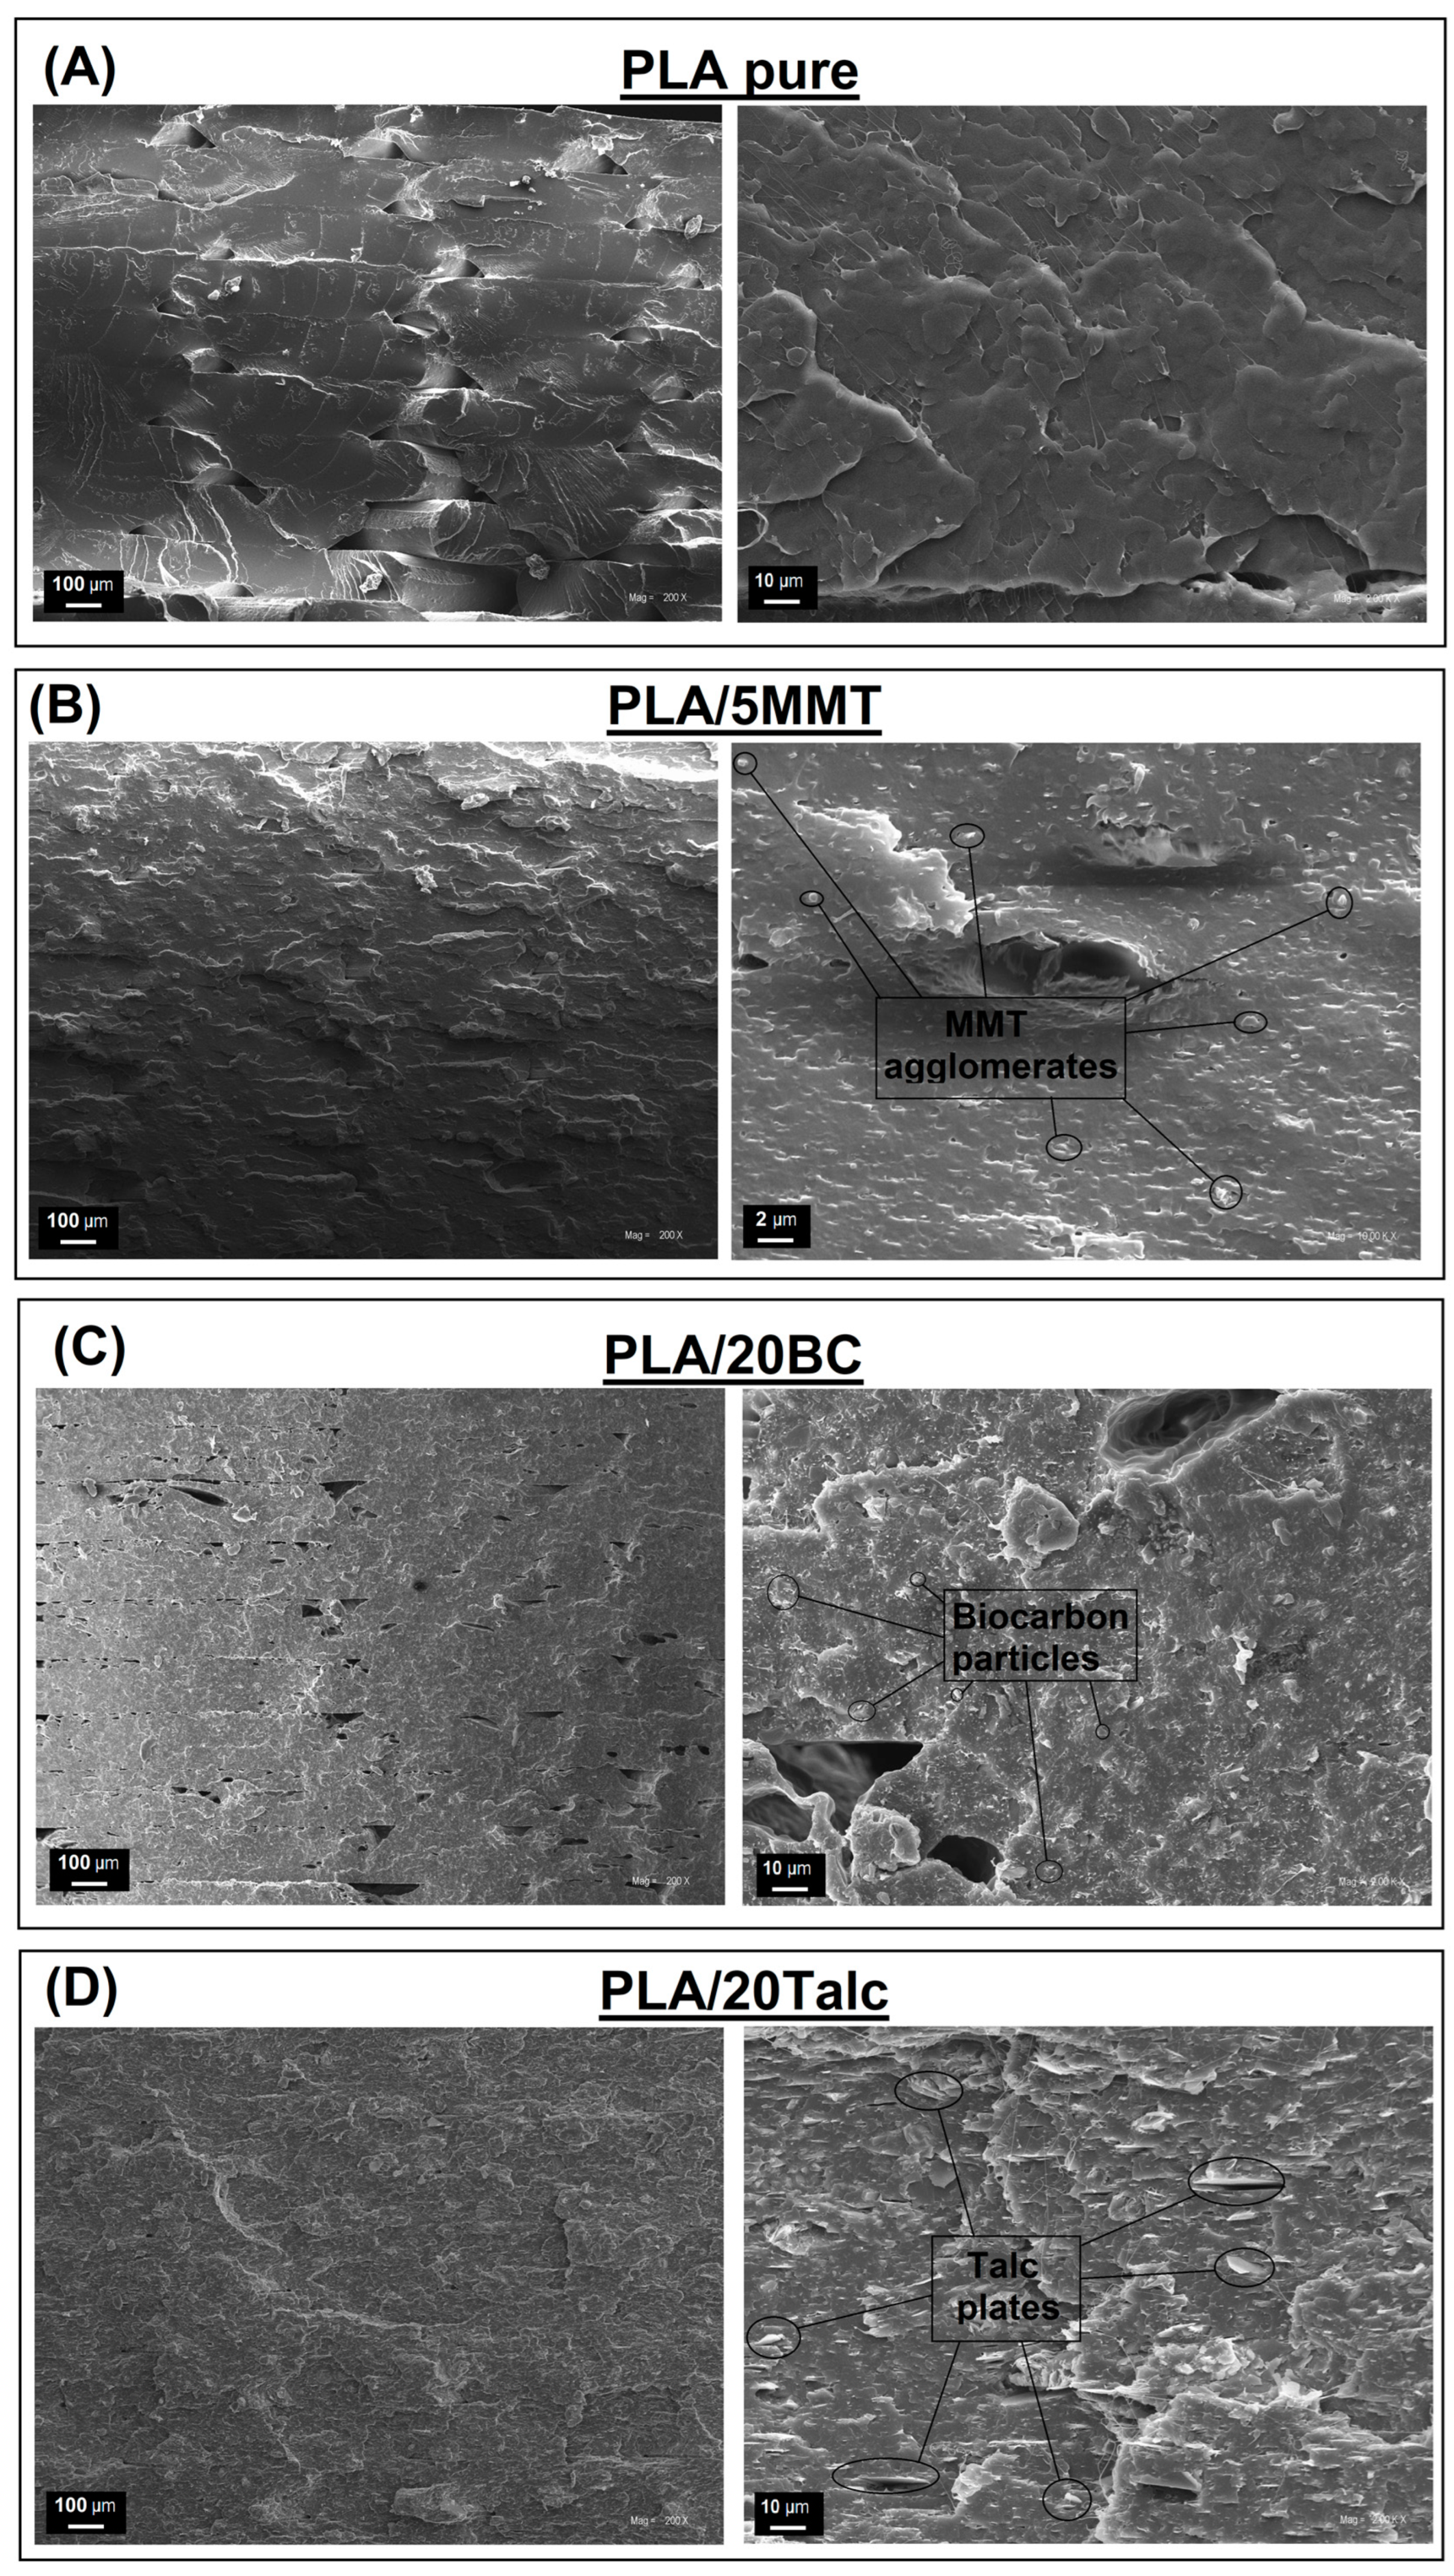
3.1. Composite Structure Evaluation—SEM Observations
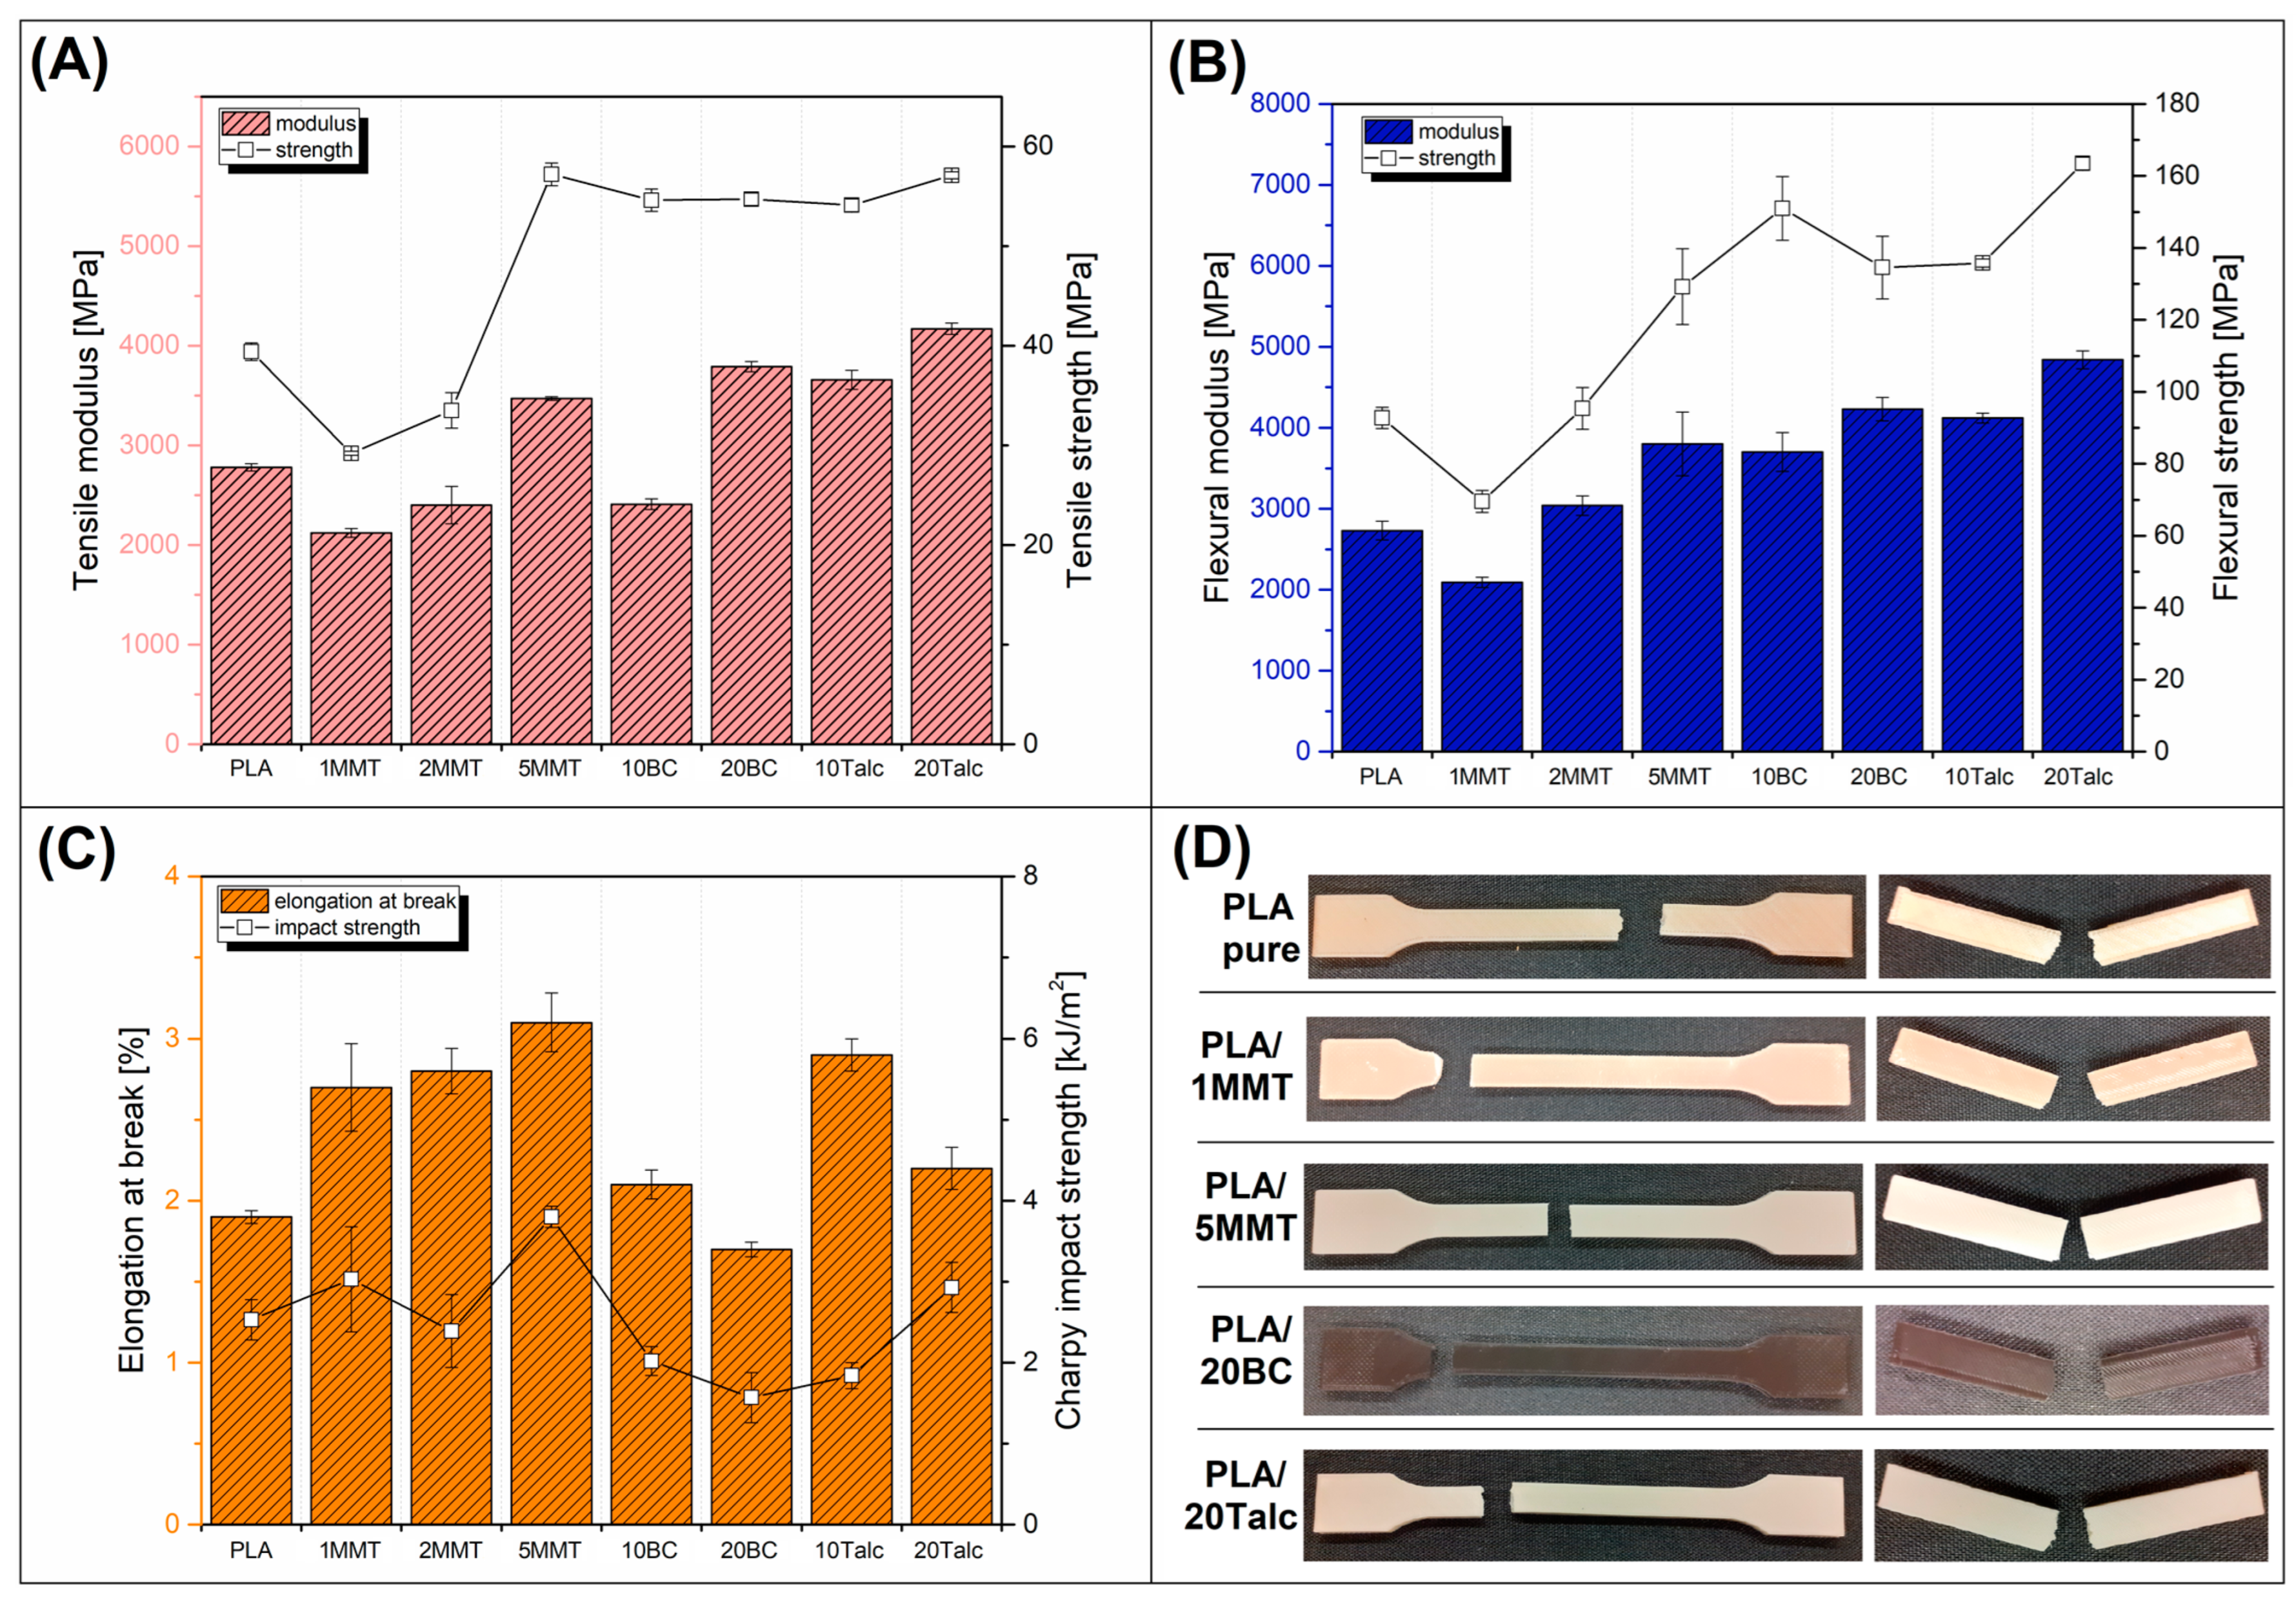
3.2. Mechanical Performance—Static Tensile/Flexural Tests and Impact Resistance Measurements
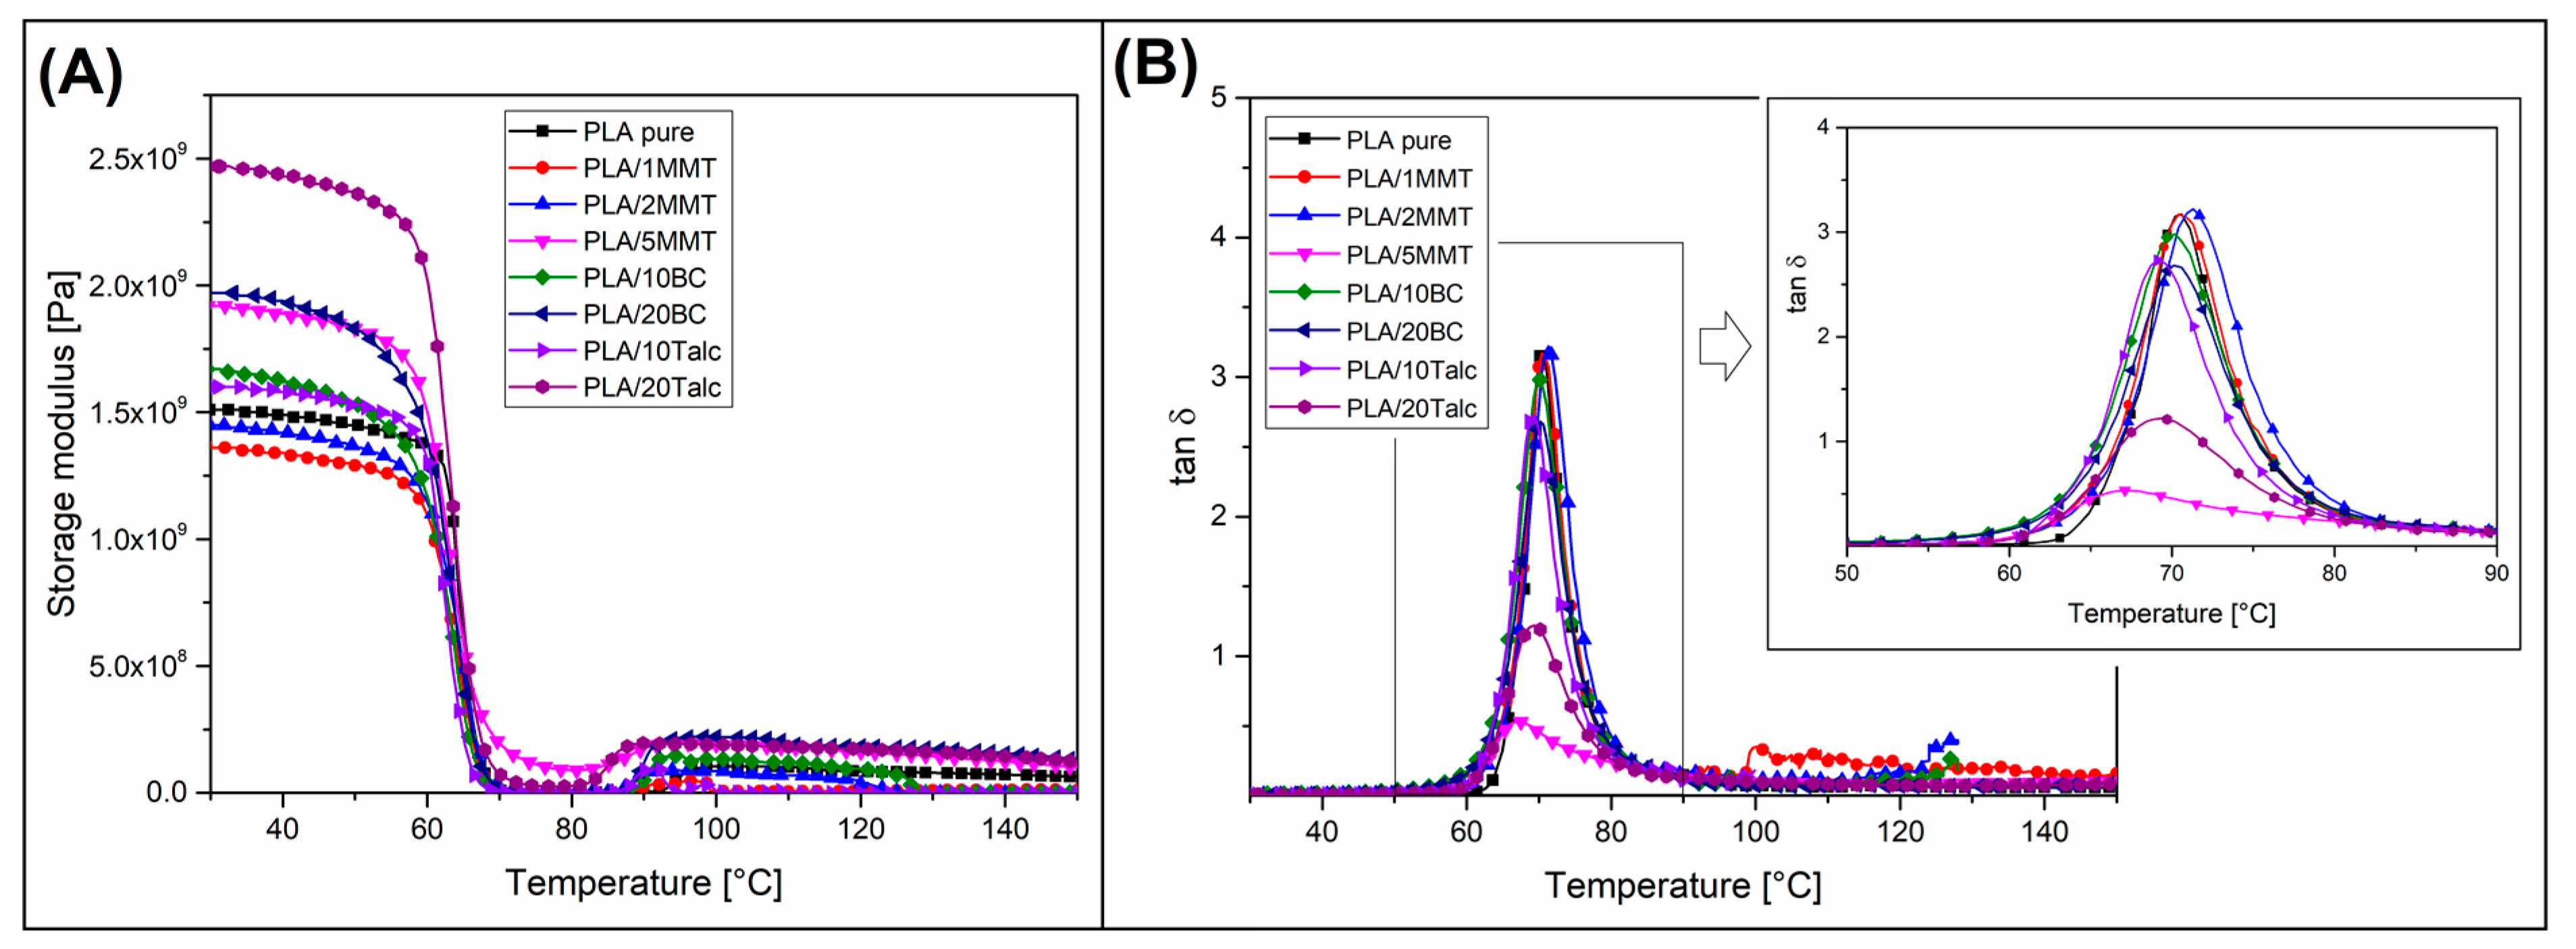
3.3. Thermomechanical Properties—DMTA Analysis and HDT/Vicat Tests

| Sample | HDT (0.455 MPa) [°C] | VST * (10 N) [°C] | C Factor [–] |
|---|---|---|---|
| PLA | 62.0 ± 0.3 | 68.1 ± 0.9 | 1.00 |
| PLA/1MMT | 57.3 ± 0.8 | 67.3 ± 2.1 | 1.10 |
| PLA/2MMT | 61.7 ± 0.1 | 69.4 ± 0.1 | 0.81 |
| PLA/5MMT | 62.2 ± 0.9 | 73.6 ± 4.0 | 0.03 |
| PLA/10BC | 57.8 ± 0.2 | 66.4 ± 0.6 | 0.77 |
| PLA/20BC | 63.4 ± 0.4 | 72.1 ± 0.3 | 0.64 |
| PLA/10Talc | 59.5 ± 1.1 | 67.0 ± 3.4 | 0.95 |
| PLA/20Talc | 60.7 ± 0.3 | 69.8 ± 0.1 | 0.13 |
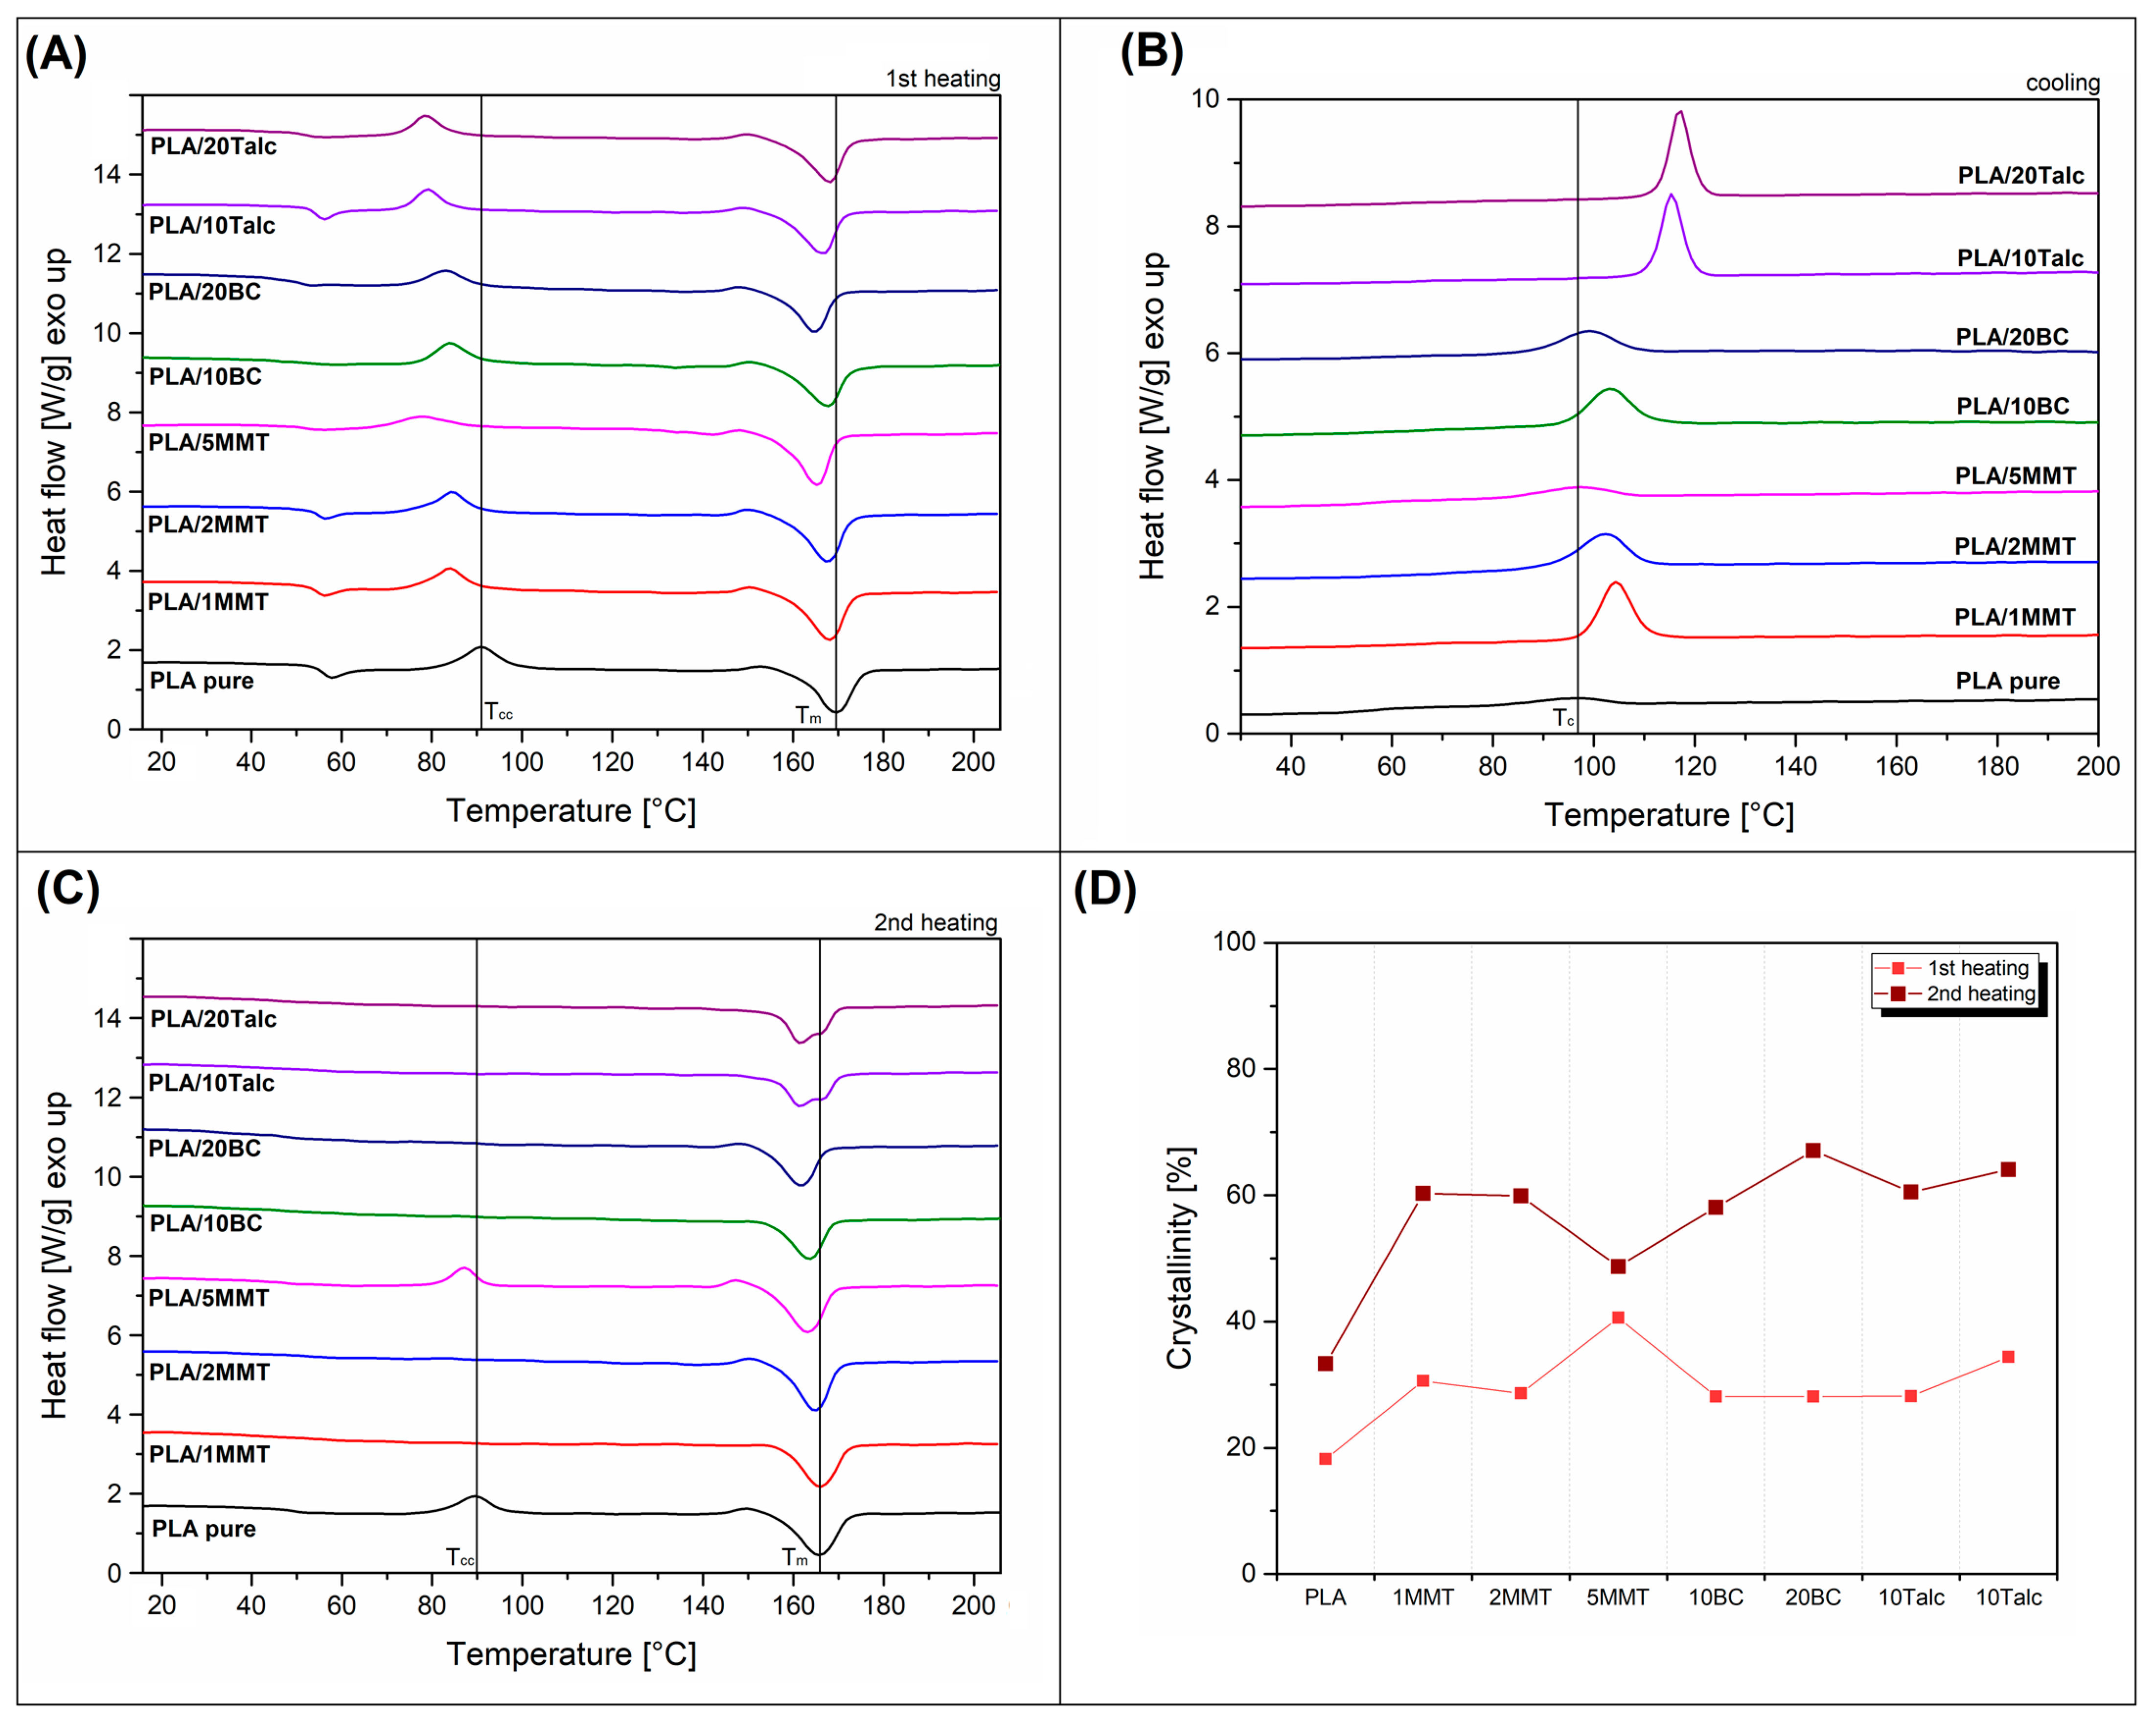
3.4. DSC Analysis
4. Discussion and Conclusions
Supplementary Materials
Author Contributions
Funding
Institutional Review Board Statement
Informed Consent Statement
Conflicts of Interest
References
- Ngo, T.D.; Kashani, A.; Imbalzano, G.; Nguyen, K.T.Q.; Hui, D. Additive Manufacturing (3D Printing): A Review of Materials, Methods, Applications and Challenges. Compos. Part B Eng. 2018, 143, 172–196. [Google Scholar] [CrossRef]
- Heidari-Rarani, M.; Rafiee-Afarani, M.; Zahedi, A.M. Mechanical Characterization of FDM 3D Printing of Continuous Carbon Fiber Reinforced PLA Composites. Compos. Part B Eng. 2019, 175, 107147. [Google Scholar] [CrossRef]
- Tian, X.; Liu, T.; Yang, C.; Wang, Q.; Li, D. Interface and Performance of 3D Printed Continuous Carbon Fiber Reinforced PLA Composites. Compos. Part A Appl. Sci. Manuf. 2016, 88, 198–205. [Google Scholar] [CrossRef]
- Li, N.; Li, Y.; Liu, S. Rapid Prototyping of Continuous Carbon Fiber Reinforced Polylactic Acid Composites by 3D Printing. J. Mater. Process. Technol. 2016, 238, 218–225. [Google Scholar] [CrossRef]
- Goh, G.D.; Yap, Y.L.; Agarwala, S.; Yeong, W.Y. Recent Progress in Additive Manufacturing of Fiber Reinforced Polymer Composite. Adv. Mater. Technol. 2019, 4, 1800271. [Google Scholar] [CrossRef]
- Sher, D. Anisoprint Launches New Composite Basalt Fiber Material for Continuous Fiber 3D Printing. Available online: https://www.3dprintingmedia.network/anisoprint-launches-new-composite-basalt-fiber-material-for-continuous-fiber-3d-printing/ (accessed on 5 June 2022).
- Gong, H.; Snelling, D.; Kardel, K.; Carrano, A. Comparison of Stainless Steel 316L Parts Made by FDM- and SLM-Based Additive Manufacturing Processes. Jom 2019, 71, 880–885. [Google Scholar] [CrossRef]
- Ait-Mansour, I.; Kretzschmar, N.; Chekurov, S.; Salmi, M.; Rech, J. Design-Dependent Shrinkage Compensation Modeling and Mechanical Property Targeting of Metal FFF. Prog. Addit. Manuf. 2020, 5, 51–57. [Google Scholar] [CrossRef]
- Liu, B.; Wang, Y.; Lin, Z.; Zhang, T. Creating Metal Parts by Fused Deposition Modeling and Sintering. Mater. Lett. 2020, 263, 127252. [Google Scholar] [CrossRef]
- Suwanpreecha, C.; Manonukul, A. A Review on Material Extrusion Additive Manufacturing of Metal and How It Compares with Metal Injection Moulding. Metals 2022, 12, 429. [Google Scholar] [CrossRef]
- Pellegrini, A.; Palmieri, M.E.; Guerra, M.G. Evaluation of Anisotropic Mechanical Behaviour of 316L Parts Realized by Metal Fused Filament Fabrication Using Digital Image Correlation. Int. J. Adv. Manuf. Technol. 2022, 120, 7951–7965. [Google Scholar] [CrossRef]
- Abdullah, A.M.; Tuan Rahim, T.N.A.; Mohamad, D.; Akil, H.M.; Rajion, Z.A. Mechanical and Physical Properties of Highly ZrO2/β-TCP Filled Polyamide 12 Prepared via Fused Deposition Modelling (FDM) 3D Printer for Potential Craniofacial Reconstruction Application. Mater. Lett. 2017, 189, 307–309. [Google Scholar] [CrossRef]
- Nikzad, M.; Masood, S.H.; Sbarski, I. Thermo-Mechanical Properties of a Highly Filled Polymeric Composites for Fused Deposition Modeling. Mater. Des. 2011, 32, 3448–3456. [Google Scholar] [CrossRef]
- Deb, D.; Jafferson, J.M. Natural Fibers Reinforced FDM 3D Printing Filaments. Mater. Today Proc. 2021, 46, 1308–1318. [Google Scholar] [CrossRef]
- Muthe, L.P.; Pickering, K.; Gauss, C. A Review of 3D/4D Printing of Poly-Lactic Acid Composites with Bio-Derived Reinforcements. Compos. Part C Open Access 2022, 8, 100271. [Google Scholar] [CrossRef]
- Tümer, E.H.; Erbil, H.Y. Extrusion-Based 3d Printing Applications of Pla Composites: A Review. Coatings 2021, 11, 390. [Google Scholar] [CrossRef]
- Göschel, U.; Lutz, W.; Davidson, N.C. The Influence of a Polymeric Nucleating Additive on the Crystallisation in Glass Fibre Reinforced Polyamide 6 Composites. Compos. Sci. Technol. 2007, 67, 2606–2615. [Google Scholar] [CrossRef][Green Version]
- Yan, X.; Imai, Y.; Shimamoto, D.; Hotta, Y. Relationship Study between Crystal Structure and Thermal/Mechanical Properties of Polyamide 6 Reinforced and Unreinforced by Carbon Fiber from Macro and Local View. Polymer 2014, 55, 6186–6194. [Google Scholar] [CrossRef]
- Zhao, J.; Qiao, Y.; Wang, G.; Wang, C.; Park, C.B. Lightweight and Tough PP/Talc Composite Foam with Bimodal Nanoporous Structure Achieved by Microcellular Injection Molding. Mater. Des. 2020, 195, 109051. [Google Scholar] [CrossRef]
- Layachi, A.; Makhlouf, A.; Frihi, D.; Satha, H.; Belaadi, A.; Seguela, R. Non-Isothermal Crystallization Kinetics and Nucleation Behavior of Isotactic Polypropylene Composites with Micro-Talc. J. Therm. Anal. Calorim. 2019, 138, 1081–1095. [Google Scholar] [CrossRef]
- Gao, X.; Qi, S.; Yang, B.; Su, Y.; Li, J.; Wang, D. Synergistic Effect of Plasticizer and Nucleating Agent on Crystallization Behavior of Polylactide during Fused Filament Fabrication. Polymer 2021, 215, 123426. [Google Scholar] [CrossRef]
- Simmons, H.; Tiwary, P.; Colwell, J.E.; Kontopoulou, M. Improvements in the Crystallinity and Mechanical Properties of PLA by Nucleation and Annealing. Polym. Degrad. Stab. 2019, 166, 248–257. [Google Scholar] [CrossRef]
- Andrzejewski, J.; Aniśko, J.; Szulc, J. A Comparative Study of Biocarbon Reinforced Polyoxymethylene and Polyamide: Materials Performance and Durability. Compos. Part A Appl. Sci. Manuf. 2022, 152, 106715. [Google Scholar] [CrossRef]
- Yu, W.; Wang, X.; Ferraris, E.; Zhang, J. Melt Crystallization of PLA/Talc in Fused Filament Fabrication. Mater. Des. 2019, 182, 108013. [Google Scholar] [CrossRef]
- Coiai, S.; Cicogna, F.; de Santi, A.; Pérez Amaro, L.; Spiniello, R.; Signori, F.; Fiori, S.; Oberhauser, W.; Passaglia, E. MMT and LDH Organo-Modification with Surfactants Tailored for PLA Nanocomposites. Express Polym. Lett. 2017, 11, 163–175. [Google Scholar] [CrossRef]
- Fan, Q.; Han, G.; Cheng, W.; Tian, H.; Wang, D.; Xuan, L. Effect of Intercalation Structure of Organo-Modified Montmorillonite/Polylactic Acid on Wheat Straw Fiber/Polylactic Acid Composites. Polymers 2018, 10, 896. [Google Scholar] [CrossRef]
- Ng, H.M.; Bee, S.T.; Sin, L.T.; Ratnam, C.T. Optimization Study on Properties of Poly (Lactic Acid) (PLA) Composites Filled with Scomberomorus Guttatus-Derived Hydroxyapatite and Montmorillonite (MMT) under Electron Beam Irradiation; Springer: Berlin/Heidelberg, Germany, 2021; ISBN 0123456789. [Google Scholar]
- Garlotta, D. A Literature Review of Poly(Lactic Acid). J. Polym. Environ. 2001, 9, 63–84. [Google Scholar] [CrossRef]
- Fischer, E.W.; Sterzel, H.J.; Wegner, G. Investigation of the Structure of Solution Grown Crystals of Lactide Copolymers by Means of Chemical Reactions. Kolloid-Z. Z. Polym. 1973, 251, 980–990. [Google Scholar] [CrossRef]
- Benwood, C.; Anstey, A.; Andrzejewski, J.; Misra, M.; Mohanty, A.K. Improving the Impact Strength and Heat Resistance of 3D Printed Models: Structure, Property, and Processing Correlationships during Fused Deposition Modeling (FDM) of Poly(Lactic Acid). ACS Omega 2018, 3, 4400–4411. [Google Scholar] [CrossRef]
- Matykiewicz, D.; Barczewski, M.; Michałowski, S. Basalt Powder as an Eco-Friendly Filler for Epoxy Composites: Thermal and Thermo-Mechanical Properties Assessment. Compos. Part B Eng. 2019, 164, 272–279. [Google Scholar] [CrossRef]
- Raftopoulos, K.N.; Hebda, E.; Grzybowska, A.; Klonos, P.A.; Kyritsis, A.; Pielichowski, K. PEG-POSS Star Molecules Blended in Polyurethane with Flexible Hard Segments: Morphology and Dynamics. Molecules 2020, 26, 99. [Google Scholar] [CrossRef]
- Ogunsona, E.O.; Codou, A.; Misra, M.; Mohanty, A.K. Thermally Stable Pyrolytic Biocarbon as an Effective and Sustainable Reinforcing Filler for Polyamide Bio-Composites Fabrication. J. Polym. Environ. 2018, 26, 3574–3589. [Google Scholar] [CrossRef]
- Rodriguez-Uribe, A.; Snowdon, M.R.; Abdelwahab, M.A.; Codou, A.; Misra, M.; Mohanty, A.K. Impact of Renewable Carbon on the Properties of Composites Made by Using Three Types of Polymers Having Different Polarity. J. Appl. Polym. Sci. 2021, 138, 49948. [Google Scholar] [CrossRef]
- Ogunsona, E.O.; Misra, M.; Mohanty, A.K. Influence of Epoxidized Natural Rubber on the Phase Structure and Toughening Behavior of Biocarbon Reinforced Nylon 6 Biocomposites. RSC Adv. 2017, 7, 8727–8739. [Google Scholar] [CrossRef]
- Behazin, E.; Misra, M.; Mohanty, A.K. Sustainable Biocarbon from Pyrolyzed Perennial Grasses and Their Effects on Impact Modified Polypropylene Biocomposites. Compos. Part B Eng. 2017, 118, 116–124. [Google Scholar] [CrossRef]
- Codou, A.; Misra, M.; Mohanty, A.K. Sustainable Biocomposites from Nylon 6 and Polypropylene Blends and Biocarbon—Studies on Tailored Morphologies and Complex Composite Structures. Compos. Part A Appl. Sci. Manuf. 2020, 129, 105680. [Google Scholar] [CrossRef]
- Chang, B.P.; Mohanty, A.K.; Misra, M. Sustainable Biocarbon as an Alternative of Traditional Fillers for Poly(Butylene Terephthalate)-Based Composites: Thermo-Oxidative Aging and Durability. J. Appl. Polym. Sci. 2019, 136, 47722. [Google Scholar] [CrossRef]
- Picard, M.; Thakur, S.; Misra, M.; Mielewski, D.F.; Mohanty, A.K. Biocarbon from Peanut Hulls and Their Green Composites with Biobased Poly(Trimethylene Terephthalate) (PTT). Sci. Rep. 2020, 10, 3310. [Google Scholar] [CrossRef]
- Nagarajan, V.; Mohanty, A.K.; Misra, M. Biocomposites with Size-Fractionated Biocarbon: Influence of the Microstructure on Macroscopic Properties. ACS Omega 2016, 1, 636–647. [Google Scholar] [CrossRef]
- Snowdon, M.R.; Abdelwahab, M.; Mohanty, A.K.; Misra, M. Mechanical Optimization of Virgin and Recycled Poly(Ethylene Terephthalate) Biocomposites with Sustainable Biocarbon through a Factorial Design. Results Mater. 2020, 5, 100060. [Google Scholar] [CrossRef]
- Choi, W.J.; Kim, S.C. Effects of Talc Orientation and Non-Isothermal Crystallization Rate on Crystal Orientation of Polypropylene in Injection-Molded Polypropylene/Ethylene-Propylene Rubber/Talc Blends. Polymer 2004, 45, 2393–2401. [Google Scholar] [CrossRef]
- Battegazzore, D.; Bocchini, S.; Frache, A. Crystallization Kinetics of Poly(Lactic Acid)-Talc Composites. Express Polym. Lett. 2011, 5, 849–858. [Google Scholar] [CrossRef]
- Ueng, S.K.; Chen, L.G.; Jen, S.Y. Voxel-Based Virtual Manufacturing Simulation for Three-Dimensional Printing. Adv. Mech. Eng. 2018, 10, 1687814018781632. [Google Scholar] [CrossRef]
- Kontovourkis, O.; Tryfonos, G. Integrating Parametric Design with Robotic Additive Manufacturing for 3D Clay Printing: An Experimental Study. In Proceedings of the ISARC 2018—35th International Symposium on Automation and Robotics in Construction, Berlin, Germany, 20–25 July 2018. [Google Scholar] [CrossRef]
- Barczewski, M.; Mysiukiewicz, O.; Matykiewicz, D.; Skórczewska, K.; Lewandowski, K.; Andrzejewski, J.; Piasecki, A. Development of Polylactide Composites with Improved Thermomechanical Properties by Simultaneous Use of Basalt Powder and a Nucleating Agent. Polym. Compos. 2020, 41, 2947–2957. [Google Scholar] [CrossRef]
- Piekarska, K.; Piorkowska, E.; Bojda, J. The Influence of Matrix Crystallinity, Filler Grain Size and Modification on Properties of PLA/Calcium Carbonate Composites. Polym. Test. 2017, 62, 203–209. [Google Scholar] [CrossRef]
- Pivsa-Art, W.; Pivsa-Art, S. Effect of Talc on Mechanical Characteristics and Fracture Toughness of Poly(Lactic Acid)/Poly(Butylene Succinate) Blend. J. Polym. Environ. 2019, 27, 1821–1827. [Google Scholar] [CrossRef]
- Ageyeva, T.; Kovács, J.G.; Tábi, T. Comparison of the Efficiency of the Most Effective Heterogeneous Nucleating Agents for Poly(Lactic Acid). J. Therm. Anal. Calorim. 2021, 147, 8199–8211. [Google Scholar] [CrossRef]
- Aliotta, L.; Sciara, L.M.; Cinelli, P.; Canesi, I.; Lazzeri, A. Improvement of the PLA Crystallinity and Heat Distortion Temperature Optimizing the Content of Nucleating Agents and the Injection Molding Cycle Time. Polymers 2022, 14, 977. [Google Scholar] [CrossRef] [PubMed]
- Andrzejewski, J.; Cheng, J.; Anstey, A.; Mohanty, A.K.; Misra, M. Development of Toughened Blends of Poly(Lactic Acid) (PLA) and Poly(Butylene Adipate-Co-Terephthalate) (PBAT) for 3D Printing Applications: Compatibilization Methods and Material Performance Evaluation. ACS Sustain. Chem. Eng. 2020, 8, 6576–6589. [Google Scholar] [CrossRef]
- Nyambo, C.; Mohanty, A.K.; Misra, M. Polylactide-Based Renewable Green Composites from Agricultural Residues and Their Hybrids. Biomacromolecules 2010, 11, 1654–1660. [Google Scholar] [CrossRef] [PubMed]
- Sang, L.; Han, S.; Peng, X.; Jian, X.; Wang, J. Development of 3D-Printed Basalt Fiber Reinforced Thermoplastic Honeycombs with Enhanced Compressive Mechanical Properties. Compos. Part A Appl. Sci. Manuf. 2019, 125, 105518. [Google Scholar] [CrossRef]
- Sang, L.; Han, S.; Li, Z.; Yang, X.; Hou, W. Development of Short Basalt Fiber Reinforced Polylactide Composites and Their Feasible Evaluation for 3D Printing Applications. Compos. Part B Eng. 2019, 164, 629–639. [Google Scholar] [CrossRef]
- Jyoti, J.; Singh, B.P.; Arya, A.K.; Dhakate, S.R. Dynamic Mechanical Properties of Multiwall Carbon Nanotube Reinforced ABS Composites and Their Correlation with Entanglement Density, Adhesion, Reinforcement and C Factor. RSC Adv. 2016, 6, 3997–4006. [Google Scholar] [CrossRef]
- Barczewski, M.; Szostak, M.; Nowak, D.; Piasecki, A. Effect of Wood Flour Addition and Modification of Its Surface on the Properties of Rotationally Molded Polypropylene Composites. Polimery/Polymers 2018, 63, 772–784. [Google Scholar] [CrossRef]
- Hejna, A.; Kosmela, P.; Barczewski, M.; Mysiukiewicz, O.; Piascki, A. Copper Slag as a Potential Waste Filler for Polyethylene-Based Composites Manufacturing. Tanzan. J. Sci. 2021, 47, 405–420. [Google Scholar] [CrossRef]
- Chang, B.P.; Rodriguez-Uribe, A.; Mohanty, A.K.; Misra, M. A Comprehensive Review of Renewable and Sustainable Biosourced Carbon through Pyrolysis in Biocomposites Uses: Current Development and Future Opportunity. Renew. Sustain. Energy Rev. 2021, 152, 111666. [Google Scholar] [CrossRef]
- Li, H.; Huneault, M.A. Effect of Nucleation and Plasticization on the Crystallization of Poly(Lactic Acid). Polymer 2007, 48, 6855–6866. [Google Scholar] [CrossRef]
- Harris, A.M.; Lee, E.C. Improving Mechanical Performance of Injection Molded PLA by Controlling Crystallinity. J. Appl. Polym. Sci. 2008, 107, 2246–2255. [Google Scholar] [CrossRef]
- Nagarajan, V.; Mohanty, A.K.; Misra, M. Crystallization Behavior and Morphology of Polylactic Acid (PLA) with Aromatic Sulfonate Derivative. J. Appl. Polym. Sci. 2016, 133, 1–11. [Google Scholar] [CrossRef]
- Fehri, M.K.; Mugoni, C.; Cinelli, P.; Anguillesi, I.; Coltelli, M.B.; Fiori, S.; Montorsi, M.; Lazzeri, A. Composition Dependence of the Synergistic Effect of Nucleating Agent and Plasticizer in Poly(Lactic Acid): A Mixture Design Study. Express Polym. Lett. 2016, 10, 274–288. [Google Scholar] [CrossRef]
- Nagarajan, V.; Zhang, K.; Misra, M.; Mohanty, A.K. Overcoming the Fundamental Challenges in Improving the Impact Strength and Crystallinity of PLA Biocomposites: Influence of Nucleating Agent and Mold Temperature. ACS Appl. Mater. Interfaces 2015, 7, 11203–11214. [Google Scholar] [CrossRef] [PubMed]
- Klonos, P.; Terzopoulou, Z.; Koutsoumpis, S.; Zidropoulos, S.; Kripotou, S.; Papageorgiou, G.Z.; Bikiaris, D.N.; Kyritsis, A.; Pissis, P. Rigid Amorphous Fraction and Segmental Dynamics in Nanocomposites Based on Poly(L–Lactic Acid) and Nano-Inclusions of 1–3D Geometry Studied by Thermal and Dielectric Techniques. Eur. Polym. J. 2016, 82, 16–34. [Google Scholar] [CrossRef]
- Leng, J.; Szymoniak, P.; Kang, N.J.; Wang, D.Y.; Wurm, A.; Schick, C.; Schönhals, A. Influence of Interfaces on the Crystallization Behavior and the Rigid Amorphous Phase of Poly(L-Lactide)-Based Nanocomposites with Different Layered Doubled Hydroxides as Nanofiller. Polymer 2019, 184, 121929. [Google Scholar] [CrossRef]
- Monnier, X.; Cavallo, D.; Righetti, M.C.; Di Lorenzo, M.L.; Marina, S.; Martin, J.; Cangialosi, D. Physical Aging and Glass Transition of the Rigid Amorphous Fraction in Poly(l-Lactic Acid). Macromolecules 2020, 53, 8741–8750. [Google Scholar] [CrossRef]
- Snowdon, M.R.; Wu, F.; Mohanty, A.K.; Misra, M. Comparative Study of the Extrinsic Properties of Poly(Lactic Acid)-Based Biocomposites Filled with Talc: Versus Sustainable Biocarbon. RSC Adv. 2019, 9, 6752–6761. [Google Scholar] [CrossRef]
- Abdelwahab, M.; Codou, A.; Anstey, A.; Mohanty, A.K.; Misra, M. Studies on the Dimensional Stability and Mechanical Properties of Nanobiocomposites from Polyamide 6-Filled with Biocarbon and Nanoclay Hybrid Systems. Compos. Part A Appl. Sci. Manuf. 2020, 129, 105695. [Google Scholar] [CrossRef]
- Wootthikanokkhan, J.; Cheachun, T.; Sombatsompop, N.; Thumsorn, S.; Kaabbuathong, N.; Wongta, N.; Wong-On, J.; Na Ayutthaya, S.I.; Kositchaiyong, A. Crystallization and Thermomechanical Properties of PLA Composites: Effects of Additive Types and Heat Treatment. J. Appl. Polym. Sci. 2013, 129, 215–223. [Google Scholar] [CrossRef]
- Szust, A.; Adamski, G. Using Thermal Annealing and Salt Remelting to Increase Tensile Properties of 3D FDM Prints. Eng. Fail. Anal. 2022, 132, 105932. [Google Scholar] [CrossRef]
- Bhandari, S.; Lopez-Anido, R.A.; Gardner, D.J. Enhancing the Interlayer Tensile Strength of 3D Printed Short Carbon Fiber Reinforced PETG and PLA Composites via Annealing. Addit. Manuf. 2019, 30, 100922. [Google Scholar] [CrossRef]


| Sample | MMT [%] | BC [%] | Talc [%] |
|---|---|---|---|
| PLA | - | - | - |
| PLA/1MMT | 1 | - | - |
| PLA/2MMT | 2 | - | - |
| PLA/5MMT | 5 | - | - |
| PLA/10BC | - | 10 | - |
| PLA/20BC | - | 20 | - |
| PLA/10Talc | - | - | 10 |
| PLA/20Talc | - | - | 20 |
| Sample | Density (Calculated) [g/cm3] | Density (of Filament) [g/cm3] | Density (of FDM Part) [g/cm3] | Porosity (of FDM Part) [%] |
|---|---|---|---|---|
| PLA | 1.25 * | 1.247 (±0.005) | 1.203 (±0.034) | 3.9 |
| PLA/1MMT | 1.26 | 1.245 (±0.015) | 1.214 (±0.031) | 3.6 |
| PLA/2MMT | 1.26 | 1.246 (±0.008) | 1.218 (±0.047) | 3.3 |
| PLA/5MMT | 1.28 | 1.269 (±0.011) | 1.231 (±0.010) | 3.8 |
| PLA/10BC | 1.28 | 1.267 (±0.014) | 1.235 (±0.021) | 3.5 |
| PLA/20BC | 1.31 | 1.297 (±0.009) | 1.261 (±0.042) | 3.7 |
| PLA/10Talc | 1.32 | 1.313 (±0.011) | 1.278 (±0.038) | 3.2 |
| PLA/20Talc | 1.41 | 1.394 (±0.007) | 1.337 (±0.054) | 5.2 |
Publisher’s Note: MDPI stays neutral with regard to jurisdictional claims in published maps and institutional affiliations. |
© 2022 by the authors. Licensee MDPI, Basel, Switzerland. This article is an open access article distributed under the terms and conditions of the Creative Commons Attribution (CC BY) license (https://creativecommons.org/licenses/by/4.0/).
Share and Cite
Andrzejewski, J.; Markowski, M.; Barczewski, M. The Use of Nanoscale Montmorillonite (MMT) as Reinforcement for Polylactide Acid (PLA) Prepared by Fused Deposition Modeling (FDM)—Comparative Study with Biocarbon and Talc Fillers. Materials 2022, 15, 5205. https://doi.org/10.3390/ma15155205
Andrzejewski J, Markowski M, Barczewski M. The Use of Nanoscale Montmorillonite (MMT) as Reinforcement for Polylactide Acid (PLA) Prepared by Fused Deposition Modeling (FDM)—Comparative Study with Biocarbon and Talc Fillers. Materials. 2022; 15(15):5205. https://doi.org/10.3390/ma15155205
Chicago/Turabian StyleAndrzejewski, Jacek, Mateusz Markowski, and Mateusz Barczewski. 2022. "The Use of Nanoscale Montmorillonite (MMT) as Reinforcement for Polylactide Acid (PLA) Prepared by Fused Deposition Modeling (FDM)—Comparative Study with Biocarbon and Talc Fillers" Materials 15, no. 15: 5205. https://doi.org/10.3390/ma15155205
APA StyleAndrzejewski, J., Markowski, M., & Barczewski, M. (2022). The Use of Nanoscale Montmorillonite (MMT) as Reinforcement for Polylactide Acid (PLA) Prepared by Fused Deposition Modeling (FDM)—Comparative Study with Biocarbon and Talc Fillers. Materials, 15(15), 5205. https://doi.org/10.3390/ma15155205