
Measurement of Water Absorption of Recycled Aggregate


Abstract
:1. Introduction
2. Absorption Behaviors and Moisture States of RA
2.1. Absorption Behaviors
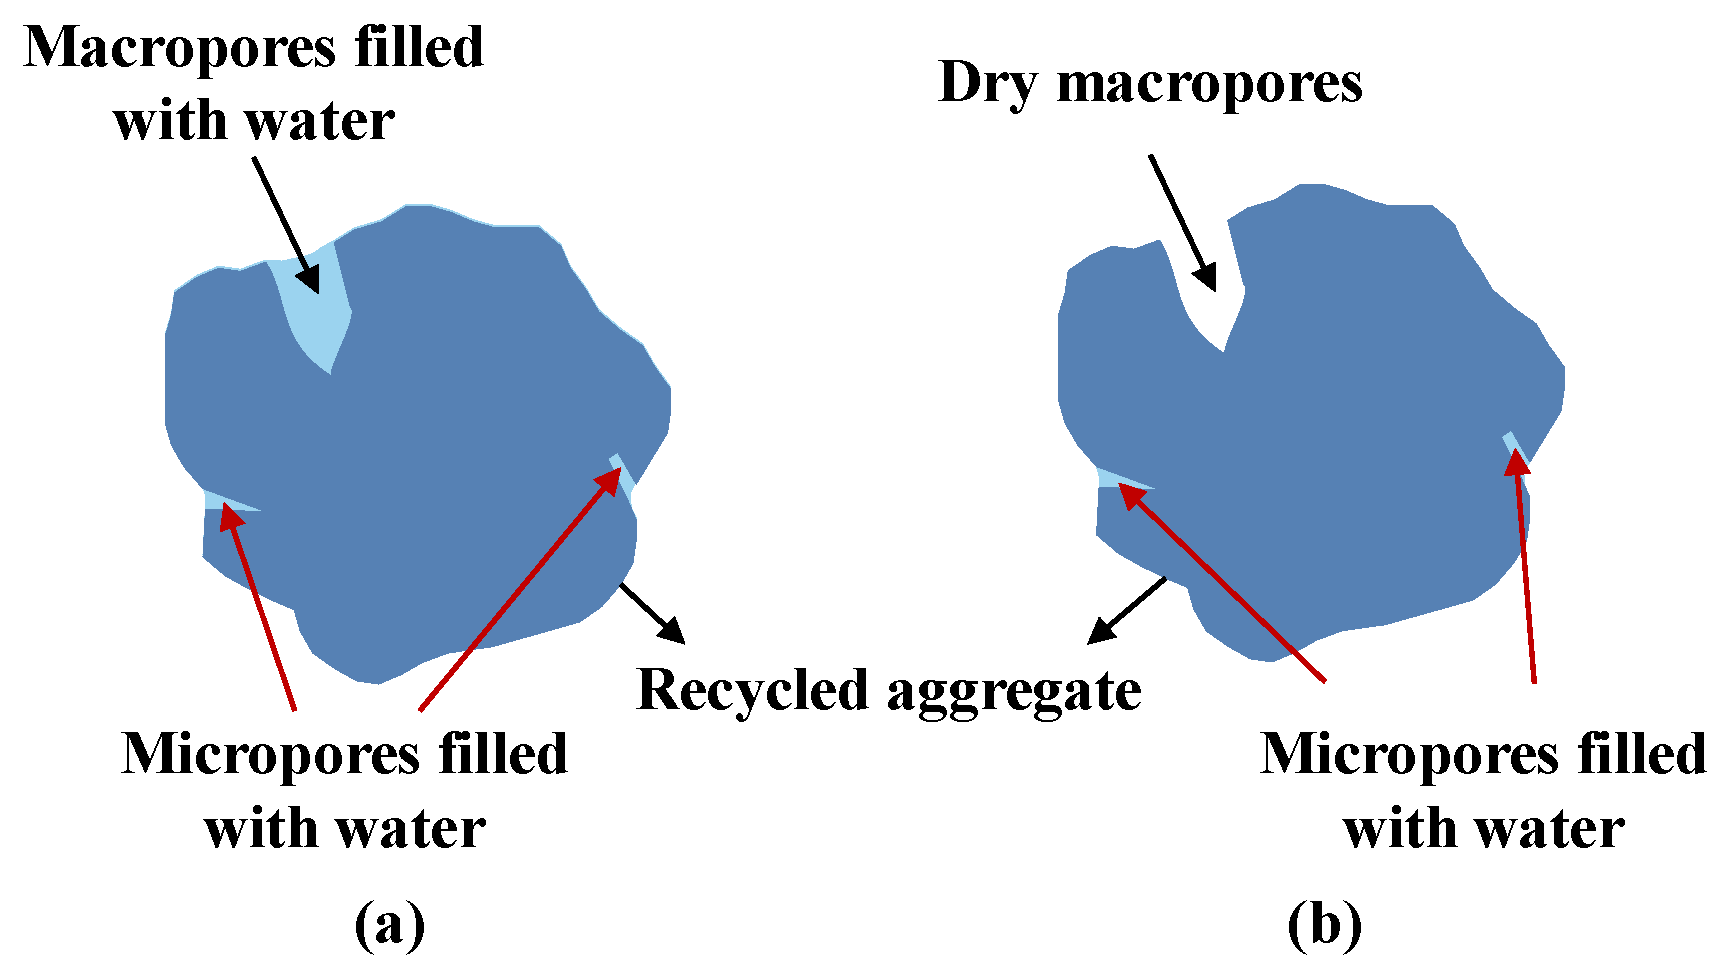
2.2. Moisture States
3. Measurement Methods for WSSD of RA
3.1. Standard Methods
3.1.1. Wiping
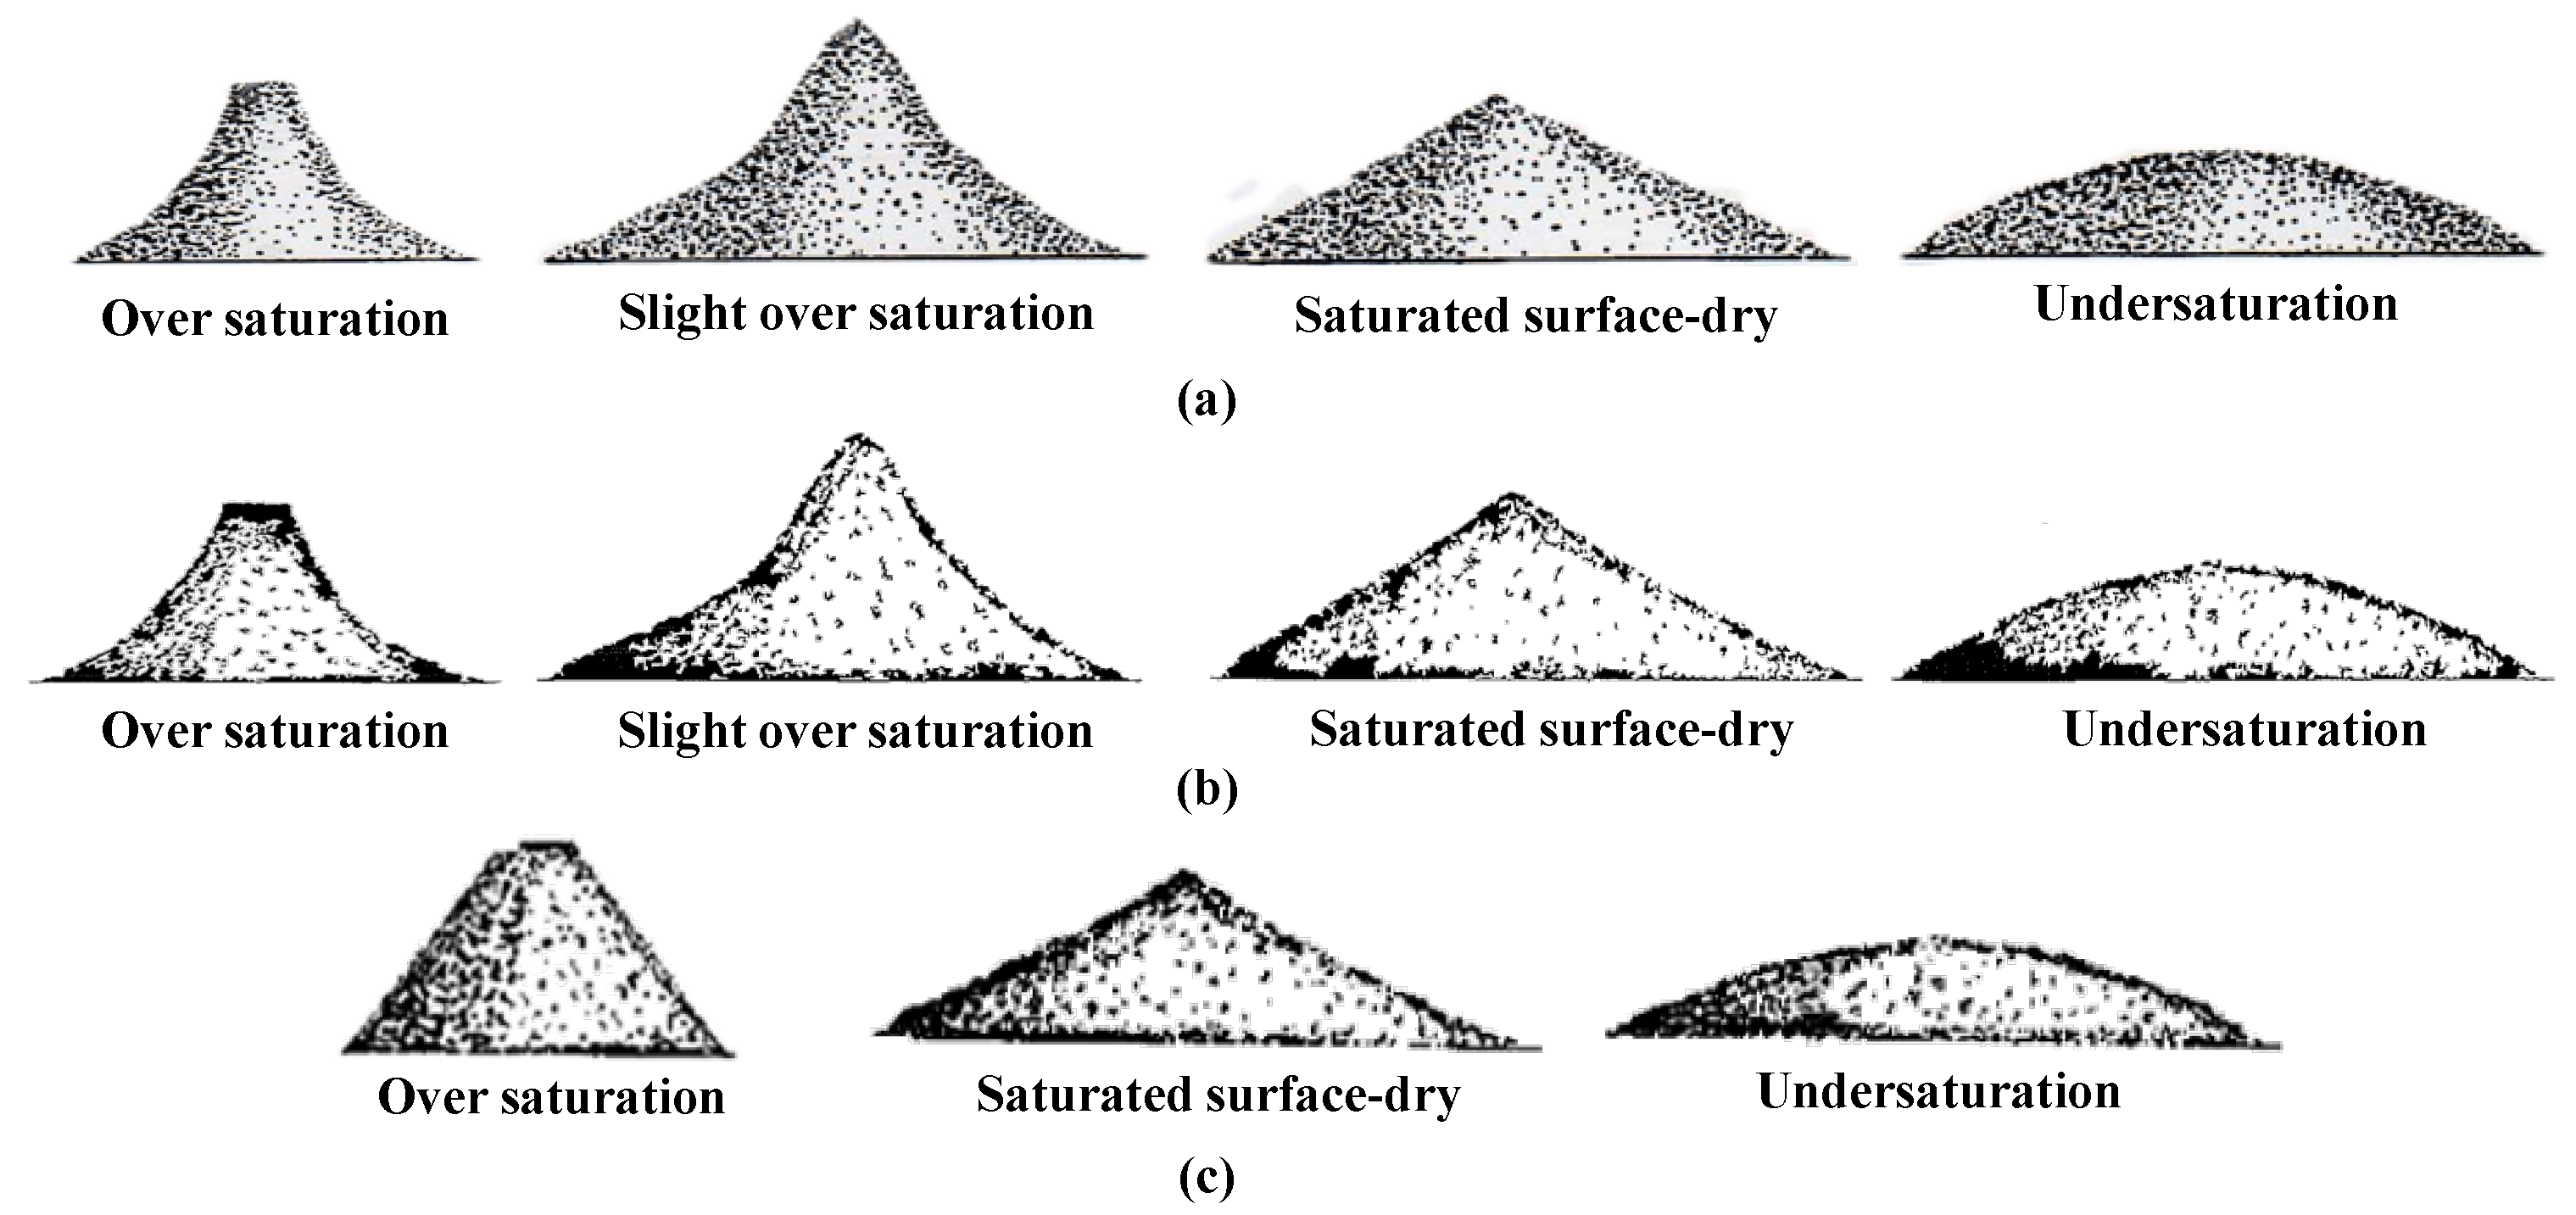
3.1.2. Slumping
3.2. Centrifugation
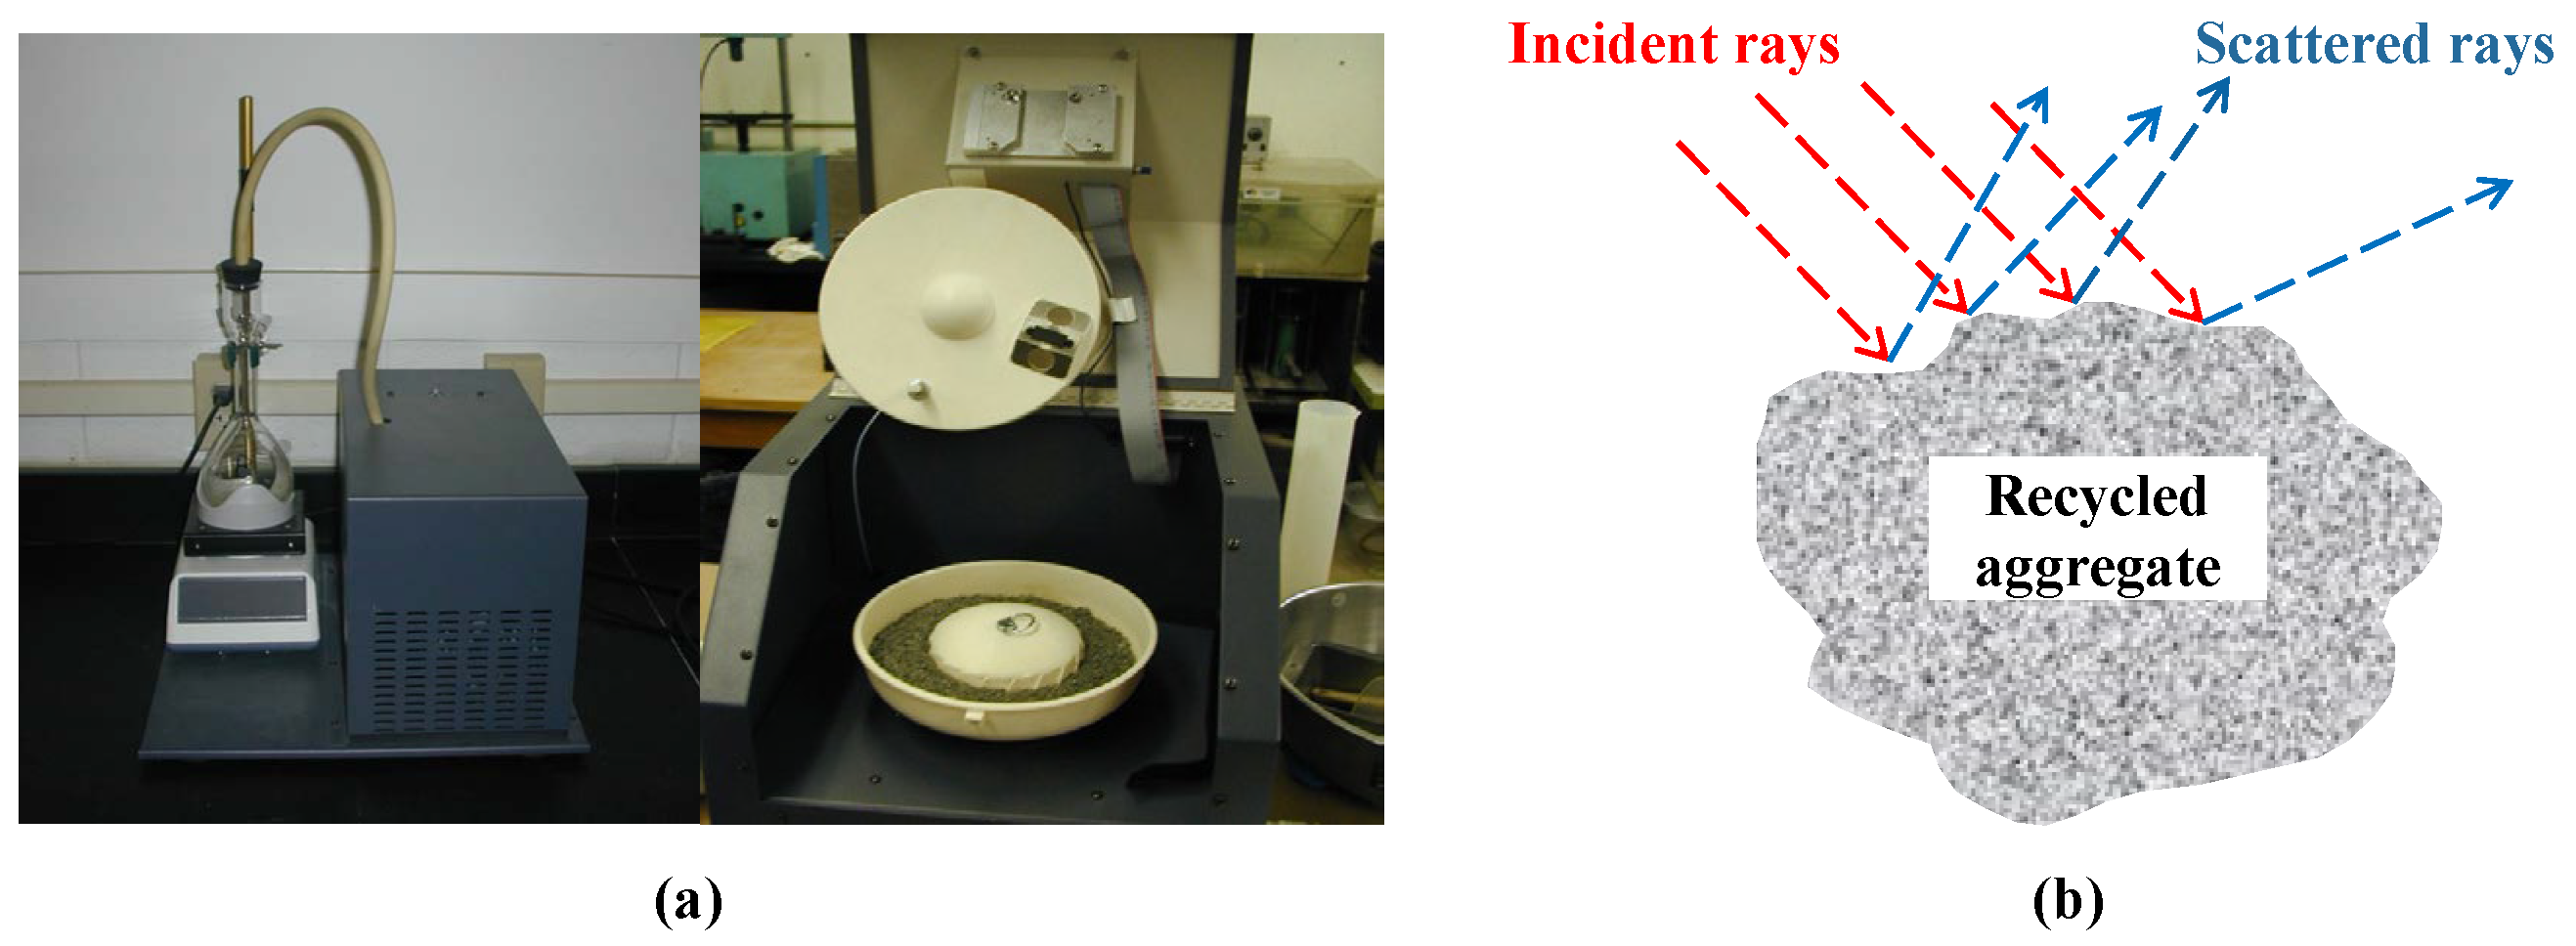
3.3. Infrared
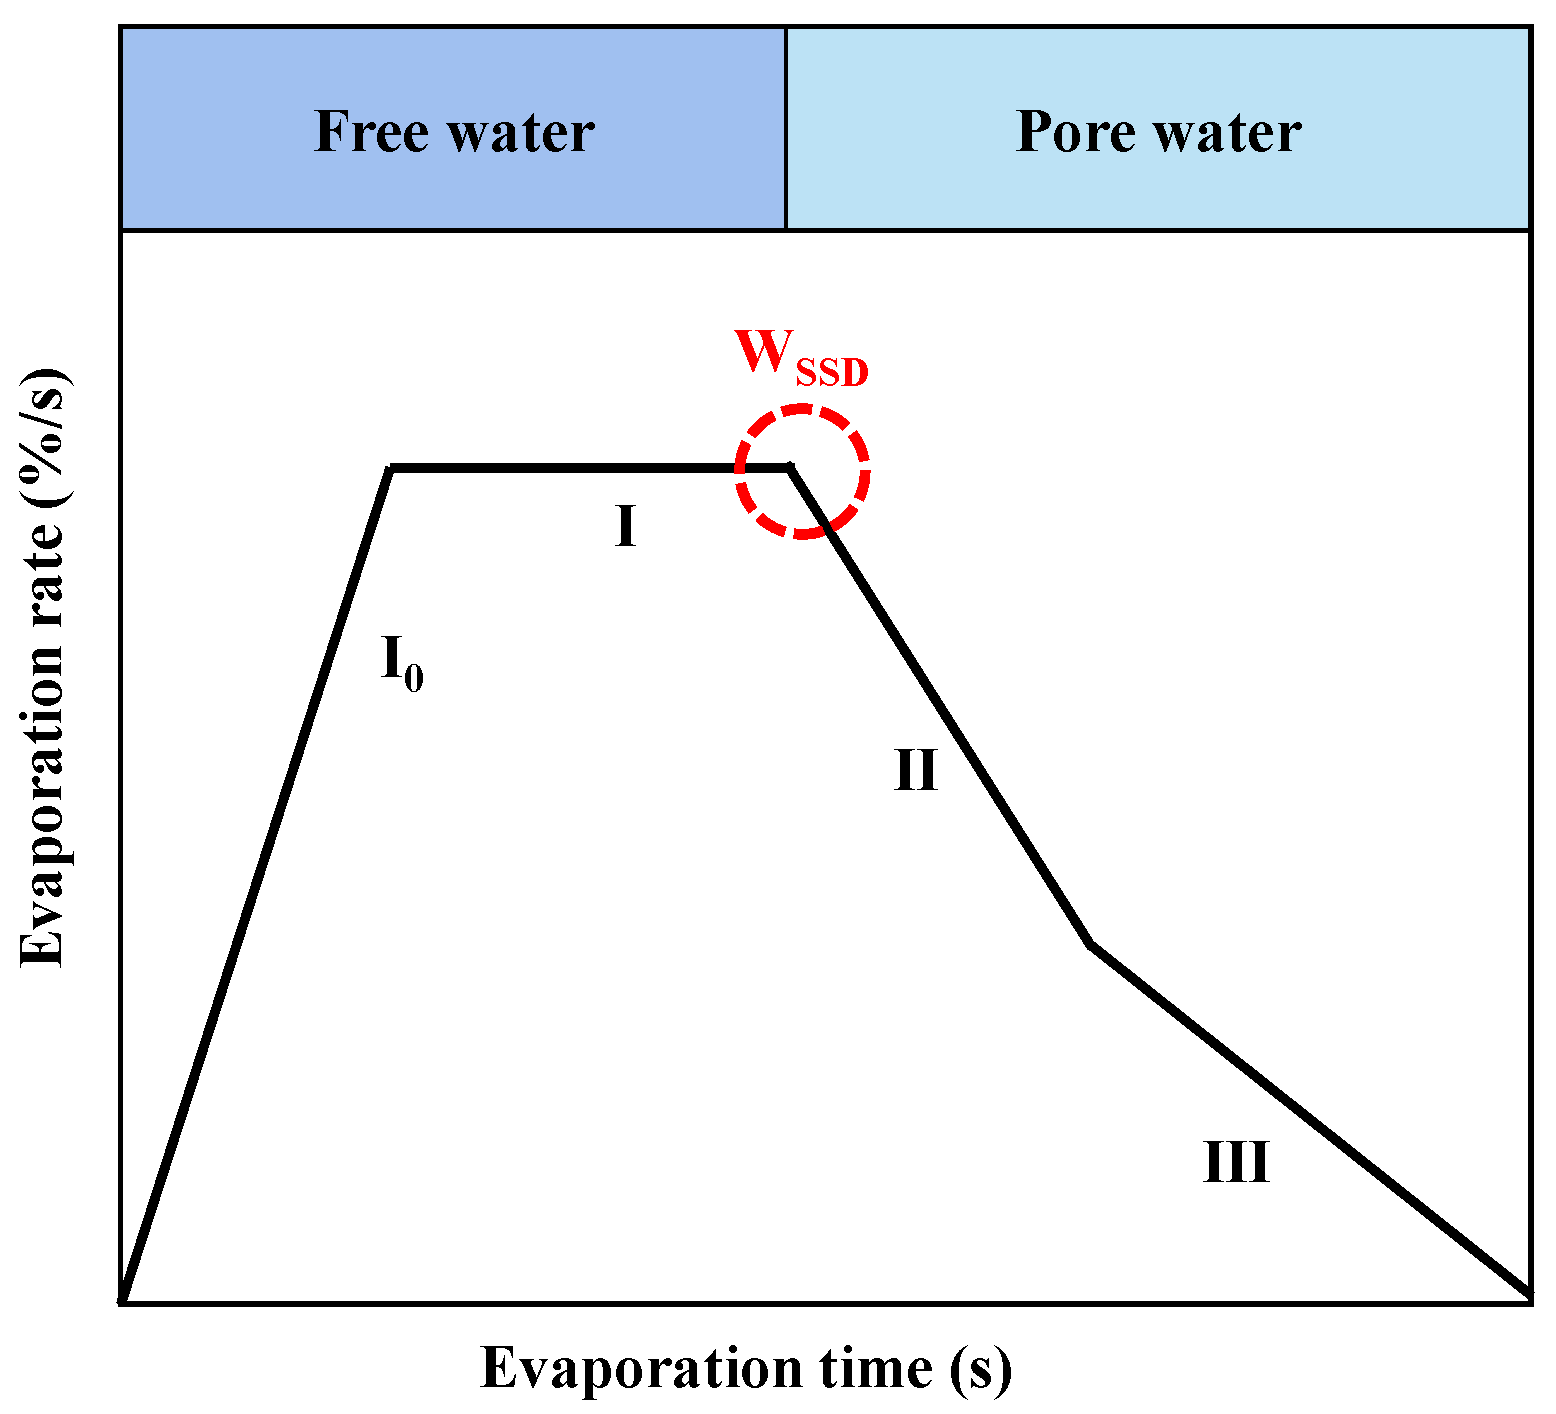
3.4. Evaporation
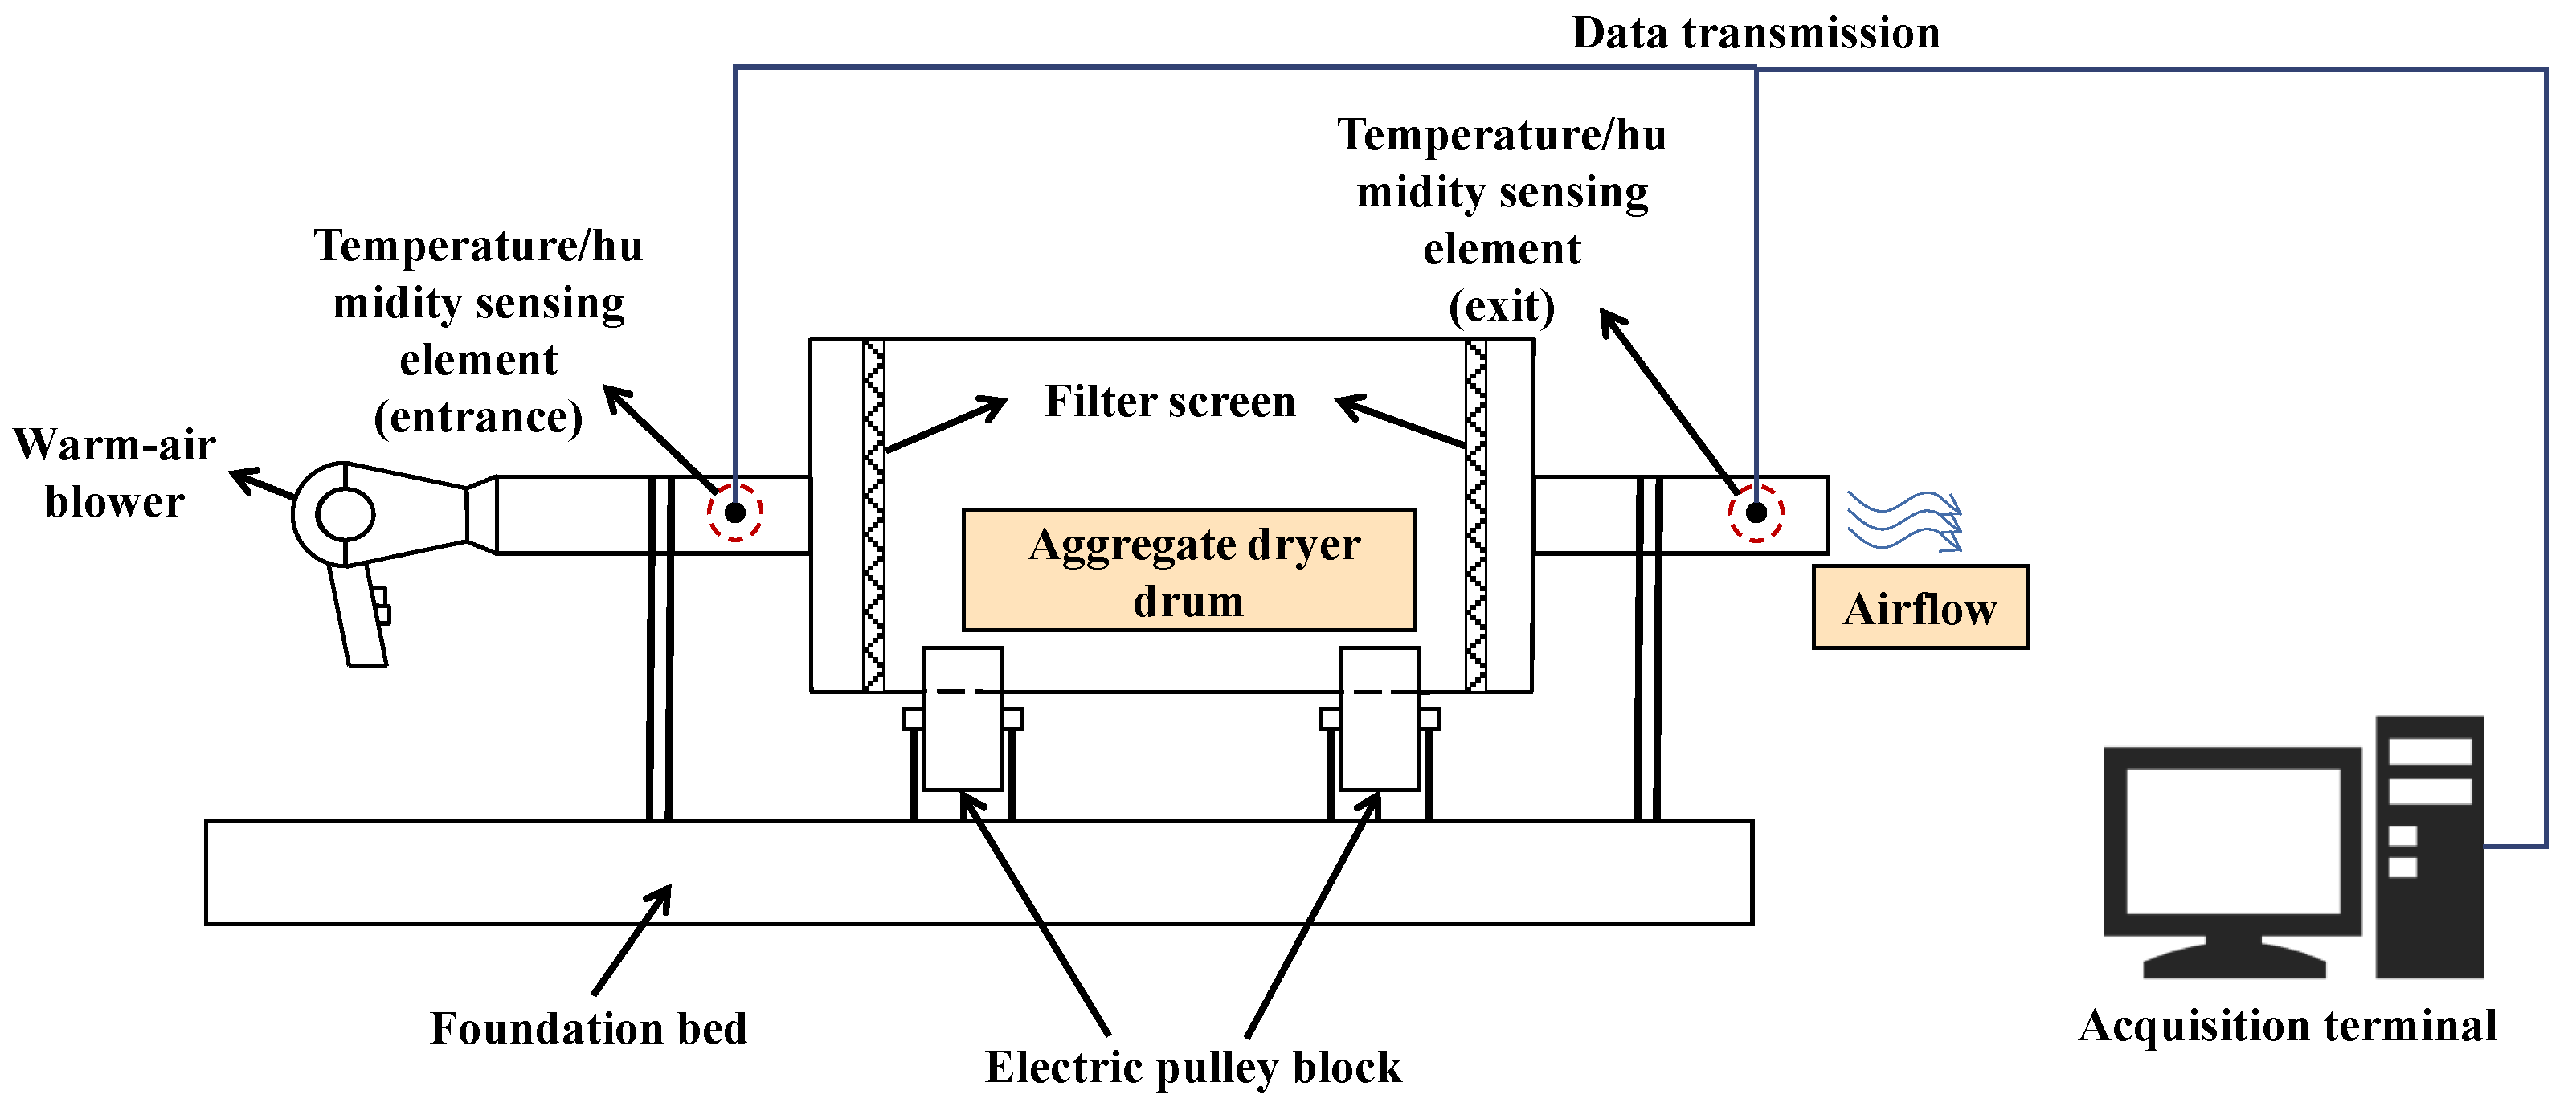
3.5. Airflow Drying
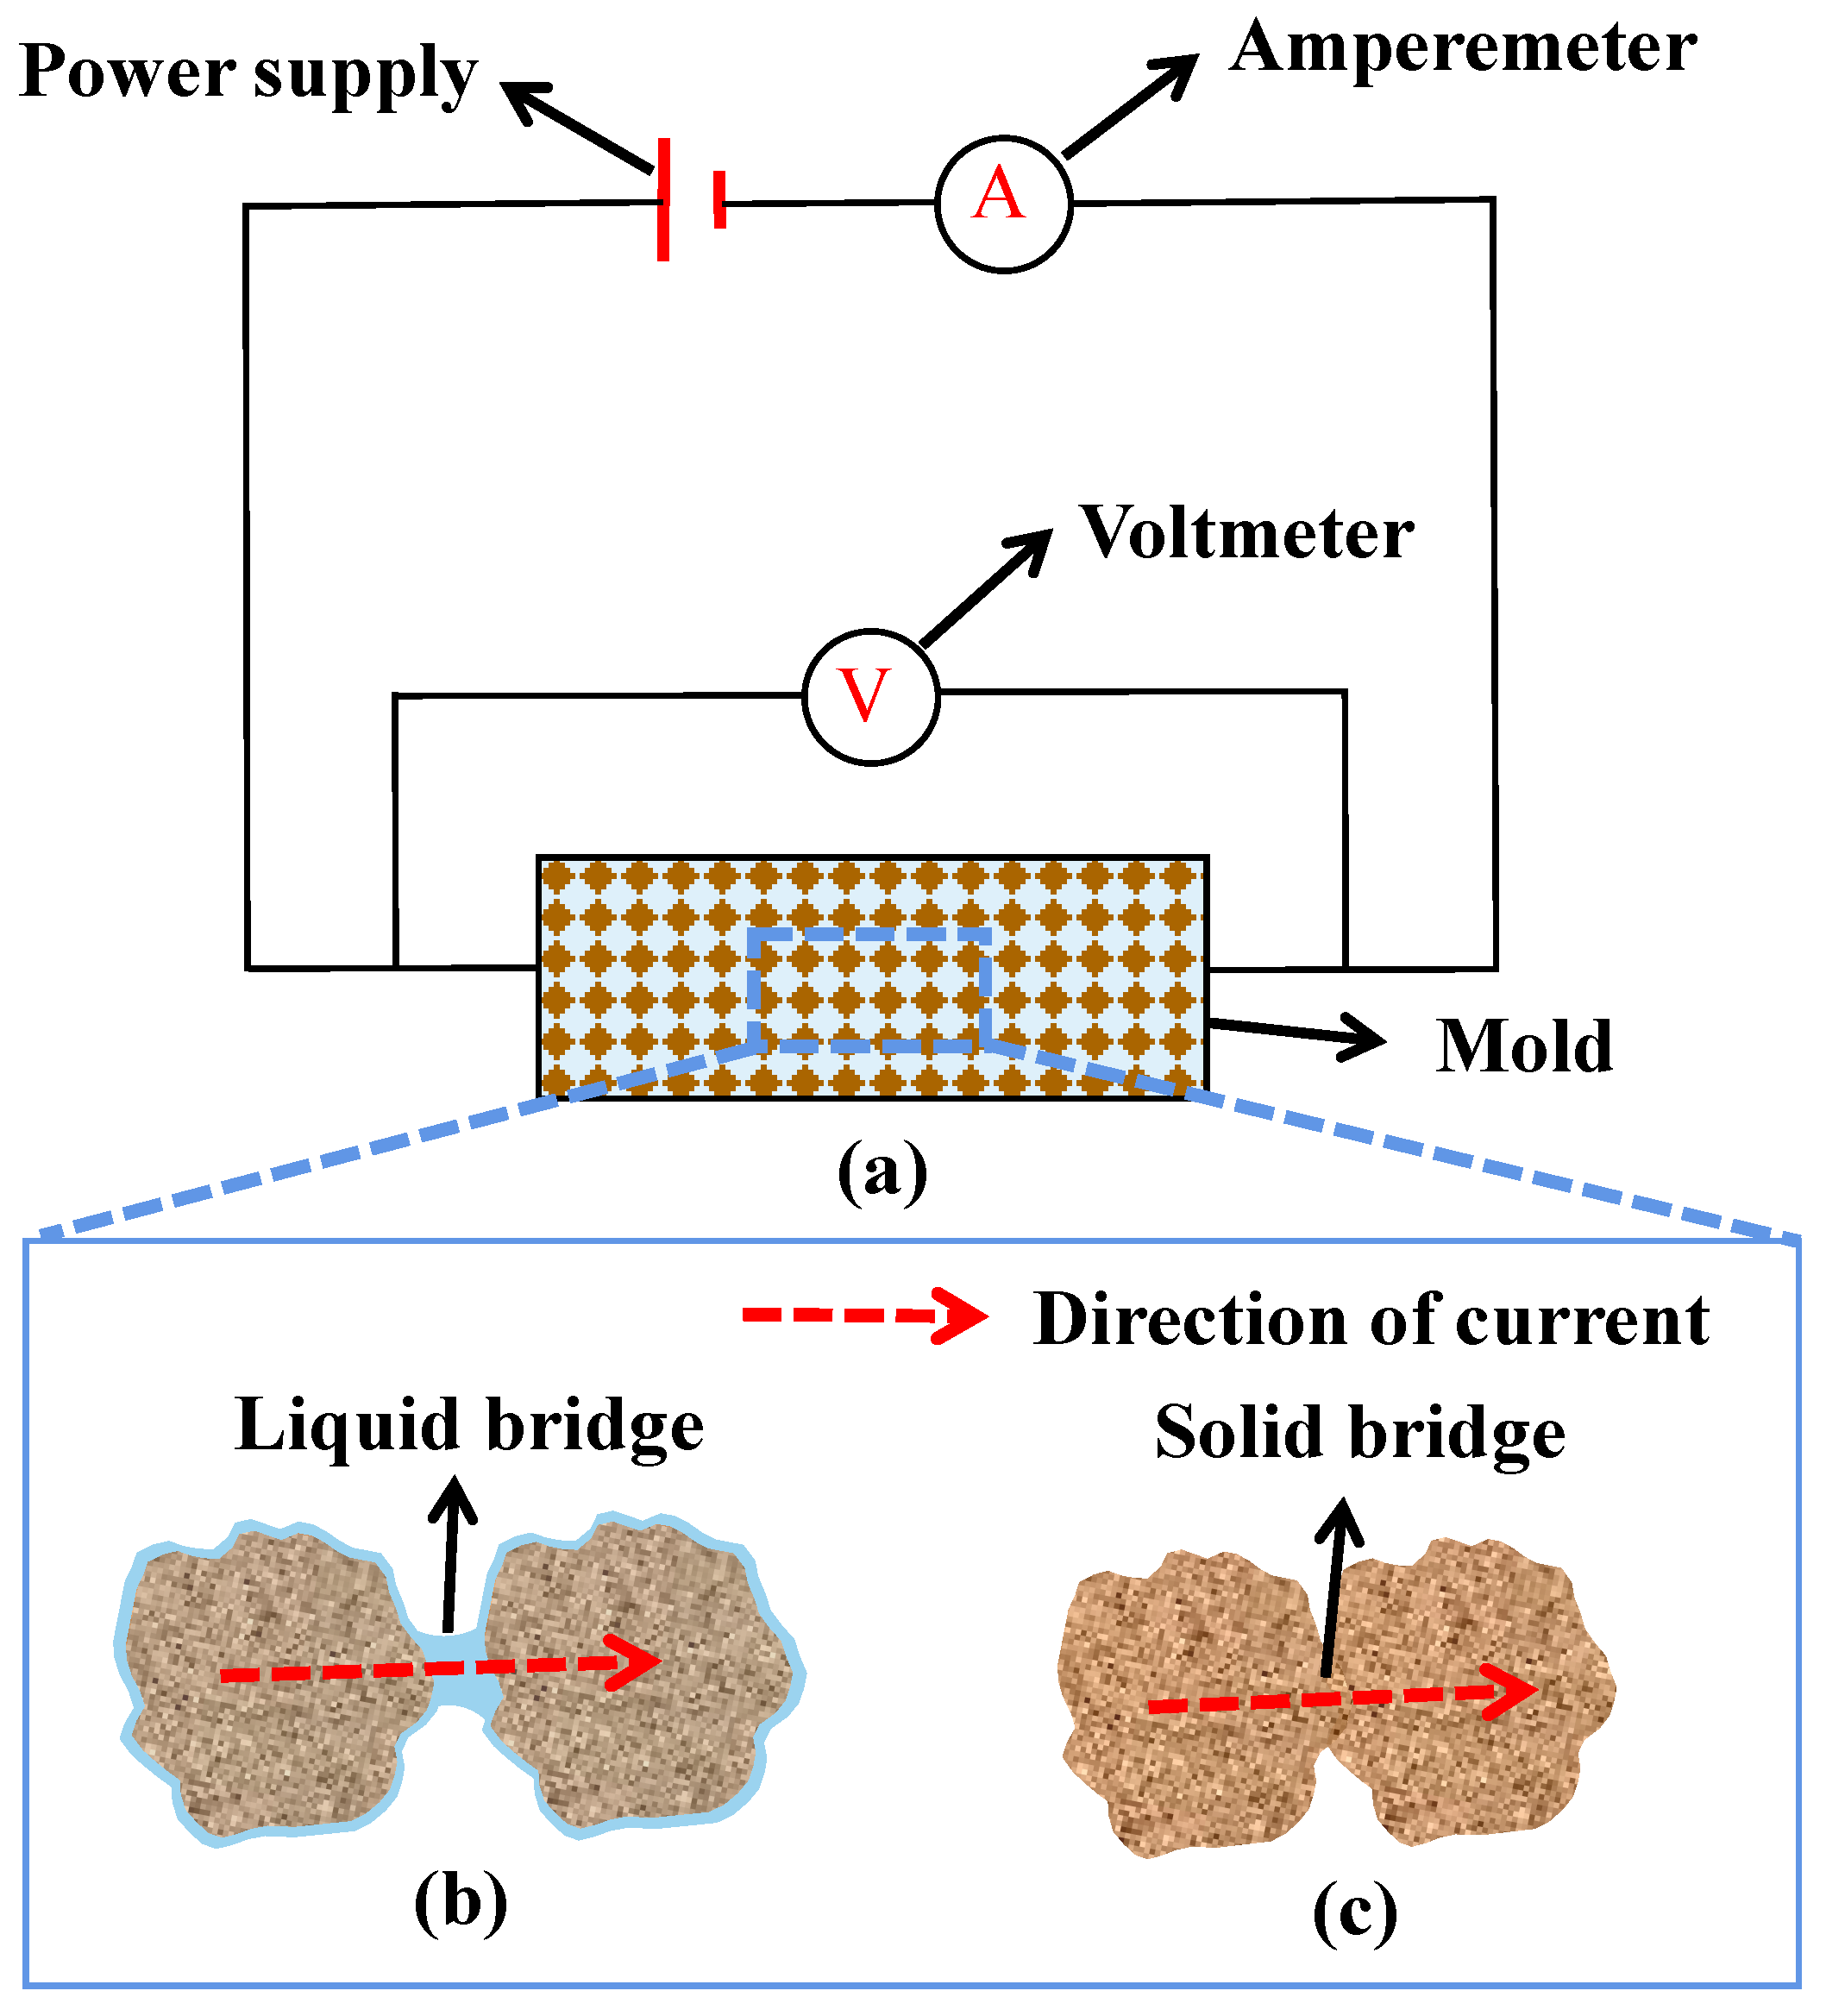
3.6. Conductivity
3.7. Pycnometer
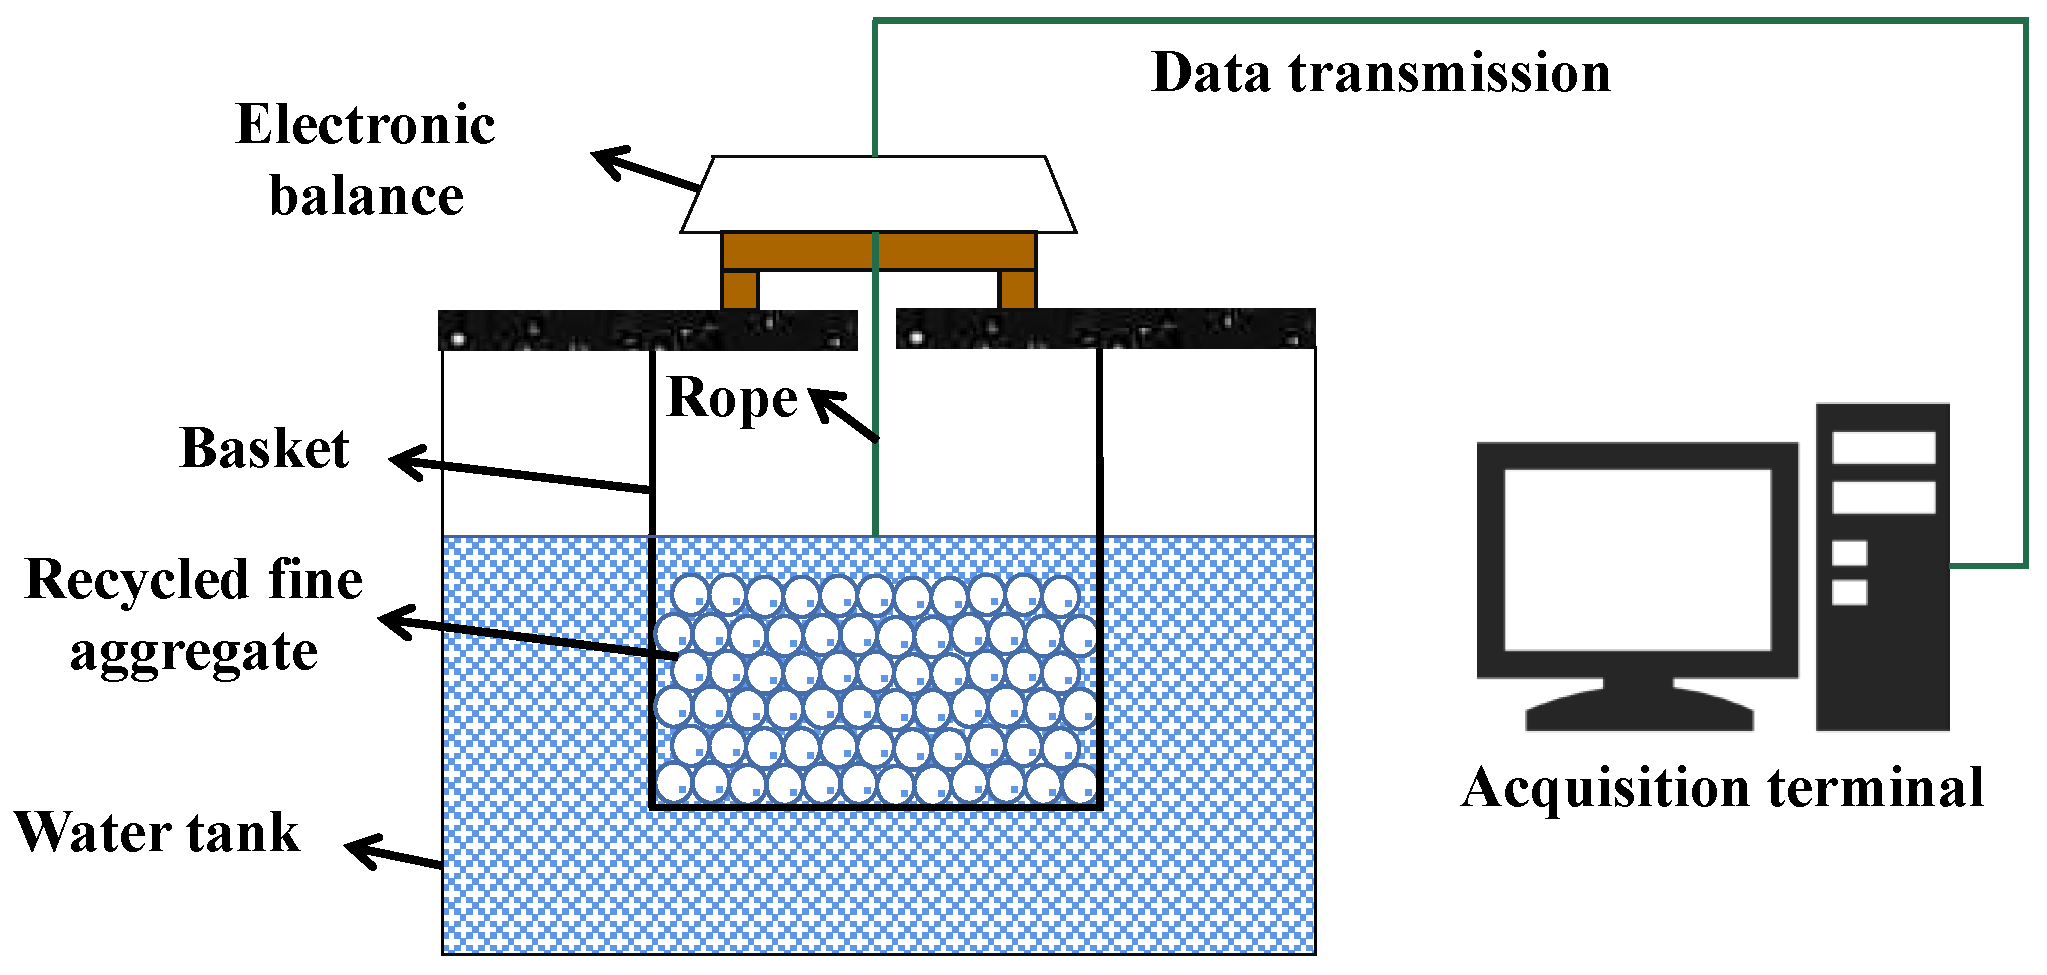
3.8. Hydrostatic Balance
3.9. Extrapolation
4. Prospects
4.1. Suggestions for Slumping
4.2. Suggestions for Heat Transfer
4.3. Suggestions for Absorption Kinetics
4.4. Suggestions for Conductivity
4.5. Suggestions for other Methods
5. Conclusions
- (1)
- Compared with NA, the absorption behaviors of RA have four outstanding features, including higher capacity, larger standard deviations, and time and size dependency. Furthermore, RA has five categories of moisture states. The AD state is an ideal moisture state for RA and the SSD state is usually used to evaluate the additional water of RAC.
- (2)
- In most standards, Wiping and Slumping are used to measure the WSSD of RCA and RFA, respectively. However, the operation of Slumping heavily depends on the operator’s experience because of vague definitions of the slumped shape of RFA. Furthermore, the physical principle of Slumping and its relationship to particle size are still unclear.
- (3)
- The physical principles of Evaporation, Airflow drying, Pycnometer, Hydrostatic balance, and Centrifugation are almost faultless. However, many problems exist in the operation of these methods. For example, the water on one side of RA is largely retained during Centrifugation. Furthermore, during Hydrostatic balance, RFA would absorb a part of water before determining the initial reading.
- (4)
- Although Infrared, Conductivity, and Extrapolation are easy to operate, their physical principles need to be improved. For instance, it is crucial for Infrared to update the water film coefficient formula to be suitable for RFA. In addition, the influence of water content on the bulk density of RFA and the number of inter-particle contacts in Conductivity should be clarified.
- (5)
- To develop an accurate and convenient method for measuring the WSSD of RA, several suggestions are proposed, including the combination of Evaporation and Airflow drying where the mass change of RFA can be recorded after each tumble, the liquid selection in Hydrostatic balance (e.g., kerosene or paraffin), and the addition of a tiny mixer in each centrifuge tube.
Author Contributions
Funding
Institutional Review Board Statement
Informed Consent Statement
Conflicts of Interest
References
- Ding, T.; Xiao, J.Z.; Qin, F.; Duan, Z.H. Mechanical behavior of 3D printed mortar with recycled sand at early ages. Constr. Build. Mater. 2020, 248, 118654. [Google Scholar] [CrossRef]
- Xiao, J.Z.; Zou, S.; Yu, Y.; Wang, Y.; Ding, T.; Zhu, Y.; Yu, J.T.; Li, S.S.; Duan, Z.H.; Wu, Y.C.; et al. 3D recycled mortar printing: System development, process design, material properties and on-site printing. J. Build. Eng. 2020, 32, 101779. [Google Scholar] [CrossRef]
- Lu, J.X.; Shen, P.L.; Zheng, H.B.; Zhan, B.J.; Ali, H.A.; He, P.P.; Poon, C.S. Synergetic recycling of waste glass and recycled aggregates in cement mortars: Physical, durability and microstructure performance. Cem. Concr. Compos. 2020, 113, 103632. [Google Scholar] [CrossRef]
- Yao, J.; Zhang, D.; Li, Y.L.; Zhang, Q.; Gao, J.F. Quantifying the hydrodynamic impacts of cumulative sand mining on a large river-connected floodplain lake: Poyang Lake. J. Hydrol. 2019, 579, 124156. [Google Scholar] [CrossRef]
- Ye, T.H.; Xiao, J.Z.; Zhao, W.J.; Duan, Z.H.; Xu, Y.F. Combined use of recycled concrete aggregate and glass cullet in mortar: Strength, alkali expansion and chemical compositions. J. Build. Eng. 2022, 55, 104721. [Google Scholar] [CrossRef]
- Salgado, F.D.; Silva, F.D. Recycled aggregates from construction and demolition waste towards an application on structural concrete: A review. J. Build. Eng. 2022, 52, 104452. [Google Scholar] [CrossRef]
- Skariah Thomas, B.; Yang, J.; Bahurudeen, A.; Chinnu, S.N.; Abdalla, J.A.; Hawileh, R.A.; Hamada, H.M. Geopolymer concrete incorporating recycled aggregates: A comprehensive review. Clean. Mater. 2022, 3, 100056. [Google Scholar] [CrossRef]
- Wang, B.; Yan, L.B.; Fu, Q.N.; Kasal, B. A Comprehensive Review on Recycled Aggregate and Recycled Aggregate Concrete. Resour. Conserv. Recycl. 2021, 171, 105565. [Google Scholar] [CrossRef]
- Liu, Q.; Xiao, J.Z.; Poon, C.S.; Li, L. Investigation on modeled recycled concrete prepared with recycled concrete aggregate and recycled brick aggregate. J. Build. Struct. 2020, 41, 133–140. (In Chinese) [Google Scholar] [CrossRef]
- Han, Y.L.; Yang, Z.H.; Ding, T.; Xiao, J.Z. Environmental and economic assessment on 3D printed buildings with recycled concrete. J. Clean. Prod. 2021, 278, 123884. [Google Scholar] [CrossRef]
- Duan, Z.H.; Singh, A.; Xiao, J.Z.; Hou, S.D. Combined use of recycled powder and recycled coarse aggregate derived from construction and demolition waste in self-compacting concrete. Constr. Build. Mater. 2020, 254, 119323. [Google Scholar] [CrossRef]
- Xiao, J.Z.; Li, W.G.; Fan, Y.H.; Huang, X. An overview of study on recycled aggregate concrete in China (1996-2011). Constr. Build. Mater. 2012, 31, 364–383. [Google Scholar] [CrossRef]
- Tam, V.W.Y.; Gao, X.F.; Tam, C.M. Microstructural analysis of recycled aggregate concrete produced from two-stage mixing approach. Cem. Concr. Res. 2005, 35, 1195–1203. [Google Scholar] [CrossRef] [Green Version]
- Purushothaman, R.; Amirthavalli, R.R.; Karan, L. Influence of Treatment Methods on the Strength and Performance Characteristics of Recycled Aggregate Concrete. J. Mater. Civ. Eng. 2015, 27, 04014168. [Google Scholar] [CrossRef]
- Florea, M.V.A.; Brouwers, H.J.H. Properties of various size fractions of crushed concrete related to process conditions and re-use. Cem. Concr. Res. 2013, 52, 11–21. [Google Scholar] [CrossRef]
- Zhang, X.B.; Deng, S.C.; Qin, Y.H. Additional adsorbed water in recycled concrete. J. Cent. South Univ. Technol. 2007, 14, 449–453. [Google Scholar] [CrossRef]
- Quattrone, M.; Cazacliu, B.; Angulo, S.C.; Hamard, E.; Cothenet, A. Measuring the water absorption of recycled aggregates, what is the best practice for concrete production? Constr. Build. Mater. 2016, 123, 690–703. [Google Scholar] [CrossRef]
- Mefteh, H.; Kebaili, O.; Oucief, H.; Berredjem, L.; Arabi, N. Influence of moisture conditioning of recycled aggregates on the properties of fresh and hardened concrete. J. Clean. Prod. 2013, 54, 282–288. [Google Scholar] [CrossRef]
- Khoury, E.; Cazacliu, B.; Remond, S. Impact of the initial moisture level and pre-wetting history of recycled concrete aggregates on their water absorption. Mater. Struct. 2017, 50, 229. [Google Scholar] [CrossRef]
- Montero, J.; Laserna, S. Influence of effective mixing water in recycled concrete. Constr. Build. Mater. 2017, 132, 343–352. [Google Scholar] [CrossRef]
- Delobel, F.; Bulteel, D.; Mechling, J.M.; Lecomte, A.; Cyr, M.; Remond, S. Application of ASR tests to recycled concrete aggregates: Influence of water absorption. Constr. Build. Mater. 2016, 124, 714–721. [Google Scholar] [CrossRef]
- Huang, H.S.; Zheng, J.L. Prediction Adequacy of Creep of Recycled Concrete Influenced by the Water Absorption in Recycled Aggregates. J. Test. Eval. 2019, 47, 2926–2946. [Google Scholar] [CrossRef]
- Li, B.; Hou, S.D.; Duan, Z.H.; Li, L.; Guo, W. Rheological behavior and compressive strength of concrete made with recycled fine aggregate of different size range. Constr. Build. Mater. 2021, 268, 121172. [Google Scholar] [CrossRef]
- Duan, Z.H.; Jiang, S.S.; Xiao, J.Z.; Hou, S.D.; Chen, X.L. Effect of moisture condition of recycled coarse aggregate on the properties of concrete. J. Build. Mater. 2021, 24, 545–550. (In Chinese) [Google Scholar] [CrossRef]
- Jiang, S.S. Basic Research on Rheological Properties of Recycled Concrete; Tongji University: Shanghai, China, 2020. (In Chinese) [Google Scholar]
- Miller, A.E.; Barrett, T.J.; Zander, A.; Weiss, W.J. Using a Centrifuge to Determine Moisture Properties of Lightweight Fine Aggregate for Use in Internal Curing. Adv. Civil. Eng. Mater. 2014, 3, 142–157. [Google Scholar] [CrossRef]
- Xiao, J.Z.; Poon, C.S.; Wang, Y.Y.; Zhao, Y.X.; Ding, T.; Geng, Y.; Ye, T.H.; Li, L. Fundamental behaviour of recycled aggregate concrete-Overview I: Strength and deformation. Mag. Concr. Res. 2022, 1–12. [Google Scholar] [CrossRef]
- Xiao, J.Z.; Poon, C.S.; Zhao, Y.X.; Wang, Y.Y.; Ye, T.H.; Duan, Z.H.; Peng, L.G. Fundamental behavior of recycled aggregate concrete-overview II: Durability and enhancement. Mag. Concr. Res. 2022, 1–17. [Google Scholar] [CrossRef]
- Tazawa, E.; Miyazawa, S.; Kasai, T. Chemical Shrinkage and Autogenous Shrinkage of Hydrating Cement Paste. Cem. Concr. Res. 1995, 25, 288–292. [Google Scholar] [CrossRef]
- Kovler, K.; Zhutovsky, S. Overview and future trends of shrinkage research. Mater. Struct. 2006, 39, 827–847. [Google Scholar] [CrossRef]
- Gajewicz-Jaromin, A.M.; McDonald, P.J.; Muller, A.C.A.; Scrivener, K.L. Influence of curing temperature on cement paste microstructure measured by H-1 NMR relaxometry. Cem. Concr. Res. 2019, 122, 147–156. [Google Scholar] [CrossRef]
- Avet, F.; Boehm-Courjault, E.; Scrivener, K. Investigation of C-A-S-H composition, morphology and density in Limestone Calcined Clay Cement (LC3). Cem. Concr. Res. 2019, 115, 70–79. [Google Scholar] [CrossRef]
- Zhang, Z.Q.; Zhang, Y.F.; Yan, C.G.; Liu, Y.X. Influence of crushing index on properties of recycled aggregates pervious concrete. Constr. Build. Mater. 2017, 135, 112–118. [Google Scholar] [CrossRef]
- Park, S.S.; Kim, S.J.; Chen, K.; Lee, Y.J.; Lee, S.B. Crushing characteristics of a recycled aggregate from waste concrete. Constr. Build. Mater. 2018, 160, 100–105. [Google Scholar] [CrossRef]
- Padmini, A.K.; Ramamurthy, K.; Mathews, M.S. Influence of parent concrete on the properties of recycled aggregate concrete. Constr. Build. Mater. 2009, 23, 829–836. [Google Scholar] [CrossRef]
- Duan, Z.H.; Han, N.; Singh, A.; Xiao, J.Z. Multi-Scale Investigation on Concrete Prepared with Recycled Aggregates from Different Parent Concrete. J. Renew. Mater. 2020, 8, 1375–1390. [Google Scholar] [CrossRef]
- Marie, I.; Mujalli, R. Effect of design properties of parent concrete on the morphological properties of recycled concrete aggregates. Eng. Sci. Technol. 2019, 22, 334–345. [Google Scholar] [CrossRef]
- Therene, F.; Keita, E.; Nael-Redolfi, J.; Boustingorry, P.; Bonafous, L.; Roussel, N. Water absorption of recycled aggregates: Measurements, influence of temperature and practical consequences. Cem. Concr. Res. 2020, 137, 106196. [Google Scholar] [CrossRef]
- Li, Z.; Liu, J.P.; Xiao, J.Z.; Zhong, P.H. Internal curing effect of saturated recycled fine aggregates in early-age mortar. Cem. Concr. Compos. 2020, 108, 103444. [Google Scholar] [CrossRef]
- Kiuchi, T.; Horiuchi, E. An Experimental Study on Recycle Concrete by using HighQuality Recycled Coarse Aggregate. Mem. Fac. Eng. Osaka City Univ. 2003, 44, 37–44. [Google Scholar]
- Pani, L.; Francesconi, L.; Rombi, J.; Mistretta, F.; Sassu, M.; Stochino, F. Effect of Parent Concrete on the Performance of Recycled Aggregate Concrete. Sustainability 2020, 12, 9399. [Google Scholar] [CrossRef]
- Fonseca, N.; de Brito, J.; Evangelista, L. The influence of curing conditions on the mechanical performance of concrete made with recycled concrete waste. Cem. Concr. Compos. 2011, 33, 637–643. [Google Scholar] [CrossRef]
- Agrela, F.; de Juan, M.S.; Ayuso, J.; Geraldes, V.L.; Jimenez, J.R. Limiting properties in the characterisation of mixed recycled aggregates for use in the manufacture of concrete. Constr. Build. Mater. 2011, 25, 3950–3955. [Google Scholar] [CrossRef] [Green Version]
- Evangelista, L.; Guedes, M.; de Brito, J.; Ferro, A.C.; Pereira, M.F. Physical, chemical and mineralogical properties of fine recycled aggregates made from concrete waste. Constr. Build. Mater. 2015, 86, 178–188. [Google Scholar] [CrossRef]
- Zhao, Z.F.; Remond, S.; Damidot, D.; Xu, W.Y. Influence of fine recycled concrete aggregates on the properties of mortars. Constr. Build. Mater. 2015, 81, 179–186. [Google Scholar] [CrossRef]
- Tegguer, A.D. Determining the water absorption of recycled aggregates utilizing hydrostatic weighing approach. Constr. Build. Mater. 2012, 27, 112–116. [Google Scholar] [CrossRef]
- Poon, C.S.; Shui, Z.H.; Lam, L.; Fok, H.; Kou, S.C. Influence of moisture states of natural and recycled aggregates on the slump and compressive strength of concrete. Cem. Concr. Res. 2004, 34, 31–36. [Google Scholar] [CrossRef]
- Ji, T.; Chen, C.Y.; Chen, Y.Y.; Zhuang, Y.Z.; Chen, J.F.; Lin, X.J. Effect of moisture state of recycled fine aggregate on the cracking resistibility of concrete. Constr. Build. Mater. 2013, 44, 726–733. [Google Scholar] [CrossRef]
- Zhang, H.; Xu, X.; Liu, W.; Zhao, B.; Wang, Q. Influence of the moisture states of aggregate recycled from waste concrete on the performance of the prepared recycled aggregate concrete (RAC)–A review. Constr. Build. Mater. 2022, 326, 126891. [Google Scholar] [CrossRef]
- Sosa, M.E.; Zaccardi, Y.A.V.; Zega, C.J. A critical review of the resulting effective water-to-cement ratio of fine recycled aggregate concrete. Constr. Build. Mater. 2021, 313, 125536. [Google Scholar] [CrossRef]
- Li, Z.; Liu, J.P.; Zhong, P. Assessment of the absorption of fine recycled aggregates in paste–determination of free water content of paste. In Proceedings of the 4th International Conference on Sercice Life Design for Infrastructure, Delft, The Netherlands, 27–30 August 2018. [Google Scholar]
- Leite, M.B.; Lima, P.; Santos, A.C. Study of the consistency and mechanical behaviour of recycled mortars. In Proceedings of the 2nd International RILEM Conference on Progress of Recycling in the Built Environment, Sao Paulo, Brazil, 2–4 December 2009. [Google Scholar]
- NF EN 1097-6; Tests for Mechanical and Physical Properties of Aggregates—Part 6: Determination of Particle Density and Water Absorption. SIST: Ljubljana, Slovenija, 2013.
- BS 812; Testing Aggregates Part 2: Methods for Determination of Density. BSI: London, UK, 1995.
- ASTM C127-12; Standard Test Method for Density, Relative Density (Specific Gravity), and Absorption of Coarse Aggregate. ASTM: West Conshohocken, PA, USA, 2012.
- GB/T 25177; Recycled Coarse Aggregate for Concrete. National Standards of the People’s Republic of China: Beijing, China, 2010.
- Castro, J.; Keiser, L.; Golias, M.; Weiss, J. Absorption and desorption properties of fine lightweight aggregate for application to internally cured concrete mixtures. Cem. Concr. Compos. 2011, 33, 1001–1008. [Google Scholar] [CrossRef]
- NY 703-19 E; Moisture Content of Lightweight Fine Aggregate. New York State Department of Transportation: New York, NY, USA, 2008.
- IFSTTAR. Test Method No. 78. In Tests on Aggregates for Concrete: Measurement of Total Water Absorption by a Crushed Sand; IFSTTAR: Lille, France, 2011. [Google Scholar]
- GB/T 14684; Sand for Construction. National Standards of the People’s Republic of China: Beijing, China, 2011.
- ASTM C128-12; Standard Test Method for Relative Density (Specific Gravity) and Absorption of Fine Aggregate. ASTM: West Conshohocken, PA, USA, 2015.
- AASHTO T 84-13; Standard Method of Test for Specific Gravity and Absorption of Fine Aggregate. AASHTO: Washington, DC, USA, 2015.
- Kim, J.; Zi, G.; Lange, D.A. Measurement of Water Absorption of Very Fine Particles Using Electrical Resistivity. Aci Mater. J. 2017, 114, 957–965. [Google Scholar] [CrossRef]
- Ye, T.H.; Xiao, J.Z.; Duan, Z.H.; Li, S.S. Geopolymers made of recycled brick and concrete powder-A critical review. Constr. Build. Mater. 2022, 330, 127232. [Google Scholar] [CrossRef]
- Xiao, J.Z.; Lv, Z.Y.; Duan, Z.H.; Hou, S.D. Study on preparation and mechanical properties of 3D printed concrete with different aggregate combinations. J. Build. Eng. 2022, 51, 104282. [Google Scholar] [CrossRef]
- Miller, A.E. Using a Centrifuge for Quality Control of Pre-Wetted Lightweight Aggregate in Internally Cured Concrete; Purdue University: West Lafayette, IN, USA, 2014. [Google Scholar]
- Miller, A.E.; Spragg, R.; Antico, F.C.; Ashraf, W. Determining the moisture content of pre-wetted lightweight aggregate: Assessing the variability of the paper towel and centrifuge methods. In Proceedings of the 4th International Conference on the Durability of Concrete Structures, West Lafayette, IN, USA, 24–26 July 2014. [Google Scholar]
- Li, Z.; Liu, J.P.; Tian, Q. Method for controlling the absorbed water content of recycled fine aggregates by centrifugation. Constr. Build. Mater. 2018, 160, 316–325. [Google Scholar] [CrossRef]
- Kim, H.K. Feasibility study on measurement of water absorption in fine aggregate with macroporous surface via centrifugal compaction. Constr. Build. Mater. 2015, 95, 421–430. [Google Scholar] [CrossRef]
- Prowell, B.D.; Baker, N.V. Round Robin Evaluation of New Test. Procedures for Determining the Bulk Specific Gravity of Fine Aggregate; National Center for Asphalt Technology: Auburn, AL, USA, 2005. [Google Scholar]
- You, Z.P.; Mills-Beale, J.; Williams, R.C. Measuring the Specific Gravities of Fine Aggregates: An Automated Procedure. Int. J. Pavement Res. Technol. 2009, 2, 37–50. [Google Scholar] [CrossRef]
- Msengi, K.M. Evaluation of the Aggplus Sytem Andthe Ssdetect System against Thecurrent Aashto T-84 and T-85; Oklahoma State University: Kashiwa, Japan, 2009. [Google Scholar]
- Mechling, J.M.; Lecomte, A.; Merriaux, K. Measurement of the absorption of water of the mineral admixtures in concrete by evaporometry. Mater. Struct. 2003, 36, 32–39. [Google Scholar] [CrossRef]
- Nael-Redolfi, J.; Keita, E.; Roussel, N. Water absorption measurement of fine porous aggregates using an evaporative method: Experimental results and physical analysis. Cem. Concr. Res. 2018, 104, 61–67. [Google Scholar] [CrossRef]
- Constantiner, D.; Farrington, S.A. Review of the thermodynamic stability of ettringite. Cem. Concr. Aggreg. 1999, 21, 39–42. [Google Scholar]
- Jimenez, A.; Prieto, M. Thermal Stability of Ettringite Exposed to Atmosphere: Implications for the Uptake of Harmful Ions by Cement. Environ. Sci. Technol. 2015, 49, 7957–7964. [Google Scholar] [CrossRef] [Green Version]
- Damineli, B.L.; Quattrone, M.; Angulo, S.C.; Taqueda, M.E.S.; John, V.M. Rapid method for measuring the water absorption of recycled aggregates. Mater. Struct. 2016, 49, 4069–4084. [Google Scholar] [CrossRef]
- Kandhal, P.S.; Mallick, R.B.; Huner, M. Measuring bulk.k-specific gravity of fine aggregates-Development of new test method. Transp. Res. Rec. J. Transp. Res. Board 2000, 1721, 81–90. [Google Scholar] [CrossRef]
- Gentilini, P.; Yazoghli-Marzouk, O.; Delmotte, V.; Descantes, Y. Determination of the water content of fillerised fine aggregates in the saturated surface dry state. Constr. Build. Mater. 2015, 98, 662–670. [Google Scholar] [CrossRef] [Green Version]
- Sosa, M.E.; Carrizo, L.E.; Zega, C.J.; Zaccardi, Y.A.V. Water absorption of fine recycled aggregates: Effective determination by a method based on electrical conductivity. Mater. Struct. 2018, 51, 127. [Google Scholar] [CrossRef]
- Hoornahad, H.; Koenders, E.A.B.; van Breugel, K. Wettability of particles and its effect on liquid bridges in wet granular materials. J. Silic. Based Compos. Mater. 2015, 67, 139–142. [Google Scholar] [CrossRef]
- Zhi, P.; Wu, Y.C.; Yang, Q.F.; Kong, X.R.; Xiao, J.Z. Effect of spiral blade geometry on 3D-printed concrete rheological properties and extrudability using discrete event modeling. Autom. Constr. 2022, 137, 104199. [Google Scholar] [CrossRef]
- Liang, K.; Hou, Y.J.; Sun, J.C.; Li, X.G.; Bai, J.H.; Tian, W.; Liu, Y.X. Theoretical analysis of water absorption kinetics of recycled aggregates immersed in water. Constr. Build. Mater. 2021, 302, 124156. [Google Scholar] [CrossRef]
- Ma, M. The Dispersive Effect of Sodium Hexametaphosphate on Kaolinite in Saline Water. Clays Clay Miner. 2012, 60, 405–410. [Google Scholar] [CrossRef]
- Andreola, F.; Castellini, E.; Ferreira, J.M.F.; Olhero, S.; Romagnoli, M. Effect of sodium hexametaphosphate and ageing on the rheological behaviour of kaolin dispersions. Appl. Clay Sci. 2006, 31, 56–64. [Google Scholar] [CrossRef]
- Rodrigues, F.; Evangelista, L.; de Brito, J. A New Method to Determine the Density and Water Absorption of Fine Recycled Aggregates. Mater. Res.-Ibero-Am. J. 2013, 16, 1045–1051. [Google Scholar] [CrossRef] [Green Version]
- Tam, V.W.Y.; Gao, X.F.; Tam, C.M.; Chan, C.H. New approach in measuring water absorption of recycled aggregates. Constr. Build. Mater. 2008, 22, 364–369. [Google Scholar] [CrossRef] [Green Version]
- Bendimerad, A.Z.; Roziere, E.; Loukili, A. Combined experimental methods to assess absorption rate of natural and recycled aggregates. Mater. Struct. 2015, 48, 3557–3569. [Google Scholar] [CrossRef]
- Belin, P.; Habert, G.; Thiery, M.; Roussel, N. Cement paste content and water absorption of recycled concrete coarse aggregates. Mater. Struct. 2014, 47, 1451–1465. [Google Scholar] [CrossRef]
- Santos, W.F.; Quattrone, M.; John, V.M.; Angulo, S.C. Roughness, wettability and water absorption of water repellent treated recycled aggregates. Constr. Build. Mater. 2017, 146, 502–513. [Google Scholar] [CrossRef]
- Zhao, Z.F.; Remond, S.; Damidot, D.; Xu, W.Y. Influence of Hardened Cement Paste Content on the Water Absorption of Fine Recycled Concrete Aggregates. J. Sustain. Cem.-Based Mater. 2013, 2, 186–203. [Google Scholar] [CrossRef]
- Le, T.; Remond, S.; Le Saout, G.; Garcia-Diaz, E. Fresh behavior of mortar based on recycled sand-Influence of moisture condition. Constr. Build. Mater. 2016, 106, 35–42. [Google Scholar] [CrossRef] [Green Version]
- Deshpande, Y.S.; Hiller, J.E. Pore characterization of manufactured aggregates: Recycled concrete aggregates and lightweight aggregates. Mater. Struct. 2012, 45, 67–79. [Google Scholar] [CrossRef]
- Bouarroudj, M.E.; Remond, S.; Michel, F.; Zhao, Z.F.; Bulteel, D.; Courard, L. Use of a reference limestone fine aggregate to study the fresh and hard behavior of mortar made with recycled fine aggregate. Mater. Struct. 2019, 52, 18. [Google Scholar] [CrossRef] [Green Version]
- Sundararaj, A.J.; Guna, K.R.; William, M. Experimental investigation of the effect of temperature on ignition of modified kerosene. Int. J. Engine Res. 2022, 23, 460–468. [Google Scholar] [CrossRef]


| Moisture States | Schematic Diagram | Description |
|---|---|---|
| Oven dry (OD) |  | The pores inside the aggregate are completely dry, and there is no water on the surface. |
| Air dry (AD) |  | The bottom of the pores inside the aggregate is filled with water, while the top of the pores near the surface keeps dry [46]. Meanwhile, there is no water on the surface. |
| Surface saturation surface-dry (SSSD) |  | The bottom of the pores inside the aggregate keeps dry, while the top of the pores near the surface is filled with water [46]. Meanwhile, there is no water on the surface. It generally happens on the pores with a large aspect ratio. |
| Saturated surface-dry (SSD) |  | The pores inside the aggregate are filled with water, while there is no water on the surface. |
| Over saturation (OS) |  | The pores inside the aggregate are filled with water, and there is a water film on the surface. |
| Reference | Tool | Procedure | Judgment |
|---|---|---|---|
| NF EN 1097-6 [53] | Dry towel |
| All visible films of water are removed, but aggregates still have a damp appearance. |
| BS 812: part 2 [54] | |||
| ASTM C127-12 [55] |
| ||
| GB/T 25177 [56] |
| - | |
| Castro et al. [57] | Dry tissue | Patting the surface of aggregates dry with a dry tissue. | Visual inspection: It appears that the tissue is no longer absorbing moisture from aggregates. |
| IFSTTAR. Test Method No. 78 [59] | Colorful absorbent tissue | Drying aggregates progressively with different sheets of colorful absorbent tissues. | No trace of water can be seen on the tissues. |
| Standards | Procedures | Judgment |
|---|---|---|
| ASTM C128-12 [61] |
| Slight slumping of the molded fine aggregate indicates that it has reached a surface-dry condition. |
| AASHTO T-84 [62] |
| When the fine aggregate achieves an SSD condition, the fine aggregate will slump. |
| EN 1097-6 [53] |
| The collapse situation occurs at mold removal. |
| GB/T 14684 [60] |
| Repeating the operation until fine aggregates reach a fixed shape. |
| Methods | Scenarios | Advantages | Disadvantages |
|---|---|---|---|
| Wiping | Laboratory and construction site |
|
|
| Slumping |
| ||
| Centrifugation | Laboratory |
|
|
| Infrared |
|
| |
| Evaporation |
|
| |
| Airflow drying |
|
| |
| Conductivity | Laboratory and construction site |
|
|
| Pycnometer |
|
| |
| Hydrostatic balance | Laboratory |
|
|
| Extrapolation |
|
|
Publisher’s Note: MDPI stays neutral with regard to jurisdictional claims in published maps and institutional affiliations. |
© 2022 by the authors. Licensee MDPI, Basel, Switzerland. This article is an open access article distributed under the terms and conditions of the Creative Commons Attribution (CC BY) license (https://creativecommons.org/licenses/by/4.0/).
Share and Cite
Duan, Z.; Zhao, W.; Ye, T.; Zhang, Y.; Zhang, C. Measurement of Water Absorption of Recycled Aggregate. Materials 2022, 15, 5141. https://doi.org/10.3390/ma15155141
Duan Z, Zhao W, Ye T, Zhang Y, Zhang C. Measurement of Water Absorption of Recycled Aggregate. Materials. 2022; 15(15):5141. https://doi.org/10.3390/ma15155141
Chicago/Turabian StyleDuan, Zhenhua, Wenjing Zhao, Taohua Ye, Yunhui Zhang, and Chuanchuan Zhang. 2022. "Measurement of Water Absorption of Recycled Aggregate" Materials 15, no. 15: 5141. https://doi.org/10.3390/ma15155141
APA StyleDuan, Z., Zhao, W., Ye, T., Zhang, Y., & Zhang, C. (2022). Measurement of Water Absorption of Recycled Aggregate. Materials, 15(15), 5141. https://doi.org/10.3390/ma15155141