
Experimental Prognostication of Ultra-High-Performance Lightweight Hybrid Fiber-Reinforced Concrete by Using Sintered Fly Ash Aggregate, Palm Oil Shell Aggregate, and Supplementary Cementitious Materials


Abstract
1. Introduction
2. Materials and Methods
2.1. Material Properties
2.2. Mix Proportion
2.3. Evaluation
2.3.1. Unit Weight
2.3.2. Workability Test
2.3.3. Slump Test
2.3.4. Compaction Factor Test
2.3.5. Vee Bee Time Test
2.3.6. Water Absorption Test
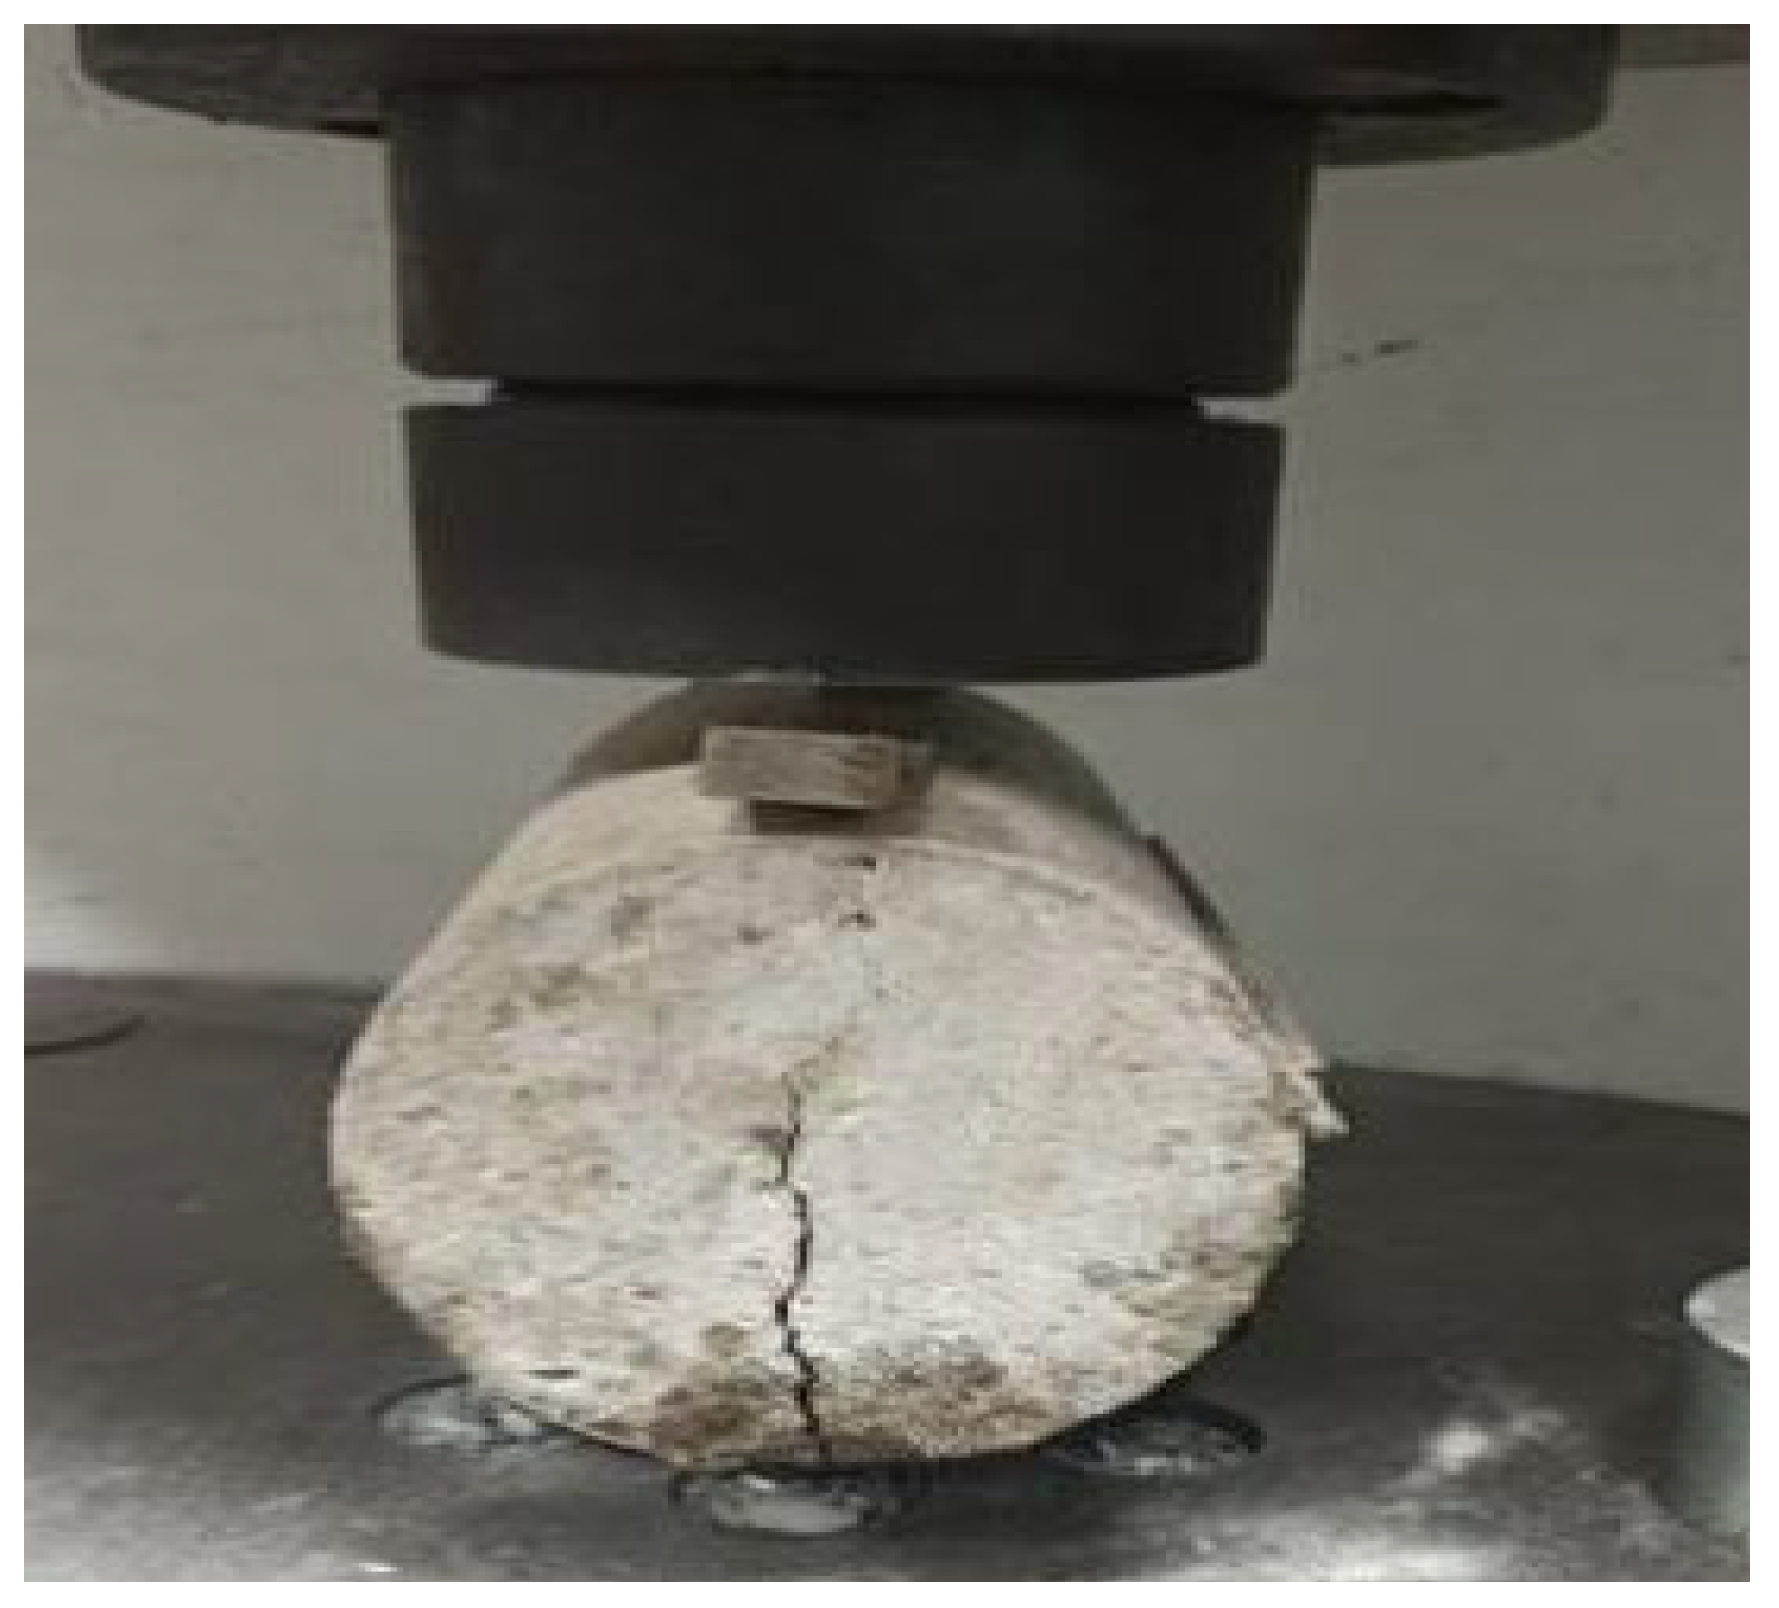
2.3.7. Cylinder Compressive Strength Test
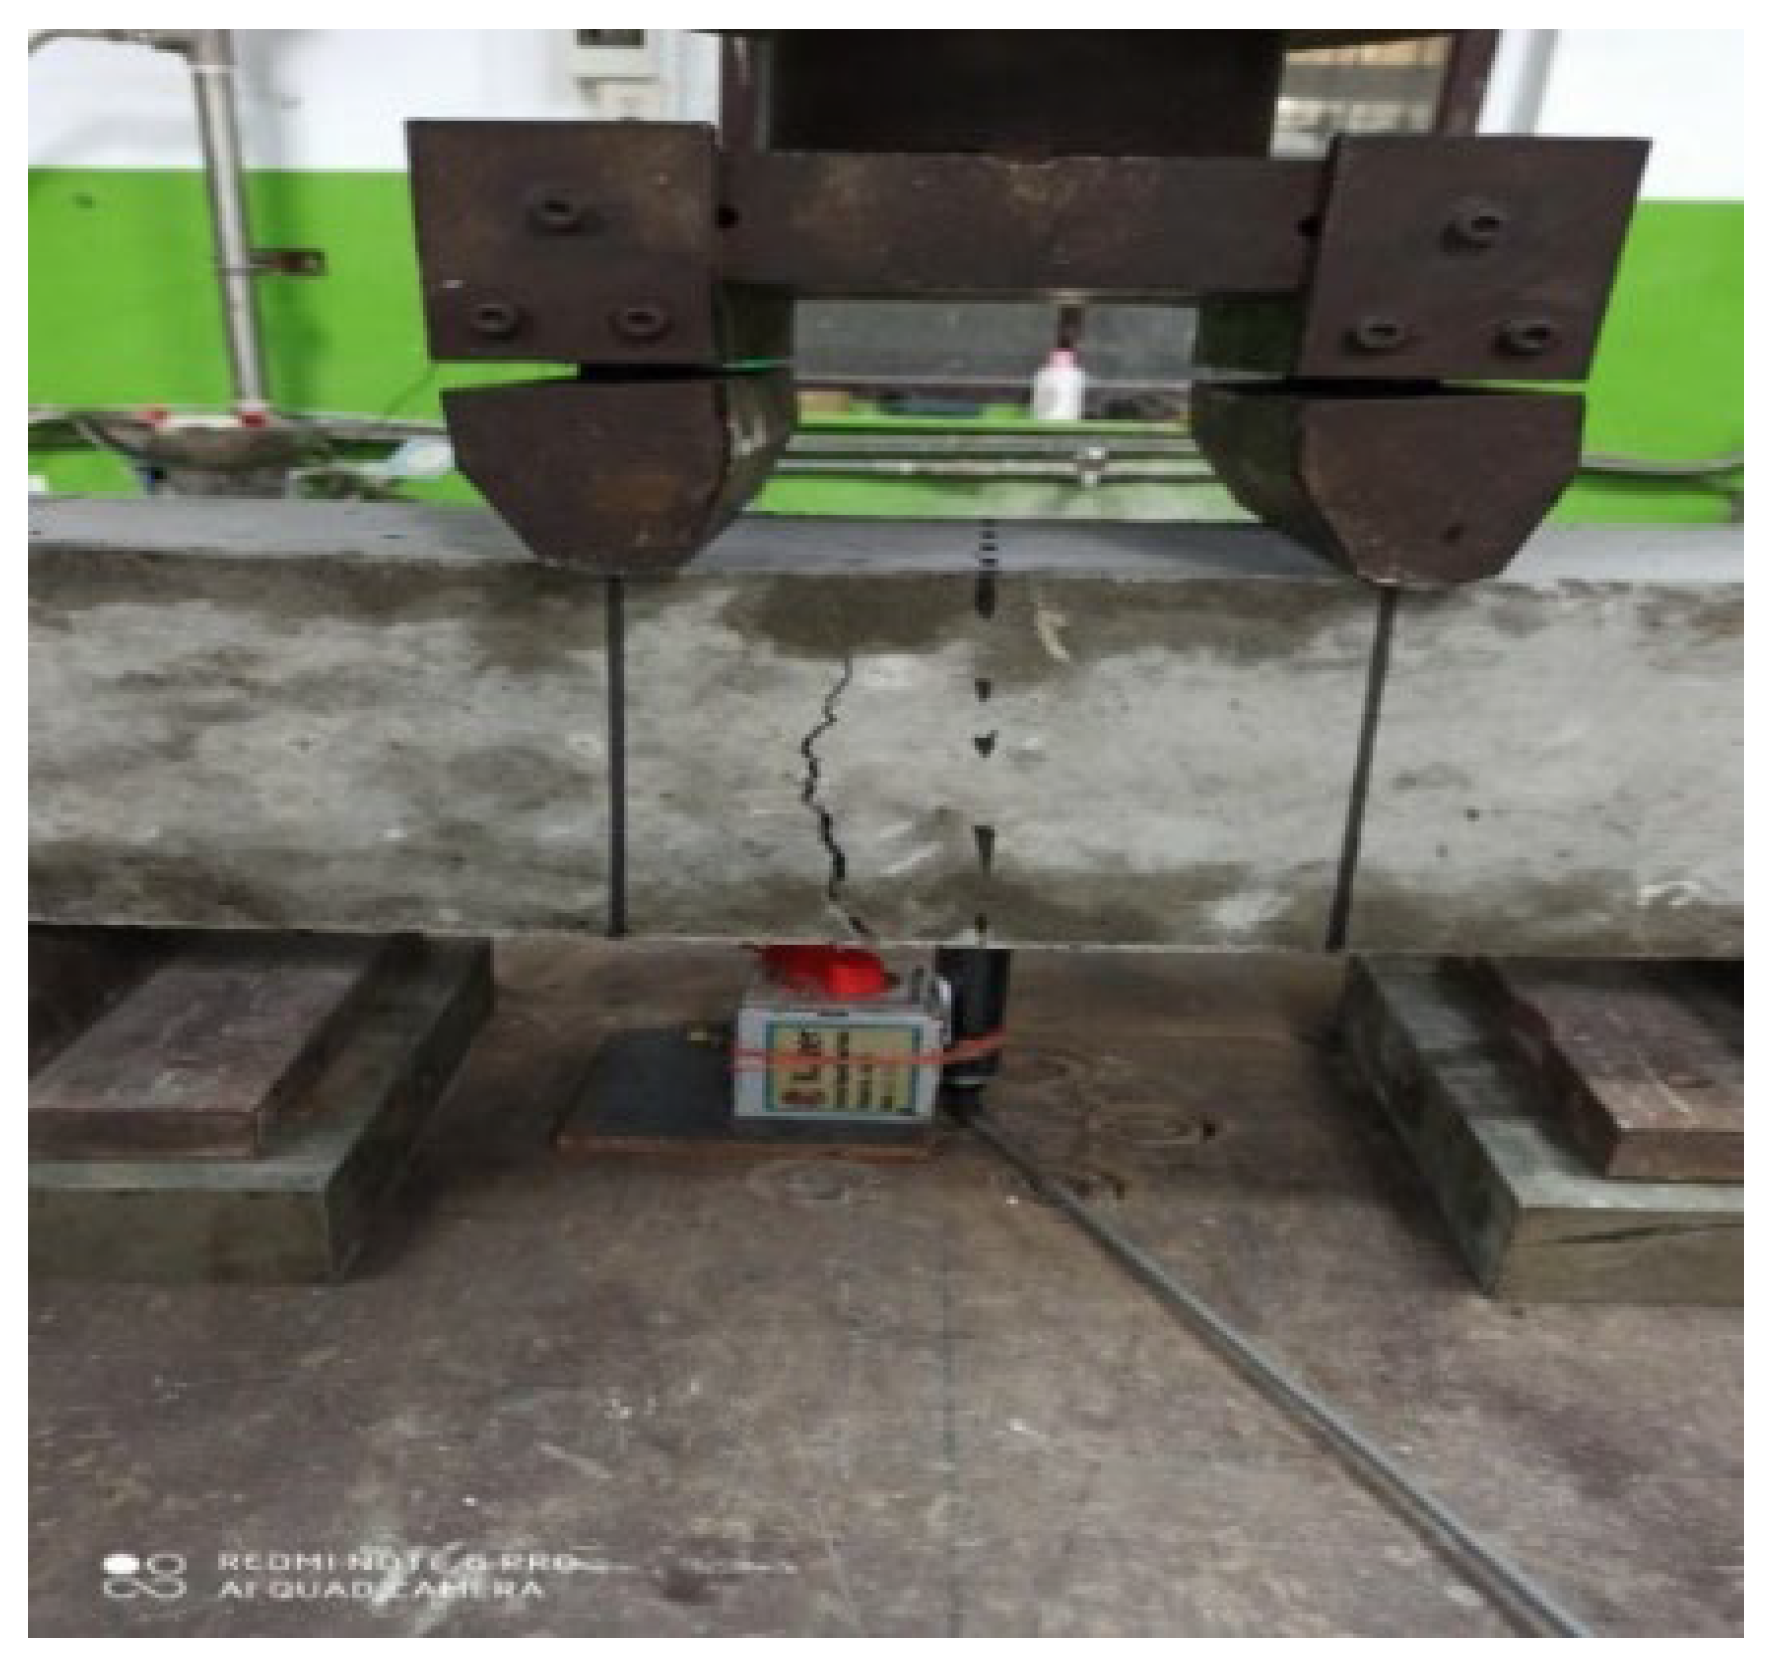
2.3.8. Split Tensile Strength Test
- fspt = splitting tensile strength of the specimen (MPa);
- P = maximum load applied to specimen (N).
- l = length of the specimen (mm).
- d = cross-sectional diameter of the specimen (mm).
2.3.9. Flexural Strength Test
3. Results and Discussion
3.1. Unit Weight
3.2. Workability and Water Absorption Test
3.3. Compressive Strength
- (a)
- E Series (LWC)
- (b)
- HA Series (1% Hybrid Fiber)
- (c)
- HB Series (1.5 % Hybrid)
- (d)
- HC Series (2% Hybrid)
3.4. Split Tensile Strength Test
3.5. Flexural Strength Test
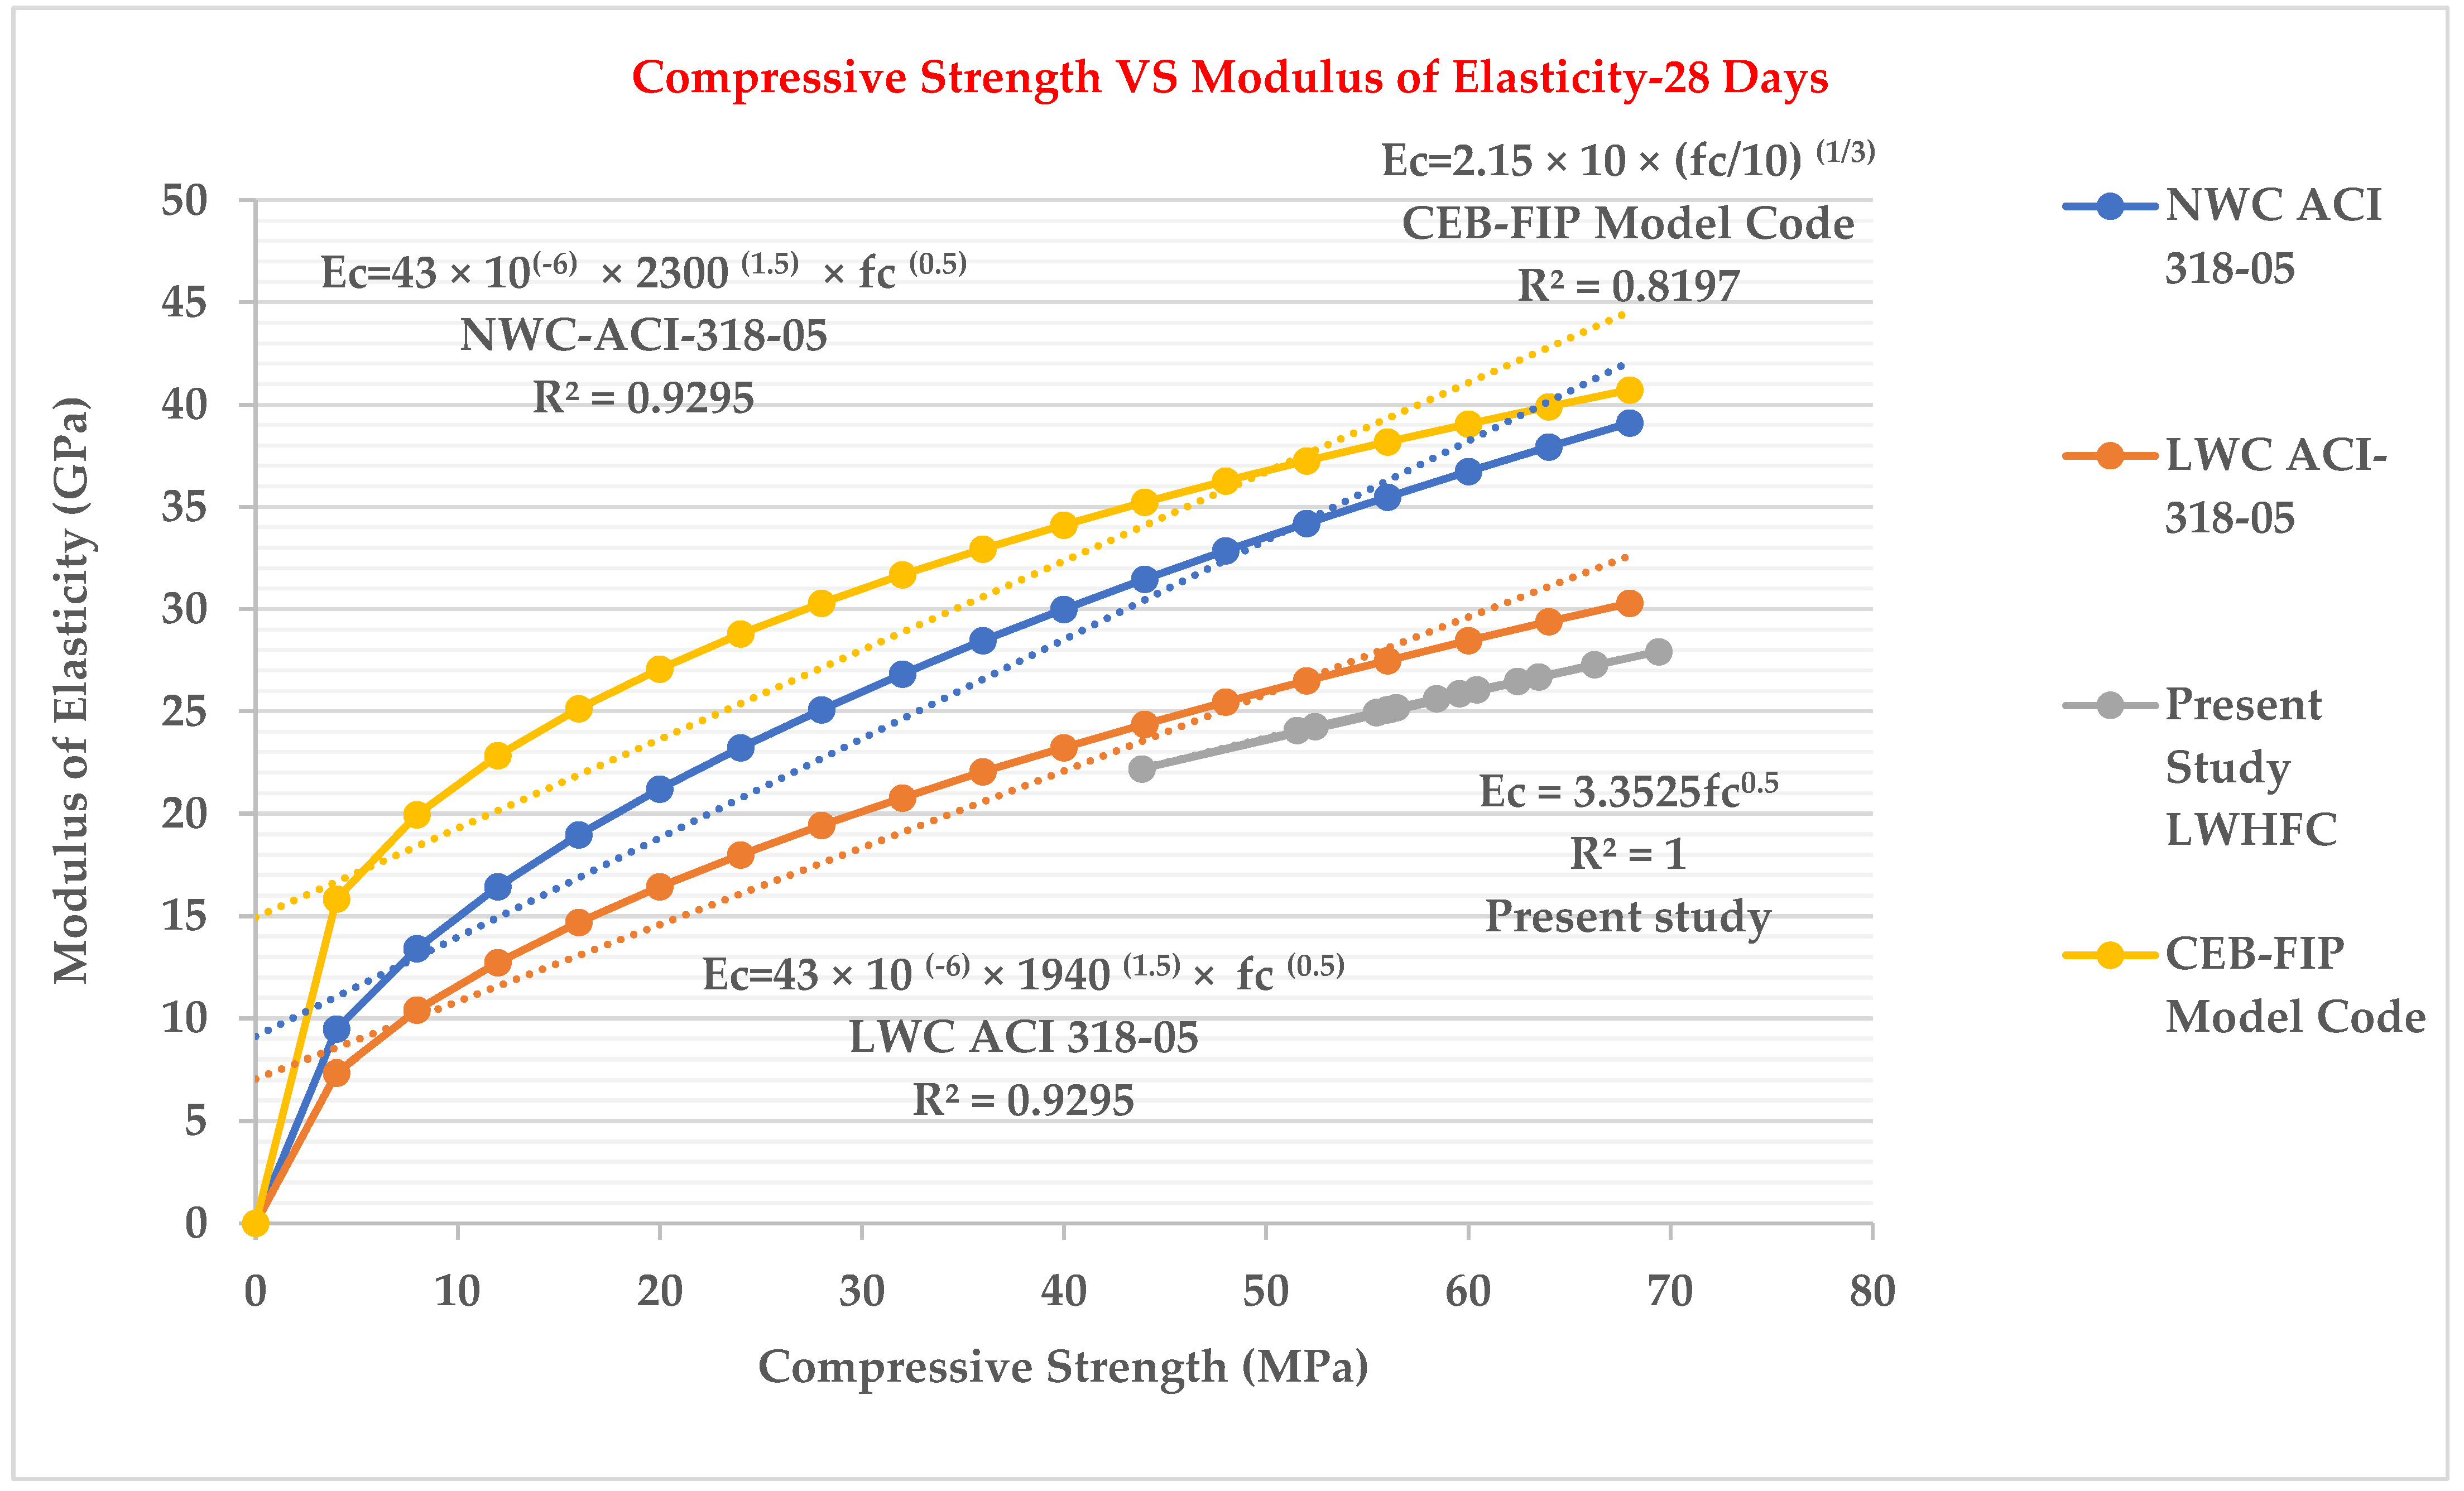
3.6. Relationship between Compressive Strength (fc’) Test and Modulus of Elasticity Test
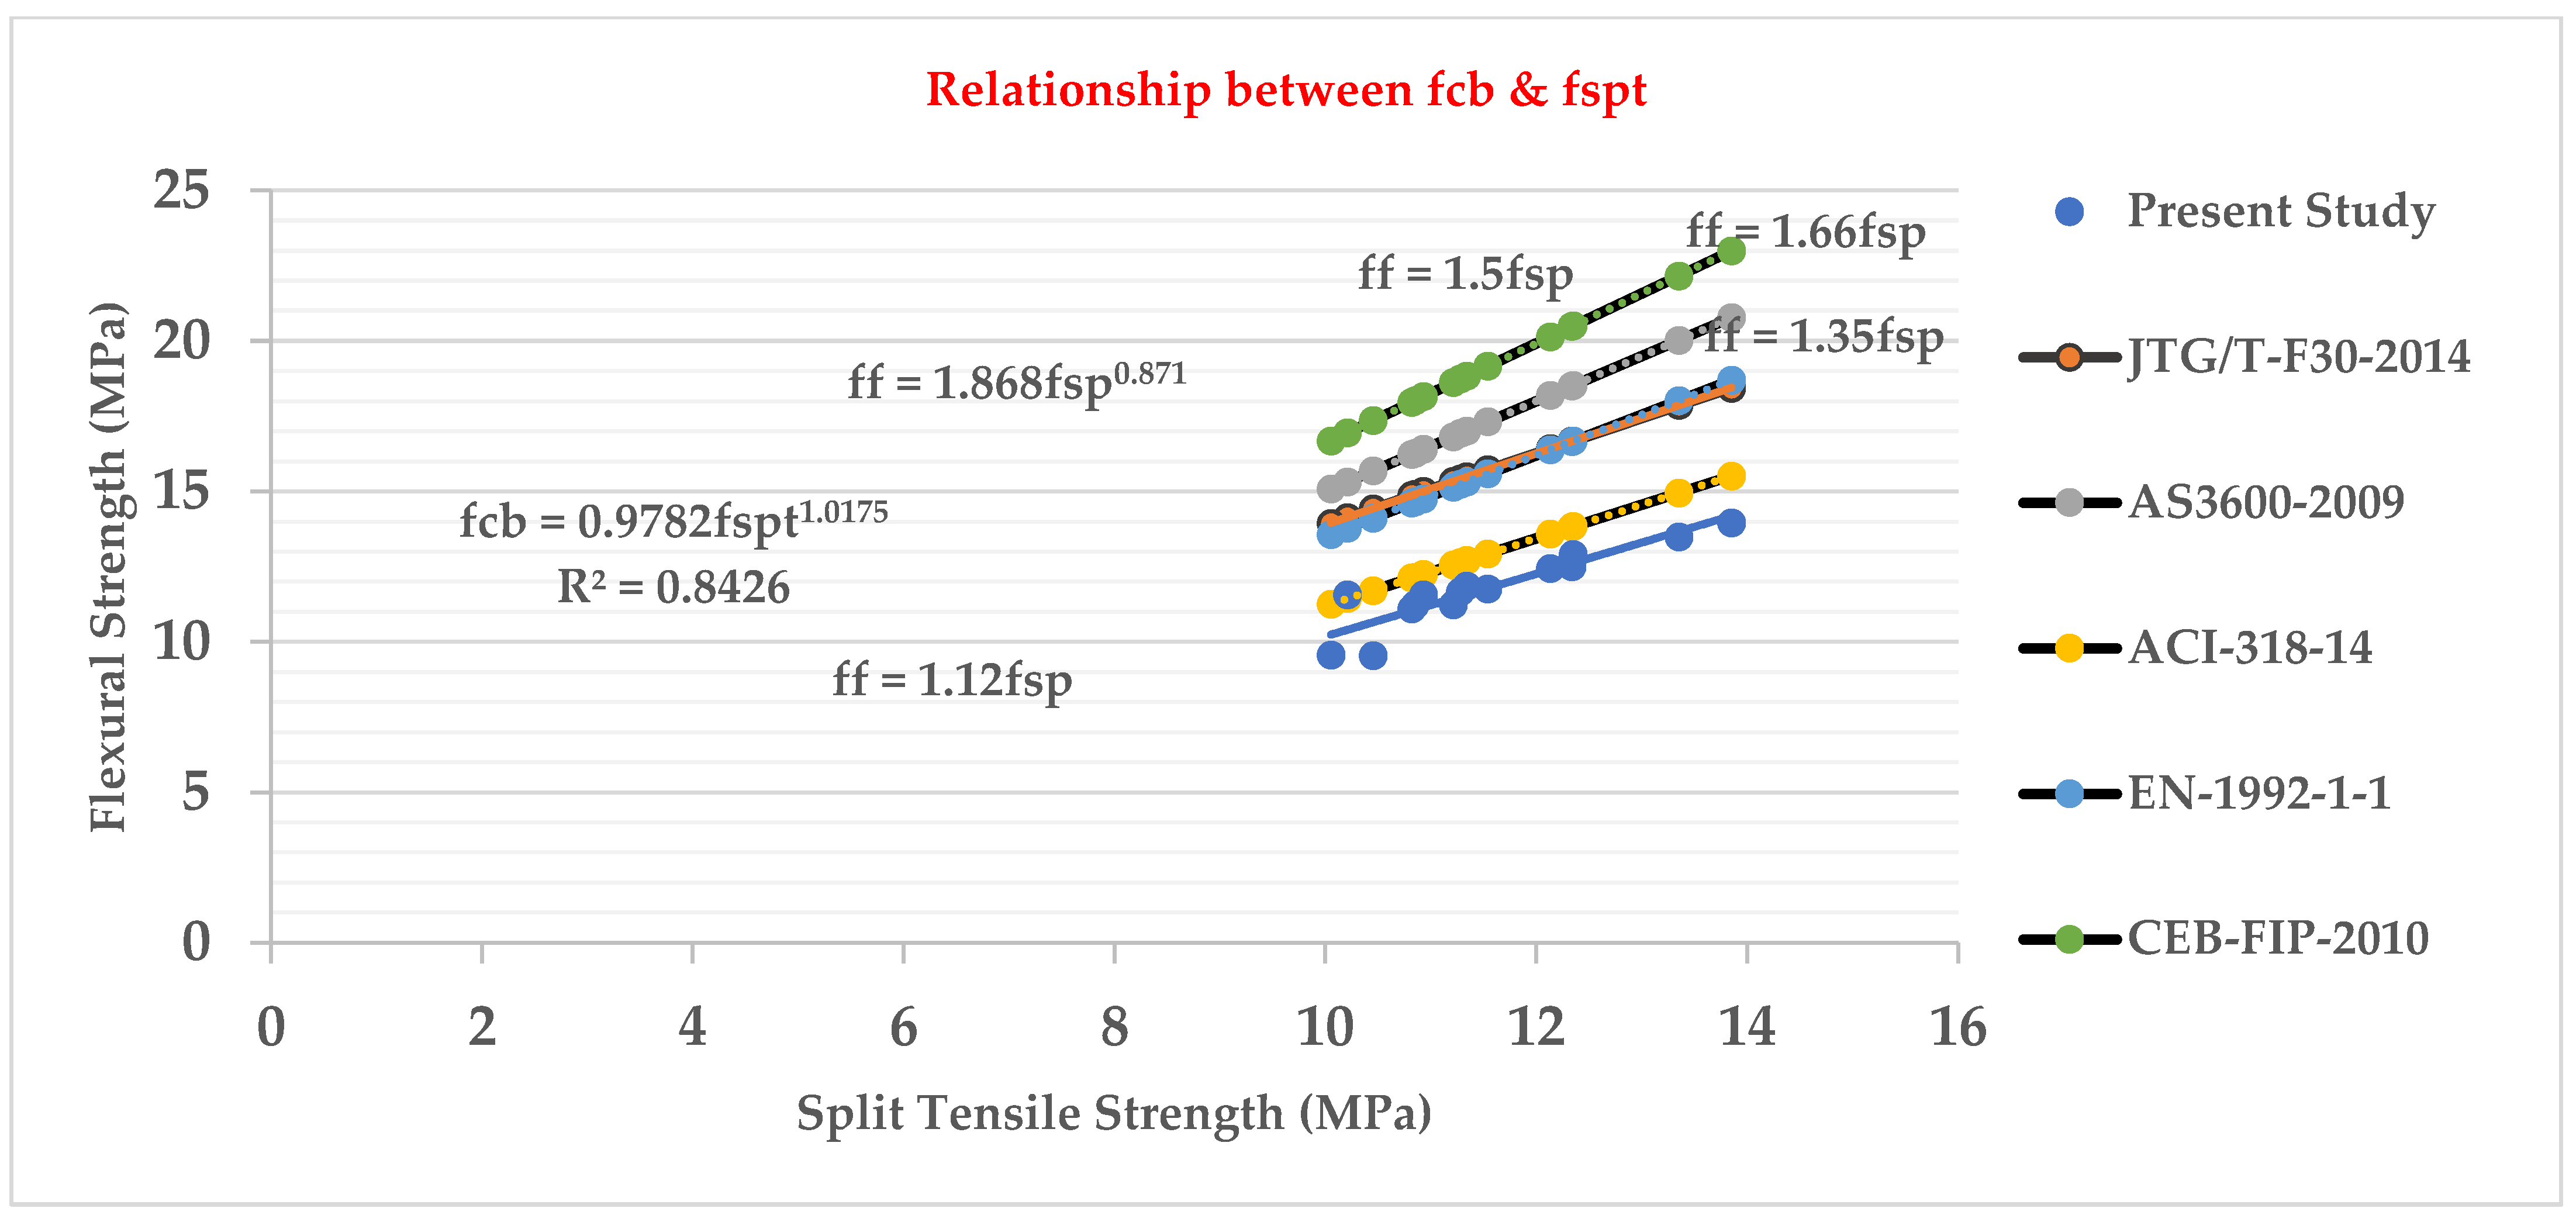
3.7. Relationship between Flexural Strength (fcb) and Split Tensile Strength (fspt) Test
3.8. Relationship between Split Tensile Strength (fspt) Test and Compressive Strength (fc’) Test
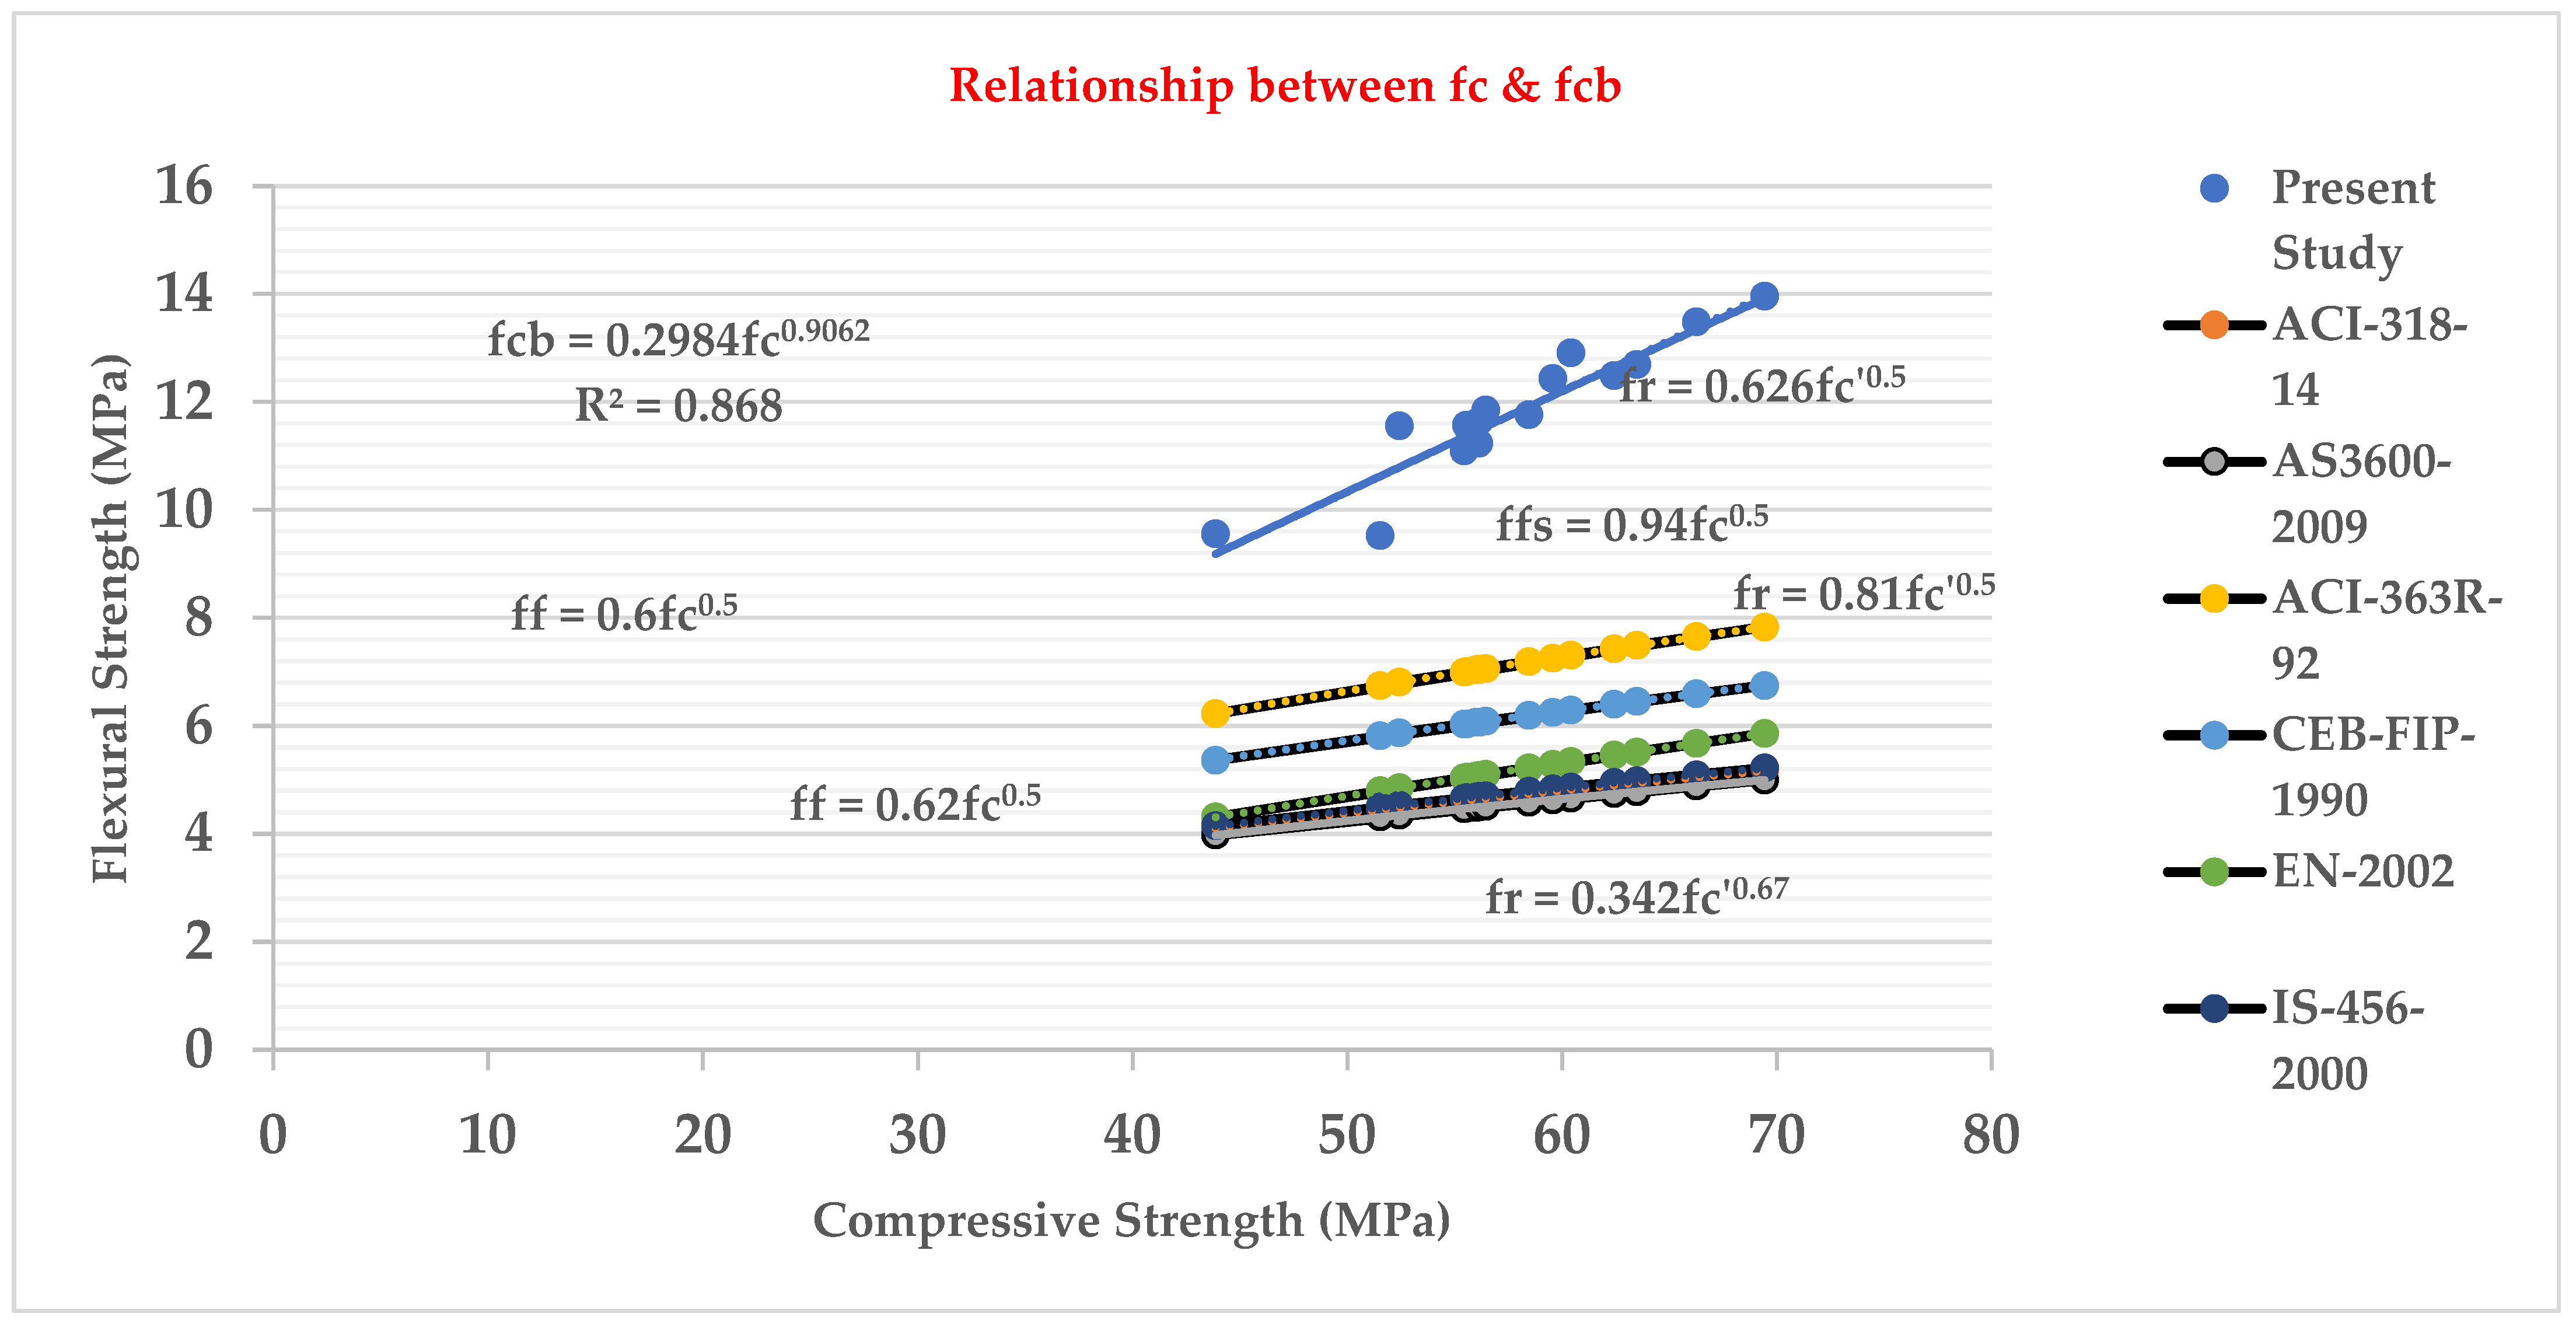
3.9. Relationship between Flexural Strength (fcb) Test and Compressive Strength (fc’) Test
3.10. Cost Analysis Report
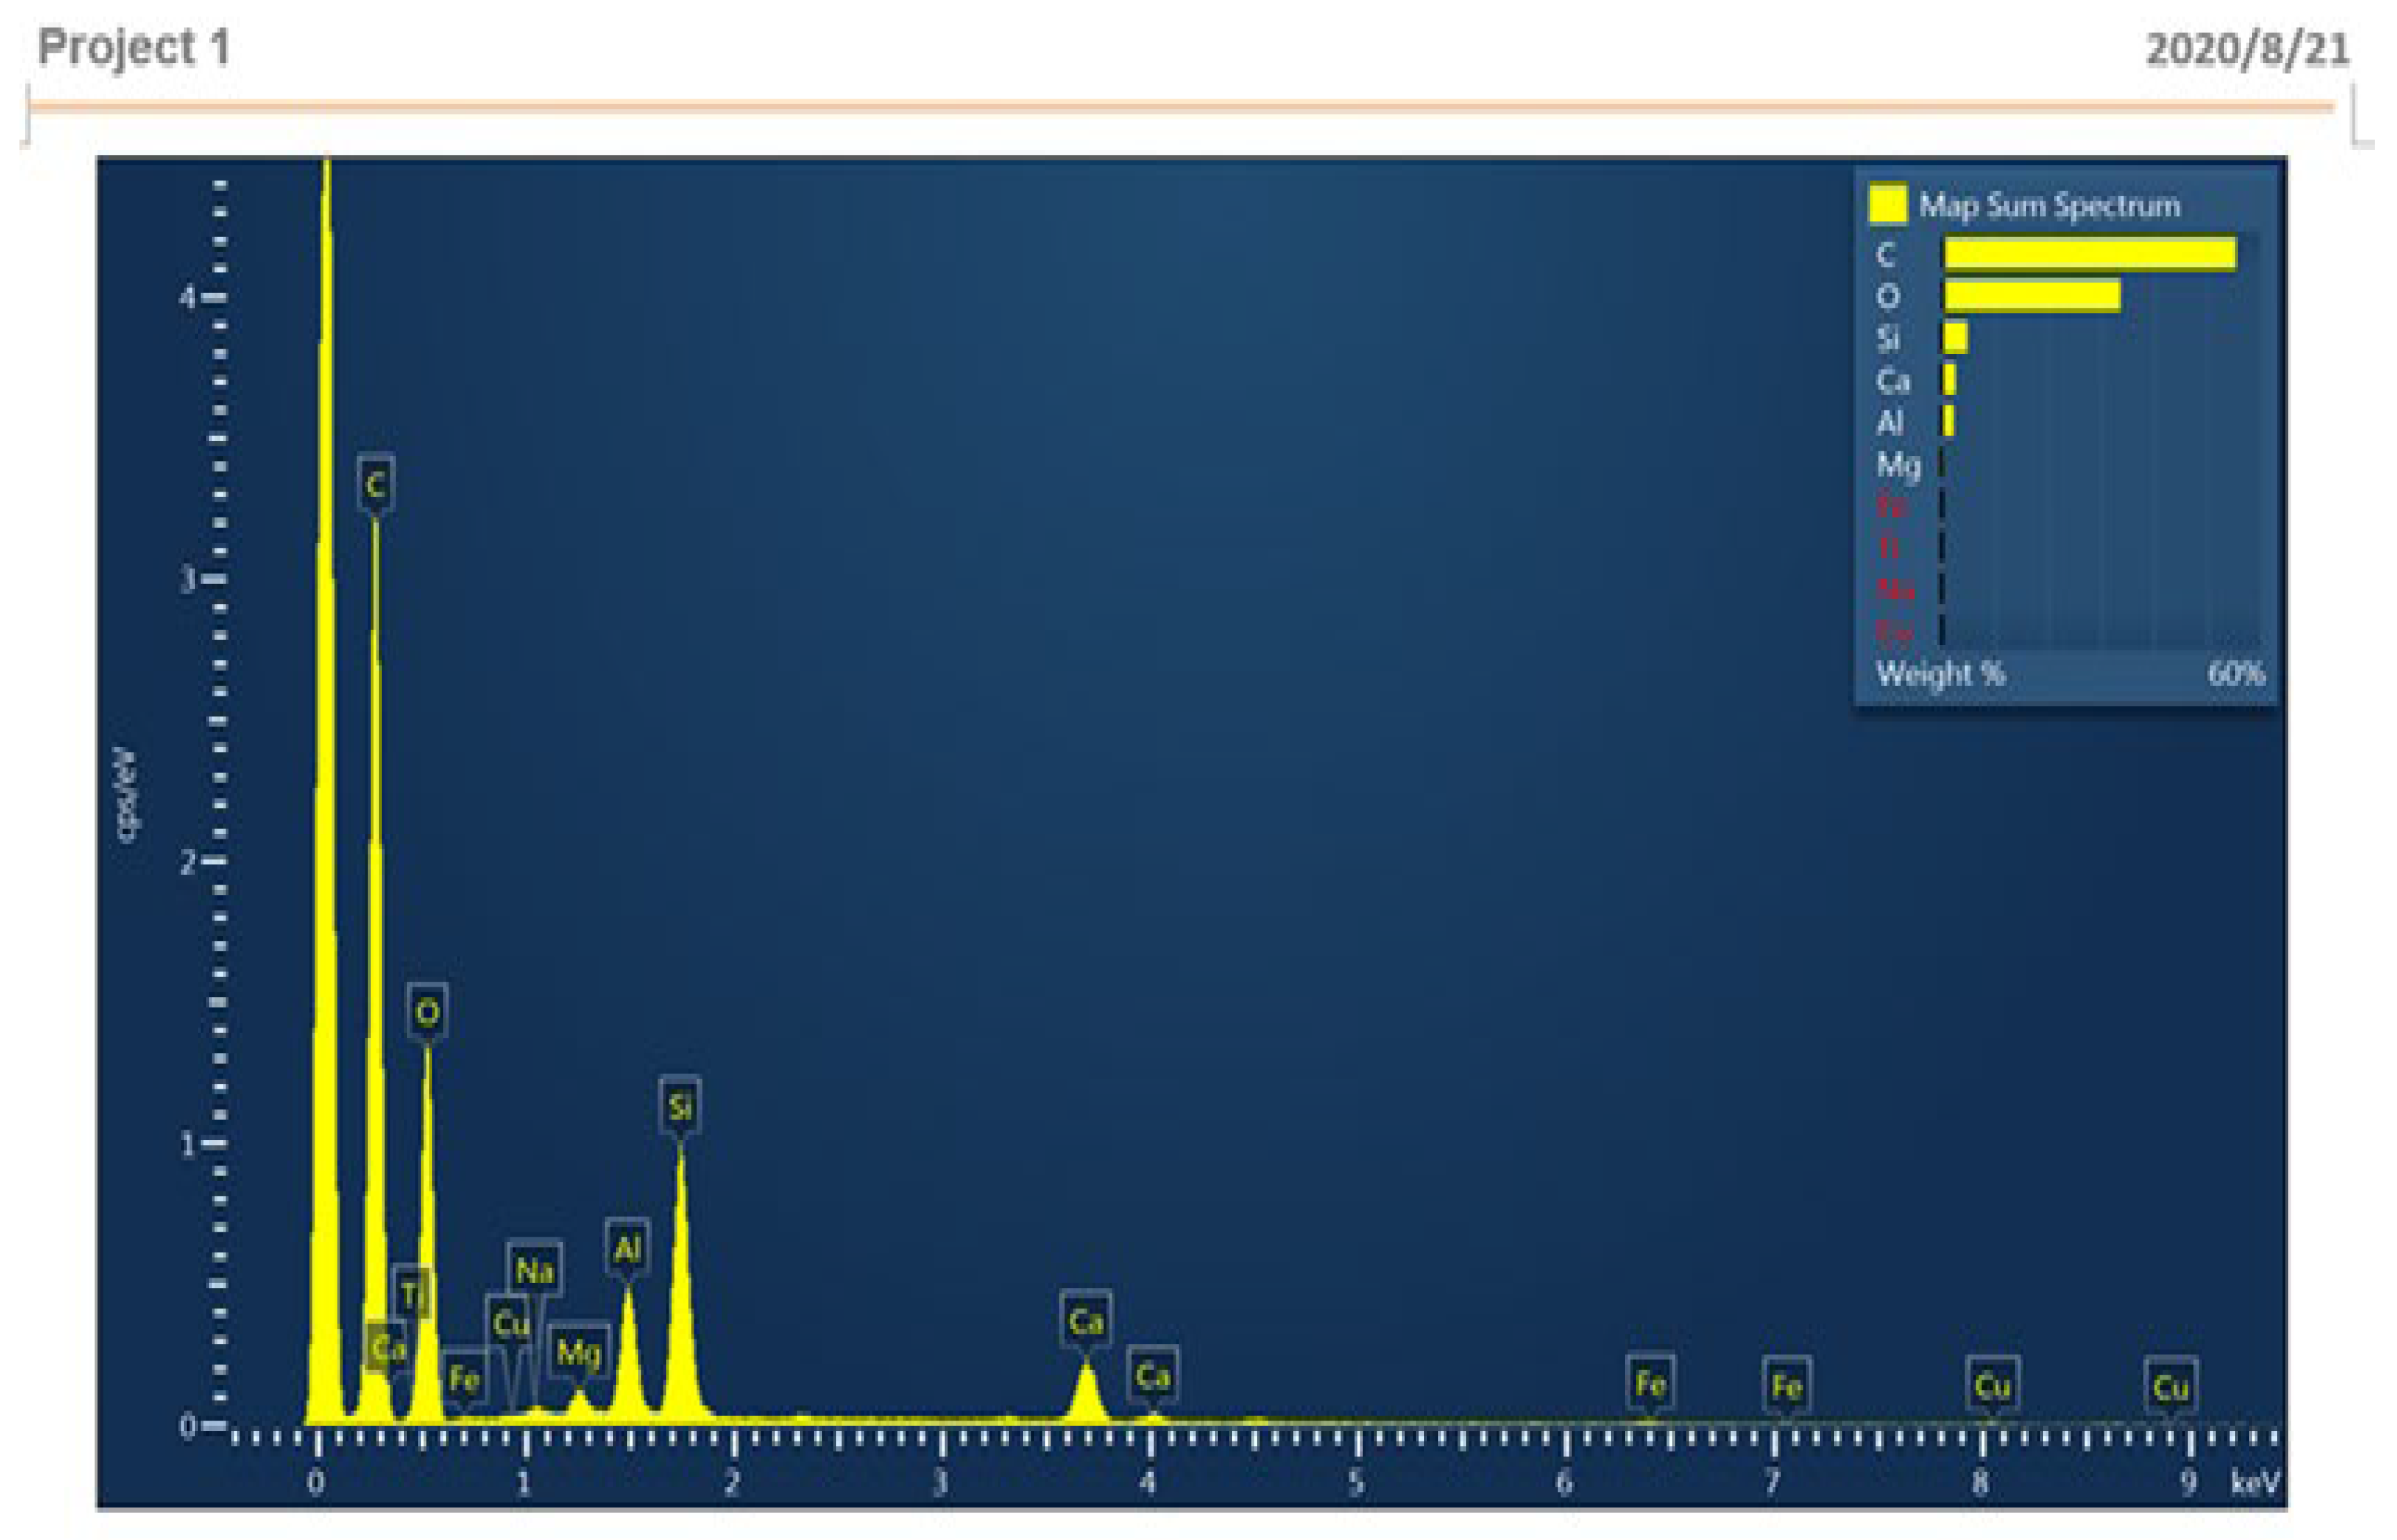
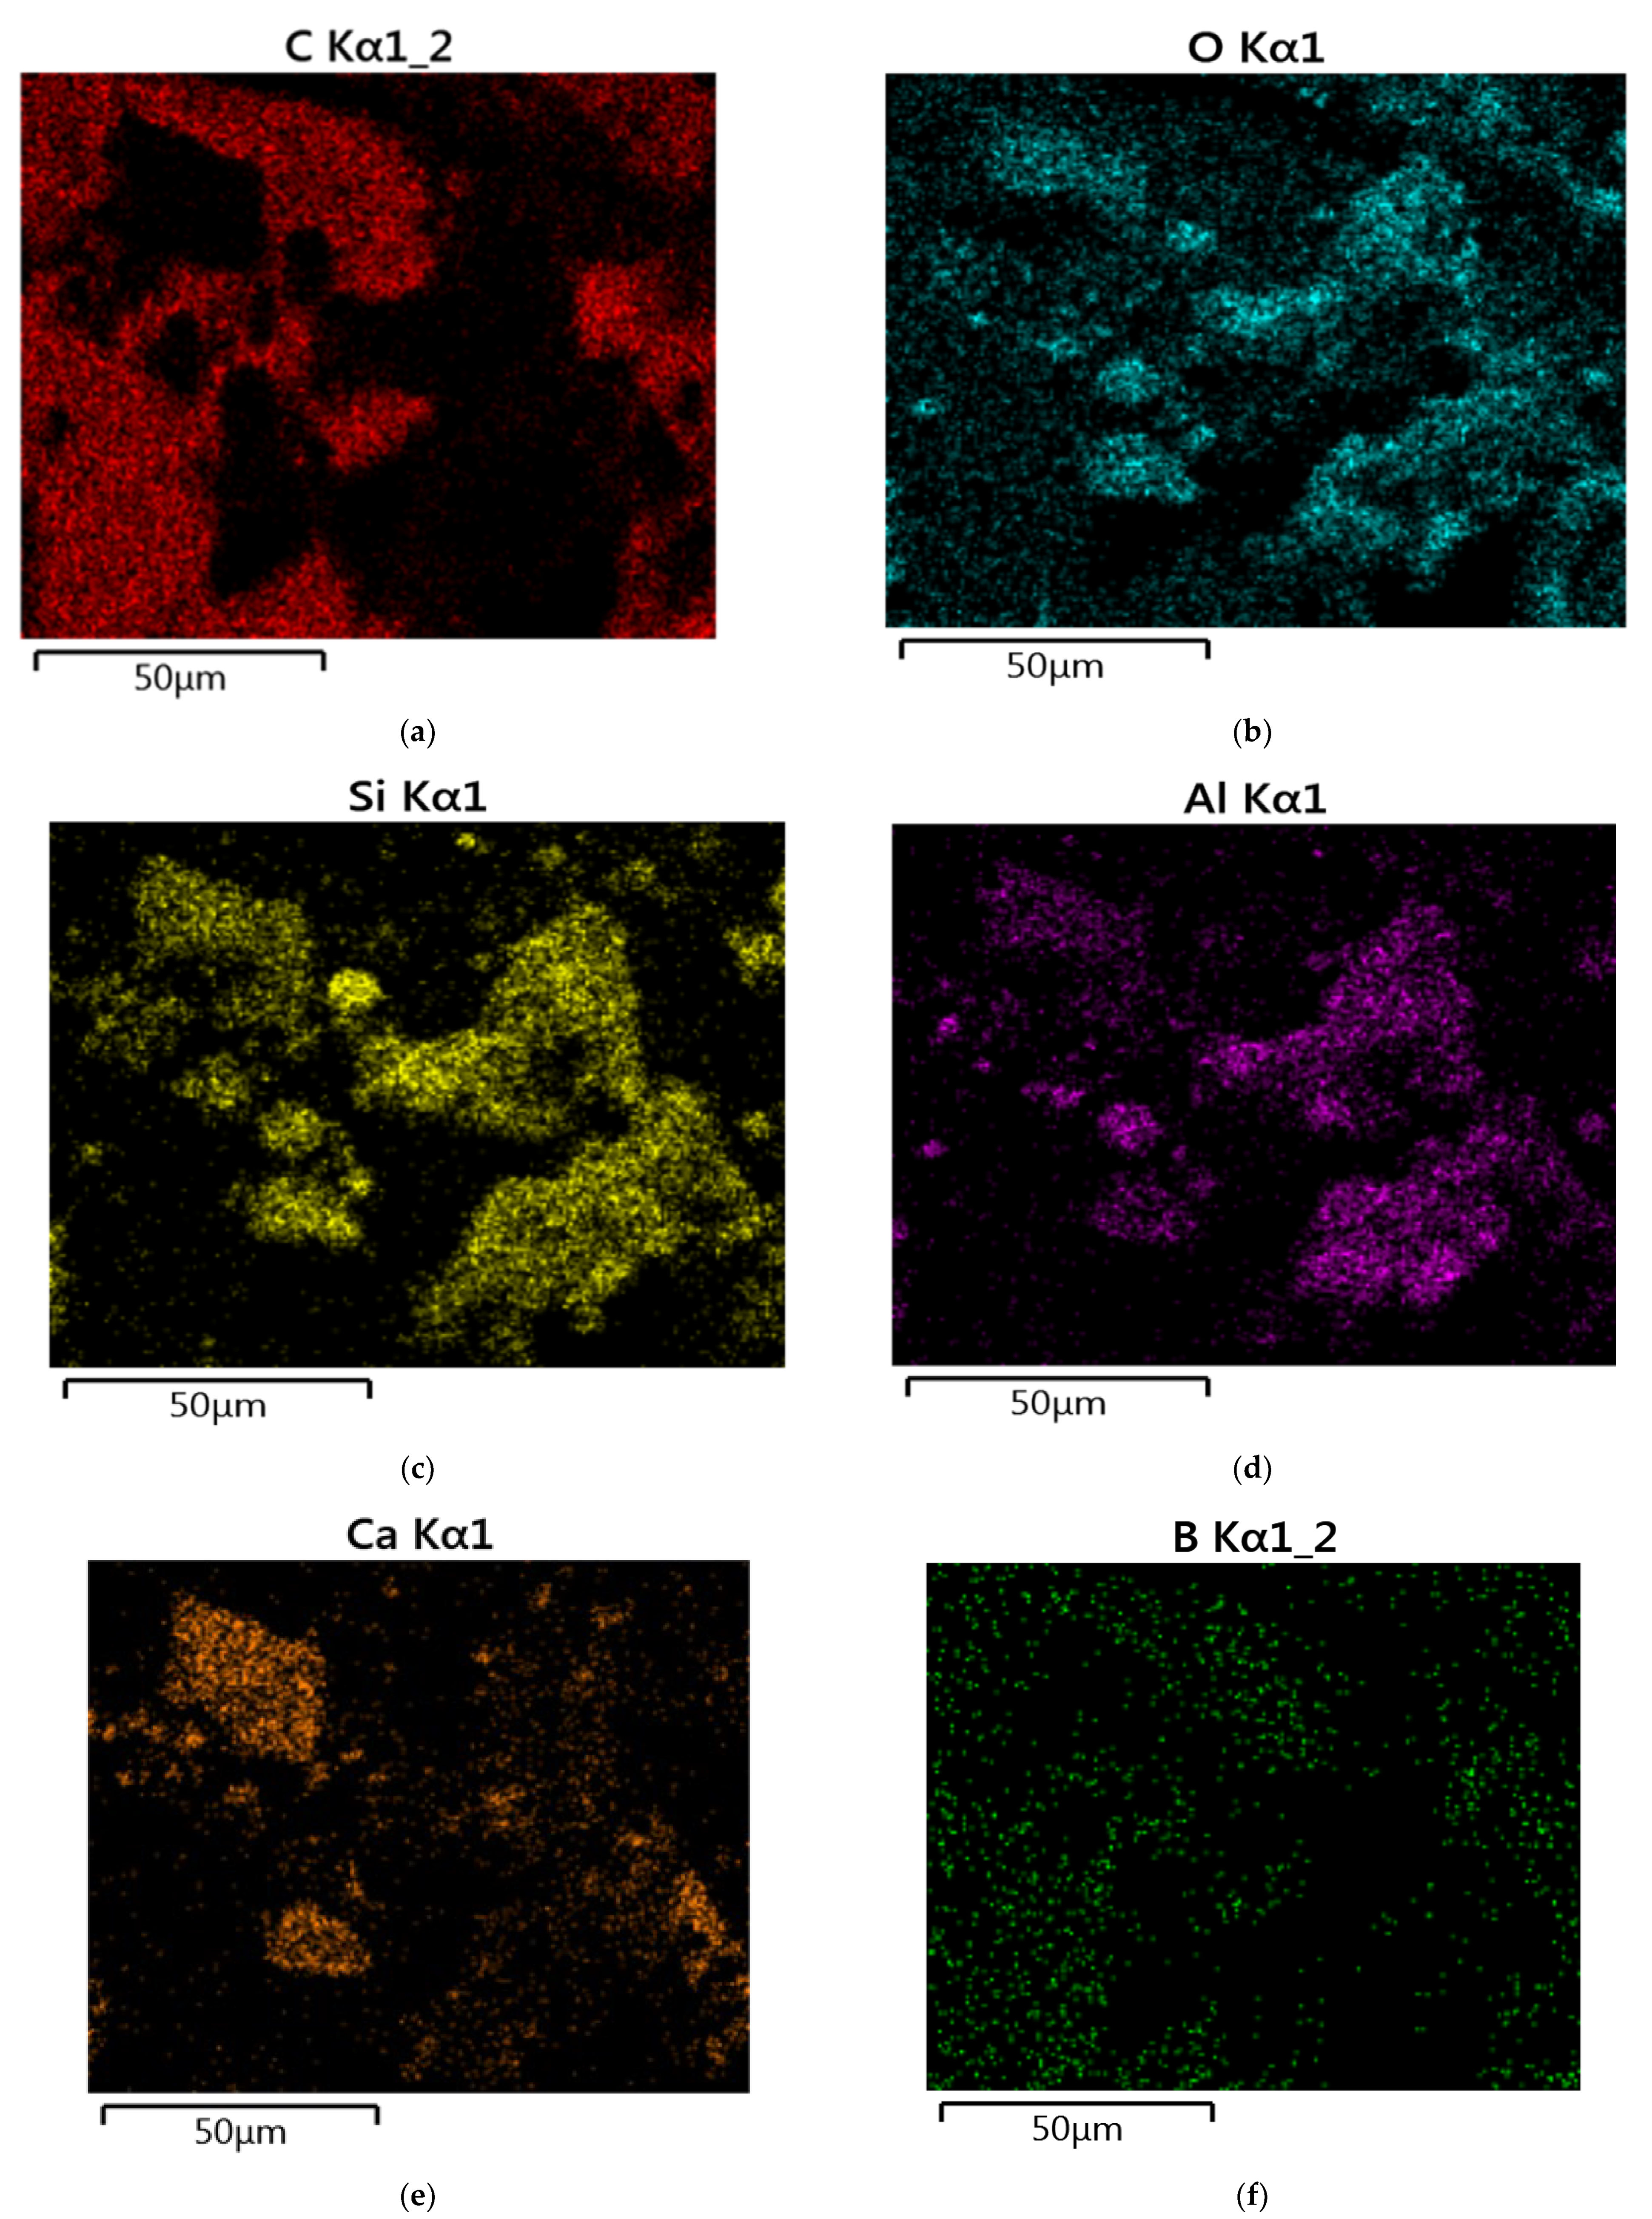
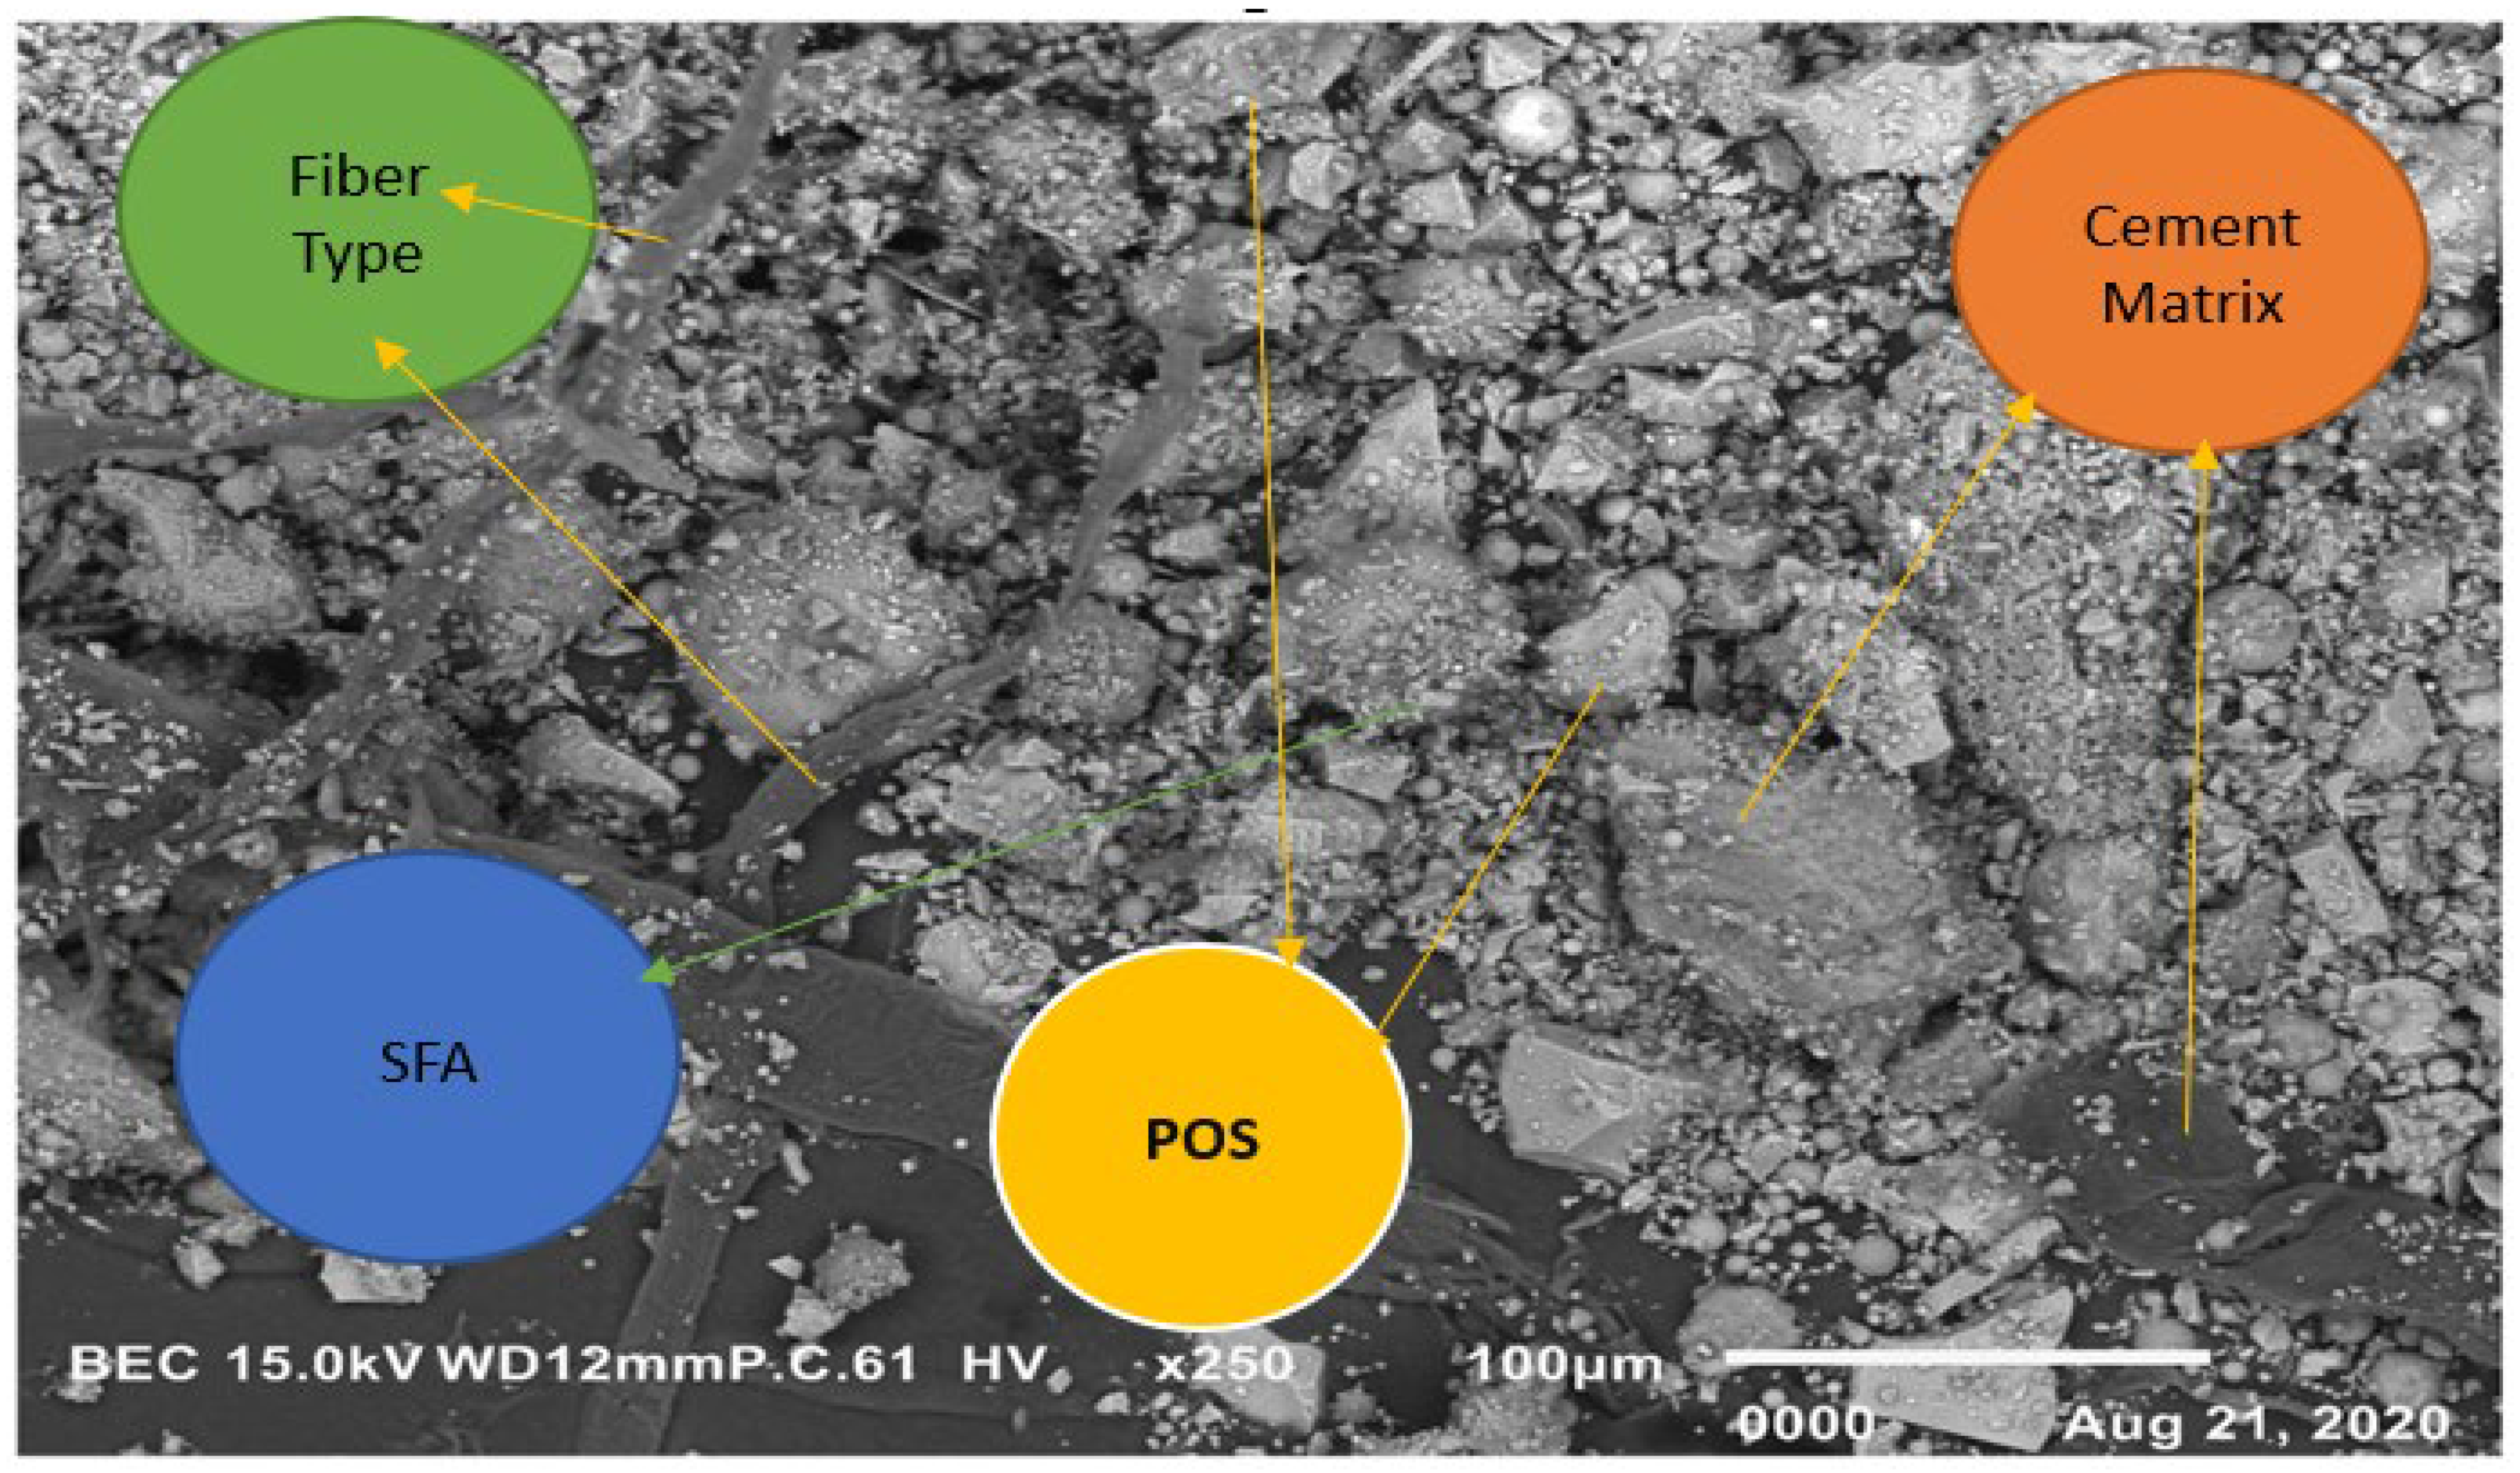
3.11. Scanning Electron Microscopy (SEM), EDS Analysis, EDS Mapping, XRD
- (a)
- XRD Report
- (b)
- EDS Analysis
- (c)
- SEM Report
- (d)
- SEM Report—EDS mapping
3.12. ANOVA and Regression Analysis for Bulk Density, Water Absorption, Slump, and Compressive Strength of Lightweight Concrete and Lightweight Hybrid Fiber-Reinforced Concrete
4. Conclusions and Future Perspectives
- The compressive strengths (E1–E6) of LWC at 28 days were increased by 80.44%, 61.53%, 55.99%, 11.83%, 18.78%, and 4.93%, respectively, when compared to control concrete (C1).
- Similarly, at 28 days, the compressive strengths (HA1–HA6) of LWHFRC were increased by 55.99%, 57.96%, 64.44%, 57.48%, 69.97%, and 47.50%, respectively (1% hybrid fiber). At 28 days, the compressive strengths (HB1-HB6) of LWHFRC (1.5% hybrid fiber) increased by 55.99%, 56.24%, 67.59%, 78.58%, 86.34%, and 23.42%, respectively. At the age of 28 days, the compressive strengths (HC1–HC6) of LWHFRC were increased by 55.99%, 56.24%, 58.81%, 75.63%, 95.29%, and 5.85% (-ve), respectively (2% hybrid fiber).
- The strength of lightweight concrete without fiber increased by 55.98%, while the cost of lightweight concrete increased by approximately 16.46%, and unit weight decreased by about 26.67% compared to normal concrete without mineral admixture.
- The significant effect of replacing 50% of the GGBS with cement played an essential role in increasing compressive strength.
- SFA outperforms POS and NCA in compressive strength. However, the workability of SFA is lower than that of the other two aggregates. The researchers also discovered that the 90% SFA and 10% POS mixture and the 80% SFA and 20% POS mixture had higher strength and unit weight, meeting lightweight structural criteria.
- The series of 2% steel fiber and 0.5% PVA fiber had higher compressive strength than the other percentages. The compressive strength of the 2% hybrid fiber (1.5% steel + 0.5% PVA) was higher.
- In the flexural strength test of the beam, PVA fiber deflected more than steel fiber. As a result, the modulus of rupture of a steel fiber beam was higher.
- The relationship between the beam flexural strength, and the cylinder split tensile strength of LWHFRC was fcb = 0.9782 fspt1.0175, R2 = 0.8426.
- A relationship was formed between the cylinder split tensile strength and compressive strength of LWHFRC: fspt = 0.4309 fc’0.8103, R2 = 0.8875.
- The LWHFRC beam flexural and compressive strengths formed a relationship fcb = 0.2984 fc’0.9062, R2 = 0.868.
- The cylinder modulus of elasticity and LWHFRC compressive strength formed a relationship E = 3.3525 fc’0.5, R2 = 1.
- The ACI-318-19-Ec lightweight concrete equation matched the current lightweight hybrid fiber-reinforced concrete study.
- Mineral admixtures improve the structure of the aggregate’s contact zone, resulting in a better bond between aggregates and cement paste, as demonstrated by the SEM micrograph and XRD report.
- ANOVA and regression analysis produced the most significant results with 5 to 10% error.
Author Contributions
Funding
Institutional Review Board Statement
Informed Consent Statement
Data Availability Statement
Acknowledgments
Conflicts of Interest
References
- Narattha, C.; Chaipanich, A. Phase characterizations, physical properties, and strength of environment-friendly cold-bonded fly ash lightweight aggregates. J. Clean. Prod. 2018, 171, 1094–1100. [Google Scholar] [CrossRef]
- Sathyam, D.; Srikanth, K.; Desai, B.V. Brief Study on Concrete Modified with Artificial Cold Bonded Pelletized Light Weight Fly Ash Aggregates. IOSR J. Eng. 2017, 7, 35–41. [Google Scholar]
- Majhi, R.K.; Padhy, A.; Nayak, A.N. Performance of lightweight structural concrete produced by utilizing the high volume of fly ash chemosphere and sintered fly ash aggregate with silica fume. Clean. Eng. Technol. 2021, 3, 100121. [Google Scholar] [CrossRef]
- Reddy, B.D.; Jyothy, S.A.; Kumar, N.K.; Kumar, K.H. An Experimental Investigation on Concrete by Partial Replacement of Cement by Fly Ash and Fine Aggregate by Quarry Dust. IOP Conf. Ser. Mater. Sci. Eng. 2020, 1006, 012033. [Google Scholar] [CrossRef]
- Hasani, H.; Soleymani, A.; Hashem Jahangir, H.; Azizi, M.B. Investigating the effect of sintered fly ash aggregate on mechanical properties of concrete: A review. In Proceedings of the 13th National Congress on Civil Engineering, Isfahan, Iran, 10–11 May 2022. [Google Scholar]
- Nadesan, M.S.; Dinakar, P. Mix design and properties of fly ash waste lightweight aggregates in structural lightweight concrete. Case Stud. Constr. Mater. 2017, 7, 336–347. [Google Scholar] [CrossRef]
- Nadesan, M.S.; Dinakar, P. Structural concrete using sintered fly ash lightweight aggregate: A review. Constr. Build. Mater. 2017, 154, 928–944. [Google Scholar] [CrossRef]
- Yao, Z.T.; Ji, X.S.; Sarker, P.K.; Tang, J.H.; Ge, L.Q.; Xia, M.S.; Xi, Y.Q. A comprehensive review on the application of coal fly ash. Earth Sci. Rev. 2015, 141, 105–121. [Google Scholar] [CrossRef]
- Central Electricity Authority. Report on Flyash Generation at Coal/Lignite Based Thermal Power Stations, and Its Utilization in the Country for the Year 2015–2016; Central Electricity Authority: New Delhi, India, 2016. [Google Scholar]
- Ramamurthy, K.; Harikrishnan, K.I. Influence of binders on properties of sintered fly ash aggregate. Cem. Concr. Compos. 2006, 28, 33–38. [Google Scholar] [CrossRef]
- Prakash, R.; Raman, S.N.; Subramanian, C.; Divyah, N. Eco-friendly fiber-reinforced concrete. In Handbook of Sustainable Concrete and Industrial Waste Management; Woodhead Publishing: Sawston, UK, 2022. [Google Scholar] [CrossRef]
- Sobuz, H.R.; Hasan, N.M.S.; Tamanna, N.; Islam, S. Structural Lightweight Concrete Production by Using Oil Palm Shell. J. Mater. 2014, 2014, 870247. [Google Scholar] [CrossRef]
- Aslam, M.; Shafigh, P.; Jumaat, M.Z. High Strength Light Weight Aggregate Concrete using Blended Coarse Lightweight Aggregate Origin from Palm Oil Industry. Sains Malays. 2017, 46, 667–675. [Google Scholar] [CrossRef]
- Kamaldeep, M.G.; Chamberlin, S. Experimental Study on Performance of Concrete by using Combination of Fly ash and Ggbs as Blended Material. Int. J. Recent Technol. Eng. IJRTE 2019, 7, 490–495. [Google Scholar]
- Bashar, I.I.; Alengaram, U.J.; Jumaat, M.Z.; Islam, A.; Santhi, H.; Sharmin, A. Engineering properties and fracture behavior of high-volume palm oil fuel ash-based fiber reinforced geopolymer concrete. Constr. Build. Mater. 2016, 111, 286–297. [Google Scholar] [CrossRef]
- Gomathi, P.; Sivakumar, A. An accelerated curing effect on the mechanical performance of cold bonded and sintered fly ash aggregate concrete. Constr. Build. Mater. 2015, 77, 276–287. [Google Scholar] [CrossRef]
- Kockal, N.U.; Ozturan, T. Effects of lightweight fly ash aggregate properties on the behavior of lightweight concrete. J. Hazard. Mater. 2010, 179, 954–965. [Google Scholar] [CrossRef]
- Abbass, W.; Khan, M.I. Mechanical properties of Hybrid steel/PVA fiber reinforced high strength concrete. MATEC Web Conf. 2018, 199, 11005. [Google Scholar] [CrossRef][Green Version]
- Feng, J.; Sun, W.; Zhai, H.; Wang, L.; Dong, H.; Wu, Q. Experimental Study on Hybrid Effect Evaluation of Fiber Reinforced Concrete Subjected to Drop Weight Impacts. Materials 2018, 11, 2563. [Google Scholar] [CrossRef]
- Bijen, J. Manufacturing processes of artificial lightweight aggregates from fly ash. Int. J. Cem. Compos. Lightweight Concr. 1986, 8, 191–199. [Google Scholar] [CrossRef]
- Oti, O.P.; Nwaigwe, K.N.; Okereke, N.A. Assessment of palm kernel shell as a composite aggregate in concrete. CIGR J. 2017, 19, 34–41. Available online: http://www.cigrjournal.org (accessed on 18 August 2017).
- Basha, S.I.; Ali, M.R.; Al-Dulaijan, S.U.; Maslehuddin, M. Mechanical and thermal properties of lightweight recycled plastic aggregate concrete. J. Build. Eng. 2020, 32, 101710. [Google Scholar] [CrossRef]
- Sudhikumar, G.S.; Prakash, K.B.; Rao, M.S. Effect of Aspect Ratio of Fibers on the Strength Characteristics of Slurry Infiltrated Fibrous Ferrocement. J. Civ. Struct. Eng. 2014, 3, 29–37. [Google Scholar]
- Nagarkar, R.; Patel, J. Polyvinyl Alcohol: A Comprehensive Study. Acta Sci. Pharm. Sci. 2019, 3, 34–44. [Google Scholar]
- Verma, C.L.; Handa, S.K.; Jain, S.K.; Yadav, R. Techno-commercial perspective study for sintered fly ash lightweight aggregates in India. Constr. Build. Mater. 1998, 12, 341–346. [Google Scholar] [CrossRef]
- Zhang, R.; Jin, L.; Tian, Y.; Dou, G.; Du, X. Static and dynamic mechanical properties of eco-friendly polyvinyl alcohol fiber-reinforced ultra-high-strength concrete. Struct. Concr. 2019, 20, 1051–1063. [Google Scholar] [CrossRef]
- Noushini, A.; Samali, B.; Vessalas, K. Effect of polyvinyl alcohol (PVA) fiber on dynamic and material properties of fiber reinforced concrete. Constr. Build. Mater. 2013, 49, 374–383. [Google Scholar] [CrossRef]
- Hassanpour, M.; Shafigh, P.; Bin Mahmud, H. Lightweight aggregate concrete fiber reinforcement—A review. Constr. Build. Mater. 2012, 37, 452–461. [Google Scholar] [CrossRef]
- Libre, N.A.; Shekarchizadeh, M.; Mahoutian, M.; Soroushian, P. Mechanical properties of hybrid fiber reinforced lightweight aggregate concrete made with natural pumice. Constr. Build. Mater. 2011, 25, 2458–2464. [Google Scholar] [CrossRef]
- Georgiou, A.; Pantazopoulou, S. Determination of the direct tensile stress-strain curve from simple three-point bending tests. ResearchGate 2014, 2014, 1–11. [Google Scholar] [CrossRef]
- Hamad, A.J.; Sldozian, R.J.A. Flexural and Flexural Toughness of Fiber Reinforced Concrete—American Standard Specifications Review. GRD J. Glob. Res. Dev. J. Eng. 2019, 4, 5–13. [Google Scholar]
- Deepak, T.J.; Jalam, A.A.; Loh, E.; Siow, Y.T.; Nair, S.; Panjehpour, M. Prognostication of Concrete Characteristics with Coconut Shell as Coarse Aggregate Partial Percentile Replacement. IJSRSET Themed Sect. Eng. Technol. 2015, 1, 45–50. Available online: http://ijsrset.com/archive.php?v=4&i=6&pyear=2015 (accessed on 15 September 2015).
- Franklin, S.O.; Kangootui, F.I. Tensile/Compressive/Flexural Strength Relationships for Concrete using Kgale Aggregates with Botchem as Binder. Int. J. Sci. Eng. Res. 2020, 11, 5. [Google Scholar]
- Xie, F.; Zhang, C.; Cai, D.; Ruan, J. Comparative Study on the Mechanical Strength of SAP Internally Cured Concrete. Front. Mater. 2020, 7, 588130. [Google Scholar] [CrossRef]
- Juki, M.I.; Awang, M.; Annas, M.M.K.; Boon, K.H.; Othman, N.; Kadir, A.B.A.; Roslan, M.A.; Khalid, F.S. Relationship Between Compressive, Splitting Tensile and Flexural Strength of Concrete Containing Granulated Waste Polyethylene Terephthalate (PET) Bottles as Fine Aggregate. Available online: https://doi.org/10.4028/www.scientific.net/AMR.795.356 (accessed on 15 September 2013).
- Moretti, L.; Natali, S.; Tiberi, A.; D’Andrea, A. Proposal for a Methodology Based on XRD and SEM-EDS to Monitor Effects of Lime-Treatment on Clayey Soils. Appl. Sci. 2020, 10, 2569. [Google Scholar] [CrossRef]
- Kanniyappan, S.P.; Kumar, S.; Muthukumaran, T. Analyzing the Microstructural Properties of Nanomaterial in OPC by SEM, TEM, XRD and Corrosion Rate by TAFEL Techniques. Int. Res. J. Eng. Technol. IRJET 2017, 4, 1497–1503. [Google Scholar]
- Geetha, S.; Ramamurthy, K. Properties of sintered low calcium bottom ash aggregate with clay binders. Constr. Build. Mater. 2011, 25, 2002–2013. [Google Scholar] [CrossRef]
- Yusuf, S.; Islam, N.; Akram, W.; Ali, H.; Siddique, A. Prediction of the best tensile and flexural strength of natural fiber reinforced epoxy resin-based composite using taguchi method. In Proceedings of the International Conference on Industrial & Mechanical Engineering and Operations Management, Dhaka, Bangladesh, 26–27 December 2020. [Google Scholar]
- Arιoglu, N.; Girgin, Z.C.; Arιoglu, E. Evaluation of Ratio between Splitting Tensile Strength and Compressive Strength for Concretes up to 120 MPa and its Application in Strength Criterion. ACI Mater. J. 2006, 103, 18–24. [Google Scholar]


| Materials | Mechanical Properties |
|---|---|
| Cement | 53 grades, OPC |
| Silica fume | Self-compaction, but SP required |
| Fly ash | Class F, unit weight 1380 kg/m3 |
| GGBS | 1000–1100 kg/m3 (loose), 1200–1300 kg/m3 (vibrated) |
| CA (NCA) | 12 to 18 mm, an angular shape |
| CA (SFA) | 12.5 to 18 mm, density 678 to 879 kg/m3, water absorption <10% for 24 h, round shape |
| CA (POS) | 10 to 12.5 mm, density 610 to 860 kg/m3, water absorption < 15%, triangular shape |
| FA | Dune sand is 0.6 mm, and coarse sand is 4.75 mm |
| Water | Normal (pure) |
| SP | Sulfated naphthalene |
| Fiber—Steel | MS13/0.32 and MS16/0.2 of tensile strength 2800 MPa with an aspect ratio of 40 and 80 |
| Fiber—PVA | 6 mm and 12 mm with aspect ratio 800 and tensile strength 1500 MPa |
| Mix | Cement | Silica Fume | Fly Ash | GGBS | CA (NCA) | CA (SFA) | CA (POS) | FA | Water | SP | Steel Fiber | PVA Fiber | Total |
|---|---|---|---|---|---|---|---|---|---|---|---|---|---|
| HA1 | 330.00 | 60.00 | 0.00 | 210.00 | 0.00 | 345.43 | 82.82 | 613.47 | 176.64 | 6.00 | 0.00 | 0.00 | 1824.35 |
| HA2 | 330.00 | 60.00 | 0.00 | 210.00 | 0.00 | 345.43 | 82.82 | 613.47 | 176.64 | 6.00 | 9.12 | 9.12 | 1824.35 |
| HA3 | 330.00 | 60.00 | 0.00 | 210.00 | 0.00 | 345.43 | 82.82 | 613.47 | 176.64 | 6.00 | 13.68 | 4.56 | 1824.35 |
| HA4 | 330.00 | 60.00 | 0.00 | 210.00 | 0.00 | 345.43 | 82.82 | 613.47 | 176.64 | 6.00 | 4.56 | 13.68 | 1824.35 |
| HA5 | 330.00 | 60.00 | 0.00 | 210.00 | 0.00 | 345.43 | 82.82 | 613.47 | 176.64 | 6.00 | 18.24 | 0.00 | 1824.35 |
| HA6 | 330.00 | 60.00 | 0.00 | 210.00 | 0.00 | 345.43 | 82.82 | 613.47 | 176.64 | 6.00 | 0.00 | 18.24 | 1824.35 |
| HB1 | 330.00 | 60.00 | 0.00 | 210.00 | 0.00 | 345.43 | 82.82 | 613.47 | 176.64 | 6.00 | 0.00 | 0.00 | 1824.35 |
| HB2 | 330.00 | 60.00 | 0.00 | 210.00 | 0.00 | 345.43 | 82.82 | 613.47 | 176.64 | 6.00 | 9.12 | 18.24 | 1824.35 |
| HB3 | 330.00 | 60.00 | 0.00 | 210.00 | 0.00 | 345.43 | 82.82 | 613.47 | 176.64 | 6.00 | 18.24 | 9.12 | 1824.35 |
| HB4 | 330.00 | 60.00 | 0.00 | 210.00 | 0.00 | 345.43 | 82.82 | 613.47 | 176.64 | 6.00 | 22.80 | 4.56 | 1824.35 |
| HB5 | 330.00 | 60.00 | 0.00 | 210.00 | 0.00 | 345.43 | 82.82 | 613.47 | 176.64 | 6.00 | 27.37 | 0.00 | 1824.35 |
| HB6 | 330.00 | 60.00 | 0.00 | 210.00 | 0.00 | 345.43 | 82.82 | 613.47 | 176.64 | 6.00 | 0.00 | 27.37 | 1824.35 |
| HC1 | 330.00 | 60.00 | 0.00 | 210.00 | 0.00 | 345.43 | 82.82 | 613.47 | 176.64 | 6.00 | 0.00 | 0.00 | 1824.35 |
| HC2 | 330.00 | 60.00 | 0.00 | 210.00 | 0.00 | 345.43 | 82.82 | 613.47 | 176.64 | 6.00 | 9.12 | 27.37 | 1824.35 |
| HC3 | 330.00 | 60.00 | 0.00 | 210.00 | 0.00 | 345.43 | 82.82 | 613.47 | 176.64 | 6.00 | 18.24 | 18.24 | 1824.35 |
| HC4 | 330.00 | 60.00 | 0.00 | 210.00 | 0.00 | 345.43 | 82.82 | 613.47 | 176.64 | 6.00 | 27.37 | 9.12 | 1824.35 |
| HC5 | 330.00 | 60.00 | 0.00 | 210.00 | 0.00 | 345.43 | 82.82 | 613.47 | 176.64 | 6.00 | 36.49 | 0.00 | 1824.35 |
| HC6 | 330.00 | 60.00 | 0.00 | 210.00 | 0.00 | 345.43 | 82.82 | 613.47 | 176.64 | 6.00 | 0.00 | 36.49 | 1824.35 |
| Mix | Cement | Silica Fume | Fly Ash | GGBS | CA (NCA) | CA (SFA) | CA (POS) | FA | Water | SP | Steel Fiber | PVA Fiber | Total |
|---|---|---|---|---|---|---|---|---|---|---|---|---|---|
| C1 | 600.00 | 0.00 | 0.00 | 0.00 | 1053.16 | 0.00 | 0.00 | 651.96 | 176.64 | 6.00 | 0.00 | 0.00 | 2487.76 |
| C2 | 600.00 | 0.00 | 0.00 | 0.00 | 0.00 | 458.88 | 0.00 | 651.96 | 176.64 | 6.00 | 0.00 | 0.00 | 1893.48 |
| C3 | 600.00 | 0.00 | 0.00 | 0.00 | 0.00 | 0.00 | 389.53 | 577.08 | 248.64 | 6.00 | 0.00 | 0.00 | 1821.25 |
| E1 | 330.00 | 60.00 | 0.00 | 210.00 | 0.00 | 431.79 | 0.00 | 613.47 | 176.64 | 6.00 | 0.00 | 0.00 | 1827.89 |
| E2 | 330.00 | 60.00 | 0.00 | 210.00 | 0.00 | 388.61 | 41.41 | 613.47 | 176.64 | 6.00 | 0.00 | 0.00 | 1826.12 |
| E3 | 330.00 | 60.00 | 0.00 | 210.00 | 0.00 | 345.43 | 82.82 | 613.47 | 176.64 | 6.00 | 0.00 | 0.00 | 1824.35 |
| E4 | 330.00 | 60.00 | 0.00 | 210.00 | 0.00 | 302.25 | 124.23 | 613.47 | 176.64 | 6.00 | 0.00 | 0.00 | 1822.58 |
| E5 | 330.00 | 60.00 | 0.00 | 210.00 | 0.00 | 259.07 | 165.64 | 613.47 | 176.64 | 6.00 | 0.00 | 0.00 | 1820.81 |
| E6 | 330.00 | 60.00 | 0.00 | 210.00 | 0.00 | 215.89 | 207.04 | 613.47 | 176.64 | 6.00 | 0.00 | 0.00 | 1819.04 |
| E Series (Without Fiber)—LWC | ||||
| Mix | Slump (mm) | Compaction Factor | Vee Bee Time in Seconds | Water Absorption % |
| E1/CS | 270 | 0.89 | 8 | 2.5 |
| E2 | 255 | 0.87 | 11 | 3.4 |
| E3 | 240 | 0.8 | 13 | 3.7 |
| E4 | 233 | 0.78 | 15 | 4.6 |
| E5 | 210 | 0.77 | 18 | 5.3 |
| E6 | 190 | 0.75 | 20 | 5.5 |
| HA Series (With 1% Hybrid fiber) | ||||
| Mix | Slump (mm) | Compaction Factor | Vee Bee Time in Seconds | Water Absorption % |
| HA1/CS | 240 | 0.8 | 13 | 3.7 |
| HA2 | 201 | 0.83 | 14 | 4.5 |
| HA3 | 192 | 0.71 | 15 | 4.9 |
| HA4 | 180 | 0.79 | 17 | 7.6 |
| HA5 | 173 | 0.76 | 20 | 8.2 |
| HA6 | 165 | 0.71 | 22 | 9.5 |
| HB Series (With 1.5% Hybrid fiber) | ||||
| Mix | Slump (mm) | Compaction Factor | Vee Bee Time in Seconds | Water Absorption % |
| HB1/CS | 240 | 0.8 | 13 | 3.7 |
| HB2 | 210 | 0.74 | 14 | 4.6 |
| HB3 | 194 | 0.71 | 16 | 5.2 |
| HB4 | 180 | 0.68 | 18 | 5.7 |
| HB5 | 162 | 0.69 | 20 | 11.8 |
| HB6 | 154 | 0.64 | 23 | 12.4 |
| HC Series (With 2% Hybrid fiber) | ||||
| Mix | Slump (mm) | Compaction Factor | Vee Bee Time in Seconds | Water Absorption % |
| HC1/CS | 240 | 0.8 | 13 | 3.7 |
| HC2 | 206 | 0.87 | 11 | 2 |
| HC3 | 192 | 0.8 | 13 | 3.5 |
| HC4 | 180 | 0.78 | 15 | 4 |
| HC5 | 168 | 0.65 | 21 | 6.2 |
| HC6 | 140 | 0.67 | 23 | 13.7 |
| Mix | 7 Days | 28 Days | % Increase Strength | |||
|---|---|---|---|---|---|---|
| fc’ | σ | fc’ | σ | 7 Days | 28 Days | |
| E1 | 43.37 | 5.25 | 64.15 | 3.26 | 72.66 | 80.44 |
| E2 | 38.43 | 5.41 | 57.43 | 5.43 | 52.97 | 61.53 |
| E3 | 37.85 | 3.09 | 55.45 | 4.82 | 50.69 | 55.99 |
| E4 | 28.52 | 5.24 | 39.75 | 3.5 | 13.53 | 11.83 |
| E5 | 25.93 | 4.07 | 42.23 | 2.77 | 3.24 | 18.78 |
| E6 | 22.89 | 3.03 | 37.30 | 2.05 | −8.88 | 4.93 |
| Mix of 1% Hybrid Fiber fc’ (MPa) | ||||||
| Mix | 7 Days | 28 Days | % Increase Strength | |||
| fc’ | σ | fc’ | σ | 7 Days | 28 Days | |
| HA1 | 37.85 | 1.77 | 55.45 | 3.73 | 50.69 | 55.99 |
| HA2 | 35.43 | 2.95 | 56.16 | 7.60 | 41.02 | 57.96 |
| HA3 | 42.58 | 9.59 | 58.46 | 7.56 | 69.50 | 64.44 |
| HA4 | 39.75 | 4.75 | 55.98 | 1.80 | 58.26 | 57.48 |
| HA5 | 42.49 | 3.93 | 60.43 | 4.96 | 69.14 | 69.97 |
| HA6 | 37.15 | 2.53 | 52.44 | 2.41 | 47.87 | 47.50 |
| Mix of 1.5% Hybrid Fiber fc’ (MPa) | ||||||
| Mix | 7 Days | 28 Days | % Increase Strength | |||
| fc’ | σ | fc’ | σ | 7 Days | 28 Days | |
| HB1 | 37.85 | 2.14 | 55.45 | 2.90 | 50.69 | 55.99 |
| HB2 | 37.43 | 3.78 | 55.55 | 3.81 | 48.98 | 56.24 |
| HB3 | 40.85 | 5.11 | 59.58 | 4.20 | 62.63 | 67.59 |
| HB4 | 43.28 | 4.53 | 63.49 | 2.20 | 72.29 | 78.58 |
| HB5 | 43.58 | 2.35 | 66.25 | 1.57 | 73.47 | 86.34 |
| HB6 | 27.42 | 3.85 | 43.88 | 7.60 | 9.17 | 23.42 |
| Mix of 2% Hybrid Fiber fc’ (MPa) | ||||||
| Mix | 7 Days | 28 Days | % Increase Strength | |||
| fc’ | σ | fc’ | σ | 7 Days | 28 Days | |
| HC1 | 37.85 | 2.25 | 55.45 | 2.84 | 50.69 | 55.99 |
| HC2 | 37.43 | 3.17 | 55.55 | 2.69 | 49.00 | 56.24 |
| HC3 | 38.62 | 2.28 | 56.46 | 4.38 | 53.76 | 58.81 |
| HC4 | 41.87 | 3.93 | 62.44 | 4.92 | 66.68 | 75.63 |
| HC5 | 48.66 | 8.27 | 69.43 | 3.86 | 93.70 | 95.29 |
| HC6 | 22.43 | 2.13 | 33.47 | 2.17 | −10.72 | −5.85 |
| C1—Control Specimen fc’ = 25.12 MPa (7 Days) and 35.55 MPa (28 Days) | ||||||
| Mix Stage | 7 Days | 28 Days | ||||||
|---|---|---|---|---|---|---|---|---|
| fc’ (MPa) | fcb (MPa) | fspt (MPa) | Ec (GPa) | fc’ (MPa) | fcb (MPa) | fspt (MPa) | Ec (GPa) | |
| HA1 | 37.85 | 7.81 | 7.59 | 21.96 | 55.45 | 11.09 | 10.82 | 24.96 |
| HA2 | 35.43 | 8.12 | 7.95 | 22.15 | 56.15 | 11.65 | 11.28 | 25.12 |
| HA3 | 42.58 | 8.15 | 8.16 | 22.54 | 58.45 | 11.76 | 11.54 | 25.63 |
| HA4 | 39.75 | 7.84 | 7.68 | 22.01 | 55.98 | 11.23 | 10.85 | 25.08 |
| HA5 | 42.49 | 9.23 | 8.71 | 23.12 | 60.42 | 12.91 | 12.35 | 26.06 |
| HA6 | 37.15 | 8.11 | 7.10 | 21.32 | 52.43 | 11.56 | 10.21 | 24.27 |
| HB1 | 37.85 | 7.81 | 7.59 | 22.93 | 55.45 | 11.09 | 10.82 | 24.96 |
| HB2 | 37.43 | 8.05 | 7.65 | 21.97 | 55.54 | 11.57 | 10.93 | 24.98 |
| HB3 | 40.85 | 8.42 | 8.49 | 22.77 | 59.57 | 12.43 | 12.13 | 25.87 |
| HB4 | 43.28 | 8.72 | 8.64 | 23.53 | 63.48 | 12.69 | 12.34 | 26.71 |
| HB5 | 43.58 | 9.64 | 9.62 | 23.95 | 66.24 | 13.48 | 13.35 | 27.28 |
| HB6 | 27.42 | 6.72 | 7.04 | 19.47 | 43.87 | 9.56 | 10.05 | 22.20 |
| HC1 | 37.85 | 7.81 | 7.59 | 21.93 | 55.45 | 11.09 | 10.82 | 24.96 |
| HC2 | 37.43 | 7.82 | 7.87 | 22.10 | 56.12 | 11.23 | 11.21 | 25.11 |
| HC3 | 38.62 | 8.25 | 7.96 | 22.13 | 56.45 | 11.85 | 11.34 | 25.19 |
| HC4 | 41.87 | 8.63 | 8.67 | 23.27 | 62.43 | 12.49 | 12.34 | 26.49 |
| HC5 | 48.66 | 9.71 | 9.84 | 24.50 | 69.42 | 13.96 | 13.85 | 27.93 |
| HC6 | 22.43 | 6.75 | 7.22 | 21.20 | 51.54 | 9.53 | 10.45 | 24.07 |
| Material | Unit Volume (m3) | Quantity (kg/m3) | Price/Ton | Total Cost (NTD) |
|---|---|---|---|---|
| Cement | 0.19 | 600.00 | 5500.00 | 3300.00 |
| Sand (FA) | 0.25 | 651.96 | 450.00 | 293.38 |
| NCA | 0.38 | 1053.17 | 450.00 | 473.92 |
| SFA | 0.00 | 0.00 | 0.00 | 0.00 |
| POS | 0.00 | 0.00 | 0.00 | 0.00 |
| Silica Fume | 0.00 | 0.00 | 0.00 | 0.00 |
| GGBS | 0.00 | 0.00 | 0.00 | 0.00 |
| Fly Ash | 0.00 | 0.00 | 0.00 | 0.00 |
| SP | 0.01 | 6.00 | 0.00 | 0.00 |
| Water | 0.18 | 176.64 | 100.00 | 17.66 |
| Total Quantity | 2487.76 | 4084.97 | ||
| Material | Unit Volume (m3) | Quantity (kg/m3) | Price/Ton | Total Cost (NTD) |
|---|---|---|---|---|
| Cement | 0.10 | 330.00 | 5500.00 | 1815.00 |
| Sand (FA) | 0.23 | 613.47 | 450.00 | 276.06 |
| NCA | 0.00 | 0.00 | 450.00 | 0.00 |
| SFA | 0.28 | 345.43 | 350.00 | 120.90 |
| POS | 0.07 | 82.82 | 5600.00 | 463.79 |
| Silica Fume | 0.02 | 60.00 | 30000.00 | 1800.00 |
| GGBS | 0.09 | 210.00 | 1200.00 | 252.00 |
| Fly Ash | 0.00 | 0.00 | 800.00 | 0.00 |
| SP | 0.01 | 6.00 | 2000.00 | 12.00 |
| Water | 0.18 | 176.64 | 100.00 | 17.66 |
| Total Quantity | 1824.36 | 4757.42 | ||
| NCA—normal coarse aggregate, NTD—New Taiwan Dollar | ||||
| Mix | Unit Weight (kg/m3) | Cost (NTD) | Fc’ (MPa) | Increment Cost | Increment Strength | Decrease Unit Weight |
|---|---|---|---|---|---|---|
| C1 (NC) | 2487.76 | 4084.97 | 35.55 | 16.46% | 55.98% | 26.67% |
| E3 (LWC) | 1824.36 | 4757.42 | 55.45 |
| Elements | Weight % |
|---|---|
| C | 55.39 |
| O | 33.64 |
| Na | 0.18 |
| Mg | 0.43 |
| AL | 2.27 |
| Si | 4.82 |
| Ca | 2.6 |
| Ti | 0.26 |
| Fe | 0.33 |
| Cu | 0.08 |
| Total | 100 |
| Bulk Density | Water Absorption | Slump | Compressive Strength | |
|---|---|---|---|---|
| Row (Between Group) | Insignificant | Significant | Significant | Insignificant |
| Column (Within Group) | Significant | Insignificant | Insignificant | Insignificant |
| Summary Of Regression Analysis—LWHFRC | ||||
| Bulk Density | Water Absorption | Slump | Compressive Strength | |
| Column (Within Group) | Significant | Significant | Significant | Insignificant |
| Column (Within Group) | Significant | Significant | Significant | Insignificant |
| Column (Within Group) | Significant | Significant | Significant | Insignificant |
| Source of Variation | SS | DF | MS | F | p-Value | F Crit |
|---|---|---|---|---|---|---|
| Rows (Between Group) | 73.06899 | 5 | 14.6138 | 0.002334 | 0.999999 | 3.32585 |
| Columns (Within Group) | 10,511,267 | 2 | 5,255,633 | 839.347 | 7.28 × 10⁻¹² | 4.10281 |
| Error | 62,615.74 | 10 | 6261.574 | |||
| Total | 10,573,956 | 17 | ||||
| ANOVA for Water Absorption—LWHFRC | ||||||
| Source of Variation | SS | DF | MS | F | p-value | F crit |
| Rows (Between Group) | 161.3783 | 5 | 32.27567 | 11.13594 | 0.000783 | 3.325835 |
| Columns (Within Group) | 8.843333 | 2 | 4.421667 | 1.525589 | 0.26409 | 4.102821 |
| Error | 28.98333 | 10 | 2.898333 | |||
| Total | 199.205 | 17 | ||||
| ANOVA for Slump | ||||||
| Source of Variation | SS | DF | MS | F | p-value | F crit |
| Rows | 14,160.5 | 5 | 2832.1 | 77.45032 | 1.15 × 10⁻⁷ | 3.325835 |
| Columns | 52.33333 | 2 | 26.16667 | 0.715588 | 0.512325 | 4.102821 |
| Error | 365.6667 | 10 | 36.56667 | |||
| Total | 14,578.5 | 17 | ||||
| ANOVA for fc’—Lightweight Hybrid Fiber-Reinforced Concrete | ||||||
| Source of Variation | SS | DF | MS | F | p-value | F crit |
| Rows (Between Group) | 826.0872 | 5 | 165.2174 | 6.623388 | 0.005707 | 3.325835 |
| Columns (Within Group) | 10.83689 | 2 | 5.418447 | 0.21722 | 0.808452 | 4.102821 |
| Error | 249.4455 | 10 | 24.94455 | |||
| Total | 1086.37 | 17 | ||||
| Factors | R Square | Adjusted R Square | DF | F | Significance F |
|---|---|---|---|---|---|
| POS | 1 | 1 | 1 | 5.94355 × 1032 | 1.69848 × 10−65 |
| SFA | 1 | 1 | 1 | 3.11206 × 1031 | 6.19518 × 10−63 |
| LWC | 1 | 1 | 1 | 1.9908 × 1027 | 1.51389 × 10−54 |
| Regression for Water Absorption | |||||
| HA | 0.953685964 | 0.942107455 | 1 | 82.36690647 | 0.000817123 |
| HB | 0.836947333 | 0.796184166 | 1 | 20.53195076 | 0.010567519 |
| HC | 0.635757264 | 0.544696581 | 1 | 6.981687786 | 0.057442761 |
| Regression for Slump | |||||
| HA | 0.875740011 | 0.844675014 | 1 | 28.19057099 | 0.006048326 |
| HB | 0.969230769 | 0.969230769 | 1 | 126 | 0.000358735 |
| HC | 0.963329455 | 0.954161818 | 1 | 105.0793708 | 0.000510568 |
| Regression for Compressive Strength | |||||
| HA | 0.008658483 | −0.239176896 | 1 | 0.034936428 | 0.860826386 |
| HB | 0.022056558 | −0.222429303 | 1 | 0.090216087 | 0.778866104 |
| HC | 0.076118739 | −0.154851577 | 1 | 0.3295607 | 0.596656068 |
Publisher’s Note: MDPI stays neutral with regard to jurisdictional claims in published maps and institutional affiliations. |
© 2022 by the authors. Licensee MDPI, Basel, Switzerland. This article is an open access article distributed under the terms and conditions of the Creative Commons Attribution (CC BY) license (https://creativecommons.org/licenses/by/4.0/).
Share and Cite
Behera, D.; Liu, K.-Y.; Gopalakrishnan, D. Experimental Prognostication of Ultra-High-Performance Lightweight Hybrid Fiber-Reinforced Concrete by Using Sintered Fly Ash Aggregate, Palm Oil Shell Aggregate, and Supplementary Cementitious Materials. Materials 2022, 15, 5051. https://doi.org/10.3390/ma15145051
Behera D, Liu K-Y, Gopalakrishnan D. Experimental Prognostication of Ultra-High-Performance Lightweight Hybrid Fiber-Reinforced Concrete by Using Sintered Fly Ash Aggregate, Palm Oil Shell Aggregate, and Supplementary Cementitious Materials. Materials. 2022; 15(14):5051. https://doi.org/10.3390/ma15145051
Chicago/Turabian StyleBehera, Diptikar, Kuang-Yen Liu, and Dineshkumar Gopalakrishnan. 2022. "Experimental Prognostication of Ultra-High-Performance Lightweight Hybrid Fiber-Reinforced Concrete by Using Sintered Fly Ash Aggregate, Palm Oil Shell Aggregate, and Supplementary Cementitious Materials" Materials 15, no. 14: 5051. https://doi.org/10.3390/ma15145051
APA StyleBehera, D., Liu, K.-Y., & Gopalakrishnan, D. (2022). Experimental Prognostication of Ultra-High-Performance Lightweight Hybrid Fiber-Reinforced Concrete by Using Sintered Fly Ash Aggregate, Palm Oil Shell Aggregate, and Supplementary Cementitious Materials. Materials, 15(14), 5051. https://doi.org/10.3390/ma15145051