
Pressure-Induced Superconductivity of the Quasi-One-Dimensional Organic Conductor (TMTTF)2TaF6


Abstract
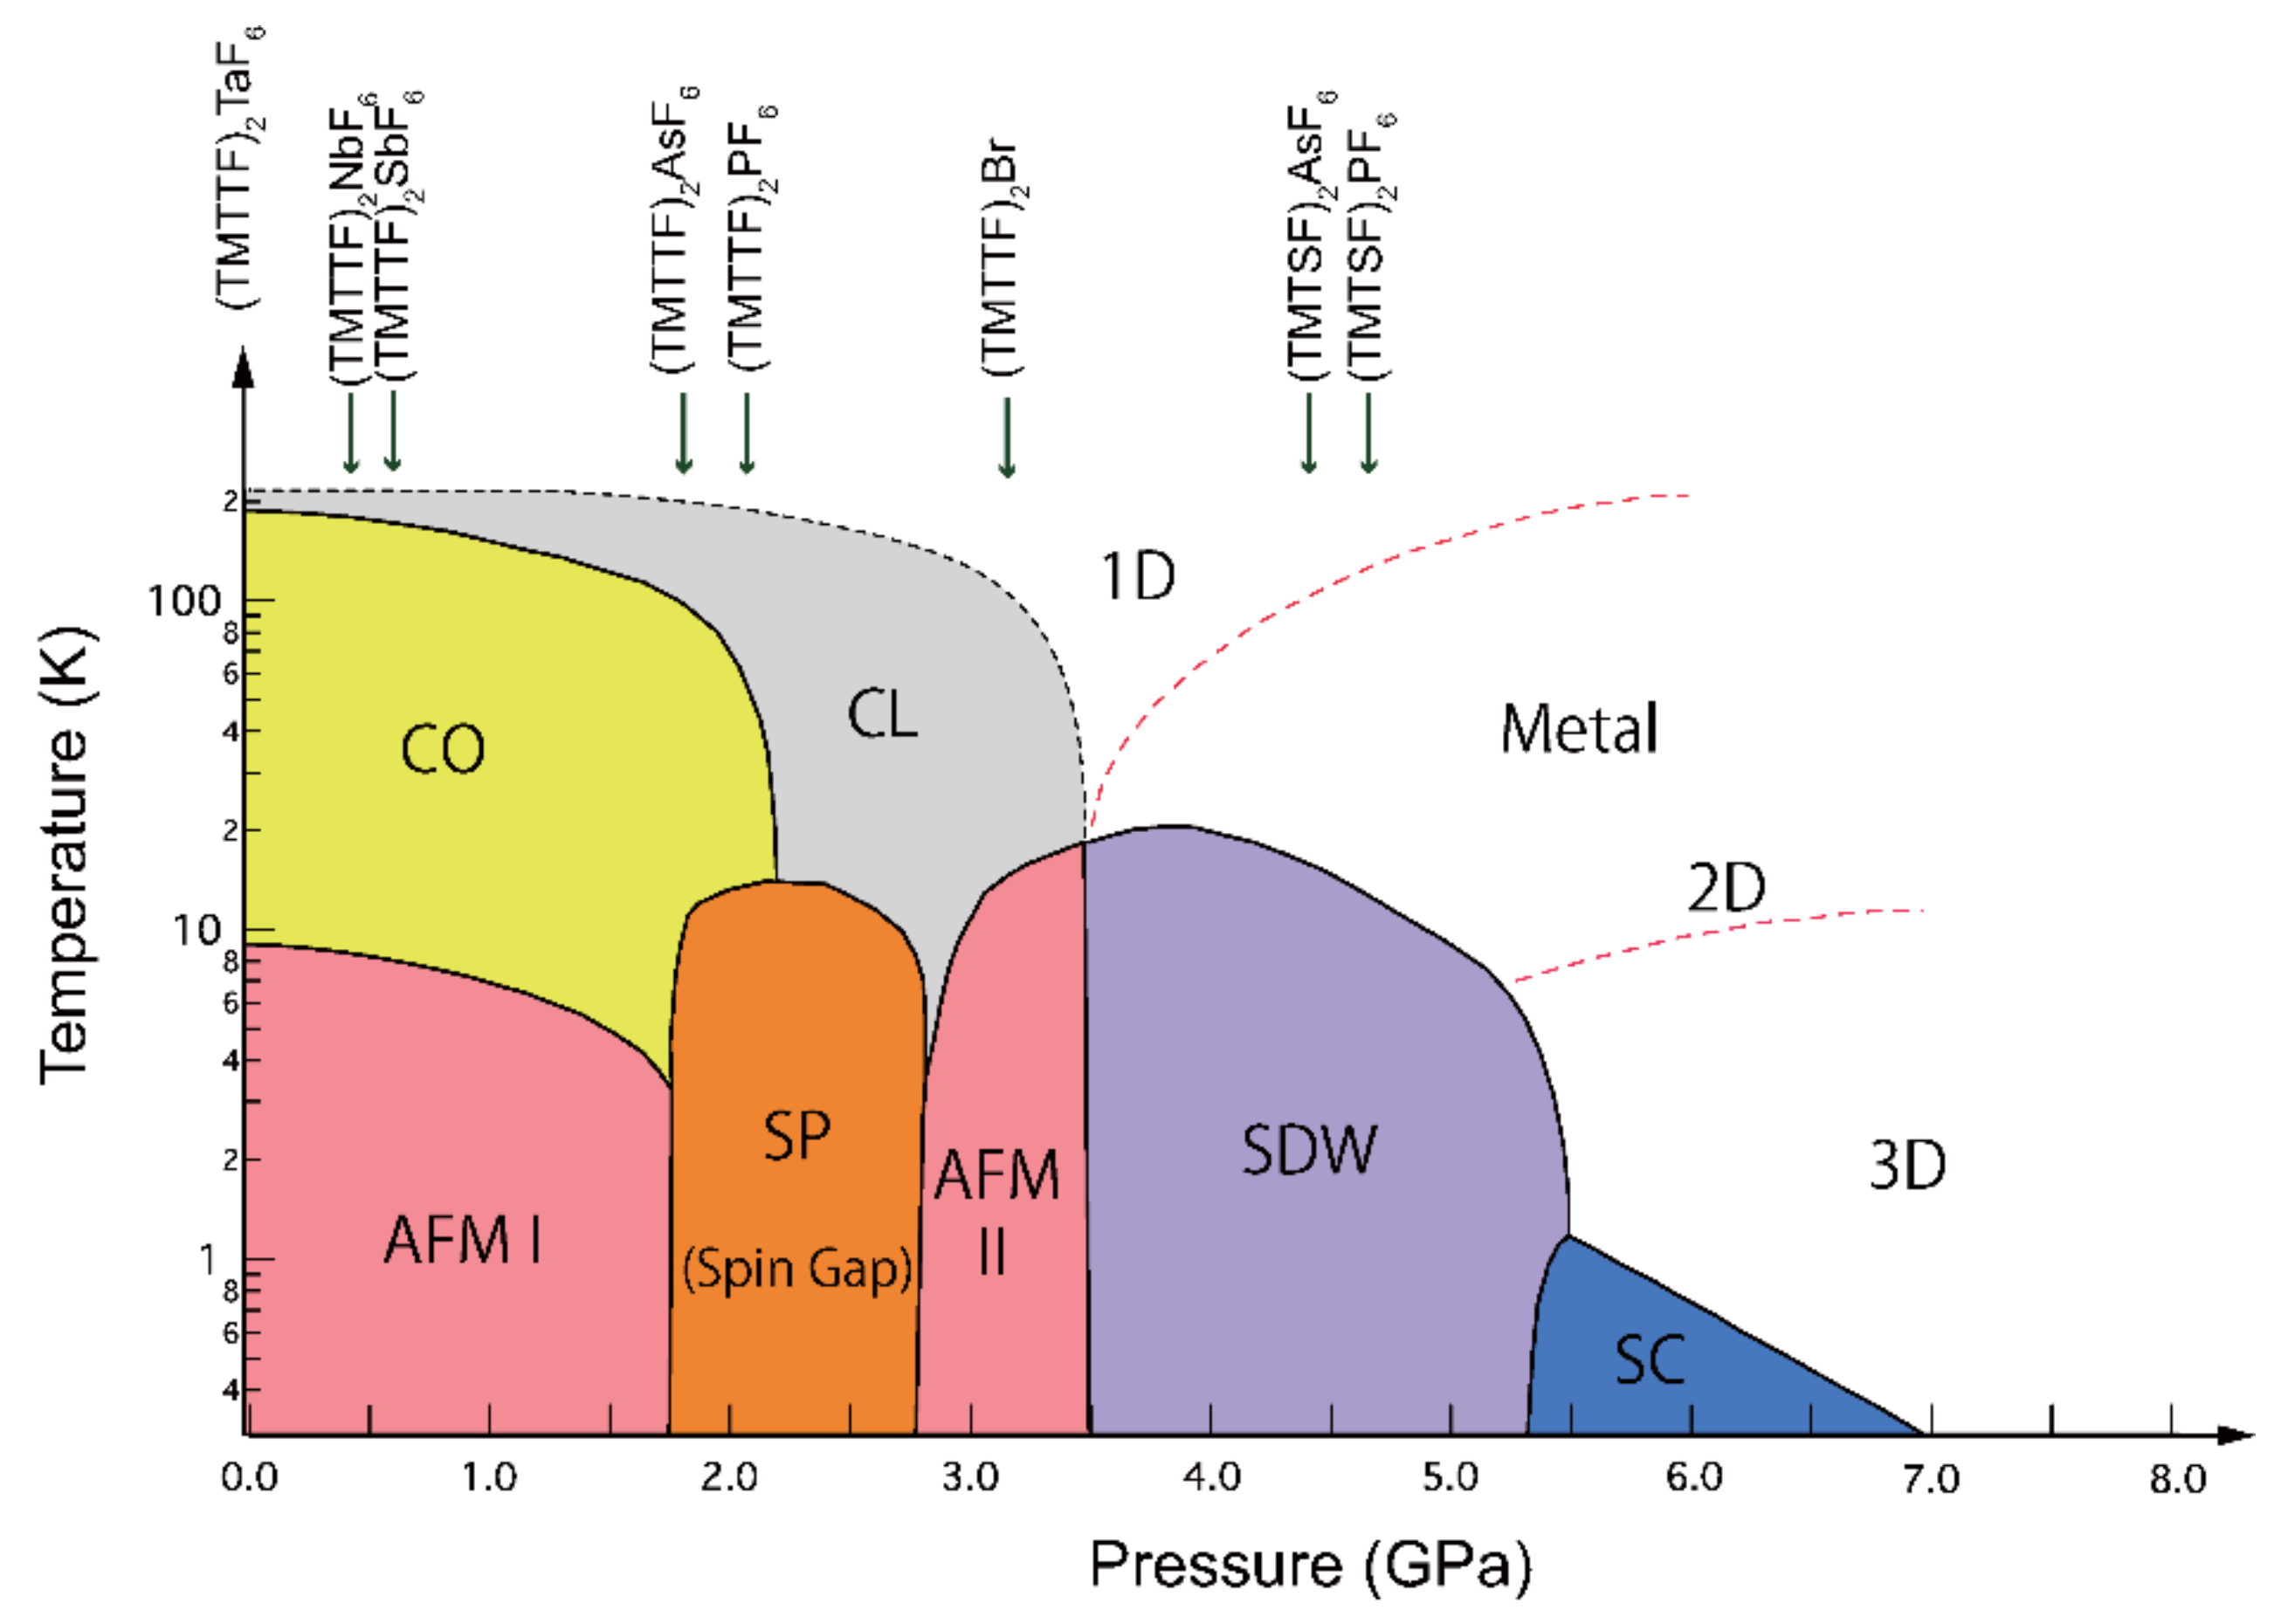
:1. Introduction
2. Experimental Section
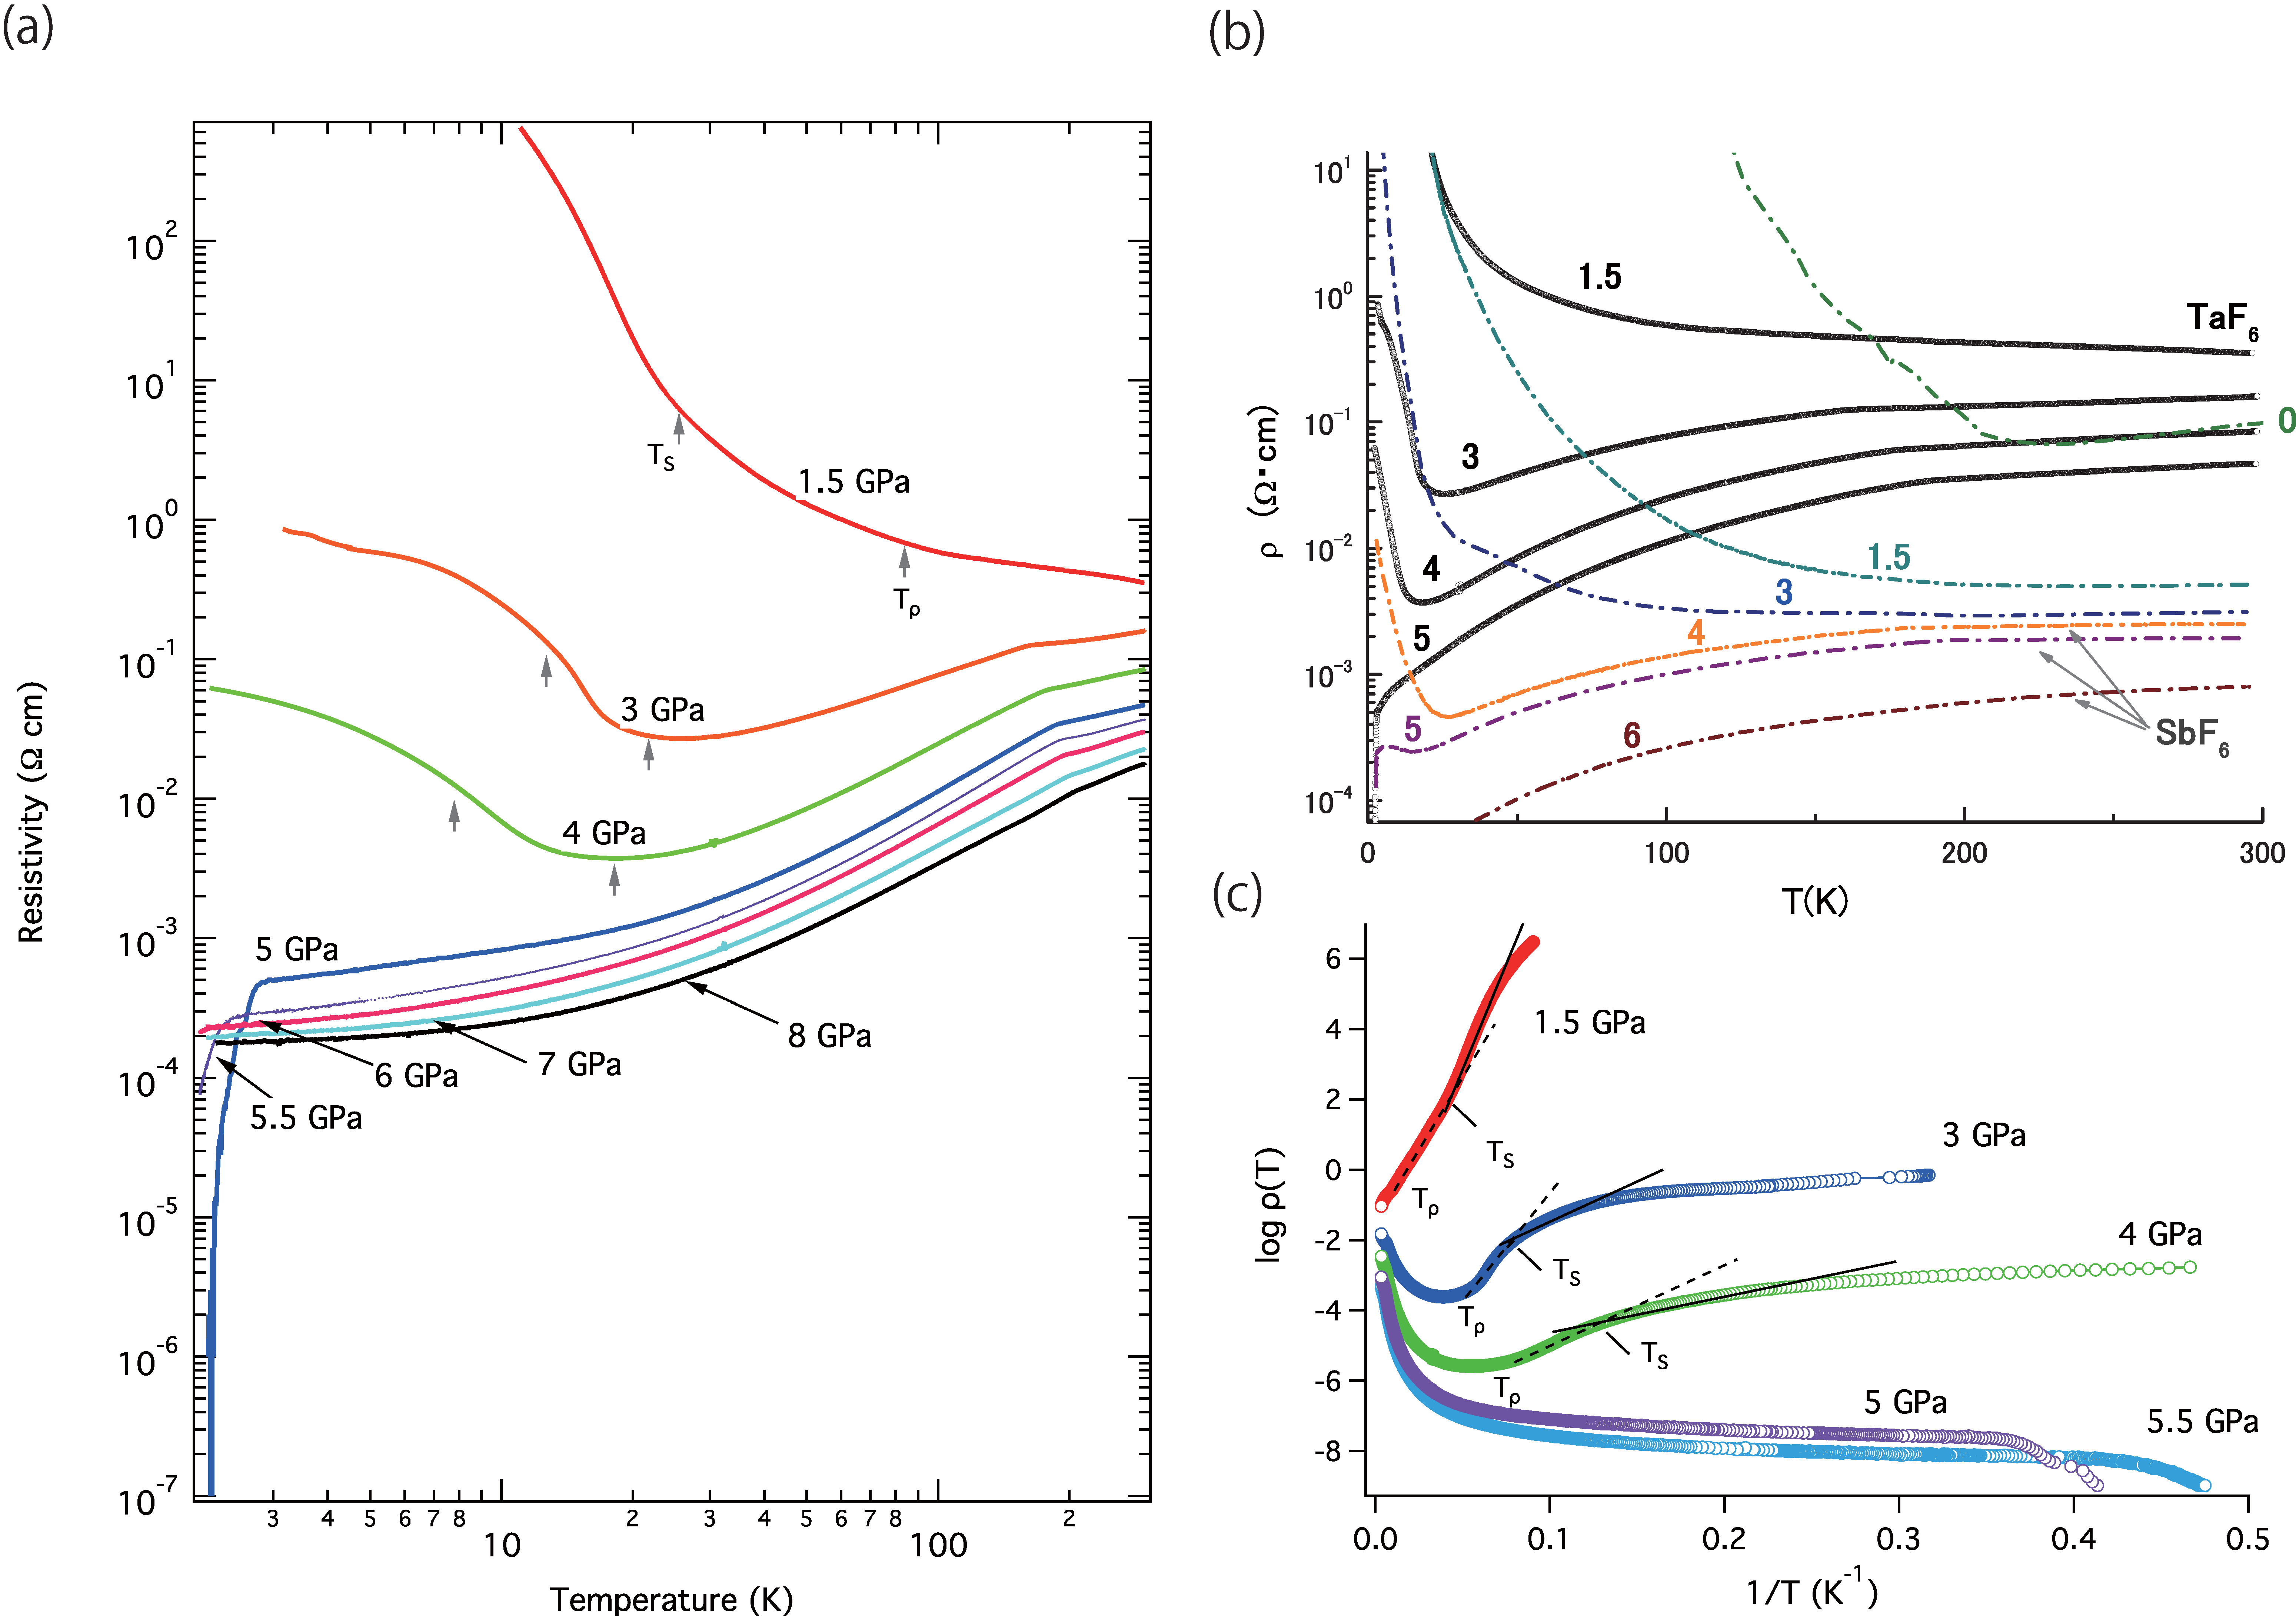
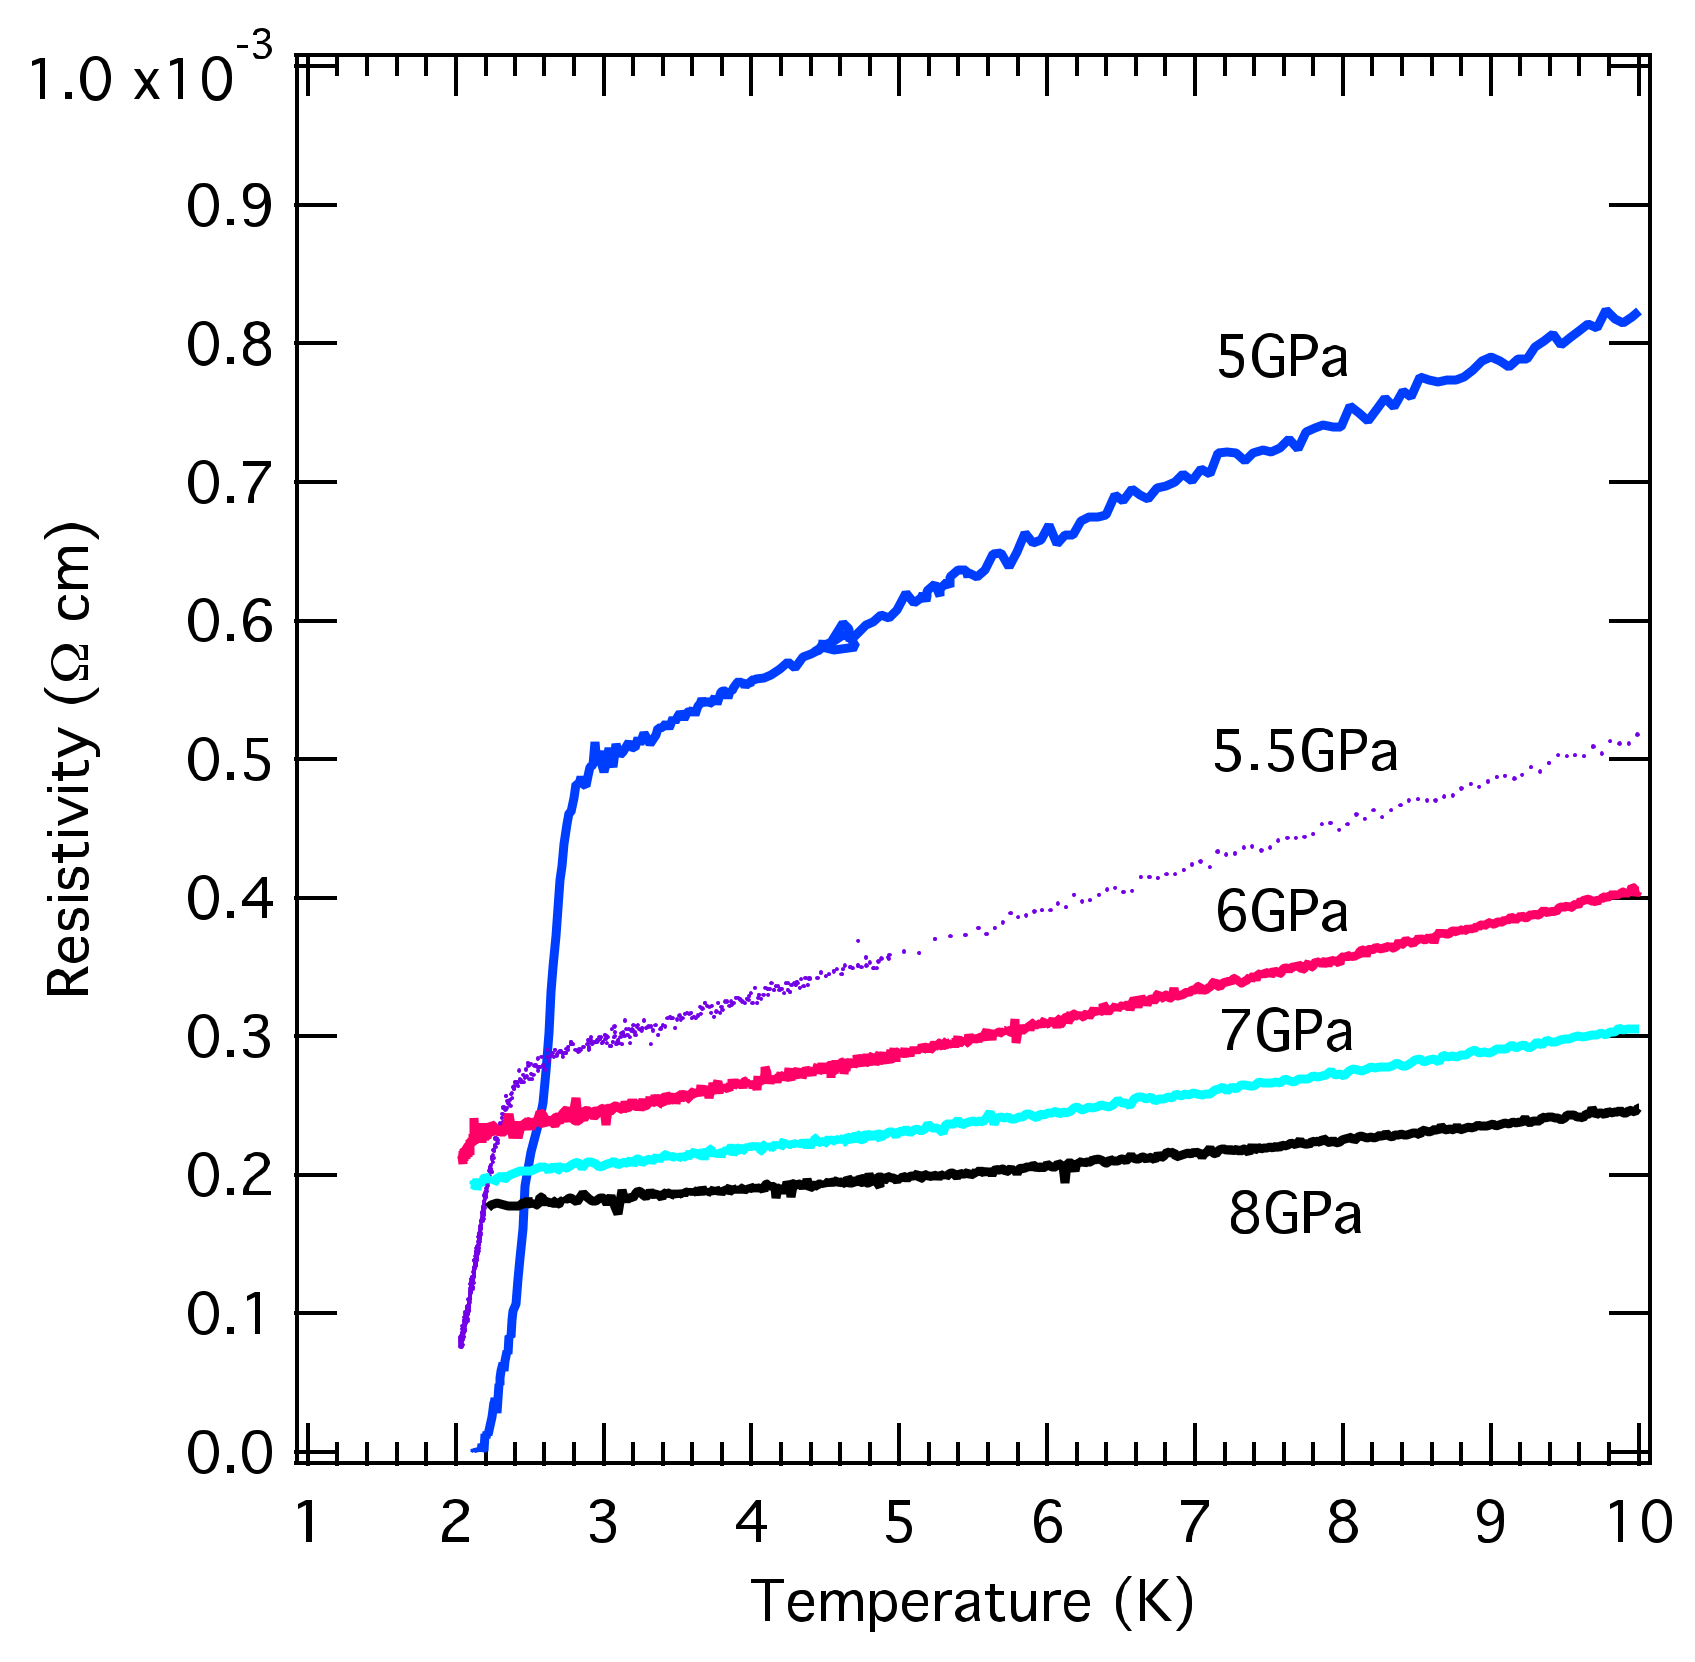
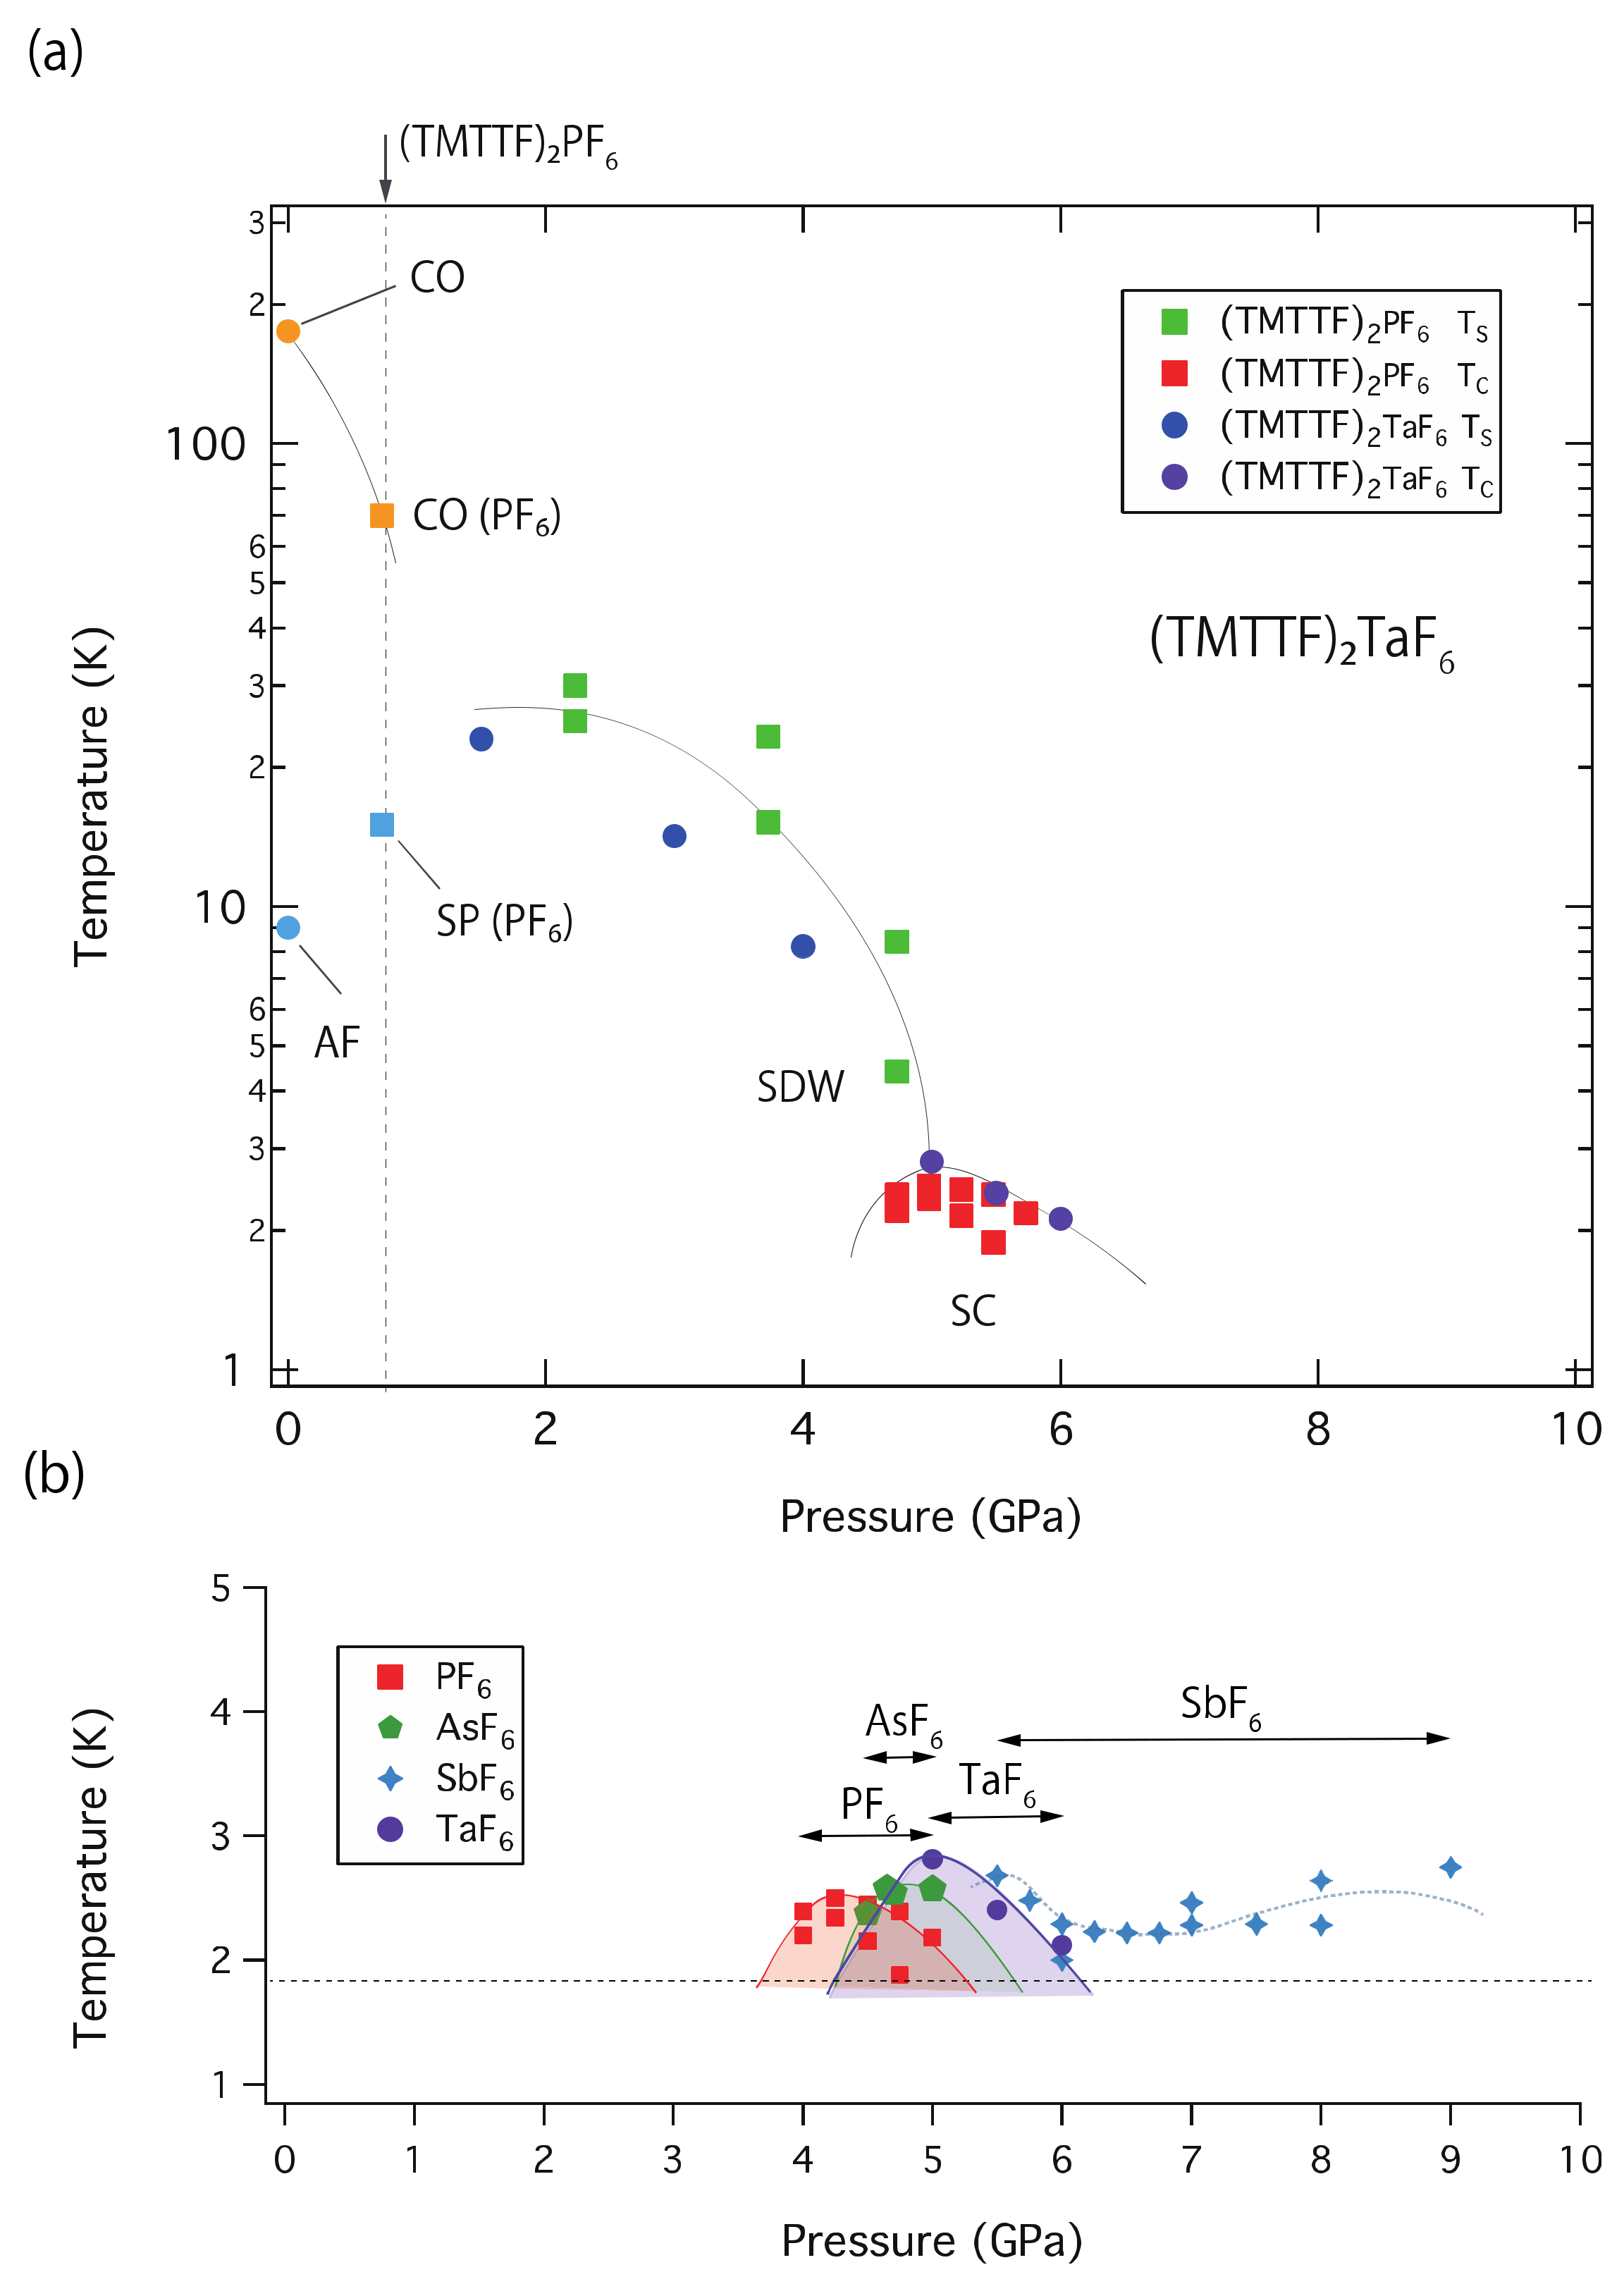
3. Results and Discussion
4. Conclusions
Author Contributions
Funding
Institutional Review Board Statement
Informed Consent Statement
Data Availability Statement
Acknowledgments
Conflicts of Interest
References
- Jérome, D. The Physics of Organic Superconductors. Science 1991, 252, 1509–1514. [Google Scholar] [CrossRef] [PubMed]
- Adachi, T.; Ojima, E.; Kato, K.; Kobayashi, H.; Miyazaki, T.; Tokumoto, M.; Kobayashi, A. Superconducting Transition of (TMTTF)2PF6 above 50 kbar [TMTTF = Tetramethyltetrathiafulvalene]. J. Am. Chem. Soc. 2000, 122, 3238–3239. [Google Scholar] [CrossRef]
- Jaccard, D.; Wilhelm, H.; Jérome, D.; Moser, J.; Carcel, C.; Fabre, J.M. From spin-Peierls to superconductivity: (TMTTF)2PF6 under high pressure. J. Phys. Condens. Matter 2001, 13, L89–L95. [Google Scholar] [CrossRef] [Green Version]
- Mori, H. Materials Viewpoint of Organic Superconductors. J. Phys. Soc. Jpn. 2006, 75, 051003. [Google Scholar] [CrossRef]
- Dressel, M. Spin-charge separation in quasi one-dimensional organic conductors. Naturwissenschaften 2003, 90, 337–344. [Google Scholar] [CrossRef] [Green Version]
- Ishiguro, T.; Yamaji, K.; Saito, G. Organic Superconductors, 2nd ed.; Fulde, P., Ed.; Springer Series in Solid-State Sciences 88; Springer: Berlin, Germany, 1998. [Google Scholar]
- Araki, C.; Itoi, M.; Hedo, M.; Uwatoko, Y.; Mori, H. Electrical Resistivity of (TMTTF)2PF6 under High Pressure. J. Phys. Soc. Jpn. 2007, 76, 198–199. [Google Scholar] [CrossRef]
- Itoi, M.; Kano, M.; Kurita, N.; Hedo, M.; Uwatoko, Y.; Nakamura, T. Pressure-Induced Superconductivity in the Quasi-One-Dimensional Organic Conductor (TMTTF)2AsF6. J. Phys. Soc. Jpn. 2007, 76, 053703. [Google Scholar] [CrossRef]
- Itoi, M.; Araki, C.; Hedo, M.; Uwatoko, Y.; Nakamura, T. Anomalously Wide Superconducting Phase of One-Dimensional Organic Conductor (TMTTF)2SbF6. J. Phys. Soc. Jpn. 2008, 77, 23701. [Google Scholar] [CrossRef]
- Kano, M.; Mori, H.; Matsubayashi, K.; Itoi, M.; Hedo, M.; Murphy, T.P.; Tozer, S.W.; Uwatoko, Y.; Nakamura, T. Anisotropy of Upper Critical Field in a One-Dimensional Organic System, (TMTTF)2PF6 under High Pressure. J. Phys. Soc. Jpn. 2012, 81, 024716. [Google Scholar] [CrossRef]
- Balicas, L.; Behnia, K.; Kang, W.; Auban-Senzier, P.; Canadell, E.; Jérome, D.; Ribault, M.; Fabre, J.-M. (TMTTF)2Br: The First Organic Superconductor in the (TMTTF)2X family. Adv. Mater. 1994, 6, 762–765. [Google Scholar] [CrossRef]
- Hisano, M.; Nakamura, T.; Takahashi, T.; Saito, G. SDW wave number and charge localization in (TMTTF)2Br: 1H-NMR investigation. Synth. Met. 1999, 103, 2195. [Google Scholar] [CrossRef]
- Hirose, S.; Liu, Y.; Kawamoto, A. 13C NMR study of commensurate antiferromagnetism in (TMTTF)2Br. Phys. Rev. B 2013, 88, 125121. [Google Scholar] [CrossRef] [Green Version]
- Asada, M.; Nakamura, T. Magnetic resonance investigation for a possible antiferromagnetic subphase in (TMTTF)2Br. Phys. Rev. B 2017, 96, 125120. [Google Scholar] [CrossRef]
- Ishikawa, A.; Matsunaga, N.; Nomura, K.; Sasaki, T.; Nakamura, T.; Takahashi, T.; Saito, G. Electron correlation and two dimensionality in the spin-density-wave phase of (TMTTF)2Br under pressure. Phys. Rev. B 2003, 67, 212404. [Google Scholar] [CrossRef] [Green Version]
- Lee, I.J.; Brown, S.E.; Naughton, M.J. Unconventional Superconductivity in a Quasi-One-Dimensional System (TMTSF)2X. J. Phys. Soc. Jpn. 2006, 75, 051011. [Google Scholar] [CrossRef]
- Yonezawa, S.; Kusaba, S.; Maeno, Y.; Auban-Senzier, P.; Pasquier, C.; Bechgaard, K.; Jérome, D. Anomalous In-Plane Anisotropy of the Onset of Superconductivity in (TMTSF)2ClO4. Phys. Rev. Lett. 2008, 100, 117002. [Google Scholar] [CrossRef] [Green Version]
- Pratt, F.L.; Lancaster, T.; Blundell, S.J.; Baines, C. Low-Field Superconducting Phase of (TMTSF)2ClO4. Phys. Rev. Lett. 2013, 110, 107005. [Google Scholar] [CrossRef] [Green Version]
- Nad, F.; Monceau, P. Dielectric Response of the Charge Ordered State in Quasi-One-Dimensional Organic Conductors. J. Phys. Soc. Jpn. 2006, 75, 051005. [Google Scholar] [CrossRef]
- Köhler, B.; Rose, E.; Dumm, M.; Untereiner, G.; Dressel, M. Comprehensive transport study of anisotropy and ordering phenomena in quasi-one-dimensional (TMTTF)2X salts (X = PF6, AsF6, SbF6, BF4, ClO4, ReO4). Phys. Rev. B 2011, 84, 035124. [Google Scholar] [CrossRef] [Green Version]
- Furukawa, K.; Sugiura, K.; Iwase, F.; Nakamura, T. Structural investigation of the spin-singlet phase in (TMTTF)2I. Phys. Rev. B 2011, 83, 184419. [Google Scholar] [CrossRef]
- Kitou, S.; Fujii, T.; Kawamoto, T.; Katayama, N.; Maki, S.; Nishibori, E.; Sugimoto, K.; Takata, M.; Nakamura, T.; Sawa, H. Successive Dimensional Transition in (TMTTF)2PF6 Revealed by Synchrotron X-ray Diffraction. Phys. Rev. Lett. 2017, 119, 065701. [Google Scholar] [CrossRef] [PubMed]
- Kitou, S.; Zhang, L.; Nakamura, T.; Sawa, H. Complex changes in structural parameters hidden in the universal phase diagram of the quasi-one-dimensional organic conductors (TMTTF)2X (X = NbF6, AsF6, PF6, and Br). Phys. Rev. B 2021, 103, 184112. [Google Scholar] [CrossRef]
- Nakamura, T. Possible Charge Ordering Patterns of the Paramagnetic Insulating States in (TMTTF)2X. J. Phys. Soc. Jpn. 2003, 72, 213–216. [Google Scholar] [CrossRef]
- Yoshimi, K.; Seo, H.; Ishibashi, S.; Brown, S.E. Tuning the Magnetic Dimensionality by Charge Ordering in the Molecular TMTTF Salts. Phys. Rev. Lett. 2012, 108, 096402. [Google Scholar] [CrossRef] [Green Version]
- Yu, W.; Zhang, F.; Zamborszky, F.; Alavi, B.; Baur, A.; Merlic, C.A.; Brown, S.E. Electron-lattice coupling and broken symmetries of the molecular salt (TMTTF)2SbF6. Phys. Rev. B 2004, 70, 121101. [Google Scholar] [CrossRef] [Green Version]
- Iwase, F.; Sugiura, K.; Furukawa, K.; Nakamura, T. 13C NMR study of the magnetic properties of the quasi-one-dimensional conductor (TMTTF)2SbF. Phys. Rev. B 2011, 84, 115140. [Google Scholar] [CrossRef] [Green Version]
- Iwase, F.; Sugiura, K.; Furukawa, K.; Nakamura, T. Electronic Properties of a TMTTF-Family Salt, (TMTTF)2TaF6: New Member Located on the Modified Generalized Phase-Diagram. J. Phys. Soc. Jpn. 2009, 78, 104717. [Google Scholar] [CrossRef]
- Dumm, M.; Loidl, A.; Fravel, B.W.; Starkey, K.P.; Montgomery, L.K.; Dressel, M. Electron spin resonance studies on the organic linear-chain compounds (TMTCF)2X (C = S, Se; X = PF6, AsF6, ClO4, Br). Phys. Rev. B 2000, 61, 511–521. [Google Scholar] [CrossRef]
- Rösslhuber, R.; Rose, E.; Ivek, T.; Pustogow, A.; Breier, T.; Geiger, M.; Schrem, K.; Untereiner, G.; Dressel, M. Structural and Electronic Properties of (TMTTF)2X Salts with Tetrahedral Anions. Crystals 2018, 8, 121. [Google Scholar] [CrossRef] [Green Version]
- Dressel, M.; Dumm, M.; Knoblauch, T.; Masino, M. Comprehensive Optical Investigations of Charge Order in Organic Chain Compounds (TMTTF)2X. Crystals 2012, 2, 528–578. [Google Scholar] [CrossRef] [Green Version]
- Oka, Y.; Matsunaga, N.; Nomura, K.; Kawamoto, A.; Yamamoto, K.; Yakushi, K. Charge Order in (TMTTF)2TaF6 by Infrared Spectroscopy. J. Phys. Soc. Jpn. 2015, 84, 114709. [Google Scholar] [CrossRef]
- Pustogow, A.; Dizdarevic, D.; Erfort, S.; Iakutkina, O.; Merkl, V.; Untereiner, G.; Dressel, M. Tuning Charge Order in (TMTTF)2X by Partial Anion Substitution. Crystals 2021, 11, 1545. [Google Scholar] [CrossRef]
- Nakamura, T.; Maeda, K. Competition electronic states of (TMTTF)2MF6: ESR investigations. J. Phys. IV Fr. 2004, 114, 123–124. [Google Scholar] [CrossRef]
- Voloshenko, I.; Herter, M.; Beyer, R.; Pustogow, A.; Dressel, M. Pressure-dependent optical investigations of Fabre salts in the charge-ordered state. J. Phys. Condens. Matter 2017, 29, 115601. [Google Scholar] [CrossRef] [PubMed]
- Rose, E.; Loose, C.; Kortus, J.; Pashkin, A.; Kuntscher, C.A.; Ebbinghaus, S.G.; Hanfland, M.; Lissner, F.; Schleid, T.; Dressel, M. Pressure-dependent structural and electronic properties of quasi-one-dimensional (TMTTF)2PF6. J. Phys. Condens. Matter. 2013, 25, 014006. [Google Scholar] [CrossRef] [PubMed]
- Jacko, A.C.; Feldner, H.; Rose, E.; Lissner, F.; Dressel, M.; Valentí, R.; Jeschke, H.O. Electronic properties of Fabre charge-transfer salts under various temperature and pressure conditions. Phys. Rev. B 2013, 87, 155139. [Google Scholar] [CrossRef] [Green Version]
- Pashkin, A.; Dressel, M.; Ebbinghaus, S.G.; Hanfland, M.; Kuntscher, C.A. Pressure-induced structural phase transition in the Bechgaard-Fabre salts. Synth. Met. 2009, 159, 2097–2100. [Google Scholar] [CrossRef]


| (TMTTF)2X | TCO | Activation Energy 3 GPa Δs [K] | Lattice Parameter a* [Å] | V [Å3] at Room Temperature * | Superconducting Temperature TC [K] | Pressure at Maximum TC [K] (Pressure Region for SC Phase) ** | TSP [K] | TAF [K] |
|---|---|---|---|---|---|---|---|---|
| PF6 | 70 | 16 | 7.172(11) | 676.6 | 2.5 | 4.3 (4.0 ≤ P ≤ 5.0 GPa) | 15 | |
| AsF6 | 102 | 17 | 7.1662(4) | 686.15 | 2.6 | 5.0 (4.5 ≤ P ≤ 5.0 GPa) | 14 | |
| SbF6 | 154 | 57 | 7.1796(11) | 702.93 | 2.8 | 6.0, 9.0 (5.4 ≤ P ≤ 9.0 GPa) | 8 | |
| TaF6 | 175 | 22 | 7.1862(11) | 706.52 | 2.8 | 5.0 (5.0 ≤ P ≤ 6.0 GPa) | 9 |
Publisher’s Note: MDPI stays neutral with regard to jurisdictional claims in published maps and institutional affiliations. |
© 2022 by the authors. Licensee MDPI, Basel, Switzerland. This article is an open access article distributed under the terms and conditions of the Creative Commons Attribution (CC BY) license (https://creativecommons.org/licenses/by/4.0/).
Share and Cite
Itoi, M.; Nakamura, T.; Uwatoko, Y. Pressure-Induced Superconductivity of the Quasi-One-Dimensional Organic Conductor (TMTTF)2TaF6. Materials 2022, 15, 4638. https://doi.org/10.3390/ma15134638
Itoi M, Nakamura T, Uwatoko Y. Pressure-Induced Superconductivity of the Quasi-One-Dimensional Organic Conductor (TMTTF)2TaF6. Materials. 2022; 15(13):4638. https://doi.org/10.3390/ma15134638
Chicago/Turabian StyleItoi, Miho, Toshikazu Nakamura, and Yoshiya Uwatoko. 2022. "Pressure-Induced Superconductivity of the Quasi-One-Dimensional Organic Conductor (TMTTF)2TaF6" Materials 15, no. 13: 4638. https://doi.org/10.3390/ma15134638
APA StyleItoi, M., Nakamura, T., & Uwatoko, Y. (2022). Pressure-Induced Superconductivity of the Quasi-One-Dimensional Organic Conductor (TMTTF)2TaF6. Materials, 15(13), 4638. https://doi.org/10.3390/ma15134638