Abstract
The evaluation of the shear capacity of an FRP-strengthened reinforced-concrete beam is challenging due to the complex interaction between different contributions provided by the concrete, steel stirrup and FRP reinforcement. The shape of the beam and the FRP inclination can have paramount importance that is not often recognized by the models that are suggested by codes. The interaction among different resisting mechanisms has a significant effect on the shear capacity of beams, since it can cause a reduction in the efficiency of some resisting mechanisms. A comparative study of the performance in the shear resistance assessment provided by three models with six different effectiveness factors (R) is performed, considering different cross-section shapes, FRP wrapping schemes, inclination and anchorage systems. The results revealed that the cross-section shape, the FRP inclination and the efficiency of the FRP anchorages have a significant effect on the shear strength of beams. The analysis results show that the three models are able to provide an accurate average estimation of shear strength (but with a coefficient of variation up to 0.35) when FRP reinforcement orthogonal to the beam axis is considered, while a significant underestimation (up to 19%) affected the results for inclined FRP reinforcement. Moreover, all the models underestimated the resistance of beams with a T section.
1. Introduction
Shear failure in RC members is one of the most critical and undesired failure phenomena. Beams and columns of existing RC Moment Resisting Frames (MRFs) usually do not satisfy the current code requirements regarding shear strength; thus, often it becomes necessary to strengthen the existing RC structural member in order to protect it from unwanted shear failure [1,2].
Over the last two decades, innovative strengthening techniques such as the use of externally bonded (EB) or near-surface-mounted (NSM) fiber-reinforced polymer (FRP) and externally bonded fiber-reinforced cementitious matrix (FRCM) have been widely used in the axial and shear strengthening of RC members [3,4].
Yet, it is quite difficult to accurately design a strengthening intervention of RC members by means of externally bonded FRP because member strength evaluation is still a topic of debate [5,6]. Many experiments confirm that the shear failure of FRP-strengthened beams usually occurs due to debonding of the FRP [7,8], but different failure modes can occur in a strengthened RC member due to the very presence of the FRP, which is affected by brittle failure [9].
The shear strength evaluation of FRP-reinforced RC beams is also quite complex due to the presence and interaction of the three main contributors, i.e., concrete, externally bonded FRP and transverse steel reinforcement. Experimental results have proved that the presence of FRP modifies the shear contributions provided by concrete and transverse steel reinforcement [10].
In this connection, the brittle failure of FRP reinforcement, which can occur before the yielding of steel stirrups, can have a negative effect on the shear strength provided by the transverse steel reinforcement [11,12]. Some researchers have proved that, when members having a significant amount of steel stirrups have to be strengthened, the transverse reinforcement provides a greater contribution than the FRP because the bond between the steel and concrete is stronger than between the FRP and the concrete surface [13]. However, experiments have also revealed that sometimes the efficiency of transverse reinforcement decreases with the presence of FRP due to brittle failure of the latter, which hinders the yielding of all the steel stirrups intersected by the shear-critical crack, as well as limits the strain achieved by the stirrups at failure [12,13].
The shear contribution provided by the FRP depends on the strengthening scheme. It can be done in different ways: (1) complete wrapping (C) of the member; (2) partial wrapping (U-shape); (3) side wrapping [14]. U-shape and side wrapping are more prone to debonding failure, while there are negligible chances of debonding failure for completely shaped wrapping. The side-wrapping scheme is not considered here because it does not provide a significant increment in the shear capacity of FRP-strengthened RC beams. To avoid debonding failure, a proper anchorage length or proper mechanical connector that prevents debonding between the FRP and the concrete surface should be provided [15].
In the case of the U-shaped scheme, several researchers have introduced different types of anchorages for FRP which have proved to be effective in increasing the shear contribution of the FRP [12,16]. However, their effectiveness is significantly variable due to different arrangements and other technological issues.
Two different approaches are pursued by codes for the shear resistance evaluation of strengthened members. According to a first group of international codes (CSA 2006 [17], ACI 440.2R/17 [18]), the strength of the RC beam reinforced by FRP is evaluated by an additive method. The overall shear resistance of the RC beam is considered as the sum of Vc (shear resistance of concrete), Vs (shear resistance of steel stirrups) and Vf (shear resistance provided by FRP). Regarding the last two contributions, each of them is evaluated by separately taking into account the orientation of each reinforcement, namely (β) for the FRP and (α) for the transverse reinforcement.
By contrast, according to the European approach, the contributions of all the components are considered using the truss mechanism with variable inclination of the concrete strut. Thus, the inclination angles of the FRP (β) and transverse reinforcement (α) are parameters of paramount importance, since they affect the shear strength and contribution of all three of the components discussed above.
Colajanni et al. [19] analyzed a large database comparing the experimental shear and the analytically calculated shear strength of different models. It was found that the angle of inclination of the FRP has a significant effect on the shear strength of RC beams. Moreover, by changing the inclination angle of the FRP with respect to the beam axis, there is a significant change in the interaction between the Vf and Vs.
Oller et al. [20] found that there is some difference between the sum of Vf, Vs, and Vc and the total shear force. The experimental results show that there is a significant contribution of the flange to the shear strength in the case of T-cross-sectional members. In some cases, it was found to be up to 45% of the total shear strength. None of the code models recognizes the effect of the flange in a T cross section as relevant in modifying member shear resistance.
However, despite the presence of such a complex framework, it is unanimously recognized that among the factors affecting the estimation of shear strength, the effective strain of the FRP, expressed through the reduction factor R, plays a predominant role.
In the light of the foregoing discussion, three main models for an RC shear critical beam strengthened with FRP are considered in this research: the model of Colajanni et al. [19], ACI 440.2R-17 [18] and CNR-DT-200/R1 [21]. Each model is analyzed with six different formulations that incorporate the effective FRP strain (R factor). Two of the approaches, namely (1: Khalifa and Nanni (2000, 2002), Pellegrino Modena (2006), and 2: Chen and Teng (2003)) [7,22,23,24,25] are adopted in the Colajanni et al. model, which also considers the reduction factor for steel stirrups [19].
These models are well suited for rectangular RC beams, but the effectiveness in calculating the shear strength of T sections is still a matter of discussion, since the effect of the contribution of flanges is not incorporated in all of them.
To fully understand the effect of a cross-section shape and the influence of the inclination angle of FRP on the shear resistance of the strengthened beam, experimental results on strengthened beam specimens with different section shapes or FRP inclination angles and equal values of the other geometrical and mechanical parameters should be available. Failing these, the influence can be indirectly detected by the variation in the ability of the different analytical models to predict the experimental results.
To this aim, a large database was collected, considering rectangular and T sections, with vertical and inclined FRP, also including specimens characterized by mechanical anchorages between FRP and the RC beam. The experimental values were compared with the shear-strength values obtained from the three above-mentioned models [18,19,21]. The results are discussed focusing on the influence of the cross-section shape and the FRP angle of inclination on both the shear strength of the specimen and the reliability of the shear models, also considering the effect of the various effectiveness-factor models for FRP.
Two different analyzing approaches were adopted. The first approach was to cover the influence of the cross-section shape on the shear strength of the beam externally bonded by FRP. Then a comparison was made between the assessment of the shear strength of R and the T-cross-sectional members with the FRP and steel web reinforcement having the same inclination (α = β) by means of a fixed model. To cover the influence of FRP inclination, a comparison was made between the same shape but with different inclinations (α ≠ β), again by means of a fixed model.
2. Shear Models
Three different models—ACI 440.2R-17 [18], CNR-DT-200/R1 [21] and Colajanni et al. [19]—are reported and discussed below. The code models are reported hereinafter as presented in their original form. It has to be stressed that in the shear prediction discussed in Section 6, neither the safety factors for the FRP reinforcement, steel stirrups and concrete were considered, nor the strength-reduction factor φ.
2.1. ACI 440.2R-17
ACI 440.2R-17 [18] gives guidelines for the design and evaluation of the shear strength for an RC beam strengthened with externally bonded FRP based on an additive approach.
ACI 318-14 (ACI 2014) [26] is used for the evaluation of concrete (Vc), steel stirrup (Vs) and FRP (Vf) contributions. According to the symbol notation in Figure 1 and Abbreviations, Vc (nominal shear strength provided by shear reinforcement) is calculated as:
while Vs (nominal shear strength provided by shear reinforcement) is calculated as:
and the shear strength provided by the FRP is calculated as:
Vc = 0.167 f′c0.5 bw d
Vs = (Av fyt d)/s
Vf = (Afv dfv ffe (sin β + cos β))/sf
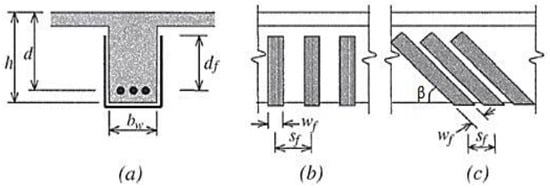
Figure 1.
Variables used in the ACI 440.2R model for shear-strengthening calculations (a) cross-sectional parameters (b) spacing and width of FRP (c) inclination angle between FRP strip and beam axis.
In the Vf equation, Afv = 2ntfwf, ffe = εfe Ef and different safety factors are used for different wrapping schemes. The shear strength of the retrofitted RC beam is equal to:
φV = φ (Vc + Vs + ψf Vf)
For the completely wrapped scheme, ψf = 0.95 while for other schemes ψf = 0.85, while φ is a strength-reduction factor. The effective strain of the FRP (ɛfe) is calculated based on the different configurations. It should not be more than 0.75 of the ultimate strain εfu, while for the design it should be limited to 4 × 10⁻³. The FRP effective depth is considered as the distance between the centroid of tensile reinforcement and the top free edge of the FRP. It must be stressed that the ACI model takes into account the actual height of the FRP reinforcement by the parameter dfv (Figure 1).
To obtain the effective strain εfe of partly wrapped sections, the ultimate strain of the FRP is multiplied by a bond-reduction factor kv, as εfe = kv ɛfu ≤ 4 × 10⁻³. kv can be calculated as kv = k1k2Le/(11,900ɛfu) ≤ 0.75, where the modification factors k1 and k2 can be calculated by using k1 = (f′c/27)2/3 and k2 = (dfv − γLe)/dfv (γ = 1 for the U-wrapped scheme and γ = 2 when both sides are wrapped), where the effective length is Le = 23,300/ (Ef tf)0.58.
2.2. CNR Model
The CNR-DT 200 R1/2013 [21] is the model established by the Italian Research Council (CNR) and it deals with two types of wrapping: U-shaped and full. The equations given are the extension of the equations provided in EN1992-1-1 [27] to evaluate the shear strength of reinforced-concrete beams. The model is derived according to the truss mechanism with variable inclination of the concrete strut, in which the shear capacity of the FRP is calculated using:
VRd,f = (1/γRd) 0.9 d ffed 2 tf (cot θ + cot β) (bf/pf)sin2 β
Equation (5) is reported and used consistently with the equation reported in the new version of the CNR-DT code for strengthening by fiber/fabric-reinforced cementitious matrix/mortar [28].
In this equation, f = f sin β represents the spacing of the FRP measured perpendicular to the direction of fiber. The shear capacity of the stirrup and concrete strut is given as:
VRd,s = 0.9 d (Asw/s) fywd (cot θ + cot α) sin α
VRd,c = 0.9 d b αc 0.5 fcd (cot α + cot θ)/(1 + cot2 θ)
In Equation (7), αc = 1 has to be retained for the beam, and the angle ψ, yet to be determined, can be introduced by replacing the angle α listed in the code, in order to stress that the evaluation of the shear strength of the compressed concrete strut is not a trivial issue, as will be shown below. The strengthened member shear resistance is computed as:
VRd = min (VRd,s + VRd,f, VRd,c)
In evaluating the shear strength in a beam with FRP reinforcement inclined with an angle β ≠ α, the CNR-DT 200 R1/2013 model assumes ψ = β, taking into account in the truss scheme the inclination of the FRP reinforcement (β) only. Thus, in evaluating the strength of the compressed concrete strut, the model neglects the presence of two orders of web reinforcements and the amount of their contributions.
In this regard in [19], it is shown that in a beam which is to be shear-strengthened in which the existing shear reinforcement provides a significant contribution to the shear strength as the FRP, the angle of inclination of the concrete strut should be evaluated assuming ψ as a weighted value between α and β, where VRd,s and VRd,f are the weights.
2.3. Colajanni et al. Model
Colajanni et al. [19] proposed a model with variable inclination of the compressed concrete action based on stress field theory. It was derived on the basis of a previous model for a concrete beam reinforced by stirrups with two different inclinations [29]. In the same paper, it was validated against experimental results on ordinary RC beams and hybrid steel-trussed concrete beams (HSTCBs) [30].
This model is able to correctly represent the shear strength of FRP-strengthened RC beams with shear reinforcement arranged in any direction. In order to evaluate the shear strength of the member, three different segments of beams are selected based on the stress field direction. They are obtained by sections parallel to the stress field of the FRP, concrete strut and steel stirrups which are demonstrated in Figure 2. The shear strength is calculated using three different equations by evaluating the vertical equilibrium of each beam segment:
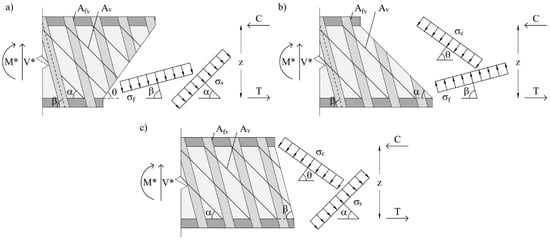
Figure 2.
Beam segments identified via three sections parallel to stress field directions of (a) concrete strut; (b) steel stirrups; (c) FRP reinforcement. M* and V* represent the moment and shear acting on the considered section.
In the equations above, f = σf/ffu, and s = σs/fyt are the non-dimensional stresses of the FRP reinforcement and steel stirrups, respectively. R is the coefficient for effective strain and stress for the FRP at failure, where the effective stress is ffe = ffu R = Ef ɛfe and the effective strain is ɛfe = ɛfu R; ffu is the ultimate stress of the fiber; r is the efficiency coefficient for the steel stirrups, which considers the efficiency of the steel stirrups involved by the shear-critical crack; β represents the angle of the FRP and α represents the angle of the shear reinforcement with the beam axis.
The static theorem of plasticity is used to evaluate the shear strength of RC beam. It means that the shear strength is the maximum value among solutions, and it should satisfy all the equations including the plastic admissibility equations given below:
By combining (9), (10) and (12), Equation (13) is obtained. It shows the relation between the FRP, the transverse steel reinforcement and the stress field of the concrete strut.
According to the code’s suggestion, the lower limit of cot θ = 1.0, and the upper limit of cot θ = 2.5 hold. Based on this limitation of inclination of the concrete strut, the shear strength can be evaluated in two steps: (1) Initially, it is assumed that at the failure phase all the three stress fields could reach their stress limit simultaneously. Hence, using the inequality given in Equation (13), the inclination of the concrete strut can be evaluated as:
Step 2: three different cases can occur, depending on the amount of steel or FRP shear reinforcement mechanical ratio ωsw and ωfw, respectively.
cot θ = ((R Afv ffu/(bw sf 0.5 fc) sin β + r Av fyt/(bw s 0.5 fc) sin α)−1 – 1)1/2
Case 1 (small ωsw and ωfw values):
cot θ > 2.5: It implies that cot θ = 2.5 must be assumed, and the concrete strut does not fail due to the presence of a small amount of shear reinforcement. So, the shear strength is calculated using Equation (9), in which f = s =1, while the stresses on the concrete strut can be obtained by using Equation (13).
Case 2 (intermediate ωsw and ωfw values):
1 ≤ cot θ ≤ 2.5: It implies that all the stress fields simultaneously achieve their stress limit. Equation (9) is thus used to find the shear strength considering f = s = c = 1.
Case 3 (very large ωsw and ωfw values):
cot θ < 1: It implies that cot θ = 1.0 must be assumed, and the failure is due to reaching the stress limit in the concrete strut and in one of the shear reinforcements. If it is assumed that β < α, then the maximum shear strength of the beam is given by the minimum value obtained via Equation (10) assuming that the FRP reinforcement attains the maximum effective strain in tension f = 1 or by Equation (11), considering that the yielding in the steel stirrups is attained, having s = 1. In Appendix B, the above three different cases are elucidated by calculation examples.
3. Reduction Factors for Steel Stirrups “r”
Different research has revealed that the simultaneous presence of FRP and steel stirrups decreases the contribution to the shear strength provided by shear reinforcement. It was also found that the increase in the axial rigidity ratio between the steel and FRP causes a reduction in the shear contribution provided by the externally bonded FRP [12,13,31,32,33].
Due to this interaction, some models were developed; the one proposed by Modifi and Chaallal [34] considers the interaction between the two reinforcement systems and their rigidities, while the model developed by Pellegrino and Modena [32] assumes a fixed reduction coefficient.
In order to model the interaction between the FRP and steel stirrup, Colajanni et al. [19] also included a similar factor in their model, which is able to take into account the possible different inclinations of the FRP and the pre-existing steel web reinforcement. “r” is defined as a bilinear expression that links the reduction in the contribution to the shear strength provided by transverse reinforcement to the ratio between the FRP effective strain in the direction of the steel reinforcement ɛfe,s = ɛfe cos(α − β) and the yield strain of the steel stirrup (ɛsyw). If ɛfe,s/ɛsyw ≤ 1.33, then r = 0.75 ɛfe,s/ɛsyw, otherwise it is considered as r = 1.
4. Effectiveness Factor “R”
The failure of a shear-strengthened RC beam with externally bonded FRP is due to several factors, including peeling of the concrete cover, failure of the FRP, debonding of the FRP from the concrete surface, the loss of aggregate interlock, etc. Most of these phenomena precede attainment of the ultimate strain in the FRP. Thus, in order to limit the contribution of the FRP reinforcement, the effectiveness factor “R” is applied to the ultimate strain of the FRP fiber, which reduces the ultimate FRP tensile stresses.
To evaluate shear strength, six different effectiveness factors “R” were used. All of these have different approaches to deal with the strengthening of FRP. The first two R factors were used in [19]; the first was derived according to Khalifa and Nanni and Pellegrino and Modena [22,23,24]. The effectiveness factor is taken as the minimum among the four coefficients (R1, R2, R3, R4), which represent different modes of failure. R1 considers the tensile failure of the FRP, while R2 and R3 represent the debonding phenomenon and failure of the FRP due to shear crack width, respectively. Lastly, R4 considers failure due to peeling of the concrete cover.
R1 = 0.56(ρf Ef)2 − 1.22(ρf Ef) + 0.78
R2 = [(fck)2/3(dfv − ηLe) [738.93 − 4.06(Ef tf)]]/εfudfv106
R3 = 6 × 10⁻³/εfu
R4 = (2fctAccos2βbc,v)/(nf tf Lf Ef [(hf − Le)/(hf)]bf εfu)
The second R factor was proposed by Chen and Teng [7]. It is the minimum between two factors (R5 and R6). One represents the tensile rupture of the FRP across the crack, and the other represents the debonding failure of the FRP due to insufficient bond length.
R5 = (1 + (d − dfv)/z)/2
For λ < 1 (λ = Lmax/Le)
R6 = (σf,max/Ef εfu) × (2/π λ × ((1−cos π λ/2)/(sin π λ /2)))
For λ ≥ 1
R6 = (σf,max/Ef εfu) × (1 − (π−2)/π λ)
The definition of the other four effectiveness factors can be found in ACI [18], CNR [21] fib [35] and Mofidi and Challal (M&C) [36].
5. Description of Data Sets and Analysis Steps
To cover the main aspects of the research (influence of cross-section shape and angle of FRP inclination), two data sets and two comparison approaches were adopted which are explained in Figure 3. The beams included in the database have effective depths of the cross section in the range of 155 mm and 831 mm, while the shear span ranges between 2.3 m and 3.8 m. The transverse internal steel reinforcement is constituted by vertical steel stirrups whose maximum geometrical ratio is 0.48%.
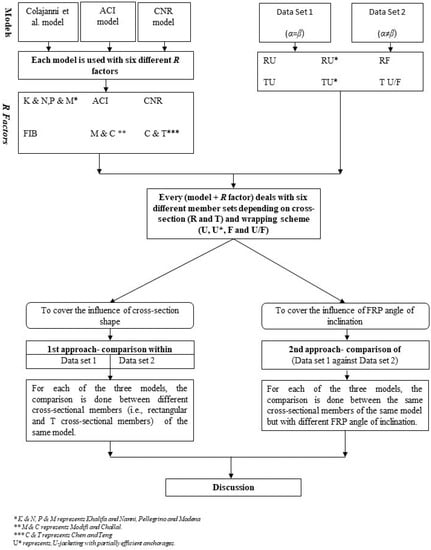
Figure 3.
Flow chart representing data-analysis methodology.
The FRP reinforcement geometrical ratio varies between 0.04% and 3.00%. The ultimate FRP tensile strength ranges between 106 and 4361 MPa, while the Young’s modulus varies between 8 and 640 GPa. In order to stress the influence of the FRP inclination (β), two data sets were analyzed, namely Data Set 1 (DS1) with α = β and Data Set 2 (DS2) with α ≠ β, where α is the inclination of the steel reinforcement with the beam axis while β represents the angle of the FRP with the beam axis.
Both data sets contain results regarding R and T members with different wrapping schemes. On the basis of the wrapping scheme, rectangular RC beams are divided into three subsets, namely RF, RU and RU*. The first subset F represents full/complete wrapping, the U represents U-jacketing without anchorages, and U* represents U-jacketing with partially efficient anchorages. Analogously, T beams are divided into TU, TU* and TU/F, the latter representing U-jacketing with fully efficient anchorages.
It is pointed out that, for the U*-wrapping scheme, the shear strength was assessed as if the beam was strengthened by ordinary U-jacketing, since the increase in shear capacity provided by partially efficient anchors cannot be assessed. Moreover, in the case of U/F, the beams were considered as strengthened by complete wrapping (as done in [20]).
In (DS1), where α = β, there are 40 rectangular beams with U-shaped wrapping, 7 reinforced-concrete beams with partially efficient anchorages (U*), and 10 beams with the complete/full wrapping scheme. Similarly, there are 52 T reinforced beams with U-wrapping, 18 T beams with U*-wrapping, and 11 TU/F beams with fully efficient anchorage.
In (DS2), where α ≠ β, there are 10 rectangular beams with U-wrapping, 7 rectangular reinforced-concrete beams RU* with partially efficient anchorages and 1 rectangular beam with complete wrapping. In DS2, for T beams there are two beams with U-wrapping, while for TU* and T U/F no experimental shear values are available.
During the analysis, vexp of the data sets was used. vthe is the analytical assessment of dimensionless shear, which for each model was calculated using all six different R-factor models, while vexp is the experimental value which can be expressed as vexp = Vexp/(bw 0.9d 0.5 fc). τavg is the average value of the ratio τavg = Vexp/Vthe.
The following steps are performed in the analysis:
- Colajanni et al. Model [19], ACI model [18] and CNR model [21] are used for the analysis with six different R factors.
- Every model + R factor deals with six different member sets, which differ in the type of cross section (R and T) and wrapping scheme (U, U*, F and U/F).
- For each data set, the results provided by the Colajanni et al. model with the six different formulations of the R effectiveness factor are discussed.
- For each of the three models: in the first approach, to cover the influence of the cross-section shape, a comparison is made between the R and T sections (i.e., between RU and TU, between RU* and TU*, between RF and TU/F within Data Set 1 and within Data Set 2).
- For each of the three models: in the second approach, to recognize the influence of the FRP inclination angle, a comparison is made of Data Set 1 against Data Set 2 for the effectiveness of each model in the strength assessment of members having the same cross-section shape but with different inclination angles (i.e., RU of DS1 and RU of DS2, RU*of DS1 and RU* of DS2, RF of DS1 and RF of DS2).
6. Results and Discussion
Different effectiveness factors (R) are used in the model proposed by Colajanni et al. [19] and their efficiency is compared in order to determine the influence of the effectiveness factor on the shear capacity assessment. To evaluate the reliability and efficiency of the model, the average ratio τAvg = Vexp/Vthe and its CoV are analyzed. In the reliability assessment, R as proposed by ACI [18], CNR [21], fib [35] and Mofidi and Challaal [36] (M&C) is used in its original form, considering the steel-stirrup reduction factor equal to r = 1, as well as two R-factor models proposed in Colajanni et al. [19] including the steel-stirrup reduction factor.
In Table 1, the results for the whole database reported in Table A1 of Appendix A are summarized, proving that the R factor has a major effect on evaluating the shear strength of strengthened beams. By using the effectiveness factor proposed by CNR or ACI, the best average values (mean efficiency ratio τavg = 0.97) were obtained, while the worst results were obtained in the case of using the R factor of fib.

Table 1.
Evaluation of combined results of Data Set 1 and Data Set 2 using the Colajanni et al. model with different R factors.
The M&C model yielded a 12% underestimation of the average shear strength. The effectiveness factors of Khalifa and Nanni + Pellegrino and Modena, and Chen and Teng yielded better results as compared to fib but with a slight overestimation of the shear strength. A coefficient of variation parameter was also used to analyze the results. From the results, it is seen that the highest scattering of data was observed in the case of R as given by the ACI model with (CoV = 0.32) while it is concluded that the highest accuracy and reliability was obtained in the case of the Chen and Teng R-factor model, since it provides the smallest CoV (0.20) with a τavg = 0.95, very close to the best ones.
A more effective analysis can be performed if the whole database is split into two subsets, according to the values of the inclination of the steel (α) and FRP (β) web reinforcement. From Figure 4, it can be seen that, for α = β, similarly as for the whole database, a very accurate estimation of the shear strength was achieved by using the R factor of ACI and CNR, while the worst results were obtained in the case of using the effectiveness factor of fib and M&C. The R-factor model proposed by Chen and Teng slightly (4%) overestimated the shear strength, but less scattering was observed as (CoV = 0.20).
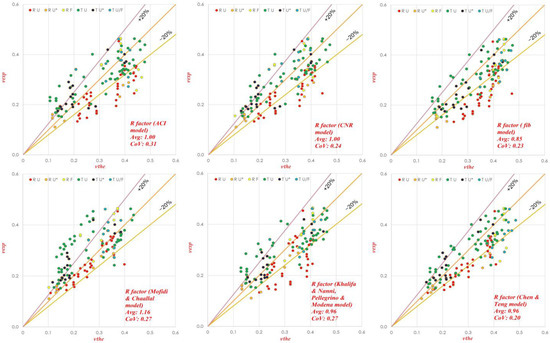
Figure 4.
Experimental vs. theoretical shear strength for the Colajanni et al. model with six different R factors. (Data Set 1, α = β). RU* and TU* represents Rectangular and T beam having U-jacketing with partially efficient anchorages.
By contrast, from Figure 5, where α ≠ β, it can be seen that a large over estimation of shear strength was found for all the models; the largest one (τavg = 0.61) as well as the largest scattering of data was observed when the R factor proposed by the fib model was used. Similar results can be observed in the case of α = β.
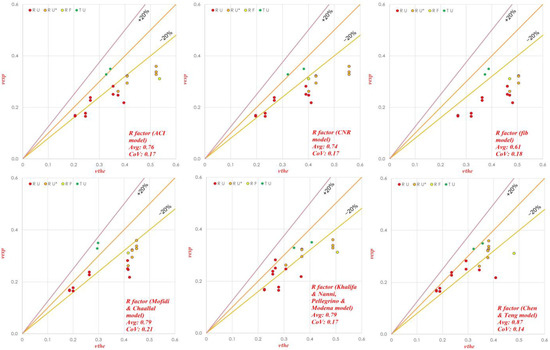
Figure 5.
Shear strength calculation (experimental vs. theoretical) for the Colajanni et al. model with six different R factors. (For Data Set 2, α ≠ β). RU* represents Rectangular while TU* represents T beam having U-jacketing with partially efficient anchorages.
The highest accuracy among the others with less overestimation and scattering (τavg = 0.87, CoV = 0.14) was observed for the effectiveness factor proposed by Chen and Teng. This unfavorable large overestimation was less marked in the models with the effectiveness factors of Khalifa and Nanni + Pellegrino and Modena, or Chen and Teng because of the introduction of the “r” factor. In Table 2, the results are further subdivided into the two databases described in Section 6.1, Section 6.2 and Section 6.3.
Table 2.
Results of calculation on the basis of the 1st and 2nd approaches from Database 1 and Database 2.
6.1. Conclusion Based on 1st Approach for DS1 (α = β)
The results were compared by taking the average value provided by the six different R-factor models, divided on the basis of section shape and efficiency of the anchorage. In the Colajanni et al. model, the results in the case of RU revealed that there was an overestimation of the shear strength on average of about 19%, while in the TU scheme, the shear strength on average was underestimated by about 9%. The first lack of accuracy, namely the overestimation of the rectangular sections, can be attributed to the inefficiency of the model in taking into account the reduced length of the FRP fiber, which in many specimens did not reach the top end of the beam. For T beams, the overestimation was mitigated by the presence of the shear contribution provided by the flange; this contribution produced a significant increment in the strength of the tested specimens that was not predicted by the model.
In the case of RU* and TU*, there was the same trend as for RU and TU. There was almost a 13% overestimation on average in the case of RU* and 11% in the case of TU*. There was less of a dispersion of the data observed for TU* with an average CoV of 0.18.
In the case of fully wrapped rectangular or equivalent fully wrapped T sections, namely RF and TU/F, the average values were almost the same, and τavg was close to unity. This is due to the fact that for RF and TU/F, some approaches underestimated while others overestimated the shear strength. It was observed that overall, more accurate estimation of the shear strength was obtained for RF and TU/F as compared to the previous comparisons, with less dispersion. This is due to the fact that the effective fiber strength of the completely wrapped sections was more accurately estimated than that of the partially wrapped ones, and possibly the partial ineffectiveness of the anchorage in the TU/F section was compensated by the flange contribution.
Overall, the Colajanni et al. model slightly overestimated the shear strength for R-cross-sectional members while it underestimated it for T-cross-sectional members, but generally speaking, the underestimation in the case of the T members was less as compared to the overestimation of the R members.
The ACI model predicted the results very accurately in the case of both RU- and TU-cross-sectional members. Just a 1% overestimation was observed in the case of the RU cross sections while a 3% overestimation was observed in the case of the TU members, which reveals that this model is less sensitive to the contribution of flanges. More accurate results were obtained by the C&T R-factor model with CoV = 0.14 for R members and CoV = 0.19 for T members.
In the case of RU* there was less of a dispersion of the data (Avg value of the CoV = 0.08) while for TU* there was more of a dispersion of the data (CoV = 0.23). A 13% overestimation was observed in the case of RU* and a 6% underestimation for TU*.
In general, less accurate results were observed in the case of TU/F (Avg CoV= 0.33) due to the flange effect. Additionally, it was observed that the ACI model yielded better results in the case of the R member than the T-cross-sectional ones. When α = β, the CNR model yielded the same results as the Colajanni et al. model when the same value of R was used, and it also performed well enough in the prediction of the average shear strength of RF and TU/F.
6.2. Conclusion Based on First Approach for DS 2 (α ≠ β)
The Colajanni et al. model, similarly to the CNR model, in the case of RU overestimated the shear strength by about 25%, but it yielded a better estimation of the average shear strength in the case of TU. Actually, the results referring to the T database for (α ≠ β) were very few, with only two specimens for the TU series, so the values of CoV were almost meaningless. Additionally, due to the lack of data on TU*, a comparison cannot be made.
In general, the ACI model was the performed best in the case of the rectangular beams, because it only overestimated the shear strength by about 18%, but it underestimated it by about 8% in the case of T members.
6.3. Conclusion Based on the 2nd Approach
A comparison of the effectiveness of each model in the strength assessment of specimens having the same cross-section shape but with different inclination angles stresses that both the Colajanni et al. and CNR models for RU and RU* overestimated more τavg in DS2 than in DS1, but with less of a dispersion of the data, while the average overestimation for RU* was larger in the CNR model than in the Colajanni one. This is due to the ability of the Colajanni et al. model to take into account the difference of steel and FRP reinforcement orientation, and to properly evaluate their contributions in determining the inclination of the concrete strut.
For TU, excellent results were obtained for both models in the case of DS2, with the best prediction of the average shear strength being only a 1% overestimation with less of a dispersion of the data (CoV 0.04) for both the Colajanni and CNR models. In the case of the ACI model, better results were obtained in the case of DS1 for RU and RU*, but in the case of TU, less accurate prediction but less of a dispersion was found in DS2.
The CNR model provided the same results in the case of RU for both DS1 and DS2. In the case of RU* in DS1, it provided better values of τavg, but more scattering of the data as compared to DS2. In the case of TU, excellent results were achieved in DS2.
7. Conclusions
The large values of the CoV (up to 0.35) that affect the assessment of the shear strength in a large database that includes specimens with different cross-section shapes and FRP reinforcement inclinations suggest that a deep analysis of the results can provide insights into the merits and demerits of the analyzed models, as well as into the effect of different characteristics of the strengthened specimens. The analysis shows that most of the models are ineffective, with the exception of the ACI model (just 1% overestimation in the case of RU cross sections while a 3% overestimation in the case of TU), because of their inability to take into account a reduced height of the fiber with respect to the total effective depth of the section, due to the presence of the top flange of the section represented by the slab. Similarly, none of the analyzed models can adequately take into account the effect of the presence of flanges in the T section, which experimental results have proved to be effective in increasing the strength of the FRP-strengthened beam.
Analyzing a database containing specimens with mechanical anchorages of the FRP, another source of uncertainty derives from the efficiency of the anchorages, which in many cases is not able to ensure that failure only occurs when the ultimate strain of the FRP is reached, i.e., by preventing FRP debonding failure.
Regarding the effect of FRP fiber inclination, the Colajanni et al. model is the only one among those based on the variable inclination of the action of the compressed concrete that is able to consistently take into account any different inclination of the FRP (β) and steel reinforcement (α). This characteristic makes it possible to mitigate the overestimation of the resistance (15% for R section and 1% for T section) that affects all the analysis models for α ≠ β. This circumstance is favored by the presence of the effectiveness factor of the steel reinforcement in the model, which takes into account the different orientation of the two reinforcements, and the consistent evaluation of the strength of the compressed concrete.
Author Contributions
Conceptualization, P.C.; Data curation, M.A.; Formal analysis, M.A. and P.C.; Investigation, S.P.; Methodology, P.C. and S.P.; Supervision, P.C.; Visualization, M.A.; Writing—original draft, M.A., P.C. and S.P.; Writing—review & editing, M.A., P.C. and S.P. All authors have read and agreed to the published version of the manuscript.
Funding
This research received no external funding.
Institutional Review Board Statement
Not applicable.
Informed Consent Statement
Not applicable.
Data Availability Statement
The data presented in this study are available on request from the corresponding author.
Conflicts of Interest
The authors declare no conflict of interest.
Abbreviations
Following Notations are used in this paper:
| Afv, Asw | Area of steel stirrups |
| R | Reduction coefficient (ratio of effective average stress/strain in FRP sheet to its ultimate strength) |
| R | Rectangular beam |
| T | T beam |
| Vc | Shear resistance of concrete |
| Vs | Shear resistance of steel stirrups |
| Vf | Shear resistance provided by FRP |
| VRd,f | FRP contribution to the shear capacity |
| VRd,s | Steel contribution to the shear capacity |
| VRd,c | Steel contribution to the shear capacity |
| τavg | Average shear strength (τavg = Vexp/Vthe) |
| α, β | Angle of steel and FRP transverse reinforcement |
| a | Shear span |
| bf, bw | Web widths of FRP and concrete |
| d, dfv | Effective depth of beam and FRP |
| fc, f′c | Characteristic compressive strength of concrete |
| Ef, Esw | FRP and steel elastic modulus |
| fbd | Design resistance of the adhesion between FRP and concrete |
| fywd | Design steel stirrup strength |
| ffed | Effective design strength of the FRP shear reinforcement |
| fyt | Characteristic yield strength of transverse reinforcement |
| ffe | Effective stress in the FRP; stress level attained at section failure |
| ffu | Design ultimate tensile strength of FRP |
| fck, fctm | Characteristic cylinder compressive and mean concrete tensile strength of concrete |
| fsy, fyt | Yielding stresses of longitudinal steel reinforcement and steel stirrups |
| hw | Beam cross-section height |
| kv, k1, k2 | Bond-reduction coefficient and modification factors |
| Lmax, Le | Maximum and effective length |
| r | Reduction factor for steel stirrups |
| wf | Spacing, thickness, and width of the FRP strip |
| sf, tf | Spacing and thickness of FRP strip |
| f | Spacing of FRP strips measured perpendicular to FRP strip axis |
| s | Spacing of the steel stirrups |
| V, Vn | External, and nominal shear forces |
| vexp, vthe | Experimental and theoretical nondimensional shear strengths, where vexp = (Vexp/(bw 0.9d 0.5 fc)) |
| z | Inner lever arm |
| ɛsyw | Yield strain of steel stirrup |
| ɛfe | Effective FRP strain |
| ɛfu | Nominal FRP strain |
| ɛfe,s | Effective strain in the direction of transverse steel reinforcement |
| θ | Angle between member axis and concrete stress |
| λ | Maximum bond length (normalized) |
| c | Stress of the web concrete (non-dimensional) |
| f | Tensile stress of transverse FRP (non-dimensional) |
| s | Stress in transverse reinforcement (non-dimensional) |
| φ | Angle between the FRP reinforcement direction and steel stirrups |
| ρf, ρs | Transverse geometrical ratio of fiber and steel reinforcement |
| σf,max | Maximum stress along the bond length |
| ψ | Fictitious angle of reinforcement incorporating FRP and transverse steel reinforcement |
| ψf ωfw, ωsw ωfw ωsw | Reduction factor equal to 0.95 in case of wrapping scheme, 0.85 for the other schemes Mechanical ratio of transverse FRP and stirrups reinforcement (2bftfffu)/(bw sf sin β fc) (Av fyt)/(bw s sin α fc) |
Appendix A. Specimen Details and Experimental Results
Table A1.
Details of specimens along with the results obtained after experimental tests.
Table A1.
Details of specimens along with the results obtained after experimental tests.
| fc | bw | d | ρs | fyt | Esw | tf | β | ρf | ffu | Ef | wrap | vexp | |||
|---|---|---|---|---|---|---|---|---|---|---|---|---|---|---|---|
| Specimen no. | (MPa) | (mm) | (mm) | a/d | (%) | (MPa) | (GPa) | (mm) | (°) | (%) | (MPa) | (GPa) | U,C | (-) | |
| Sato et al. (1997) [37] | No.2 | 35.7 | 150 | 240 | 2.5 | 0.42 | 387 | 183 | 0.11 | 90 | 0.15 | 3480 | 230 | T, U | 0.39 |
| No.3 | 35.3 | 150 | 240 | 2.5 | 0.42 | 387 | 183 | 0.11 | 90 | 0.15 | 3480 | 230 | T, U/C | 0.46 | |
| Deniaud & Cheng (2001) [38] | T6S4-C90 | 44.1 | 140 | 528 | 2.8 | 0.10 | 520 | 260 | 0.11 | 90 | 0.08 | 3400 | 230 | T, U | 0.19 |
| T6S4-G90 | 44.1 | 140 | 528 | 2.8 | 0.10 | 520 | 260 | 1.80 | 90 | 2.57 | 106 | 18 | T, U | 0.20 | |
| T6S2-C90 | 44.1 | 140 | 528 | 2.8 | 0.20 | 520 | 260 | 0.11 | 90 | 0.08 | 3400 | 230 | T, U | 0.21 | |
| Deniaud & Cheng (2003) [39] | T4S4-G90 | 30.0 | 140 | 362 | 3.0 | 0.10 | 520 | 200 | 1.80 | 90 | 2.57 | 106 | 18 | T, U | 0.30 |
| T4S2-G90 | 30.3 | 140 | 362 | 3.0 | 0.20 | 520 | 200 | 1.80 | 90 | 2.57 | 106 | 18 | T, U | 0.33 | |
| T4S2-C45 | 29.4 | 140 | 362 | 3.0 | 0.20 | 520 | 200 | 0.70 | 45 | 0.50 | 442 | 45 | T, U | 0.33 | |
| T4S2-Tri | 30.4 | 140 | 362 | 3.0 | 0.20 | 520 | 200 | 2.10 | 60 | 3.00 | 124 | 8 | T, U | 0.35 | |
| Bousselham & Chaallal (2006) [40] | SB-S1-0.5L | 25.0 | 152 | 356 | 3.0 | 0.38 | 650 | 215 | 0.06 | 90 | 0.08 | 3100 | 243 | T,U | 0.46 |
| SB-S1-1L | 25.0 | 152 | 356 | 3.0 | 0.38 | 650 | 215 | 0.11 | 90 | 0.14 | 3100 | 243 | T, U | 0.42 | |
| SB-S1-2L | 25.0 | 152 | 356 | 3.0 | 0.38 | 650 | 215 | 0.21 | 90 | 0.28 | 3100 | 243 | T, U | 0.44 | |
| Pellegrino & Modena (2006) [24] | A-U1-C-17 | 41.4 | 150 | 250 | 3.0 | 0.39 | 534 | 210 | 0.17 | 90 | 0.22 | 3450 | 230 | R, U | 0.34 |
| A-U1-C-20 | 41.4 | 150 | 250 | 3.0 | 0.34 | 534 | 210 | 0.17 | 90 | 0.22 | 3450 | 230 | R, U | 0.32 | |
| A-U1-S-17 | 41.4 | 150 | 250 | 3.0 | 0.39 | 534 | 210 | 0.17 | 90 | 0.22 | 3450 | 230 | R, U | 0.35 | |
| A-U1-S-20 | 41.4 | 150 | 250 | 3.0 | 0.34 | 534 | 210 | 0.17 | 90 | 0.22 | 3450 | 230 | R, U | 0.34 | |
| A-U2-C-17 | 41.4 | 150 | 250 | 3.0 | 0.39 | 534 | 210 | 0.33 | 90 | 0.44 | 3450 | 230 | R, U | 0.35 | |
| A-U2-C-20 | 41.4 | 150 | 250 | 3.0 | 0.34 | 534 | 210 | 0.33 | 90 | 0.44 | 3450 | 230 | R, U | 0.33 | |
| A-U2-S-17 | 41.4 | 150 | 250 | 3.0 | 0.39 | 534 | 210 | 0.33 | 90 | 0.44 | 3450 | 230 | R, U | 0.31 | |
| A-U2-S-20 | 41.4 | 150 | 250 | 3.0 | 0.34 | 534 | 210 | 0.33 | 90 | 0.44 | 3450 | 230 | R, U | 0.30 | |
| Leung et al. (2007) [41] | SB-U1 | 27.4 | 75 | 155 | 2.9 | 0.28 | 550 | 210 | 0.11 | 90 | 0.10 | 4200 | 235 | R, U | 0.45 |
| SB-F1 | 27.4 | 75 | 155 | 2.9 | 0.28 | 550 | 210 | 0.11 | 90 | 0.10 | 4200 | 235 | R, C | 0.46 | |
| SB-F2 | 27.4 | 75 | 155 | 2.9 | 0.28 | 550 | 210 | 0.11 | 90 | 0.10 | 4200 | 235 | R, C | 0.46 | |
| MB-U1 | 27.4 | 150 | 305 | 3.0 | 0.28 | 550 | 210 | 0.22 | 90 | 0.10 | 4200 | 235 | R, U | 0.27 | |
| MB-U2 | 27.4 | 150 | 305 | 3.0 | 0.28 | 550 | 210 | 0.22 | 90 | 0.10 | 4200 | 235 | R, U | 0.28 | |
| MB-F1 | 27.4 | 150 | 305 | 3.0 | 0.28 | 550 | 210 | 0.22 | 90 | 0.10 | 4200 | 235 | R, C | 0.42 | |
| MB-F2 | 27.4 | 150 | 305 | 3.0 | 0.28 | 550 | 210 | 0.22 | 90 | 0.10 | 4200 | 235 | R, C | 0.44 | |
| LB-U1 | 27.4 | 300 | 660 | 2.7 | 0.14 | 550 | 210 | 0.44 | 90 | 0.10 | 4200 | 235 | R, U | 0.23 | |
| LB-U2 | 27.4 | 300 | 660 | 2.7 | 0.14 | 550 | 210 | 0.44 | 90 | 0.10 | 4200 | 235 | R, U | 0.23 | |
| LB-F1 | 27.4 | 300 | 660 | 2.7 | 0.14 | 550 | 210 | 0.44 | 90 | 0.10 | 4200 | 235 | R, C | 0.36 | |
| LB-F2 | 27.4 | 300 | 660 | 2.7 | 0.14 | 550 | 210 | 0.44 | 90 | 0.10 | 4200 | 235 | R, C | 0.36 | |
| Monti & Liotta (2007) [12] | UF90 | 11.0 | 250 | 410 | 3.5 | 0.10 | 500 | 210 | 0.22 | 90 | 0.18 | 2600 | 390 | R, U | 0.25 |
| US60 | 11.0 | 250 | 410 | 3.5 | 0.10 | 500 | 210 | 0.22 | 60 | 0.08 | 2600 | 390 | R, U | 0.22 | |
| US45+ | 11.0 | 250 | 410 | 3.5 | 0.10 | 500 | 210 | 0.22 | 45 | 0.09 | 2600 | 390 | R, U | 0.25 | |
| US45++ | 11.0 | 250 | 410 | 3.5 | 0.10 | 500 | 210 | 0.22 | 45 | 0.06 | 2600 | 390 | R, U* | 0.26 | |
| UF45+ A | 11.0 | 250 | 410 | 3.5 | 0.10 | 500 | 210 | 0.22 | 45 | 0.12 | 2600 | 390 | R, U* | 0.33 | |
| UF45++ B | 11.0 | 250 | 410 | 3.5 | 0.10 | 500 | 210 | 0.22 | 45 | 0.12 | 2600 | 390 | R, U* | 0.34 | |
| UF45++ C | 11.0 | 250 | 410 | 3.5 | 0.10 | 500 | 210 | 0.22 | 45 | 0.12 | 2600 | 390 | R, U* | 0.36 | |
| US45+ D | 11.0 | 250 | 410 | 3.5 | 0.10 | 500 | 210 | 0.22 | 45 | 0.09 | 2600 | 390 | R, U* | 0.32 | |
| US45++ E | 11.0 | 250 | 410 | 3.5 | 0.10 | 500 | 210 | 0.22 | 45 | 0.09 | 2600 | 390 | R, U* | 0.32 | |
| US45++ F | 11.0 | 250 | 410 | 3.5 | 0.10 | 500 | 210 | 0.22 | 45 | 0.09 | 2600 | 390 | R, U* | 0.29 | |
| WS45+ | 11.0 | 250 | 410 | 3.5 | 0.10 | 500 | 210 | 0.22 | 45 | 0.06 | 2600 | 390 | R, C | 0.31 | |
| USVA | 10.6 | 250 | 400 | 3.5 | 0.10 | 500 | 200 | 0.22 | 45 | 0.09 | 3000 | 390 | R, U | 0.25 | |
| USVA+ | 10.6 | 250 | 400 | 3.5 | 0.10 | 500 | 200 | 0.22 | 45 | 0.09 | 3000 | 390 | R, U | 0.28 | |
| Pellegrino & Modena (2008) [32] | B-U1-C-14 | 46.2 | 150 | 240 | 3.0 | 0.48 | 534 | 210 | 0.17 | 90 | 0.22 | 3450 | 230 | R,U | 0.34 |
| B-U2-C-14 | 46.2 | 150 | 240 | 3.0 | 0.48 | 534 | 210 | 0.33 | 90 | 0.44 | 3450 | 230 | R, U | 0.35 | |
| B-U1-C-17 | 46.2 | 150 | 240 | 3.0 | 0.39 | 534 | 210 | 0.17 | 90 | 0.22 | 3450 | 230 | R, U | 0.32 | |
| B-U2-C-17 | 46.2 | 150 | 240 | 3.0 | 0.39 | 534 | 210 | 0.33 | 90 | 0.44 | 3450 | 230 | R, U | 0.33 | |
| Grande et al. (2009) [33] | RS4Wa | 21.0 | 250 | 411 | 3.4 | 0.10 | 476 | 210 | 0.19 | 90 | 0.15 | 2600 | 392 | R, C | 0.26 |
| RS3Wa | 21.0 | 250 | 411 | 3.4 | 0.13 | 476 | 210 | 0.19 | 90 | 0.15 | 2600 | 392 | R, C | 0.34 | |
| RS2Wa | 21.0 | 250 | 411 | 3.4 | 0.20 | 476 | 210 | 0.19 | 90 | 0.15 | 2600 | 392 | R, C | 0.31 | |
| RS4Ub | 21.0 | 250 | 411 | 3.4 | 0.10 | 476 | 210 | 0.19 | 90 | 0.15 | 2600 | 392 | R, U* | 0.23 | |
| RS3Ua | 21.0 | 250 | 411 | 3.4 | 0.13 | 476 | 210 | 0.19 | 90 | 0.15 | 2600 | 392 | R, U* | 0.28 | |
| RS2Ua | 21.0 | 250 | 411 | 3.4 | 0.20 | 476 | 210 | 0.19 | 90 | 0.15 | 2600 | 392 | R, U* | 0.29 | |
| Belarbi et al. (2012) [16] | RC-8-S90-NA | 20.7 | 457 | 831 | 3.3 | 0.15 | 276 | 200 | 0.22 | 90 | 0.06 | 3792 | 228 | T, U | 0.24 |
| RC-8-S90-DMA | 23.8 | 457 | 831 | 3.3 | 0.15 | 276 | 200 | 0.22 | 90 | 0.06 | 3792 | 228 | T, U* | 0.23 | |
| RC-12-S90-NA | 28.9 | 457 | 831 | 3.3 | 0.10 | 276 | 200 | 0.22 | 90 | 0.06 | 3792 | 228 | T, U | 0.15 | |
| RC-12-S90-DMA | 30.5 | 457 | 831 | 3.3 | 0.10 | 276 | 200 | 0.22 | 90 | 0.06 | 3792 | 228 | T, U* | 0.18 | |
| RC-12-S90-PC | 19.2 | 457 | 831 | 3.3 | 0.10 | 276 | 200 | 0.22 | 90 | 0.06 | 3792 | 228 | T, U* | 0.29 | |
| RC-12-S90-HS-PC | 18.3 | 457 | 831 | 3.3 | 0.10 | 276 | 200 | 0.22 | 90 | 0.06 | 3792 | 228 | T, U* | 0.27 | |
| Panda et al.(2013) [42] | S300-1L-SZ-U-90 | 40.4 | 100 | 230 | 3.2 | 0.19 | 252 | 200 | 0.36 | 90 | 0.72 | 160 | 13 | T, U | 0.22 |
| S300-1L-SZ-UA-90 | 40.4 | 100 | 230 | 3.2 | 0.19 | 252 | 200 | 0.36 | 90 | 0.72 | 160 | 13 | T, U | 0.23 | |
| S200-1L-SZ-U-90 | 42.1 | 100 | 230 | 3.2 | 0.28 | 252 | 200 | 0.36 | 90 | 0.72 | 160 | 13 | T, U | 0.22 | |
| S200-1L-SZ-UA-90 | 42.1 | 100 | 230 | 3.2 | 0.28 | 252 | 200 | 0.36 | 90 | 0.72 | 160 | 13 | T, U | 0.23 | |
| Baggio et al. (2014) [43] | 6-G-N | 50.1 | 150 | 310 | 2.9 | 0.21 | 384 | 200 | 0.51 | 90 | 0.34 | 575 | 26 | R, U | 0.16 |
| 7-PD-G-N | 50.1 | 150 | 310 | 2.9 | 0.21 | 384 | 200 | 0.51 | 90 | 0.34 | 575 | 26 | R, U | 0.15 | |
| 8-PD-G-CA | 50.1 | 150 | 310 | 2.9 | 0.21 | 384 | 200 | 0.51 | 90 | 0.34 | 575 | 26 | R, U* | 0.15 | |
| 9-PD-G-GA | 50.1 | 150 | 310 | 2.9 | 0.21 | 384 | 200 | 0.51 | 90 | 0.34 | 575 | 26 | R, U* | 0.16 | |
| Colalillo & Sheikh (2014) [44] | S5-US | 47.6 | 400 | 545 | 3.1 | 0.07 | 501 | 195 | 1.00 | 90 | 0.25 | 961 | 95 | R, U* | 0.11 |
| S5-UA | 47.6 | 400 | 545 | 3.1 | 0.07 | 501 | 195 | 1.00 | 90 | 0.50 | 961 | 95 | R, U | 0.13 | |
| S5-CS | 47.6 | 400 | 545 | 3.1 | 0.07 | 501 | 195 | 1.00 | 90 | 0.25 | 961 | 95 | R, C | 0.16 | |
| S2-US | 47.5 | 400 | 545 | 3.1 | 0.14 | 501 | 195 | 1.00 | 90 | 0.25 | 961 | 95 | R, U* | 0.13 | |
| S2-UA | 47.5 | 400 | 545 | 3.1 | 0.14 | 501 | 195 | 1.00 | 90 | 0.50 | 961 | 95 | R, U | 0.15 | |
| Ozden et al. (2014) [45] | FBwoA-CFRP | 12.4 | 120 | 339 | 3.8 | 0.14 | 249 | 200 | 0.13 | 90 | 0.05 | 4300 | 238 | T, U | 0.27 |
| FBwA-CFRP | 12.4 | 120 | 339 | 3.8 | 0.14 | 249 | 200 | 0.13 | 90 | 0.05 | 4300 | 238 | T, U/C | 0.36 | |
| PBwA-CFRP | 12.4 | 120 | 339 | 3.8 | 0.14 | 249 | 200 | 0.13 | 90 | 0.05 | 4300 | 238 | U, U/C | 0.29 | |
| FBwoA-GFRP | 12.4 | 120 | 339 | 3.8 | 0.14 | 249 | 200 | 0.16 | 90 | 0.06 | 3400 | 73 | T, U | 0.27 | |
| FBwA-GFRP | 12.4 | 120 | 339 | 3.8 | 0.14 | 249 | 200 | 0.16 | 90 | 0.06 | 3400 | 73 | T, U/C | 0.34 | |
| PBwA-GFRP | 12.4 | 120 | 339 | 3.8 | 0.14 | 249 | 200 | 0.16 | 90 | 0.06 | 3400 | 73 | T, U/C | 0.34 | |
| FBwoA-Hi-CFRP | 12.4 | 120 | 339 | 3.8 | 0.14 | 249 | 200 | 0.14 | 90 | 0.05 | 2600 | 640 | T, U | 0.24 | |
| FBwA-Hi-CFRP | 12.4 | 120 | 339 | 3.8 | 0.14 | 249 | 200 | 0.14 | 90 | 0.05 | 2600 | 640 | T, U/C | 0.27 | |
| PBw-Hi-C | 12.4 | 120 | 339 | 3.8 | 0.14 | 249 | 200 | 0.14 | 90 | 0.05 | 2600 | 640 | T, U/C | 0.31 | |
| Mofidi & Chaallal (2014) [36] | WT-ST-50 | 31.0 | 152 | 350 | 3.0 | 0.38 | 540 | 206 | 0.11 | 90 | 0.07 | 3450 | 230 | T, U | 0.33 |
| WT-ST-70 | 31.0 | 152 | 350 | 3.0 | 0.38 | 540 | 206 | 0.11 | 90 | 0.10 | 3450 | 230 | T, U | 0.34 | |
| WT-SH-100 | 31.0 | 152 | 350 | 3.0 | 0.38 | 540 | 206 | 0.11 | 90 | 0.14 | 3450 | 230 | T, U | 0.34 | |
| Mofidi et al. (2014) [46] | S1-LS-NE | 33.7 | 152 | 350 | 3.0 | 0.38 | 650 | 205 | 2.00 | 90 | 0.60 | 1350 | 90 | T, U | 0.34 |
| S1-LS-PE | 33.7 | 152 | 350 | 3.0 | 0.38 | 650 | 205 | 2.00 | 90 | 0.60 | 1350 | 90 | T, U* | 0.37 | |
| S1-EB-NA | 33.7 | 152 | 350 | 3.0 | 0.38 | 650 | 205 | 0.11 | 90 | 0.14 | 3450 | 230 | T, U | 0.36 | |
| El-Saikaly et al. (2015) [47] | S1-EB | 28.0 | 152 | 350 | 3.0 | 0.25 | 580 | 200 | 0.38 | 90 | 0.50 | 894 | 65 | T, U | 0.32 |
| S1-LS | 28.0 | 152 | 350 | 3.0 | 0.25 | 580 | 200 | 1.40 | 90 | 0.21 | 2250 | 120 | T, U | 0.30 | |
| S1-LS-Rope | 28.0 | 152 | 350 | 3.0 | 0.25 | 580 | 200 | 1.40 | 90 | 0.21 | 2250 | 120 | T, U/C | 0.38 | |
| S3-EB | 28.0 | 152 | 350 | 3.0 | 0.38 | 580 | 200 | 0.38 | 90 | 0.50 | 894 | 65 | T, U | 0.38 | |
| S3-LS | 28.0 | 152 | 350 | 3.0 | 0.38 | 580 | 200 | 1.40 | 90 | 0.21 | 2250 | 120 | T, U | 0.36 | |
| S3-LS-Rope | 28.0 | 152 | 350 | 3.0 | 0.38 | 580 | 200 | 1.40 | 90 | 0.21 | 2250 | 120 | T, U/C | 0.42 | |
| Qin et al. (2015) [48] | S00 | 29.6 | 125 | 295 | 3.1 | 0.29 | 542 | 210 | 1.00 | 90 | 1.60 | 986 | 96 | T, U | 0.37 |
| Chen et al. (2016) [49] | S8-U | 46.1 | 200 | 320 | 3.0 | 0.25 | 416 | 200 | 0.17 | 90 | 0.08 | 4361 | 226 | T, U | 0.23 |
| S8-UFA1 | 46.1 | 200 | 320 | 3.0 | 0.25 | 416 | 200 | 0.17 | 90 | 0.08 | 4361 | 226 | T, U* | 0.24 | |
| S8-UFA2 | 46.1 | 200 | 320 | 3.0 | 0.25 | 416 | 200 | 0.17 | 90 | 0.08 | 4361 | 226 | T, U* | 0.28 | |
| Frederick et al. (2017) [50] | TB2 | 27.2 | 130 | 235 | 3.2 | 0.17 | 415 | 200 | 0.15 | 90 | 0.23 | 1400 | 119 | T, U | 0.37 |
| TB4 | 27.2 | 130 | 235 | 3.2 | 0.17 | 415 | 200 | 0.15 | 90 | 0.23 | 1400 | 119 | T, U* | 0.42 | |
| El-Saikaly et al. (2017) [51] | EBS-BL | 28.0 | 152 | 350 | 3.0 | 0.25 | 580 | 200 | 0.38 | 90 | 0.50 | 894 | 65 | T, U* | 0.37 |
| EBS-ER | 28.0 | 152 | 350 | 3.0 | 0.25 | 580 | 200 | 0.38 | 90 | 0.50 | 894 | 65 | T, U* | 0.40 | |
| EBL-RF | 28.0 | 152 | 350 | 3.0 | 0.25 | 580 | 200 | 2.00 | 90 | 0.30 | 1350 | 90 | T, U/C | 0.4 | |
| EBS-NA | 28 | 152 | 350 | 3.0 | 0.25 | 580 | 200 | 0.38 | 90 | 0.5 | 894 | 65 | T, U | 0.32 | |
| EBL-NA | 28 | 152 | 350 | 3.0 | 0.25 | 580 | 200 | 2.00 | 90 | 0.3 | 1350 | 90 | T, U | 0.30 | |
| EBL-RW | 28 | 152 | 350 | 3.0 | 0.25 | 580 | 200 | 2.00 | 90 | 0.3 | 1350 | 90 | T, U/C | 0.38 | |
| Nguyen-Minh et al. (2018) [52] | P-A1-2.3-C | 30.6 | 120 | 406 | 2.3 | 0.16 | 342 | 205 | 1.00 | 90 | 0.83 | 986 | 96 | T, U | 0.41 |
| P-A1-2.3-G | 30.6 | 120 | 406 | 2.3 | 0.16 | 342 | 205 | 1.30 | 90 | 1.08 | 575 | 26 | T, U | 0.40 | |
| P-A1-2.3-G-Cont. | 30.6 | 120 | 406 | 2.3 | 0.16 | 342 | 205 | 1.30 | 90 | 2.17 | 575 | 26 | T, U | 0.43 | |
| P-A1-2.3-C-Cont. | 30.6 | 120 | 406 | 2.3 | 0.16 | 342 | 205 | 1.00 | 90 | 1.67 | 986 | 96 | T, U | 0.45 | |
| P-A2-2.3-C | 30.6 | 120 | 406 | 2.3 | 0.16 | 342 | 205 | 2.00 | 90 | 1.67 | 986 | 96 | T, U | 0.43 | |
| P-B1-2.3-C | 44.4 | 120 | 406 | 2.3 | 0.16 | 342 | 205 | 1.00 | 90 | 0.83 | 986 | 96 | T, U | 0.32 | |
| P-B1-2.3-G | 44.4 | 120 | 406 | 2.3 | 0.16 | 342 | 205 | 1.30 | 90 | 1.08 | 575 | 26 | T, U | 0.32 | |
| P-B1-2.3-G-Cont. | 44.4 | 120 | 406 | 2.3 | 0.16 | 342 | 205 | 1.30 | 90 | 2.17 | 575 | 26 | T, U | 0.34 | |
| P-B1-2.3-C-Cont. | 44.4 | 120 | 406 | 2.3 | 0.16 | 342 | 205 | 1.00 | 90 | 1.67 | 986 | 96 | T, U | 0.36 | |
| P-B2-2.3-C | 44.4 | 120 | 406 | 2.3 | 0.16 | 342 | 205 | 2.00 | 90 | 1.67 | 986 | 96 | T, U | 0.34 | |
| P-C1-2.3-C | 58.7 | 120 | 406 | 2.3 | 0.16 | 342 | 205 | 1.00 | 90 | 0.83 | 986 | 96 | T, U | 0.29 | |
| P-C1-2.3-G | 58.7 | 120 | 406 | 2.3 | 0.16 | 342 | 205 | 1.30 | 90 | 1.08 | 575 | 26 | T, U | 0.27 | |
| P-C1-2.3-G-Cont. | 58.7 | 120 | 406 | 2.3 | 0.16 | 342 | 205 | 1.30 | 90 | 2.17 | 575 | 26 | T, U | 0.31 | |
| P-C1-2.3-C-Cont. | 58.7 | 120 | 406 | 2.3 | 0.16 | 342 | 205 | 1.00 | 90 | 1.67 | 986 | 96 | T, U | 0.32 | |
| P-C2-2.3-C | 58.7 | 120 | 406 | 2.3 | 0.16 | 342 | 205 | 2.00 | 90 | 1.67 | 986 | 96 | T, U | 0.30 | |
| Oller et al. (2019) [20] | M1-a | 42.8 | 200 | 493 | 3.0 | 0.12 | 646 | 200 | 0.17 | 90 | 0.04 | 3400 | 230 | T, U | 0.15 |
| M1-b | 42.8 | 200 | 493 | 3.0 | 0.12 | 646 | 200 | 0.17 | 90 | 0.04 | 3400 | 230 | T, U | 0.15 | |
| M1A | 39.0 | 200 | 493 | 3.0 | 0.12 | 646 | 200 | 0.17 | 90 | 0.04 | 3400 | 230 | T, U* | 0.16 | |
| M1B | 38.5 | 200 | 493 | 3.0 | 0.12 | 646 | 200 | 0.17 | 90 | 0.04 | 3400 | 230 | T, U* | 0.17 | |
| M2A | 39.0 | 200 | 493 | 3.0 | 0.12 | 646 | 200 | 0.17 | 90 | 0.07 | 3400 | 230 | T, U* | 0.21 | |
| M2B | 38.5 | 200 | 493 | 3.0 | 0.12 | 646 | 200 | 0.17 | 90 | 0.07 | 3400 | 230 | T, U* | 0.21 | |
| H1-a | 44.4 | 200 | 493 | 3.0 | 0.12 | 646 | 200 | 0.17 | 90 | 0.04 | 3400 | 230 | T, U | 0.15 | |
| H2-a | 44.4 | 200 | 493 | 3.0 | 0.12 | 646 | 200 | 0.17 | 90 | 0.07 | 3400 | 230 | T, U | 0.19 | |
| H2-b | 49.7 | 200 | 493 | 3.0 | 0.12 | 646 | 200 | 0.17 | 90 | 0.07 | 3400 | 230 | T, U | 0.17 | |
| H2A | 44.7 | 200 | 493 | 3.0 | 0.12 | 646 | 200 | 0.17 | 90 | 0.07 | 3400 | 230 | T, U* | 0.19 | |
| H2B | 49.6 | 200 | 493 | 3.0 | 0.12 | 646 | 200 | 0.17 | 90 | 0.07 | 3400 | 230 | T, U* | 0.17 | |
| H3A | 44.7 | 200 | 493 | 3.0 | 0.12 | 646 | 200 | 0.17 | 90 | 0.17 | 3400 | 230 | T, U* | 0.23 | |
| H3B | 49.6 | 200 | 493 | 3.0 | 0.12 | 646 | 200 | 0.17 | 90 | 0.17 | 3400 | 230 | T, U* | 0.21 | |
| Alzate et al. (2013) [53] | U90S5-a(L) | 37.0 | 250 | 420 | 3.5 | 0.11 | 500 | 200 | 0.29 | 90 | 0.14 | 4000 | 240 | R, U | 0.16 |
| U90S5-a(S) | 37.0 | 250 | 420 | 3.5 | 0.11 | 500 | 200 | 0.29 | 90 | 0.14 | 4000 | 240 | R, U | 0.14 | |
| U90S5-b(L) | 28.0 | 250 | 420 | 3.5 | 0.11 | 500 | 200 | 0.29 | 90 | 0.14 | 4000 | 240 | R, U | 0.21 | |
| U90S5-b(S) | 28.0 | 250 | 420 | 3.5 | 0.11 | 500 | 200 | 0.29 | 90 | 0.14 | 4000 | 240 | R, U | 0.20 | |
| U90C5-a(L) | 24.5 | 250 | 420 | 3.5 | 0.11 | 500 | 200 | 0.29 | 90 | 0.23 | 4000 | 240 | R, U | 0.22 | |
| U90C5-a(S) | 24.5 | 250 | 420 | 3.5 | 0.11 | 500 | 200 | 0.29 | 90 | 0.23 | 4000 | 240 | R, U | 0.20 | |
| U90C5-b(L) | 22.6 | 250 | 420 | 3.5 | 0.11 | 500 | 200 | 0.29 | 90 | 0.23 | 4000 | 240 | R, U | 0.26 | |
| U90C5-b(S) | 22.6 | 250 | 420 | 3.5 | 0.11 | 500 | 200 | 0.29 | 90 | 0.23 | 4000 | 240 | R, U | 0.24 | |
| U90S3-a(L) | 20.5 | 250 | 420 | 3.5 | 0.11 | 500 | 200 | 0.17 | 90 | 0.08 | 3800 | 240 | R, U | 0.25 | |
| U90S3-a(S) | 20.5 | 250 | 420 | 3.5 | 0.11 | 500 | 200 | 0.17 | 90 | 0.08 | 3800 | 240 | R, U | 0.23 | |
| U90S3-b(L) | 22.6 | 250 | 420 | 3.5 | 0.11 | 500 | 200 | 0.17 | 90 | 0.08 | 3800 | 240 | R, U | 0.22 | |
| U90S3-b(S) | 22.6 | 250 | 420 | 3.5 | 0.11 | 500 | 200 | 0.17 | 90 | 0.08 | 3800 | 240 | R, U | 0.24 | |
| U90S3-c(L) | 28.0 | 250 | 420 | 3.5 | 0.11 | 500 | 200 | 0.17 | 90 | 0.08 | 3800 | 240 | R, U | 0.20 | |
| U90S3-c(S) | 28.0 | 250 | 420 | 3.5 | 0.11 | 500 | 200 | 0.17 | 90 | 0.08 | 3800 | 240 | R, U | 0.16 | |
| U90C3-a(L) | 30.2 | 250 | 420 | 3.5 | 0.11 | 500 | 200 | 0.17 | 90 | 0.13 | 3800 | 240 | R, U | 0.17 | |
| U90C3-a(S) | 30.2 | 250 | 420 | 3.5 | 0.11 | 500 | 200 | 0.17 | 90 | 0.13 | 3800 | 240 | R, U | 0.18 | |
| U90C3-b(L) | 30.2 | 250 | 420 | 3.5 | 0.11 | 500 | 200 | 0.17 | 90 | 0.13 | 3800 | 240 | R, U | 0.16 | |
| U90C3-b(S) | 30.2 | 250 | 420 | 3.5 | 0.11 | 500 | 200 | 0.17 | 90 | 0.13 | 3800 | 240 | R, U | 0.17 | |
| U45S5(L) | 30.7 | 250 | 420 | 3.5 | 0.11 | 500 | 200 | 0.29 | 45 | 0.14 | 4000 | 240 | R, U | 0.17 | |
| U45S5(S) | 30.7 | 250 | 420 | 3.5 | 0.11 | 500 | 200 | 0.29 | 45 | 0.14 | 4000 | 240 | R, U | 0.18 |
In the table, U* represents beam having U-jacketing with partially efficient anchorages.
Appendix B. Calculation Examples of the Colajanni et al. Model
With regard to the shear model proposed by Colajanni et al. [19], in this section three calculation examples will be carried out using a step-by-step procedure based on the equations reported in Section 2.3. For each of the three possible cases (namely cot θ > 2.5, 1 ≤ cot θ ≤ 2.5, cot θ < 1) a calculation example is given below. With the exception of the third case (which is quite difficult to find in a real application since it would require an amount of fiber and/or stirrups not compatible with engineering applications), these examples are developed starting from one of the specimens listed in Appendix A, using the R factor based on the equations given in [7].
Case 1:
One of the specimens tested by Alzate et al. [53] is used. Beam U90S5-a(L) has a rectangular cross section with dimensions equal to 250 × 420 mm, and a length of 4300 mm. It has stirrups with a diameter of 8 mm arranged at a spacing of 380 mm, while it is retrofitted with a U-shaped scheme made with CFRP strips having a thickness of 0.29 mm, a width of 300 mm and a spacing of 500 mm, arranged at right angles with respect to the beam axis. Using the data reported in Appendix A, first of all the R factor is calculated according to the equations reported in Section 4 (i.e., R5 and R6, equal to 0.65 and 0.18, respectively). Then, starting from the R-factor value, the r factor is computed based on the procedure described in Section 3, equal to 0.92. After that, the inclination of the concrete strut is calculated via Equation (14), which provides a value of cot θ > 2.5; thus, due to the limitations of cot θ values, cot θ = 2.5 is assumed. Consequently, assuming f = s = 1, the shear capacity can be calculated using Equation (9), which provides a value of 310 kN.
Case 2:
One of the specimens tested by Pellegrino and Modena [24] is used. Beam A-U1-C-17 has a rectangular cross section with dimensions equal to 150 × 300 mm, and a length of 4800 mm. It has stirrups with a diameter of 8 mm arranged at a spacing of 170 mm, while it is retrofitted with a U-shaped scheme made with continuous CFRP sheets having a thickness of 0.17 mm, arranged at right angles with respect to the beam axis. Using the data reported in Appendix A, first of all the R factor is calculated according to the equations reported in Section 4 (i.e., R5 and R6, equal to 0.50 and 0.23, respectively). Then, starting from the R-factor value, the r factor is computed based on the procedure described in Section 3, equal to 1. After that, the inclination of the concrete strut is calculated via Equation (14), which provides a value of cot θ = 2.09. Therefore, assuming c = f = s = 1, the shear capacity can be calculated using one of Equations (9)–(11), which provide a value of 272 kN.
Case 3:
As already stated before, none of the specimens analyzed in the table reported in Appendix A provides a cot θ value lower than 1. Therefore, to carry out the comparison, the specimen with the lowest cot θ is selected and then the spacing of FRP is properly modified to obtain a cot θ less than 1. To this aim, one of the specimens tested by El-Saikaly et al. [47] is used. Beam S3-LS-Rope has a T cross section with dimensions equal to 152 × 406 mm, with a flange width and thickness of 508 mm and 102 mm, respectively. It has stirrups with a diameter of 8 mm arranged at a spacing of 175 mm, while it is retrofitted with a U-shaped scheme made with CFRP strips having a thickness of 1.4 mm, a width of 20 mm and a spacing of 175 mm, arranged at right angles with respect to the beam axis. Anchorages made with carbon-fiber ropes are added to each strip to prevent debonding failure. In fact, the experimental test showed an FRP tensile failure, equivalent to a complete wrapping scheme. Using the data reported in Appendix A, first of all the R factor is calculated according to the equations reported in Section 4 (i.e., only R5 because the section is considered fully wrapped thanks to the presence of the anchorages, and it is equal to 0.66). Then, starting from the R-factor value, the r factor is computed based on the procedure described in Section 3. After that, the inclination of the concrete strut is calculated via Equation (14), which provides a value of cot θ = 1.28. Therefore, the spacing of the CFRP is reduced to 110 mm, with which, again using Equation (14), a cot θ = 0.97 is obtained. Thus, cot θ = 1 is assumed, so Equation (10) is used considering f = 1 and Equation (11) is used with s = −1. The shear strength of the beam is the minimum one obtained through the above two equations, and it is equal to 335 kN.
References
- Colajanni, P.; Pagnotta, S.; Recupero, A.; Spinella, N. Shear resistance analytical evaluation for RC beams with transverse re-inforcement with two different inclinations. Mater. Struct. 2020, 53, 18. [Google Scholar] [CrossRef]
- Colajanni, P.; Recupero, A.; Spinella, N. Shear strength degradation due to flexural ductility demand in circular RC columns. Bull. Earthq. Eng. 2015, 13, 1795–1807. [Google Scholar] [CrossRef]
- Koutas, L.N.; Tetta, Z.; Bournas, D.A.; Triantafillou, T.C. Strengthening of concrete structures with textile reinforced mortars: State-of-the-art review. J. Compos. Constr. 2019, 23, 03118001. [Google Scholar] [CrossRef]
- Sudhakar, R.; Partheeban, P. Strengthening of RCC Column Using Glass Fibre Reinforced Polymer (GFRP). Int. J. Appl. Eng. Res. 2017, 12, 4478–4483. [Google Scholar]
- Sas, G.; Täljsten, B.; Barros, J.; Lima, J.; Carolin, A. Are available models reliable for predicting the FRP contribution to the shear resistance of RC beams? J. Compos. Construct. 2009, 13, 514–534. [Google Scholar] [CrossRef] [Green Version]
- Campione, G.; Colajanni, P.; La Mendola, L.; Spinella, N. Ductility of R.C. Members Externally Wrapped With Frp Sheets. J. Compos. Constr. 2007, 11, 279–290. [Google Scholar] [CrossRef]
- Chen, J.F.; Teng, J.G. Shear capacity of FRP-strengthened RC beams: FRP debonding. Constr. Build. Mater. 2003, 17, 27–41. [Google Scholar] [CrossRef]
- Kotynia, R.; Oller, E.; Marí, A.; Kaszubska, M. Efficiency of shear strengthening of RC beams with externally bonded FRP materials—State-of-the-art in the experimental tests. Compos. Struct. 2021, 267, 113891. [Google Scholar] [CrossRef]
- Spinella, N.; Colajanni, P.; Recupero, A.; Tondolo, F. Ultimate shear of RC beams with corroded stirrups and strengthened with FRP. Buildings 2007, 9, 34. [Google Scholar] [CrossRef] [Green Version]
- Ferreira, D.; Oller, E.; Marí, A.; Bairán, J. Numerical Analysis of Shear Critical RC Beams Strengthened in Shear with FRP Sheets. J. Compos. Constr. 2013, 17, 04013016. [Google Scholar] [CrossRef]
- Colajanni, P.; Pagnotta, S. Influence of the effectiveness factors in assessing the shear capacity of RC beams strengthened with FRP. In Proceedings of the COMPDYN 2021, Athens, Greece, 27–30 June 2021. [Google Scholar]
- Monti, G.; Liotta, M. Tests and design equations for FRP-strengthening in shear. Construct. Build. Mater. 2007, 21, 799–809. [Google Scholar] [CrossRef]
- Bousselham, A.; Chaallal, O. Mechanisms of shear resistance of concrete beams strengthened in shear with externally bonded FRP. J. Compos. Constr. 2008, 12, 499–512. [Google Scholar] [CrossRef]
- Cao, S.Y.; Chen, J.F.; Teng, J.G.; Hao, Z.; Chen, J. Debonding in RC Beams Shear Strengthened with Complete FRP Wraps. J. Compos. Constr. 2005, 9, 417–428. [Google Scholar] [CrossRef]
- Oller, E.; Kotynia, R.; Marí, A. Assessment of the existing models to evaluate the shear strength contribution of externally bonded frp shear reinforcements. Compos. Struct. 2021, 266, 113641. [Google Scholar] [CrossRef]
- Belarbi, A.; Bae, S.W.; Brancaccio, A. Behavior of full-scale RC T-beams strengthened in shear with externally bonded FRP sheets. Constr. Build. Mater. 2012, 32, 27–40. [Google Scholar] [CrossRef]
- CAN/CSA (Canadian Standards Association). Canadian Highway Bridge Design Code. S6-06; CAN/CSA: Mississagua, ON, Canada, 2006. [Google Scholar]
- ACI Committee 440. ACI 440.2R-17; Guide for the Design and Construction of Externally Bonded FRP Systems for Strengthening Concrete Structures. ACI Committee 440: Farmington Hills, MI, USA, 2017.
- Colajanni, P.; Guarino, V.; Pagnotta, S. Shear capacity model with variable orientation of concrete stress field for RC beams strengthened by FRP with different inclinations. J. Compos. Constr. 2021, 25, 04021037. [Google Scholar] [CrossRef]
- Oller, E.; Pujol, M.; Marí, A. Contribution of externally bonded FRP shear reinforcement to the shear strength of RC beams. Compos. Part B Eng. 2019, 164, 235–248. [Google Scholar] [CrossRef]
- CNR-DT-200/R1; Istruzioni per la Progettazione, l’Esecuzione ed il Controllo di Interventi di Consolidamento Statico Mediante l’Utilizzo di Compositi Fibrorinforzati. CNR (Consiglio Nazionale delle Ricerche—National Research Council): Rome, Italy, 2013. (In Italian)
- Khalifa, A.; Nanni, A. Improving shear capacity of existing RC T-section beams using CFRP composites. Cem. Concr. Compos. 2000, 22, 165–174. [Google Scholar] [CrossRef]
- Khalifa, A.; Nanni, A. Rehabilitation of rectangular simply supported RC beams with shear deficiencies using CFRP composites. Constr. Build. Mater. 2002, 16, 135–146. [Google Scholar] [CrossRef]
- Pellegrino, C.; Modena, C. Fiber-reinforced polymer shear strengthening of reinforced concrete beams: Experimental study and analytical modeling. ACI Struct. J. 2006, 103, 720–728. [Google Scholar] [CrossRef]
- Chen, J.F.; Teng, J.G. Shear capacity of fiber-reinforced polymer-strengthened reinforced concrete beams: Fiber reinforced polymer rupture. J. Struct. Eng. 2003, 129, 615–625. [Google Scholar] [CrossRef]
- ACI (American Concrete Institute). ACI 318-14; Building Code Requirements for Structural Concrete and Commentary. ACI: Farmington Hills, MI, USA, 2014.
- CEN (European Committee for Standardization). EN1992-1-1; Design of Concrete Structures, Part 1.1: General Rules and Rules for Buildings. CEN: Brussels, Belgium, 2004.
- CNR-DT 215/2018; Guide for the Design and Construction of Externally Bonded Fibre Reinforced Inorganic Matrix Systems for Strengthening Existing Structures. CNR (Advisory Committee on Technical Recommendations for Construction—National Research Council): Rome, Italy, 2020.
- Colajanni, P.; La Mendola, L.; Mancini, G.; Recupero, A.; Spinella, N. Shear capacity in concrete beams reinforced by stirrups with two different inclinations. Eng. Struct. 2014, 81, 444–453. [Google Scholar] [CrossRef] [Green Version]
- Colajanni, P.; La Mendola, L.; Monaco, A.; Pagnotta, S. Seismic Performance of Earthquake-Resilient RC Frames Made with HSTC Beams and Friction Damper Devices. J. Earthq. Eng. 2021; 1–27, in press. [Google Scholar] [CrossRef]
- Ali, M.S.M.; Oehlers, D.J.; Seracino, R. Vertical shear interaction model between external FRP transverse plates and internal steel stirrups. Eng. Struct. 2006, 28, 381–389. [Google Scholar] [CrossRef]
- Pellegrino, C.; Modena, C. An experimentally based analytical model for the shear capacity of FRP-strengthened reinforced concrete beams. Mech. Compos. Mater. 2008, 44, 231–244. [Google Scholar] [CrossRef]
- Grande, E.; Imbimbo, M.; Rasulo, A. Effect of transverse steel on the response of RC beams strengthened in shear by FRP: Experimental study. J. Compos. Constr. 2009, 13, 405–414. [Google Scholar] [CrossRef]
- Mofidi, A.; Chaallal, O. Shear strengthening of RC beams with EB FRP: Influencing factors and conceptual debonding model. J. Compos. Constr. 2011, 15, 62–74. [Google Scholar] [CrossRef]
- FIB (Fédération Internationale du Béton—International Federation for Structural Concrete). Externally Applied FRP Reinforcement for Concrete Structures; Fib Bulletin 90; FIB: Lausanne, Switzerland, 2019. [Google Scholar]
- Mofidi, A.; Chaallal, O. Tests and design provisions for reinforced-concrete beams strengthened in shear using FRP sheets and strips. J. Concrete Struct. Mater. 2014, 8, 117–128. [Google Scholar] [CrossRef] [Green Version]
- Sato, Y.; Ueda, T.; Kakuta, Y.; Ono, S. Ultimate shear capacity of reinforced concrete beams with carbon fiber sheet. In Proceedings of the Third International Symposium of Non-Metallic(FRP)Reinforcement for Concrete Structures, Sapporo, Japan, 14–16 October 1997; Japan Concrete Institute: Tokyo, Japan, 1997; pp. 499–506. [Google Scholar]
- Deniaud, C.; Cheng, J.J.R. Shear behavior of reinforced concrete T-beams with externally bonded fiber-reinforced polymer sheets. ACI Struct. J. 2001, 98, 386–394. [Google Scholar] [CrossRef]
- Deniaud, C.; Cheng, J.J.R. Reinforced concrete T-beams strengthened in shear with fiber reinforced polymer sheets. J. Compos. Constr. 2003, 7, 302–310. [Google Scholar] [CrossRef]
- Bousselham, A.; Chaallal, O. Behavior of reinforced concrete T-beams strengthened in shear with carbon fiber-reinforced polymer—An experimental study. ACI Struct. J. 2006, 103, 339–347. [Google Scholar] [CrossRef]
- Leung, C.K.Y.; Chen, Z.; Lee, S.; Ng, M.; Xu, M.; Tang, J. Effect of size on the failure of geometrically similar concrete beams strengthened in shear with FRP strips. J. Compos. Constr. 2007, 11, 487–496. [Google Scholar] [CrossRef]
- Panda, K.C.; Bhattacharyya, S.K.; Barai, S.V. Effect of transverse steel on the performance of RC T-beams strengthened in shear zone with GFRP sheet. Constr. Build. Mater. 2013, 41, 79–90. [Google Scholar] [CrossRef]
- Baggio, D.; Soudki, K.; Noël, M. Strengthening of shear critical RC beams with various FRP systems. Constr. Build. Mater. 2014, 66, 634–644. [Google Scholar] [CrossRef]
- Colalillo, M.A.; Sheikh, S.A. Behavior of shear-critical RC beams strengthened with FRP—experimentation. ACI Struct. J. 2014, 111, 1373–1384. [Google Scholar] [CrossRef]
- Ozden, S.; Atalay, H.M.; Akpinar, E.; Erdogan, H.; Vulaş, Y.Z. Shear strengthening of reinforced concrete T-beams with fully or partially bonded fibre-reinforced polymer composites. Struct. Concr. 2014, 15, 229–239. [Google Scholar] [CrossRef]
- Mofidi, A.; Thivierge, S.; Chaallal, O.; Shao, Y. Behavior of reinforced concrete beams strengthened in shear using L-shaped CFRP plates: Experimental investigation. J. Compos. Constr. 2014, 18, 04013033. [Google Scholar] [CrossRef]
- El-Saikaly, G.; Godat, A.; Chaallal, O. New anchorage technique for FRP shear-strengthened RC T-beams using CFRP rope. J. Compos. Constr. 2015, 19, 04014064. [Google Scholar] [CrossRef]
- Qin, S.; Dirar, S.; Yang, J.; Chan, A.H.C.; Lshafie, M. CFRP shear strengthening of reinforced-concrete T-beams with corroded shear links. J. Compos. Constr. 2015, 19, 04014081. [Google Scholar] [CrossRef] [Green Version]
- Chen, G.M.; Zhang, Z.; Li, Y.L.; Li, X.Q.; Zhou, C.Y. T-section RC beams shear-strengthened with anchored CFRP U-strips. Compos. Struct. 2016, 144, 57–79. [Google Scholar] [CrossRef]
- Frederick, F.F.R.; Sharma, U.K.; Gupta, V.K. Influence of end anchorage on shear strengthening of reinforced concrete beams using CFRP composites. Curr. Sci. 2017, 112, 973–981. [Google Scholar] [CrossRef]
- El-Saikaly, G.; Chaallal, O.; Benmokrane, B. Comparison of anchorage systems for RC T-beams strengthened in shear with EB-CFRP. In Proceedings of the 6th Asia-Pacific Conference on FRP in Structures, Singapore, 19–21 July 2017; International Institute for FRP in Construction: Singapore, 2017; pp. 1–5. [Google Scholar]
- Nguyen-Minh, L.; Vo-Le, D.; Tran-Thanh, D.; Pham, T.M.; Ho-Huu, C.; Rovnák, M. Shear capacity of unbonded post-tensioned concrete T-beams strengthened with CFRP and GFRP U-wraps. Compos. Struct. 2018, 184, 1011–1029. [Google Scholar] [CrossRef] [Green Version]
- Alzate, A.; Arteaga, A.; De Diego, A.; Cisneros, D.; Perera, R. Shear strengthening of reinforced concrete members with CFRP sheets. Mater. Constr. 2013, 63, 251–265. [Google Scholar] [CrossRef] [Green Version]
Publisher’s Note: MDPI stays neutral with regard to jurisdictional claims in published maps and institutional affiliations. |
© 2022 by the authors. Licensee MDPI, Basel, Switzerland. This article is an open access article distributed under the terms and conditions of the Creative Commons Attribution (CC BY) license (https://creativecommons.org/licenses/by/4.0/).