
Excess Lifetime Cancer Risk Associated with Granite Bearing Radioactive Minerals and Valuable Metals, Monqul Area, North Eastern Desert, Egypt

 ,
, 
Abstract
:1. Introduction
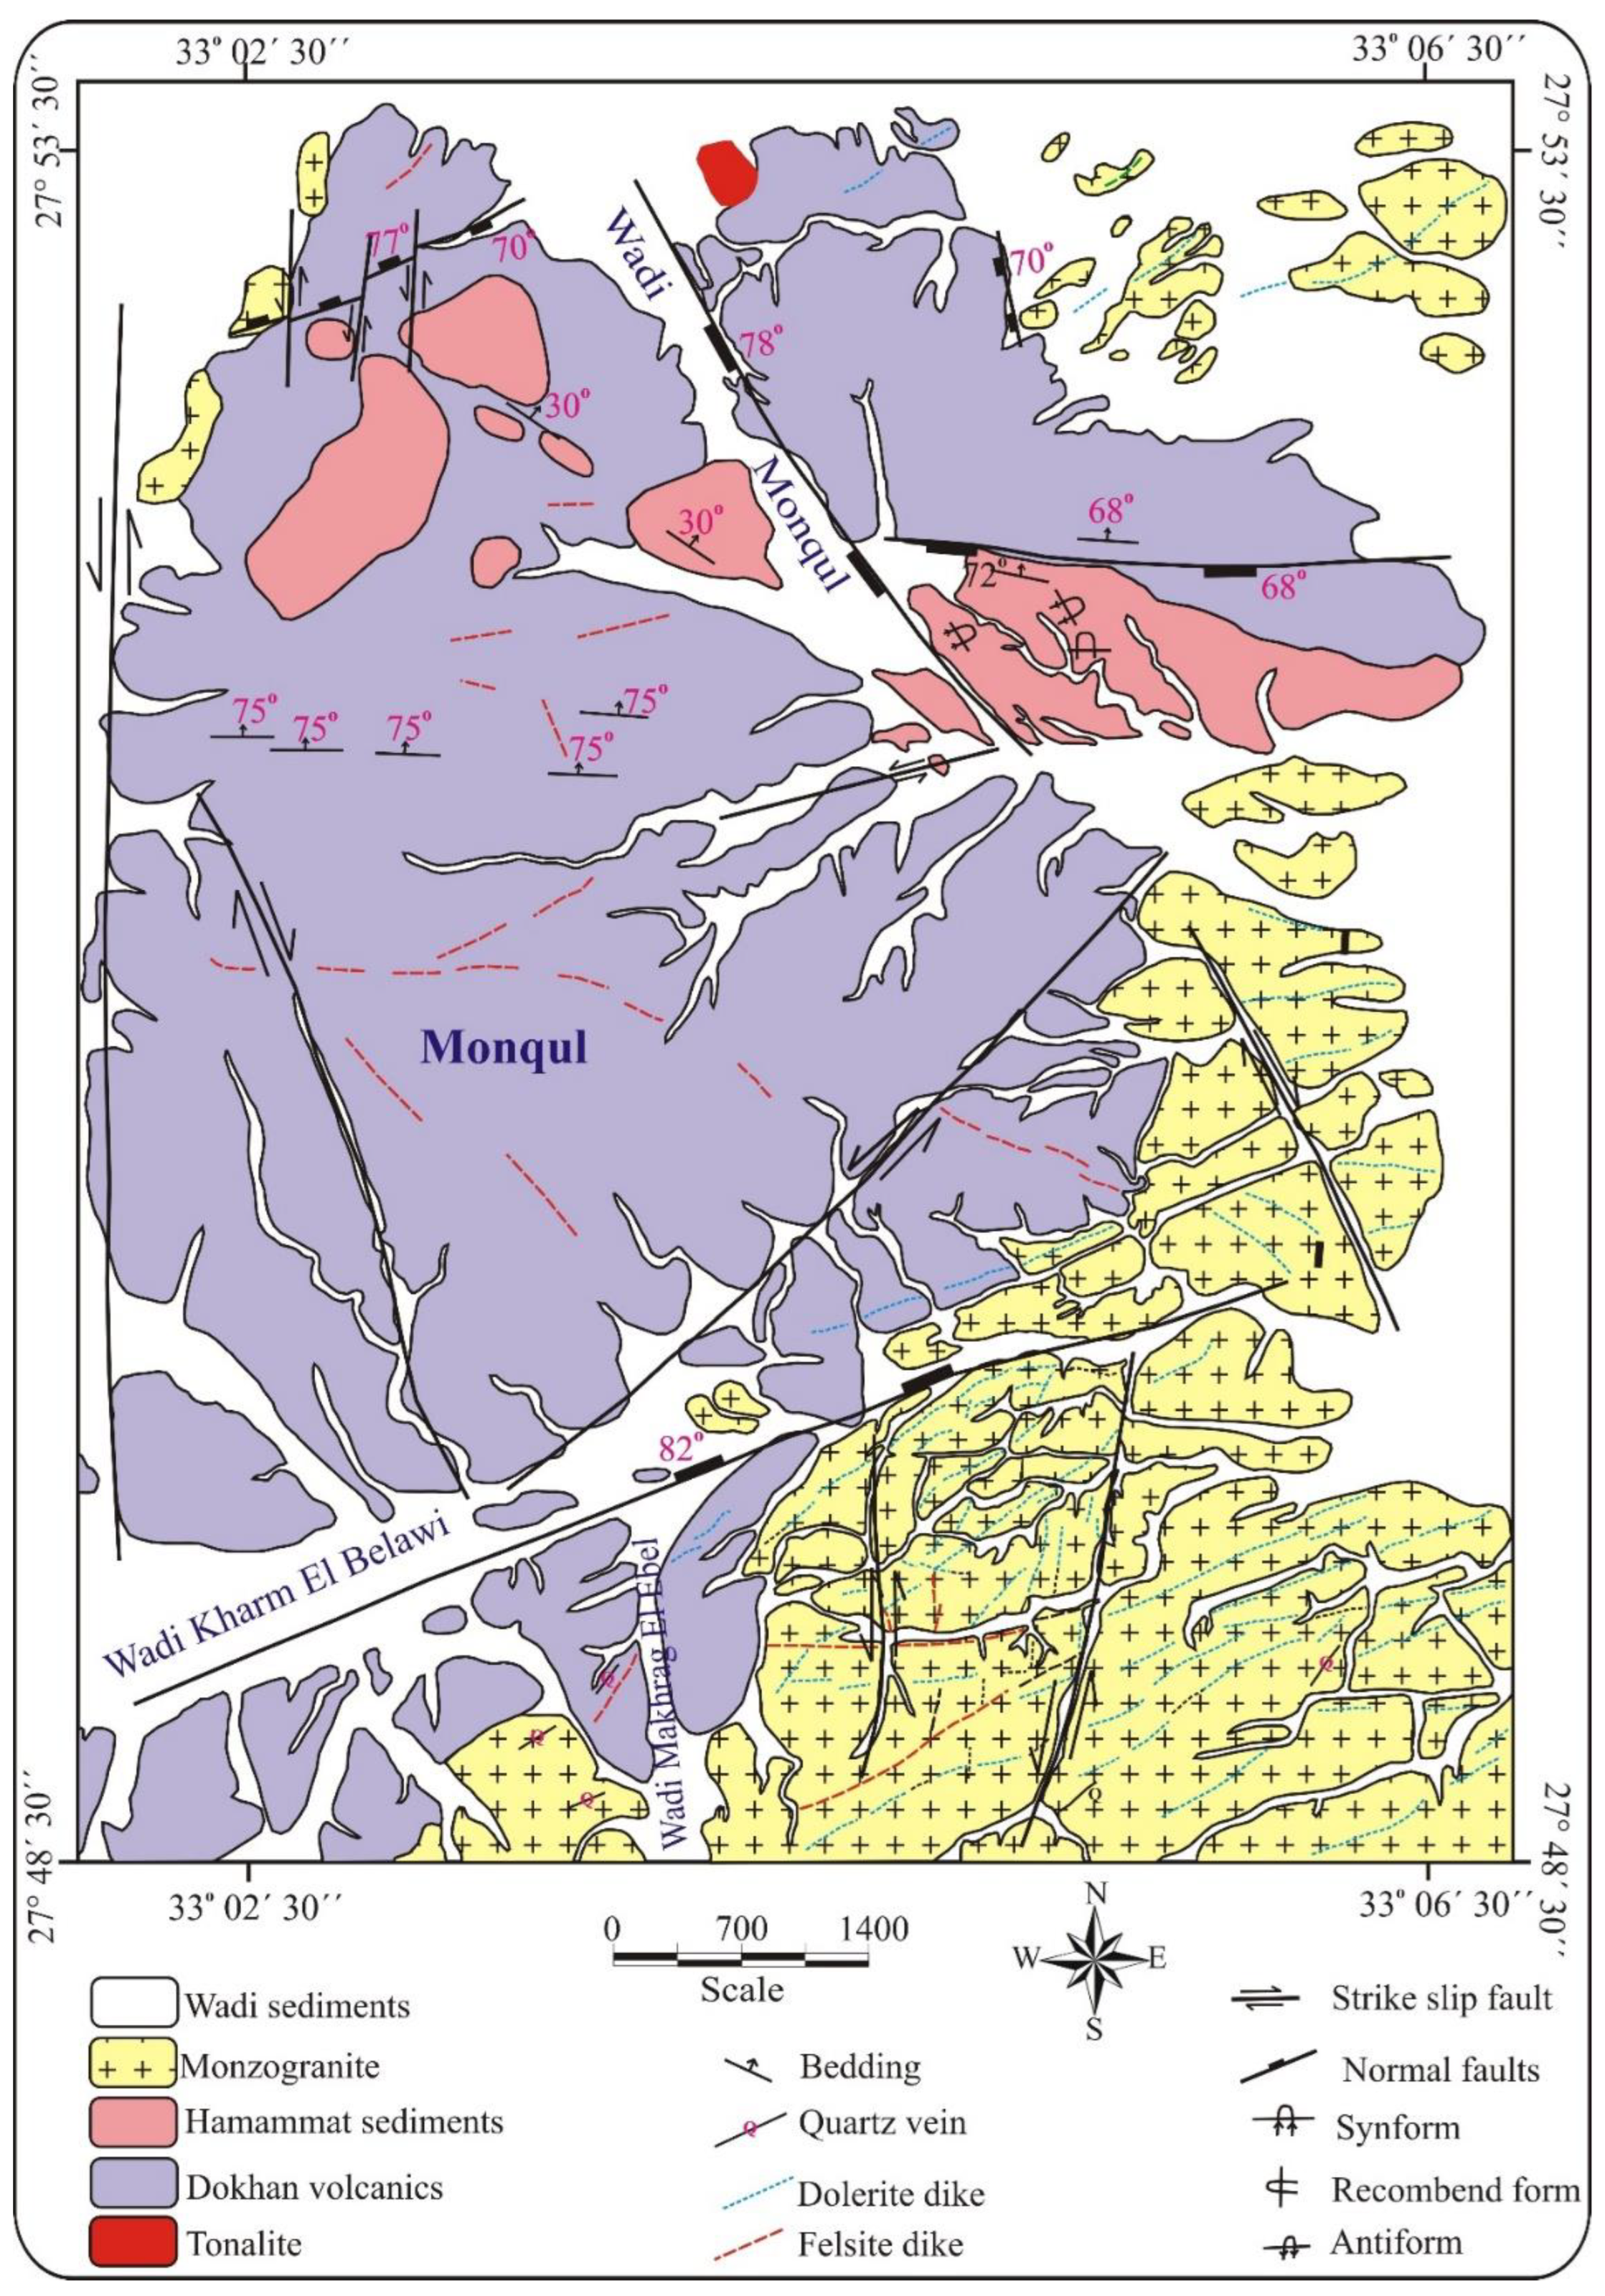
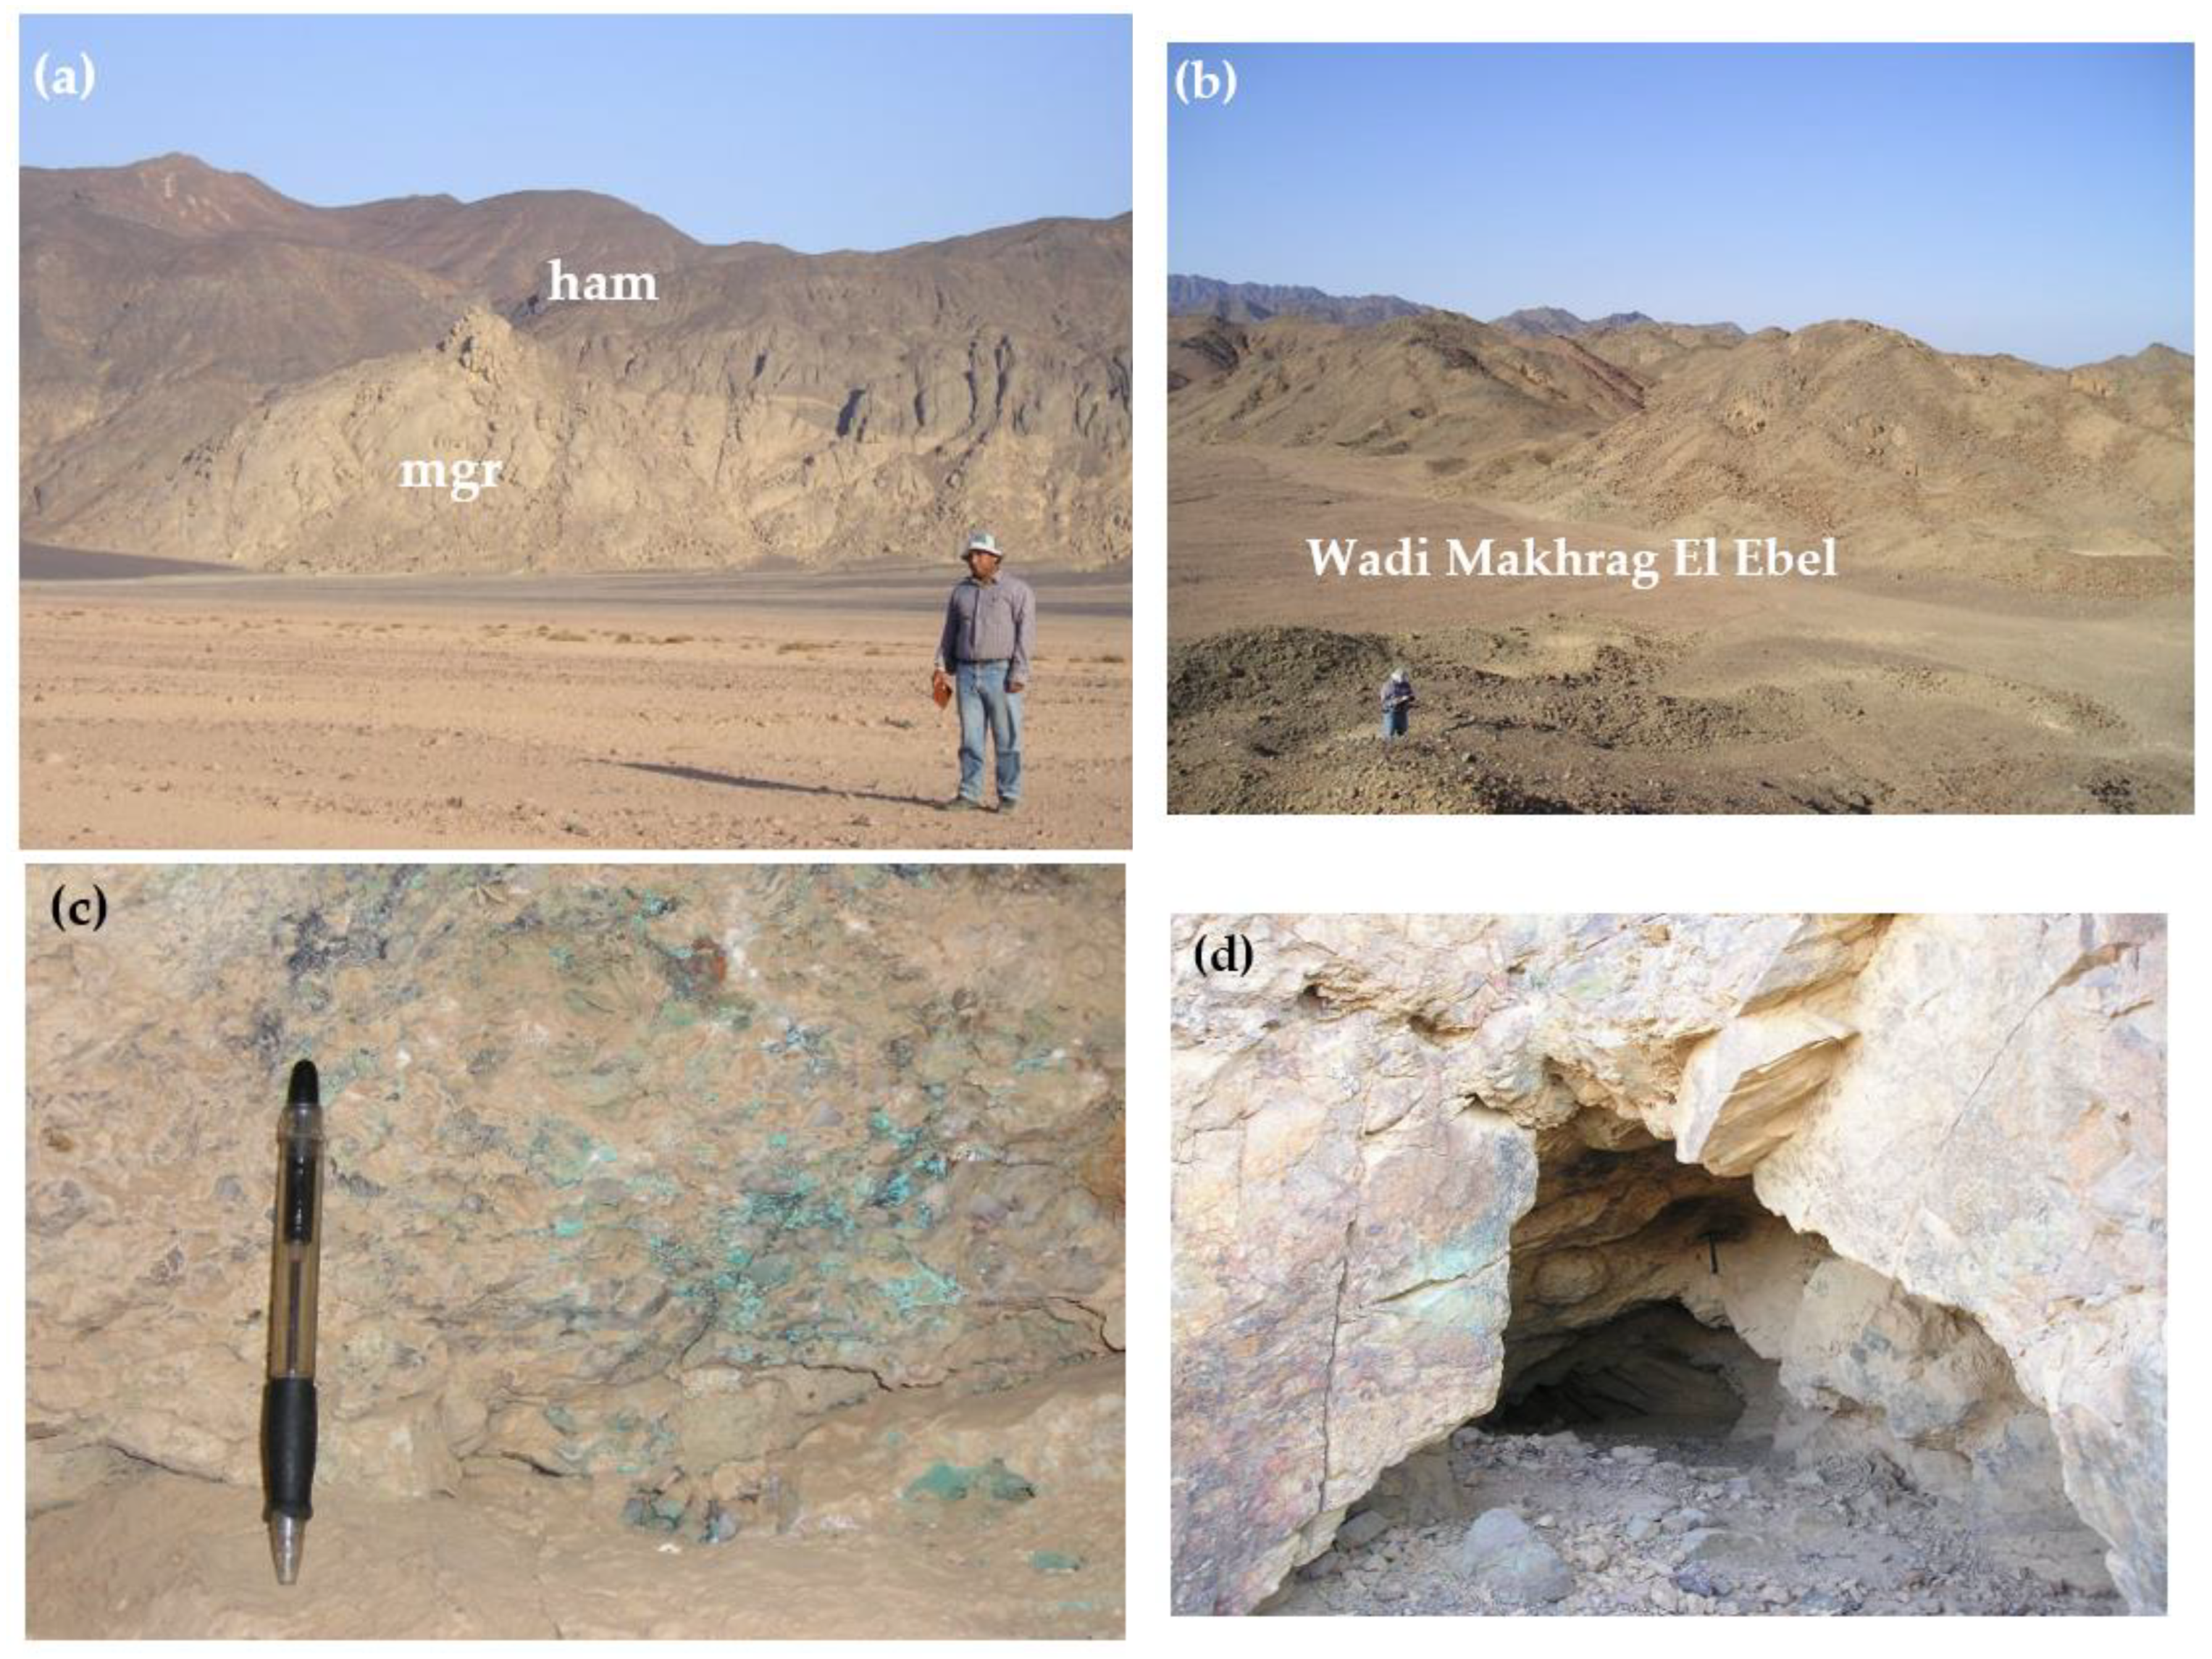
2. Geologic Setting
3. Materials and Methods
3.1. GS-256 Spectrometer
3.2. Heavy Minerals
3.3. Statistical Analysis
4. Results and Discussion
4.1. Mineralogical Features of Heavy Minerals
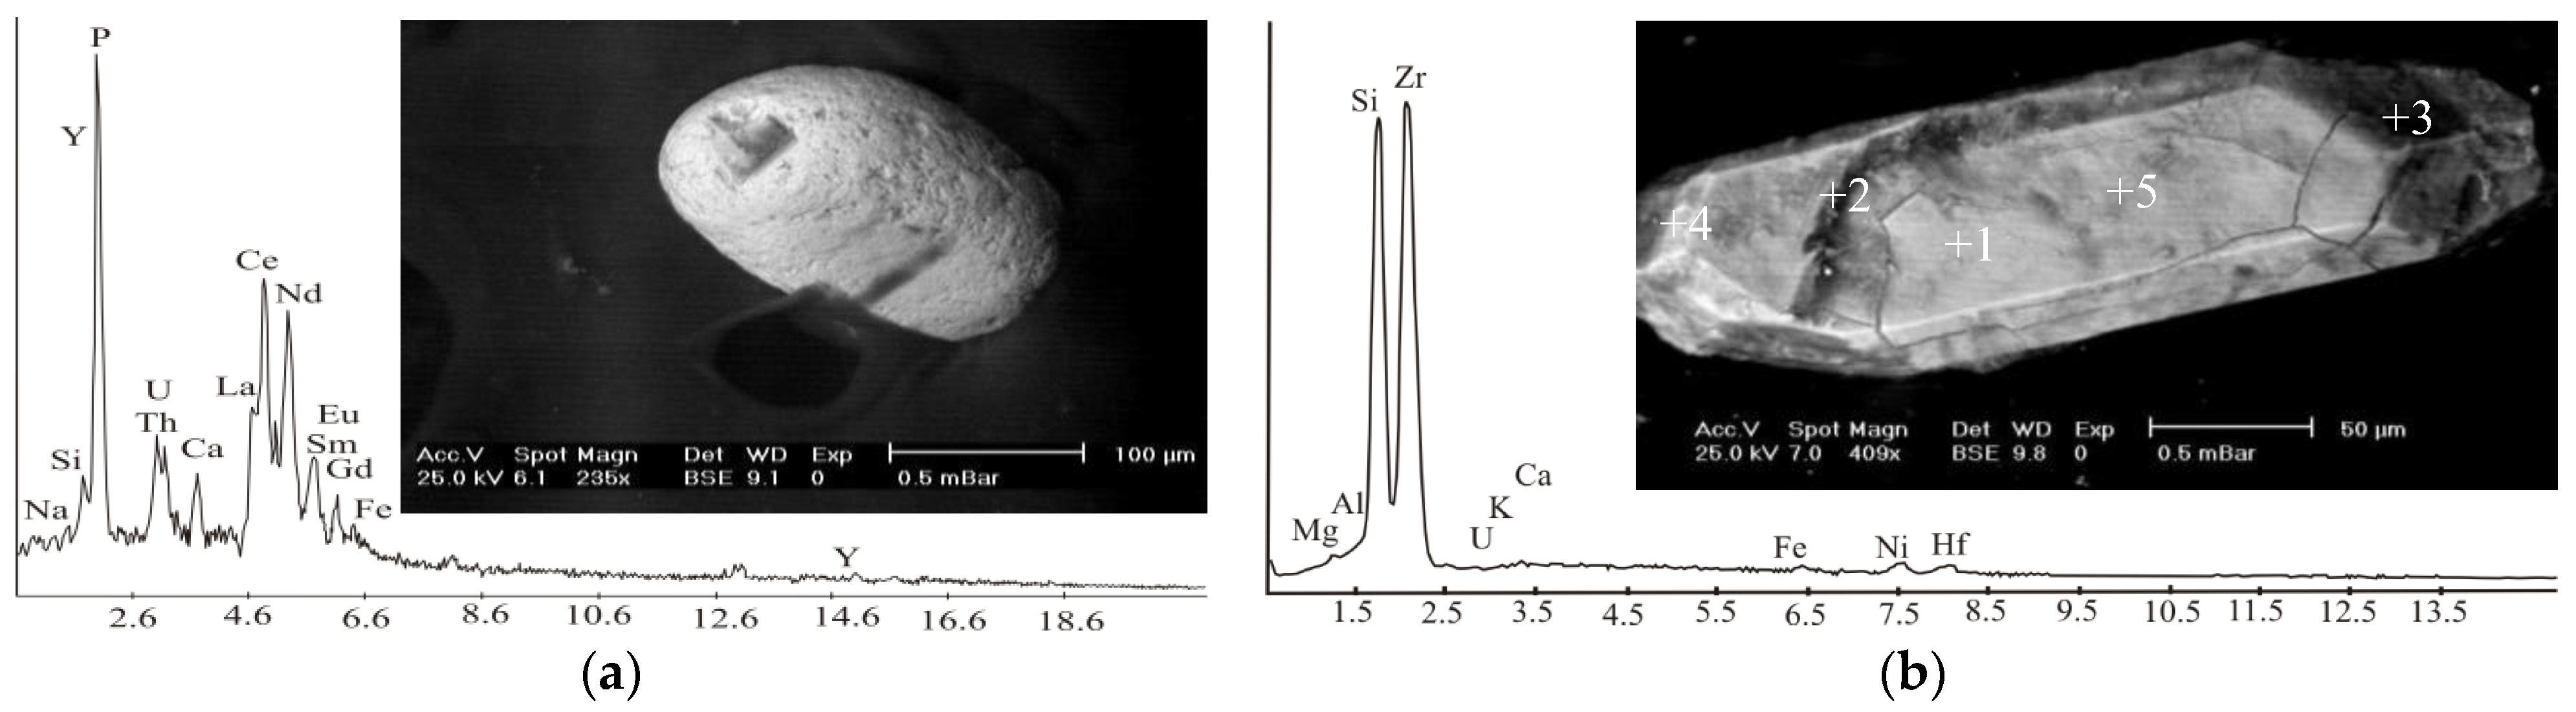
4.1.1. Radioactive-Bearing Minerals
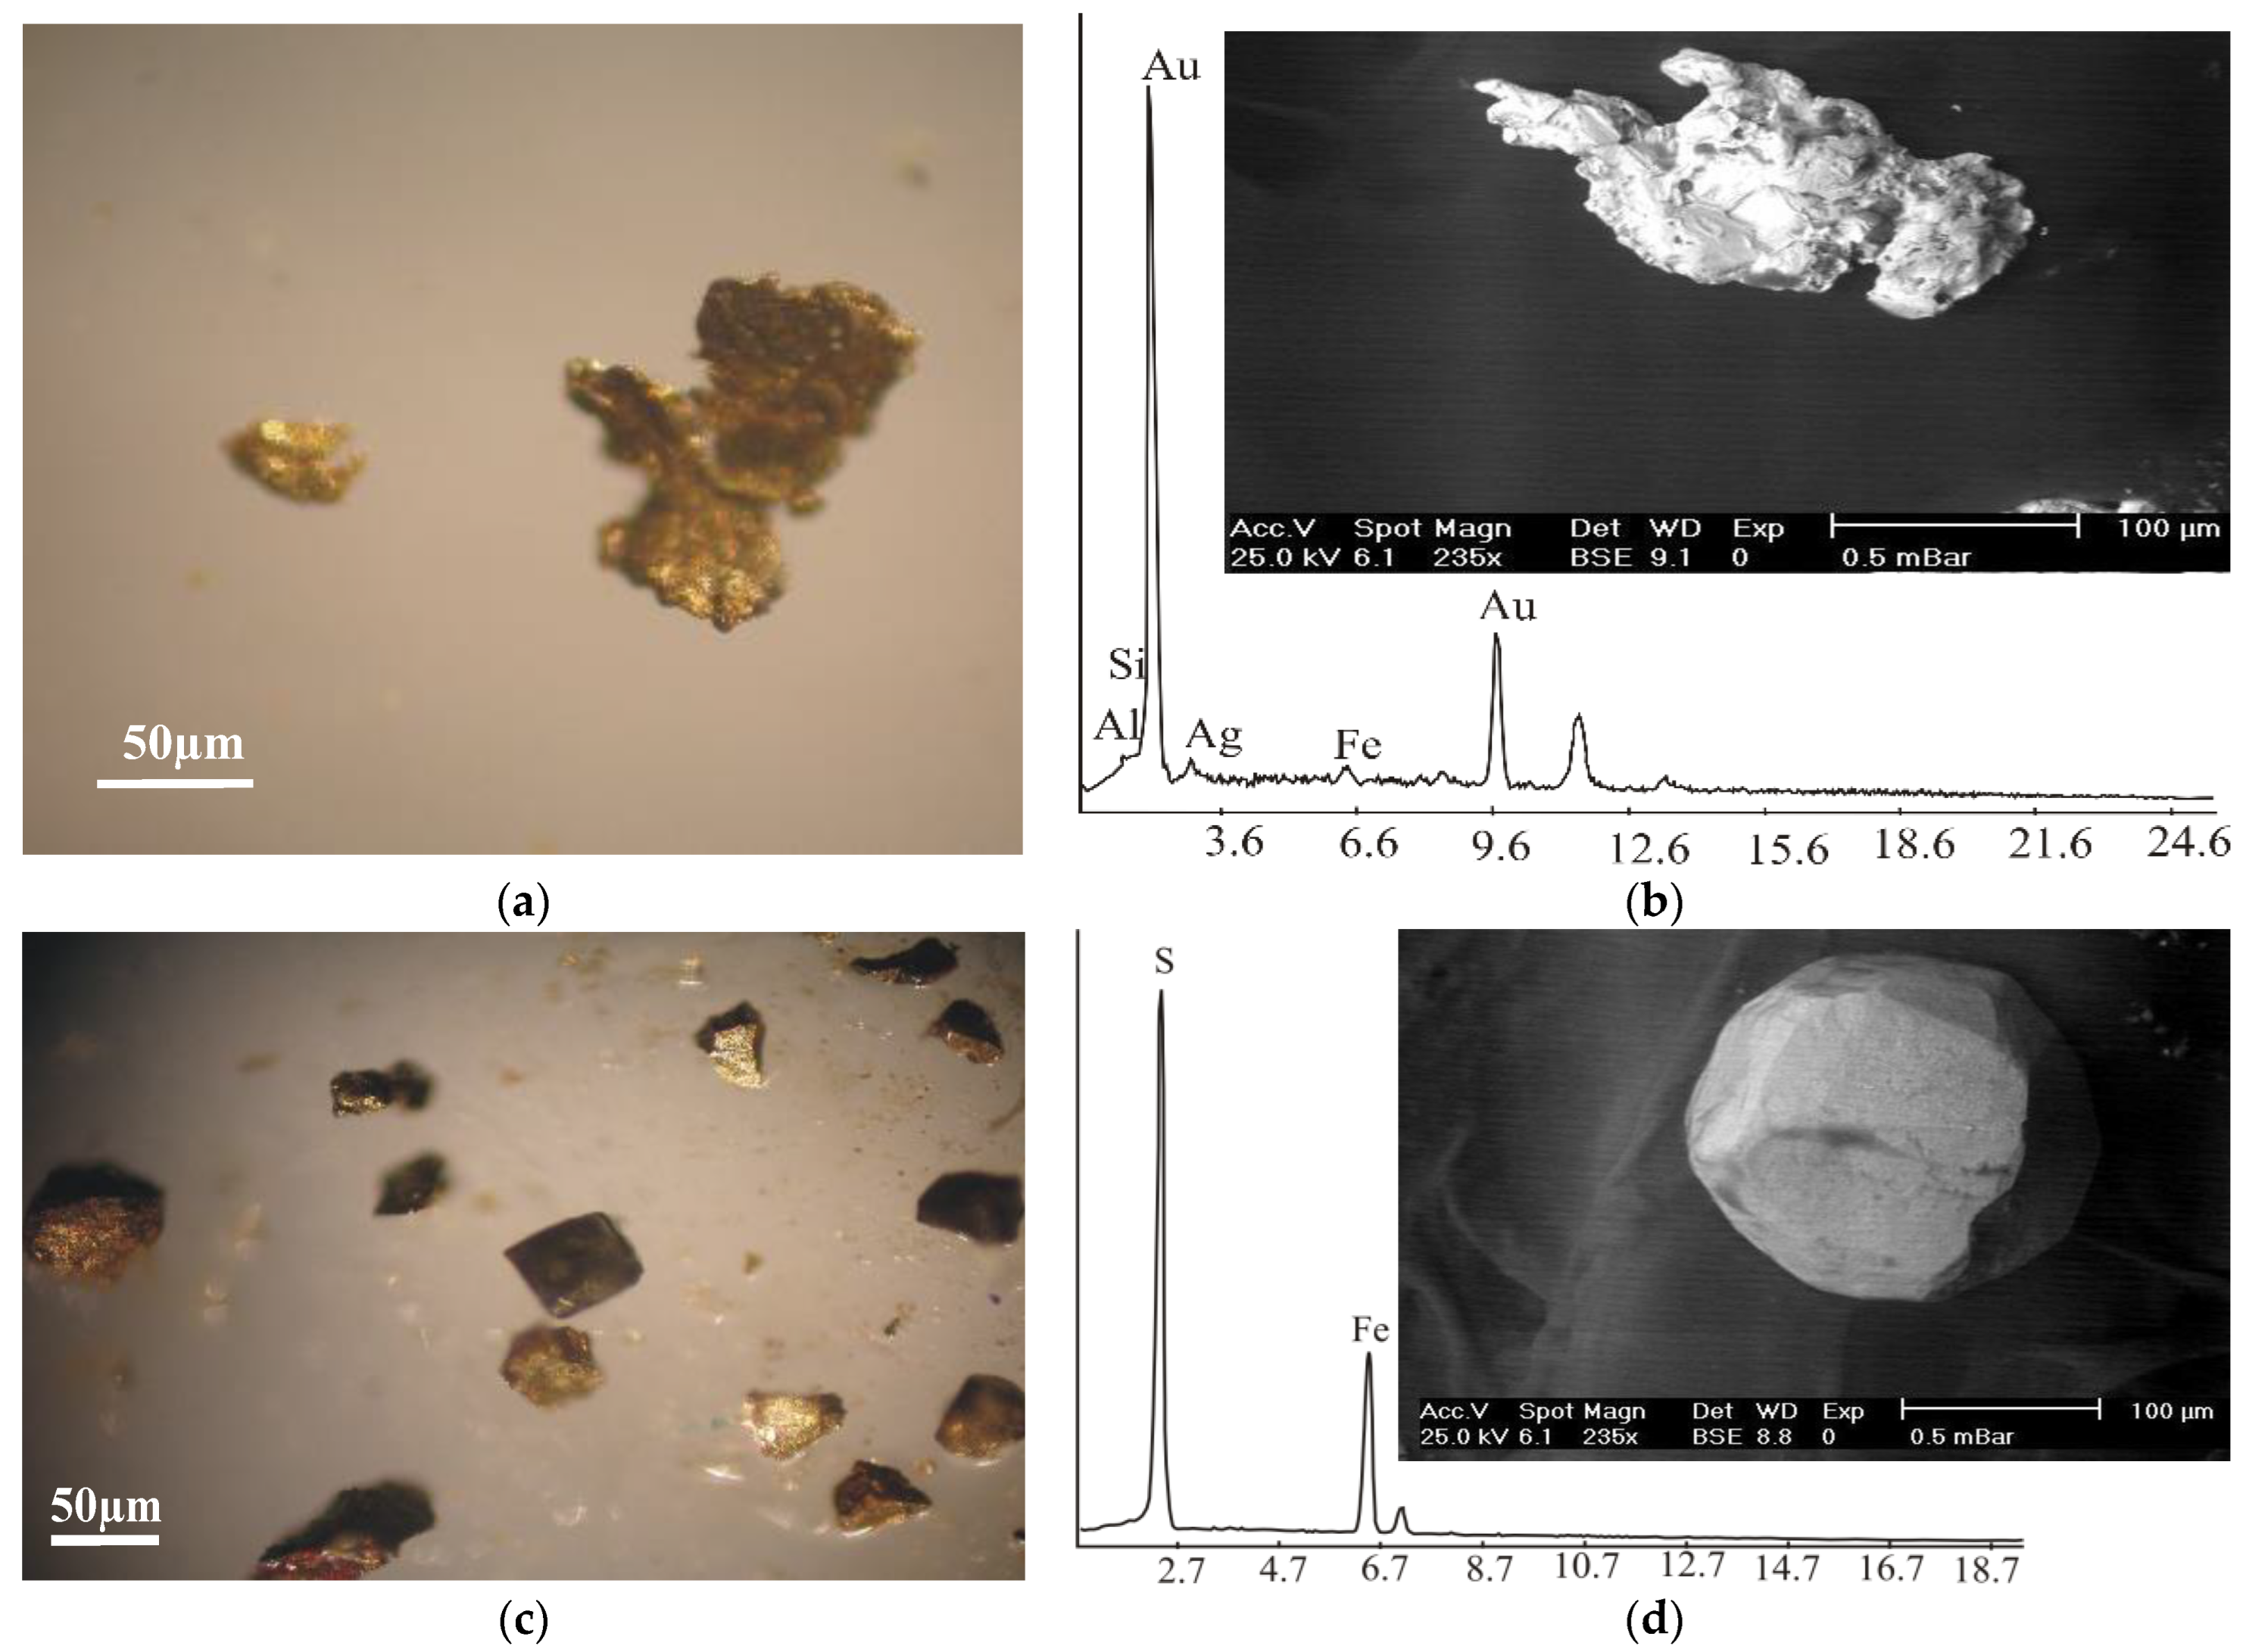
4.1.2. Other Accessory Minerals
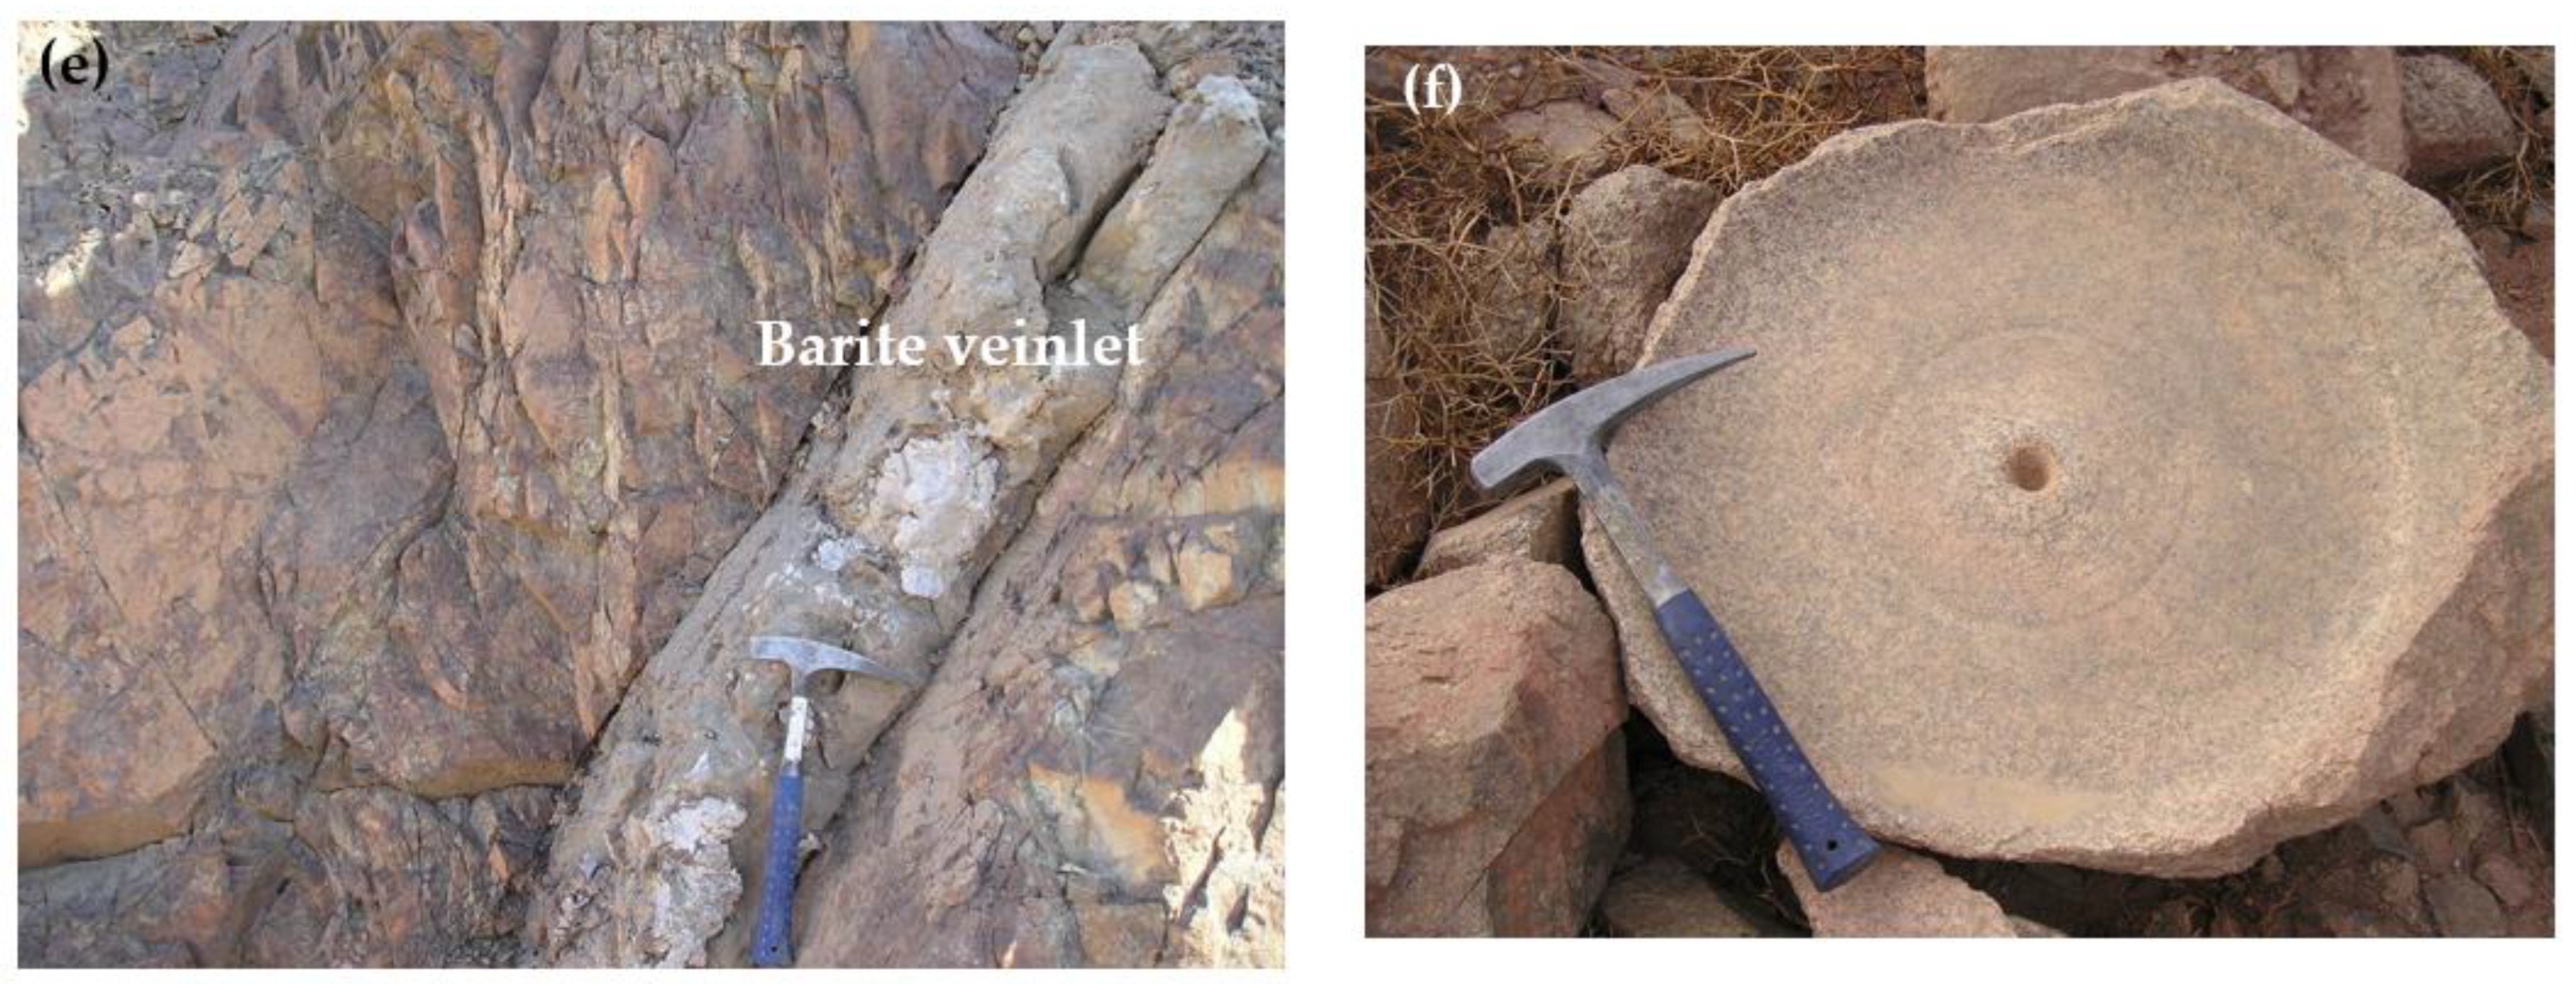
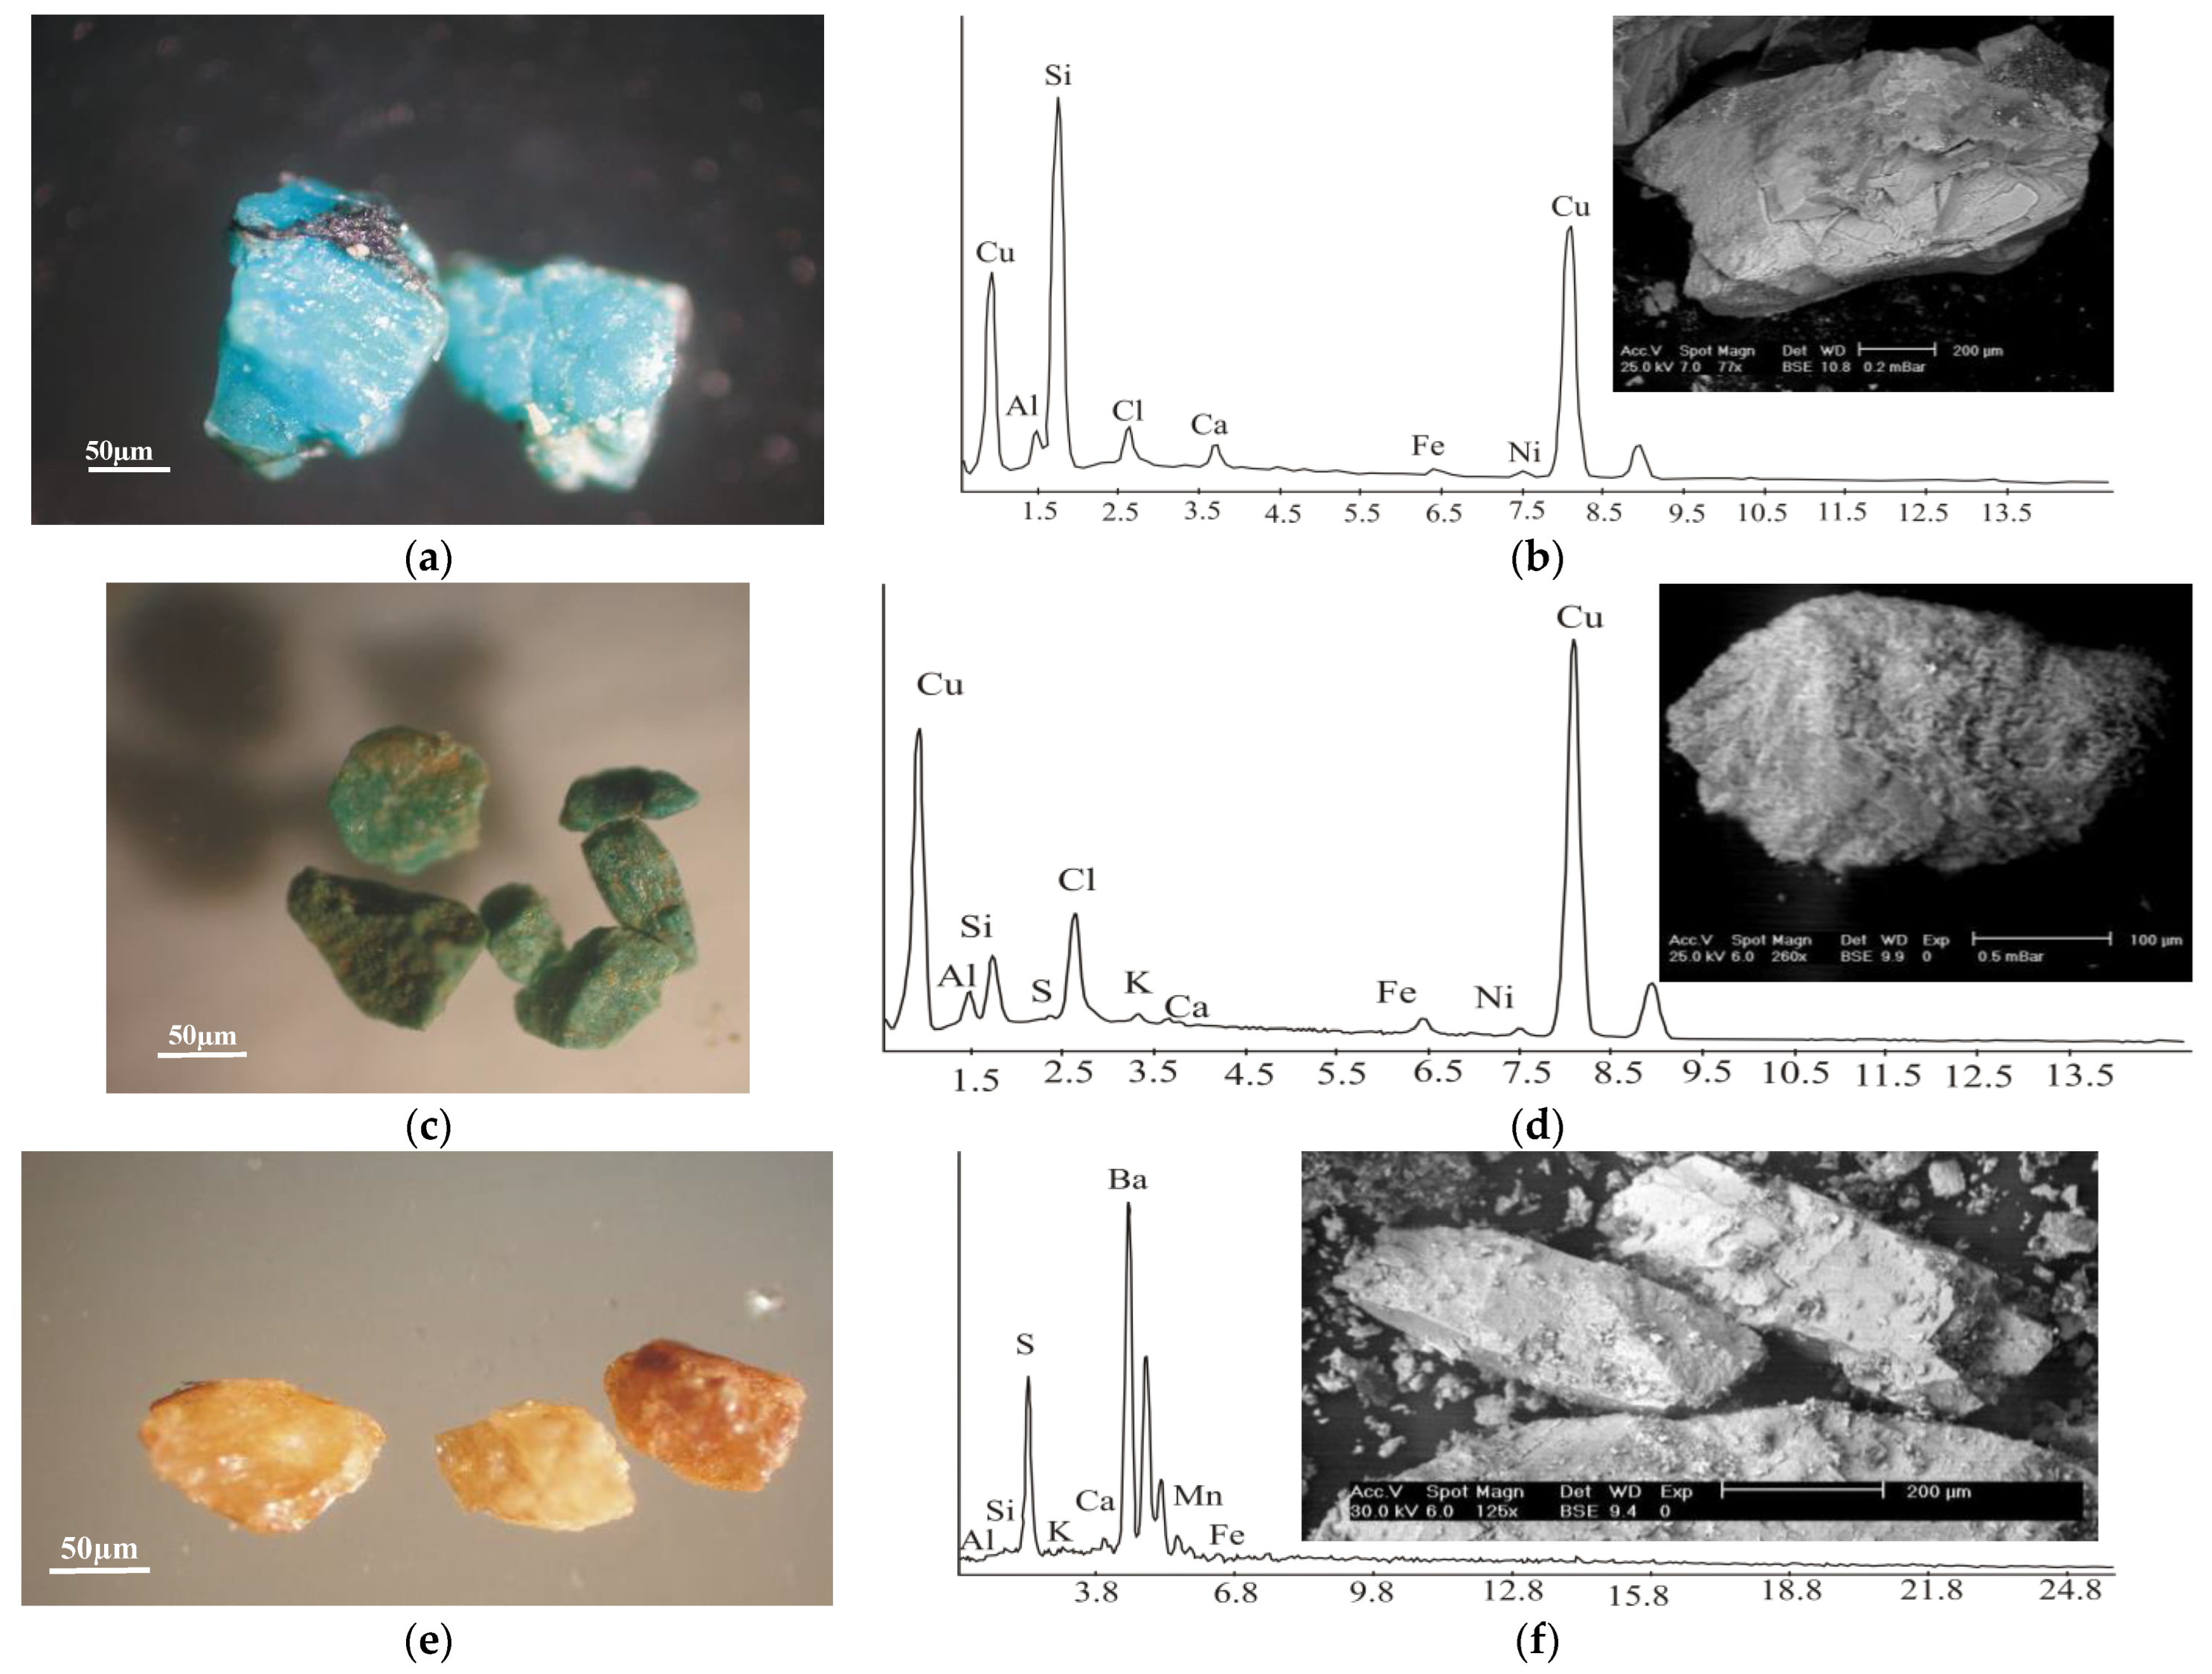
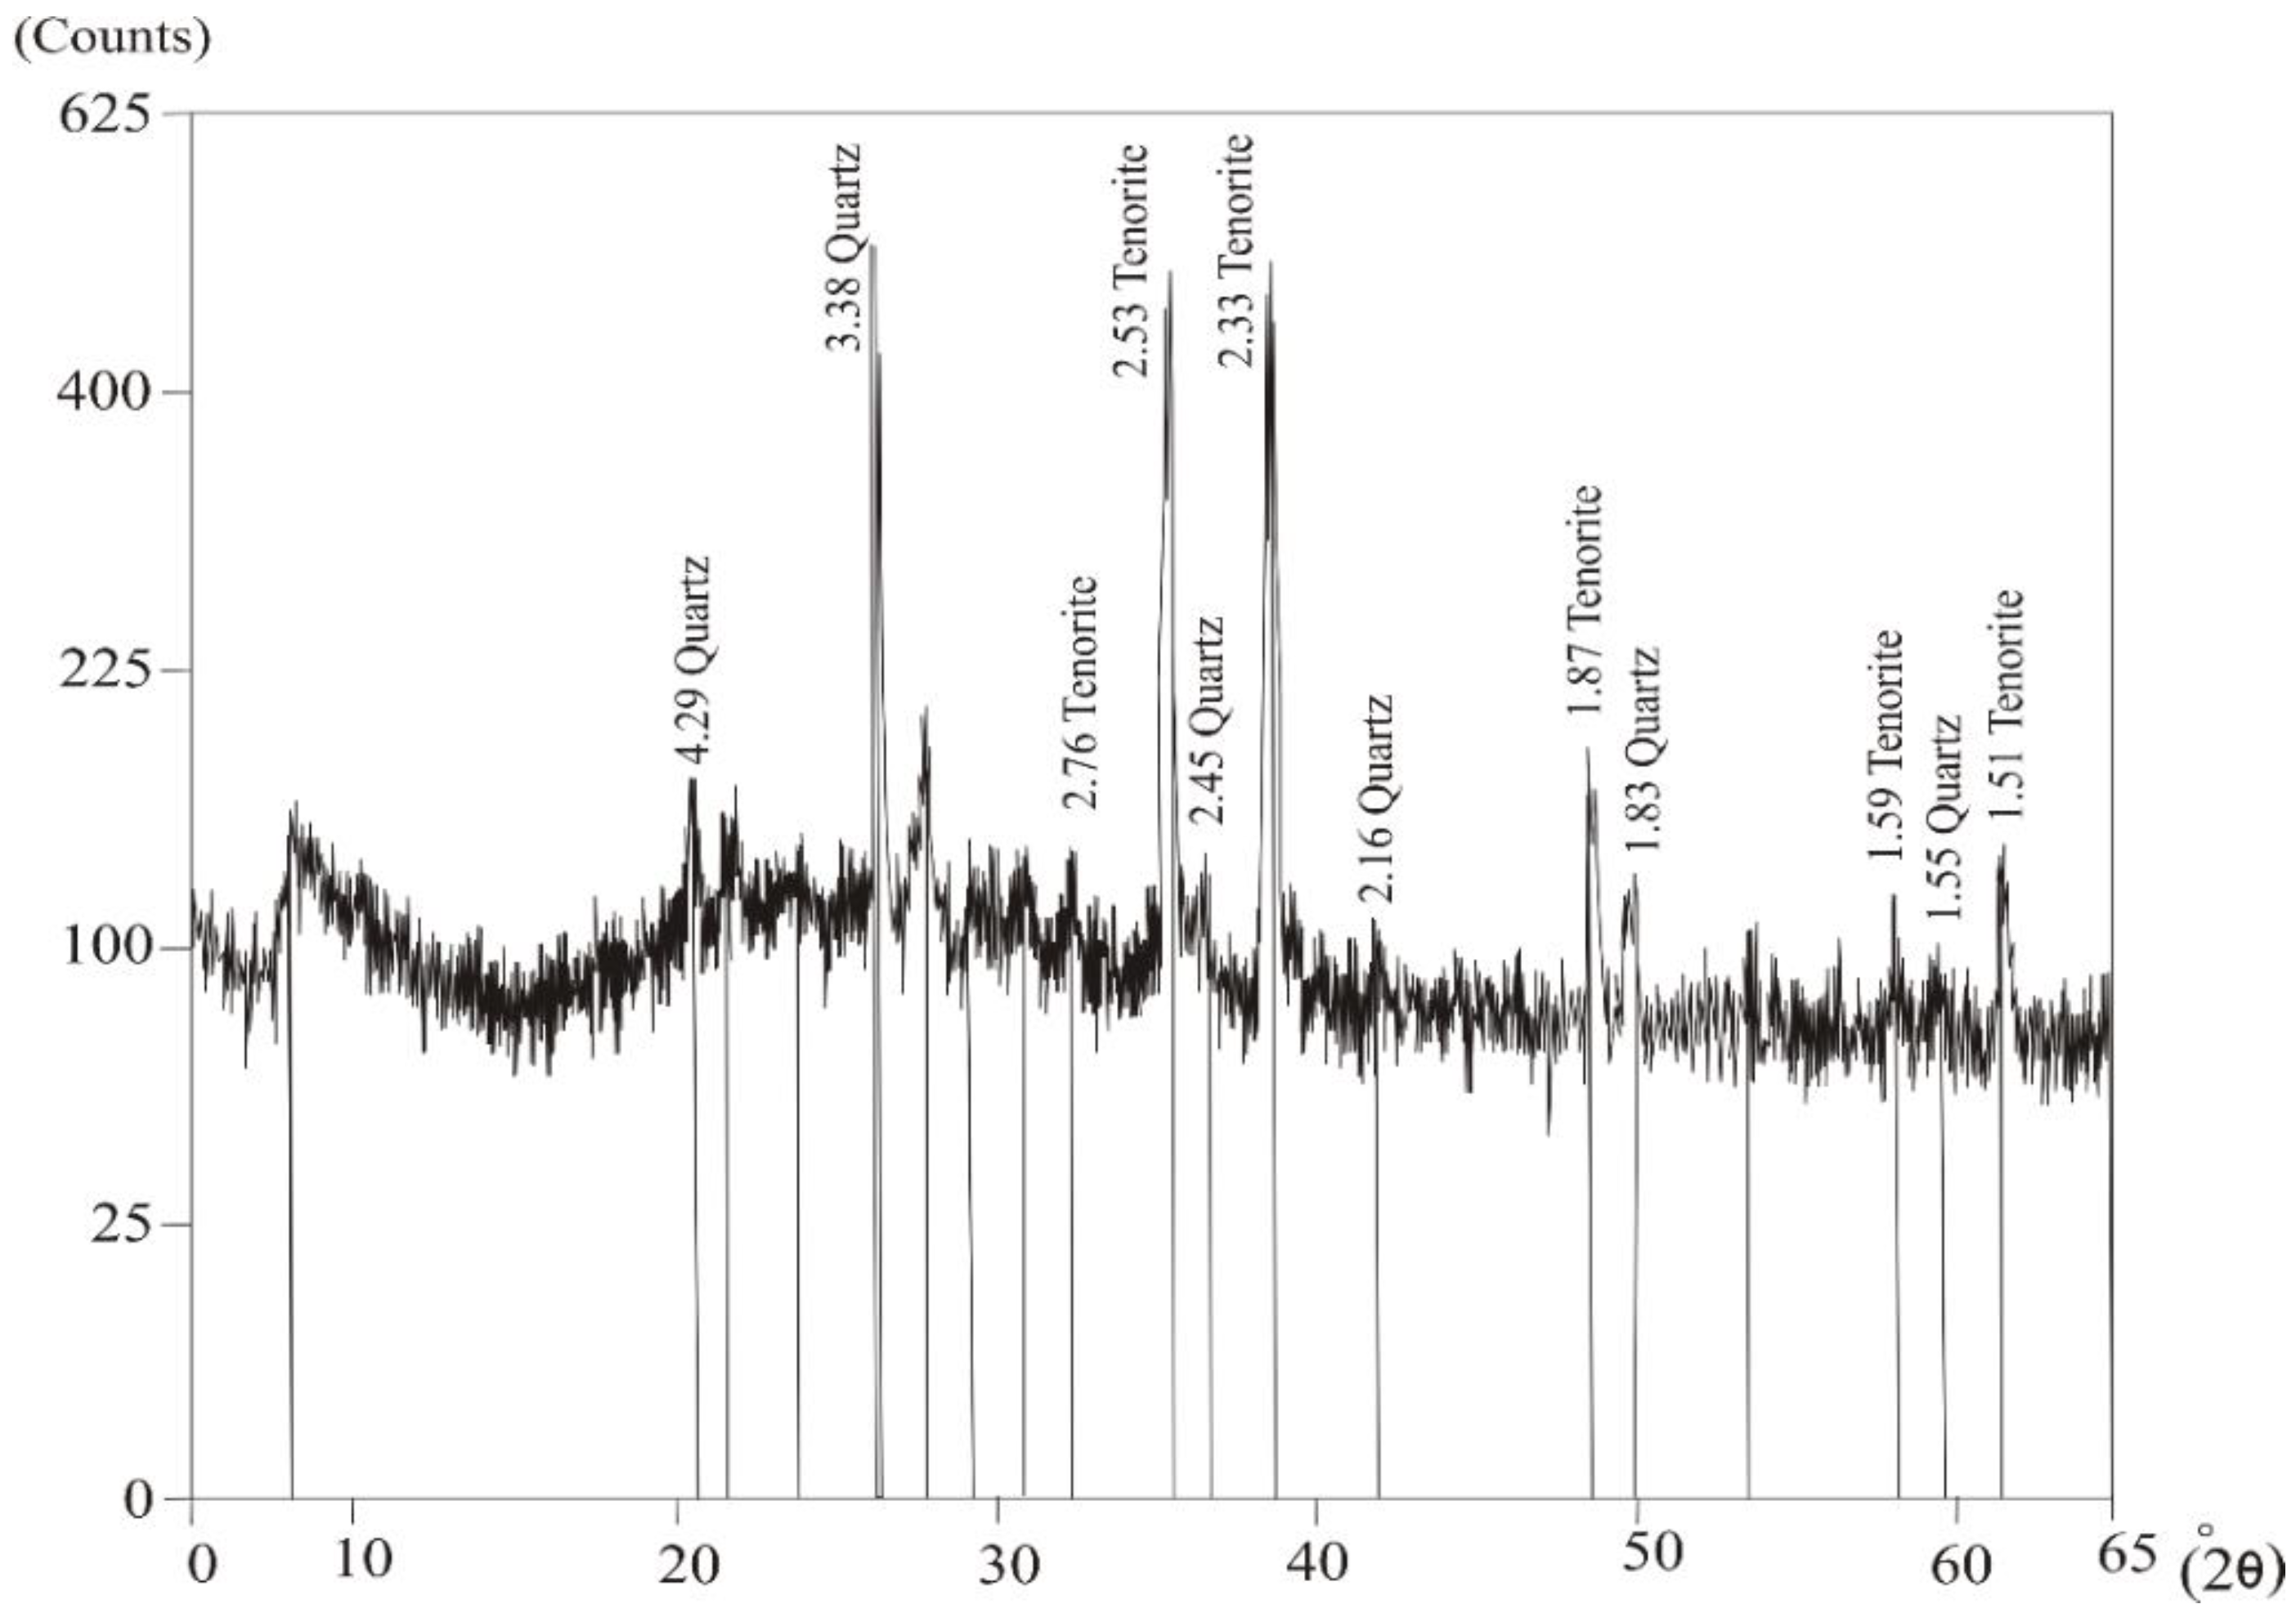
Copper Mineralization
4.2. Radiological Implications
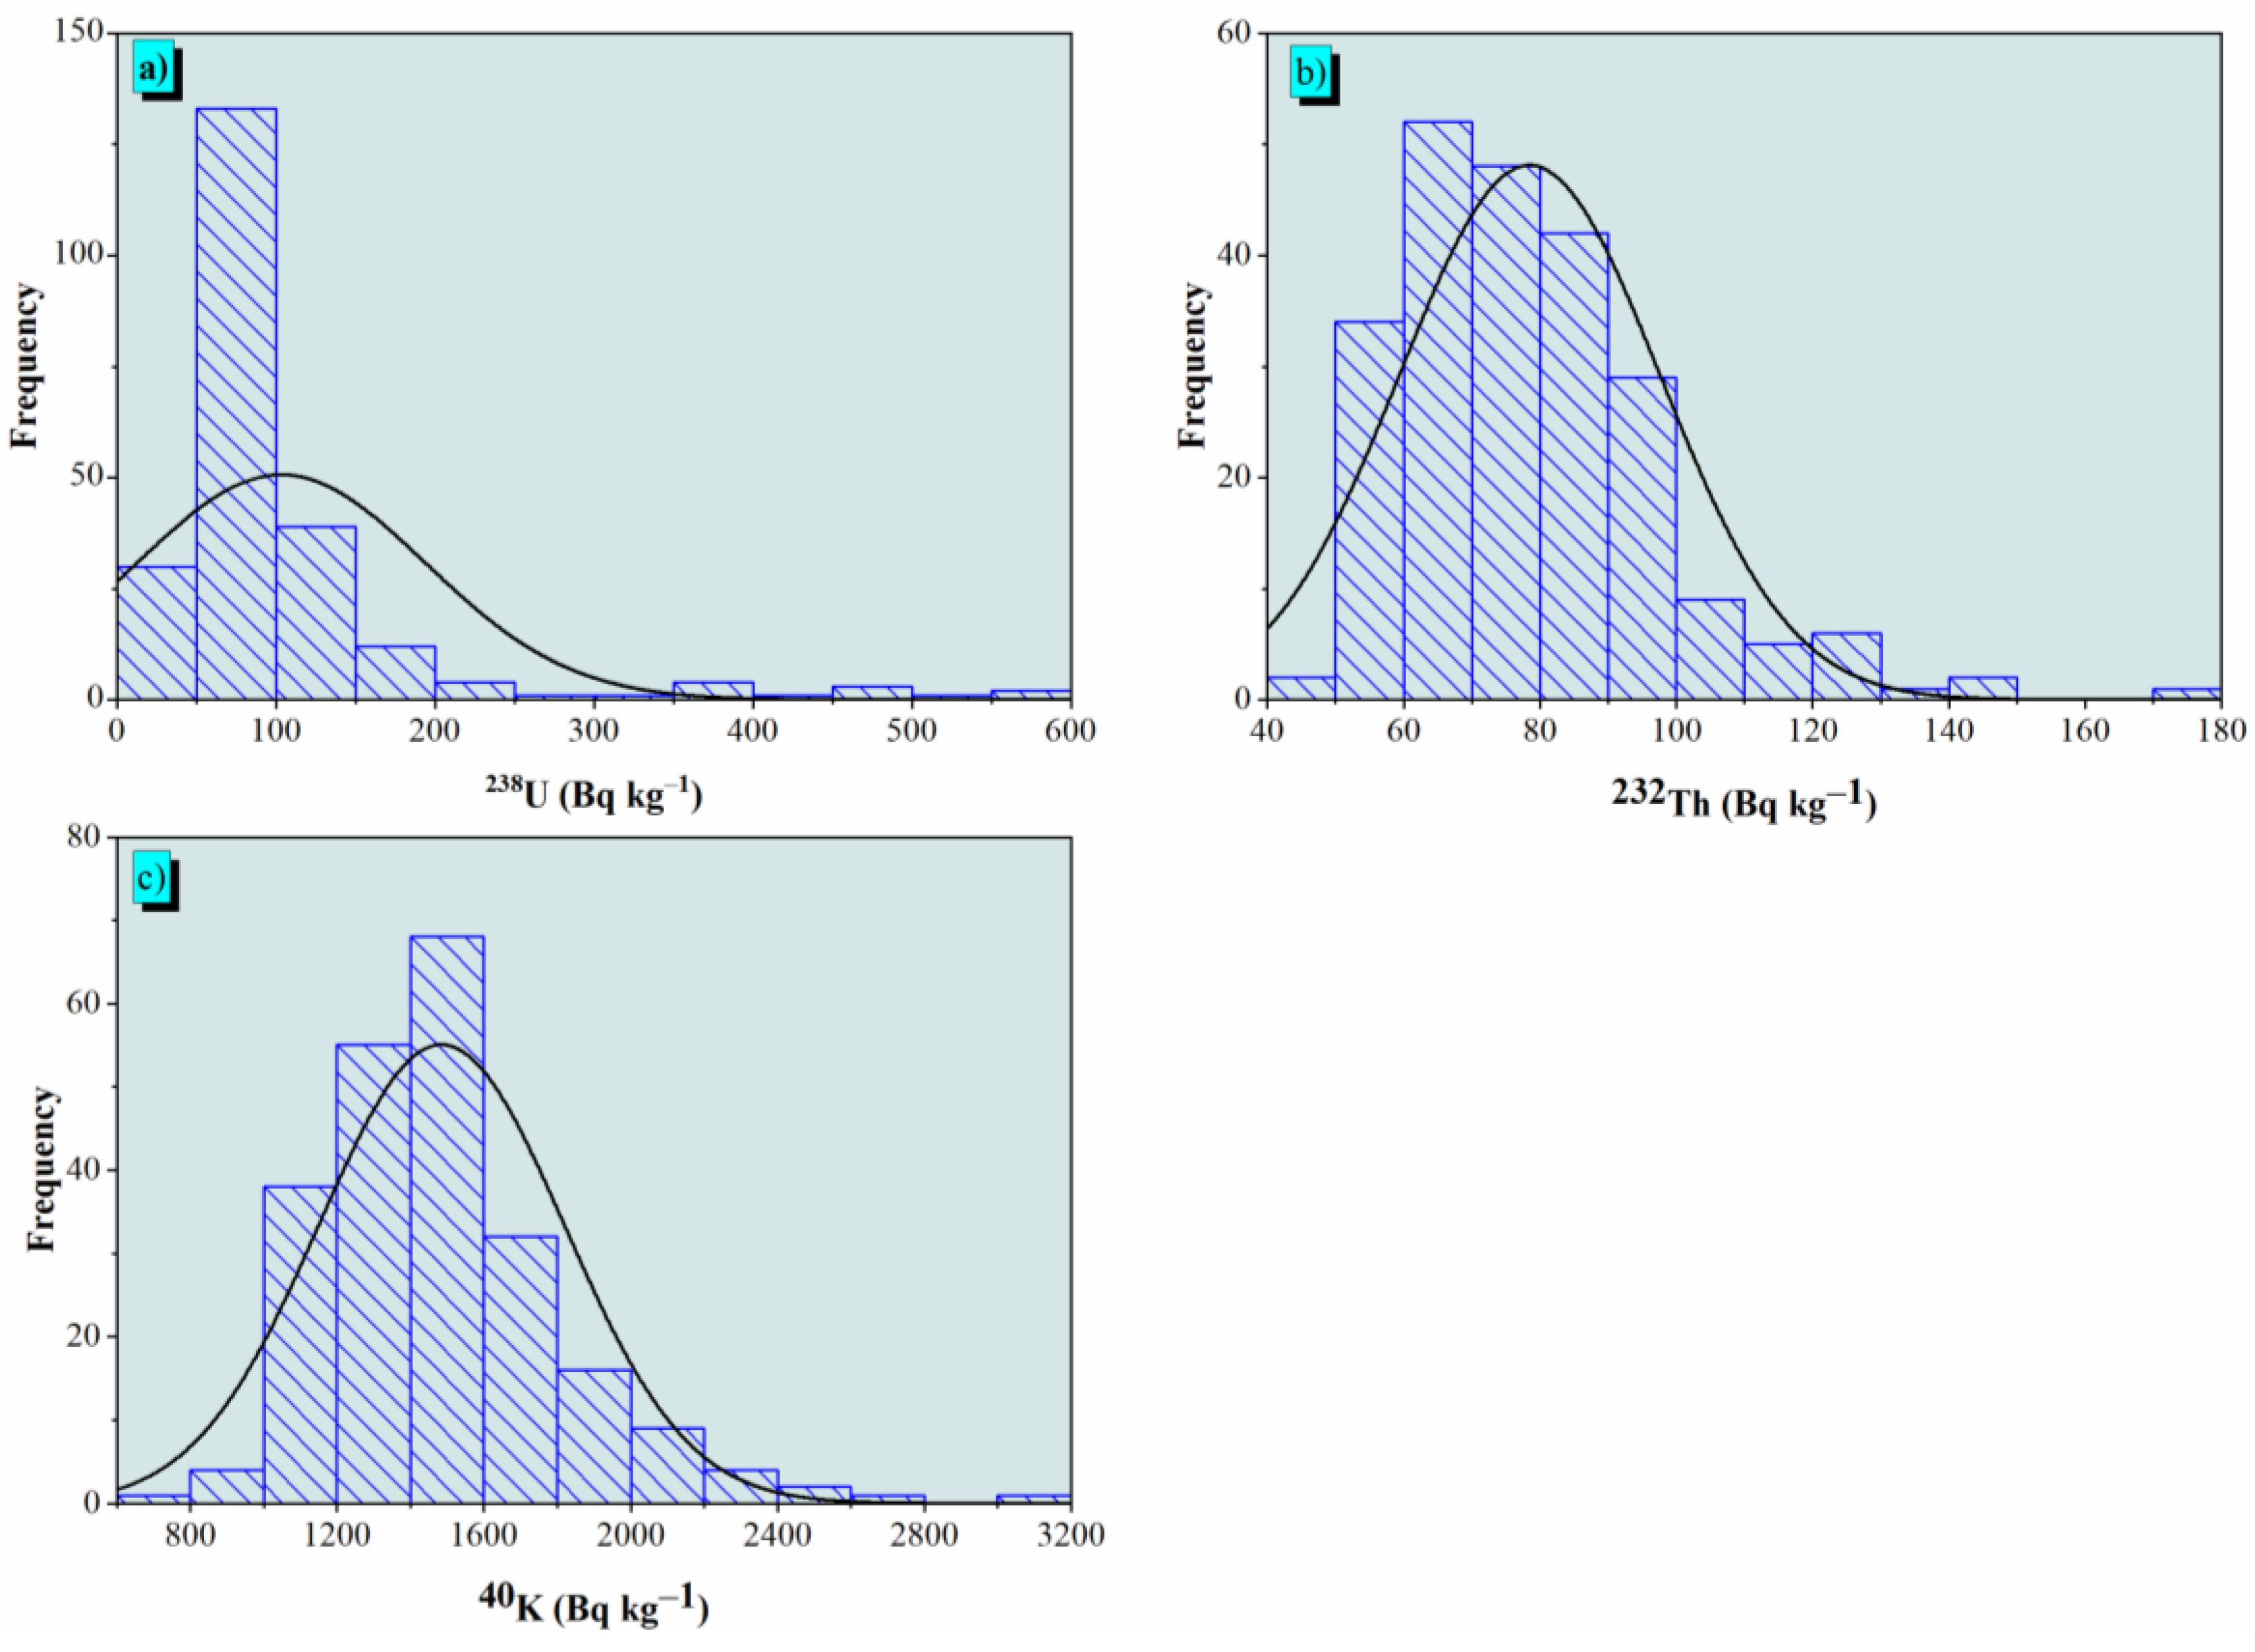
4.2.1. 238U, 232Th, and 40K
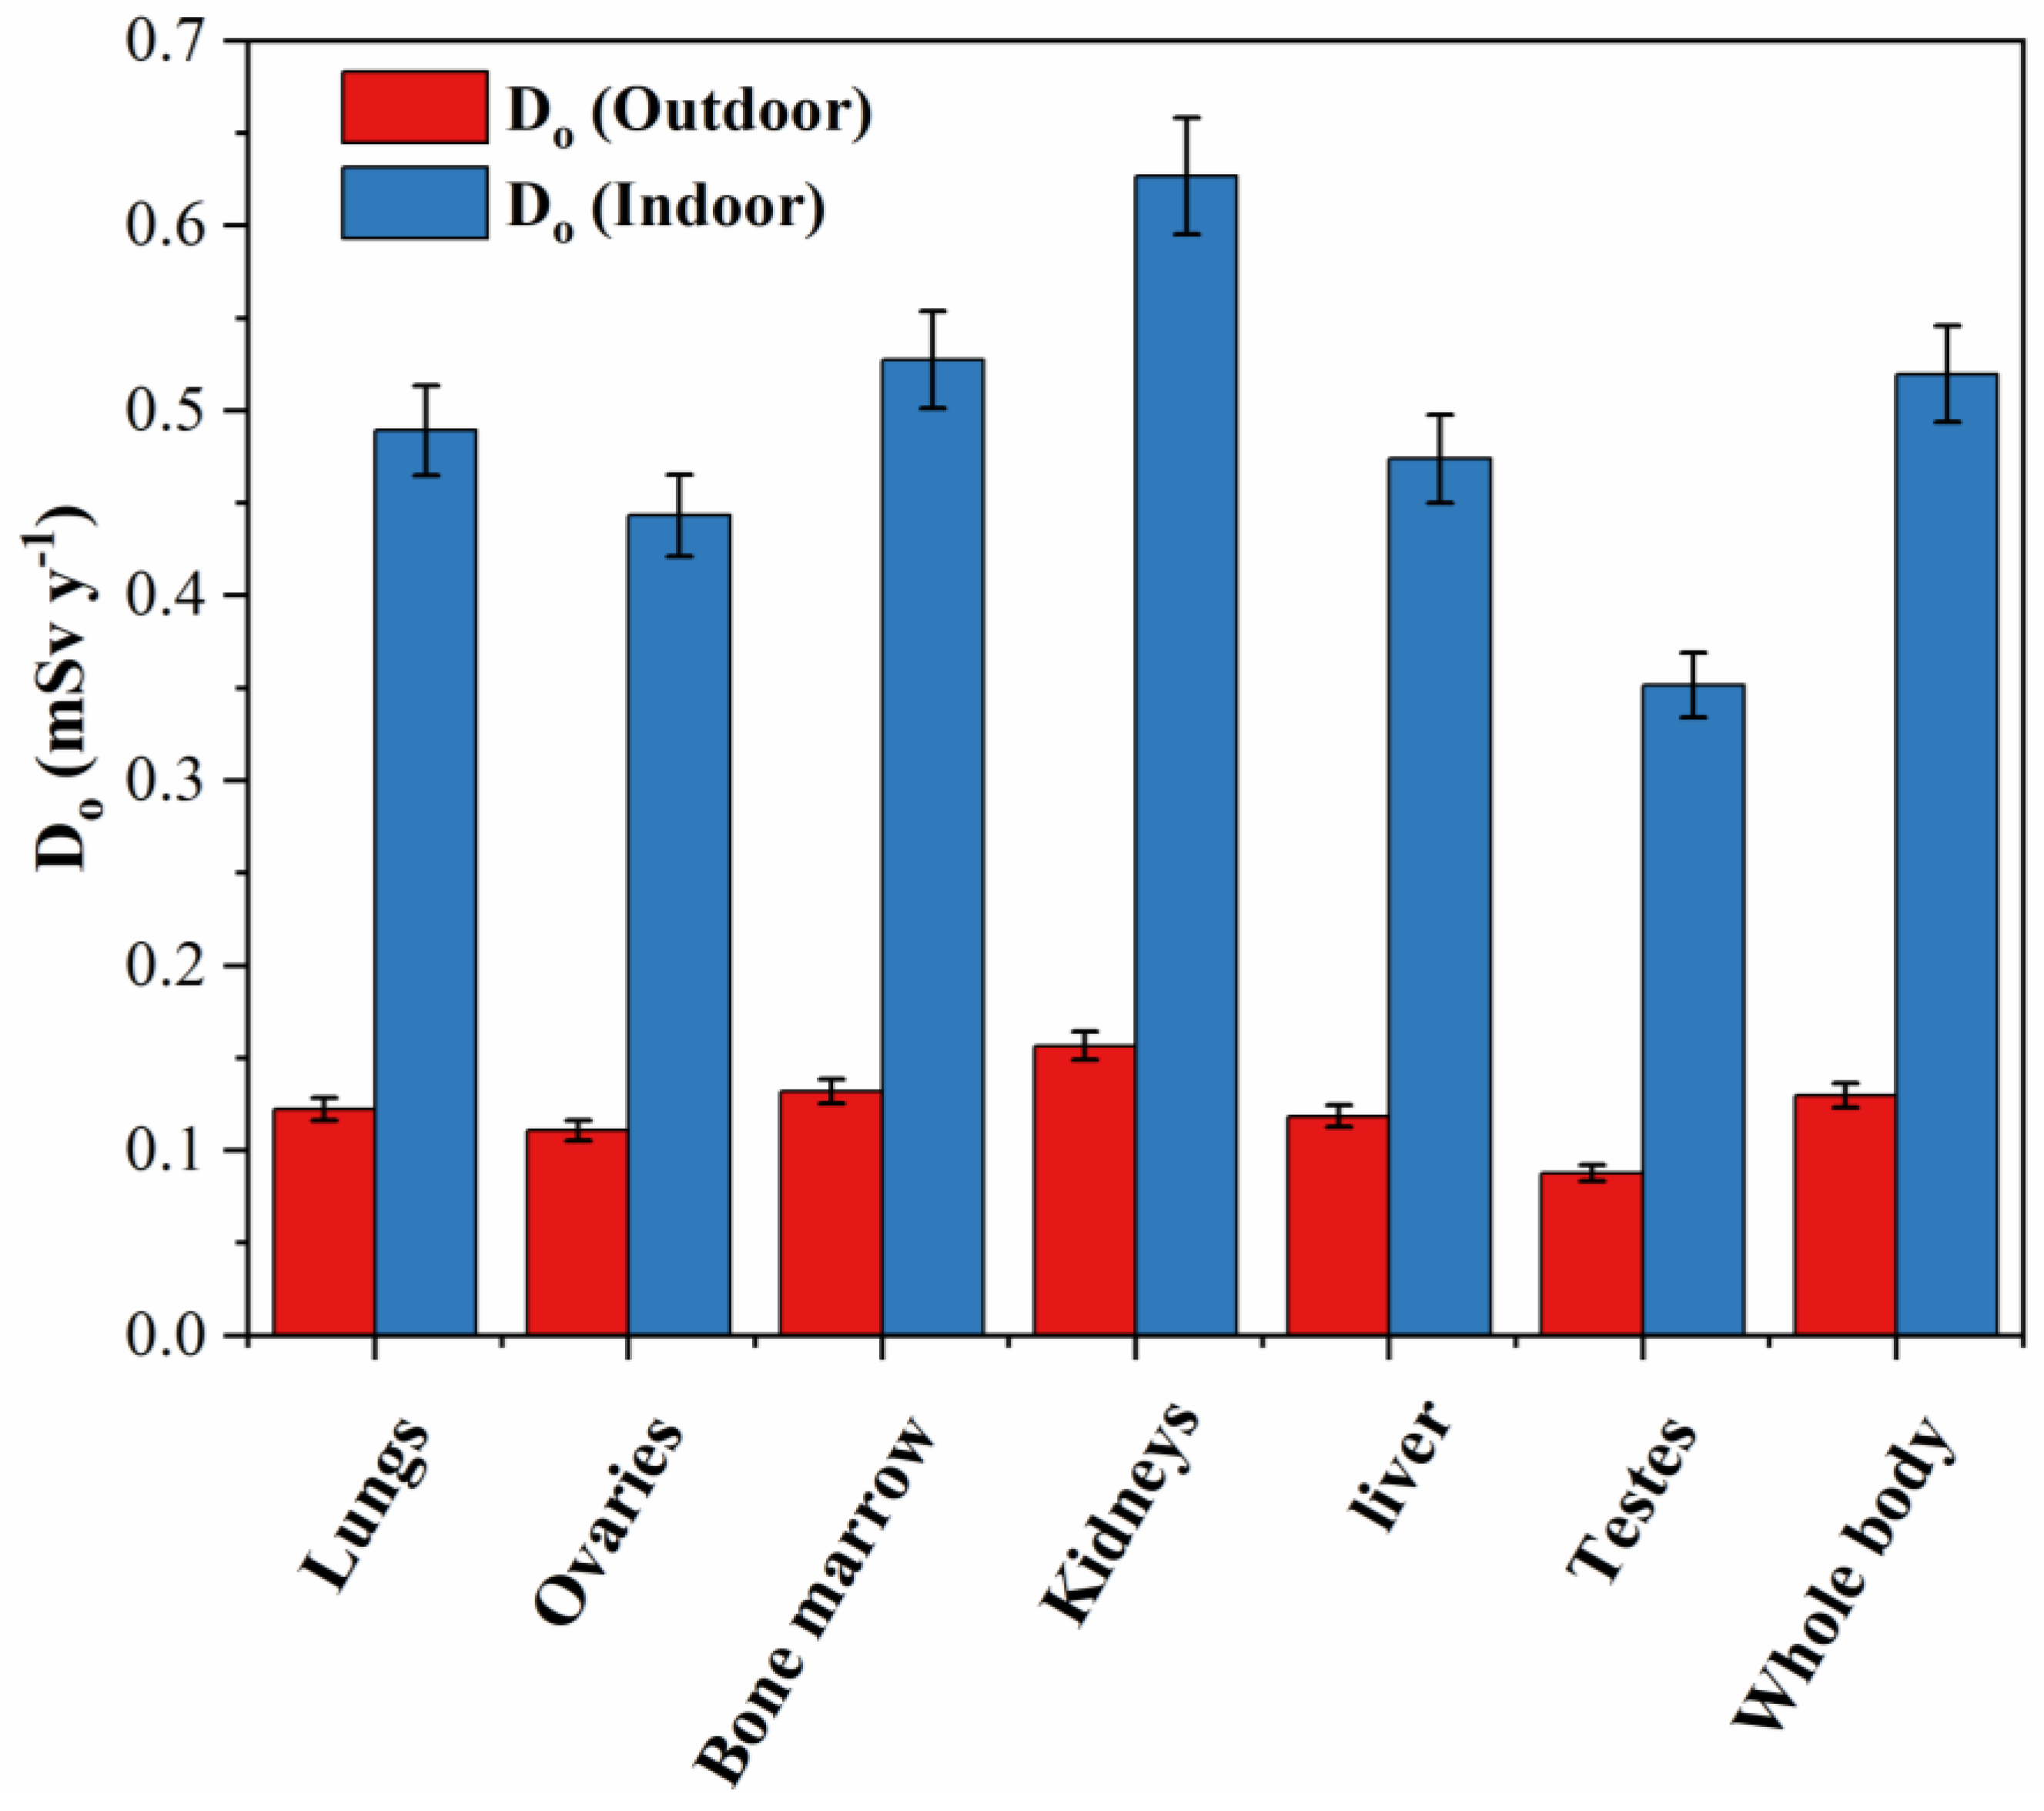
4.2.2. Hazards and Cancer Assessment
4.3. Statistical Analysis
4.3.1. Pearson Correlation Analysis (PC)
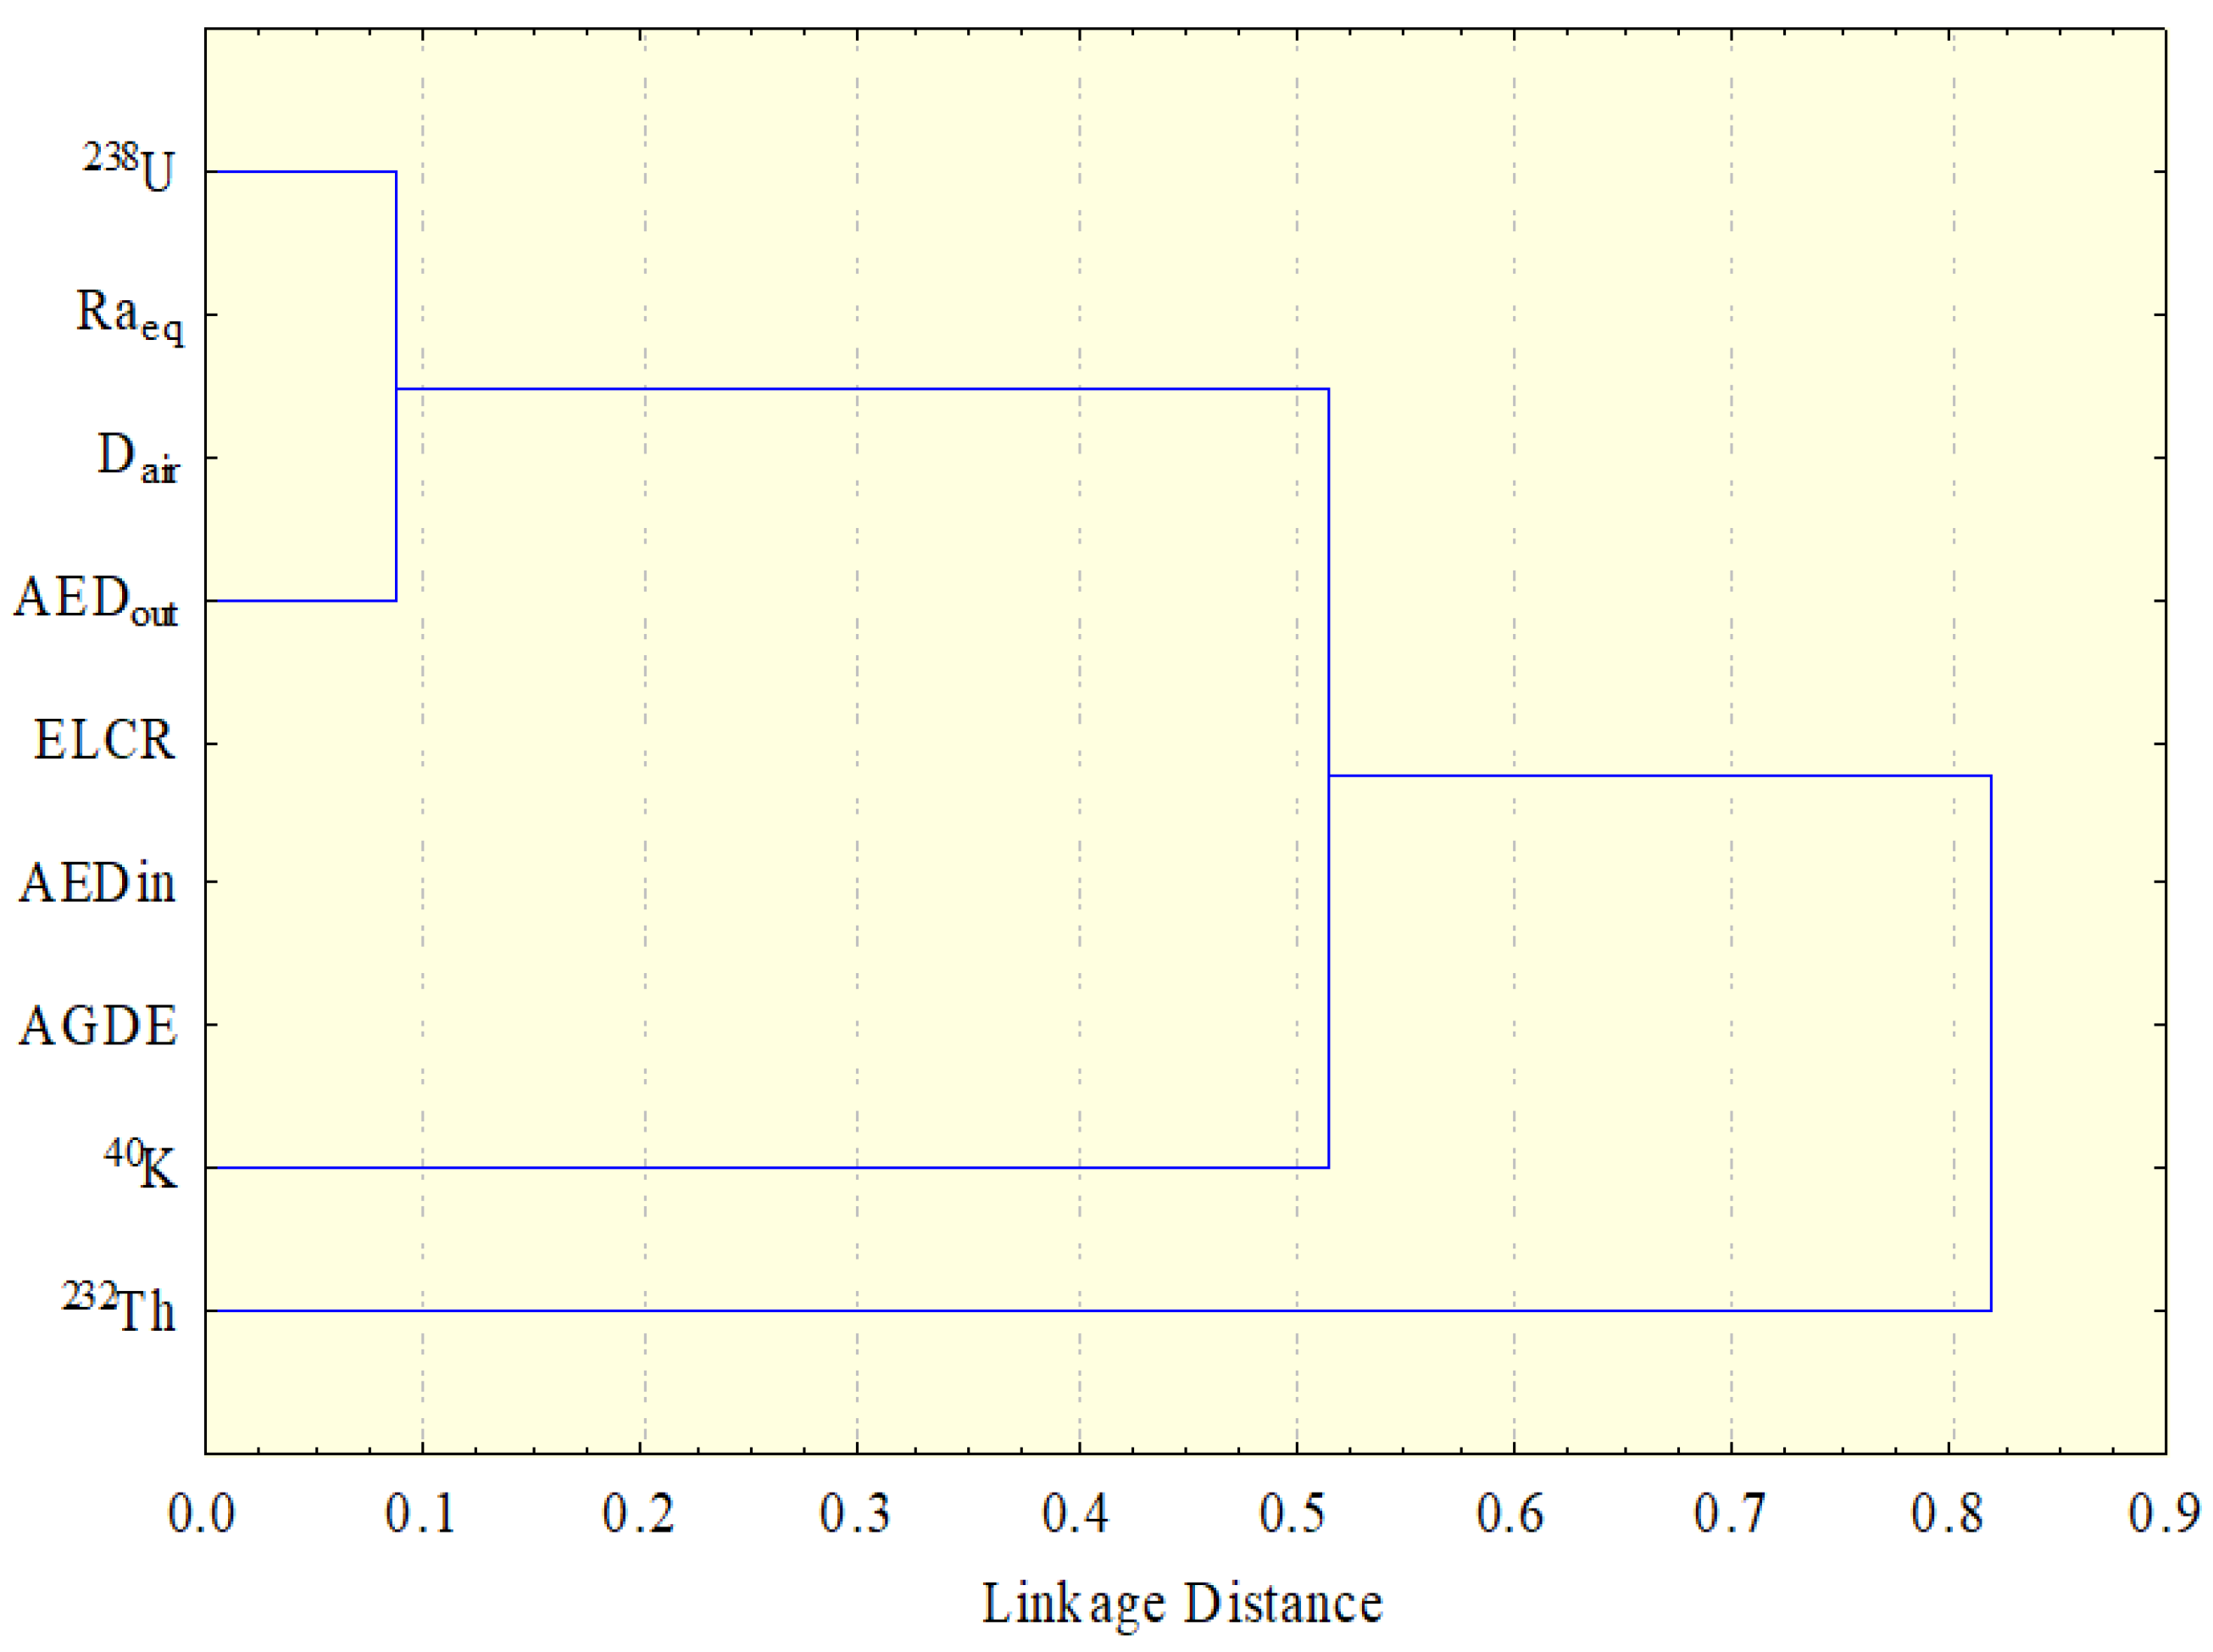
4.3.2. Hierarchical Cluster Analysis
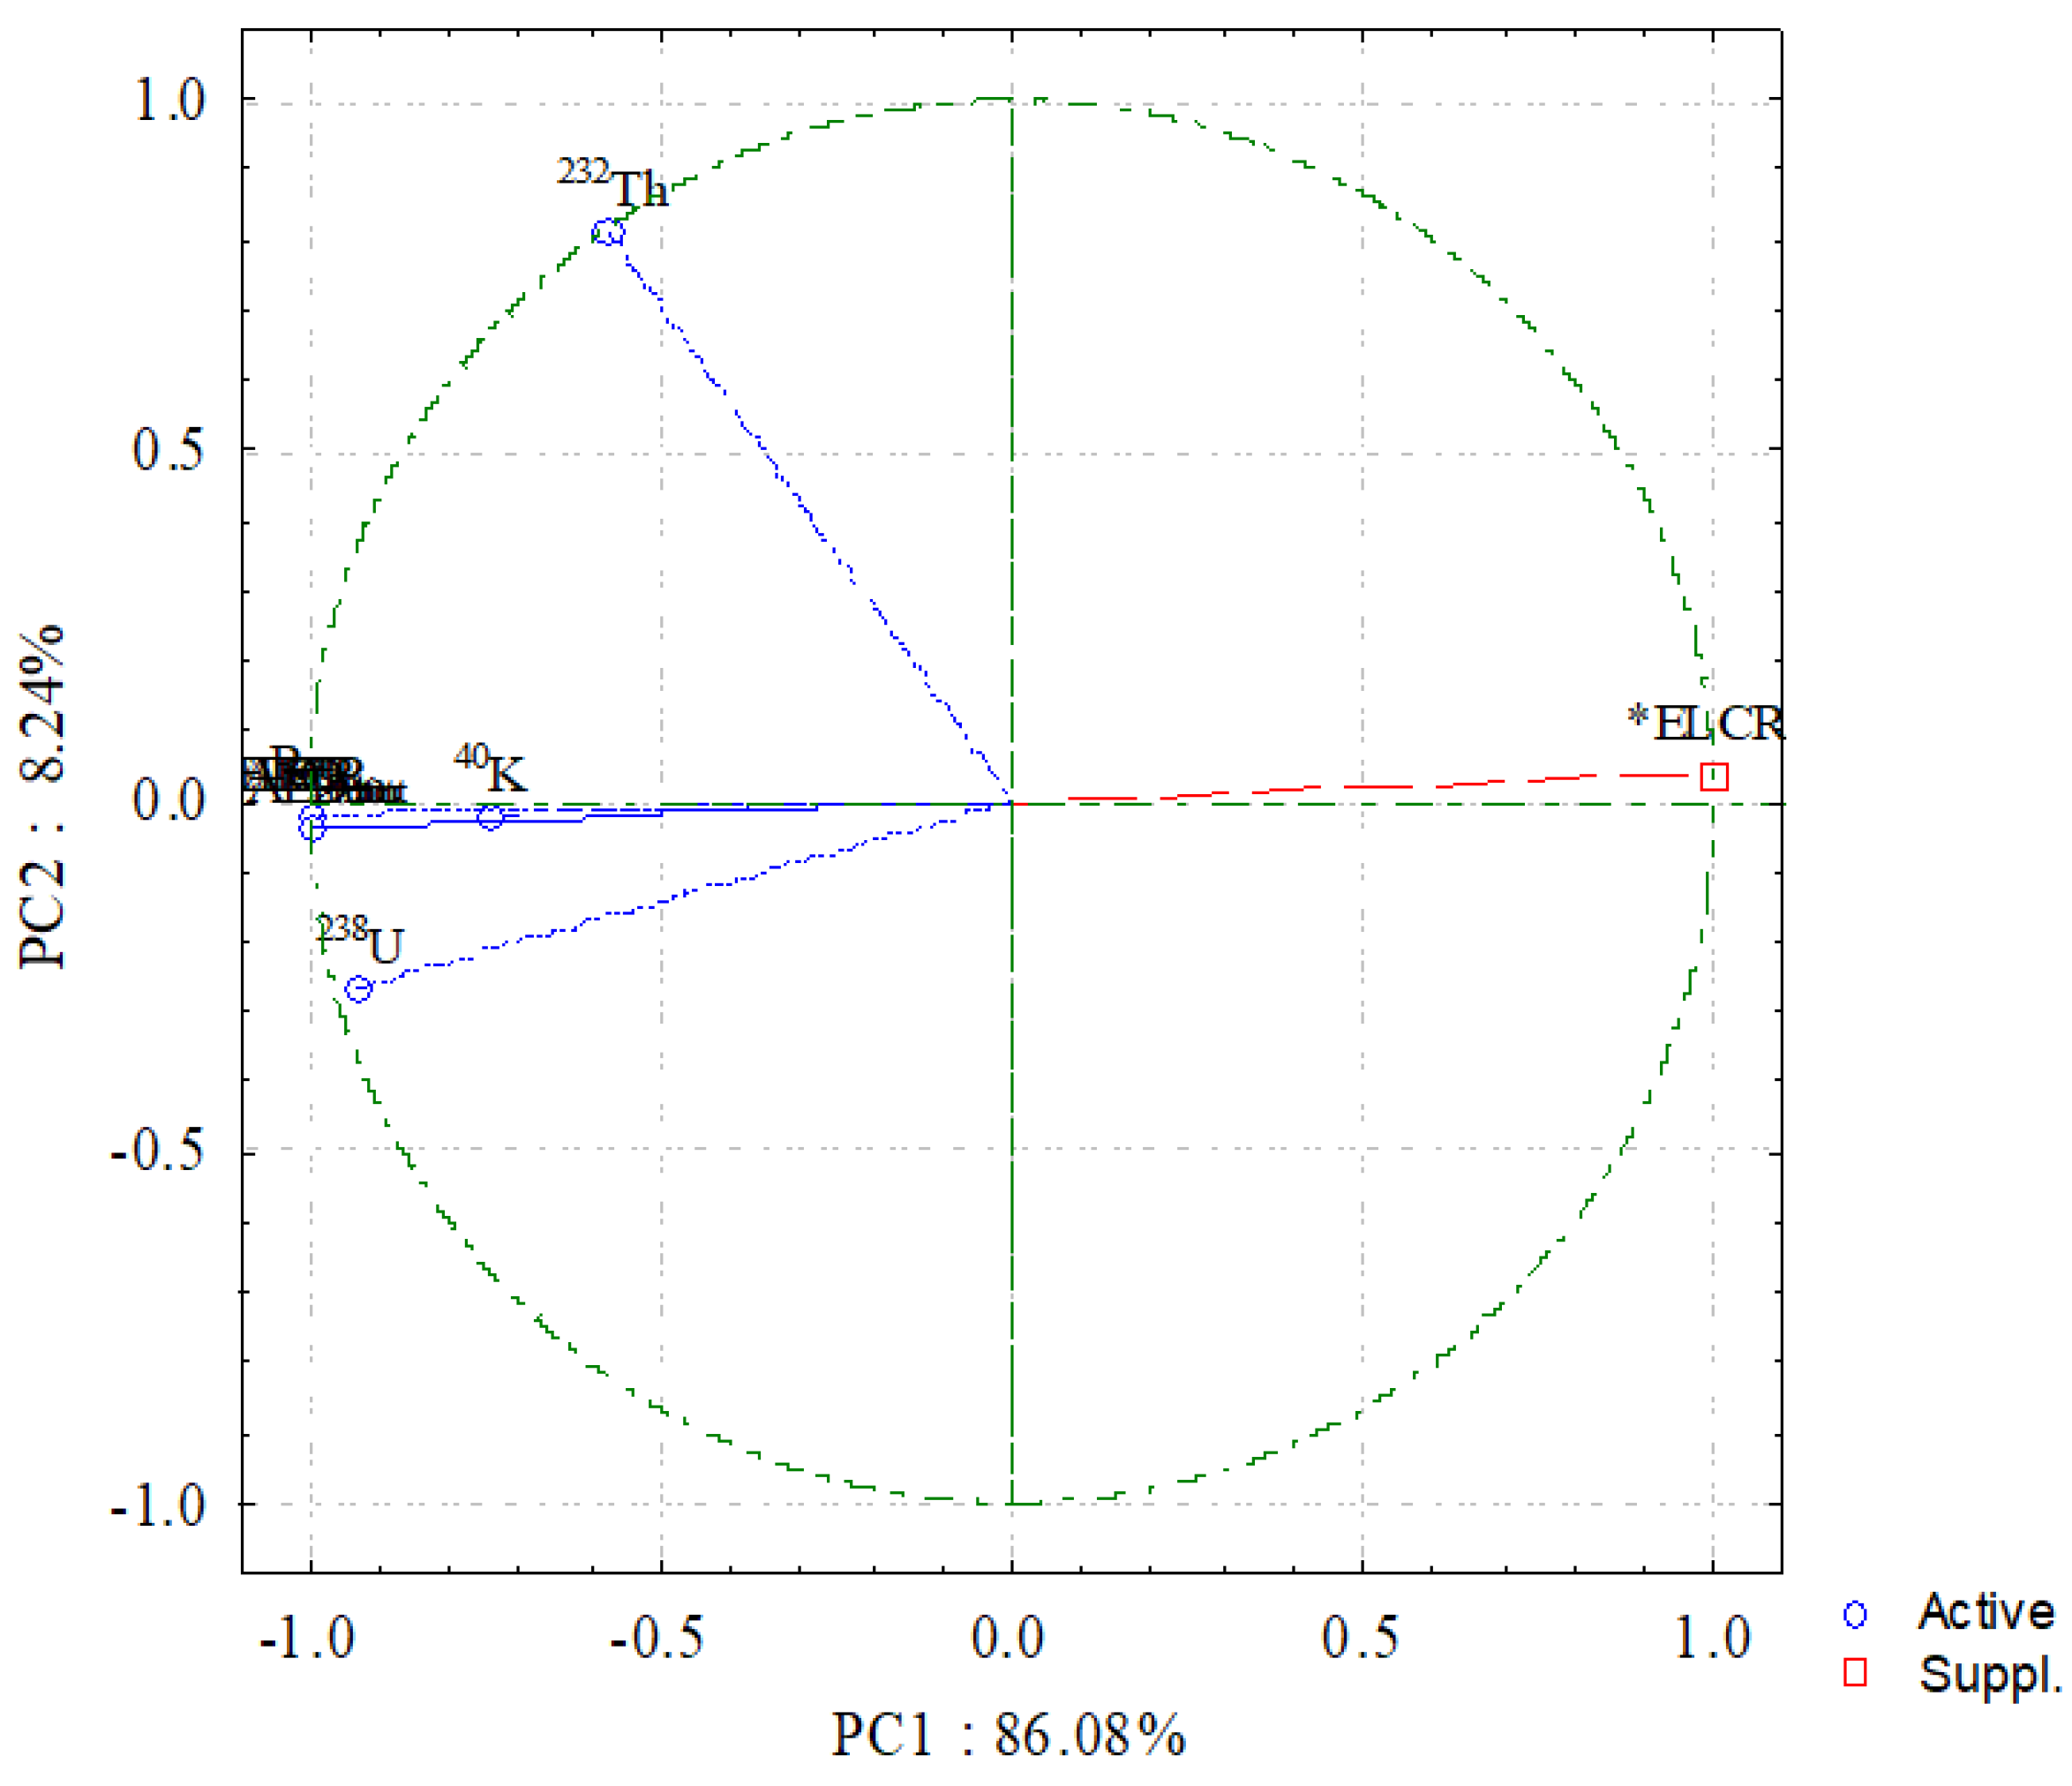
4.3.3. Principal Component Analysis (PCA)
5. Conclusions
Author Contributions
Funding
Institutional Review Board Statement
Informed Consent Statement
Data Availability Statement
Conflicts of Interest
References
- Akpanowo, M.A.; Umaru, I.; Iyakwari, S.; Joshua, E.O.; Yusuf, S.; Ekong, G.B. Determination of natural radioactivity levels and radiological hazards in environmental samples from artisanal mining sites of Anka, North-West Nigeria. Sci. Afr. 2020, 10, e00561. [Google Scholar] [CrossRef]
- Farhan, N.; Ridha, A.A.; Dheyaa, M.; Hanfi, M.Y.; Mostafa, M.Y.A. Development of alpha tracks measurement with thermal oven as an etching technique for SSNTDs. Mater. Today Proc. 2021, 44, 2903–2908. [Google Scholar] [CrossRef]
- UNSCEAR. Sources and Effects of Ionizing Radiation—Exposures of the Public and Workers from Various Sources of Radiation; UNSCEAR 2008 Report; UNSCEAR: New York, NY, USA, 2010. [Google Scholar]
- Gaafar, I.; Hanfi, M.; El-Ahll, L.S.; Zeidan, I. Assessment of radiation hazards from phosphate rocks, Sibaiya area, central eastern desert, Egypt. Appl. Radiat. Isot. 2021, 173, 109734. [Google Scholar] [CrossRef] [PubMed]
- Sivakumar, S.; Chandrasekaran, A.; Senthilkumar, G.; Suresh Gandhi, M.; Ravisankar, R. Determination of radioactivity levels and associated hazards of coastal sediment from south east coast of Tamil Nadu with statistical approach. Iran. J. Sci. Technol. Trans. A Sci. 2018, 42, 601–614. [Google Scholar] [CrossRef]
- Pavlidou, S.; Koroneos, A.; Papastefanou, C. Natural radioactivity of granites used as building materials. J. Environ. Radioact. 2006, 89, 48–60. [Google Scholar] [CrossRef]
- Hanfi, M.Y.; Yarmoshenko, I.; Seleznev, A.A.; Onishchenko, A.D.; Zhukovsky, M.V. Development of an appropriate method for measuring gross alpha activity concentration in low-mass size-fractionated samples of sediment using solid-state nuclear track detectors. J. Radioanal. Nucl. Chem. 2020, 323, 1047–1053. [Google Scholar] [CrossRef]
- Boumala, D.; Mavon, C.; Belafrites, A.; Tedjani, A.; Groetz, J.E. Evaluation of radionuclide concentrations and external gamma radiation levels in phosphate ores and fertilizers commonly used in Algeria. J. Radioanal. Nucl. Chem. 2018, 317, 501–510. [Google Scholar] [CrossRef]
- Hassan, N.M.; Mansour, N.A.; Fayez-Hassan, M.; Sedqy, E. Assessment of natural radioactivity in fertilizers and phosphate ores in Egypt. J. Taibah Univ. Sci. 2016, 10, 296–306. [Google Scholar] [CrossRef] [Green Version]
- Calin, M.R.; Radulescu, I.; Calin, M.A. Measurement and evaluation of natural radioactivity in phosphogypsum in industrial areas from Romania. J. Radioanal. Nucl. Chem. 2015, 304, 1303–1312. [Google Scholar] [CrossRef]
- Hanfi, M.Y.M. Radiological assessment of gamma and radon dose rates at former uranium mining tunnels in Egypt. Environ. Earth Sci. 2019, 78, 113. [Google Scholar] [CrossRef]
- Ravisankar, R.; Chandrasekaran, A.; Vijayagopal, P.; Venkatraman, B.; Senthilkumar, G.; Eswaran, P.; Rajalakshmi, A. Natural radioactivity in soil samples of Yelagiri Hills, Tamil Nadu, India and the associated radiation hazards. Radiat. Phys. Chem. 2012, 81, 1789–1795. [Google Scholar] [CrossRef]
- Abbady, A.; Ahmed, N.K.; El-arabi, A.M.; Michel, R.; El-kamel, A.H.; Abbady, A.G.E. Estimation of radiation hazard indices from natural radioactivity of some rocks. Nucl. Sci. Tech. 2006, 17, 118–122. [Google Scholar] [CrossRef]
- Agency for Toxic Substances and Disease Registry (ATSDR). Toxicological Profile for Uranium; Public Health Service U.S. Department of Health and Human Services: Washington, DC, USA, 1999; pp. 1–145. [Google Scholar]
- Agency for Toxic Substances and Disease Registry (ATSDR). Draft Toxicological Profile for Radon: Agency for Toxic Substances and Disease Registry; Public Health Service U.S. Department of Health and Human Services: Washington, DC, USA, 2012; pp. 9–11, 161–167. [Google Scholar]
- La Verde, G.; Raulo, A.; D’Avino, V.; Roca, V.; Pugliese, M. Radioactivity content in natural stones used as building materials in Puglia region analysed by high resolution gamma-ray spectroscopy: Preliminary results. Constr. Build. Mater. 2020, 239, 117668. [Google Scholar] [CrossRef]
- Sahoo, B.K.; Nathwani, D.; Eappen, K.P.; Ramachandran, T.V.; Gaware, J.J.; Mayya, Y.S. Estimation of radon emanation factor in Indian building materials. Radiat. Meas. 2007, 42, 1422–1425. [Google Scholar] [CrossRef]
- Sabbarese, C.; Ambrosino, F.; Onofrio, A.D.; Roca, V. Radiological characterization of natural building materials from the Campania region (Southern Italy). Constr. Build. Mater. 2020, 268, 121087. [Google Scholar] [CrossRef]
- Imani, M.; Adelikhah, M.; Shahrokhi, A.; Azimpour, G.; Yadollahi, A.; Kocsis, E.; Toth-Bodrogi, E.; Kovács, T. Natural radioactivity and radiological risks of common building materials used in Semnan Province dwellings, Iran. Environ. Sci. Pollut. Res. 2021, 28, 41492–41503. [Google Scholar] [CrossRef]
- Liégeois, J.P.; Stern, R.J. Sr-Nd isotopes and geochemistry of granite-gneiss complexes from the Meatiq and Hafafit domes, Eastern Desert, Egypt: No evidence for pre-Neoproterozoic crust. J. Afr. Earth Sci. 2010, 57, 31–40. [Google Scholar] [CrossRef]
- Zoheir, B.A.; Creaser, R.A.; Lehmann, B. Re-Os geochronology of gold mineralization in the Fawakhir area, Eastern Desert, Egypt. Int. Geol. Rev. 2014, 57, 1418–1432. [Google Scholar] [CrossRef]
- Zoheir, B.; Emam, A. Integrating geologic and satellite imagery data for high-resolution mapping and gold exploration targets in the South Eastern Desert, Egypt. J. Afr. Earth Sci. 2012, 66–67, 22–34. [Google Scholar] [CrossRef]
- Helmy, H.M.; Zoheir, B.A. Metal and fluid sources in a potential world-class gold deposit: El-Sid mine, Egypt. Int. J. Earth Sci. 2015, 104, 645–661. [Google Scholar] [CrossRef]
- Zoheir, B.; Deshesh, F.; Broman, C.; Pitcairn, I.; El-Metwally, A.; Mashaal, S. Granitoid-associated gold mineralization in Egypt: A case study from the Atalla mine. Min. Depos. 2017, 53, 701–720. [Google Scholar] [CrossRef]
- Saleh, G.M. Rare-metal pegmatites from the Southeastern Desert, Egypt: Geology, geochemistry, and petrogenesis. Int. Geol. Rev. 2007, 49, 824–843. [Google Scholar] [CrossRef]
- Abdel Wahed, A.A.; Ali, K.G.; Khalil, M.M.; Abdel Gawad, A.E. Dokhan Volcanics of Gabal Monqul area, North eastern Desert, Egypt: Geochemistry and petrogenesis. Arab. J. Geosci. 2012, 5, 29–44. [Google Scholar] [CrossRef]
- Ali, M.A.; Abdel Gawad, A.E.; Ghoneim, M.M. Geology and mineral chemistry of uranium and thorium bearing minerals in rare-metal (NYF) pegmatites of Um Solimate, South Eastern Desert of Egypt. Acta Geol. Sin. 2021, 95, 1568–1582. [Google Scholar] [CrossRef]
- Hegab, M.A.; Salem, S.M. Mineral-bearing alteration zones at Gebel Monqul area, North Eastern Desert, Egypt, using remote sensing and gamma-ray spectrometry data. Arab. J. Geosci. 2021, 14, 1869. [Google Scholar] [CrossRef]
- Abdel Gawad, A.E.; Ene, A.; Skublov, S.G.; Gavrilchik, A.K.; Ali, M.A.; Ghoneim, M.M.; Nastavkin, A.V. Trace element geochemistry and genesis of beryl from Wadi Nugrus, South Eastern Desert, Egypt. Minerals 2022, 12, 206. [Google Scholar] [CrossRef]
- Surour, A.A.; Omar, S.A.M. Historiography and FTIR spectral signatures of beryl crystals from some ancient Roman sites in the Eastern Desert of Egypt. Environ. Earth Sci. 2020, 79, 520. [Google Scholar] [CrossRef]
- El-Afandy, A.H.; El-Feky, M.G.; Taha, S.H.; El Minyawi, S.M.; Sallam, H.A.; Ebyan, O.A.; Yousef, E.-S.; Hanfi, M.Y. Natural Radionuclide Concentrations γ-Ray Spectrometry in Granitic Rocks of the Sol Hamed Area, Southeastern Desert of Egypt, and Their Radiological Implications. Minerals 2022, 12, 294. [Google Scholar] [CrossRef]
- Abd El Rahman, R.M.; Taalab, S.A.; Al Full, Z.Z.; Mohamed, M.S.; Sayyed, M.I.; Almousa, N.; Hanfi, M.Y. Natural radionuclide levels and radiological hazards of Khour Abalea mineralized pegmatites, Southeastern Desert, Egypt. Minerals 2022, 12, 353. [Google Scholar] [CrossRef]
- Park, K.H.; Kim, H.I.; Parhi, P.K.; Mishra, D.; Nam, C.W.; Park, J.T.; Kim, D.J. Extraction of metals from Mo-Ni/Al2O3 spent catalyst using H2SO4 baking-leaching-solvent extraction technique. J. Ind. Eng. Chem. 2012, 18, 2036–2045. [Google Scholar] [CrossRef]
- Parhi, P.K.; Sethy, T.R.; Rout, P.C.; Sarangi, K. Separation and recovery of neodymium and praseodymium from permanent magnet scrap through the hydrometallurgical route. Sep. Sci. Technol. 2016, 51, 2232–2241. [Google Scholar] [CrossRef]
- Elsaid, M.; Aboelkhair, H.; Dardier, D.; Hermas, E.; Minoru, U. Processing of Multispectral ASTER Data for Mapping Alteration Minerals Zones: As an Aid for Uranium Exploration in Elmissikat-Eleridiya Granites, Central Eastern Desert, Egypt. Open Geol. J. 2014, 8 (Suppl. 1), 9–83. [Google Scholar] [CrossRef] [Green Version]
- Hanfi, M.Y.; Emad, B.M.; Sayyed, M.I.; Khandaker, M.U.; Bradley, D.A. Natural radioactivity in the prospecting tunnel in Egypt: Dose rate and risk assessment. Radiat. Phys. Chem. 2021, 187, 109555. [Google Scholar] [CrossRef]
- Hussein, H.A.; Hassan, M.A.; El-Tahir, M.A.; Abou-Deif, A. Uranium-bearing siliceous veins in younger granites, Eastern Desert, Egypt. In Vein Type Uranium Deposits; IAEA-TECDOC-361; Fuchs, H., Ed.; International Atomic Energy Agency: Vienna, Austria, 1986; pp. 143–157. [Google Scholar]
- Abd El-Naby, H.A. Genesis of secondary uranium minerals associated with jasperoid veins, El Erediya area, Eastern Desert, Egypt. Min. Depos. 2008, 43, 933–944. [Google Scholar] [CrossRef]
- Omran, A.A. Geology, mineralogy and radioelements potentiality of microgranite dikes to the south of wadi Abu Hadieda area, northern Eastern Desert. Al-Azhar Bull. Sci. 2014, 25, 47–62. [Google Scholar] [CrossRef]
- Dessouky, O.K.; Sun, W.; Ibrahim, W.S.; Ali, H.H.; Hassan, M.M.; Li, C.; Omran, A.A.; Dardier, A.M. New insights into Cryogenian Arc granitoids hosting Th-U mineralized Ediacaran syenogranite dikes, Ra’s Abdah area in the northern Egyptian Nubian Shield: Constraints from U-Pb Ages and zircon geochemistry. Precambrian Res. 2020, 352, 105986. [Google Scholar] [CrossRef]
- Abdel Gawad, A.E.; Skublov, S.G.; Levashova, E.V.; Ghoneim, M.M. Geochemistry and U–Pb age dating of Zircon as a petrogenetic tool for magmatic and hydrothermal processes in Wadi Ras Abda syenogranite, Eastern Desert, Egypt. Arab. J. Geosci. Eng. 2021, 47, 7351–7365. [Google Scholar] [CrossRef]
- Salman, A.B.; El Aassy, I.E.; Shalaby, M.H. New occurrence of uranium mineralization in Gabal Gattar, Northern Eastern Desert, Egypt. Ann. Geol. Surv. Egypt 1986, 16, 31–34. [Google Scholar]
- Salman, A.B.; El Kholy, D.M.; El Zalaky, M.A. Relation between granite plutonism, faulting and uranium mineralization in the northern part of Gabal Qattar area, Nortern Eastern Desert, Egypt. Al-Azhar Bull. Sci. 2005, 16, 23–35. [Google Scholar]
- Shalaby, M.H. New occurrence of uranium mineralizations GVII, Gabal Qattar uranium prospect, north Eastern Desert. Egypt Bull. Fac. Sci. Alex. Univ. 1995, 35, 447–460. [Google Scholar]
- Mahdy, N.M.; El Kalioubi, B.A.; Wohlgemuth-Ueberwasser, C.C.; Shalaby, M.H.; El- Afandy, A.H. Petrogenesis of U- and Mo-bearing A2-type granite of the Gattar batholith in the Arabian Nubian Shield, Northeastern Desert, Egypt: Evidence for the favorability of host rocks for the origin of associated ore deposits. Ore Geol. Rev. 2015, 71, 57–81. [Google Scholar] [CrossRef]
- Gaafar, I.; Cuney, M.; Abdel Gawad, A.E. Mineral chemistry of two mica granite rare metals: Impact of geophysics on the distribution of uranium mineralization at El Sela shear zone, Egypt. Open J. Geol. 2014, 4, 137–160. [Google Scholar] [CrossRef]
- Abdel Gawad, A.E. Geochemical behaviour of trace and rare earth elements during hydrothermal alteration at El Sela shear zone, Egypt. In Proceedings of the VIII Young Geoscientists School, New Knowledge about Ore-Forming Processes, Moscow, Russia, 26–30 November 2018; IGEM RAS: Moscow, Russia, 2018; pp. 439–442. [Google Scholar]
- Ghoneim, M.M.; Abdel Gawad, A.E.; Awad, H.A.; Zakaly, H.M.H.; Mira, H.I.; El-Taher, A. Distribution patterns of natural radioactivity and rare earth elements in intrusive rocks (El Sela area, Eastern Desert, Egypt). Int. J. Env. Anal. 2021, 1–14. [Google Scholar] [CrossRef]
- Hanfi, M.Y.; Masoud, M.S.; Ambrosino, F.; Mostafa, M.Y.A. Natural radiological characterization at the Gabal El Seila region (Egypt). Appl. Radiat. Isot. 2021, 173, 109705. [Google Scholar] [CrossRef] [PubMed]
- Abdel Karim, M.A.; Sos, E.A. Geochemical characteristics and potassium argon ages dating of some granitoids from South Eastern Desert, Egypt. Egypt. J. Geol. Soc. Egypt 2000, 44, 305–318. [Google Scholar]
- Moussa, E.M.M.; Stern, R.J.; Manton, W.I.; Ali, K.A. SHRIMP zircon dating and Sm/Nd isotopic investigations of Neoproterozoic granitoids, Eastern Desert, Egypt. Precambrian Res. 2008, 160, 341–356. [Google Scholar] [CrossRef]
- Eliwa, H.A.; Breitkreuz, C.; Murata, M.; Khalaf, I.M.; Bühler, B.; Itaya, T.; Takahashi, T.; Hirahara, Y.; Miyazaki, T.; Kimura, J.-I.; et al. SIMS zircon U–Pb and mica K–Ar geochronology, and Sr–Nd isotope geochemistry of Neoproterozoic granitoids and their bearing on the evolution of the north Eastern Desert, Egypt. Gondwana Res. 2014, 25, 1570–1598. [Google Scholar] [CrossRef]
- Ali, B.H. SHRIMP U–Pb zircon geochronology: Evidence for emplacement time of some granitoids north Eastern Desert, Egypt. Arab. J. Geosci. 2015, 8, 5465–5474. [Google Scholar] [CrossRef]
- Skublov, S.G.; Abdel Gawad, A.E.; Levashova, E.V.; Ghoneim, M.M. U–Pb geochronology, REE and trace element geochemistry of zircon from El Fereyid monzogranite, south Eastern Desert, Egypt. J. Miner. Pet. Sci. 2021, 116, 220–233. [Google Scholar] [CrossRef]
- Stanton, R.L. Ore Petrology; McGraw-Hill Book Co.: London, UK; New York, NY, USA, 1972; Volume XVIII, 713p. [Google Scholar]
- Mason, D.R.; Heaslip, J.E. Tectonic setting and origin of intrusive rocks and related porphyry copper deposits in the western highlands of Papua New Guinea. Tectonophysics 1980, 63, 125–137. [Google Scholar] [CrossRef]
- Sillitoe, R.H. Porphyry copper systems. Econ. Geol. 2010, 105, 3–41. [Google Scholar] [CrossRef] [Green Version]
- Salem, S.M.; Arafa, S.A.; Ramadan, T.M.; El Gammal, E.A. Exploration of copper deposits in Wadi El Regeita area, Southern Sinai, Egypt, with contribution of remote sensing and geophysical data. Arab. J. Geosci. 2013, 6, 321–335. [Google Scholar] [CrossRef]
- Ahmed, A.H.; Gharib, M.E. Porphyry Cu mineralization in the eastern desert of Egypt: Inference from geochemistry, alteration zones, and ore mineralogy. Arab. J. Geosci. 2016, 9, 179. [Google Scholar] [CrossRef]
- Abdel Gawad, A.E.; Ghoneim, M.M.; El-Taher, A.; Ramadan, A.A. Mineral chemistry aspects of U-, Th-, REE-, Cu-bearing minerals at El-Regeita shear zone, South Central Sinai, Egypt. Arab. J. Geosci. 2021, 14, 1356. [Google Scholar] [CrossRef]
- Helba, H.A.; Ghonaim, M.A.; Khalil, S.O.; El Makky, A.M. Alteration patterns related to copper mineralization in dioritic rocks at the Dara area, north Eastern Desert, Egypt. Arab. J. Geosci. 2021, 14, 1138. [Google Scholar] [CrossRef]
- Grasty, R.L.; Holman, P.B.; Blanchard, Y.B. Transportable Calibration Pads for Ground and Airborne Gammaray Spectrometers; Geological Survey of Canada: Ottawa, ON, Canada, 1991; 25p. [Google Scholar]
- Aral, H.; Kohn, B.P.; Hawkins, D.K.; Copper, M.B.; Mumme, W.G. Physical and Chemical Characteristic of Commercial Zircon Sand Concentrates. Heavy Mineral, Johannesburg, South Africa; Institute of Mining and Metallurgy: London, UK, 1997; pp. 111–124. [Google Scholar]
- Ghoneim, M.M.; Panova, E.G.; Abdel Gawad, A.E.; Yanson, S.Y. Morphology and geochemical features of zircon from intrusive rocks of El Sela area, Eastern Desert, Egypt. News Ural. State Min. Univ. 2020, 3, 7–18. [Google Scholar] [CrossRef]
- Botros, N.S.; Wetait, M.A. A possible porphyry copper mineralization in South Monqul, Eastern Desert, Egypt. Egypt J. Geol. 1997, 41, 175–196. [Google Scholar]
- Botros, N.S. Genesis of Gold mineralization in the North Eastern Desert, Egypt. Ann. Geol. Surv. Egypt 1995, 25, 381–409. [Google Scholar]
- El Mamoney, M.H.; Khater, A.E.M. Environmental characterization and radio-ecological impacts of non-nuclear industries on the Red Sea coast. J. Environ. Radioact. 2004, 73, 151–168. [Google Scholar] [CrossRef]
- Guillén, J.; Tejado, J.J.; Baeza, A.; Corbacho, J.A.; Muñoz, J.G. Assessment of radiological hazard of commercial granites from Extremadura (Spain). J. Environ. Radioact. 2014, 132, 81–88. [Google Scholar] [CrossRef]
- Abbasi, A. Calculation of gamma radiation dose rate and radon concentration due to granites used as building materials in Iran. Radiat. Prot. Dosim. 2013, 155, 335–342. [Google Scholar] [CrossRef] [PubMed]
- Senthilkumar, G.; Raghu, Y.; Sivakumar, S.; Chandrasekaran, A.; Prem Anand, D.; Ravisankar, R. Natural radioactivity measurement and evaluation of radiological hazards in some commercial flooring materials used in Thiruvannamalai, Tamilnadu, India. J. Radiat. Res. Appl. Sci. 2014, 7, 116–122. [Google Scholar] [CrossRef]
- Sharaf, J.M.; Hamideen, M.S. Measurement of natural radioactivity in Jordanian building materials and their contribution to the public indoor gamma dose rate. Appl. Radiat. Isot. 2013, 80, 61–66. [Google Scholar] [CrossRef] [PubMed]
- Thabayneh, K.M. Measurement of natural radioactivity and radon exhalation rate in granite samples used in palestinian buildings. Arab. J. Sci. Eng. 2013, 38, 201–207. [Google Scholar] [CrossRef]
- Amin, R.M. Gamma radiation measurements of naturally occurring radioactive samples from commercial Egyptian granites. Environ. Earth Sci. 2012, 67, 771–775. [Google Scholar] [CrossRef]
- Papadopoulos, A.; Christofides, G.; Koroneos, A.; Papadopoulou, L.; Papastefanou, C.; Stoulos, S. Natural radioactivity and radiation index of the major plutonic bodies in Greece. J. Environ. Radioact. 2013, 124, 227–238. [Google Scholar] [CrossRef] [PubMed]
- Aykamiş, A.Ş.; Turhan, S.; Aysun Ugur, F.; Baykan, U.N.; Kiliç, A.M. Natural radioactivity, radon exhalation rates and indoor radon concentration of some granite samples usedas construction material in Turkey. Radiat. Prot. Dosim. 2013, 157, 105–111. [Google Scholar] [CrossRef] [PubMed]
- Hanfi, M.Y.M.; Masoud, M.S.; Sayyed, M.I.; Khandaker, M.U.; Faruque, M.R.I.; Bradley, D.A.; Mostafa, M.Y.A. The presence of radioactive heavy minerals in prospecting trenches and concomitant occupational exposure. PLoS ONE 2021, 16, 1–12. [Google Scholar] [CrossRef]
- Senthilkumar, R.D.; Narayanaswamy, R. Assessment of radiological hazards in the industrial effluent disposed soil with statistical analyses. J. Radiat. Res. Appl. Sci. 2016, 9, 449–456. [Google Scholar] [CrossRef] [Green Version]
- United States Environmental Protection Agency (USEPA). EPA Radiogenic Cancer Risk Models and Projections for the U.S. Population; USEPA: Washington, DC, USA, 2011. [Google Scholar]
- Qureshi, A.A.; Tariq, S.; Kamal, U.; Manzoor, S.; Calligaris, C.; Waheed, A. ScienceDirect Evaluation of excessive lifetime cancer risk due to natural radioactivity in the rivers sediments of Northern Pakistan. J. Radiat. Res. Appl. Sci. 2014, 7, 438–447. [Google Scholar] [CrossRef] [Green Version]
- Feinendegen, L.E. Relative implications of protective responss versus damage induction at low dose and low-dose-rate exposures, using the microdose approach. Radiat. Prot. Dosim. 2003, 104, 337–346. [Google Scholar] [CrossRef] [PubMed]
- Yang, T.; Samin, A.; Cao, L. A review of low-level ionizing radiation and risk models of leukemia. J. Radiat. Oncol. 2013, 2, 263–270. [Google Scholar] [CrossRef] [Green Version]
- Rodel, F.; Frey, B.; Gaipl, U.; Keilholz, L.; Fournier, C.; Manda, K.; Schollnberger, H.; Hildebrandt, G.; Rodel, C. Modulation of Inflammatory Immune Reactions by Low-Dose Ionizing Radiation: Molecular Mechanisms and Clinical Application. Curr. Med. Chem. 2012, 19, 1741–1750. [Google Scholar] [CrossRef] [PubMed]
- Ababneh, Z.Q.; Alyassin, A.M.; Aljarrah, K.M.; Ababneh, A.M. Measurement of natural and artificial radioactivity in powdered milk consumed in Jordan and estimates of the corresponding annual effective dose. Radiat. Prot. Dosim. 2009, 138, 278–283. [Google Scholar] [CrossRef] [PubMed]
- Abedin, M.J.; Karim, M.R.; Khandaker, M.U.; Kamal, M.; Hossain, S.; Miah, M.H.A.; Bradley, D.A.; Faruque, M.R.I.; Sayyed, M.I. Dispersion of radionuclides from coal-fired brick kilns and concomitant impact on human health and the environment. Radiat. Phys. Chem. 2020, 177, 109165. [Google Scholar] [CrossRef]
- Adam, A.M.A.; Eltayeb, M.A.H. Multivariate statistical analysis of radioactive variables in two phosphate ores from Sudan. J. Environ. Radioact. 2012, 107, 23–43. [Google Scholar] [CrossRef]
- Ravisankar, R.; Chandramohan, J.; Chandrasekaran, A.; Prakash, J.P.; Vijayalakshmi, I.; Vijayagopal, P.; Venkatraman, B. Assessments of radioactivity concentration of natural radionuclides and radiological hazard indices in sediment samples from the East coast of Tamilnadu, India with statistical approach. Mar. Pollut. Bull. 2015, 97, 419–430. [Google Scholar] [CrossRef]


| Parameter | Symbol | Definition | Formula |
|---|---|---|---|
| Radium equivalent activity | Raeq | Radium equivalent activity is a weighted sum of the 226Ra, 232Th, and 40K activities according to the hypothesis that 370 Bq kg−1 of 226Ra, 259 Bq/kg of 232Th, and 4810 Bq/kg of 40K attain the same dose rates of gamma rays. | Raeq (Bq kg−1) = ARa + 1.43 ATh + 0.077 AK |
| Absorbed dose rate | D (nGy/h) | The absorbed dose rate is the radioactive factor that is applied to detect the effect of gamma radiation at 1 m from the radiation source in the air due to the concentrations of 238U, 232Th, and 40K. | Dair (nGy h−1) = 0.430 AU + 0.666 ATh + 0.042 AK |
| Outdoor annual effective dose | AEDout | The annual effective dose is a radioactive factor utilized to detect the exposure level of radiation during a stationary duration (1 year). | AEDout (mSv/y) = Dair (nGy/h) × 0.2 × 8760 (h/y) × 0.7 (Sv/Gy) × 10−6 (mSv/nGy) |
| Indoor annual effective dose | AEDin | AEDin (mSv/y) = Dair (nGy/h) × 0.8 × 8760 (h/y) × 0.7 (Sv/Gy) × 10−6 (mSv/nGy) | |
| Excess Lifetime Cancer Risk | ELCR | Excess lifetime cancer risk is the radioactive factor applied to detect fatal cancer resulting from gamma radiation exposure at a set duration time (DL = 70 years for public) and risk factor (RF = 0.05 Sv−1). | ELCR = AEDout × DL × RF |
| Effective dose to various body organs | Do | The computation of Do values is dependent on the scenario of exposure (outdoor—AEDout—and indoor—AEDin). The differentiation of effective doses among organs is governed by the dose conversion factor (F). The F values are estimated by the ICRP for each organ (F: 0.46—liver, 0.58—ovaries, 0.62—kidneys, 0.64—lungs, 0.69—bone marrow, 0.82—testes, and 0.68—whole body). | Do (mSvy−1) = AED × F |
| Spot No. | Zr1 | Zr2 | Zr3 | Zr4 | Zr5 |
|---|---|---|---|---|---|
| Si | 29.81 | 21.85 | 21.80 | 23.43 | 25.55 |
| Al | n.d. | 3.74 | 4.15 | 1.60 | 0.78 |
| Fe | 0.76 | 4.96 | 3.49 | 0.69 | 0.64 |
| Mg | n.d. | 2.16 | 2.96 | 0.05 | 0.06 |
| Ca | n.d. | 0.40 | n.d. | 0.25 | n.d. |
| K | n.d. | n.d. | n.d. | 0.55 | n.d. |
| Hf | 1.90 | 1.29 | 2.74 | 3.19 | 2.59 |
| Zr | 67.53 | 64.45 | 64.41 | 67.36 | 68.75 |
| U | n.d. | n.d. | 0.46 | 0.60 | n.d. |
| Ni | n.d. | 1.15 | n.d. | 2.29 | 1.63 |
| Total | 100 | ||||
| Analyzed Samples | Identified Minerals | ||||
|---|---|---|---|---|---|
| Tenorite | Quartz | ||||
| (ASTM) Card No. | |||||
| (5-0661) | (5-0490) | ||||
| dÅ | I/I0 | dÅ | I/I0 | dÅ | I/I0 |
| 4.29 | 18 | 4.26 | 35 | ||
| 3.38 | 100 | 3.343 | 100 | ||
| 2.76 | 10 | 2.751 | 12 | ||
| 2.53 | 97 | 2.523 | 100 | ||
| 2.45 | 9 | 2.458 | 12 | ||
| 2.33 | 93 | 2.323 | 96 | ||
| 2.16 | 4 | 2.128 | 9 | ||
| 1.87 | 21 | 1.866 | 25 | ||
| 1.83 | 11 | 1.817 | 17 | ||
| 1.59 | 7 | 1.581 | 14 | ||
| 1.55 | 3 | 1.541 | 15 | ||
| 1.51 | 14 | 1.505 | 20 | ||
| N | Mean | SD | Min | Max | Skewness | Kurtosis | CV, % | |
|---|---|---|---|---|---|---|---|---|
| U-238 | 231 | 103 | 91 | 19 | 564 | 3.22 | 11.20 | 88 |
| Th-232 | 231 | 78 | 19 | 50 | 174 | 1.35 | 3.20 | 24 |
| K-40 | 231 | 1484 | 334 | 657 | 3098 | 1.15 | 2.67 | 22 |
| DF | Statistic | p-Value | |
|---|---|---|---|
| U-238 | 231 | 0.26 | 6 × 10⁻¹⁴ |
| Th-232 | 231 | 0.08 | 0.10 |
| K-40 | 231 | 0.10 | 0.02 |
| Country | 238U | 232Th | 40K | References |
|---|---|---|---|---|
| Spain | 84 | 42 | 1138 | [68] |
| Iran | 77.4 | 44.5 | 1017.2 | [69] |
| India | 25.88 | 42.82 | 560.6 | [70] |
| Jordan | 41.52 | 58.42 | 897 | [71] |
| Palestine | 71 | 82 | 780 | [72] |
| Egypt | 137 | 82 | 1082 | [73] |
| Greece | 74 | 85 | 881 | [74] |
| Turkey | 80 | 101 | 974 | [75] |
| Saudi Arabia | 28.82 | 34.83 | 665.08 | [76] |
| Egypt | 103 | 78 | 1484 | Present study |
| Raeq | Dair | AEDout | AEDin | ELCRout × 10−6 | ELCRin × 10−6 | ELCRt × 10−6 | |
|---|---|---|---|---|---|---|---|
| Mean ± SD | 330 ± 120 | 156 ± 56 | 0.19 ± 0.07 | 0.77 ± 0.28 | 0.67 ± 0.24 | 2.98 ± 0.96 | 3.35 ± 1.21 |
| Range | 177–971 | 84–452 | 0.10–0.55 | 0.41–2.22 | 0.36–1.94 | 1.43–7.75 | 1.79–9.69 |
| U-238 | Th-232 | K-40 | Raeq | Dair | AEDout | AEDin | ELCR | |
|---|---|---|---|---|---|---|---|---|
| U-238 | 1 | |||||||
| Th-232 | 0.34 | 1 | ||||||
| K-40 | 0.54 | 0.37 | 1 | |||||
| Raeq | 0.95 | 0.56 | 0.71 | 1 | ||||
| Dair | 0.95 | 0.55 | 0.73 | 0.99 | 1 | |||
| AEDout | 0.95 | 0.55 | 0.73 | 0.99 | 0.99 | 1 | ||
| AEDin | 0.95 | 0.55 | 0.73 | 0.99 | 0.99 | 0.99 | 1 | |
| ELCR | 0.95 | 0.55 | 0.73 | 0.99 | 0.99 | 0.99 | 0.99 | 1 |
Publisher’s Note: MDPI stays neutral with regard to jurisdictional claims in published maps and institutional affiliations. |
© 2022 by the authors. Licensee MDPI, Basel, Switzerland. This article is an open access article distributed under the terms and conditions of the Creative Commons Attribution (CC BY) license (https://creativecommons.org/licenses/by/4.0/).
Share and Cite
Abdel Gawad, A.E.; Ali, K.G.; Wahed, A.A.A.; Alsafi, K.; Khafaji, M.; Albahiti, S.; Khalil, M.; Masoud, M.S.; Hanfi, M.Y. Excess Lifetime Cancer Risk Associated with Granite Bearing Radioactive Minerals and Valuable Metals, Monqul Area, North Eastern Desert, Egypt. Materials 2022, 15, 4307. https://doi.org/10.3390/ma15124307
Abdel Gawad AE, Ali KG, Wahed AAA, Alsafi K, Khafaji M, Albahiti S, Khalil M, Masoud MS, Hanfi MY. Excess Lifetime Cancer Risk Associated with Granite Bearing Radioactive Minerals and Valuable Metals, Monqul Area, North Eastern Desert, Egypt. Materials. 2022; 15(12):4307. https://doi.org/10.3390/ma15124307
Chicago/Turabian StyleAbdel Gawad, Ahmed E., Khaled G. Ali, Adel A. Abdel Wahed, Khalid Alsafi, Mawya Khafaji, Sarah Albahiti, Magdy Khalil, Masoud S. Masoud, and Mohamed Y. Hanfi. 2022. "Excess Lifetime Cancer Risk Associated with Granite Bearing Radioactive Minerals and Valuable Metals, Monqul Area, North Eastern Desert, Egypt" Materials 15, no. 12: 4307. https://doi.org/10.3390/ma15124307
APA StyleAbdel Gawad, A. E., Ali, K. G., Wahed, A. A. A., Alsafi, K., Khafaji, M., Albahiti, S., Khalil, M., Masoud, M. S., & Hanfi, M. Y. (2022). Excess Lifetime Cancer Risk Associated with Granite Bearing Radioactive Minerals and Valuable Metals, Monqul Area, North Eastern Desert, Egypt. Materials, 15(12), 4307. https://doi.org/10.3390/ma15124307