
Development of a Kinetic Model for the Redox Reactions of Co2.4Ni0.6O4 and SiO2/Co2.4Ni0.6O4 Oxides for Thermochemical Energy Storage

 , , , and
Abstract
1. Introduction
2. Materials and Methods
3. Results
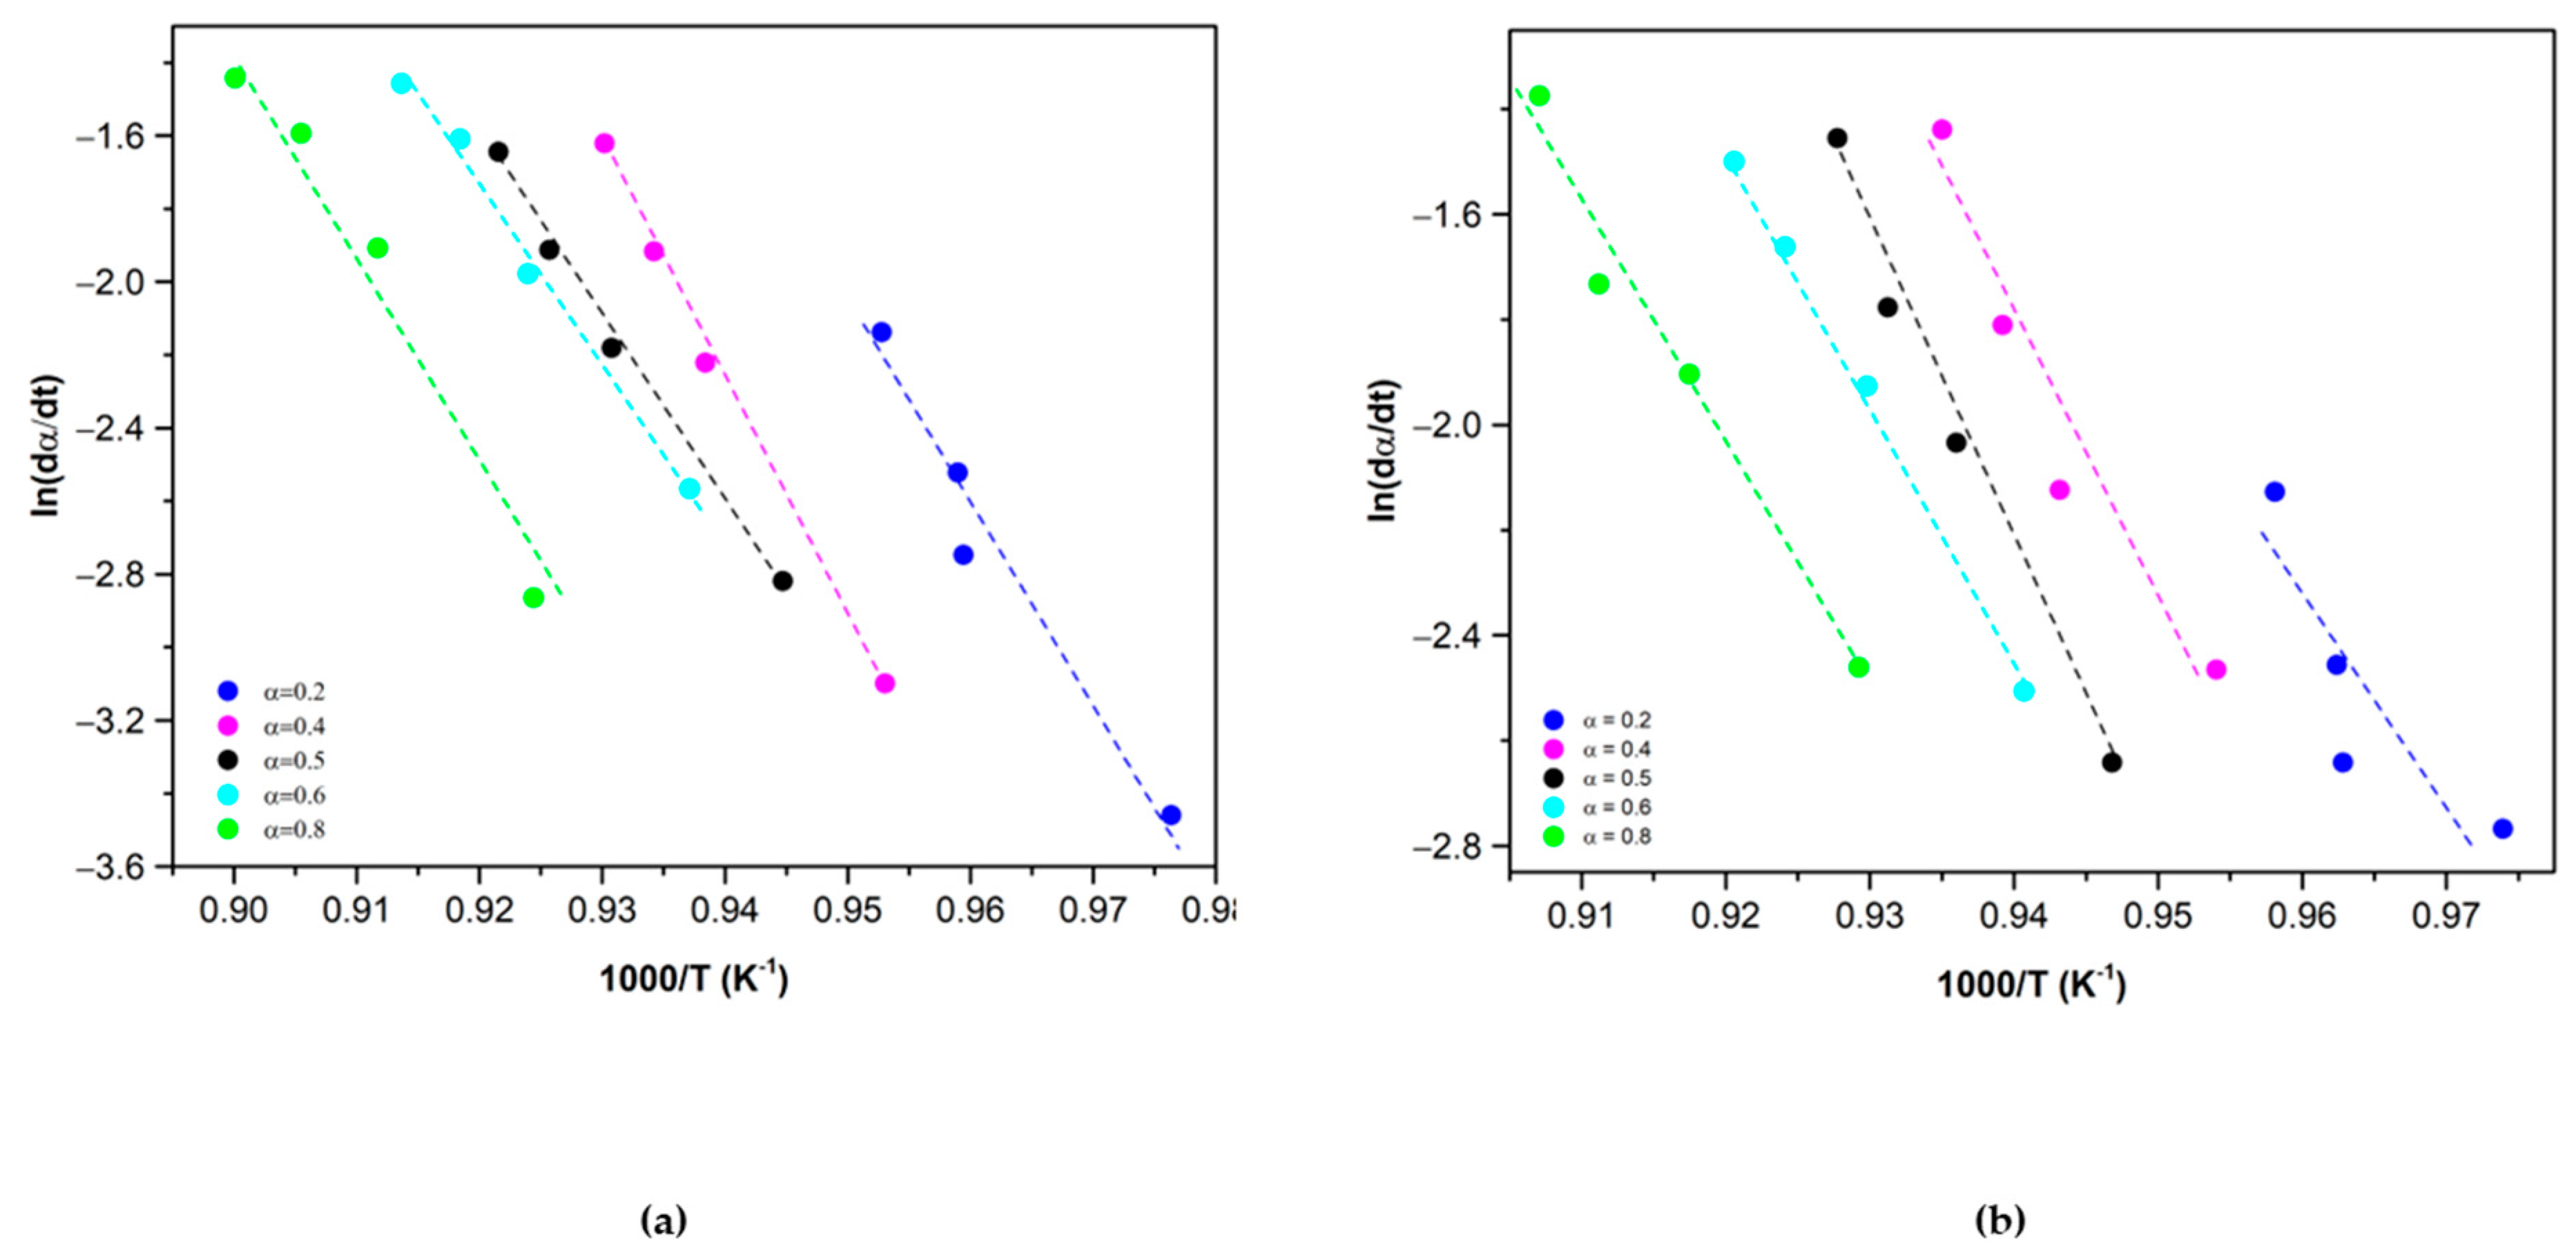
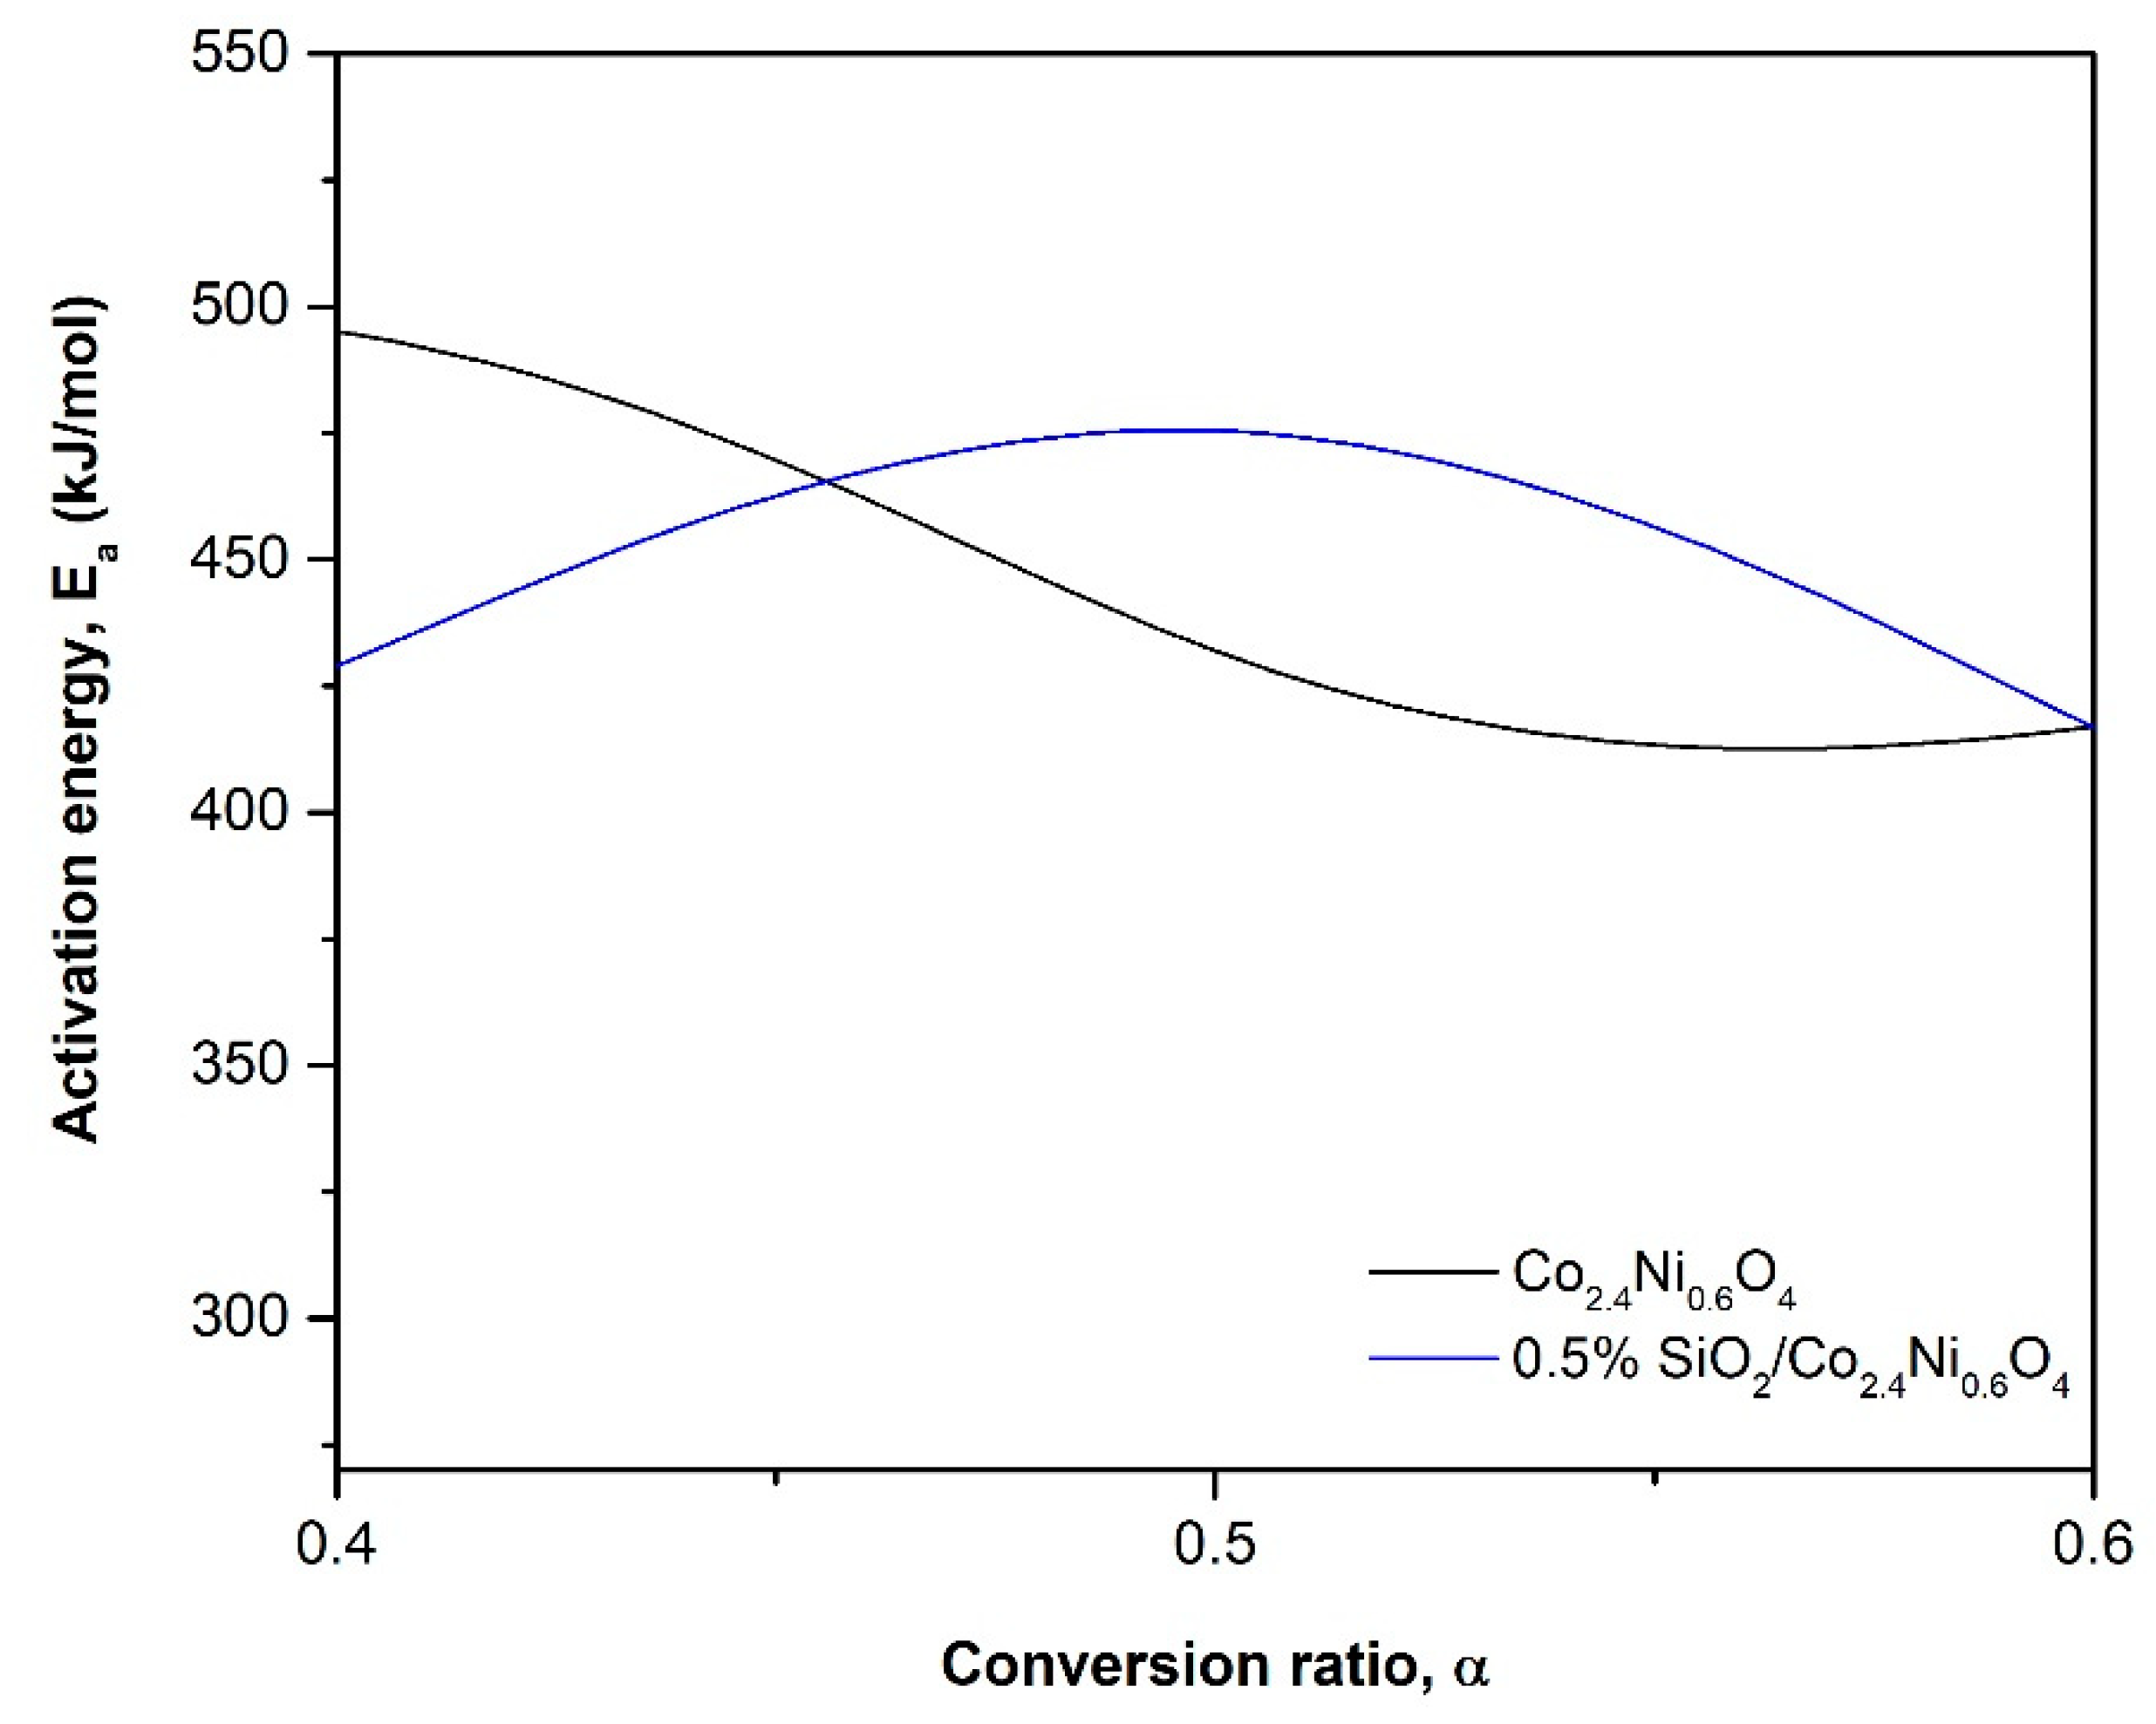
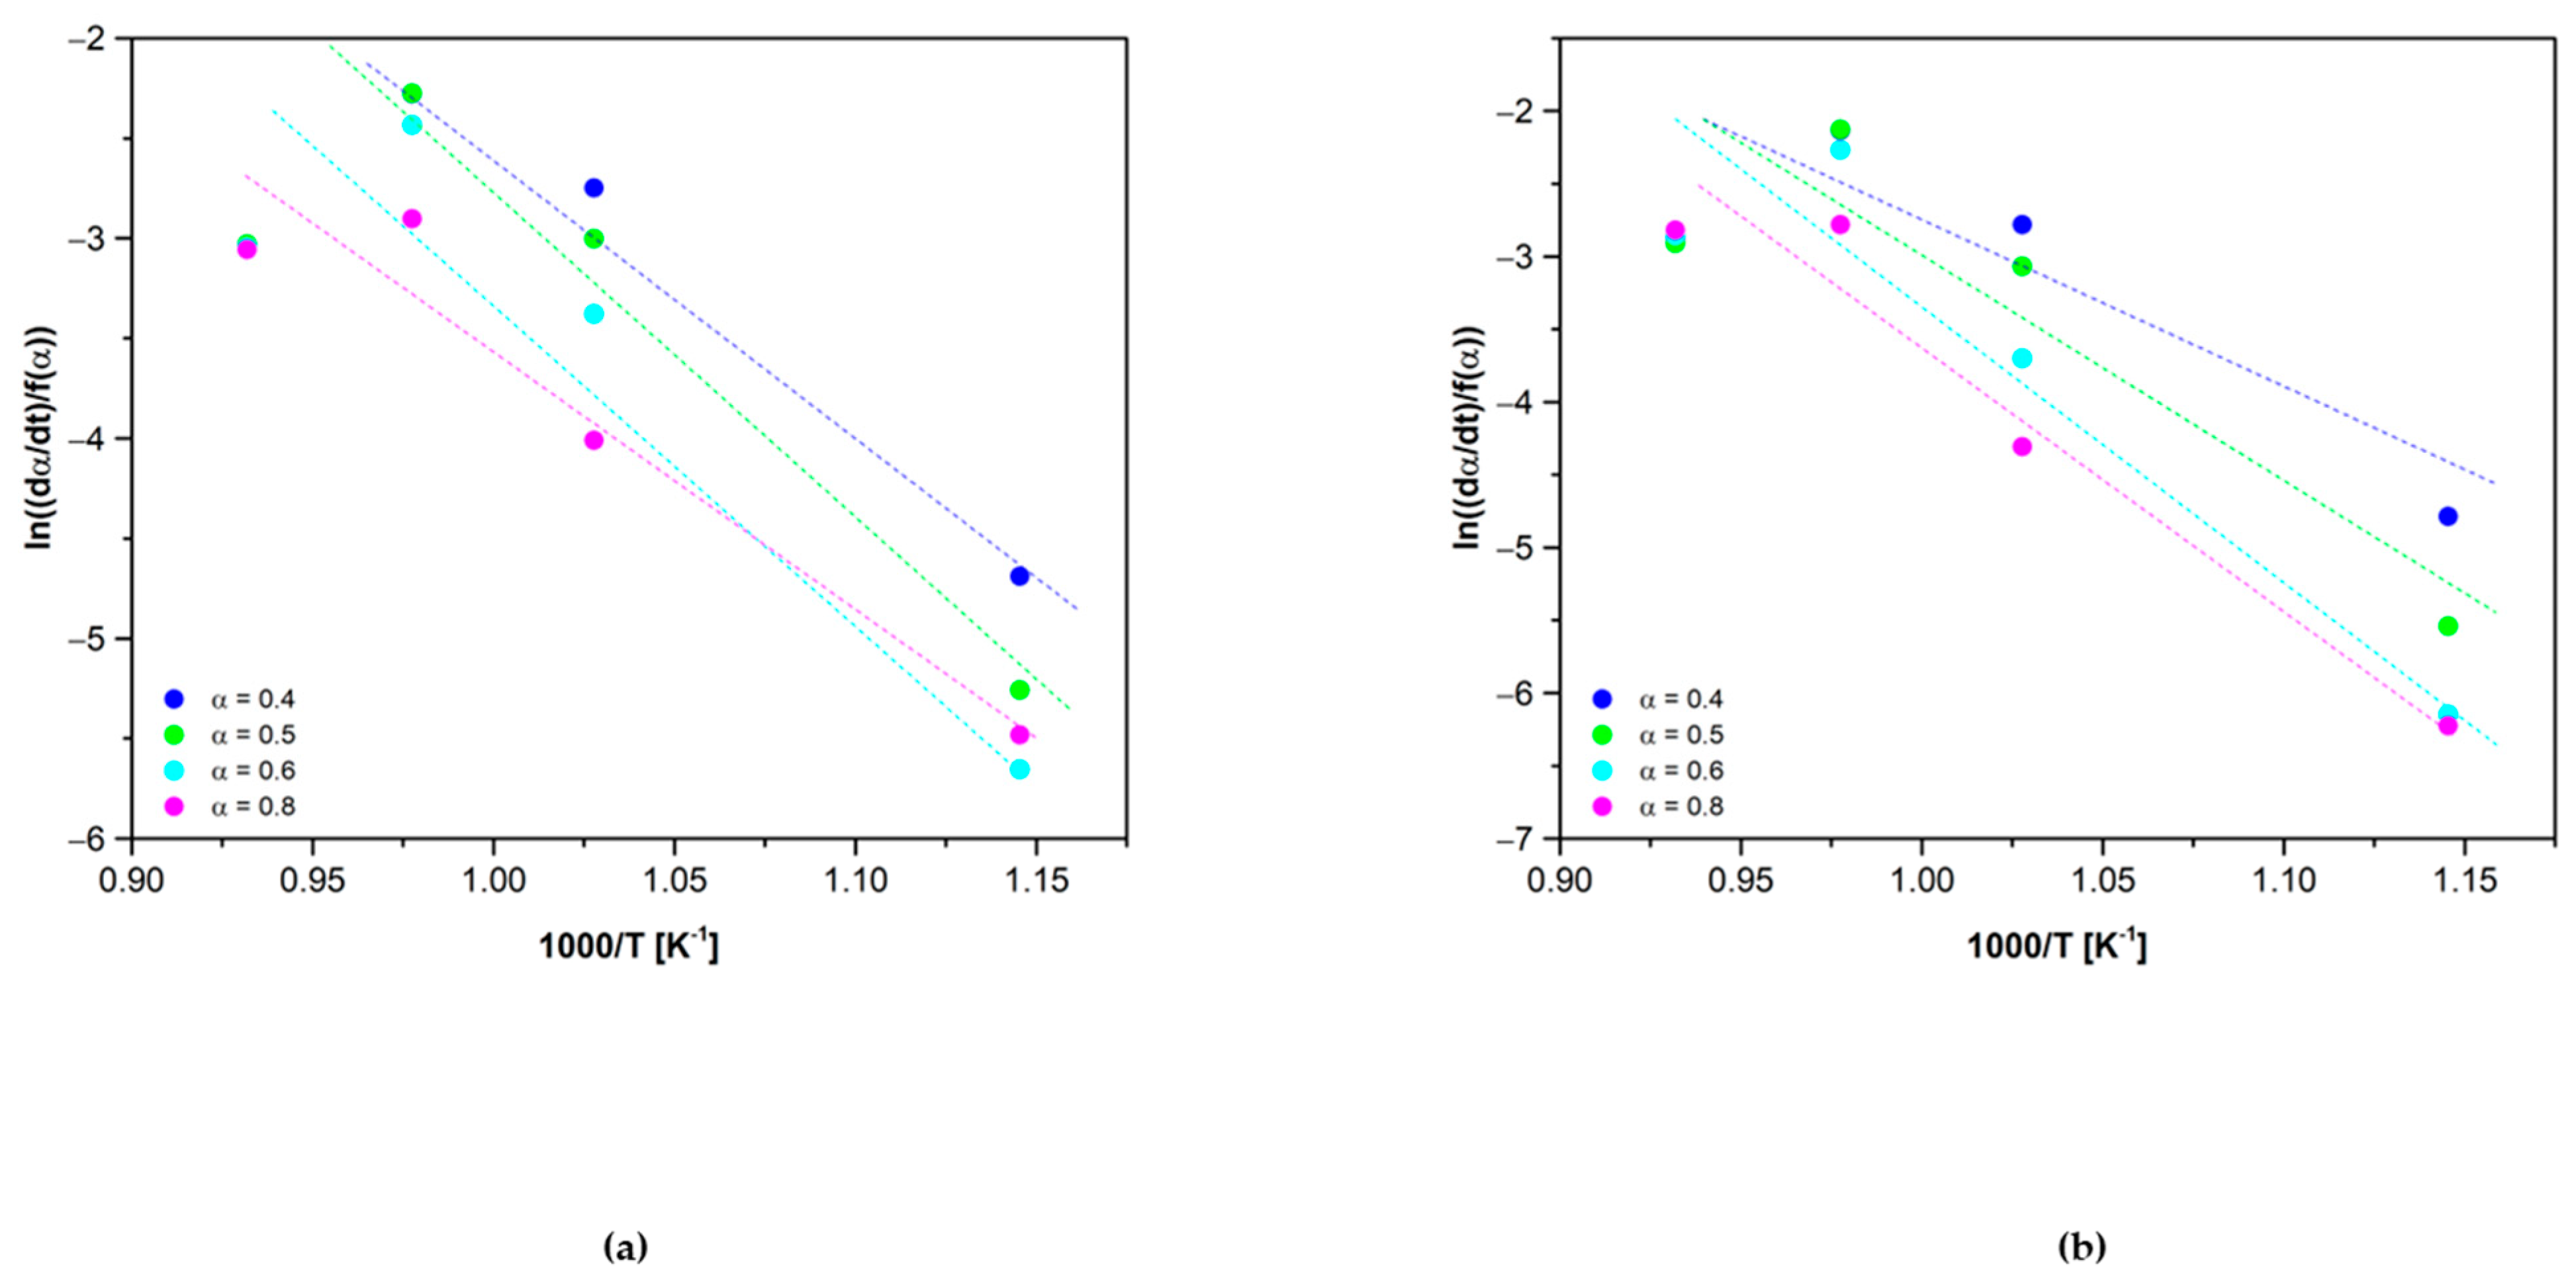
3.1. Kinetic Analysis
3.2. Results and Discussion
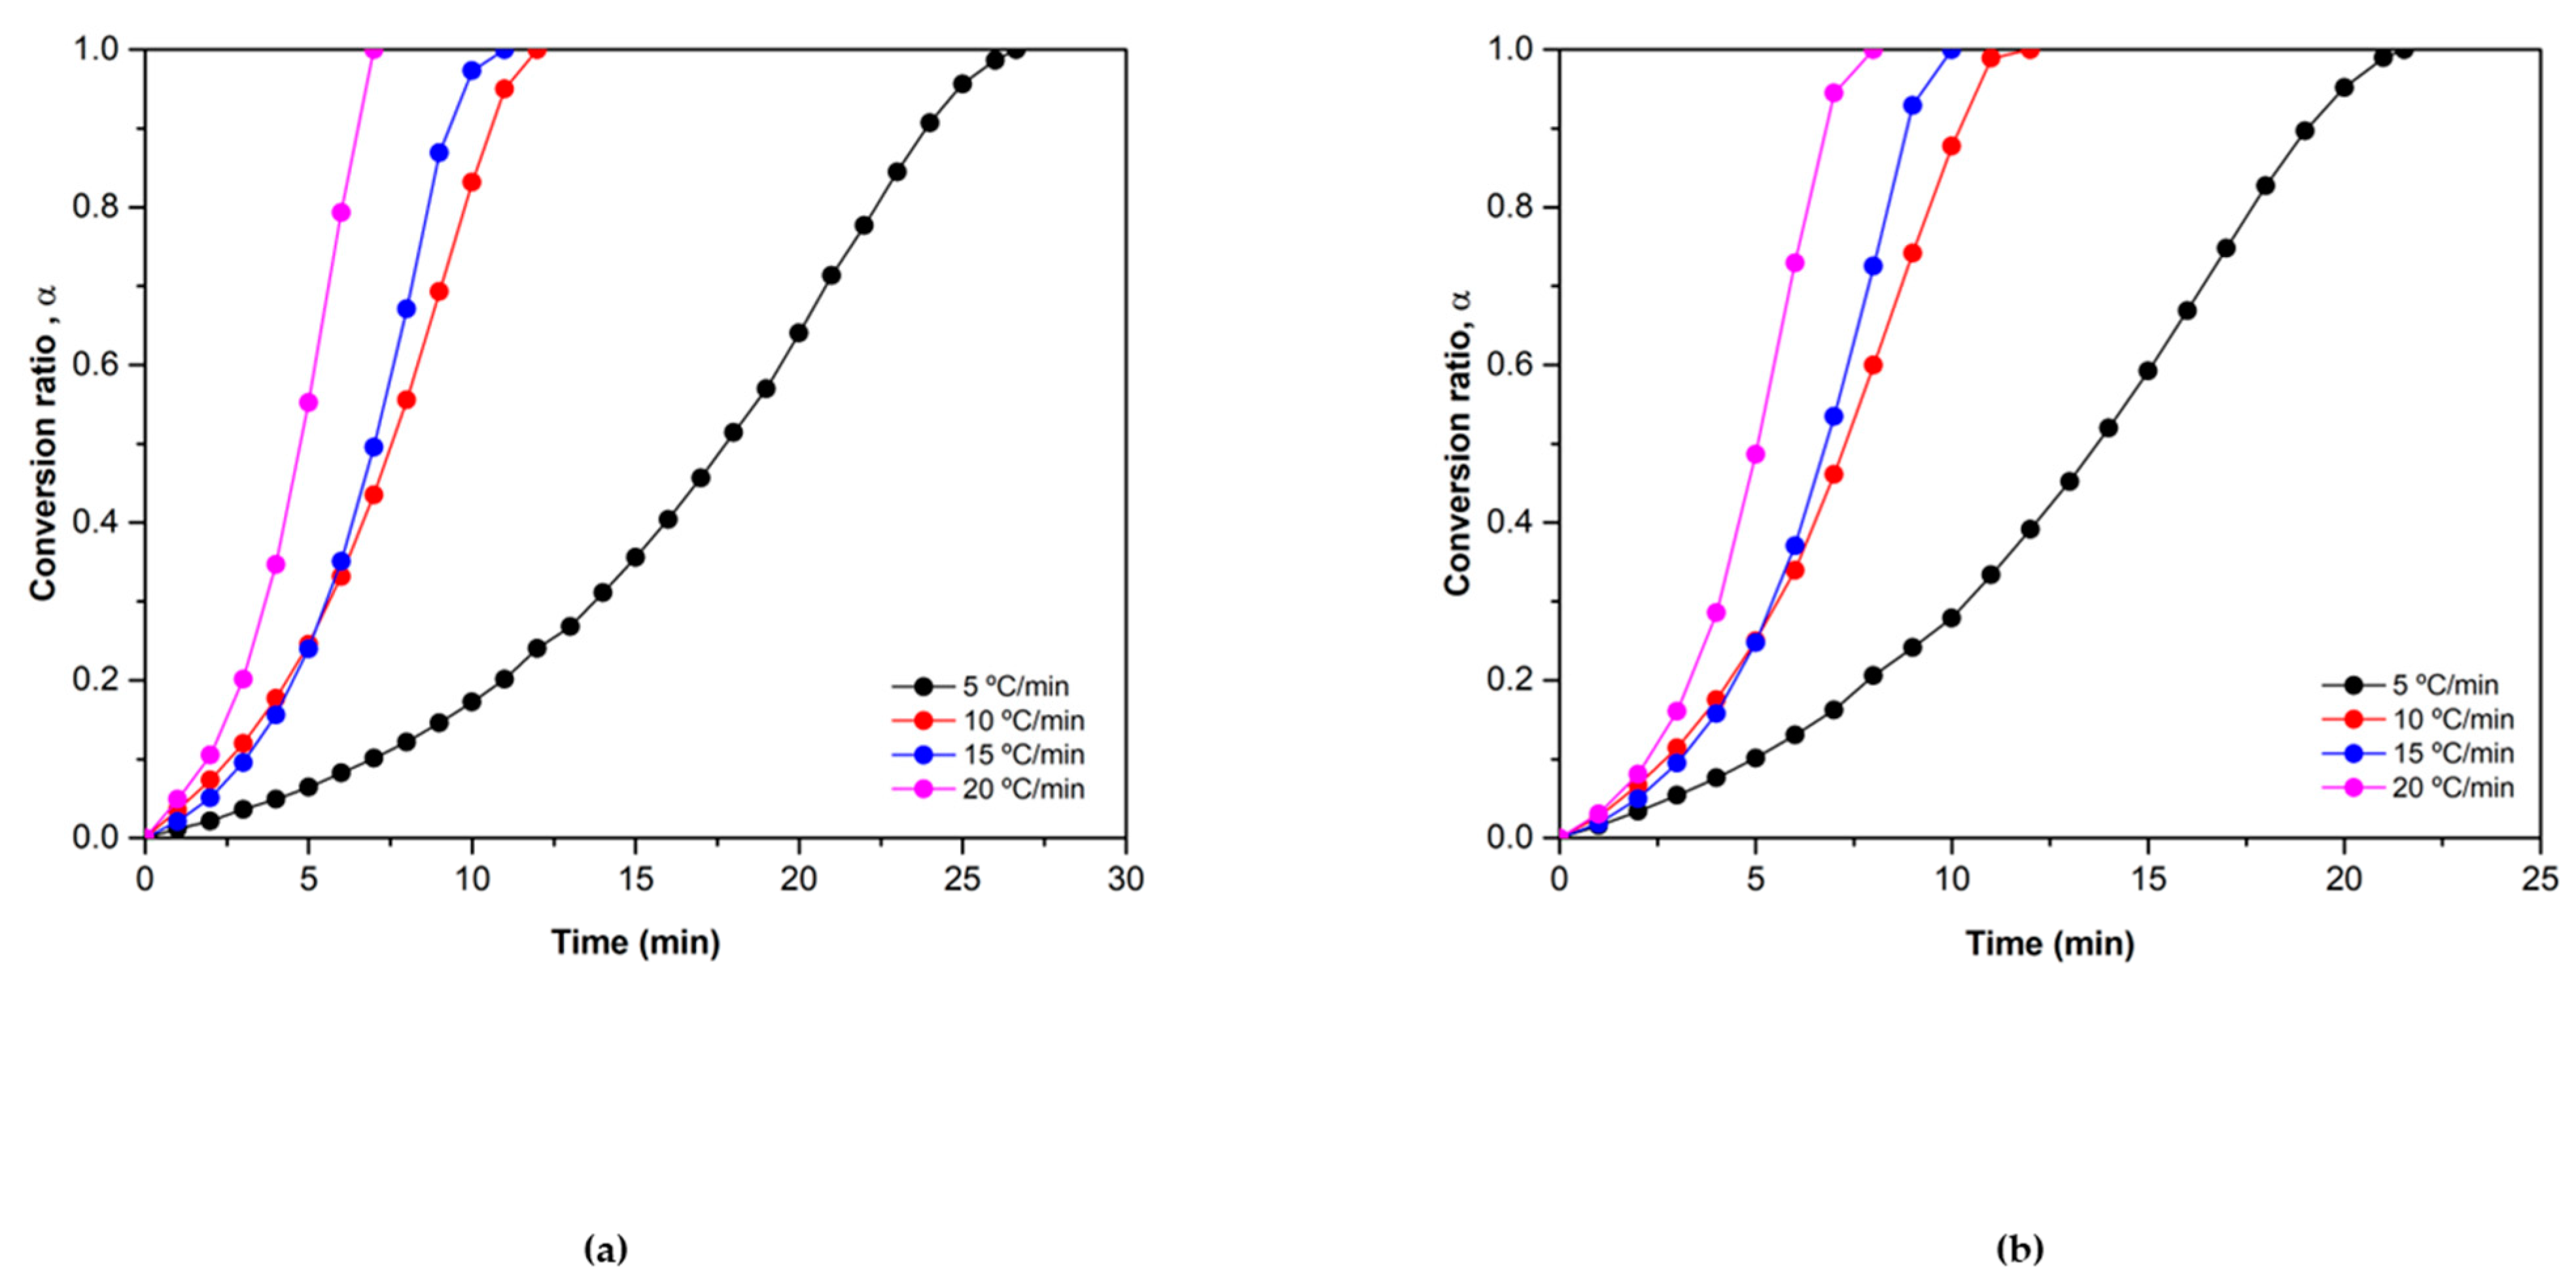
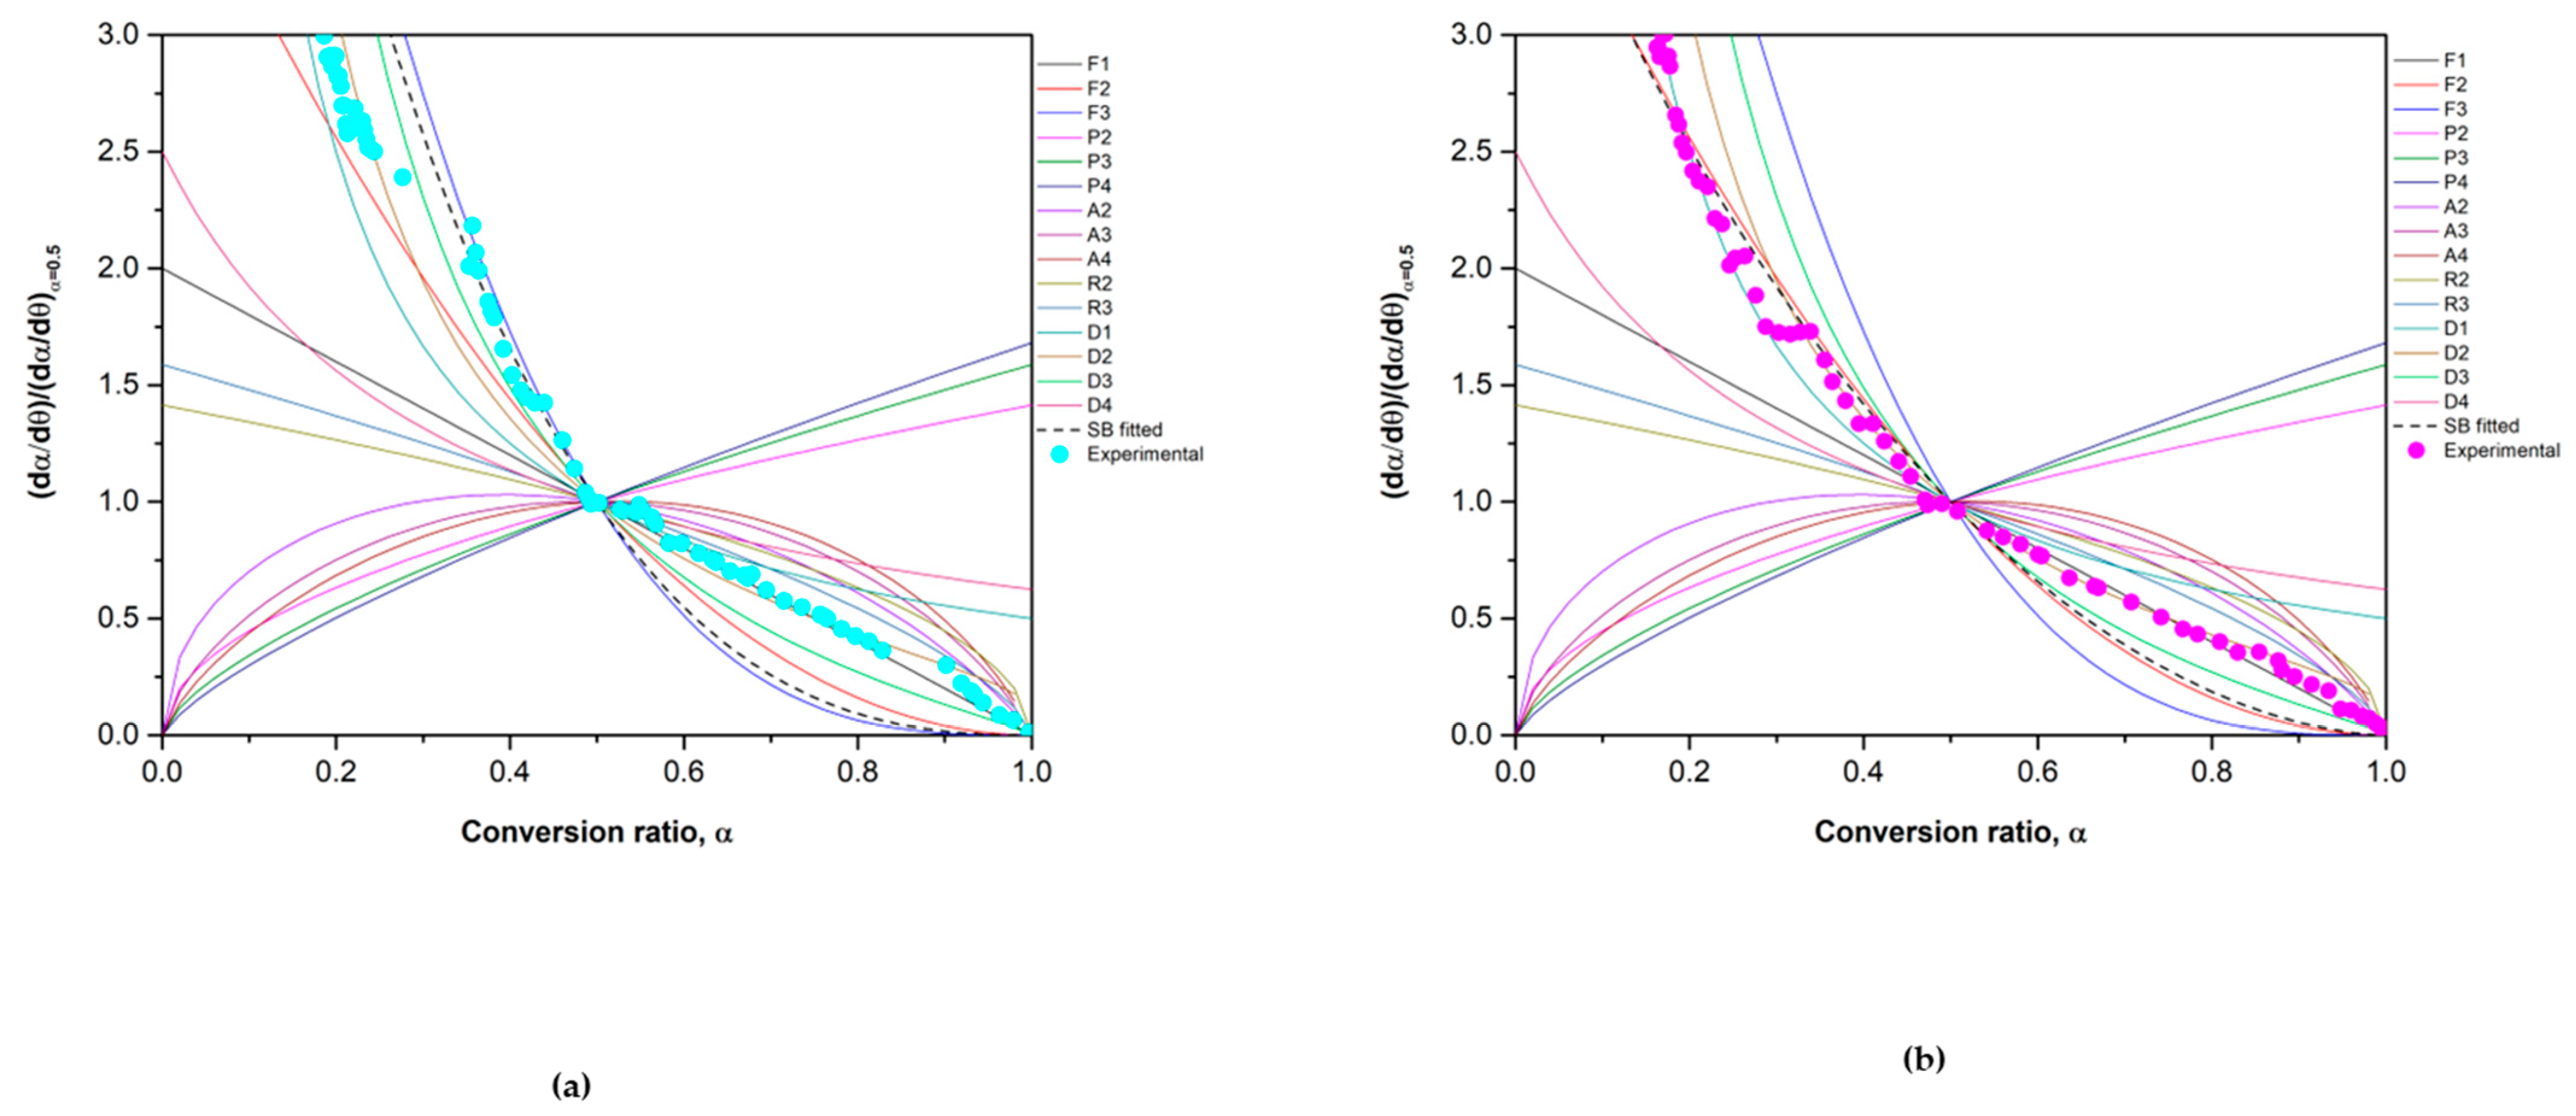
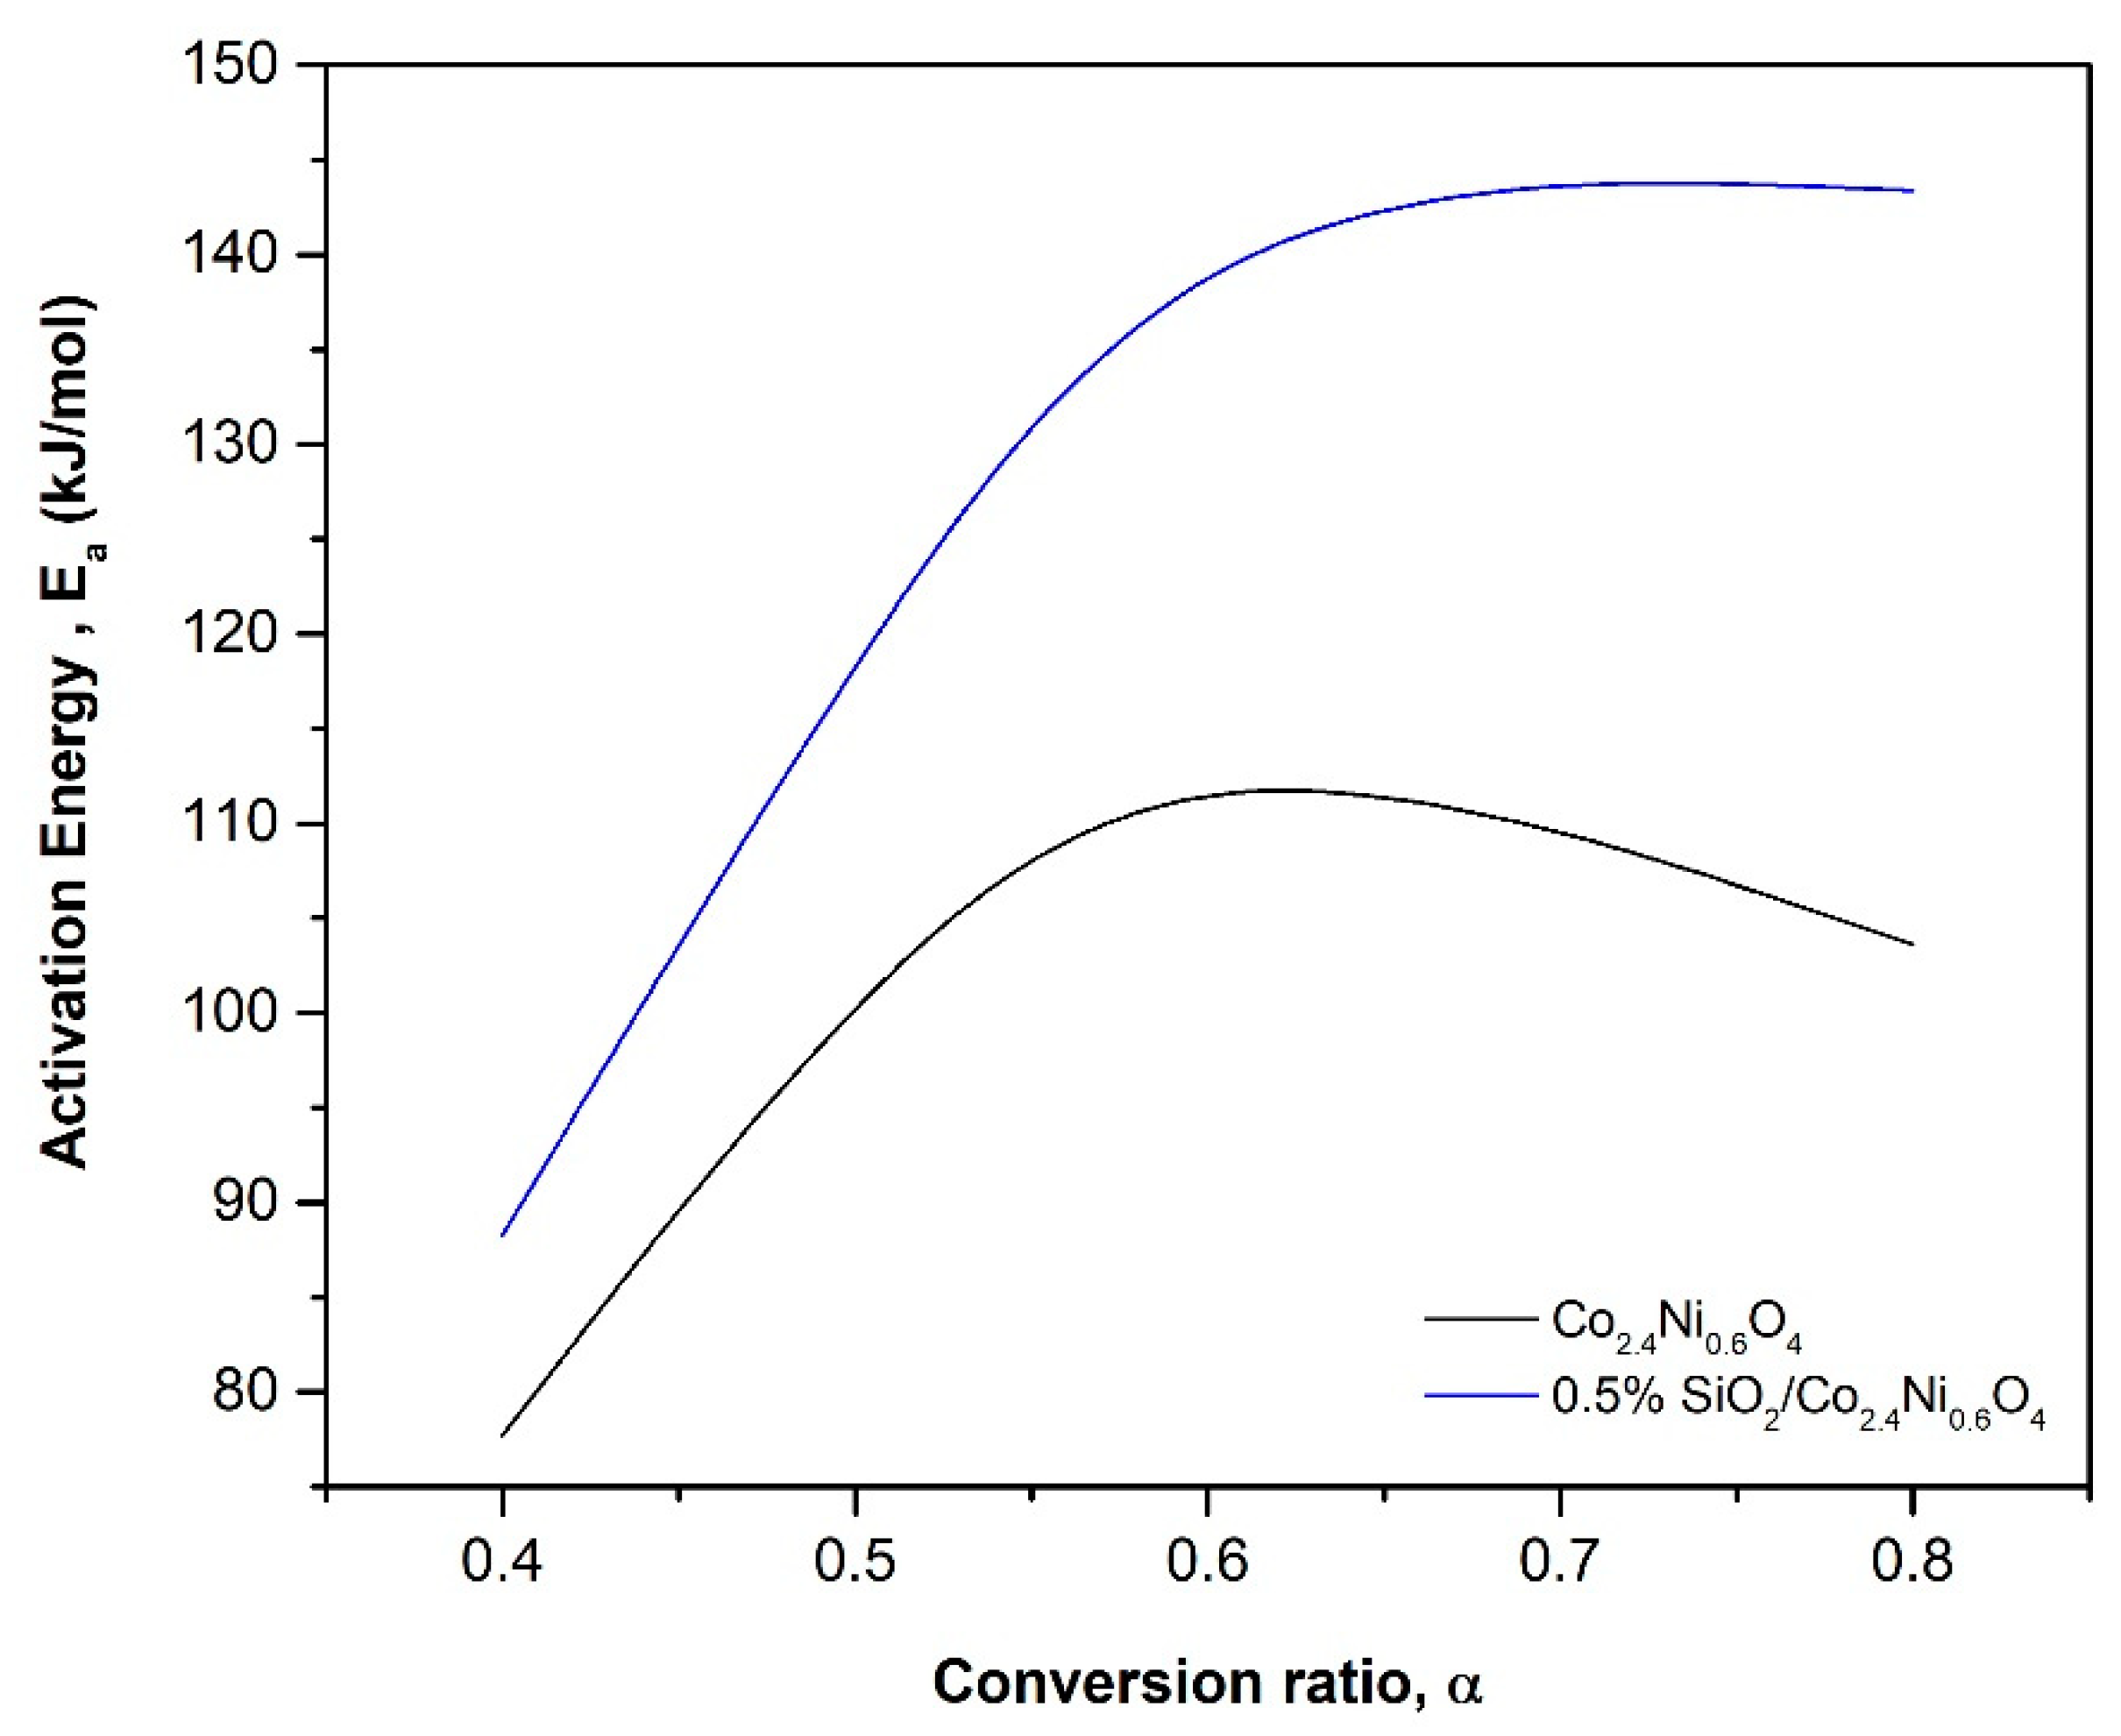
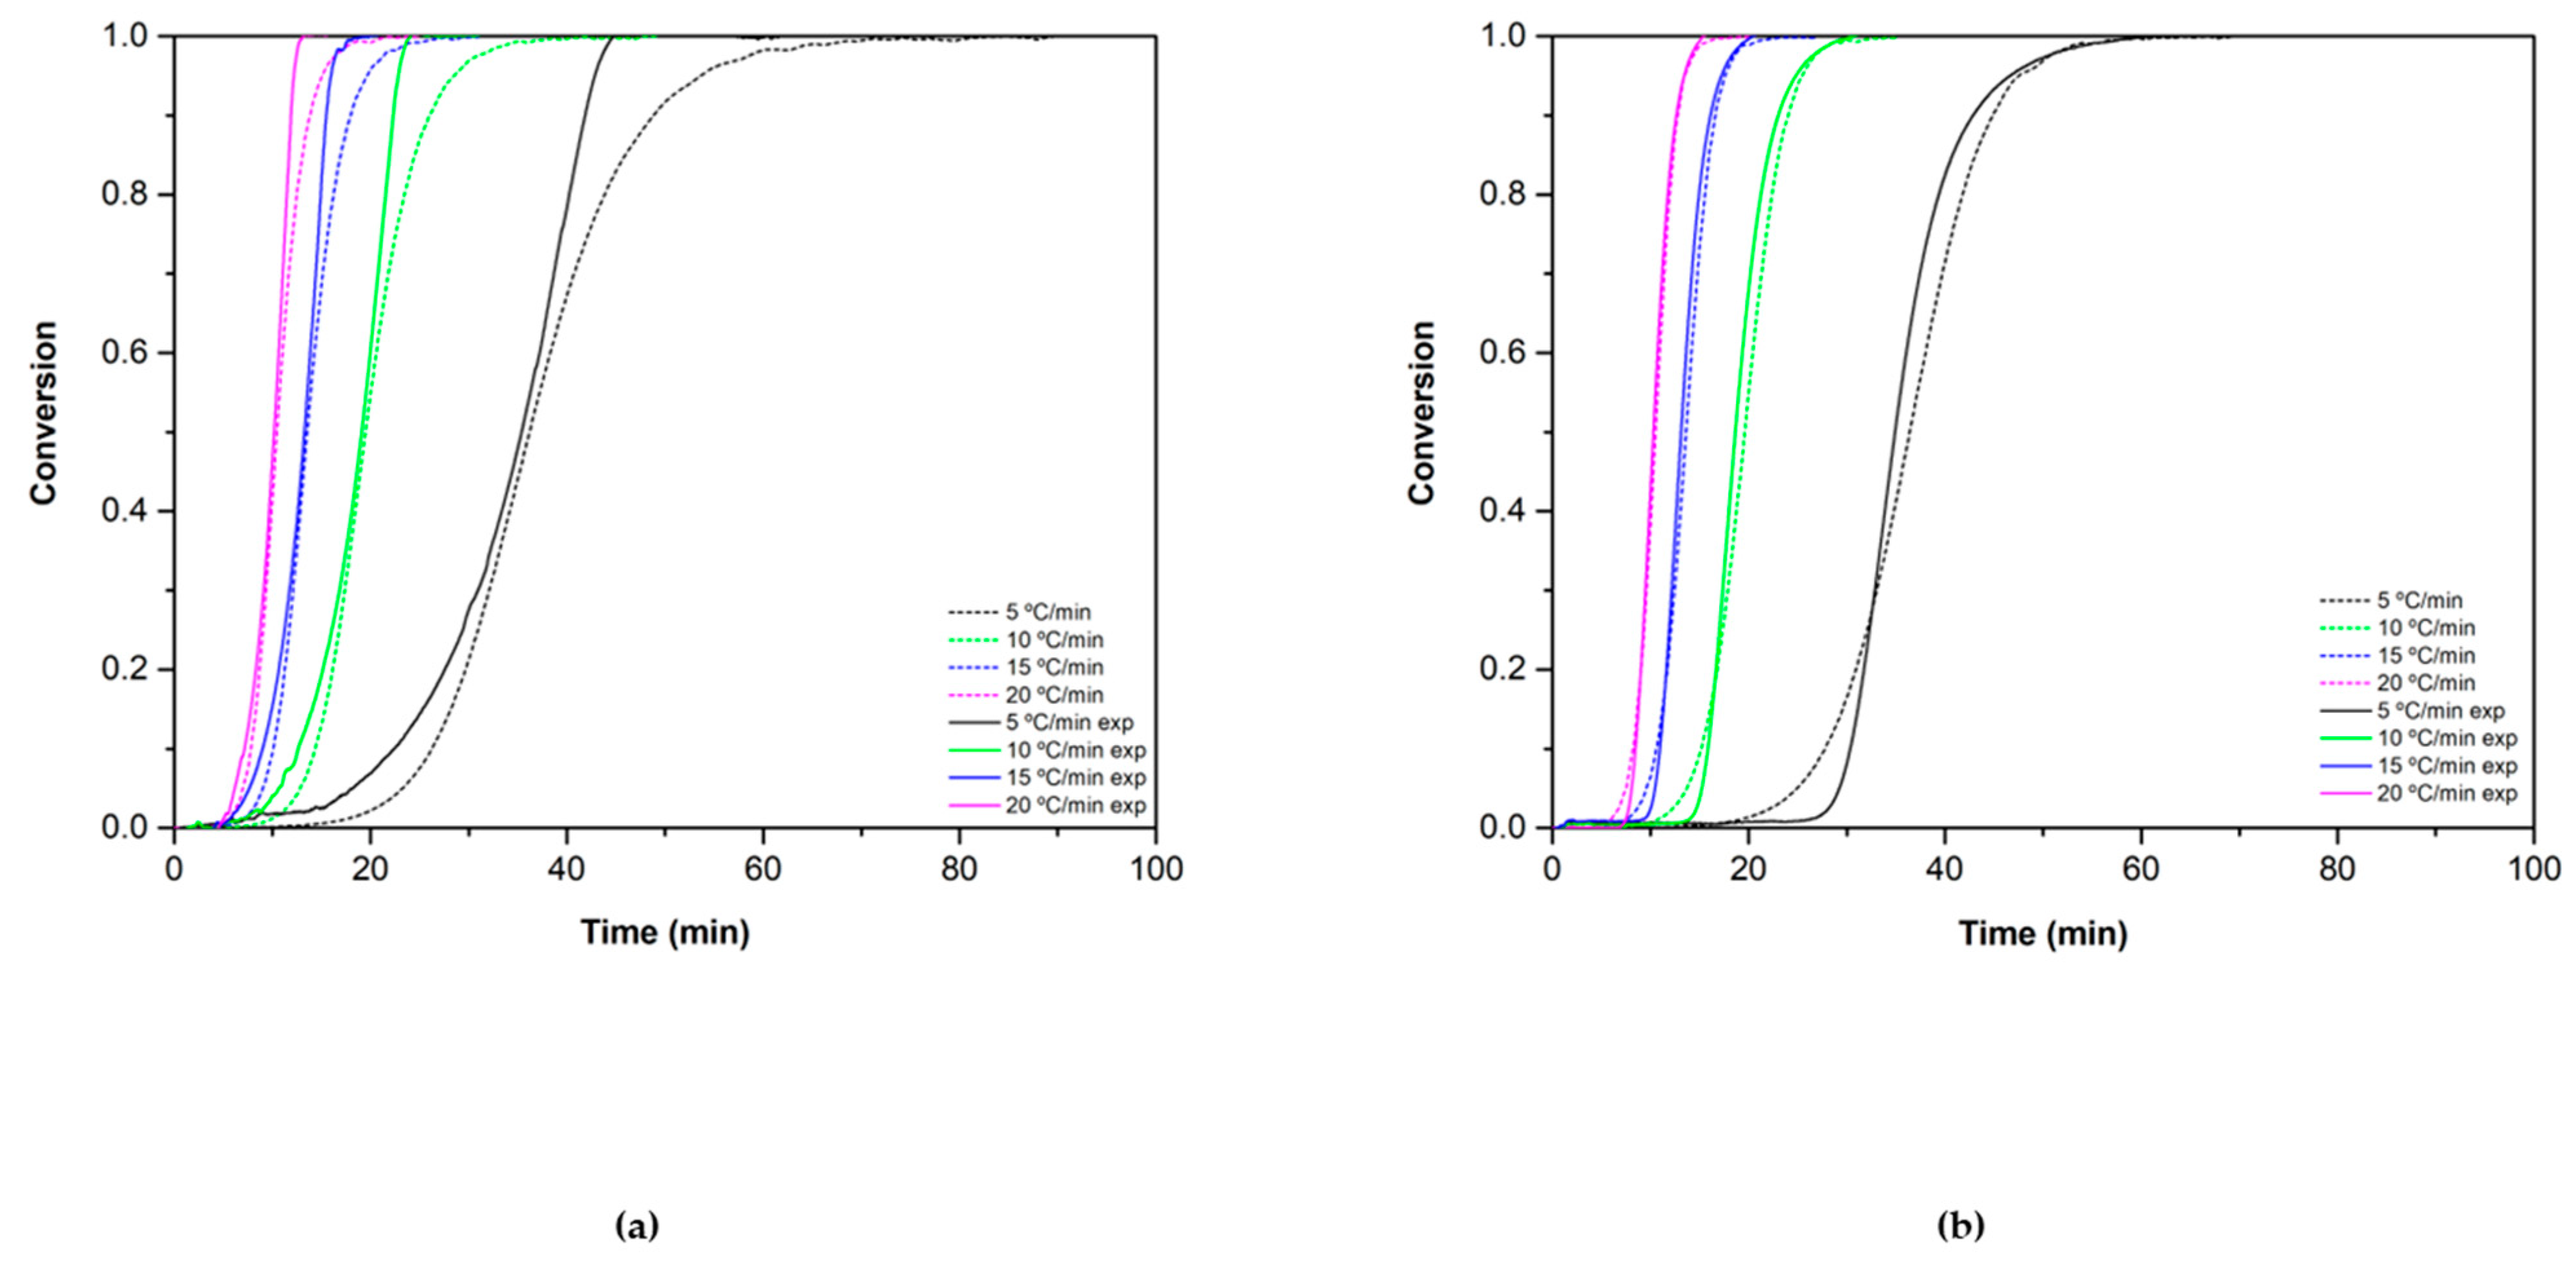
3.2.1. Reduction Reaction Rate
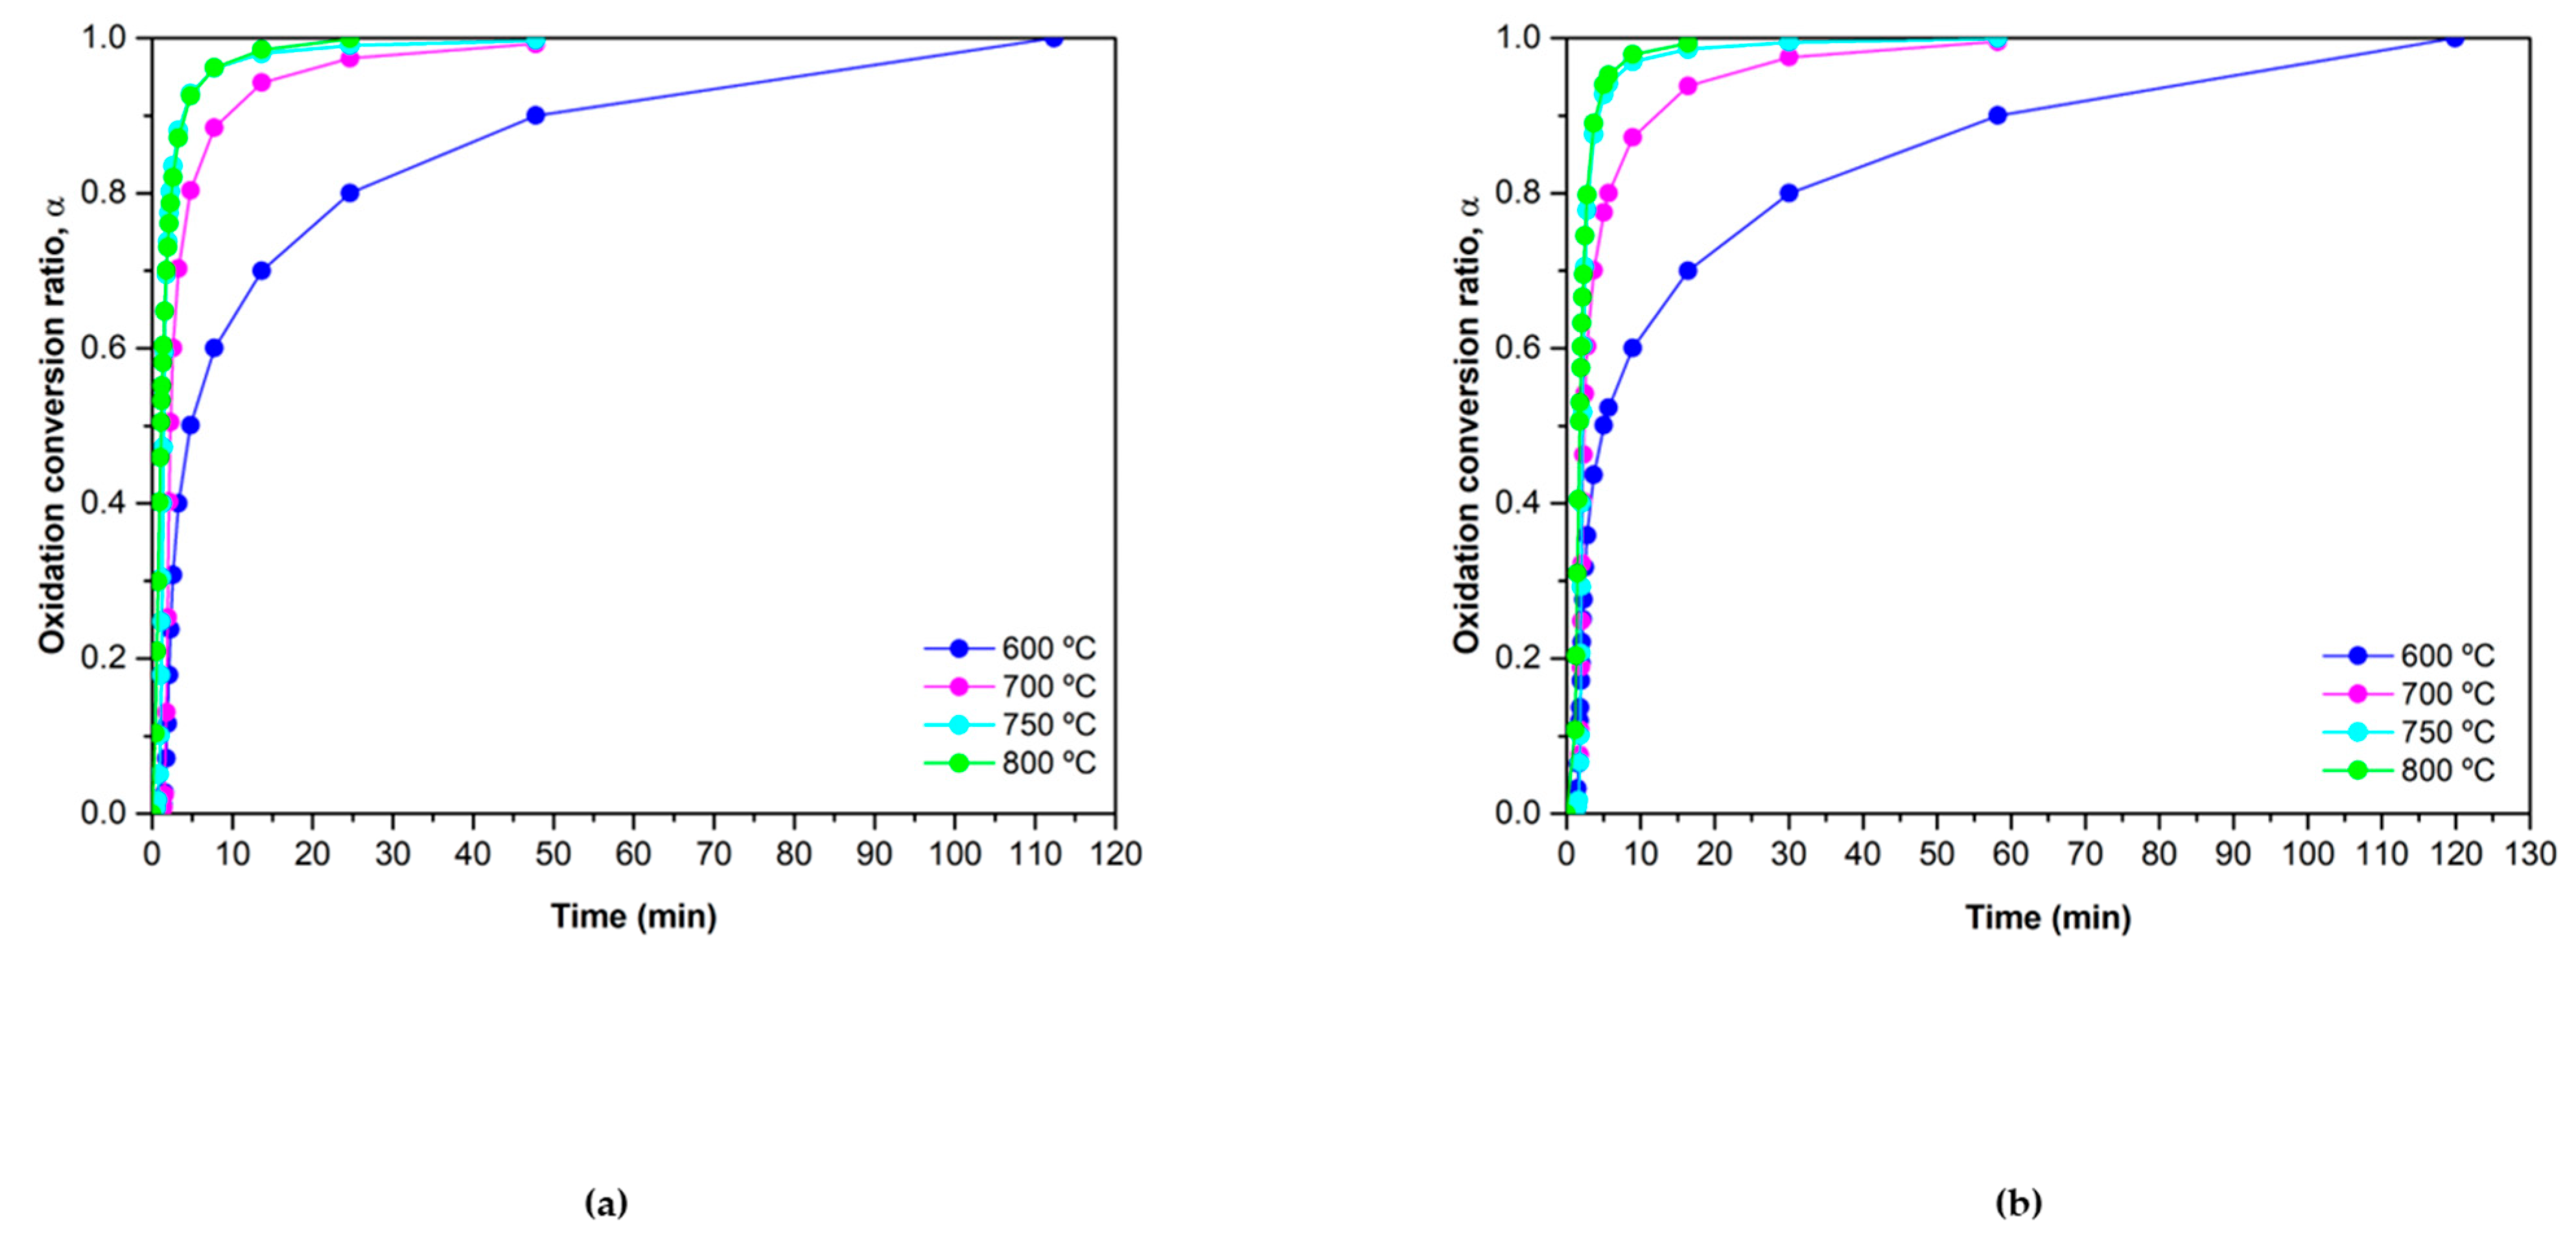
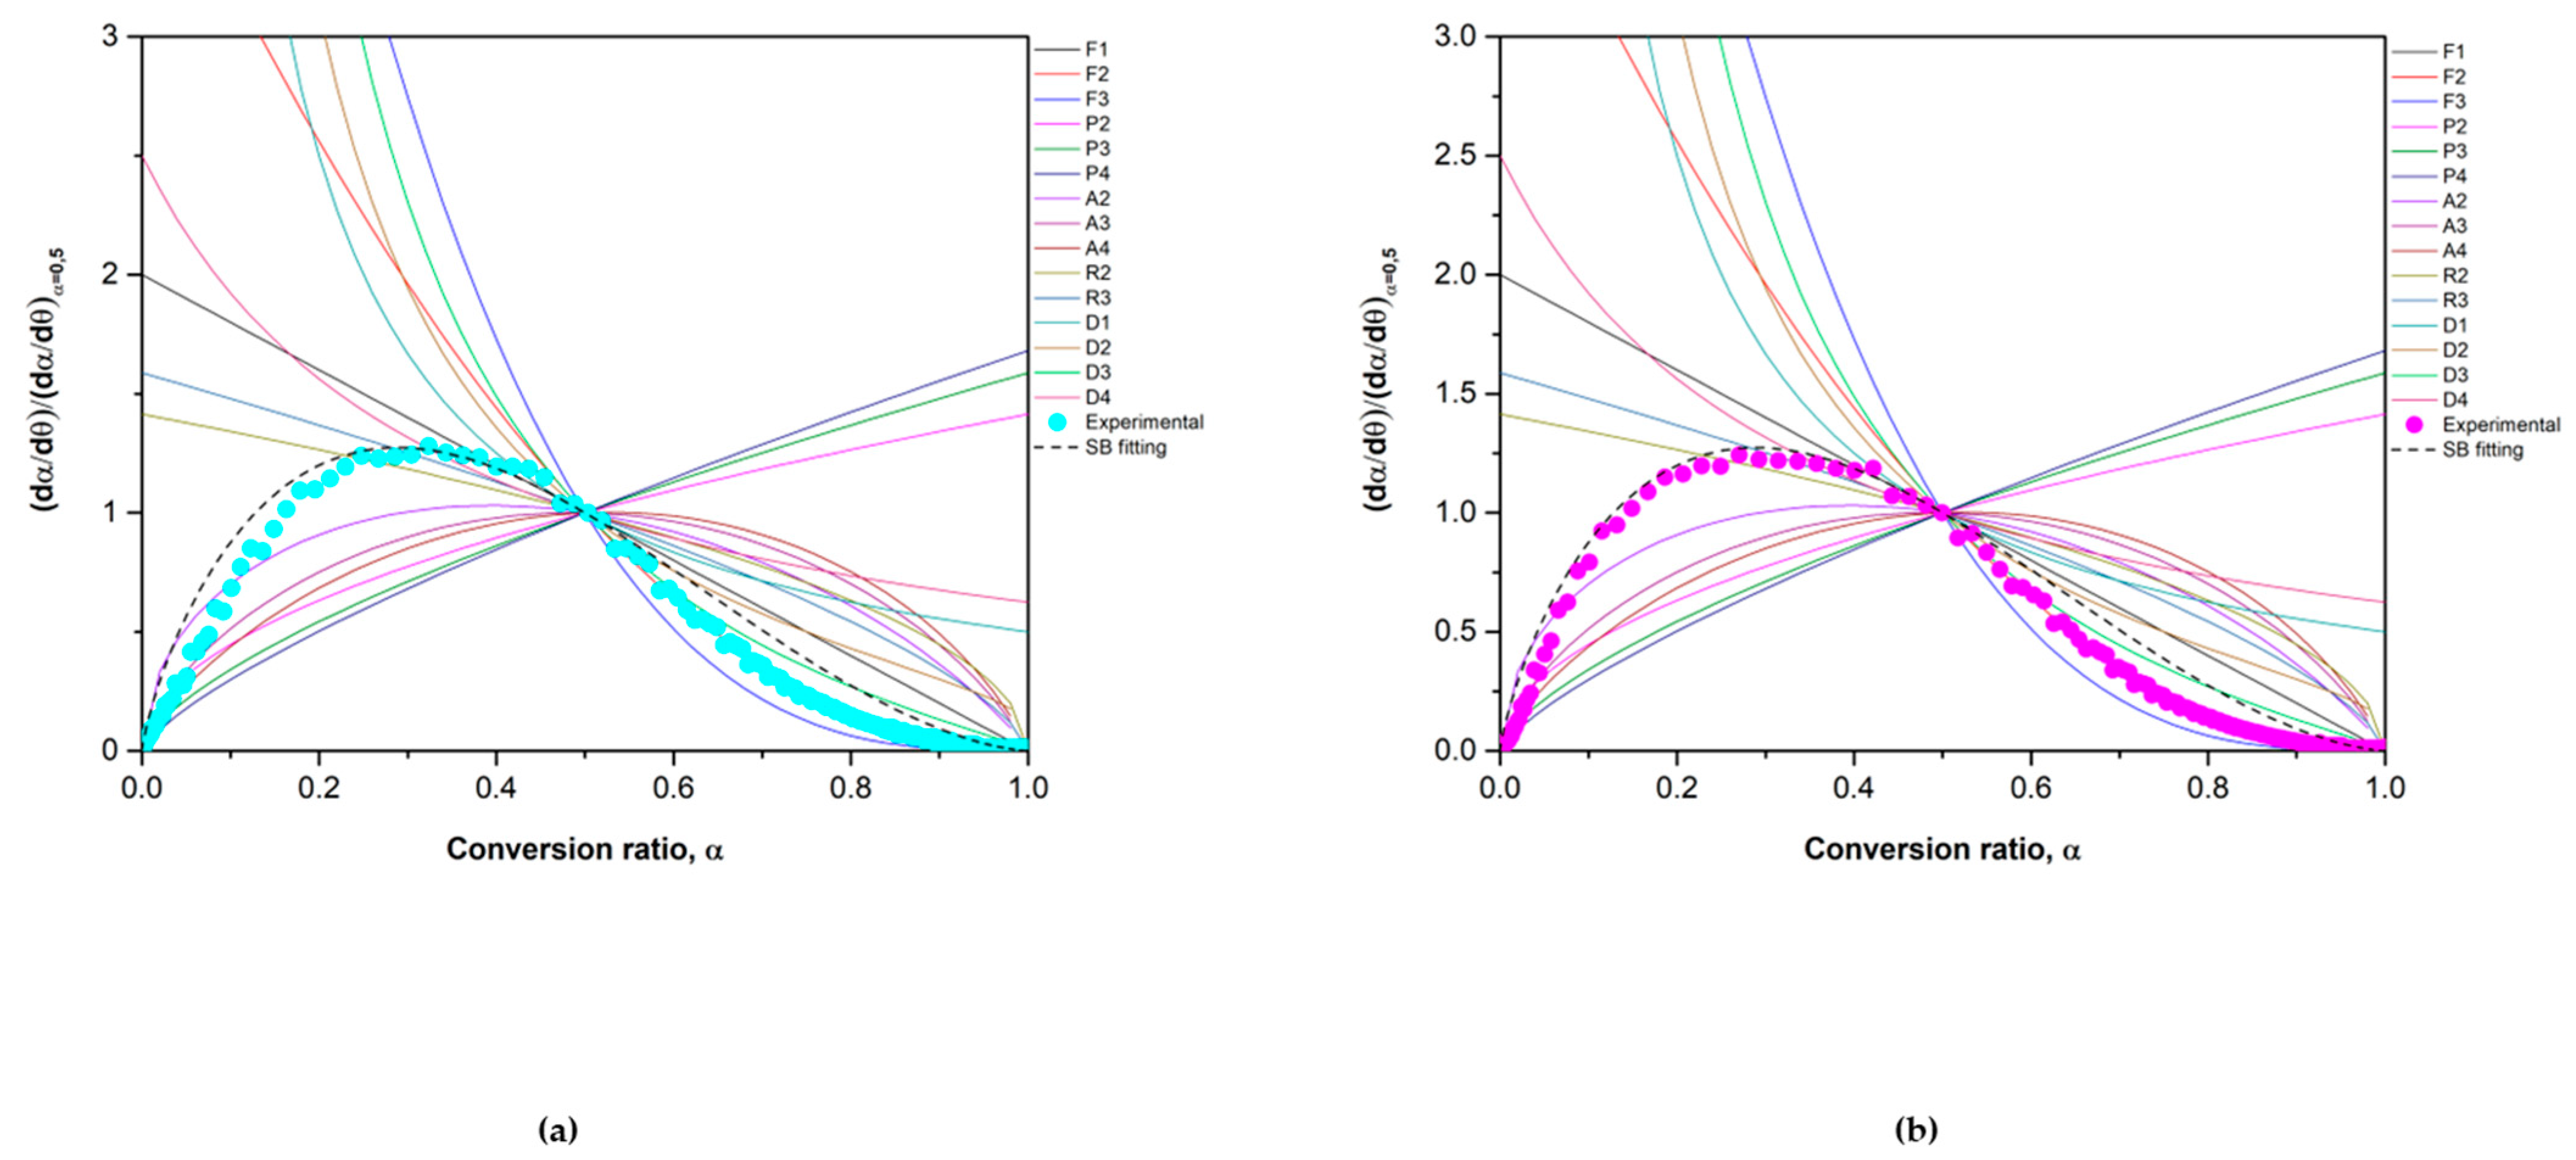
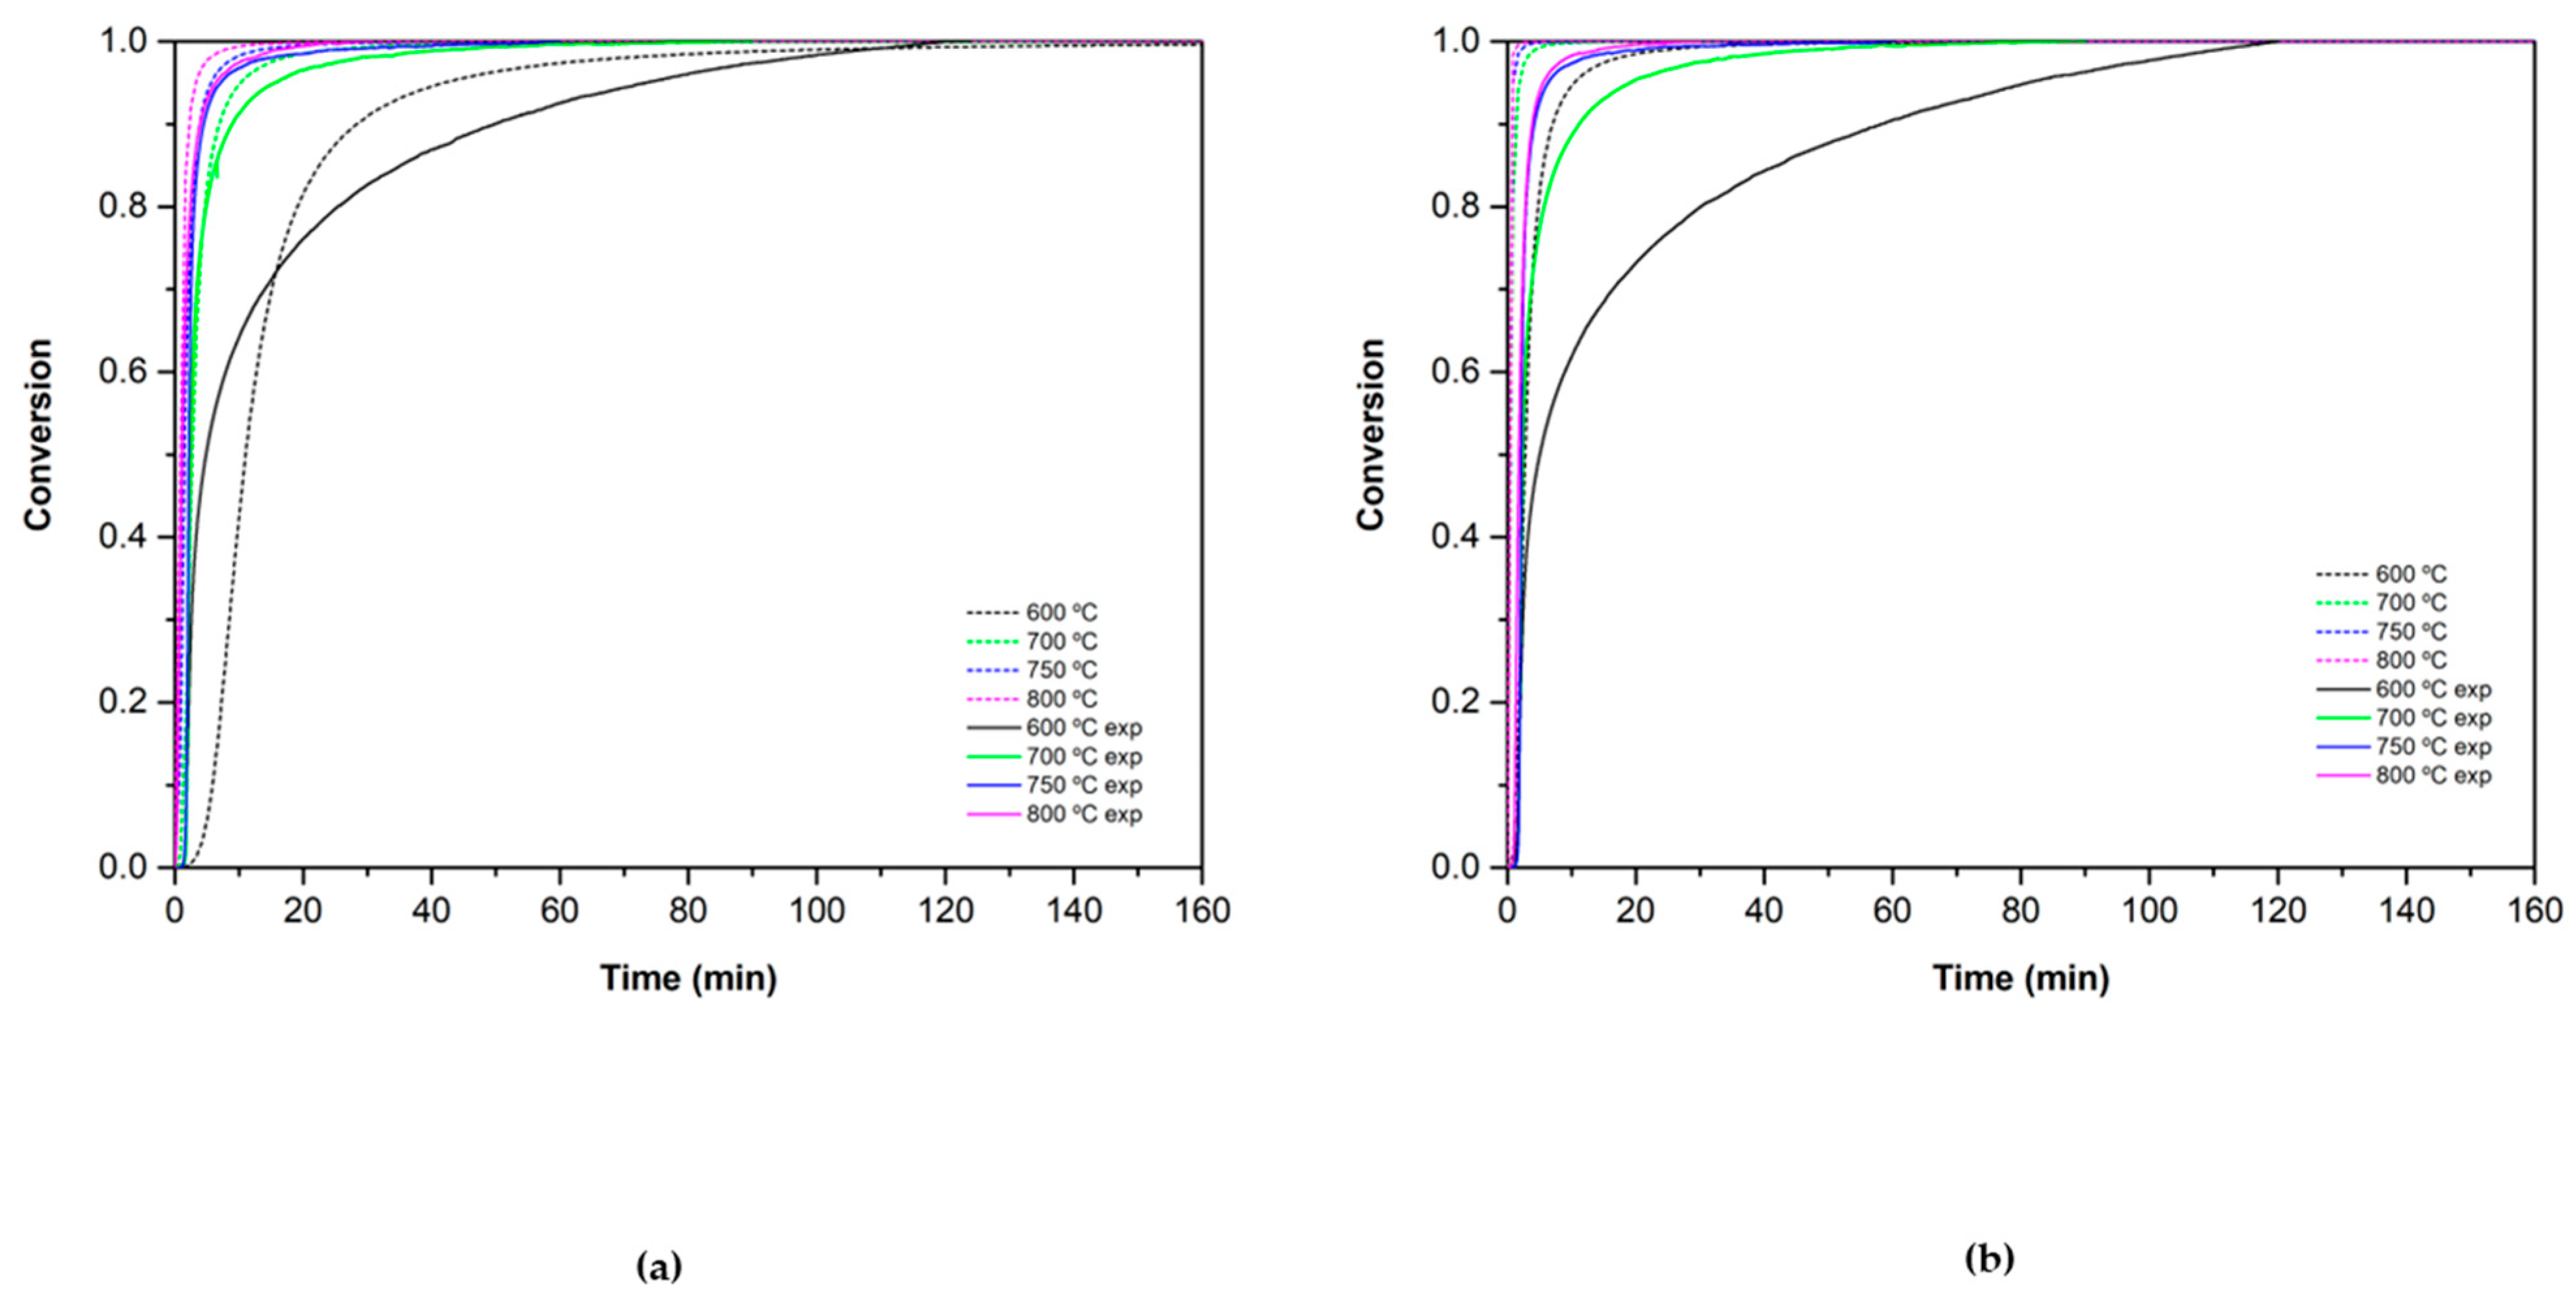
3.2.2. Oxidation Reaction Rate
4. Conclusions
Author Contributions
Funding
Institutional Review Board Statement
Informed Consent Statement
Acknowledgments
Conflicts of Interest
References
- Zhou, X.; Mahmood, M.; Chen, J.; Yang, T.; Xiao, G.; Ferrari, M.L. Validated Model of Thermochemical Energy Storage Based on Cobalt Oxides. Appl. Therm. Eng. 2019, 159, 113965. [Google Scholar] [CrossRef]
- Mahmood, M.; Traverso, A.; Traverso, A.N.; Massardo, A.F.; Marsano, D.; Cravero, C. Thermal Energy Storage for CSP Hybrid Gas Turbine Systems: Dynamic Modelling and Experimental Validation. Appl. Energy 2018, 212, 1240–1251. [Google Scholar] [CrossRef]
- Dizaji, H.B.; Hosseini, H. A Review of Material Screening in Pure and Mixed-Metal Oxide Thermochemical Energy Storage (TCES) Systems for Concentrated Solar Power (CSP) Applications. Renew. Sustain. Energy Rev. 2018, 98, 9–26. [Google Scholar] [CrossRef]
- Ehrhart, B.; Coker, E.; Siegel, N.; Weimer, A. Thermochemical Cycle of a Mixed Metal Oxide for Augmentation of Thermal Energy Storage in Solid Particles. Energy Procedia 2013, 49, 762–771. [Google Scholar] [CrossRef]
- Bruno, F.; Belusko, M.; Liu, M.; Tay, N.H.S. Using Solid-Liquid Phase Change Materials (PCMs) in Thermal Energy Storage Systems; Woodhead Publishing Limited: Thorston, UK, 2014; ISBN 9781782420965. [Google Scholar]
- Wu, S.; Zhou, C.; Doroodchi, E.; Nellore, R.; Moghtaderi, B. A Review on High-Temperature Thermochemical Energy Storage Based on Metal Oxides Redox Cycle. Energy Convers. Manag. 2018, 168, 421–453. [Google Scholar] [CrossRef]
- Liu, M.; Steven Tay, N.H.; Bell, S.; Belusko, M.; Jacob, R.; Will, G.; Saman, W.; Bruno, F. Review on Concentrating Solar Power Plants and New Developments in High Temperature Thermal Energy Storage Technologies. Renew. Sustain. Energy Rev. 2016, 53, 1411–1432. [Google Scholar] [CrossRef]
- Agrafiotis, C.; Roeb, M.; Schmücker, M.; Sattler, C. Exploitation of Thermochemical Cycles Based on Solid Oxide Redox Systems for Thermochemical Storage of Solar Heat. Part 1: Testing of Cobalt Oxide-Based Powders. Sol. Energy 2014, 102, 189–211. [Google Scholar] [CrossRef]
- Myung, J.H.; Shin, T.H.; Huang, X.; Carins, G.; Irvine, J.T.S. Enhancement of Redox Stability and Electrical Conductivity by Doping Various Metals on Ceria, Ce1-XMxO2-δ (M = Ni, Cu, Co, Mn, Ti, Zr). Int. J. Hydrogen Energy 2015, 40, 12003–12008. [Google Scholar] [CrossRef]
- Agrafiotis, C.; Roeb, M.; Schmücker, M.; Sattler, C. Exploitation of Thermochemical Cycles Based on Solid Oxide Redox Systems for Thermochemical Storage of Solar Heat. Part 2: Redox Oxide-Coated Porous Ceramic Structures as Integrated Thermochemical Reactors/Heat Exchangers. Sol. Energy 2015, 114, 440–458. [Google Scholar] [CrossRef]
- Agrafiotis, C.; Tescari, S.; Roeb, M.; Schmücker, M.; Sattler, C. Exploitation of Thermochemical Cycles Based on Solid Oxide Redox Systems for Thermochemical Storage of Solar Heat. Part 3: Cobalt Oxide Monolithic Porous Structures as Integrated Thermochemical Reactors/Heat Exchangers. Sol. Energy 2015, 114, 459–475. [Google Scholar] [CrossRef]
- Abedin, A.H. A Critical Review of Thermochemical Energy Storage Systems. Open Renew. Energy J. 2011, 4, 42–46. [Google Scholar] [CrossRef]
- Carrillo, A.J.; Moya, J.; Bayón, A.; Jana, P.; De La Peña O’Shea, V.A.; Romero, M.; Gonzalez-Aguilar, J.; Serrano, D.P.; Pizarro, P.; Coronado, J.M. Thermochemical Energy Storage at High Temperature via Redox Cycles of Mn and Co Oxides: Pure Oxides versus Mixed Ones. Sol. Energy Mater. Sol. Cells 2014, 123, 47–57. [Google Scholar] [CrossRef]
- Block, T.; Schmücker, M. Metal Oxides for Thermochemical Energy Storage: A Comparison of Several Metal Oxide Systems. Sol. Energy 2016, 126, 195–207. [Google Scholar] [CrossRef]
- Carrillo, A.J.; Serrano, D.P.; Pizarro, P.; Coronado, J.M. Thermochemical Heat Storage at High Temperatures Using Mn2O3/Mn3O4 System: Narrowing the Redox Hysteresis by Metal Co-Doping. Energy Procedia 2015, 73, 263–271. [Google Scholar] [CrossRef][Green Version]
- Carrillo, A.J.; Sastre, D.; Serrano, D.P.; Pizarro, P.; Coronado, J.M. Revisiting the BaO2/BaO Redox Cycle for Solar Thermochemical Energy Storage. Phys. Chem. Chem. Phys. 2016, 18, 8039–8048. [Google Scholar] [CrossRef] [PubMed]
- Block, T.; Knoblauch, N.; Schmücker, M. The Cobalt-Oxide/Iron-Oxide Binary System for Use as High Temperature Thermochemical Energy Storage Material. Thermochim. Acta 2014, 577, 25–32. [Google Scholar] [CrossRef]
- Wong, B. Energy, U.S.D. of Thermochemical Heat Storage for Concentrated Solar Power, Thermochemical System Reactor Design for Thermal Energy Storage. Ind. Eng. Chem. 2011, 19, 594–596. [Google Scholar]
- Roßkopf, C.; Haas, M.; Faik, A.; Linder, M.; Wörner, A. Improving Powder Bed Properties for Thermochemical Storage by Adding Nanoparticles. Energy Convers. Manag. 2014, 86, 93–98. [Google Scholar] [CrossRef]
- Bielsa, D.; Zaki, A.; Arias, P.L.; Faik, A. Improving the Redox Performance of Mn2O3/Mn3O4 Pair by Si Doping to Be Used as Thermochemical Energy Storage for Concentrated Solar Power Plants. Sol. Energy 2020, 204, 144–154. [Google Scholar] [CrossRef]
- Hill, R.J.; Craig, J.R.; Gibbs, G.V. Systematics of the Spinel Structure Type. Phys. Chem. Miner. 1979, 4, 317–339. [Google Scholar] [CrossRef]
- King, W.J.; Tseung, A.C.C. The Reduction of Oxygen on Nickel-Cobalt Oxides—II. Electrochim. Acta 1974, 19, 493–498. [Google Scholar] [CrossRef]
- Klissurski, D.; Uzunova, E. Synthesis and Features of Binary Cobaltite Spinels. J. Mater. Sci. 1994, 29, 285–293. [Google Scholar] [CrossRef]
- Portilla-Nieto, Y.; Zaki, A.; Vidal, K.; Hernaiz, M.; Aranzabe, E.; Doppiu, S.; Faik, A. Development of Co3-XNixO4 Materials for Thermochemical Energy Storage at Lower Red-Ox Temperature. Sol. Energy Mater. Sol. Cells 2021, 230, 111194. [Google Scholar] [CrossRef]
- Muroyama, A.P.; Schrader, A.J.; Loutzenhiser, P.G. Solar Electricity via an Air Brayton Cycle with an Integrated Two-Step Thermochemical Cycle for Heat Storage Based on Co3O4/CoO Redox Reactions II: Kinetic Analyses. Sol. Energy 2015, 122, 409–418. [Google Scholar] [CrossRef]
- Wong, B. Thermochemical Heat Storage for Concentrated Solar Power: Thermochemical System Reactor Design for Thermal Energy Storage, Phase II Final Report for the Period September 30, 2008 through April 30, 2011; U.S. Department of Energy: Washington, DC, USA, 2011.
- Hutchings, K.N.; Wilson, M.; Larsen, P.A.; Cutler, R.A. Kinetic and Thermodynamic Considerations for Oxygen Absorption/Desorption Using Cobalt Oxide. Solid State Ion. 2006, 177, 45–51. [Google Scholar] [CrossRef]
- Pagkoura, C.; Karagiannakis, G.; Zygogianni, A.; Lorentzou, S.; Kostoglou, M.; Konstandopoulos, A.G.; Rattenburry, M.; Woodhead, J.W. Cobalt Oxide Based Structured Bodies as Redox Thermochemical Heat Storage Medium for Future CSP Plants. Sol. Energy 2014, 108, 146–163. [Google Scholar] [CrossRef]
- Hasanvand, A.; Pourabdoli, M. Theoretical thermodynamics and practical kinetics studies of oxygen desorption from Co3O4-5 wt% Al2O3 and Co3O4-5 wt% Y2O3 composites. J. Part. Sci. Technol. 2019, 5, 13–21. [Google Scholar] [CrossRef]
- Carrillo, A.J.; Serrano, D.P.; Pizarro, P.; Coronado, J.M. Understanding Redox Kinetics of Iron-Doped Manganese Oxides for High Temperature Thermochemical Energy Storage. J. Phys. Chem. C 2016, 120, 27800–27812. [Google Scholar] [CrossRef]
- Vyazovkin, S.; Burnham, A.K.; Criado, J.M.; Pérez-Maqueda, L.A.; Popescu, C.; Sbirrazzuoli, N. ICTAC Kinetics Committee Recommendations for Performing Kinetic Computations on Thermal Analysis Data. Thermochim. Acta 2011, 520, 1–19. [Google Scholar] [CrossRef]
- Bielsa, D.; Zaki, A.; Arias, P.L.; Faik, A. Development of a Kinetic Reaction Model for Reduction and Oxidation of Si Doped Mn2O3 for Thermochemical Energy Storage in Concentrated Solar Power Plants. J. Energy Storage 2021, 43, 103271. [Google Scholar] [CrossRef]
- Friedman, H.L. Kinetics of Thermal Degradation of Char-Forming Plastics from Thermogravimetry. Application to a Phenolic Plastic. J. Polym. Sci. Part C Polym. Symp. 2007, 6, 183–195. [Google Scholar] [CrossRef]
- Criado, J.M.; Sánchez-Jiménez, P.E.; Pérez-Maqueda, L.A. Critical Study of the Isoconversional Methods of Kinetic Analysis. J. Therm. Anal. Calorim. 2008, 92, 199–203. [Google Scholar] [CrossRef]
- Ozawa, T. Kinetic Analysis of Derivative Curves in Thermal Analysis. J. Therm. Anal. 1970, 2, 301–324. [Google Scholar] [CrossRef]
- Gotor, F.J.; José, M.C.; Malek, J.; Koga, N. Kinetic Analysis of Solid-State Reactions: The Universality of Master Plots for Analyzing Isothermal and Nonisothermal Experiments. J. Phys. Chem. A 2000, 104, 10777–10782. [Google Scholar] [CrossRef]
- Ozawa, T. Non-Isothermal Kinetics and Generalized Time. Thermochim. Acta 1986, 100, 109–118. [Google Scholar] [CrossRef]
- Šesták, J.; Berggren, G. Study of the Kinetics of the Mechanism of Solid-State Reactions at Increasing Temperatures. Thermochim. Acta 1971, 3, 1–12. [Google Scholar] [CrossRef]
- Criado, J.M.; Málek, J.; Gotor, F.J. The Applicability of the Šesták-Berggren Kinetic Equation in Constant Rate Thermal Analysis (CRTA). Thermochim. Acta 1990, 158, 205–213. [Google Scholar] [CrossRef]
- Ali, G.A.M.; Fouad, O.A.; Makhlouf, S.A.; Yusoff, M.M.; Chong, K.F. Co3O4/SiO2 Nanocomposites for Supercapacitor Application. J. Solid State Electrochem. 2014, 18, 2505–2512. [Google Scholar] [CrossRef]
- Reti, A.R.; Brian, P.L.T.; Hoagland, L.C. Short-time, High Temperature Oxidation of Cobaltous Oxide. Ind. Eng. Chem. Process Des. Dev. 2000, 5, 171–177. [Google Scholar] [CrossRef]
- Tomlinson, W.J.; Easterlow, A. Kinetics and Microstructure of Oxidation of CoO to Co3O4 at 700-800 °C. J. Phys. Chem. Solids 1985, 46, 151–153. [Google Scholar] [CrossRef]


| Reaction Model | Name | Mechanism | f(α) |
|---|---|---|---|
| Reaction order models | F1 | Random nucleation followed by an instantaneous growth of nuclei | 1−α |
| F2 | (1−α)2 | ||
| F3 | (1−α)3 | ||
| Power law | P2 | Random nucleation and growth of nuclei through different nucleation and nucleus growth models | 2α1/2 |
| P3 | 3α2/3 | ||
| P4 | 4α3/4 | ||
| Avrami–Erofeev | A2 | 2(1−α)[−ln(1−α)]1/2 | |
| A3 | 3(1−α)[−ln(1−α)]2/3 | ||
| A4 | 4(1−α)[−ln(1−α)]3/4 | ||
| Contracting area | R2 | Phase boundary-controlled reaction | 2(1−α)1/2 |
| Contracting volume | R3 | 3(1−α)2/3 | |
| Diffusion | D1 | Based on the penetration of reactant molecules through a layer of product | ½α−1 |
| D2 | [−ln(1−α)]−1 | ||
| D3 | 3/2(1−α)2/3[1−(1−α)1/3]−1 | ||
| D4 | 3/2[(1−α)−1/3−1] |
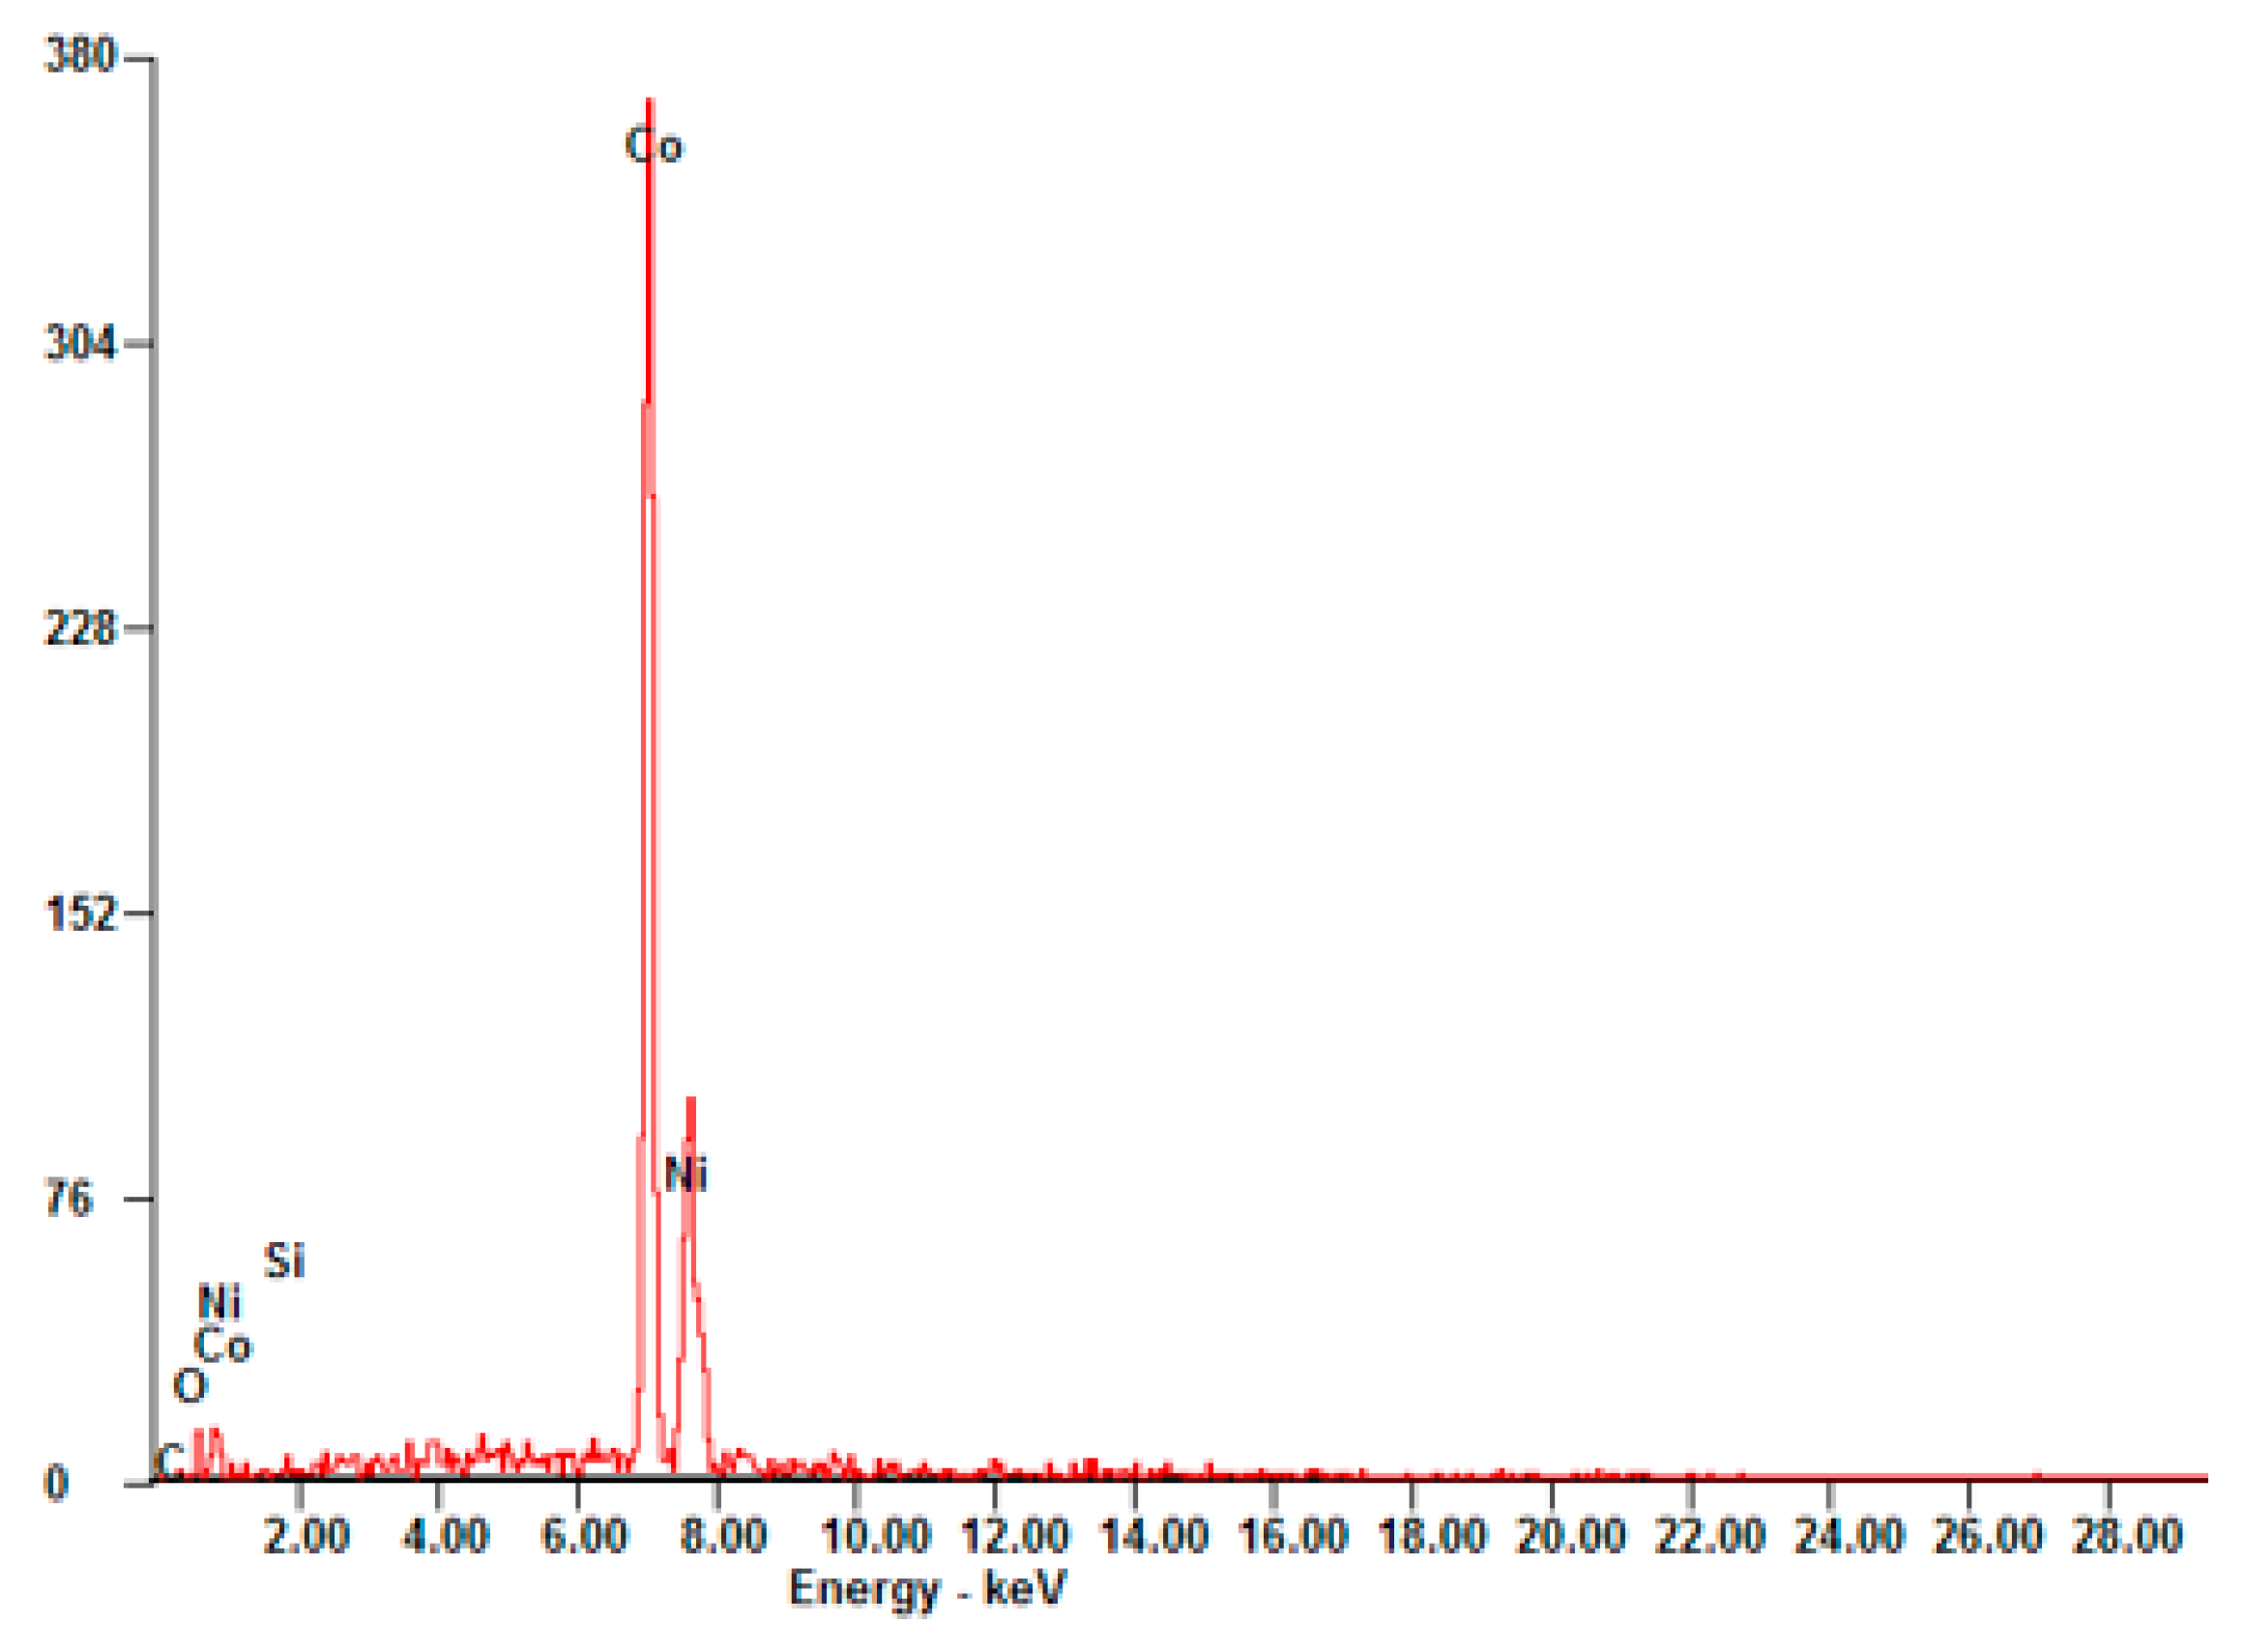
| Element | Wt% | At% |
|---|---|---|
| SiK | 0.00 | 0.00 |
| NiK | 78.55 | 78.49 |
| CoK | 21.45 | 21.51 |
| Material | Ea (kJ/mol) | f(α) | A (min−1) | ||
|---|---|---|---|---|---|
| m | n | p | |||
| Co2.4Ni0.6O4 | 450 ± 47 | 2 | 1.7 | −2.1 | 9.65·1019 |
| 0.5% SiO2/Co2.4Ni0.6O4 | 449 ± 32 | 0.81 | 1.45 | −0.87 | 6.37·1019 |
| Co3O4 [25] | 247 | - | - | - | - |
| Co3O4 [26] | 960 | - | - | - | - |
| 5% Al2O3/Co3O4 [29] | 238 | - | - | - | - |
| 5% Al2O3/Co3O4 [26] | 731 | - | - | - | - |
| Material | Ea (kJ/mol) | f(α) | A (min−1) | ||
|---|---|---|---|---|---|
| m | n | p | |||
| Co2.4Ni0.6O4 | 100 ± 22 | 2.8 | 1 | −2.01 | 7·103 |
| 0.5% SiO2/Co2.4Ni0.6O4 | 134 ± 36 | 2.8 | 1 | −2.01 | 7.81·105 |
| Co3O4 [25] | 58 ± 0.26 | - | - | - | - |
| Co3O4 [41] | 60 | - | - | - | - |
| 5% Al2O3/Co3O4 [26] | 165 | - | - | - | - |
Publisher’s Note: MDPI stays neutral with regard to jurisdictional claims in published maps and institutional affiliations. |
© 2022 by the authors. Licensee MDPI, Basel, Switzerland. This article is an open access article distributed under the terms and conditions of the Creative Commons Attribution (CC BY) license (https://creativecommons.org/licenses/by/4.0/).
Share and Cite
Portilla-Nieto, Y.; Bielsa, D.; Dauvergne, J.-L.; Hernaiz, M.; Aranzabe, E.; Doppiu, S.; Palomo del Barrio, E. Development of a Kinetic Model for the Redox Reactions of Co2.4Ni0.6O4 and SiO2/Co2.4Ni0.6O4 Oxides for Thermochemical Energy Storage. Materials 2022, 15, 3695. https://doi.org/10.3390/ma15103695
Portilla-Nieto Y, Bielsa D, Dauvergne J-L, Hernaiz M, Aranzabe E, Doppiu S, Palomo del Barrio E. Development of a Kinetic Model for the Redox Reactions of Co2.4Ni0.6O4 and SiO2/Co2.4Ni0.6O4 Oxides for Thermochemical Energy Storage. Materials. 2022; 15(10):3695. https://doi.org/10.3390/ma15103695
Chicago/Turabian StylePortilla-Nieto, Yasmina, Daniel Bielsa, Jean-Luc Dauvergne, Marta Hernaiz, Estibaliz Aranzabe, Stefania Doppiu, and Elena Palomo del Barrio. 2022. "Development of a Kinetic Model for the Redox Reactions of Co2.4Ni0.6O4 and SiO2/Co2.4Ni0.6O4 Oxides for Thermochemical Energy Storage" Materials 15, no. 10: 3695. https://doi.org/10.3390/ma15103695
APA StylePortilla-Nieto, Y., Bielsa, D., Dauvergne, J.-L., Hernaiz, M., Aranzabe, E., Doppiu, S., & Palomo del Barrio, E. (2022). Development of a Kinetic Model for the Redox Reactions of Co2.4Ni0.6O4 and SiO2/Co2.4Ni0.6O4 Oxides for Thermochemical Energy Storage. Materials, 15(10), 3695. https://doi.org/10.3390/ma15103695