
Numerical Investigation on Guided Waves Dispersion and Scattering Phenomena in Stiffened Panels


Abstract
:1. Introduction
2. Reflection, Attenuation, and Mode Conversion of Guided Waves in Stiffened Panels
2.1. Reflection
2.2. Attenuation
2.3. Mode Conversion
3. Cases of Study
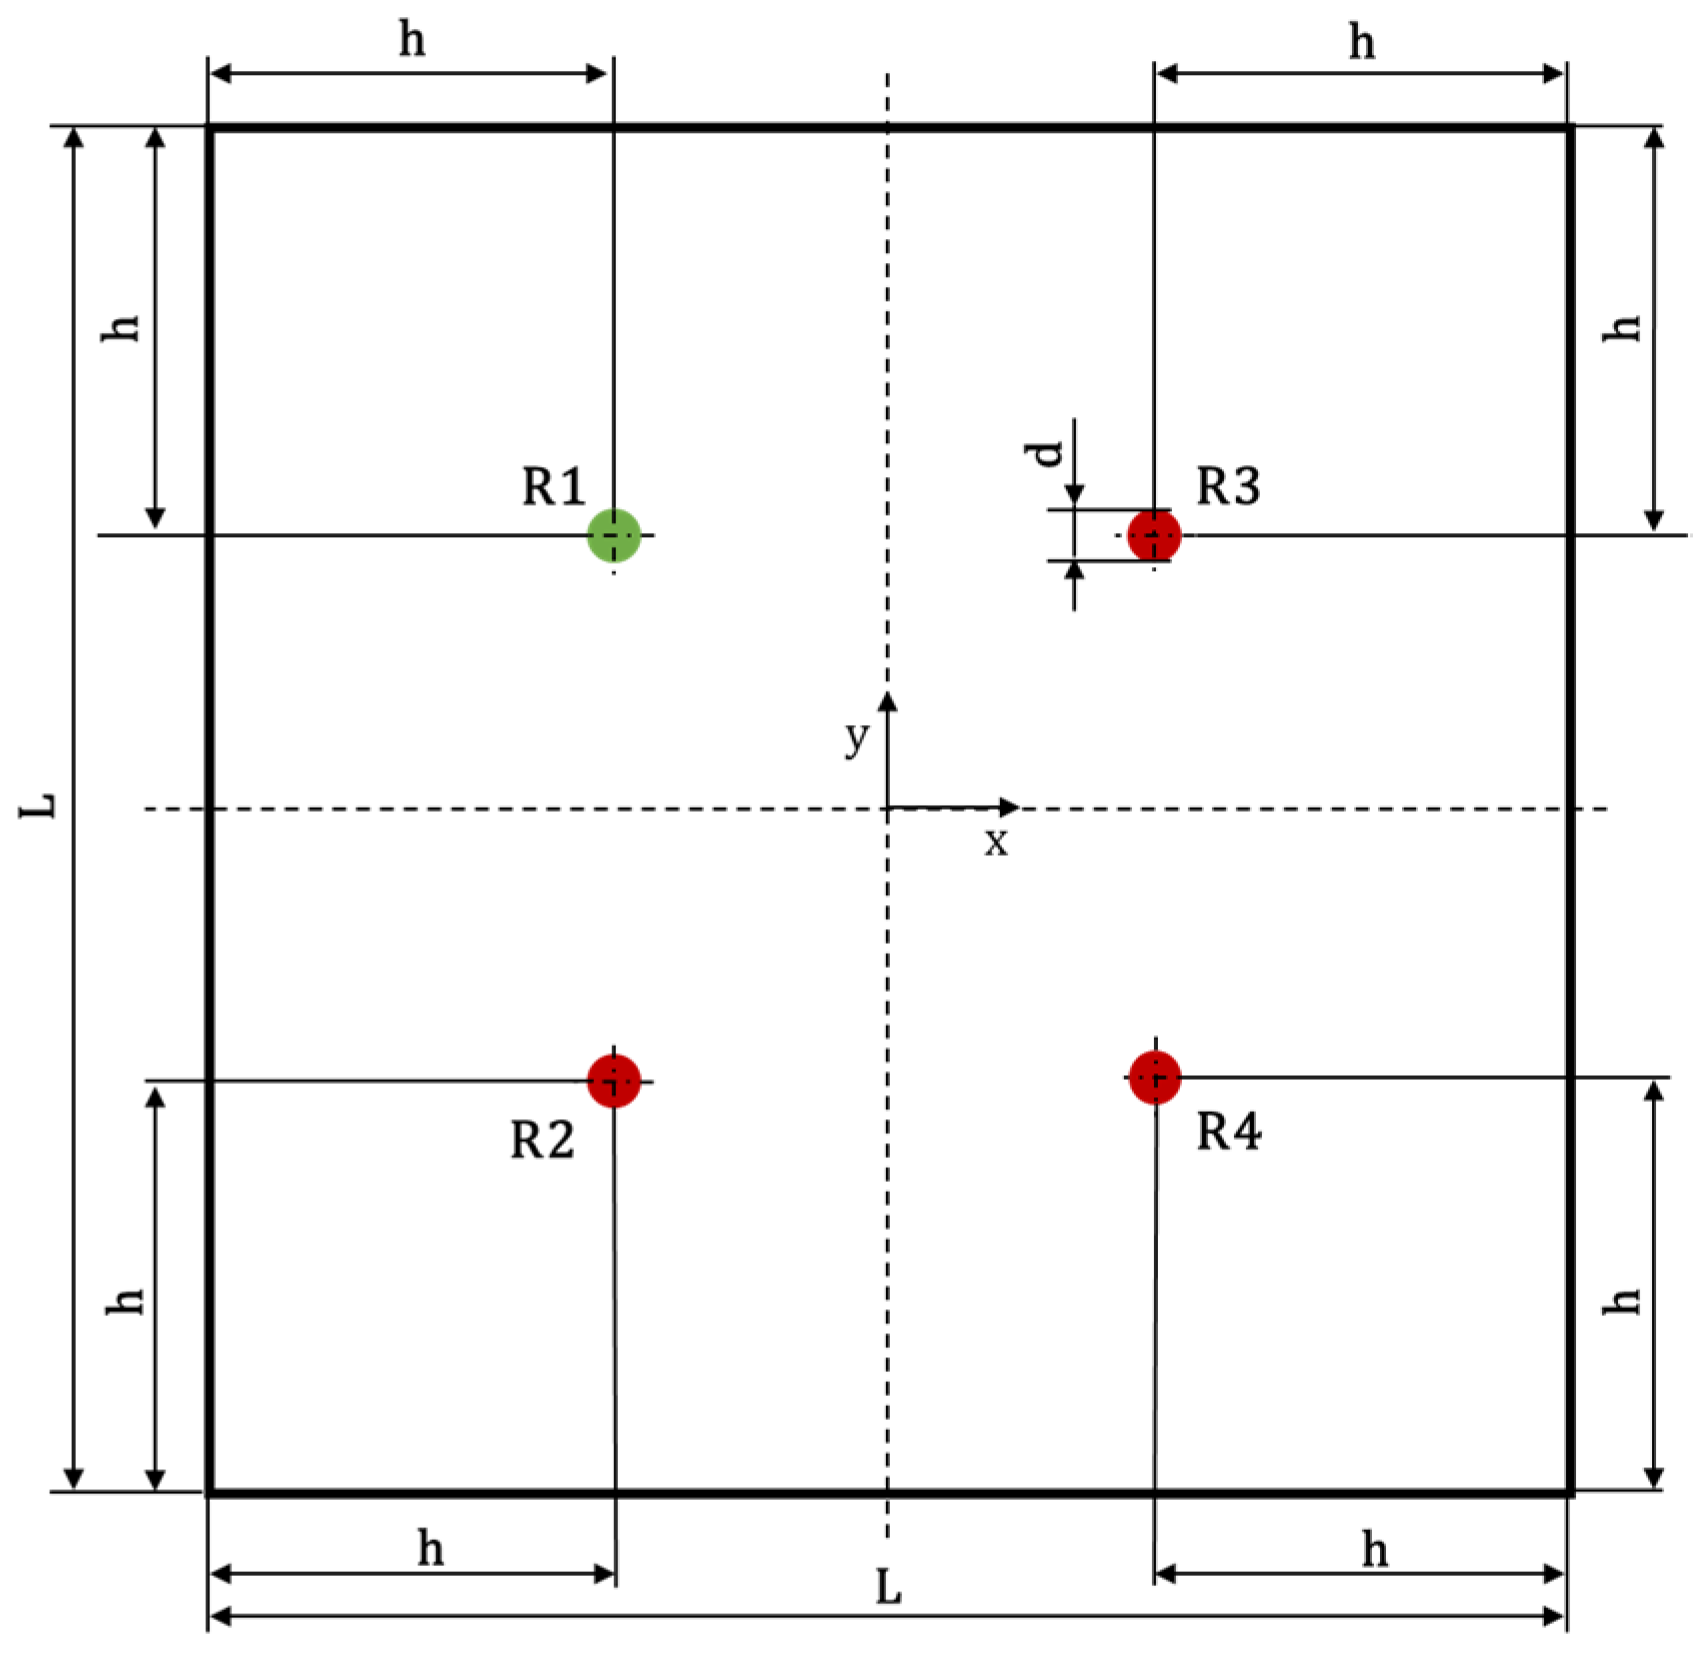
3.1. Flat Panel
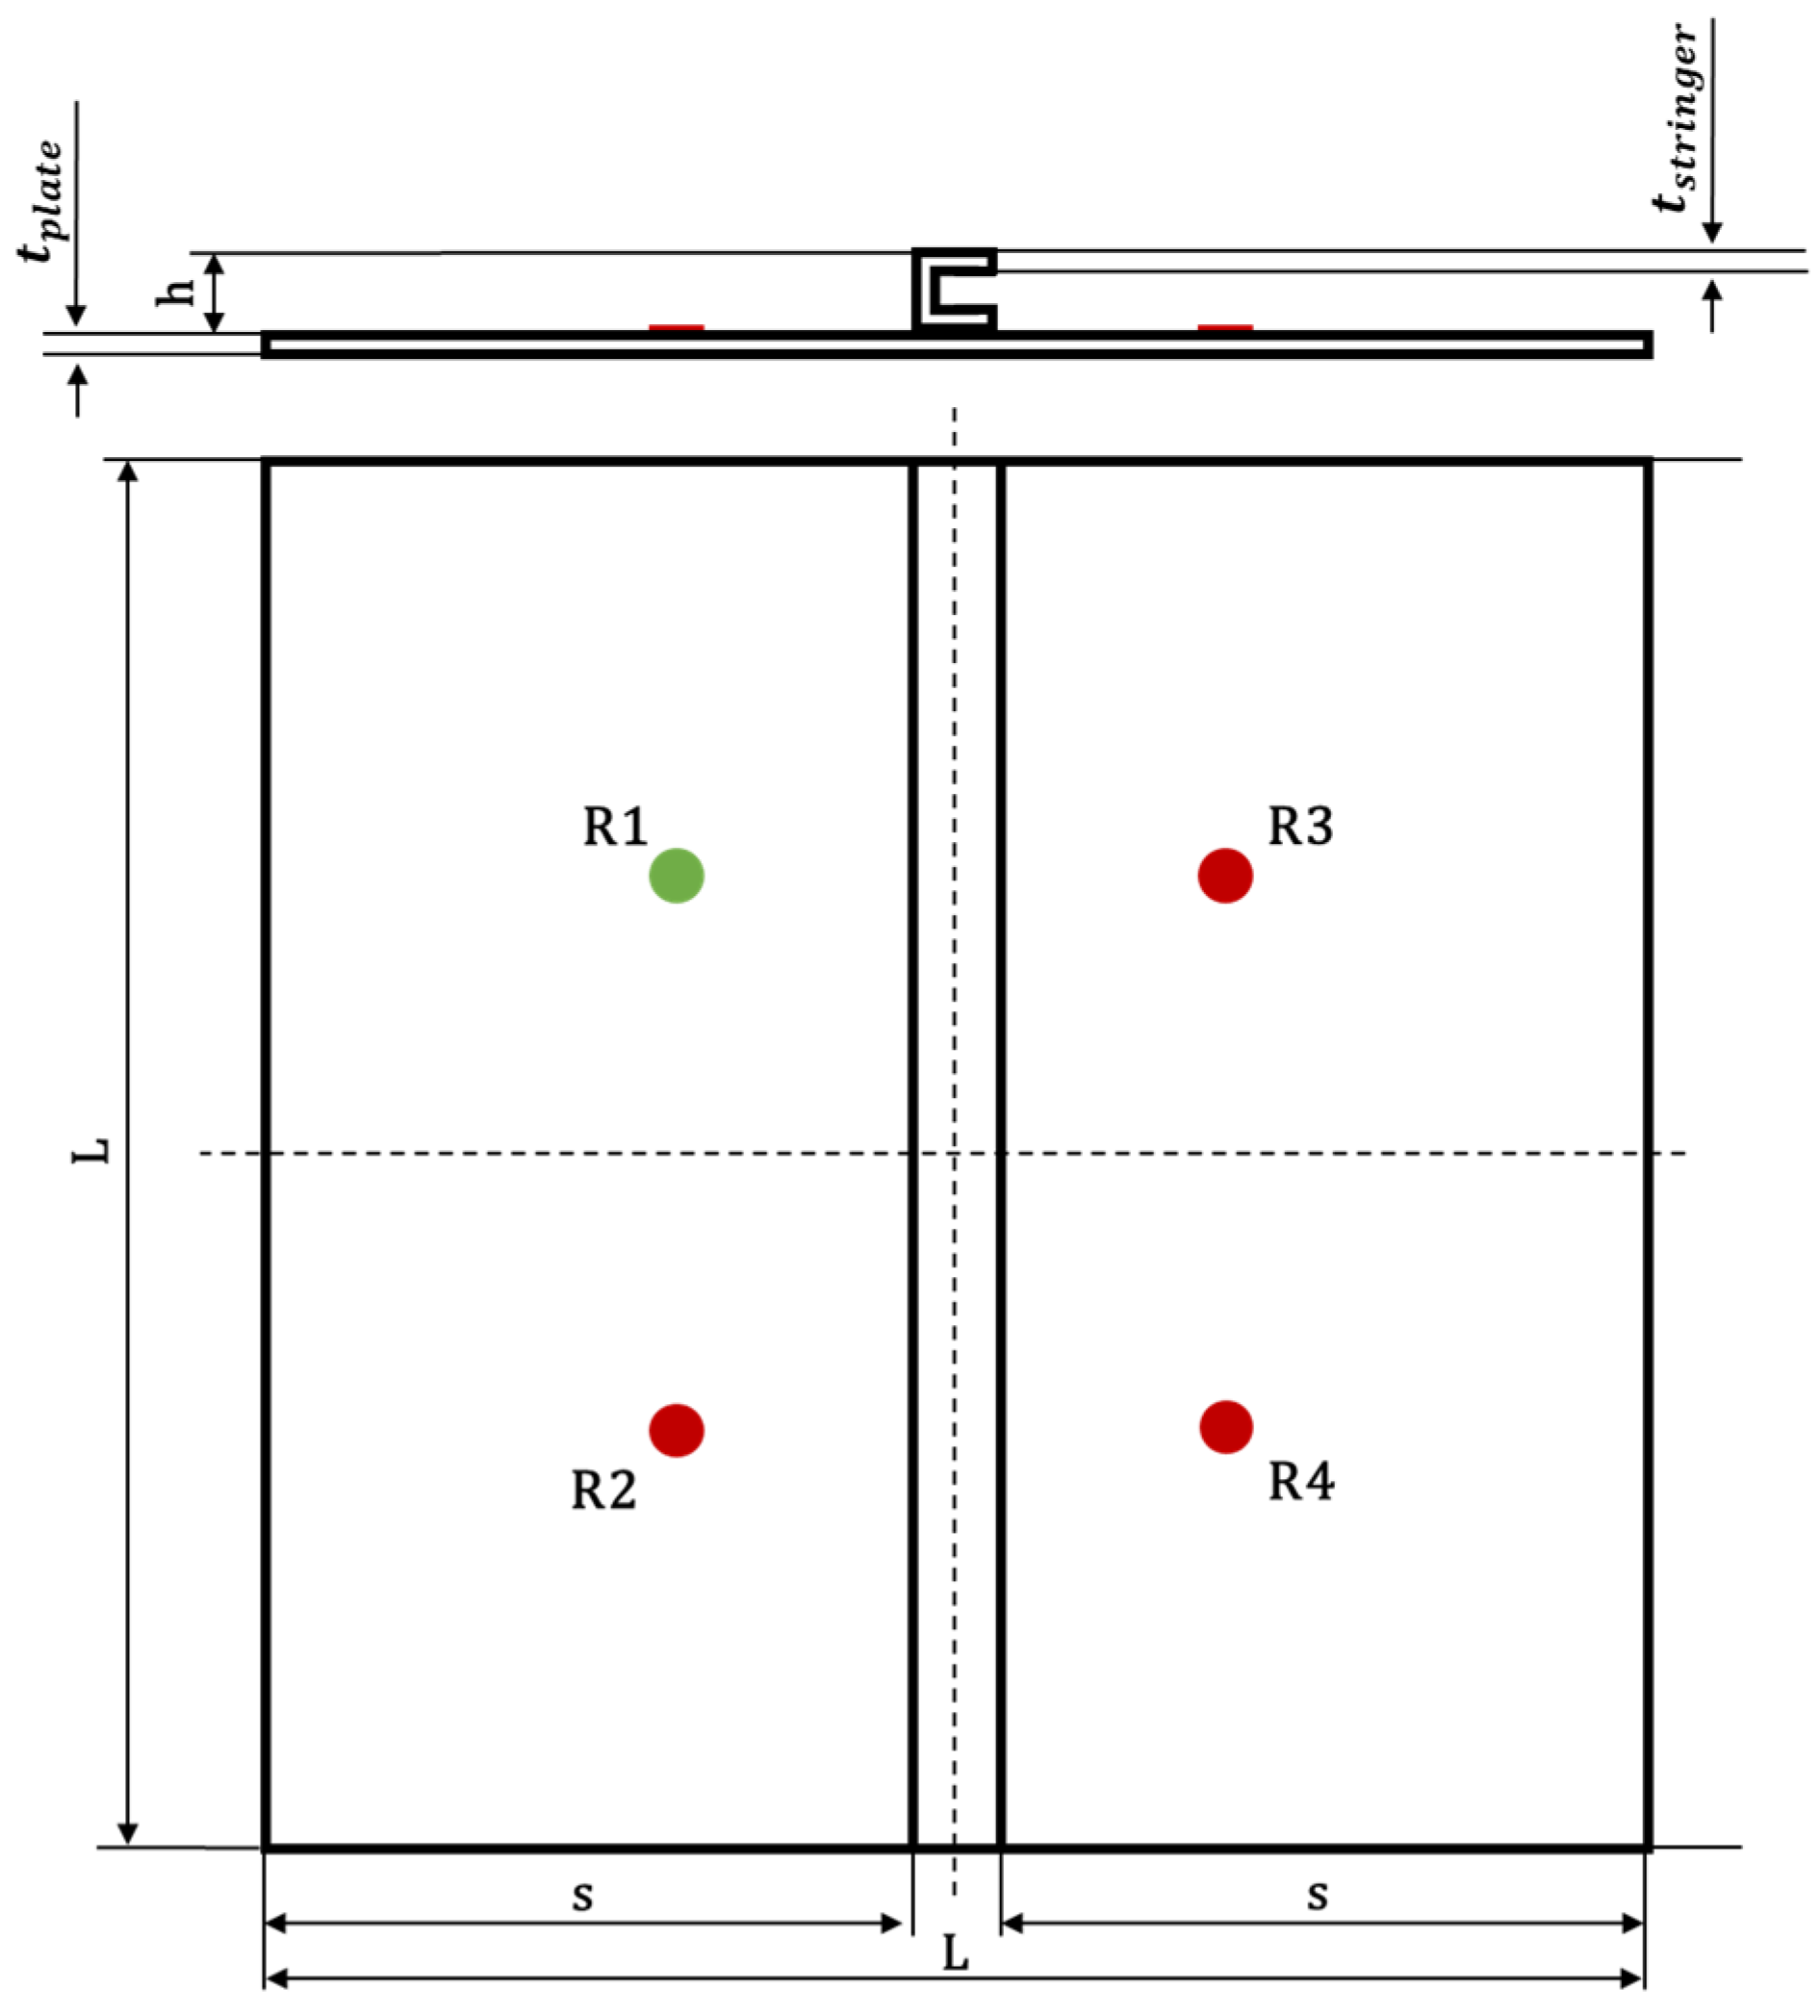
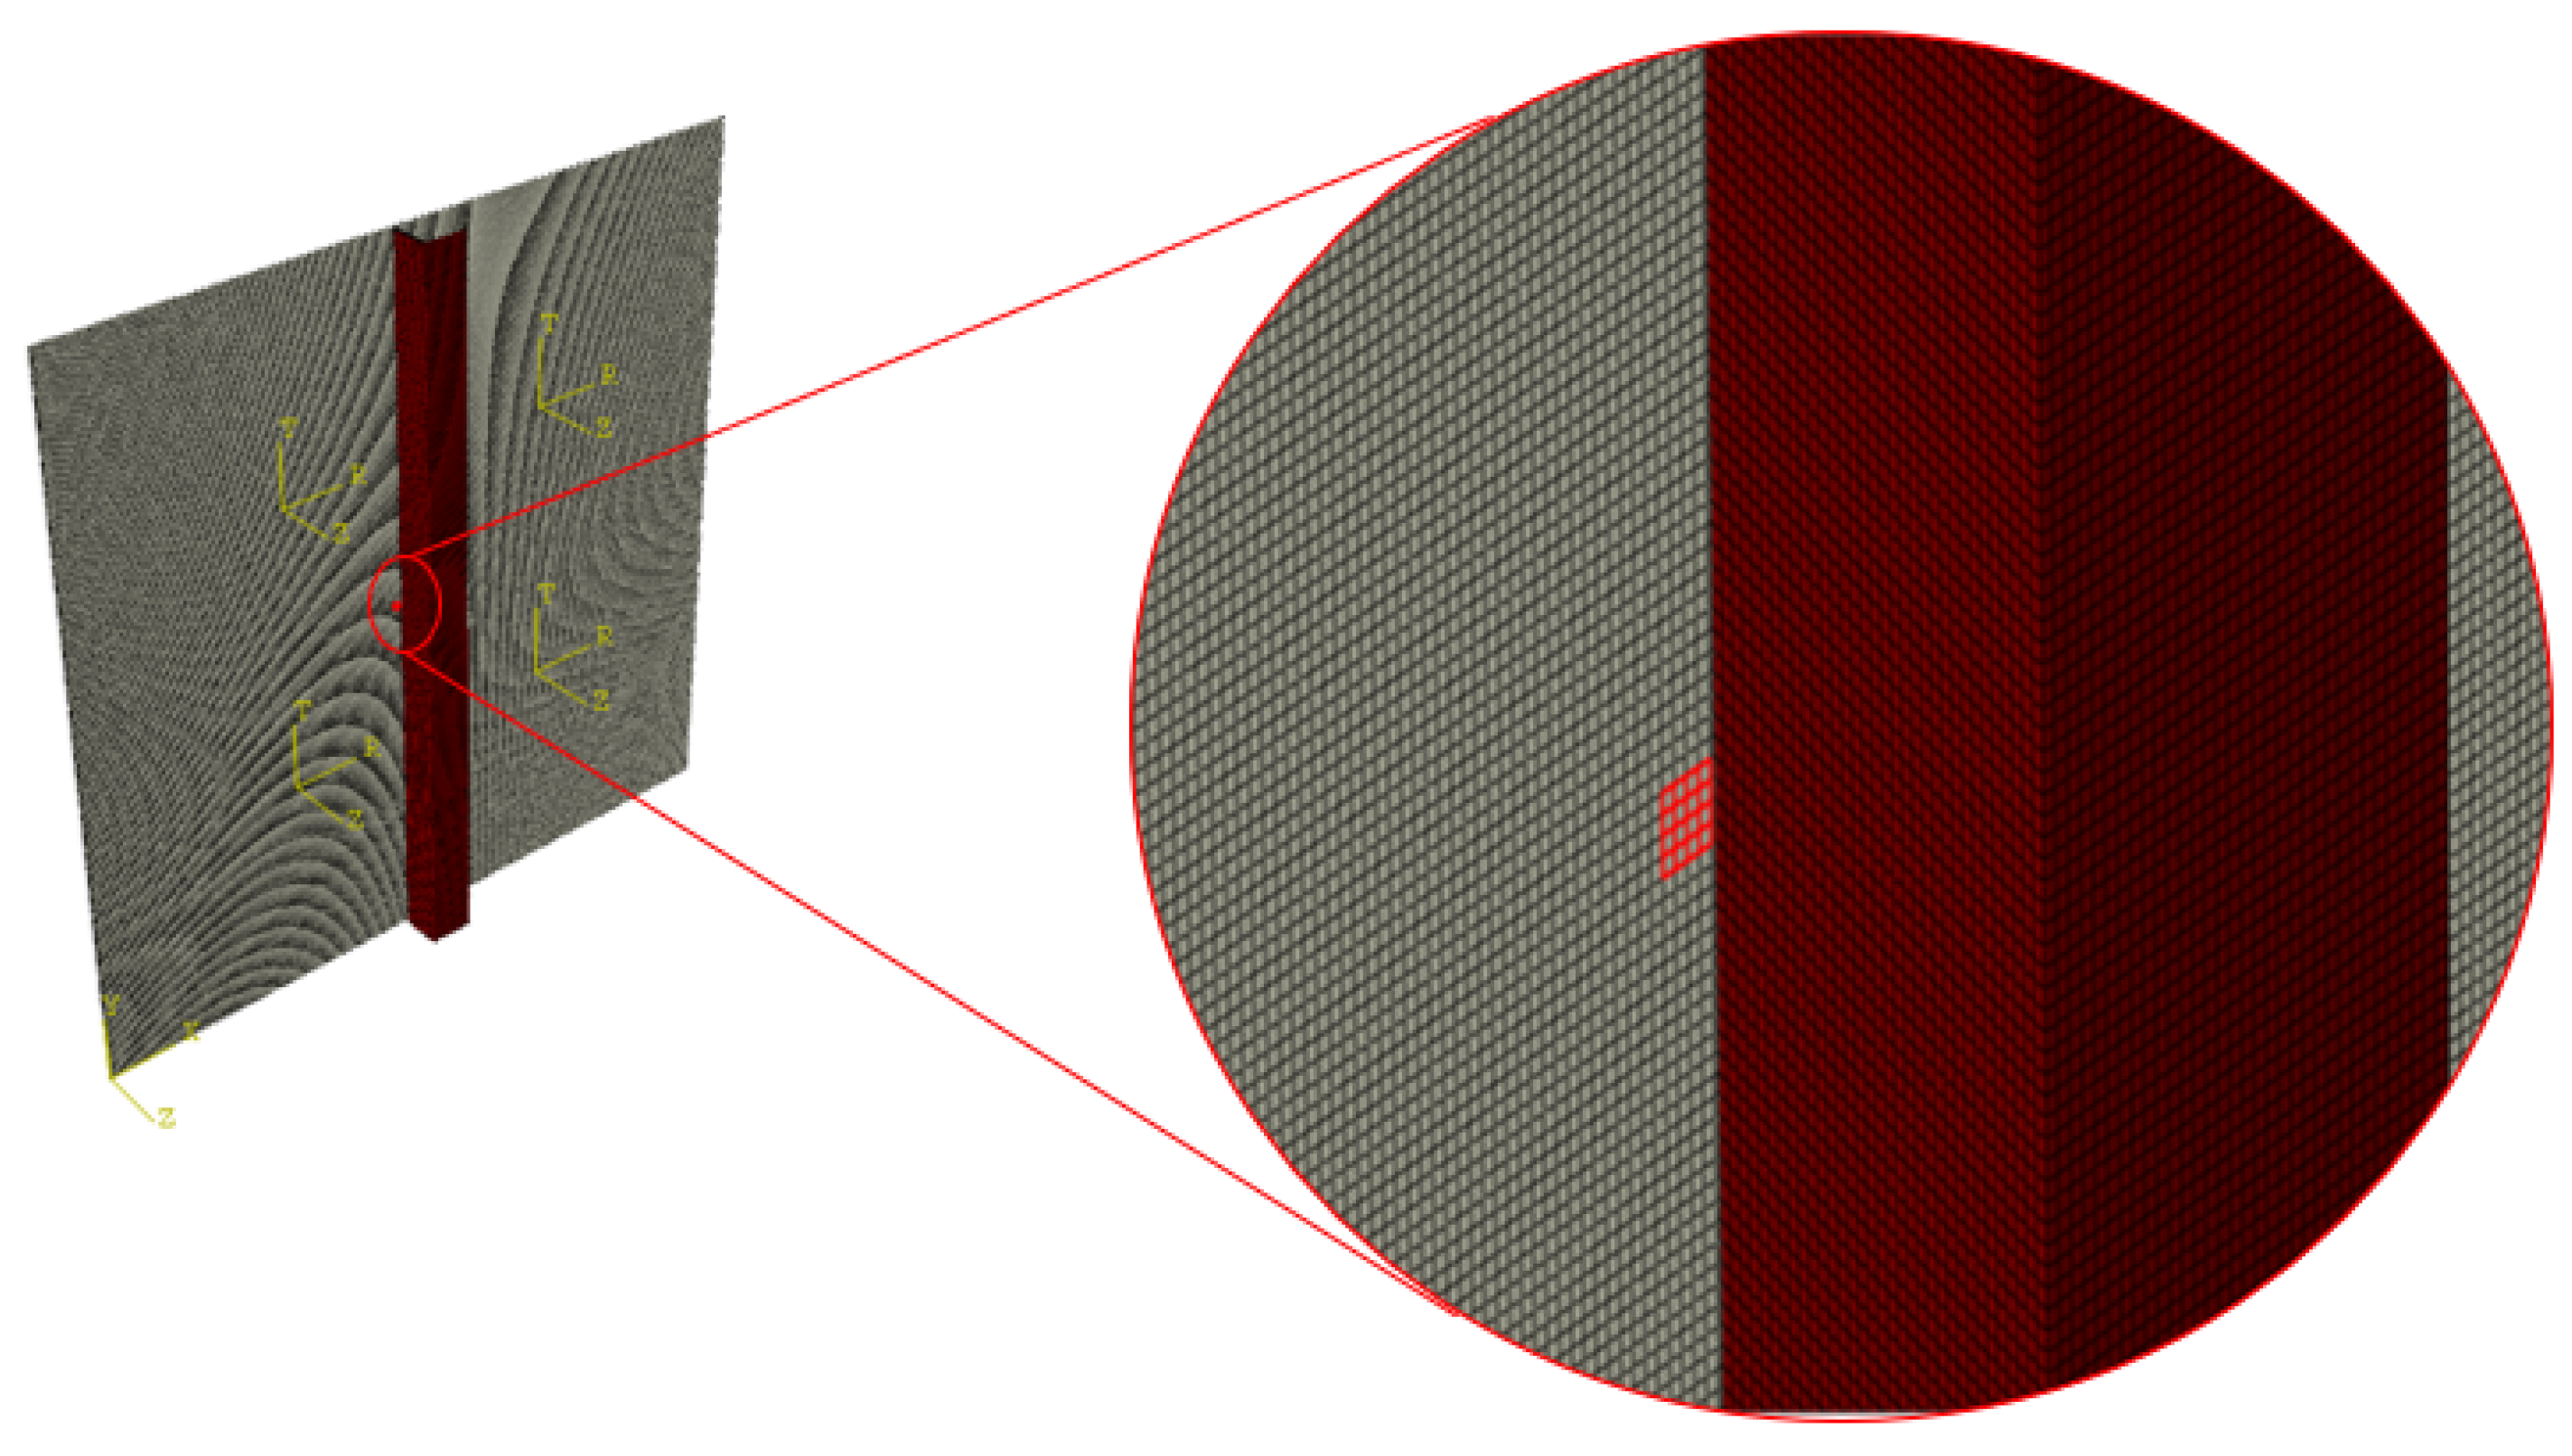
3.2. Case Study: Stiffened Panels
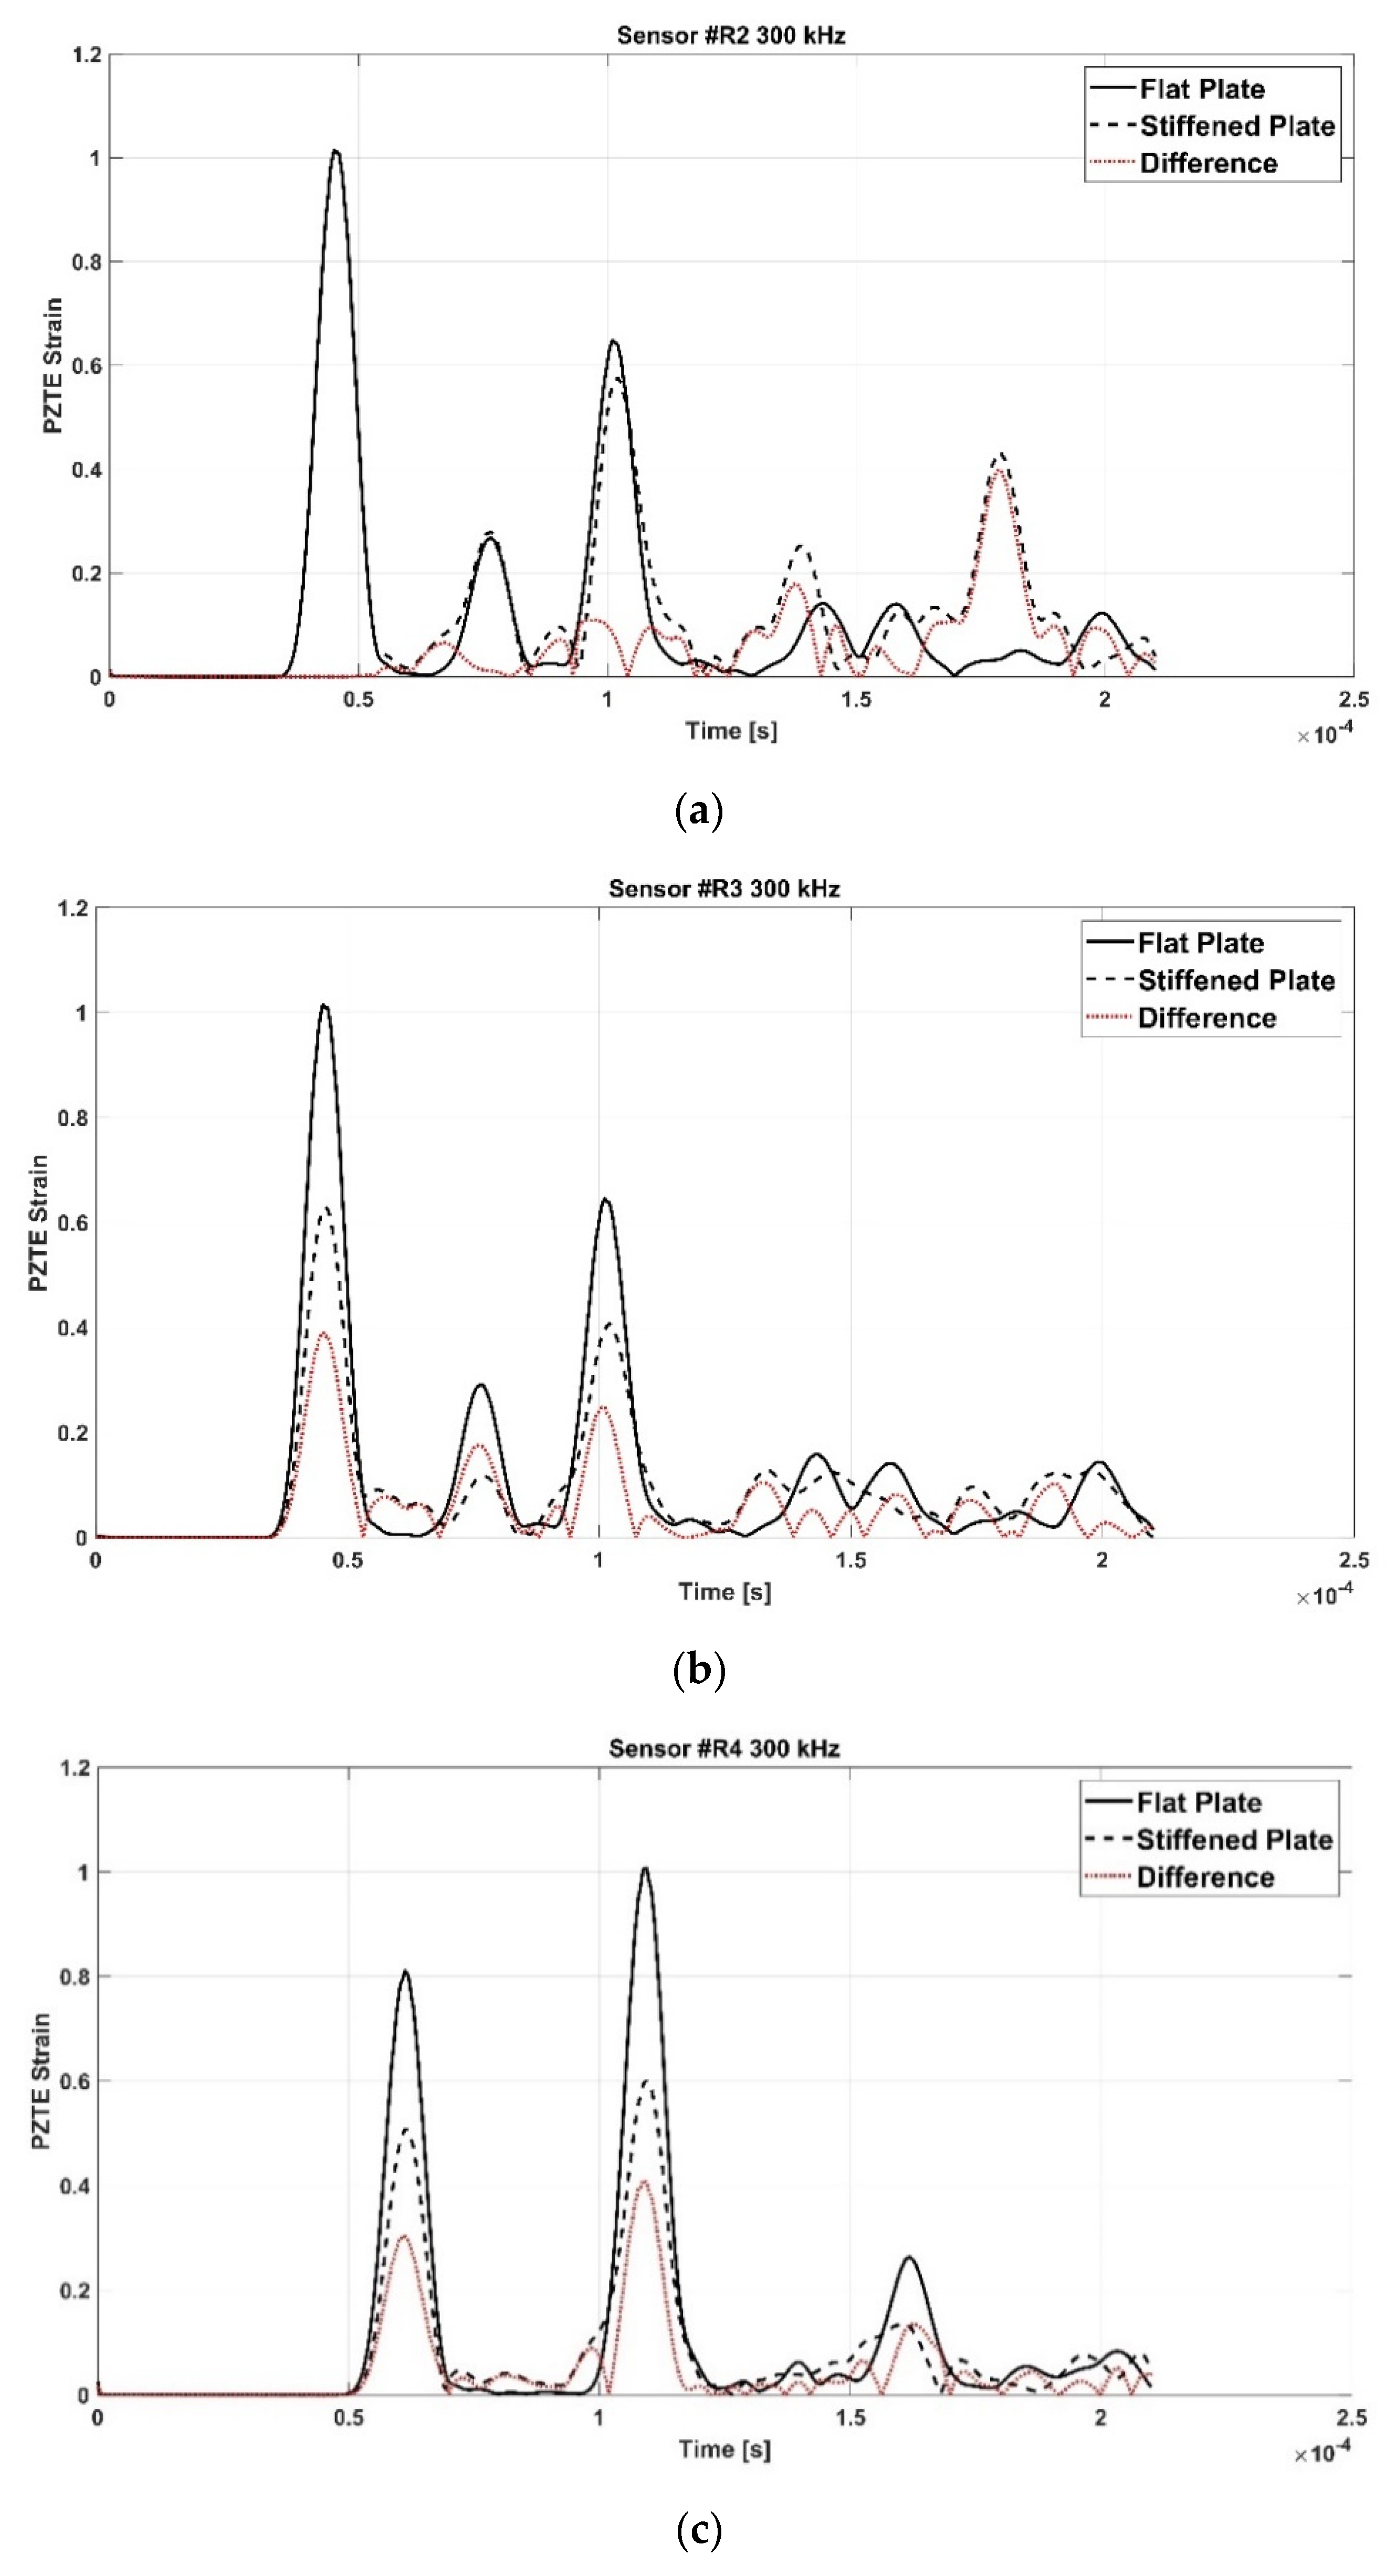
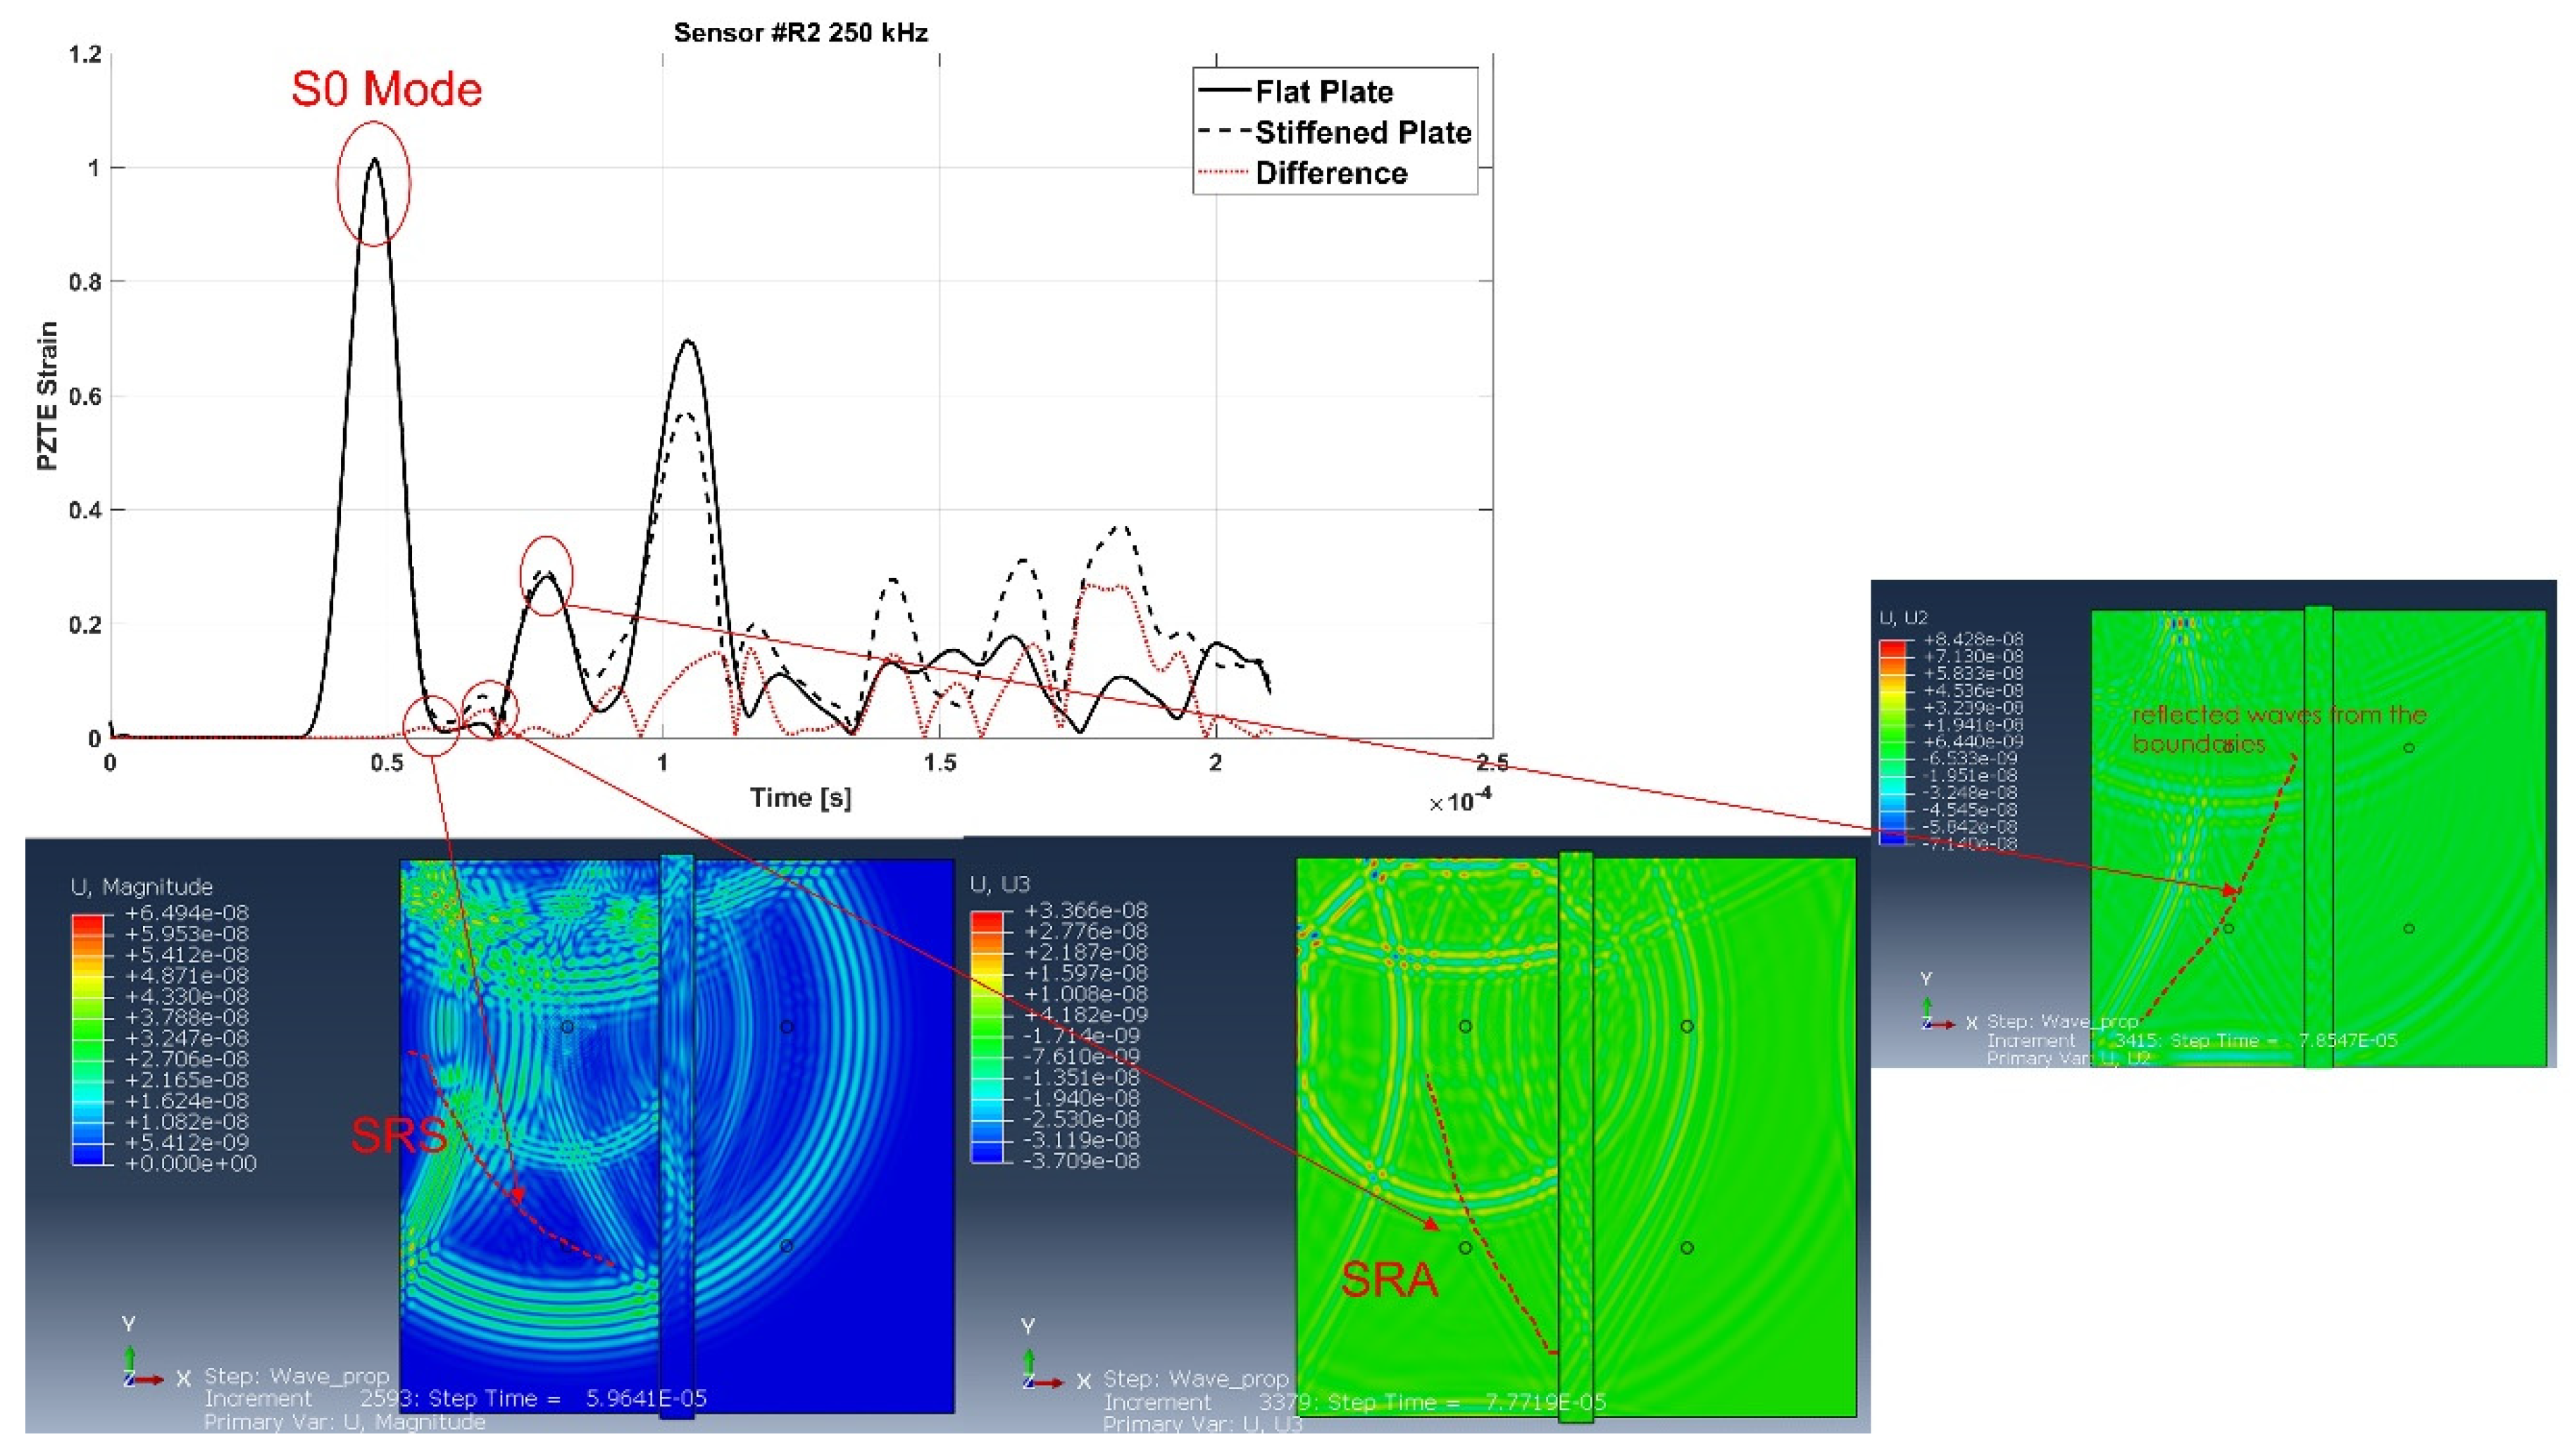
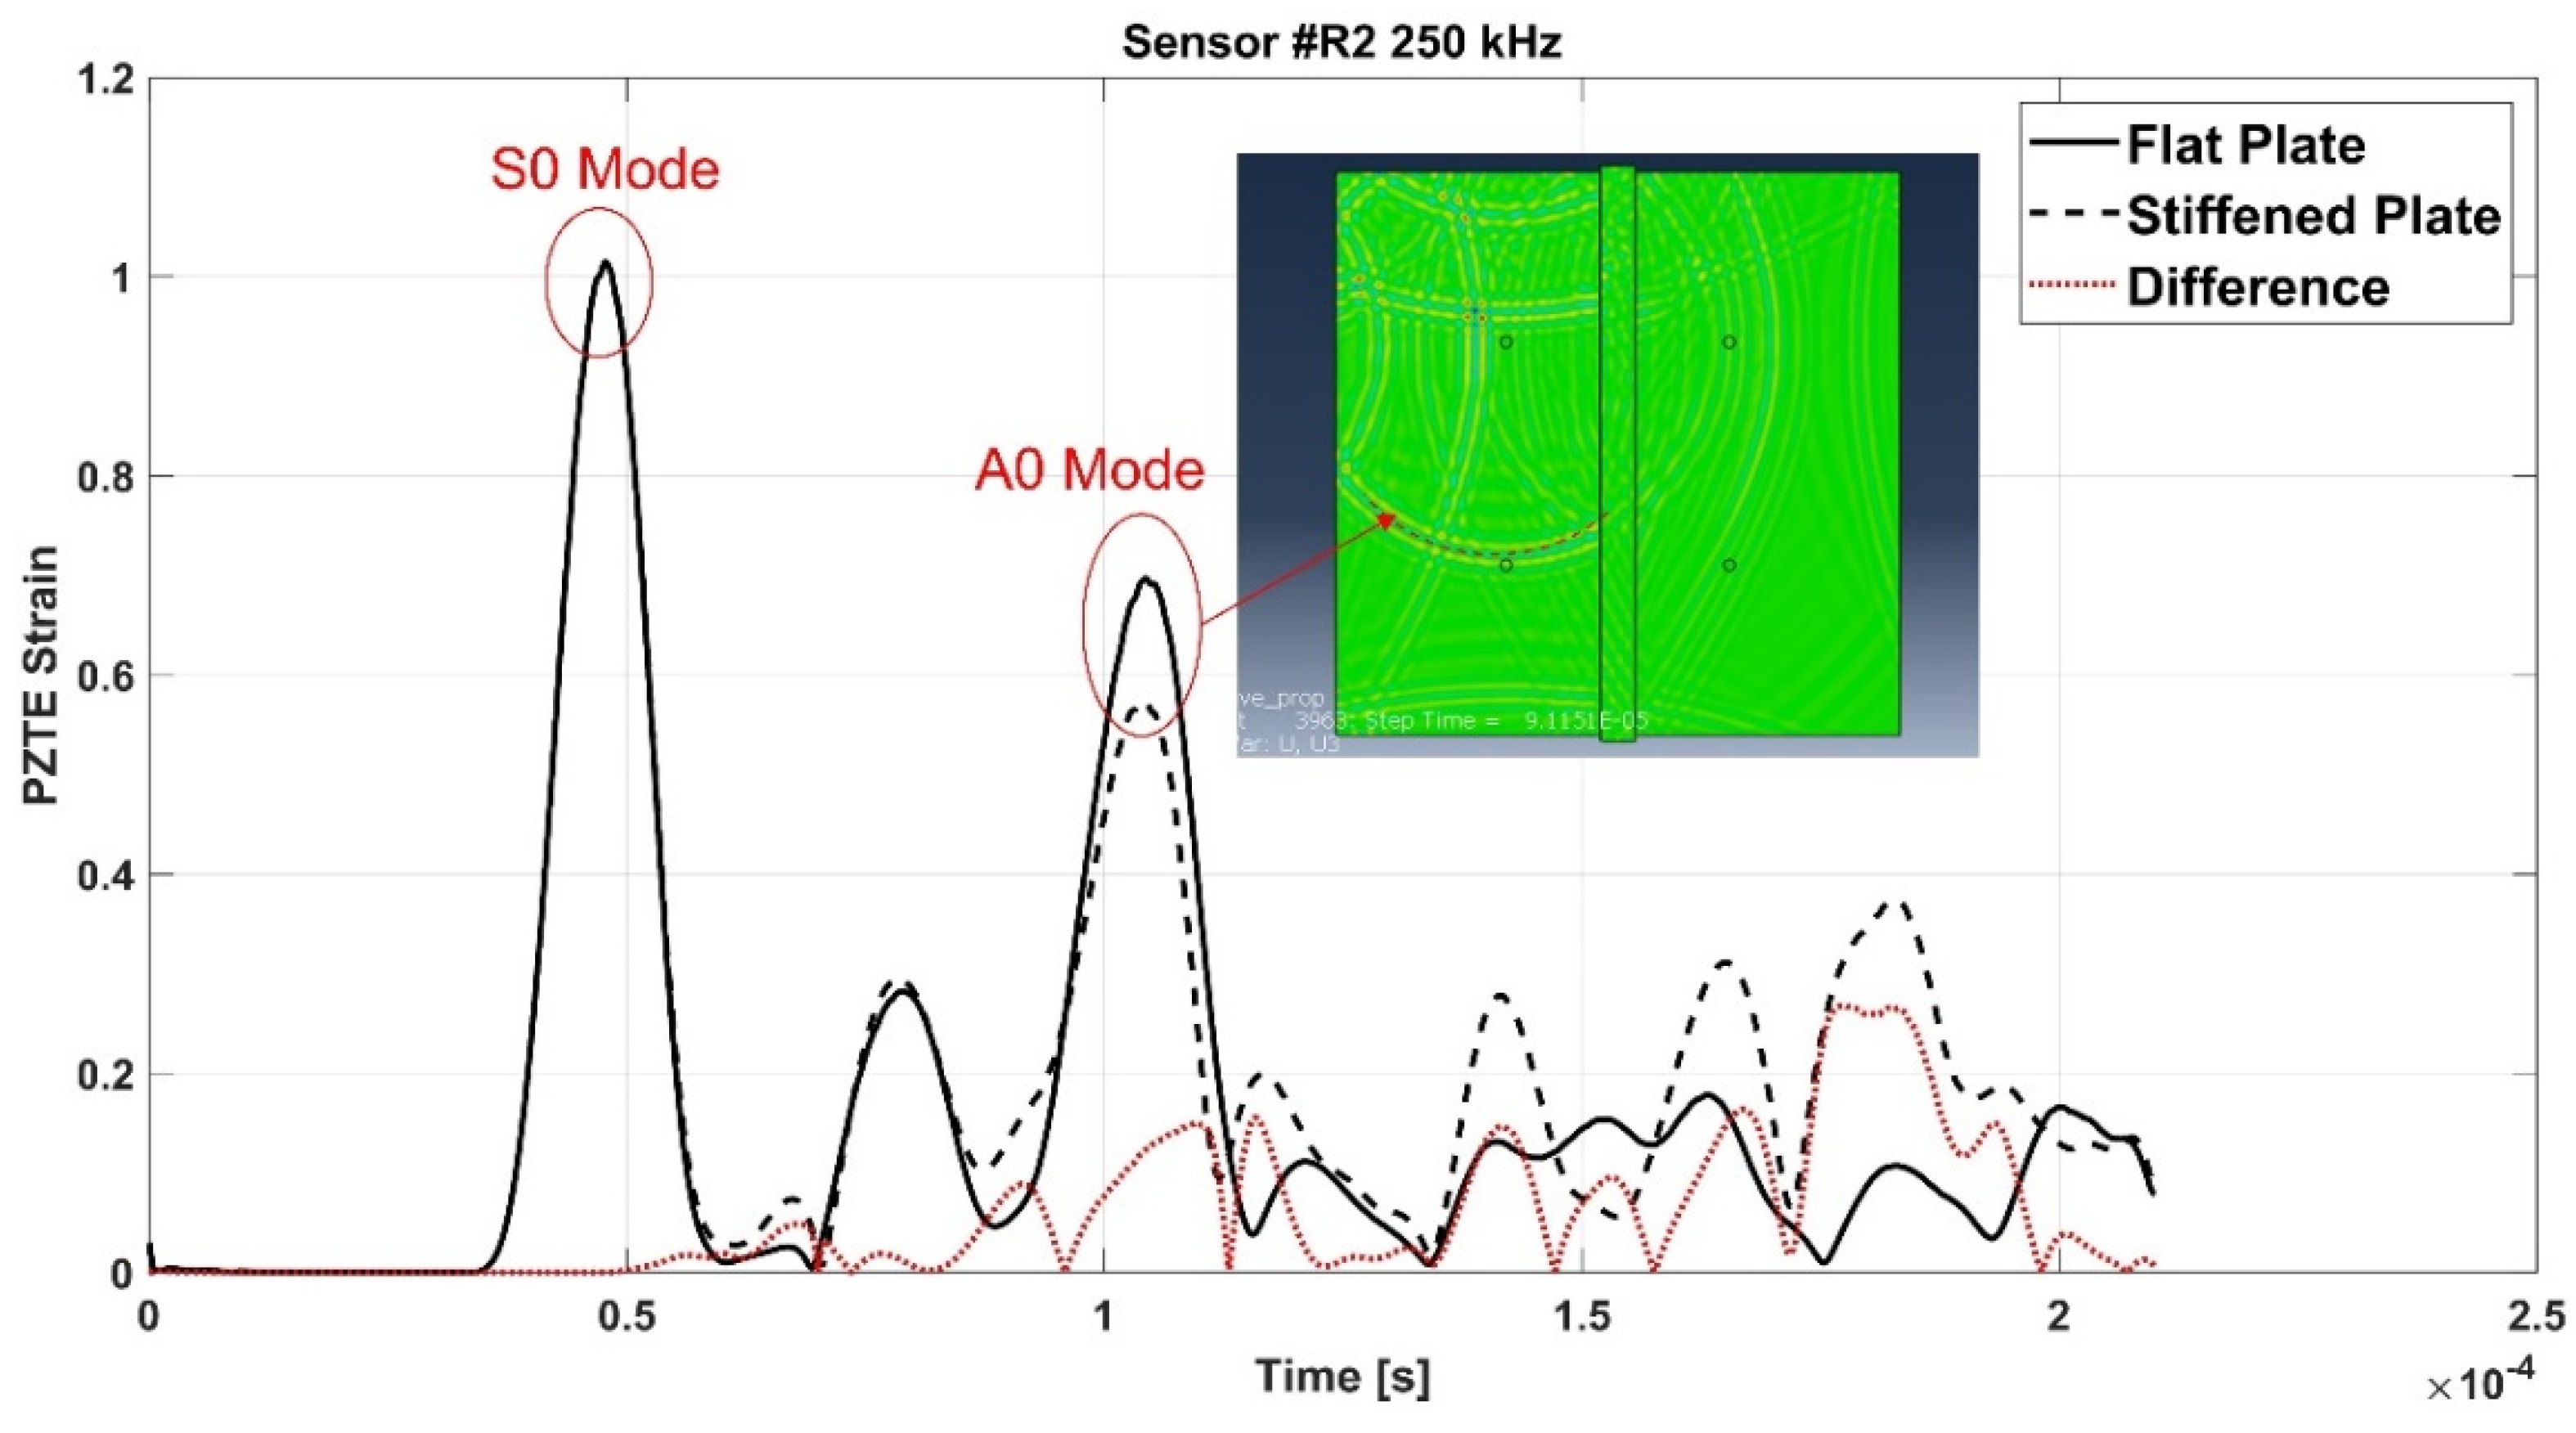
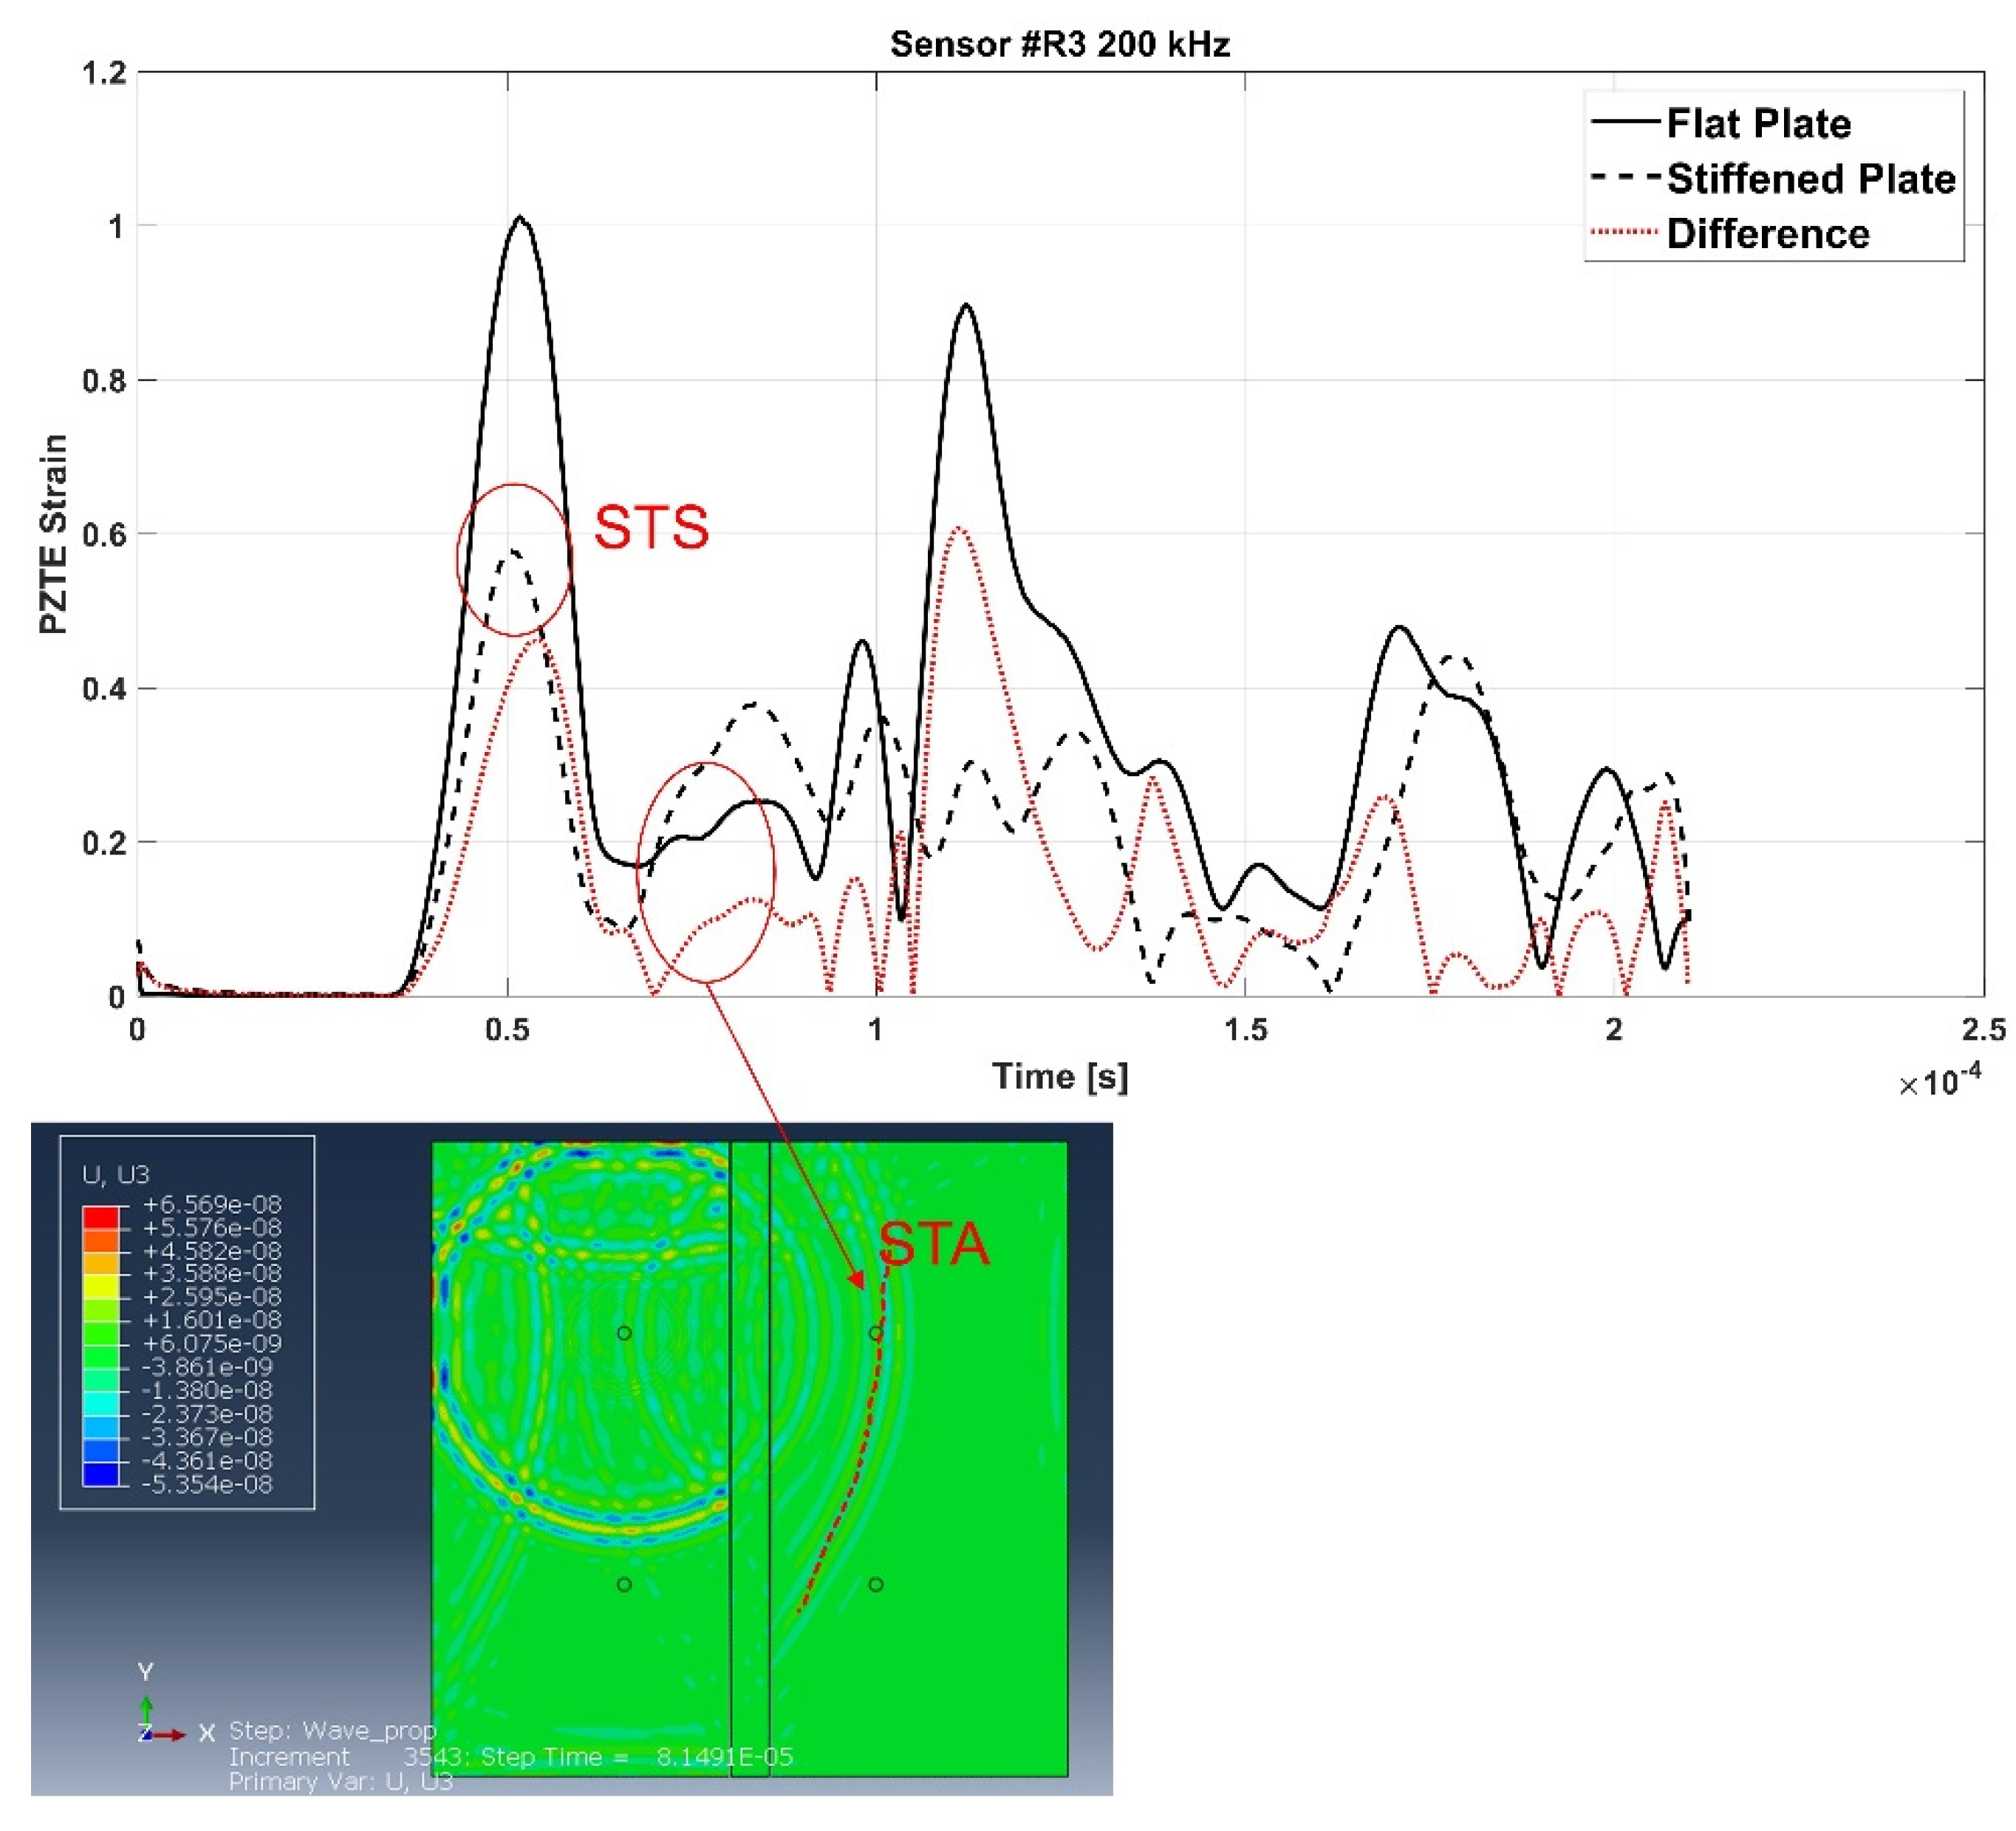
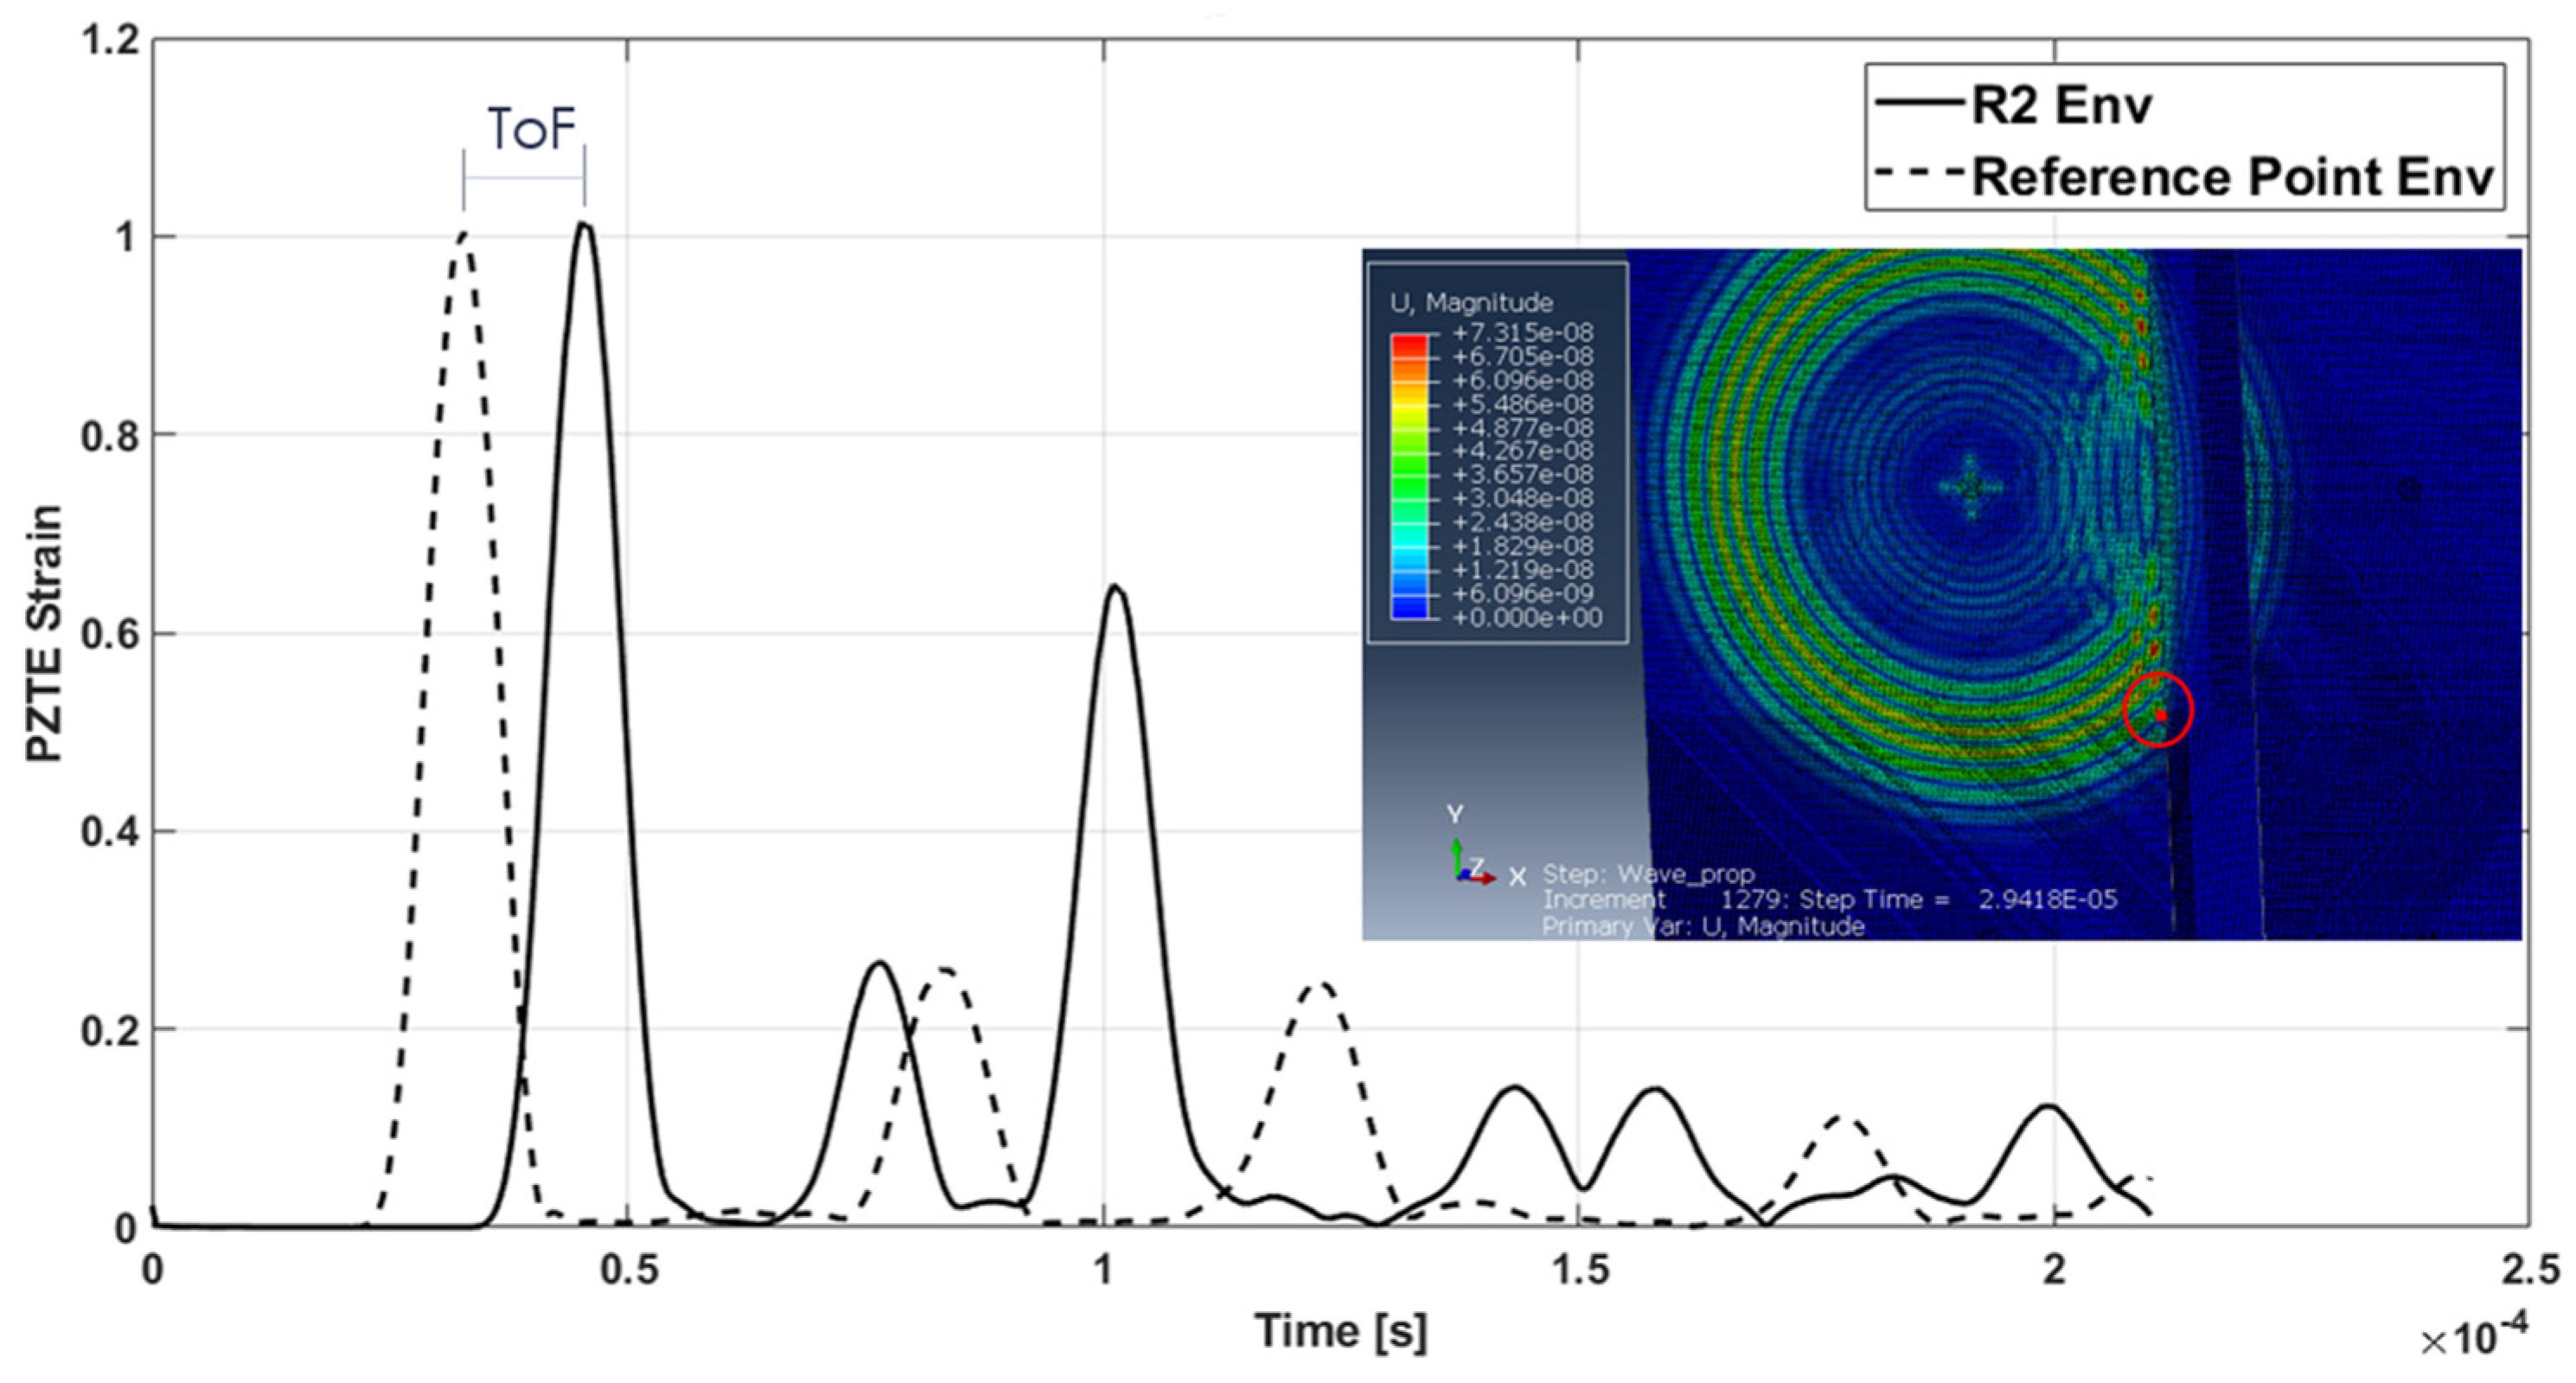
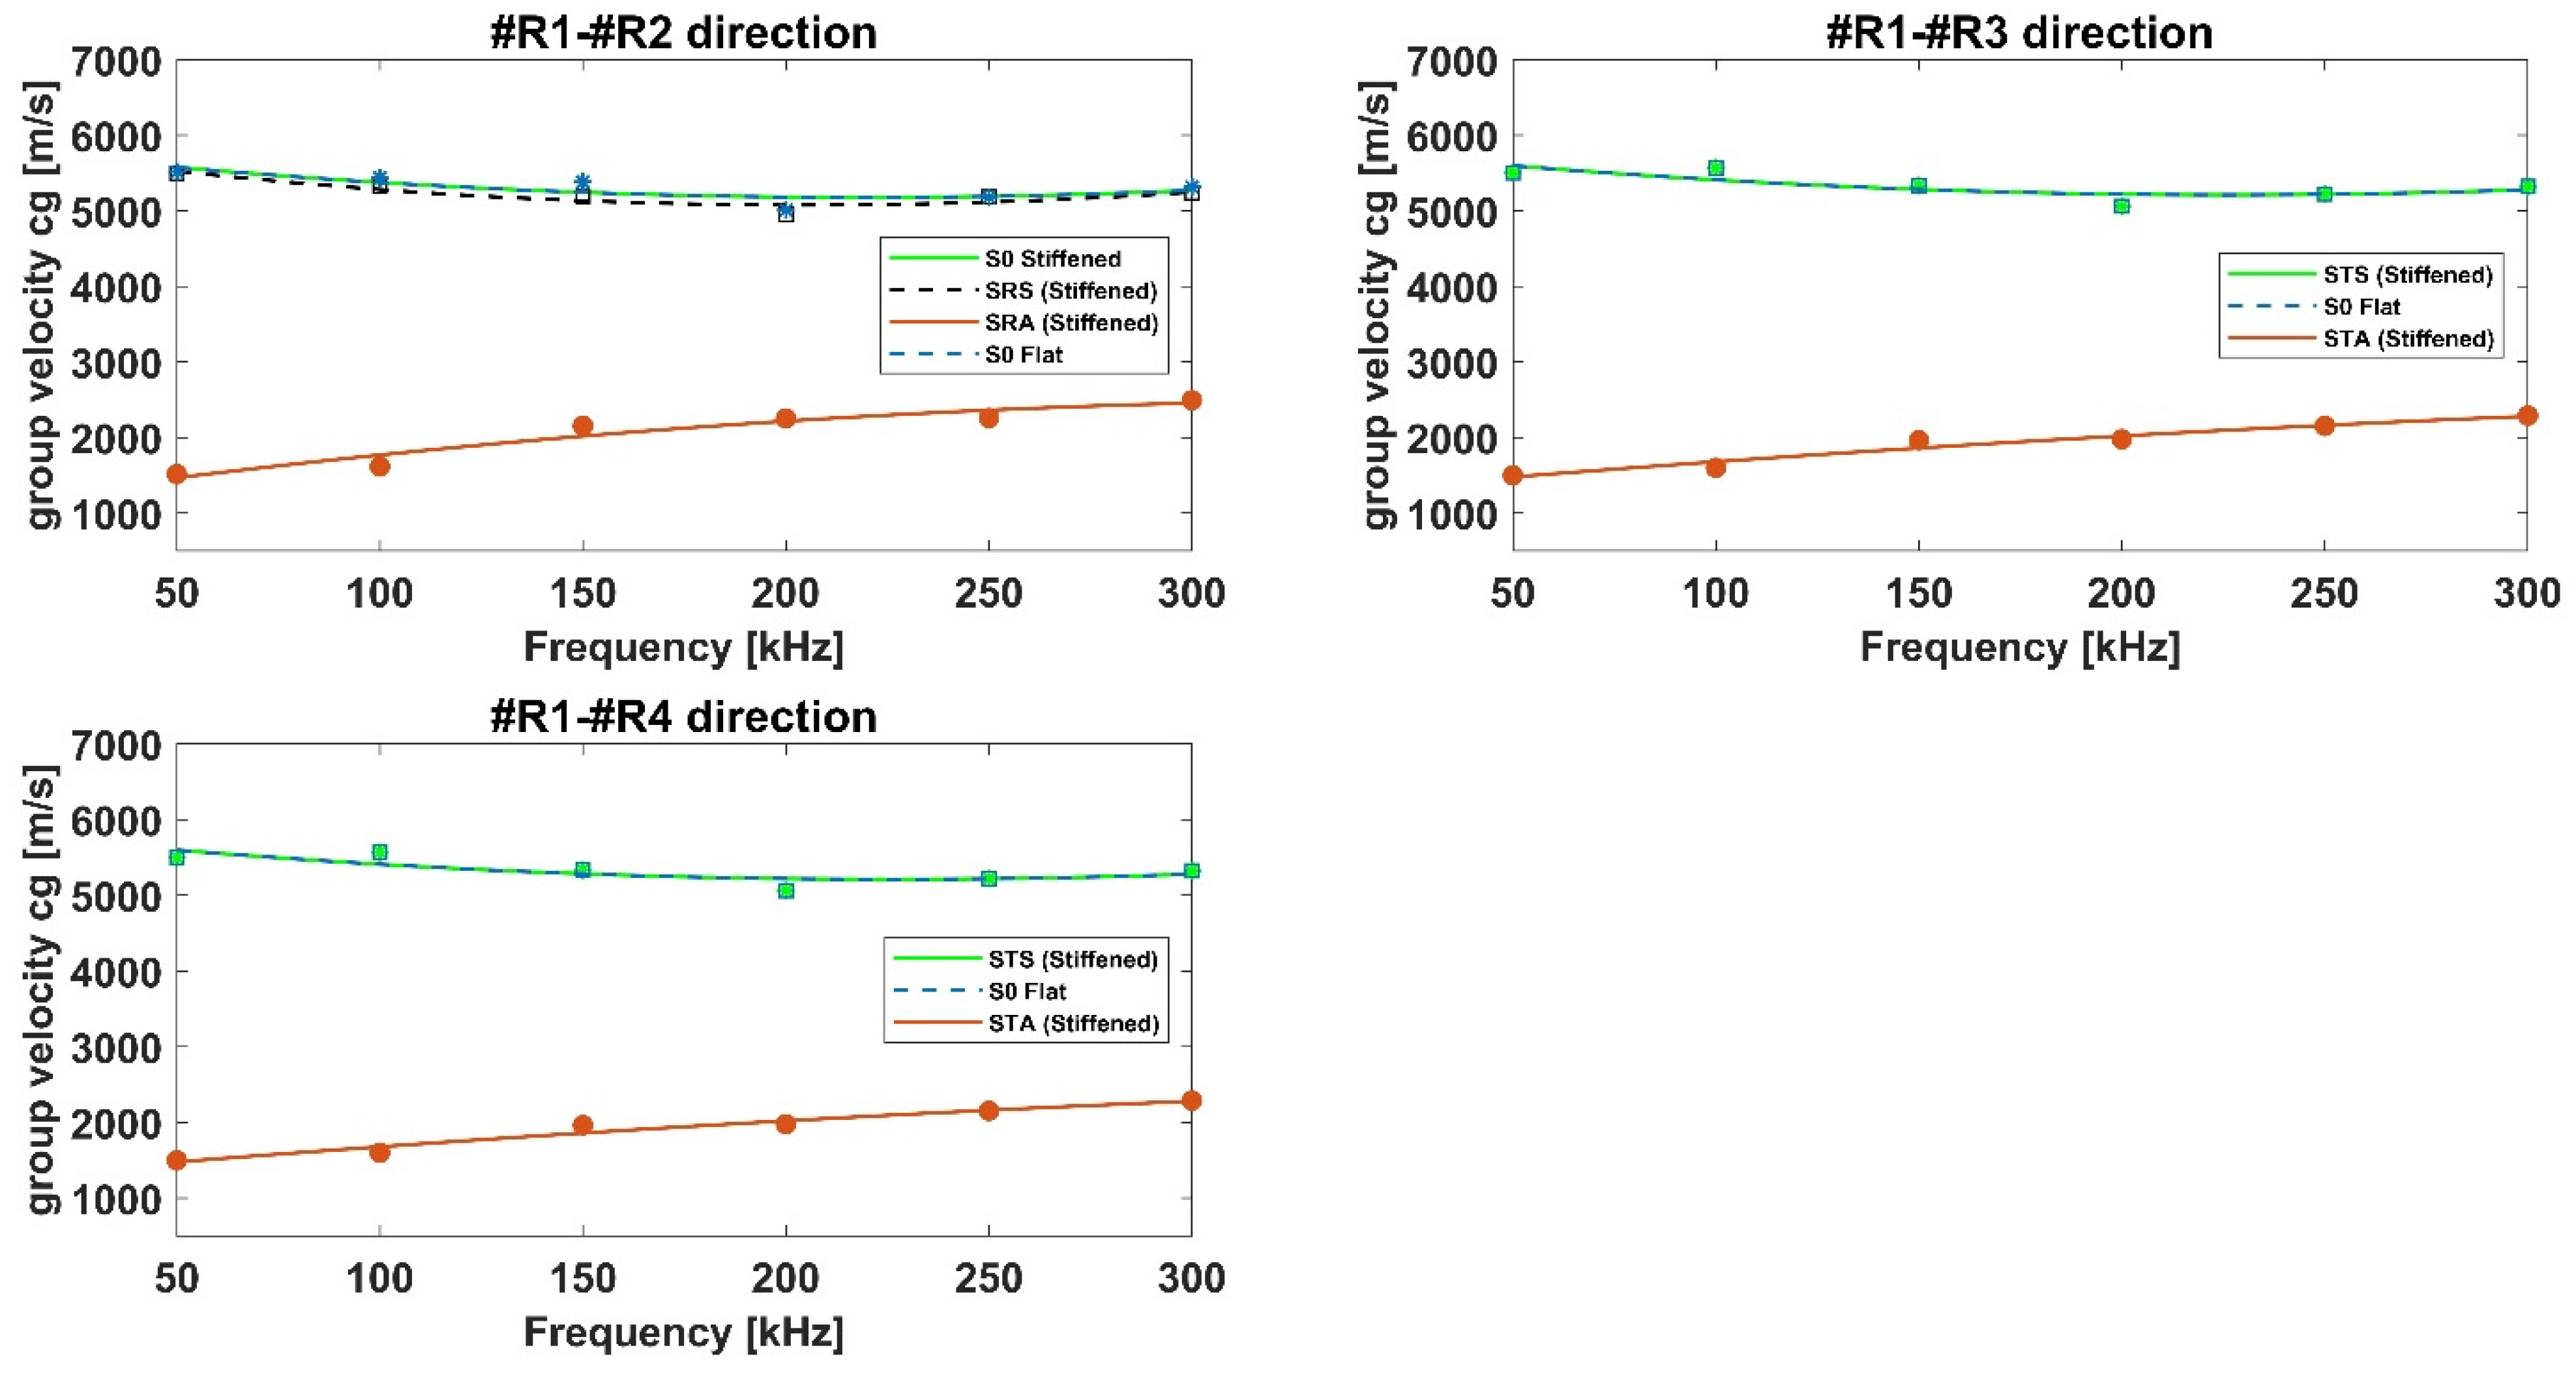
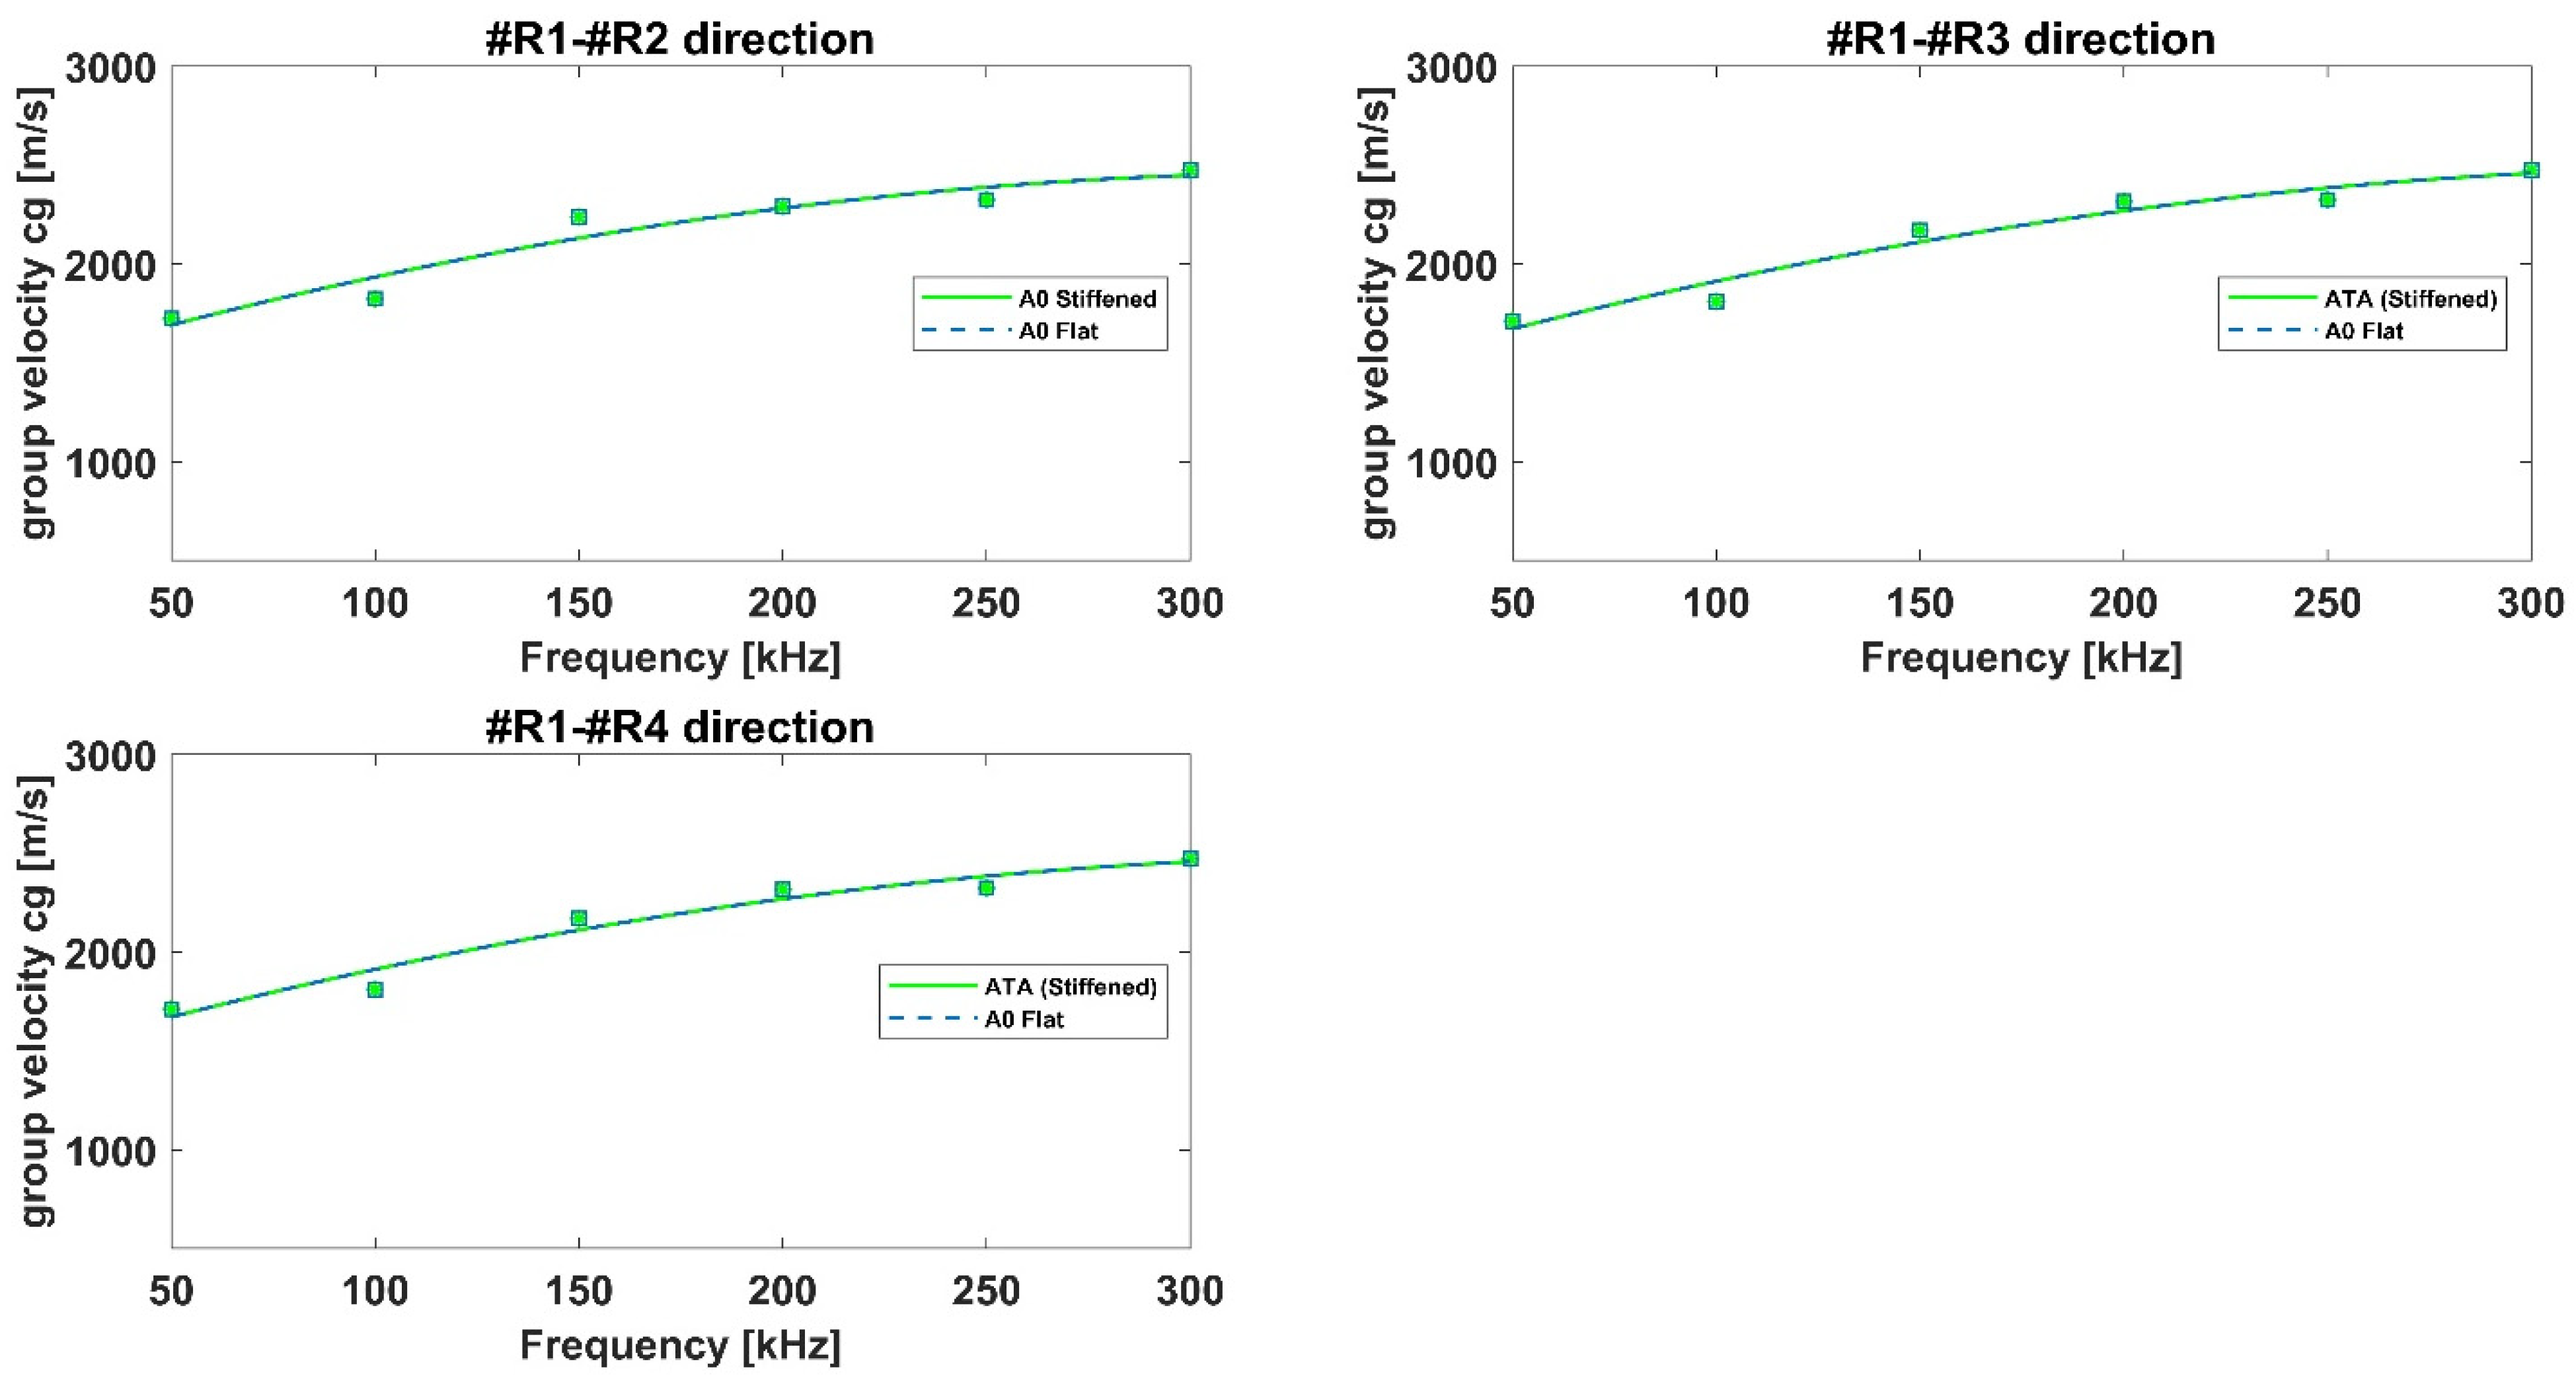
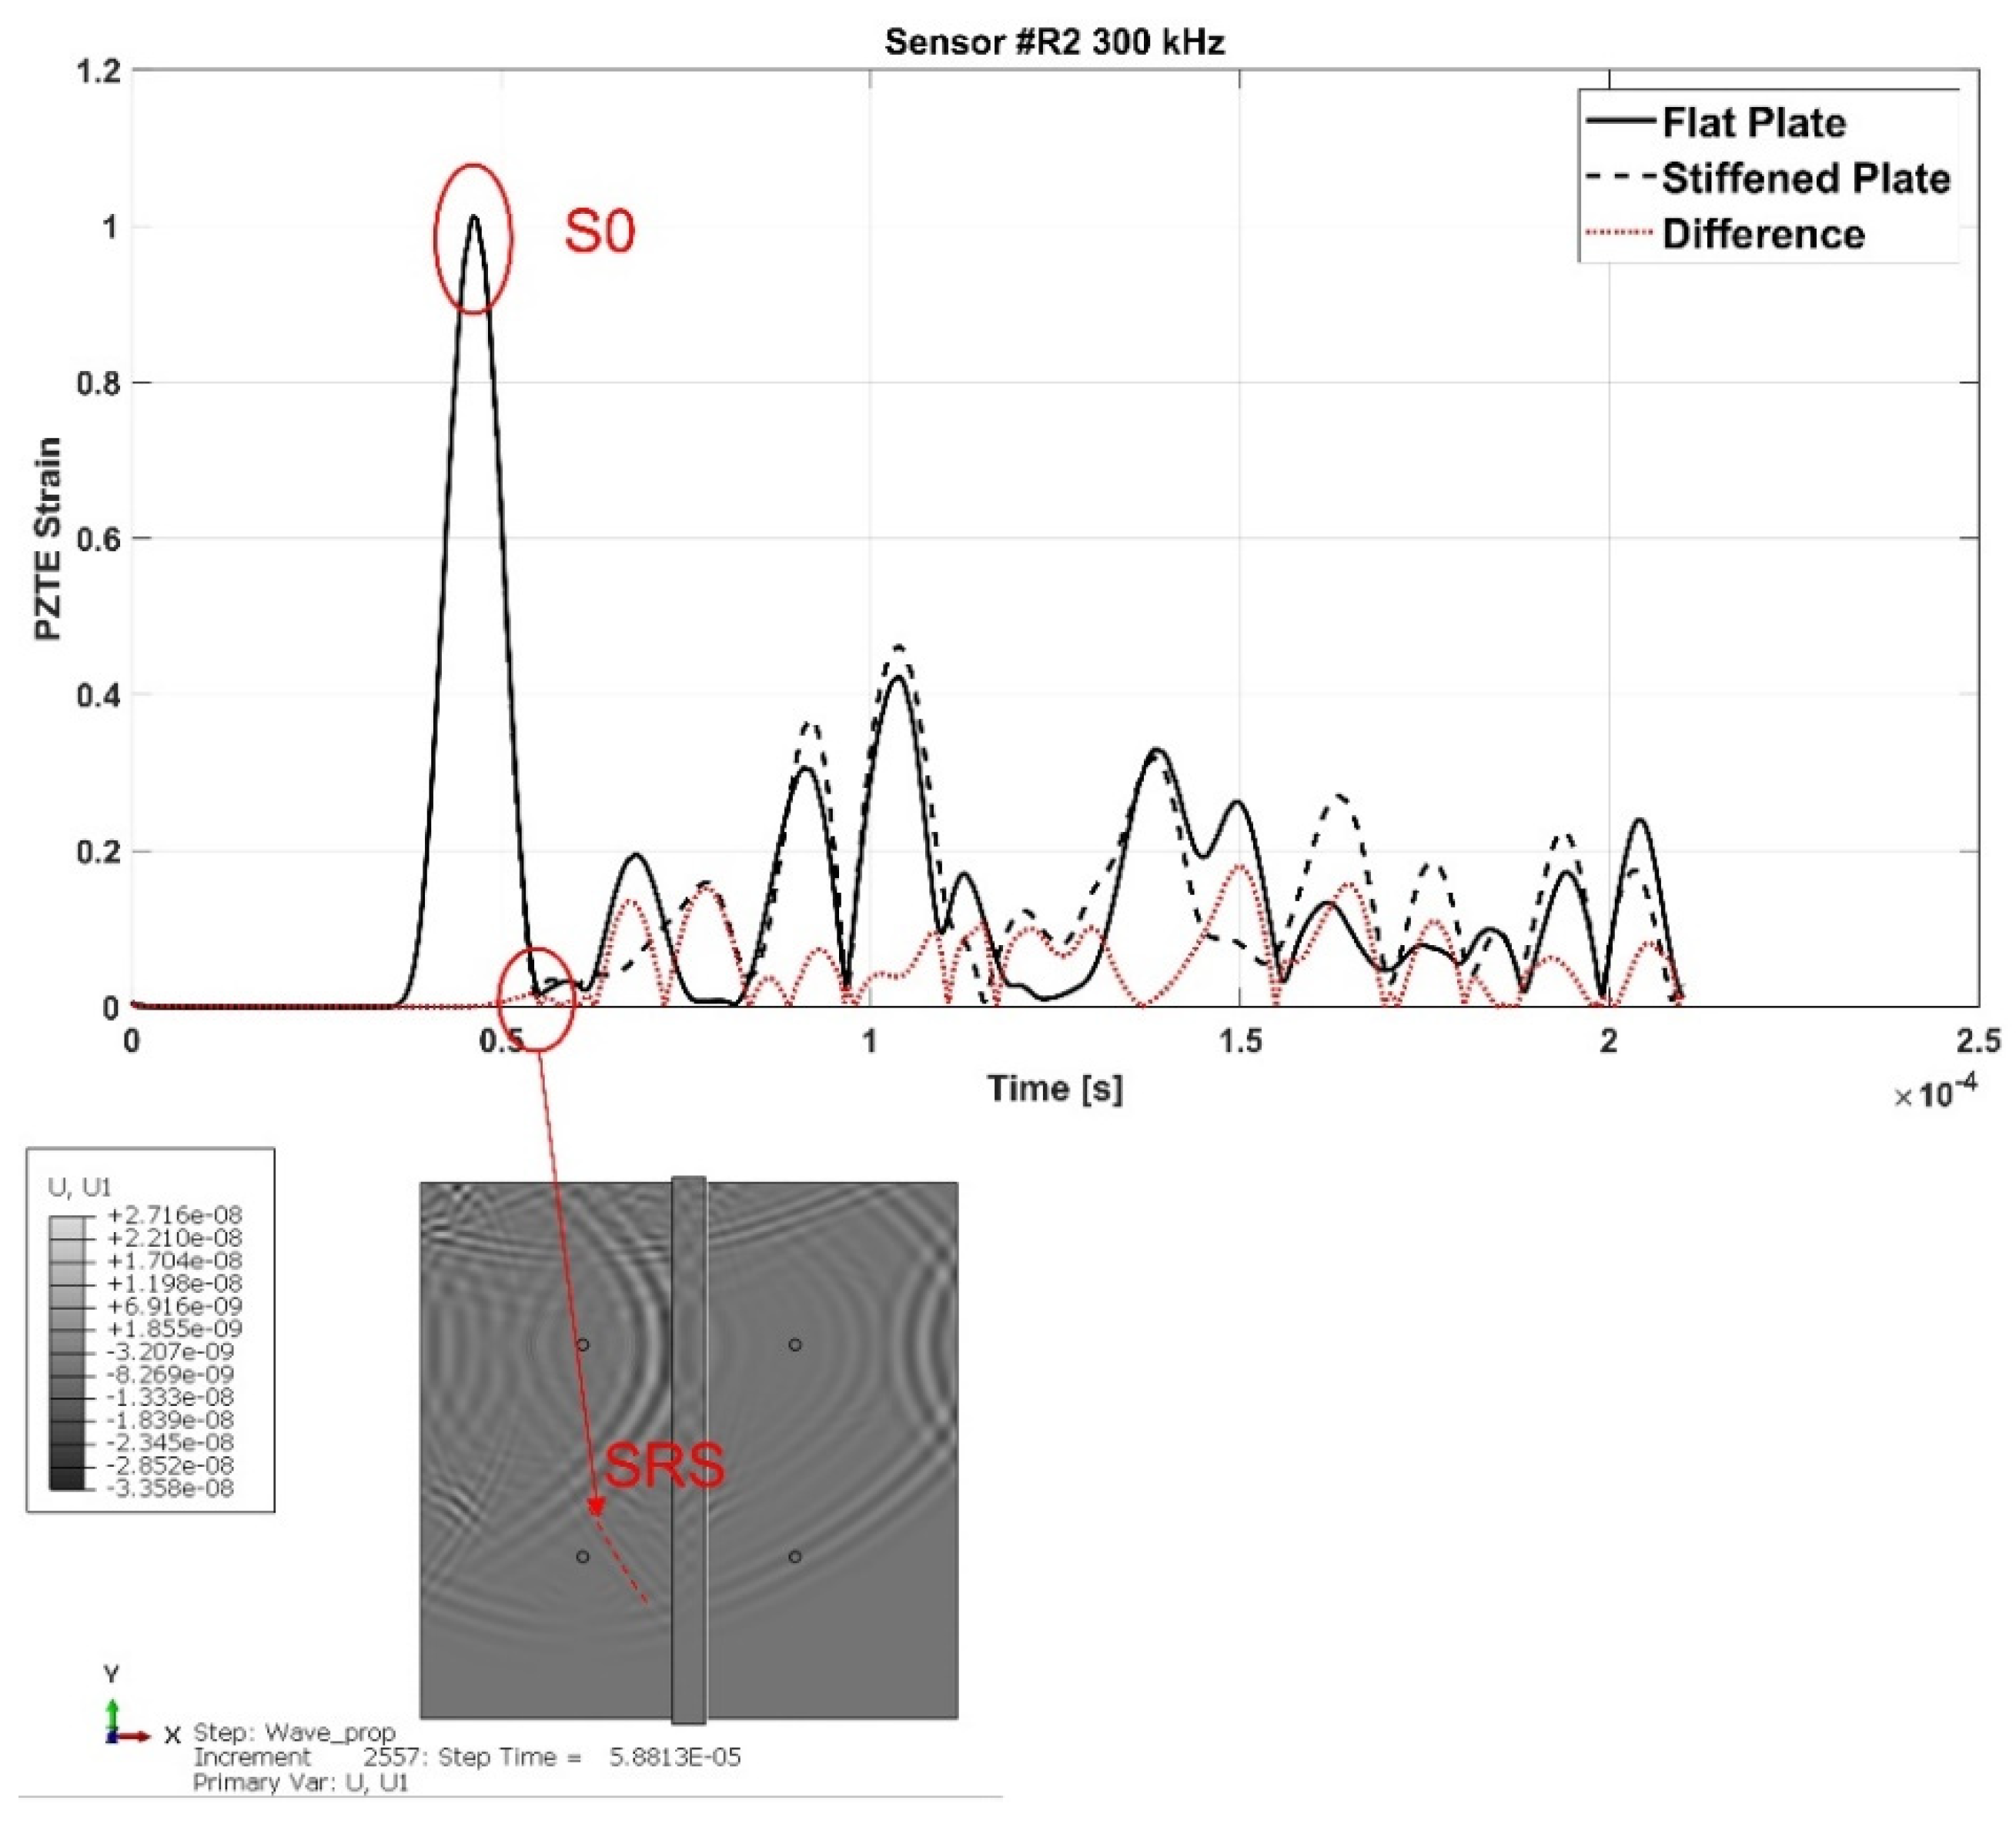
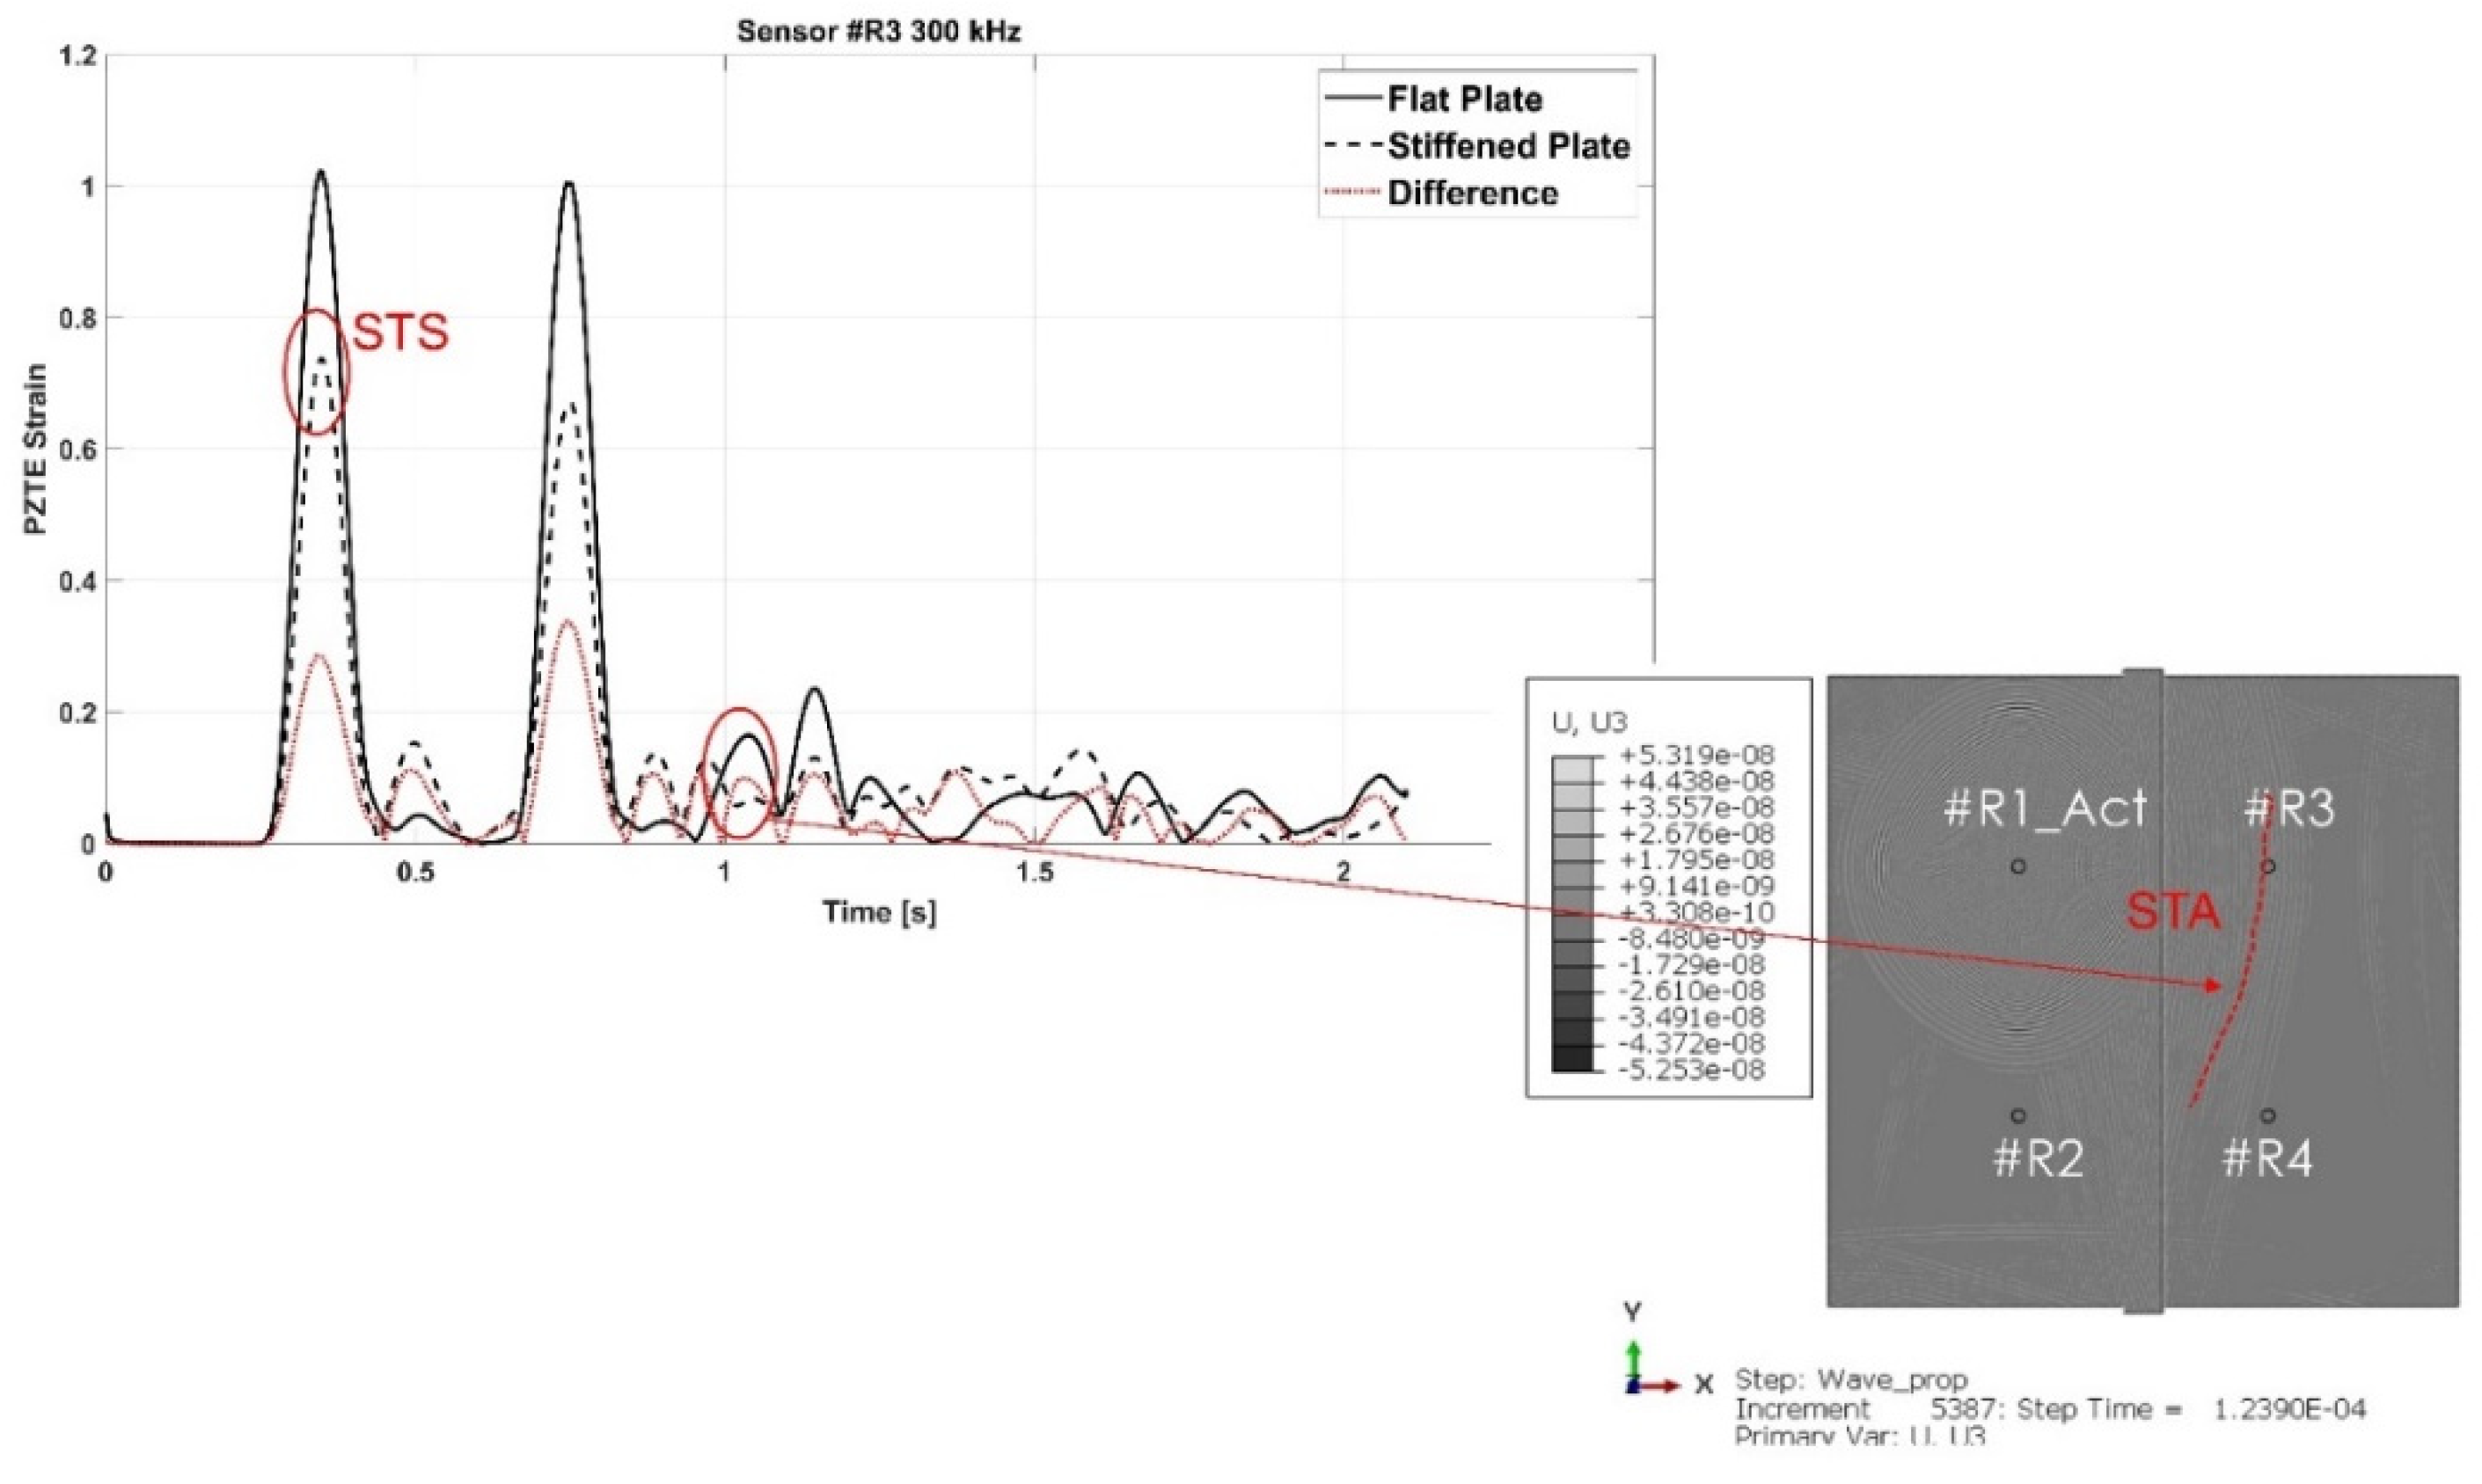
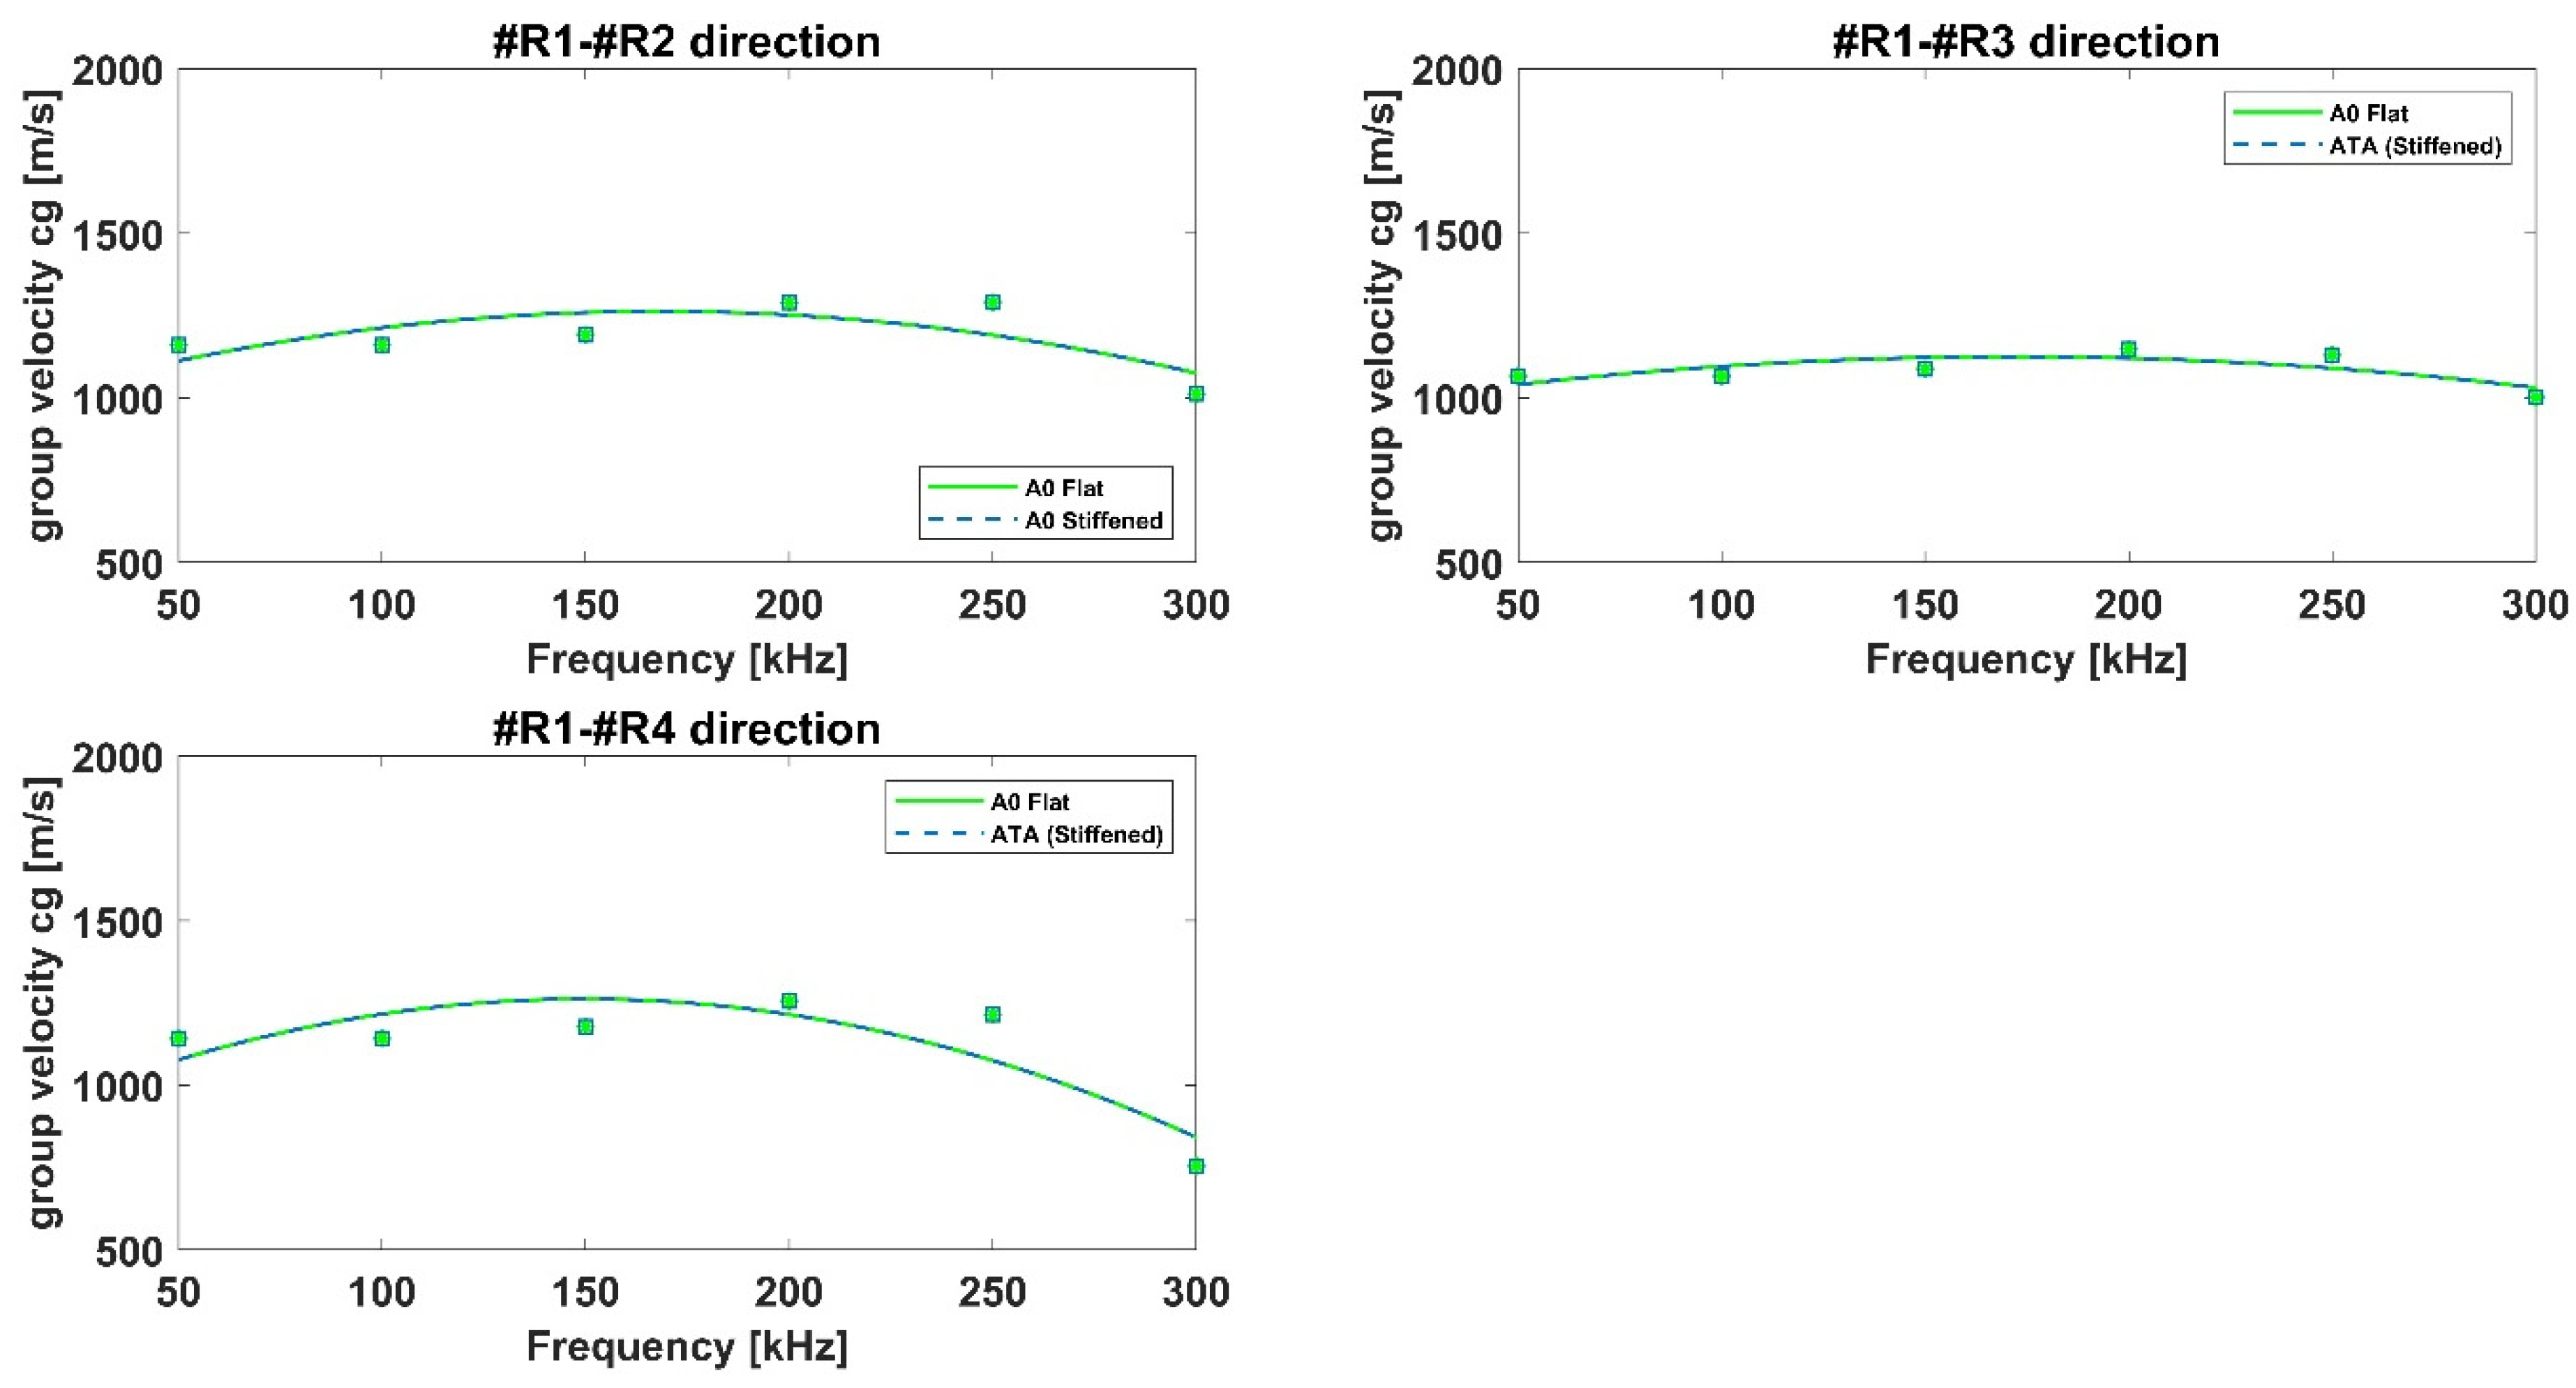
4. Results Analysis
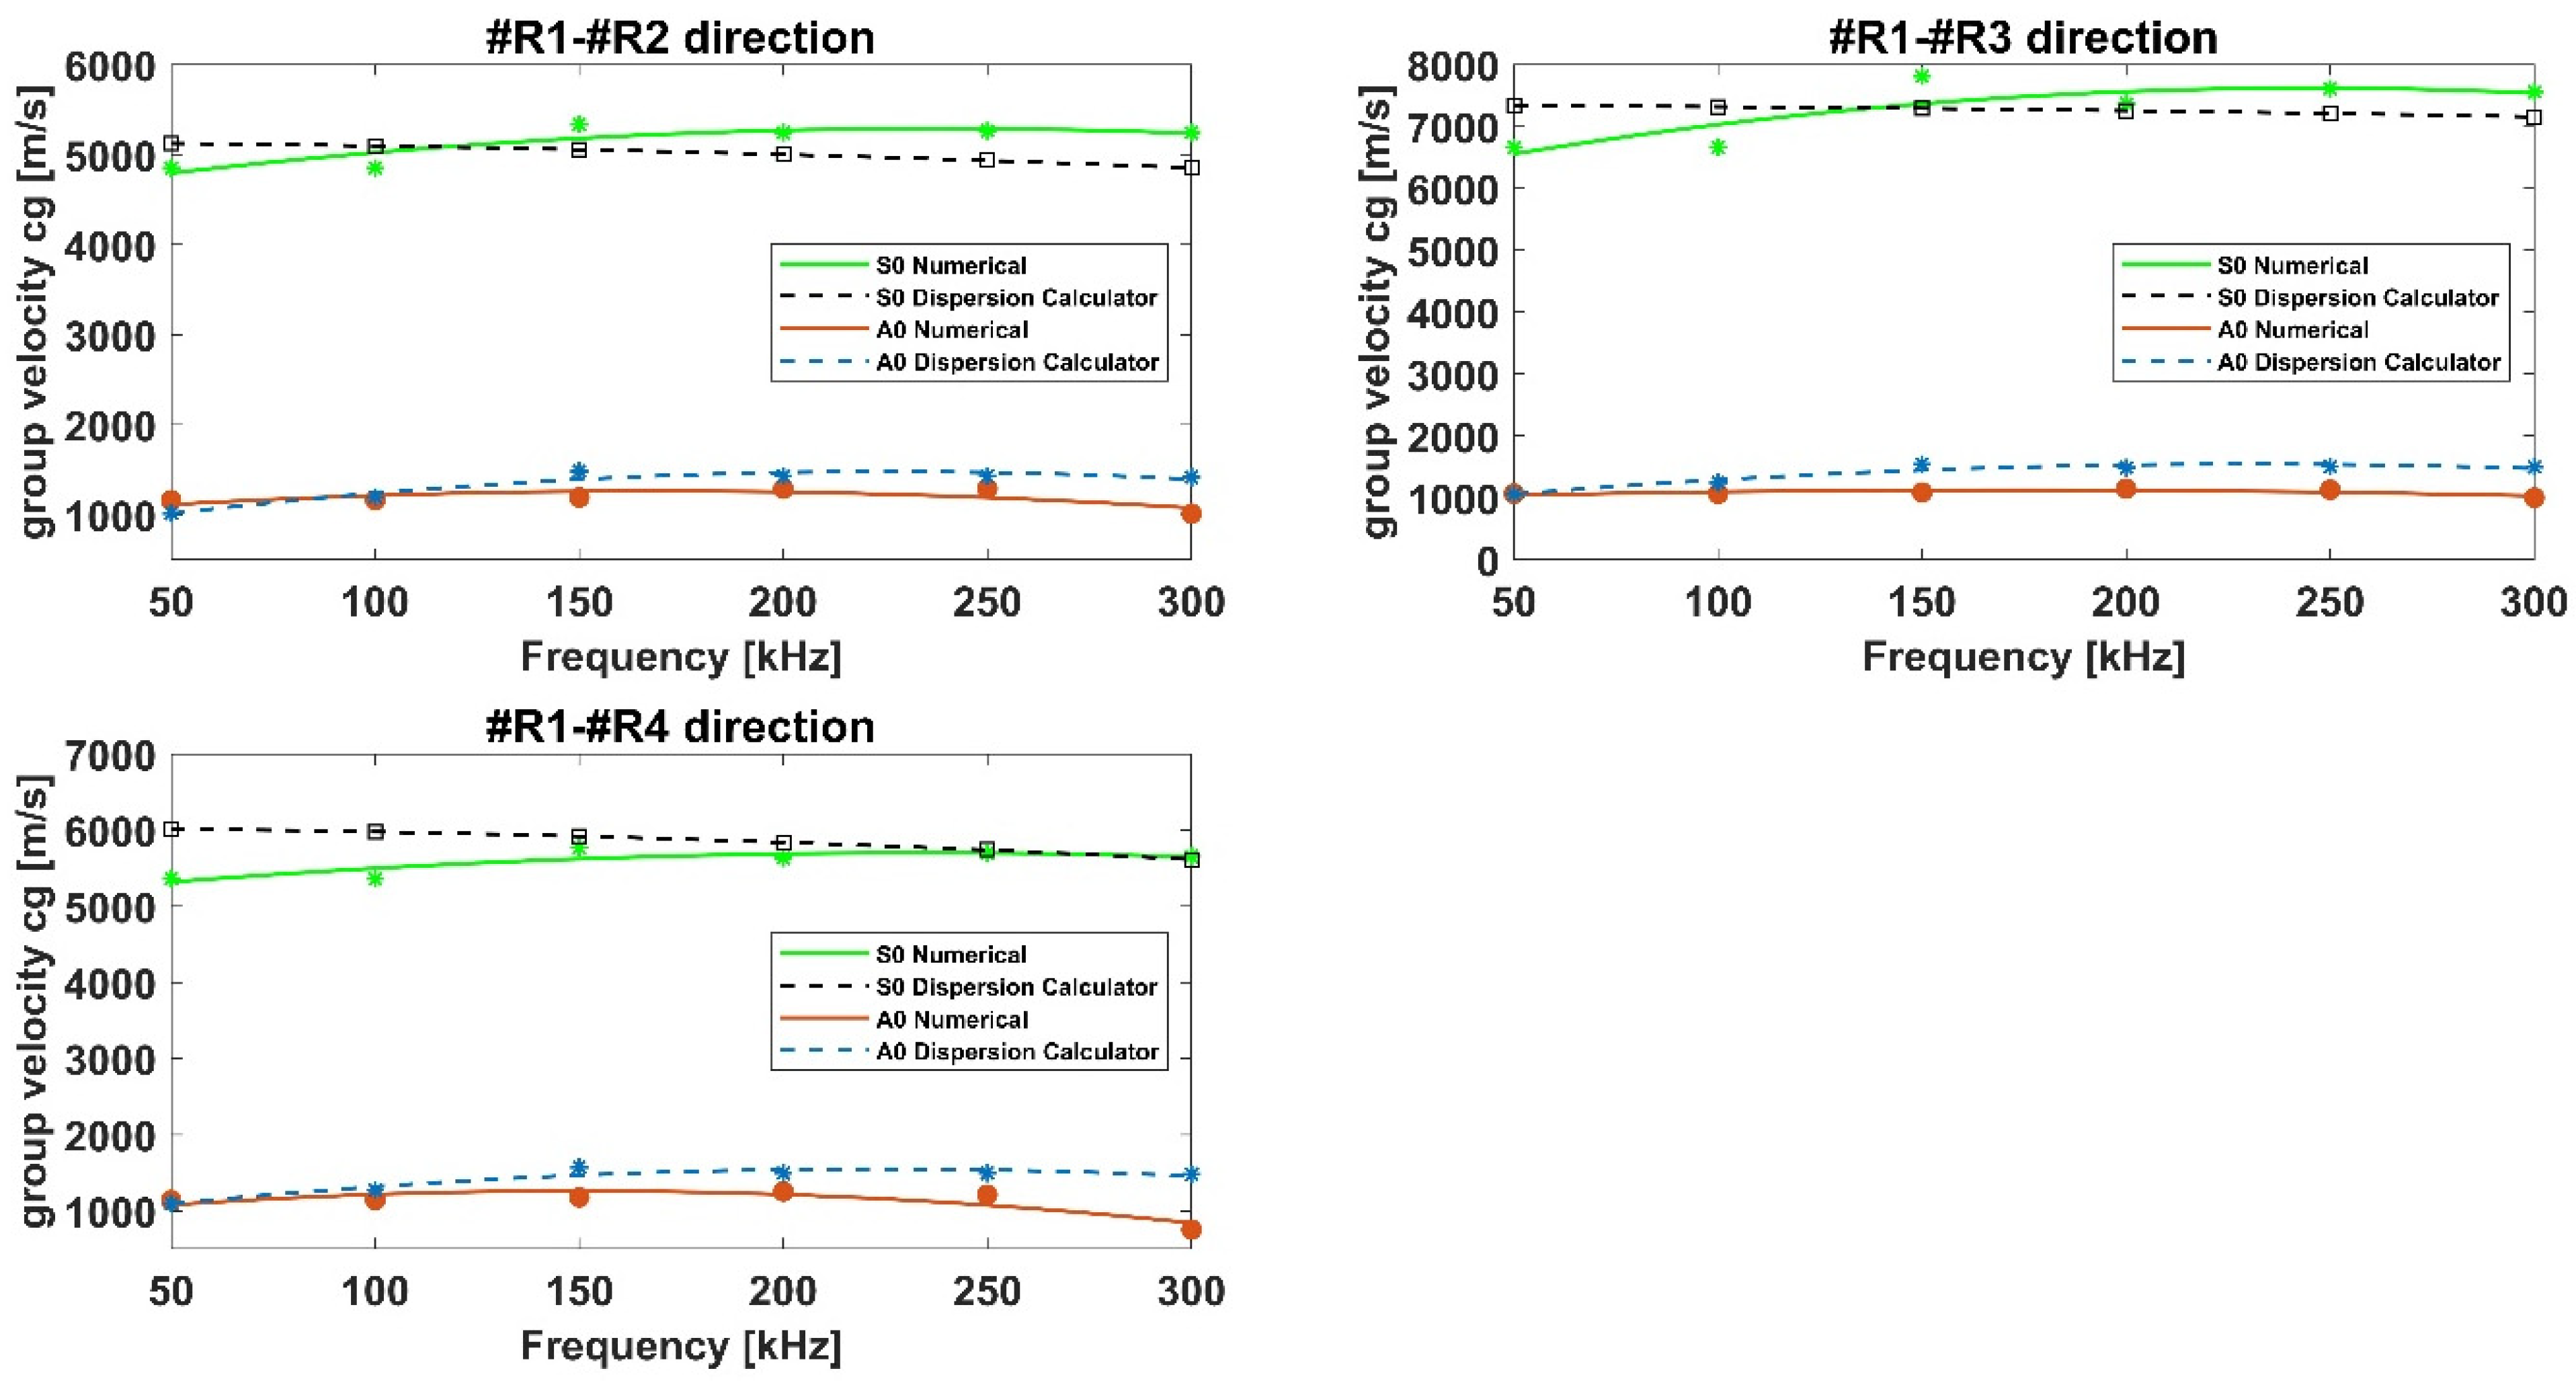
4.1. Results for the Flat Panels
4.2. Results for the Stiffened Panels
5. Conclusions
Author Contributions
Funding
Institutional Review Board Statement
Informed Consent Statement
Data Availability Statement
Conflicts of Interest
References
- Giurgiutiu, V. Structural Health Monitoring with Piezoelectric Wafer Active Sensors, 2nd ed.; Academic Press: Burlington, MA, USA, 2007. [Google Scholar]
- Boller, C. Why SHM? A Motivation. 2015. 1–20. Available online: https://www.researchgate.net/profile/Christian-Boller-2/publication/268151300_Why_SHM_A_Motivation/links/5463efc80cf2837efdb347cf/Why-SHM-A-Motivation.pdf (accessed on 21 December 2021).
- Lynch, J.; Loh, K. A Summary Review of Wireless Sensors and Sensor Networks for Structural Health Monitoring. Shock Vib. Dig. 2006, 38, 91–128. [Google Scholar] [CrossRef] [Green Version]
- Su, Z.; Ye, L.; Lu, Y. Guided Lamb Waves for Identification of Damage in Composite Structures: A Review. J. Sound Vib. 2006, 295, 753–780. [Google Scholar] [CrossRef]
- Raghavan, A.; Cesnik, C.E.S. Review of Guided-Wave Structural Health Monitoring. Shock Vib. Dig. 2007, 39, 91–114. [Google Scholar] [CrossRef]
- He, J.; Ran, Y.; Liu, B.; Yang, J.; Guan, X. A Fatigue Crack Size Evaluation Method Based on Lamb Wave Simulation and Limited Experimental Data. Sensors 2017, 17, 2097. [Google Scholar] [CrossRef] [PubMed] [Green Version]
- Sepe, R.; Citarella, R.; De Luca, A.; Armentani, E. Numerical and Experimental Investigation on the Structural Behaviour of a Horizontal Stabilizer under Critical Aerodynamic Loading Conditions. Adv. Mater. Sci. Eng. 2017, 2017, 1092701. [Google Scholar] [CrossRef] [Green Version]
- Caputo, F.; De Luca, A.; Greco, A.; Marro, A.; Apicella, A.; Sepe, R.; Armentani, E. Established Numerical Techniques for the Structural Analysis of a Regional Aircraft Landing Gear. Adv. Mater. Sci. Eng. 2018, 2018, 8536581. [Google Scholar] [CrossRef] [Green Version]
- Sepe, R.; Armentani, E.; Caputo, F. Static and Fatigue Experimental Tests on a Full Scale Fuselage Panel and FEM Analyses. Frat. Integrità Strutt. 2015, 10, 534–550. [Google Scholar] [CrossRef] [Green Version]
- Armentani, E.; Citarella, R.; Sepe, R. FML Full Scale Aeronautic Panel under Multiaxial Fatigue: Experimental Test and DBEM Simulation. Eng. Fract. Mech. 2011, 78, 1717–1728. [Google Scholar] [CrossRef]
- Ramadas, C.; Balasubramaniam, K.; Joshi, M.; Krishnamurthy, C.V. Interaction of Lamb Mode (Ao) with Structural Discontinuity and Generation of “Turning Modes” in a T-Joint. Ultrasonics 2011, 51, 586–595. [Google Scholar] [CrossRef]
- Su, Z.; Ye, L. Identification of Damage Using Lamb Waves; Lecture Notes in Applied and Computational Mechanics; Pfeiffer, F., Wriggers, P., Eds.; Springer: London, UK, 2009; Volume 48. [Google Scholar]
- Chang, C.Y.; Yuan, F.G. Extraction of Guided Wave Dispersion Curve in Isotropic and Anisotropic Materials by Matrix Pencil Method. Ultrasonics 2018, 89, 143–154. [Google Scholar] [CrossRef]
- Crespo, B.H.; Courtney, C.R.P.; Engineer, B. Calculation of Guidedwave Dispersion Characteristics Using a Three-Transducer Measurement System. Appl. Sci. 2018, 8, 1253. [Google Scholar] [CrossRef] [Green Version]
- Masurkar, F.A.; Yelve, N.P. Lamb Wave Based Experimental and Finite Element Simulation Studies for Damage Detection in an Aluminium and a Composite Plate Using Geodesic Algorithm. Int. J. Acoust. Vib. 2017, 22, 413–421. [Google Scholar] [CrossRef]
- Perfetto, D.; De Luca, A.; Lamanna, G.; Caputo, F. On the Prediction of Guided Wave Dispersion Curves in Plates for Health Monitoring Applications. Macromol. Symp. 2021, 396, 2000333. [Google Scholar] [CrossRef]
- De Luca, A.; Perfetto, D.; De Fenza, A.; Petrone, G.; Caputo, F. Guided Wave SHM System for Damage Detection in Complex Composite Structure. Theor. Appl. Fract. Mech. 2020, 105, 102408. [Google Scholar] [CrossRef]
- De Luca, A.; Perfetto, D.; De Fenza, A.; Petrone, G.; Caputo, F. Guided Waves in a Composite Winglet Structure: Numerical and Experimental Investigations. Compos. Struct. 2019, 210, 96–108. [Google Scholar] [CrossRef]
- De Luca, A.; Perfetto, D.; Petrone, G.; De Fenza, A.; Caputo, F. Guided-Waves in a Low Velocity Impacted Composite Winglet. Key Eng. Mater. 2018, 774, 343–348. [Google Scholar] [CrossRef]
- Han, C.; Yang, G.; Wang, J.; Guo, X. The Research on Propagation Characteristics of Acoustic Emission Signals in Stiffened Plates Based on the Multipath Propagation Model. Ultrasonics 2020, 108, 106177. [Google Scholar] [CrossRef]
- German Aerospace Center (DLR)—Institute of Structures and Design—Center for Lightweight Technology The Dispersion Calculator. Available online: https://www.dlr.de/zlp/en/desktopdefault.aspx/tabid-14332/24874_read-61142/#/gallery/33485 (accessed on 10 December 2021).
- Memmolo, V.; Monaco, E.; Boffa, N.D.; Maio, L.; Ricci, F. Guided Wave Propagation and Scattering for Structural Health Monitoring of Stiffened Composites. Compos. Struct. 2018, 184, 568–580. [Google Scholar] [CrossRef]
- Sharif-Khodaei, Z.; Aliabadi, M.H. Assessment of Delay-and-Sum Algorithms for Damage Detection in Aluminium and Composite Plates. Smart Mater. Struct. 2014, 23, 075007. [Google Scholar] [CrossRef]
- Ricci, F.; Monaco, E.; Maio, L.; Boffa, N.D.; Mal, A.K. Guided Waves in a Stiffened Composite Laminate with a Delamination. Struct. Health Monit. 2016, 15, 351–358. [Google Scholar] [CrossRef]
- Zheng, K.; Li, Z.; Ma, Z.; Chen, J.; Zhou, J.; Su, X. Damage Detection Method Based on Lamb Waves for Stiffened Composite Panels. Compos. Struct. 2019, 225. [Google Scholar] [CrossRef]
- Dafydd, I.; Sharif Khodaei, Z. Analysis of Barely Visible Impact Damage Severity with Ultrasonic Guided Lamb Waves. Struct. Health Monit. 2020, 19, 1104–1122. [Google Scholar] [CrossRef]
- Michaels, J.E.; Lee, S.J.; Croxford, A.J.; Wilcox, P.D. Chirp Excitation of Ultrasonic Guided Waves. Ultrasonics 2013, 53, 265–270. [Google Scholar] [CrossRef] [PubMed]
- Abaqus 6.14. Abaqus 6.14 Analysis User’s Guide; Dassault Systems Simulia Corp: Providence, RI, USA, 2014. [Google Scholar]
- Perfetto, D.; De Luca, A.; Perfetto, M.; Lamanna, G.; Caputo, F. Damage Detection in Flat Panels by Guided Waves Based Artificial Neural Network Trained through Finite Element Method. Materials 2021, 14, 7602. [Google Scholar] [CrossRef]
- Muller, A.; Robertson-Welsh, B.; Gaydecki, P.; Gresil, M.; Soutis, C. Lamb Waves Boundary Reflections in an Aluminium Plate for Defect Detection Related to Structural Health Monitoring. In Proceedings of the 8th European Workshop on Structural Health Monitoring (EWSHM 2016), Bilbao, Spain, 5–8 July 2016; Volume 2, pp. 1338–1349. [Google Scholar]
- Giannakeas, I.N.; Sharif-Khodaei, Z.; Aliabadi, M.H. On the Estimation of Material Properties Using Guided Wave Measurements for the Calibration of Finite Element Models. In Proceedings of the Fracture and Damage Mechanics: Theory, Simulation and Experiment, Mallorca, Spain, 15–17 September 2020; Volume 2309, p. 020008. [Google Scholar]


| Material Properties | Symbol | Units | Al 6061 | CFRP Lamina | PZT |
|---|---|---|---|---|---|
| Mass density | 2700 | ||||
| Young’ s modulus | 69 | ||||
| Longitudinal Young’s modulus | |||||
| Transversal Young’s modulus | |||||
| Transversal Young’s modulus | |||||
| Shear modulus | 26 | ||||
| Shear modulus | |||||
| Shear modulus | |||||
| Shear modulus | |||||
| Poisson’s ratio | 0.33 | ||||
| Poisson’s ratio | |||||
| Poisson’s ratio | |||||
| Poisson’s ratio | |||||
| Dielectric constant | |||||
| Piezoelectric charge constant |
| Approach | Part | Element Type | Elements Number | Nodes Number | DoF (Degrees of Freedom) |
|---|---|---|---|---|---|
| 3D Solid | PZTs | C3D8R | 2176 | 3588 | 10,764 |
| 2D Shell | Plate | S4R | 309,136 | 310,249 | 1,861,494 |
| Approach | Part | Element Type | Element Number | Nodes Number | DoF |
|---|---|---|---|---|---|
| 3D Solid | PZTs | C3D8R | 2176 | 3588 | 10,764 |
| 2D Shell | Plate | S4R | 309,136 | 310,249 | 1,861,494 |
| 2D Shell | Stiffener | S4R | 55,044 | 55,700 | 334,200 |
Publisher’s Note: MDPI stays neutral with regard to jurisdictional claims in published maps and institutional affiliations. |
© 2021 by the authors. Licensee MDPI, Basel, Switzerland. This article is an open access article distributed under the terms and conditions of the Creative Commons Attribution (CC BY) license (https://creativecommons.org/licenses/by/4.0/).
Share and Cite
De Luca, A.; Perfetto, D.; Lamanna, G.; Aversano, A.; Caputo, F. Numerical Investigation on Guided Waves Dispersion and Scattering Phenomena in Stiffened Panels. Materials 2022, 15, 74. https://doi.org/10.3390/ma15010074
De Luca A, Perfetto D, Lamanna G, Aversano A, Caputo F. Numerical Investigation on Guided Waves Dispersion and Scattering Phenomena in Stiffened Panels. Materials. 2022; 15(1):74. https://doi.org/10.3390/ma15010074
Chicago/Turabian StyleDe Luca, Alessandro, Donato Perfetto, Giuseppe Lamanna, Antonio Aversano, and Francesco Caputo. 2022. "Numerical Investigation on Guided Waves Dispersion and Scattering Phenomena in Stiffened Panels" Materials 15, no. 1: 74. https://doi.org/10.3390/ma15010074
APA StyleDe Luca, A., Perfetto, D., Lamanna, G., Aversano, A., & Caputo, F. (2022). Numerical Investigation on Guided Waves Dispersion and Scattering Phenomena in Stiffened Panels. Materials, 15(1), 74. https://doi.org/10.3390/ma15010074