Article

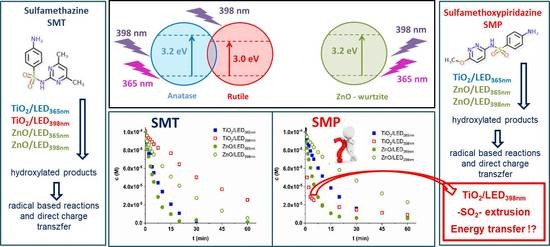
Wavelength Dependence of the Transformation Mechanism of Sulfonamides Using Different LED Light Sources and TiO2 and ZnO Photocatalysts

1
Department of Inorganic and Analytical Chemistry, University of Szeged, Dóm tér 7, H-6720 Szeged, Hungary
2
Department of Physical Chemistry and Materials Science, University of Szeged, Rerrich Béla tér 1, H-6720 Szeged, Hungary
3
Department of Applied and Environmental Chemistry, University of Szeged, Rerrich Béla tér 1, H-6720 Szeged, Hungary
4
Institute of Physical Metallurgy, Metal Forming and Nanotechnology, University of Miskolc, C/2-5 Building 209, H-3515 Miskolc-Egyetemvaros, Hungary
*
Author to whom correspondence should be addressed.
Materials 2022, 15(1), 49; https://doi.org/10.3390/ma15010049
Submission received: 4 December 2021 / Revised: 17 December 2021 / Accepted: 21 December 2021 / Published: 22 December 2021
(This article belongs to the Special Issue New Trends in Semiconductors' Catalytic Application)

Abstract

:
The comparison of the efficiency of the commercially available photocatalysts, TiO2 and ZnO, irradiated with 365 nm and 398 nm light, is presented for the removal of two antibiotics, sulfamethazine (SMT) and sulfamethoxypyridazine (SMP). The OH formation rate was compared using coumarin, and higher efficiency was proved for TiO2 than ZnO, while for 1,4-benzoquinone in O2-free suspensions, the higher contribution of the photogenerated electrons to the conversion was observed for ZnO than TiO2, especially at 398 nm irradiation. An extremely fast transformation and high quantum yield of SMP in the TiO2/LED398nm process were observed. The transformation was fast in both O2 containing and O2-free suspensions and takes place via desulfonation, while in other cases, mainly hydroxylated products form. The effect of reaction parameters (methanol, dissolved O2 content, HCO3 and Cl) confirmed that a quite rarely observed energy transfer between the excited state P25 and SMP might be responsible for this unique behavior. In our opinion, these results highlight that “non-conventional” mechanisms could occur even in the case of the well-known TiO2 photocatalyst, and the effect of wavelength is also worth investigating.

Graphical Abstract

1. Introduction

The release of antimicrobial agents to the environment causes several environmental, ecological, and public health problems [1,2]. Infection caused by antibiotic-resistant bacteria results in more than 33,000 deaths in Europe. Sulfonamides are among the first synthesized and frequently used antibiotics in human and veterinary medicine and, similar to the other antibiotics, highly contribute to the emergence of antibiotic-resistant bacteria [3]. Existing wastewater treatment plants are not designed to remove micropollutants [4,5]; the raw and treated wastewaters carry significant amount of antibiotic-resistant bacteria. Thus, the application of cost-effective additive water treatment methods is required to eliminate the antibiotics from treated waters completely. Advanced Oxidation Processes (AOPs) offer a solution to remove trace amounts of recalcitrant organic pollutants from wastewater. Among other AOPs, heterogeneous photocatalysis has been applied to remove several sulfonamides, using different photocatalysts and light sources [6,7,8,9,10,11,12,13,14,15,16,17].
During heterogeneous photocatalysis, a photon with energy higher than the bandgap is absorbed by a semiconductor, forming a photogenerated conduction band electron (eCB) and a valence band hole (hVB+), which react with dissolved organic compounds via direct charge transfer reactions or generate different reactive oxygen species (ROS) [18,19], of which hydroxyl radical (OH) has primary importance. The rare examples of photocatalytic reactions induced by prevailing energy transfer have been recently reported in literature by considering the excited solid semiconductor as the energy donor. While electron transfer requires direct contact between the semiconductor and the substrate, mediated contact or a certain distance can favor energy transfer [20]. Nosaka et al. explained the formation of singlet oxygen via double electron transfer in the opposite direction [21], while other authors hypothesized energy transfer, even in the case of surface-modified TiO2 [22,23]. The enhanced transformation of cyanuric acid [22], the selective oxidization of limonene [24,25], and isomerization of caffeic acid in aqueous TiO2 suspensions were interpreted by energy transfer mechanism [26]. In the case of “trivial energy transfer,” the quenching of the excited semiconductor can occur by the emission of a photon, and the energy transfer to the species takes place by absorption of the emitted photon. Unlike the trivial mechanism, Förster and Dexter energy transfers are radiationless processes, and their manifestation depends strongly on the distance of the acceptor from the semiconductor [20].
The two most often investigated photocatalysts, TiO2 and ZnO, have several favorable properties but are mainly active in the UV region. The commercially available TiO2 photocatalyst, P25, contains two crystal phases: the bandgap of rutile is 3.0 eV, while the anatase phase is 3.2 eV, which is approximately equal to the ZnO bandgap [27,28,29]. The excellent photocatalytic activity of P25 TiO2 is often attributed to its mixed crystal phases. Some authors observed individual anatase- and rutile-phase TiO2 particles without a heterojunction structure [30,31], while others observed a mixture of amorphous TiO2 with anatase or rutile phase and/or anatase particles covered by a thin overlayer of rutile [32,33,34,35,36]. Ohtani et al. proved the absence of synergetic effect, and found that P25 is a simple mixture of anatase and rutile without any interactions [37,38]. On the contrary, under visible light (>400 nm) irradiation, the superior photocatalytic activity of P25 was originated from the anatase–rutile interparticle contact, which is beneficial to the charge carrier separation and consequently the efficiency [33,36,39,40]. A comprehensive understanding of P25 microstructure should be crucial for designing an efficient TiO2-based photocatalyst.
Nowadays, many researchers are involved in synthesizing and characterizing new materials or composite materials based on TiO2 [41,42,43] or ZnO [29,44,45,46,47], which can be used as effective photocatalysts. However, the use of these new visible light-active photocatalysts often faces a number of problems, such as low quantum efficiency, photocorrosion, or photodissolution, or a high degree of selectivity to remove organic matter [48]. The efficiency of TiO2 and ZnO as photocatalysts applied for the elimination of organic trace pollutants under UV radiation is not easy to exceed. TiO2 and ZnO were investigated to transform various sulfonamides [4,15,16,17,49,50]. Both catalysts were effective; however, the efficiency depended on the chemical structure of sulfonamide, and generally, TiO2 P25 provided better efficiency than ZnO, especially in the presence of H2O2 [16]. Comparing the efficiency of heterogeneous photocatalysis to other AOPs, sulfonamide degradation is highly cost-effective for ozonation, but toxic, ozone resistant intermediates forms, while using TiO2 or ZnO, the mineralization is also efficient. Several visible light-activated photocatalysts (g-C3N4 [10,14], Bi2O4 [12], Bi2MoO6/Bi2WO6 [13], WO3 [11]; CexZryO2 [7]) were also tested with sulfonamides, with usually lower efficiency compared to TiO2 and ZnO, although some promising results can also be found. The efficiency of BiOI/BiOCl composite photocatalyst for the degradation of SMP and methyl orange under UV (398 nm) and visible light irradiation was comparable to TiO2 P25, but highly toxic intermediates were accumulated opposite to the P25, which was efficient for mineralization and toxicity decrease [51]. Besides developing new photocatalysts, using more efficient light sources such as UV or UV/Vis LEDs, and advanced reactor designs may enhance the cost efficiency of the method [19,52,53]. In addition to their many advantages, one of the benefits of LEDs [54,55,56] is that they emit their photons over a relatively narrow wavelength range to be well adapted to the absorption properties of photocatalysts and provide an opportunity to handle the wavelength-depending effects easily [57,58,59,60].
One of the barriers to the practical application of heterogeneous photocatalysis is the adverse effect of the matrix and its parameters on efficiency. Dissolved organic matter and inorganic ions may act as UV filters, radical scavengers or adsorbing on the catalysts’ surface can occupy the active sites and reduce efficiency [61,62,63,64]. Besides the adverse effects, the adsorption of some ions might result in better charge separation, or their reaction with photogenerated charge carriers results in the formation of less reactive and more selective radicals (e.g., Cl, CO3•−, SO4•−) than OH which could contribute to the transformation of given organic pollutants [61,65,66,67,68].
The current research aimed to compare the efficiency of the commercially available photocatalysts, TiO2 and ZnO, irradiated with two LED light sources; a high power UV-A LED emitting at 365 nm (LED365nm) and a cheap commercial LED-tape emitting at 398 nm (LED398nm). The removal of two sulfonamide antibiotics, sulfamethazine (SMT) and sulfamethoxypyridazine (SMP), was investigated in detail and compared based on removal and mineralization rates. The direct detection of reactive species in the case of heterogeneous photocatalysis is rather difficult; however, the knowledge of their formation rate under given circumstances is crucial for the elucidation of degradation mechanism and the assessment of photocatalytic activity. The OH formation rates were compared using coumarin (COU) as a model compound. The rate and importance of the direct charge transfer process were compared using 1,4-benzoquinone (1,4-BQ) in O2-free suspensions. The formation of organic and inorganic degradation products of sulfonamides and the ecotoxicity of the treated solutions were also investigated. Experiments were performed in real water matrices (tap water and biologically treated wastewater), and the effect of methanol as OH scavenger and the most abundant anions (Cl, HCO3) of the matrices was also investigated.

2. Materials and Analytical Methods

2.1. Photochemical Experiments

Two photoreactors were used during the photocatalytic experiments. One was equipped with 12 high-power UV—A LED light sources (Vishay, Malvern, PA, USA; VLMU3510-365-130, 0.69 W radiant power at 2.0 W electric power input) emitting at 365 nm (LED365nm). A laboratory power supply (Axiomet, Malmö, Sweden; AX-3005DBL-3; maximum output 5.0 A/30.0 V) was used to control the electrical power uptake of the light sources (6.6 W). Irradiations were performed in a 200 cm3 cylindrical glass reactor placed inside the hexagonally arranged LEDs (Figure S1a). The solutions were bubbled with gas from a porous glass filter. Synthetic air or N2 (99.995%) was used depending on the measurements.
The other photochemical reactor was equipped with commercial UV-LED tapes (LEDmaster, Szeged, Hungary; 4.6 W electric power input; 60 diodes/m) fixed on the inside of a double-walled, water-cooled reactor (LED398nm) (Figure S1b). Solutions were irradiated in a 100 cm3 glass reactor; the suspension was bubbled with synthetic air. The emission spectra of both light sources have been measured using a two-channel fiber-optic AvaSpec-FT2048 CCD spectrometer (Avantes, Nehterlands).
Two commercially available photocatalysts were used during the experiments, TiO2 Aeroxide® P25 and ZnO. When not stated otherwise, the concentration of the photocatalyst suspensions was 1.00 g dm−3 and 1.0 × 10⁻⁴ M solutions of COU, SMT, and SMP and 2.0 × 10⁻⁴ M solutions of 1,4-BQ were irradiated. The suspension was stirred and bubbled with air or N2 for 30 min in the dark; and the measurement was started by turning on the light source. Before analysis, the samples were centrifuged (Dragonlab, Beijing, China, 15,000 RPM) and filtered using syringe filters (FilterBio, FilterBio Nantong, China; PVDF-L; 0.22 µm).

2.2. Analytical Methods

X-ray diffractometry (XRD) measurements were performed with a Rigaku Miniflex II (Rigaku, Tokyo, Japan; Cu Kα radiation source, 3.0–90.0 2Theta° range, with 4.0 2Theta° min−1 resolution). The specific surface area was determined via N2 adsorption/desorption isotherms using a Quantachrome NOVA 2200 analyzer (Quantachrome, Boynton Beach, FL, USA). The pore size distribution was calculated by the BJH method. Diffuse reflectance spectroscopy (DRS) was performed using an Ocean Optics USB4000 detector and Ocean Optics DH-2000 light source (Ocean Optics, Largo, FL, USA). The bandgap energy values of the photocatalysts were evaluated by the Kubelka–Munk approach and the Tauc plot. The elemental composition of the photocatalysts was characterized by energy-dispersive X-ray spectroscopy (Hitachi S-4700 operating at 20 kV, equipped with a “Röntec” Energy Dispersive Spectrometer with a 12 mm working distance, Hitachi, Tokyo, Japan).
The photon flux of the light sources was measured using potassium–ferrioxalate actinometry [69]. 1.0 × 10⁻² M Fe3+–oxalate solutions were irradiated, the released Fe2+ was measured after complexation with 1,10-phenanthroline. The Fe2+–phenanthroline complex concentration was measured using UV-Vis spectrophotometry (Agilent 8453, Agilent, Santa Clara, CA, USA). During these measurements, the solutions were bubbled with N2.
The concentration of COU was determined using UV-Vis spectrophotometry (ε277nm = 10,293 M−1 cm−1). The concentration of the formed 7-HC was measured using fluorescence spectroscopy (Hitachi F-4500, Hitachi, Tokyo, Japan), the excitation and emission wavelengths were set to 345 nm and 455 nm, respectively. The concentration of 1,4-benzoquinone (1,4-BQ), its product, the 1,4-hydroquinene (1,4-H2Q), SMT, and SMP was determined by LC-DAD (Agilent 1100, Agilent, Santa Clara, CA, USA, column: Lichrosphere 100, RP-18; 5 μm). In the case of 1,4-BQ and 1,4-H2Q the eluent consisted of 50 v/v% methanol (MeOH) and 50 v/v% water; the flow rate was 1.0 cm3 min−1, the temperature was set to 25 °C. In the case of SMT and SMP the eluent consisted of 30 v/v% MeOH and 70 v/v% formic acid (0.1 v/v%), the flow rate was 1.00 cm3 min−1, the temperature was set to 35 °C. The detection of 1,4-BQ, 1,4-H2Q, SMT, and SMP was performed at 250 nm, 210 nm, 265 nm, and 261 nm, respectively. The retention time was 3.4 min, 2.7 min, 9.5 min, and 6.1 min. The initial transformation rates of the model compounds (r0) were determined from the linear part of the kinetic curves (up to 20% transformation). Given that the photon flux of light sources and the volume of a treated solution differ, it is worth comparing the efficiency based on apparent quantum yield, calculated by the following equation:
Φ = number   of   photons   reaching   the   reactor   volume   ( mol photon   s 1 dm 3 ) number   of   transformed   or   formed   molecule   in   the   treated   volume   ( mol   s 1 dm 3 )
The number of photons reaching the reactor volume was calculated from the photon flux of light LEDs divided by the volume of the actinometric solution. The volume of the actinometric solution was the same as the treated suspension.
The determination of SMT and SMP products was achieved by LC-MS, with an Agilent LC/MSD VL mass spectrometer (Agilent, Santa Clara, CA, USA) coupled to the same HPLC. The measurements were performed using an ESI ion source and a triple quadruple analyzer in positive mode (3500 V capillary voltage and 60 V fragmentor voltage). The drying gas flow rate was 13.0 dm3 min−1, and its temperature was 350 °C. The scanned mass range was between 50–1000 AMU.
Total Organic Carbon (TOC) concentration was determined using an Analytik Jena N/C 3100 analyzer (Analytik Jena, Jena, Germany). The formation of inorganic ions (NH4+, NO2, NO3, and SO42−) was measured using ion chromatography (Shimadzu Prominence LC-20AD, Shodex 5U-YS-50 column for cation detection, and Shodex NI-424 5U for anion detection, (Shimadzu, Kyoto, Japan)). The eluent was 4.0 mM methanesulfonic acid and a mixture of 2.5 mM phthalic acid for cation determination and 2.3 mM aminomethane for anion determination. The flow rate of the mobile phase was 1.0 cm3 min−1.
The performed ecotoxicity tests (LCK480, Hach-Lange GmbH, Berlin, Germany) were based on the bioluminescence inhibition of the luminescent bacteria Vibrio fischeri. Formed H2O2 was decomposed in the samples by adding catalase enzyme (0.20 mg dm−3) before starting the ecotoxicity tests. The luminescence of the bacteria was measured using a luminometer (Lumistox 300, Hach-Lange GmbH, Berlin, Germany) after 30 min incubation time.

2.3. Chemicals and Solvents Used

Two commercial photocatalysts were used, TiO2 Aeroxid® P25 (Acros Organics, Geel, Belgium, 99.5%) and ZnO (Sigma Aldrich, St. Louis, MO, USA, 80%). Experiments were also performed using anatase (Aldrich, St. Louis, MO, USA, 99.8%) and rutile (Aldrich, St. Louis, MO, USA, 99.9%) phase TiO2. The list of chemicals used during experimental work can be found in Table S1. Tap water (Szeged, Hungary) and biologically treated domestic wastewater (Szeged, Hungary) were used as mild water matrices; the matrix parameters are summarized in Table S2.

3. Results and Discussion

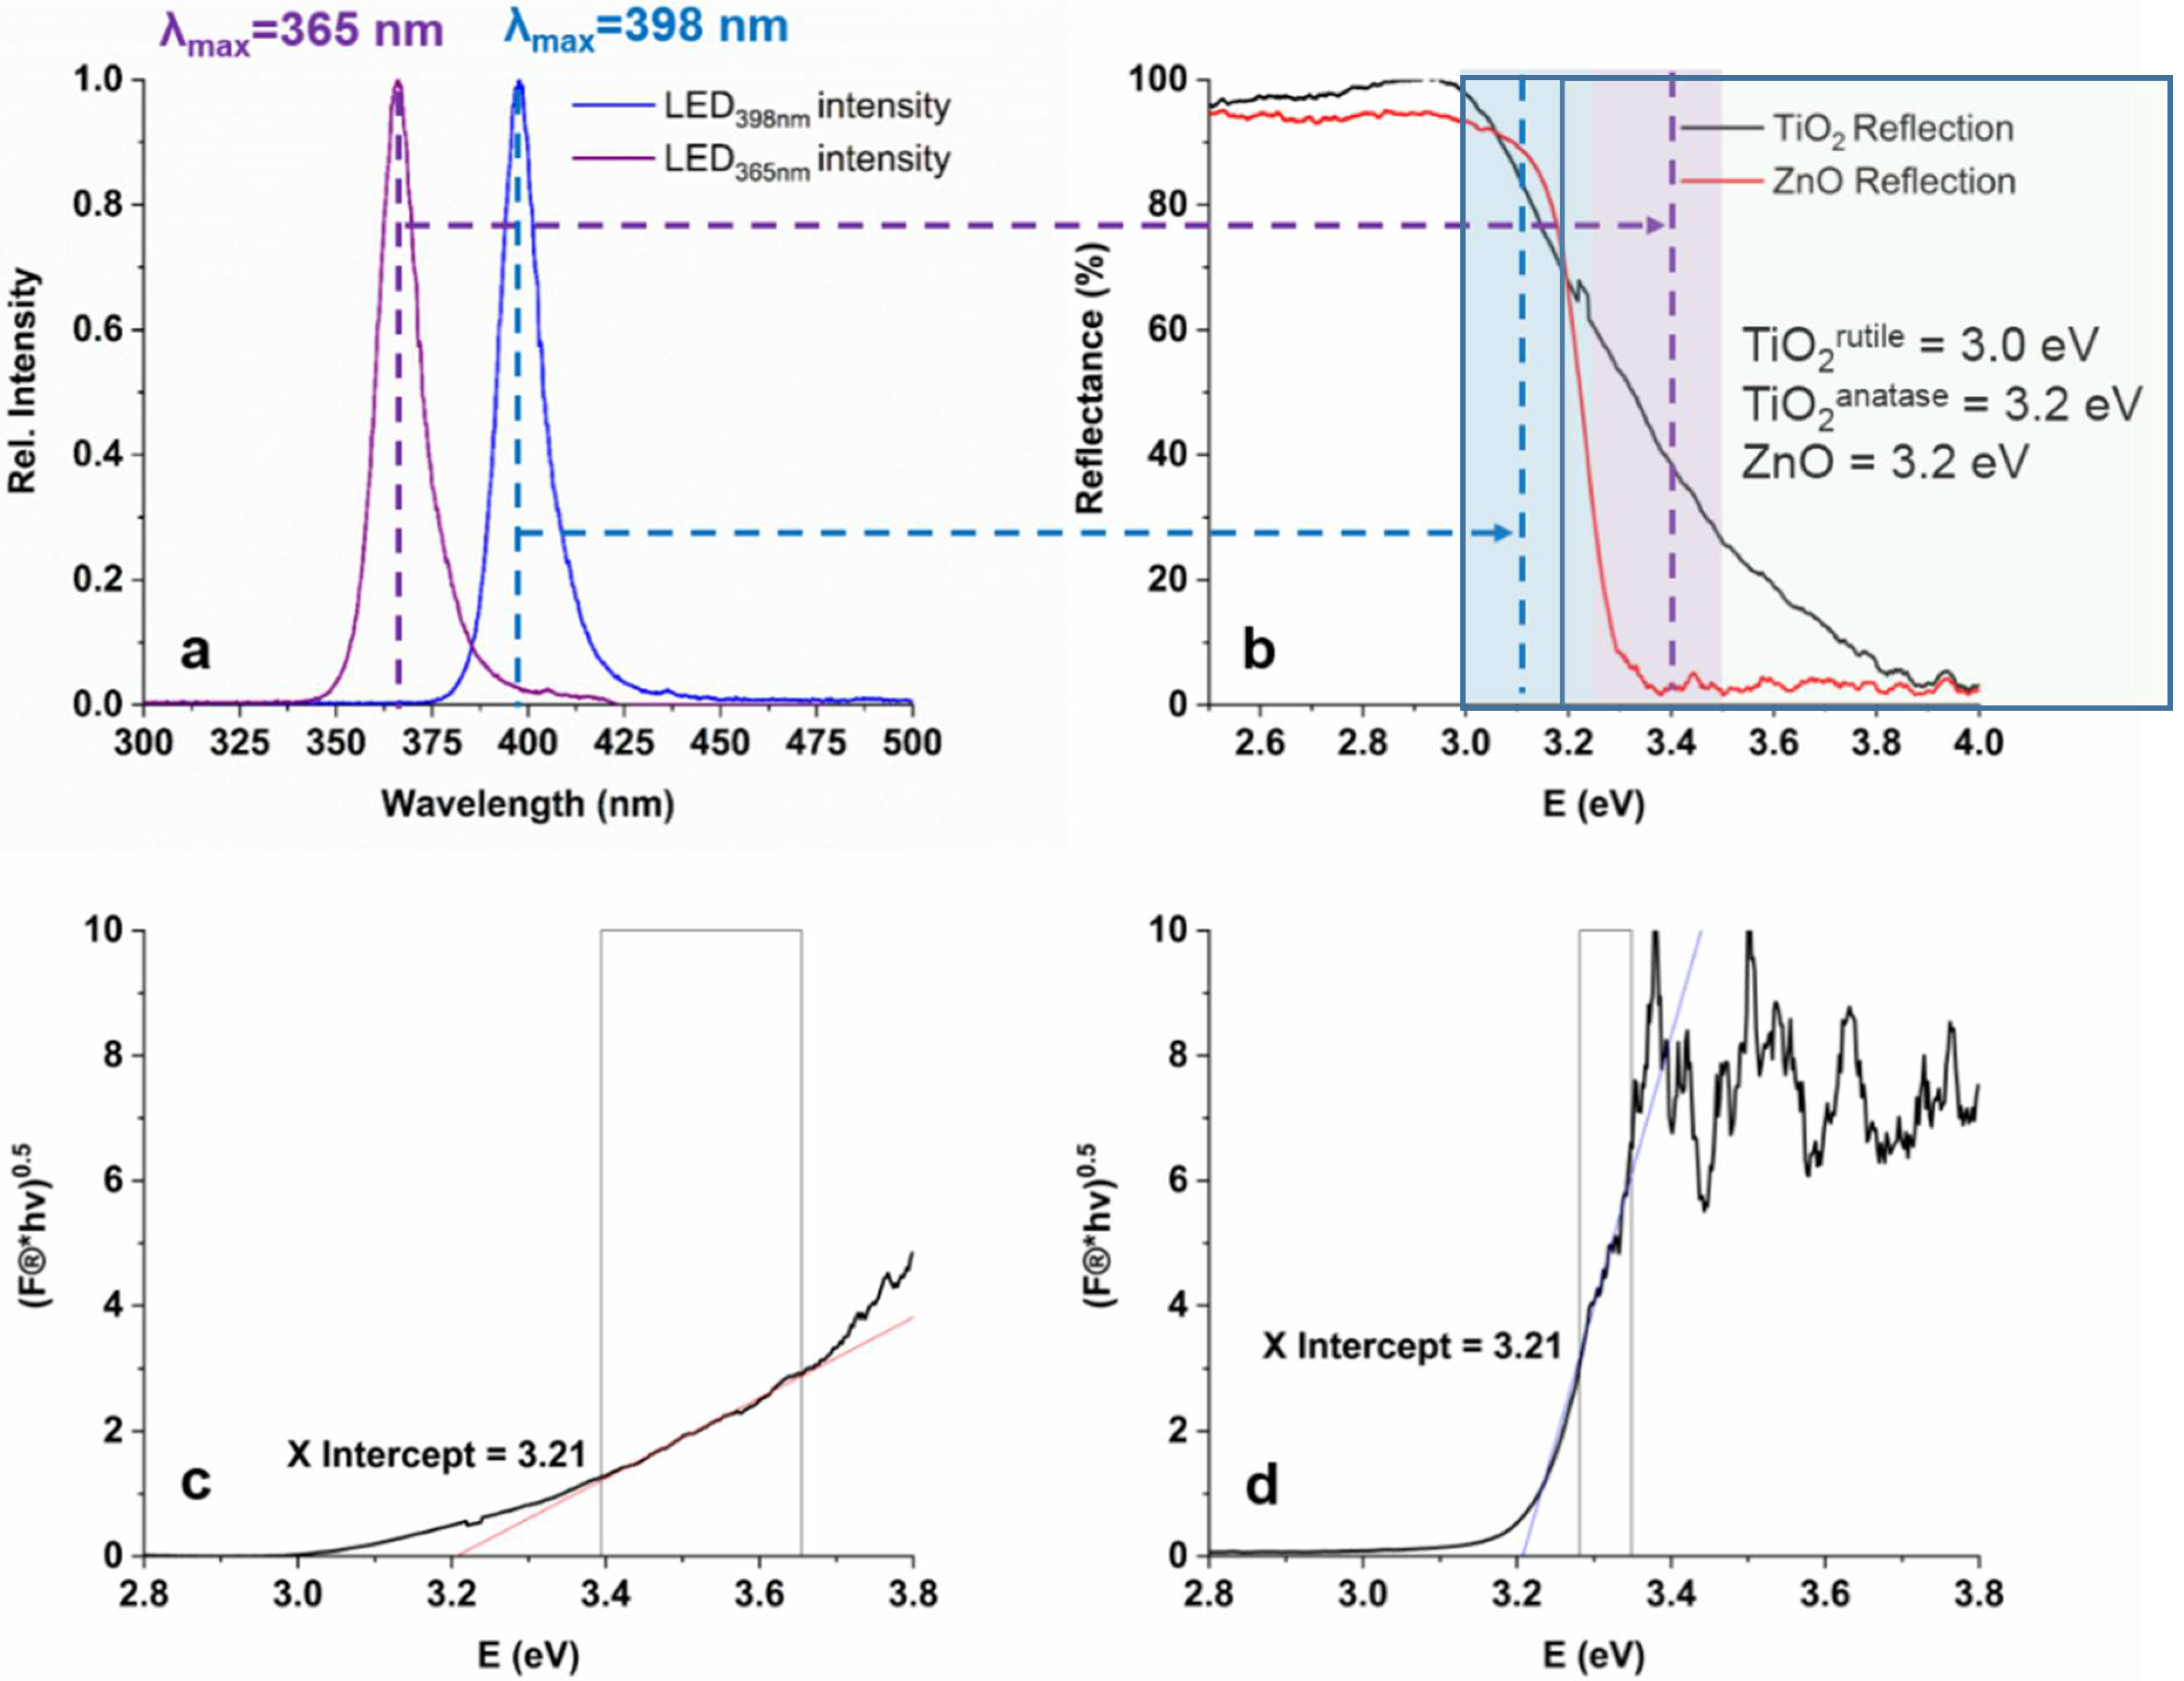
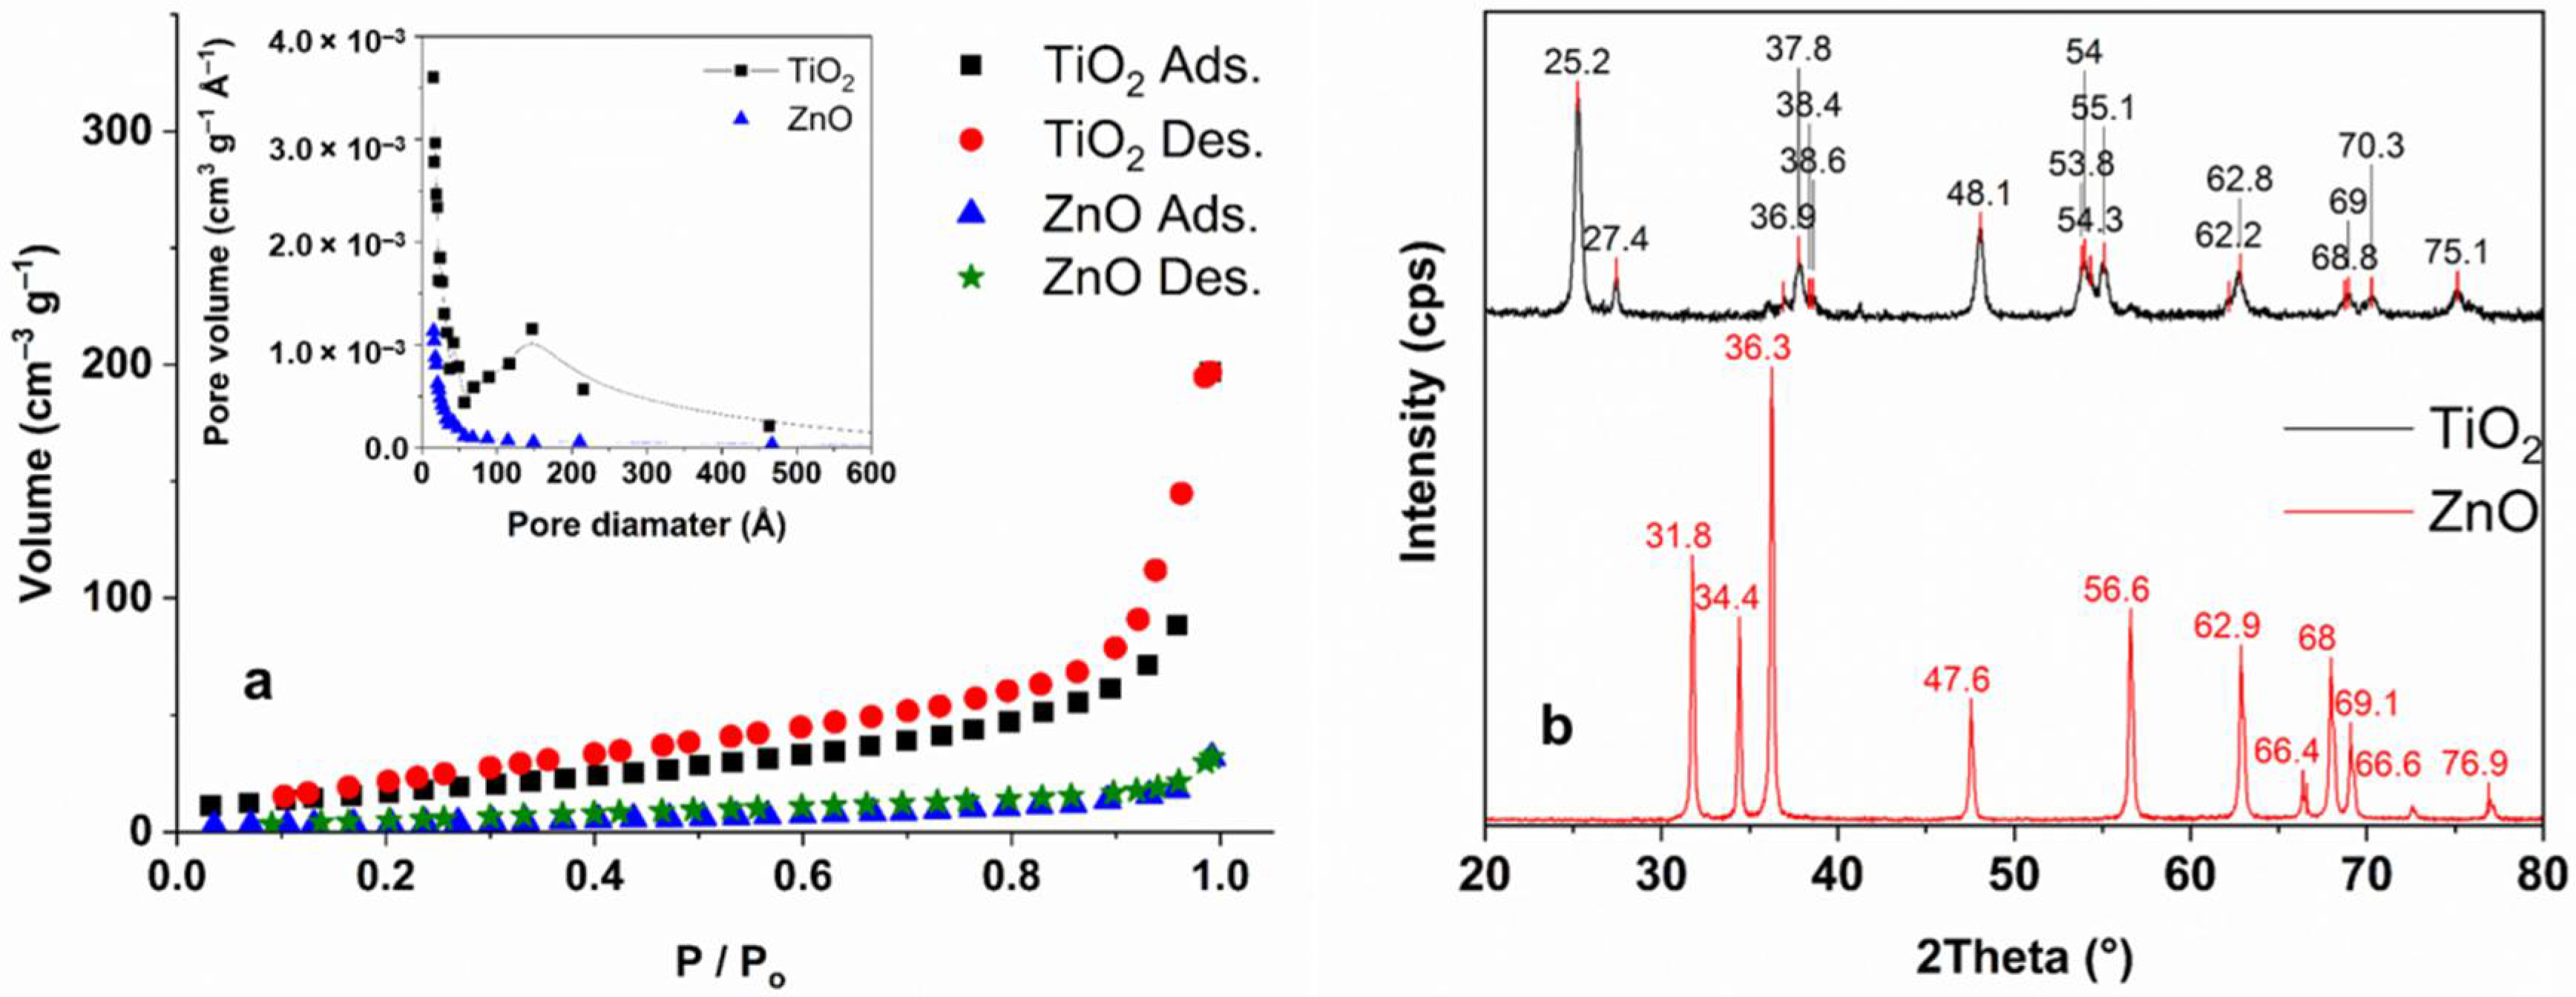
3.1. The Characterization of the Light Sources and the Photocatalysts

The photon flux of the light sources was measured using potassium–ferrioxalate actinometry and was similar: 5.52 × 10⁻⁶ molphoton s−1 for LED365nm and 4.68 × 10⁻⁶ molphoton s−1 for LED398nm. The emission spectra of the LED light sources are shown in Figure 1a.
Diffuse Reflectance Spectroscopy (DRS) measurements were performed to compare the UV–Vis absorbance and to calculate the bandgap energies of TiO2 and ZnO (Figure 1b–d). The calculated band gaps were identical, 3.21 eV for TiO2 and for ZnO. A better light absorption property of ZnO can be observed in the wavelength range emitted by LED365nm (350–400 nm); at 365 nm TiO2 reflects 40%, while ZnO practically fully absorbs the photons. Within the wavelength range, emitted by LED398nm (380–420 nm) ZnO and TiO2 show similar absorption properties; no more than 15–20% of the 398 nm photons can be absorbed (Figure 1b). For TiO2, the light of LED398nm can excite mainly the rutile phase having 3.0 eV, while LED365nm can cause the charge separation in rutile and anatase TiO2 and ZnO [36,37].
The specific surface area and pore-size distribution of TiO2 and ZnO were measured via N2 adsorption–desorption (Figure 2a). The surface area of TiO2 was significantly higher (64 m2 g−1) than ZnO (13 m2 g−1); both measured values are close to the values given by the suppliers. The average primary particle size for Aeroxide P25 TiO2 is ranges from 10 to 50 nm, largely distributed from 15 to 25 nm [36,70]. For ZnO this value is 50–70 nm [71]. Element analysis of ZnO and TiO2 has been measured with EDS technology. For both photocatalysts, the stoichiometric amount of cation (49% Zn ad 32% Ti for ZnO and TiO2 respectively) and oxygen (51% for ZnO 68% for TiO2) was measured (within the measurement margin of error). Contaminants were not detected. For TiO2, the XRD pattern is in good agreement with the results reported in the literature; anatase is the dominant crystal phase in the anatase—rutile mixture (Figure 2b) [72,73]. The XRD pattern of ZnO confirmed its pure wurtzite phase (Figure 2b) [44,74].

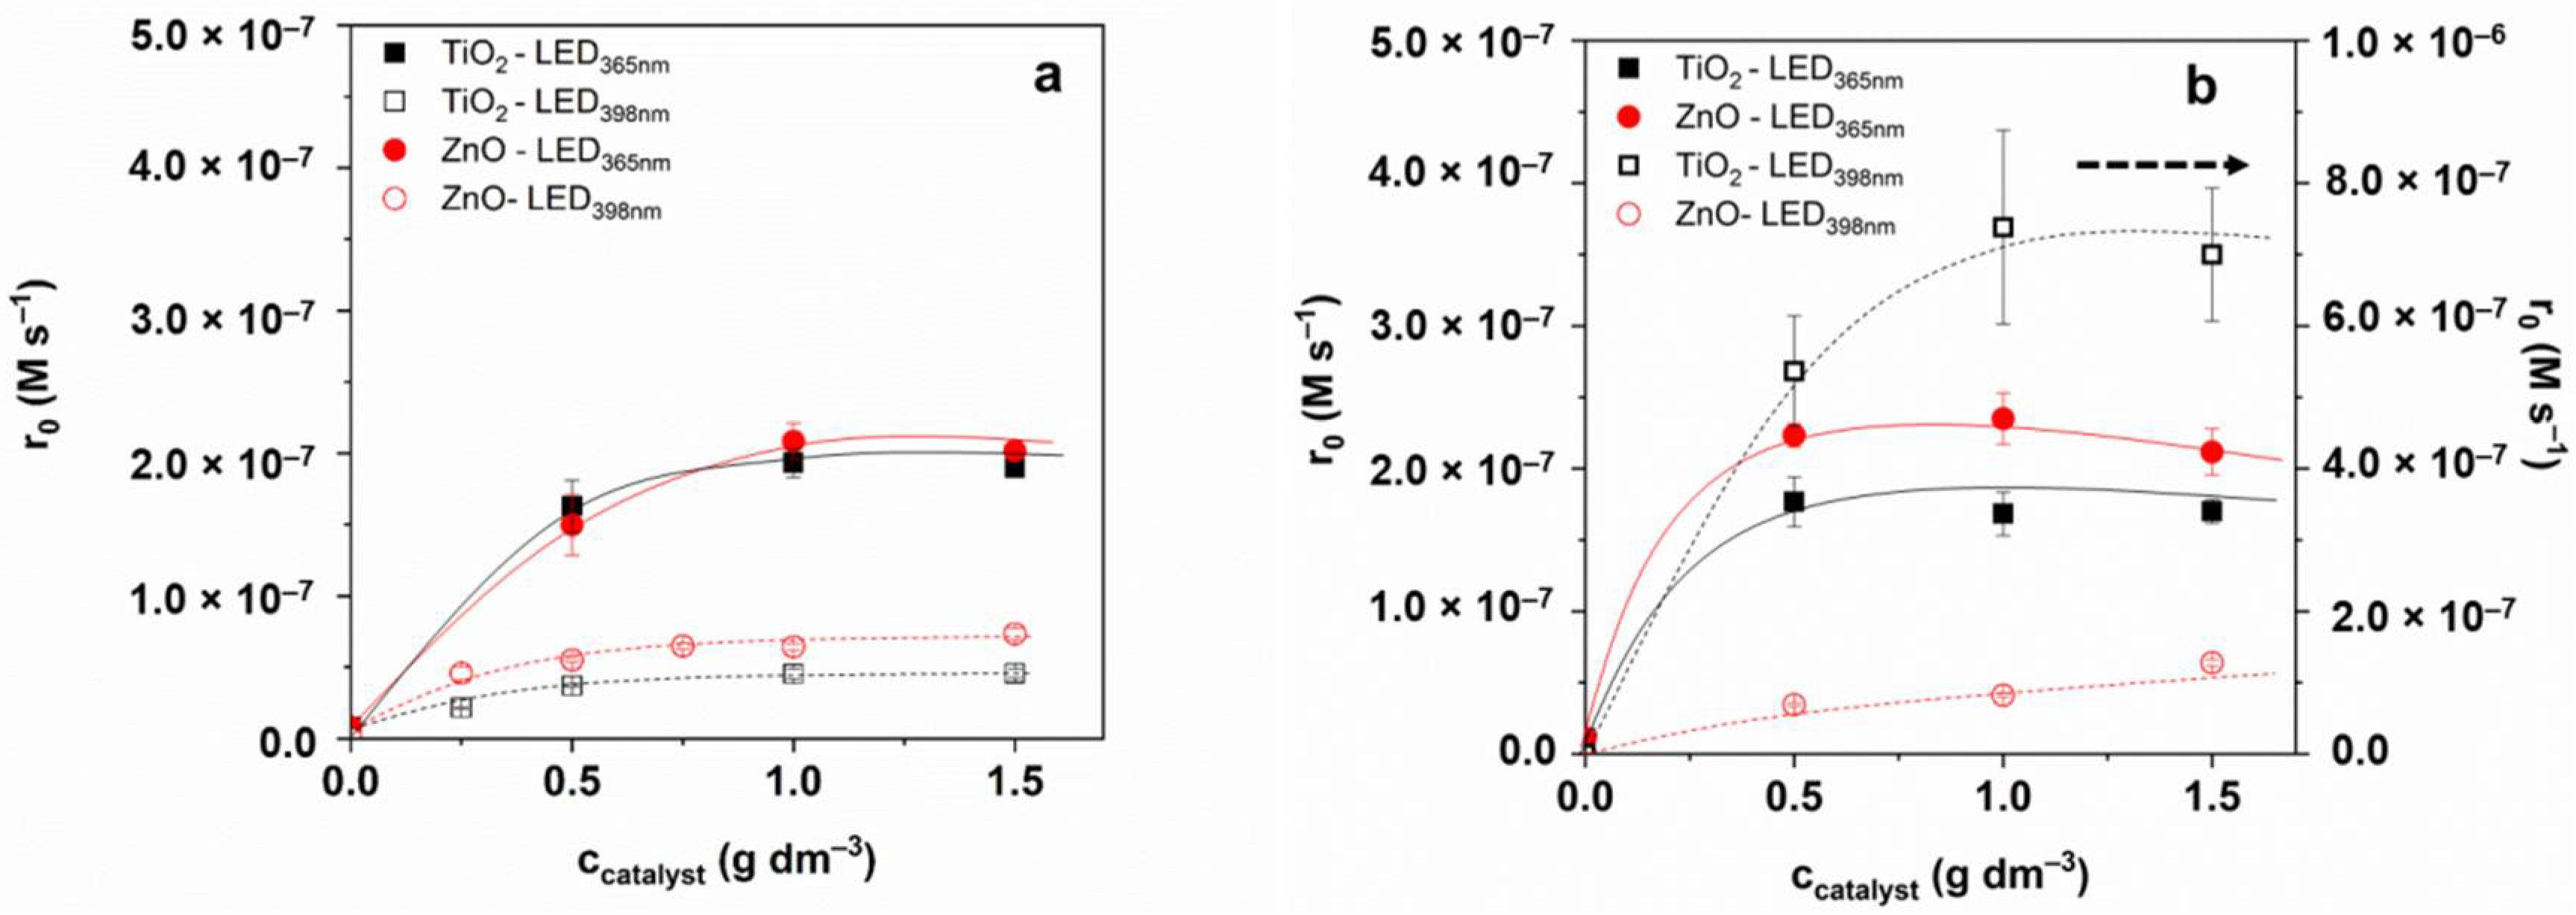
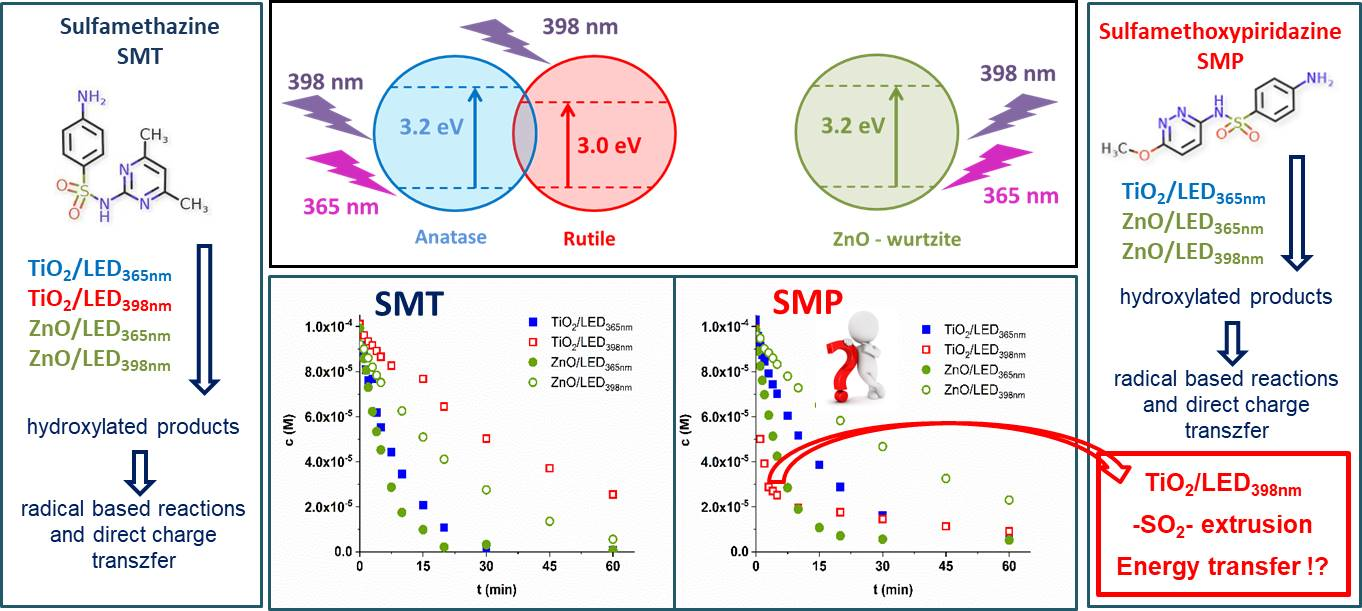
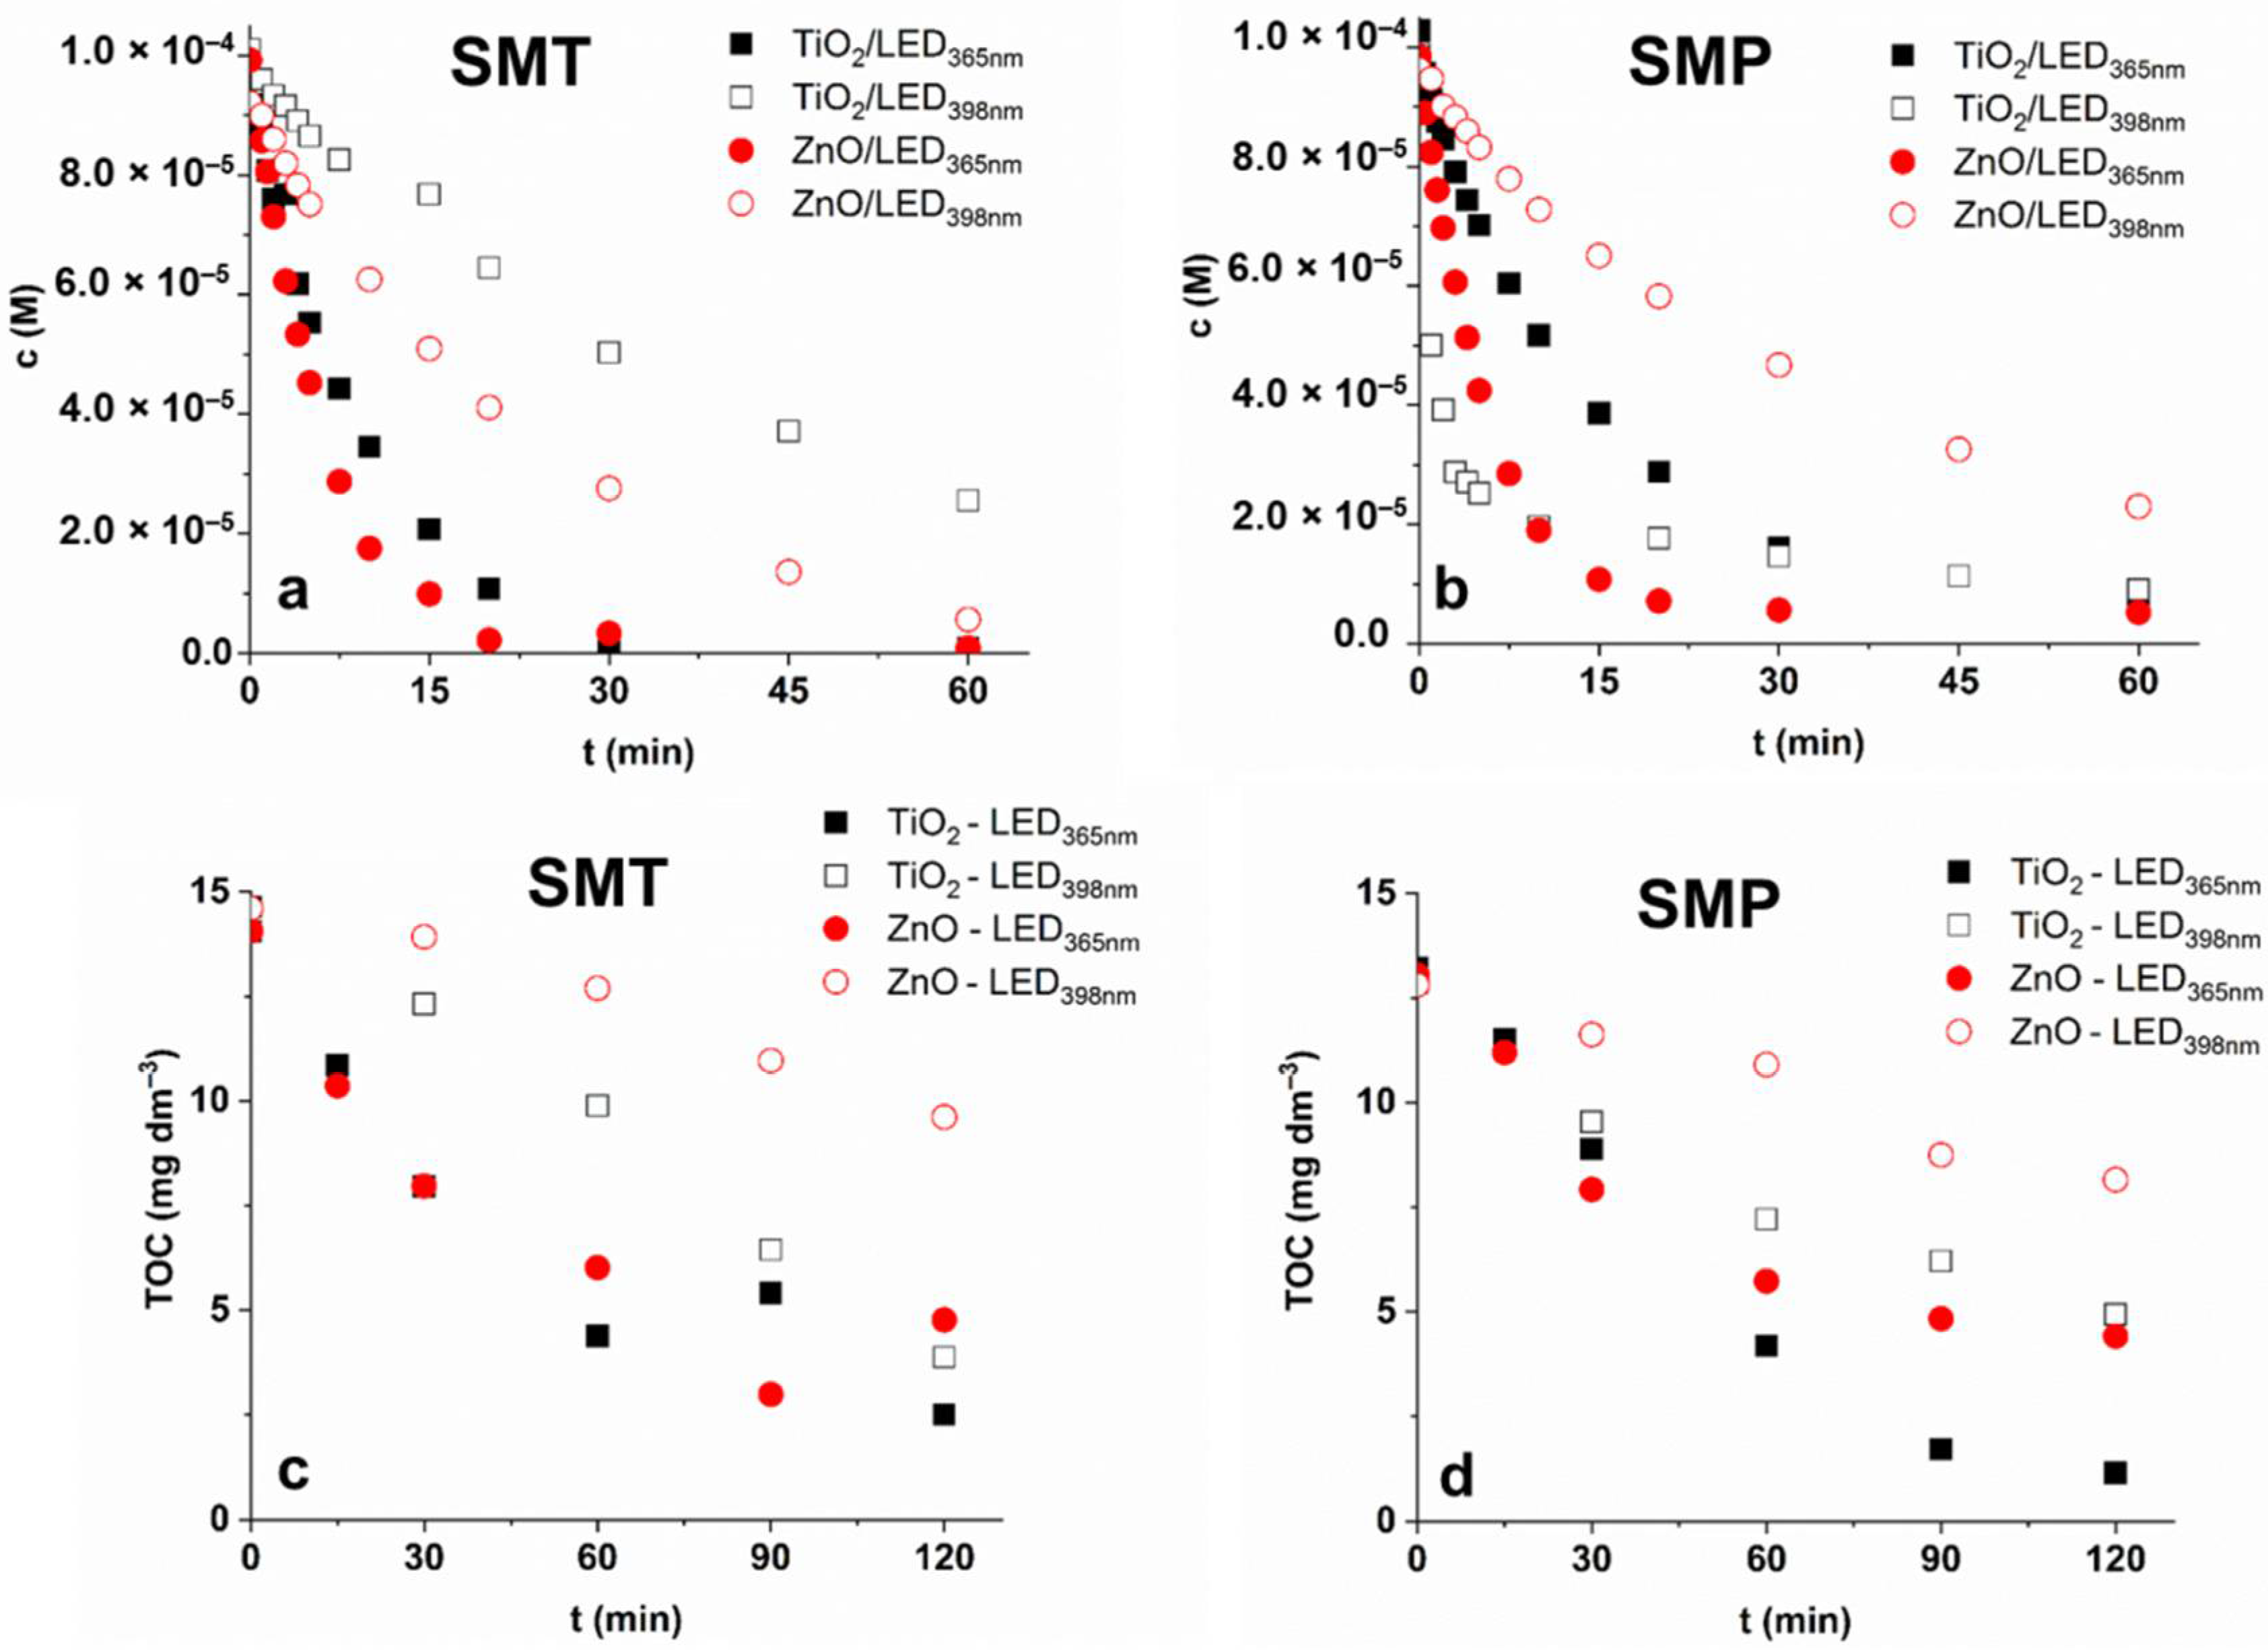
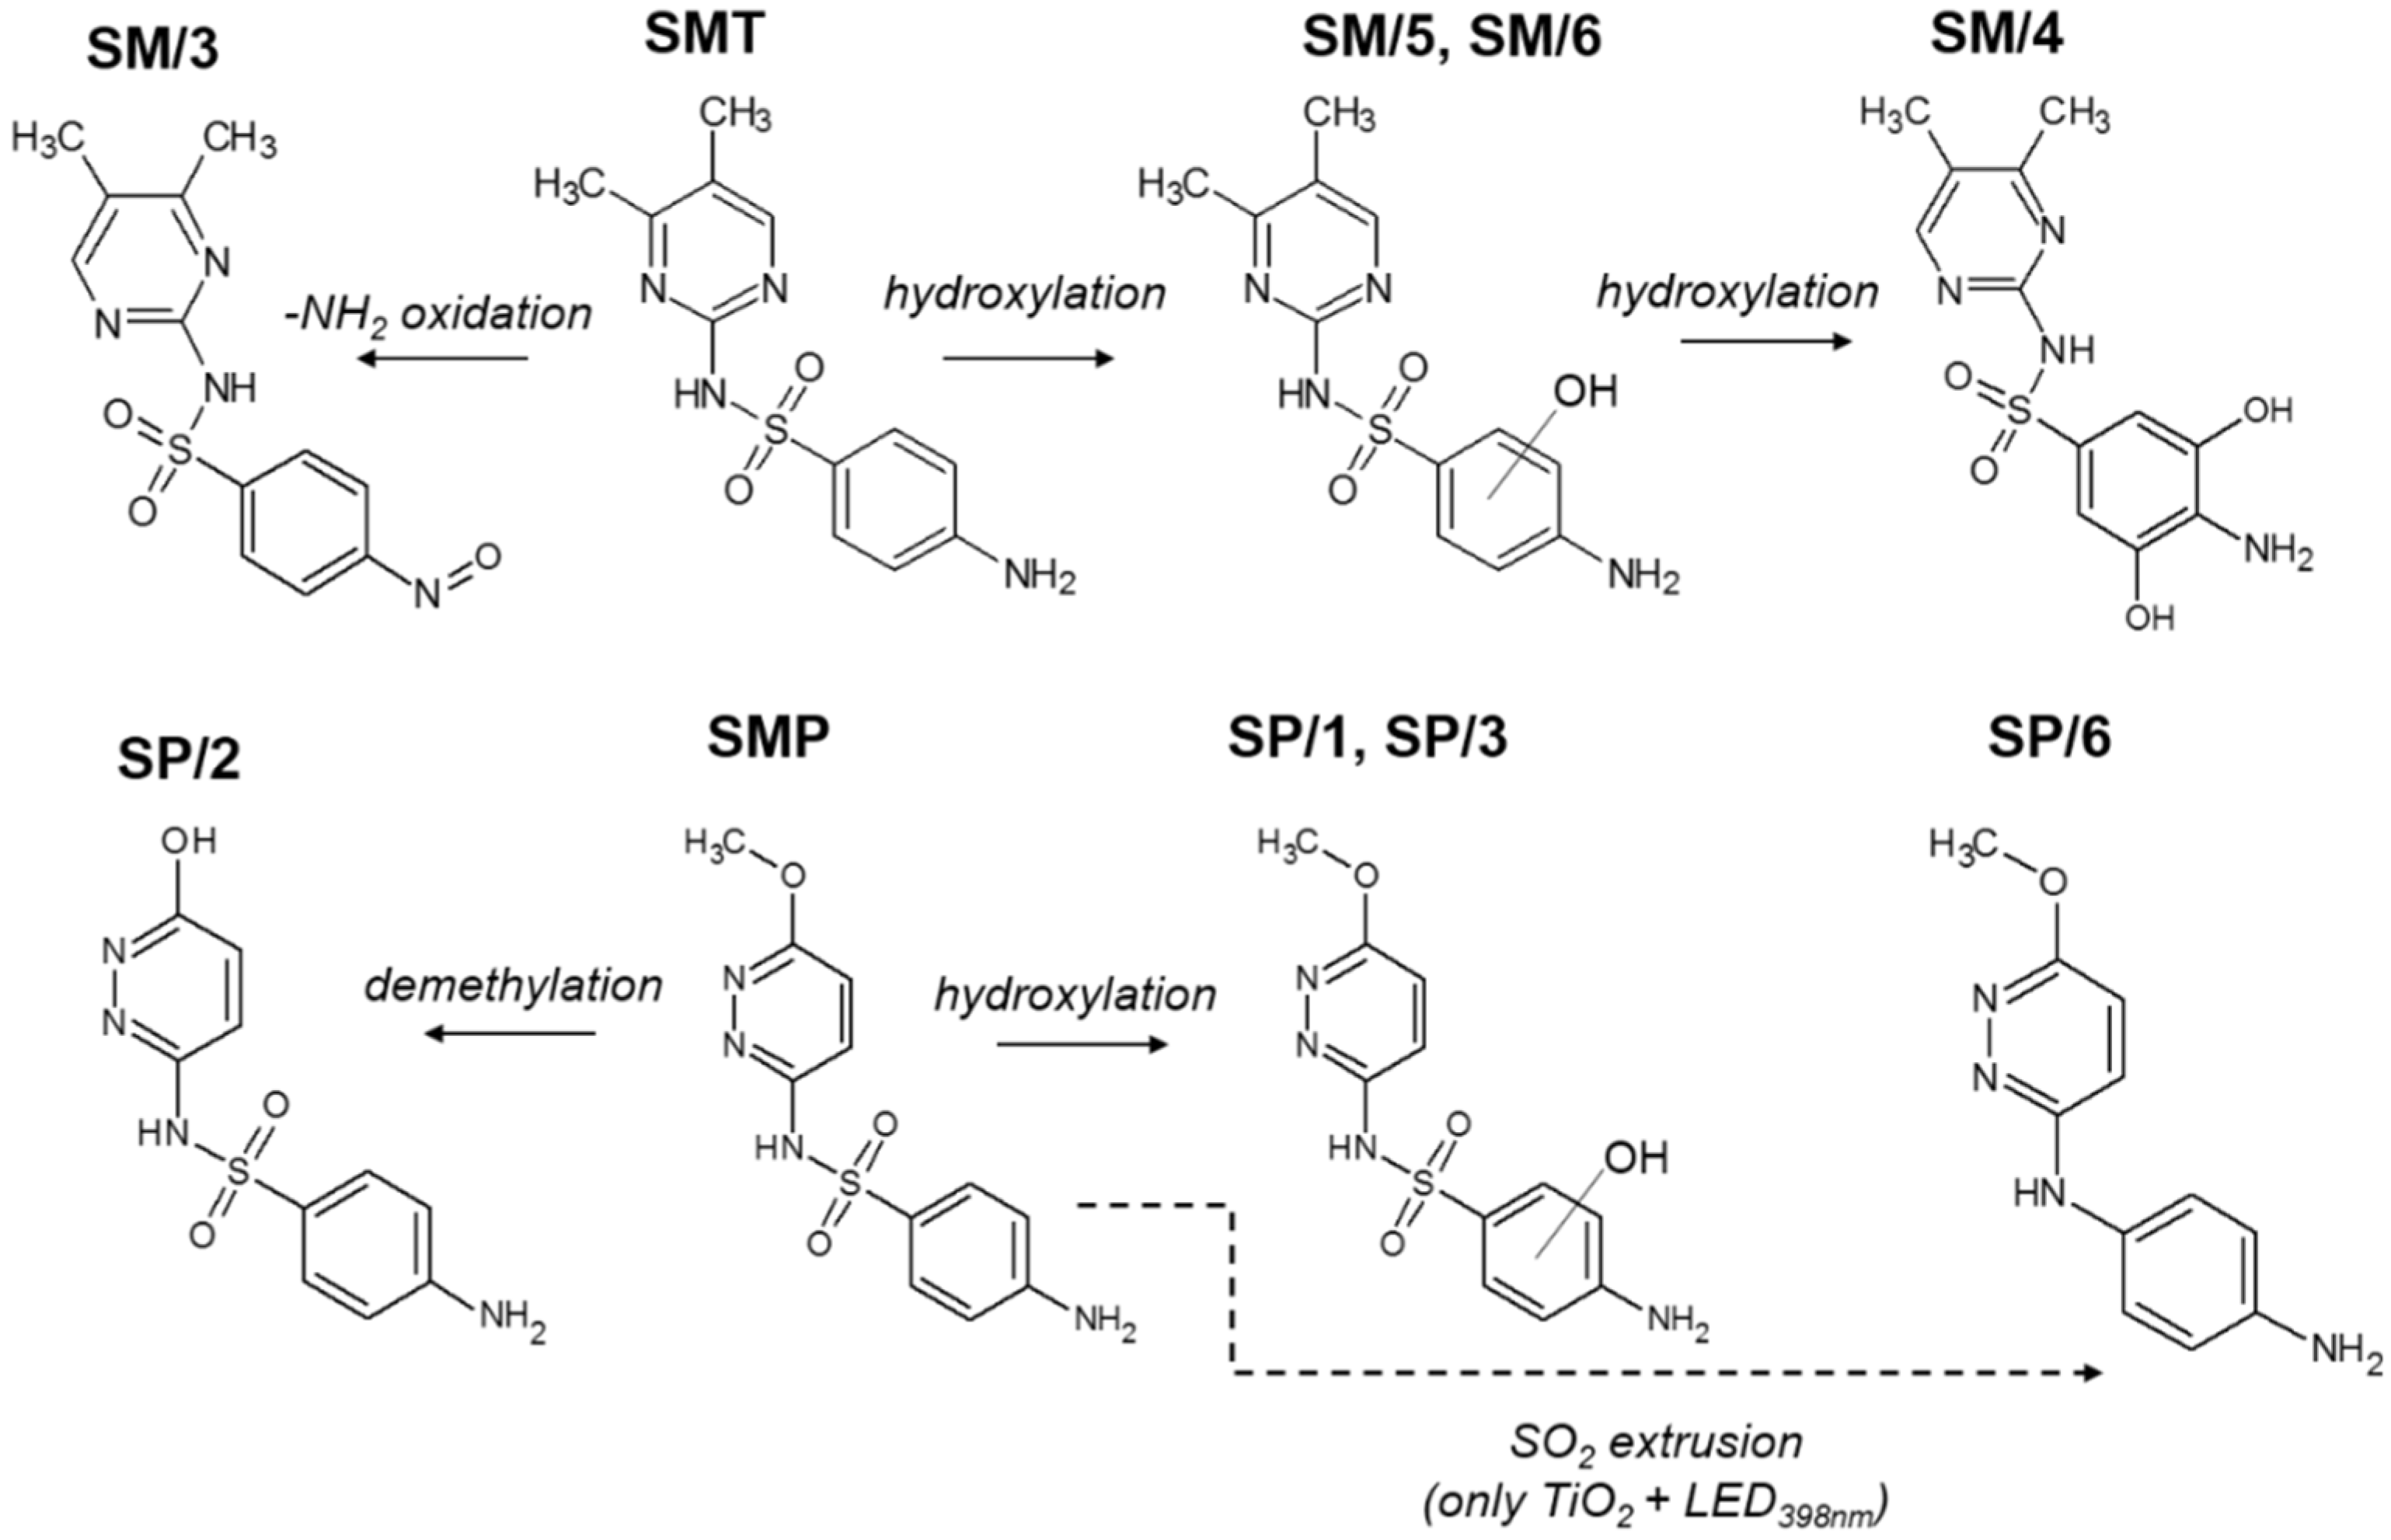
3.2. Transformation and Mineralization of Sulfonamides

At the given initial concentration (1.0 × 10⁻⁴ M), the adsorption of both SMT and SMP was negligible (<2%) for both catalysts. The effect of catalyst concentration was studied in the range of 0.25–1.5 g dm−3; the transformation rate does not increase above 1.0 g dm−3 TiO2 and ZnO concentration (Figure 3); thus, 1.0 g dm−3 photocatalyst was used for further experiments.
In the case of SMT, no significant difference was between TiO2 and ZnO, and LED365nm was more effective than LED398nm (Figure 3a), as was expected. For SMP, using LED365nm ZnO is slightly more efficient than TiO2. Using TiO2 and LED398nm an extremely fast transformation of SMP was observed (Figure 3b), which slows down after 75% decrease of the initial concentration (Figure 4b). Table 1. contains the initial reaction rates and the apparent quantum yields calculated at 1.0 g dm−3 photocatalyst dosage. The value determined for SMP TiO2/LED398nm is about 16 times higher than for SMT TiO2/LED398nm, while for other cases (TiO2/LED365nm, TiO2/LED365nm, TiO2/LED365nm), similar or even lower values were observed for SMP than SMT.
To interpret the specific behavior of SMP, we first examined and compared the distribution of aromatic intermediates, which are formed and transformed during the first 60 min. of treatment. The proposed structures of the formed products of SMT and SMP are summarized in Figure 5, while product distribution is shown in Figures S2 and S3. For SMT, six stable products were observed on the chromatogram (HPLC-DAD) (Figure S2), and four of them were identified with MS. The SM/3 product (m/z = 293.2) resulted by the oxidation of the terminal amino group, while SM/4 (m/z = 311.0), SM/5, and SM/6 (m/z = 295.1) formed via hydroxylation of the aromatic ring, most probably due to the reaction with OH [75,76]. No significant difference was found between the products formed using TiO2 and ZnO; however, ZnO produced a higher SM/5 concentration (Figure S2). The distribution of the products does not depend on the wavelength; only their accumulation and decomposition rate was higher using LED365nm than LED398nm.
In the case of SMP, SP/1 and SP/3 are hydroxylated products (m/z = 297.1), while SP/2 (m/z = 267.0) is resulted by demethylation [77]. The same products formed with a similar concentration distribution for ZnO using different LEDs. For SMT, the product distribution was similar for TiO2 and ZnO, while for SMP, it was different; SP/1 and SP/2 formed mainly in the case of ZnO, and SP/4 was observed only for TiO2 using LED365nm. (Figure S3). However, in the case of TiO2/LED398nm, not only did the conversion rate of SMP increase drastically but also the intermediates were changed in the case of lower-energy 398 nm radiation: besides the main product SP/6 (m/z = 217.0), which forms via -SO2-extrusion, the formation of hydroxylated products is negligible. The significant change of the primary products in the case of TiO2/LED398nm process indicates that the reaction mechanism of SMP is different in this case.
The primary product of sulfonamides often forms via desulfonation in both direct and indirect photodegradation processes [78,79,80]. Boreen et al. attributed the indirect oxidation partly to the interaction with triplet excited-state dissolved organic matters when the -SO2- extrusion happens due to the electron transfer and not to the energy transfer. The -SO2- extrusion as the primary transformation way was also reported in a previous work of the authors; the reaction happened selectively, BiOI/BiOCl photocatalysts [51] and direct charge transfer was supposed as the primary transformation process. Ge et al. compared the major conversion pathways for the transformation of different sulfonamides initiated by photolysis, OH-based, and singlet oxygen and desulfonation was particularly characteristic of photolysis, which includes direct photolysis and photosensitization via triplet excited-state dissolved organic matters [81]. All of these suggest that besides OH and direct charge transfer, the relative contribution of the reaction with singlet oxygen and direct energy transfer cannot be ignored and, despite their selectivity, can significantly contribute to the conversion of individual sulfonamides.

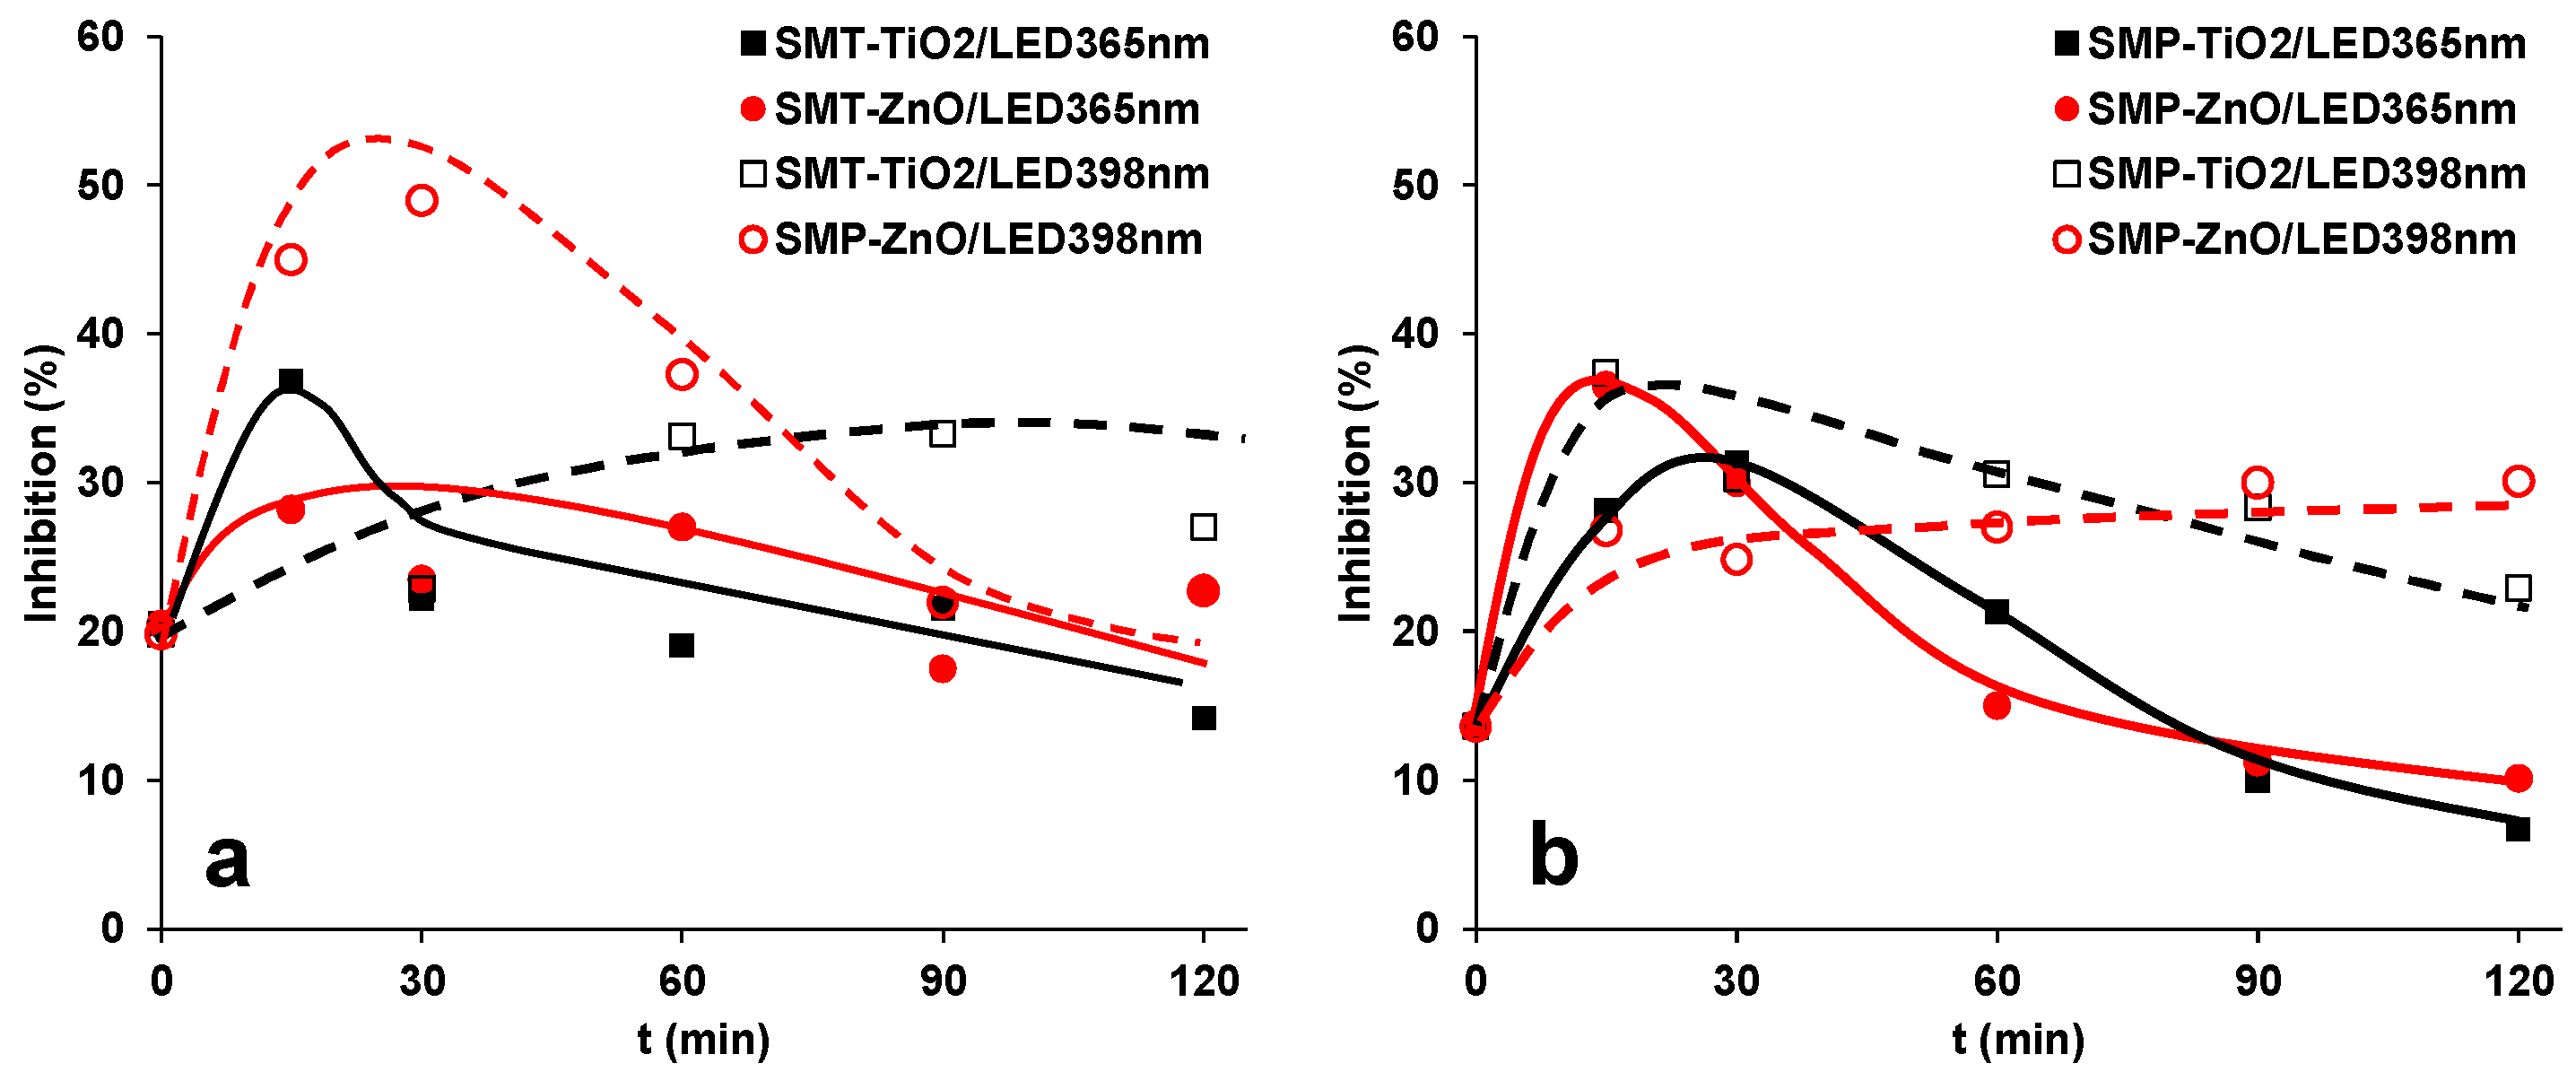
3.3. Mineralization of Sulfonamides and Ecotoxicity Assays

In the case of ozonation and UV photolysis, the intermediates of sulfonamides often have toxic effects. Moreover, chemicals together produce combination effects that are larger than the effects of the component separately. Thus, the change of ecotoxicity of the treated solution was investigated using Vibrio fischeri as a test organism. The 1.0 × 10⁻⁴ M concentration SMT and SMP caused a relatively low (<20%) inhibition. For SMT, the toxicity did not change or even increased slightly due to the formation of toxic products, then slowly decreased as their further transformation progressed (Figure 6a). For SMP, more significant changes were observed; it increased intensively and later decreased, and finally, toxicity lowered below the parent compound in the case of LED365nm (Figure 6b). The ecotoxicity change in the case of LED398nm depends on the photocatalysts: for SMT, the ZnO, while for SMP, the TiO2 is the more efficient.
The main goal of AOPs is generally not only the transformation but the complete mineralization of pollutants to avoid the accumulation of potentially toxic intermediates. In the case of SMT, both TiO2 and ZnO irradiated with LED365nm reduced the TOC by ~80%. Using LED398nm, the ZnO is more efficient for SMT transformation than TiO2, but mineralization is two times faster with TiO2 and finally (at 120 min) approaches the value measured in the case of LED365nm, while using ZnO/LED398nm no more than 33% TOC was removed (Figure 4c,d).
For SMP, TiO2 is more efficient (90 and 62% decrease for LED365nm and LED398nm, respectively) than ZnO (66% and 35% decrease for LED365nm and LED398nm, respectively) for TOC decrease in the case of both LEDs (Figure 4c,d), despite that, the SMP transformation rate for ZnO/LED365nm exceeds that for TiO2/LED365nm (Figure 3b, Table 1). Using TiO2/LED398nm, not only the transformation rate of SMP was extremely fast (Table 1), but also the mineralization was favorable, especially during the first period of treatment, and finally reached the value measured for ZnO/LED365nm. A plausible explanation of this could be that changes in the mechanism result in more easily oxidizable intermediates and, consequently, increase the mineralization rate. Comparing the mineralization rates, the efficiency change in the same order for both sulfonamides; and TiO2 shows better mineralization capacity than ZnO. The difference is much better manifested for LED398nm than LED365nm. It confirms that the OH is the most important reactive species in terms of mineralization.
For SMT, the formation of inorganic ions (NH4+, NO3, NO2 and SO42−) followed the mineralization efficiency: for LED365nm, similar results were obtained with both catalysts, with a slightly faster SO42− formation rate for ZnO and an enhanced NH4+ production for TiO2 (Figures S4 and S5). In the case of LED365nm, 85% of S-content was detected as SO42−; lower values (44% for TiO2 and 65% for ZnO) were measured for LED398nm. For LED365nm there was no significant difference between SMT and SMP in terms of inorganic ion formation rate, but it is worth comparing the SO42− conversion of SMT and SMP when TiO2/LED398nm is used. The SO42− conversion for SMT at 15 min is negligible, and no more than 25% at 60 min, while these values are 20% and 50% for SMP, confirming the different conversion mechanisms of the two sulfonamides and the importance of desulfonation for SMP, as the first step of transformation. (Figure S5). The SO42−-formation rate for TiO2/LED398nm, when –SO2-extrusion is supposed to be the dominant transformation pathway, is similar to TiO2/LED365nm and even faster for ZnO/LED365nm (Figure S5). It proves that desulfonation is an important step not only for TiO2/LED398nm; it can probably occur directly from the target substances as the first step of the transformation and from the aromatic intermediates.
No more than 30% of the nitrogen content was transformed into NH4+, the NO3 conversion was even lower (<14%) (Figures S4 and S5). For both sulfonamides, NO2 formation (<6%) was observed only for ZnO, which likely forms via the reduction of NO3 by eCB, and not favored on TiO2 surface [82]. NO2 could be easily oxidized with OH to NO3 (kNO2− + •OH = 6.0 × 10⁹ M−1 s−1 [83]), thus its concentration remains low.
To understand the reason for the unique behavior of the SMP, we have investigated the effect of wavelength and photocatalyst on the OH formation rate and charge separation efficiency, using COU and 1,4-BQ.

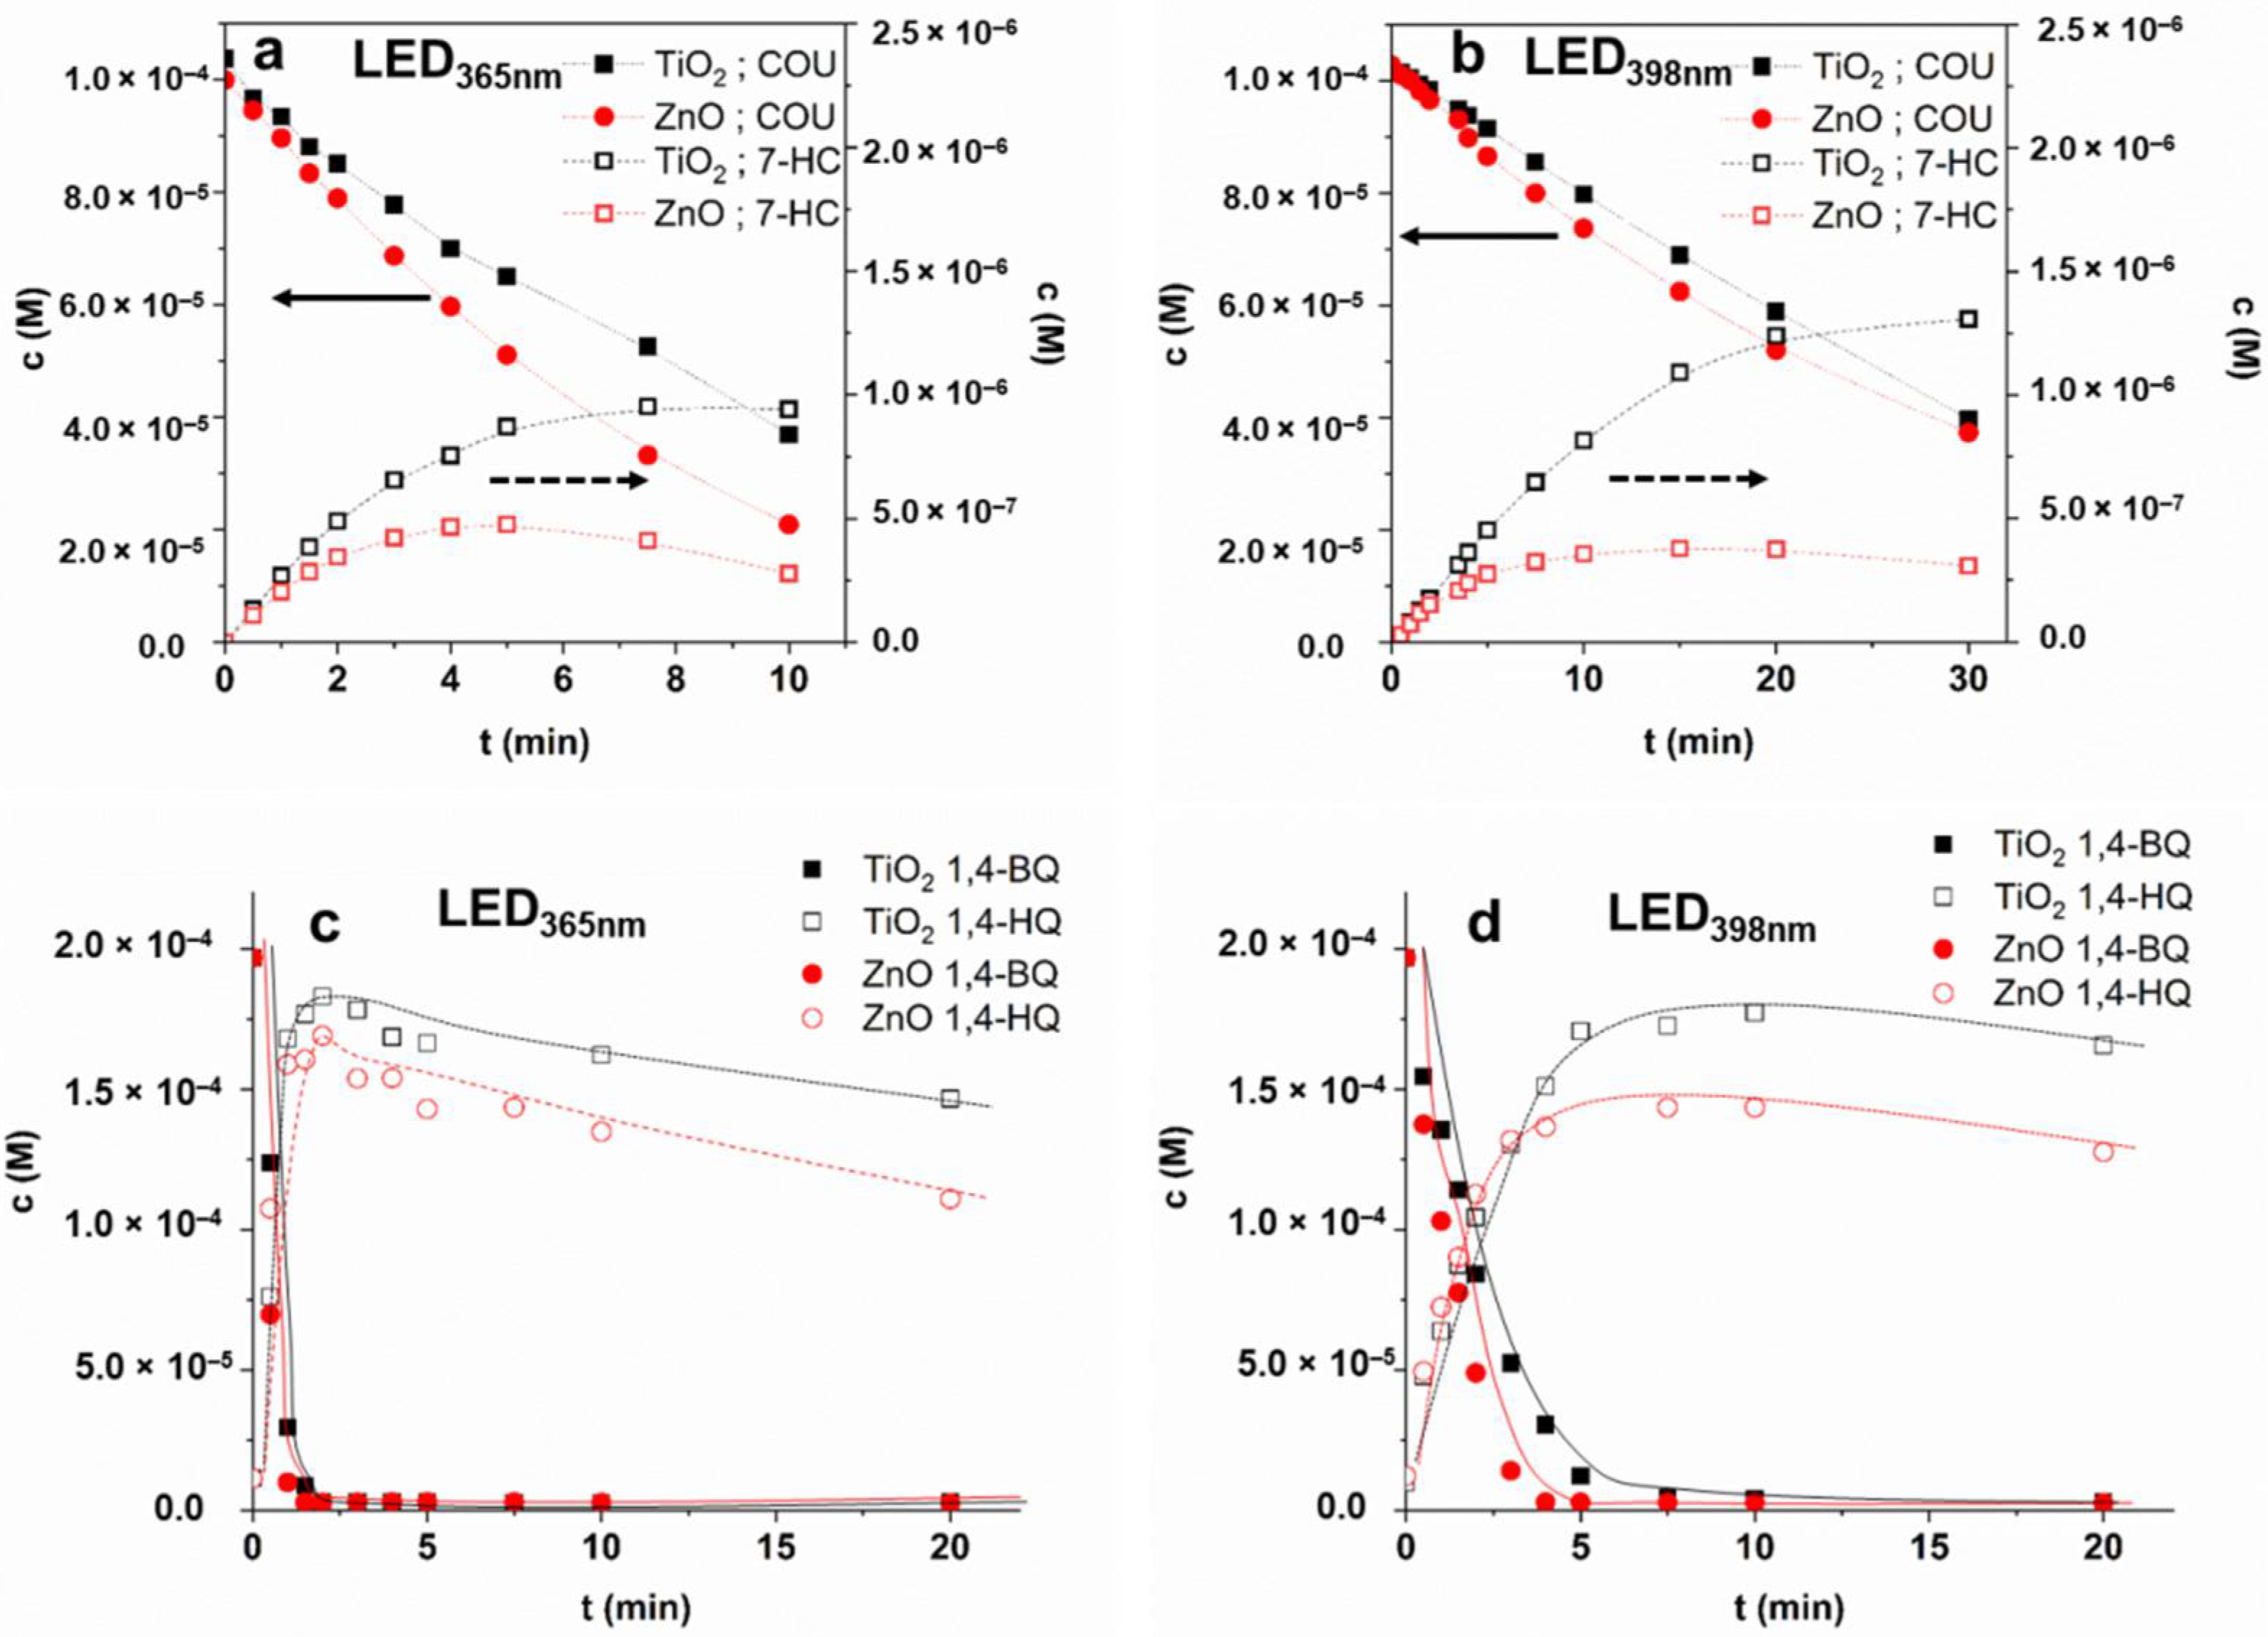
3.4. Transformation of Coumarin—The Comparison of OH Formation Efficiency

The reaction of COU with OH (kCOU+•OH = 6.9 × 10⁹ M−1 s−1 [84]) results in highly fluorescent 7-hydroxy-coumarin (7-HC) [85,86]; its formation rate is proportional to the OH formation rate. The ratio of COU transformation rate and 7-HC formation rate provides further information about the contribution of OH to the COU transformation [85,87,88].
The COU adsorption was negligible for both photocatalysts (<1.0%), similar to sulfonamides. The effect of the catalyst dose was determined in previous measurements; the r0COU reached a maximum value at 1.0 g dm−3 in the case of both photocatalysts. In this work, the initial concentration of COU was 1.0 × 10⁻⁴ M, and the catalyst dosage was 1.0 g dm−3.
The transformation of COU was slightly faster for ZnO, especially in the case of LED398nm, while the formation rate of 7-HC was significantly higher for TiO2, than for ZnO in both cases (Table 2). The maximum concentration of this hydroxylated product is almost twice for TiO2 than for ZnO in the case of LED365nm and more than three times higher in the case of LED398nm (Figure 7a,b). The r0COU/r07-HC ratio for TiO2 (0.027 and 0.041 for LED365nm and LED398nm, respectively) also exceeds the value determined for ZnO (0.019 and 0.025 for LED365nm and LED398nm, respectively). These prove the higher contribution of OH to the transformation when TiO2 is used, mainly when LED398nm is applied (Table 2). Most probably, for ZnO the transformation of COU via direct charge transfer processes is favorable due to the higher electron mobility of photogenerated charges [89,90].
The apparent quantum yield (ΦCOU) relates to the COU transformation is higher for TiO2 than for ZnO (Table 2); opposite that, the light absorption properties of ZnO are more favorable at 365 nm (Figure 1b). When LED398nm is used, primarily the rutile phase can be excited due to its lower bandgap. Since the rutile content of TiO2 is only 15%, the ΦCOU is significantly lower at this wavelength than for ZnO (Table 2). Comparing the ΦCOU value determined at two different wavelengths was 7 times higher for TiO2, but only 3 times higher for ZnO at 365 nm than 398 nm. Similar ratios can be observed for Φ7-HC values. The different wavelengths and photon flux can affect photogenerated charge carriers’ formation and recombination rate [91,92], affecting the quantum efficiency of OH formation.
The efficiency of both photocatalysts was lower at 398 nm, but despite the nearly 80% reflection and the wide bandgaps (3.2 eV), pretty good activities were measured compared to the irradiation at 365 nm. It is probably due to the presence of rutile for TiO2 and the heterojunction between the rutile and anatase phases. The results on COU conversion confirmed that OH formation is much more efficient for TiO2 than for ZnO, and that wavelength also has a significant effect on OH formation efficiency but does not explain the behavior of SMP.

3.5. Transformation of 1,4-BQ—The Comparison of Charge Separation Efficiency

Besides OH formation efficiency, the possibility of direct charge transfer and efficiency of eCB was also studied and compared. Fónagy et al. demonstrated that 1,4-benzoquinone (1,4-BQ) can be used as a direct eCB scavenger under anoxic atmosphere, and the amount of the formed 1,4-H2Q is proportional to that of eCB generated during the excitation of a photocatalyst [93]. Thus, we used the transformation rate of 1,4-benzoquinone (1,4-BQ) and the formation rate of 1,4-H2Q to investigate and compare the formation rate of photogenerated eCB The backward reaction is also possible; reaction between 1,4-H2Q and hVB+ (Equation (2)) results in 1,4-BQ [93,94].
1,4-BQ + 2 eCB + 2 H+ → 1,4-H2Q
1,4-H2Q + 2 hVB+ → 1,4-BQ + 2 H+
hVB+ + OH/H2O → OH
1,4-BQ + OH → Products
1,4-H2Q + OH → Products
The transformation rate of 1,4-BQ via direct charge transfer in O2-free suspension highly exceeds that of the COU transformation, mainly based on reactions initiated by OH in O2-containing suspension (Table 2). The difference between the efficiency of photocatalysts was observed when LED398nm was applied; the 1,4-BQ transformation was faster for ZnO than TiO2 (Figure 7d), most probably due to the higher electron mobility of ZnO [89,90]. The transformation was slower for both TiO2 and ZnO using 398 nm light due to intense reflection at this wavelength and generating fewer eCB − hVB+ pairs than 365 nm photons. In both cases, the maximum concentration of 1,4-H2Q was higher for TiO2 and just slowly transformed. The 1,4-BQ was present (c > 2.3 (±0.2) × 10−6 M) during the whole treatment time, clearly indicating the backward reaction via hVB+ (Equation (2)). In the absence of O2, the reformed 1,4-BQ (Equation (2)) acts as an eCB acceptor (Equation (1)), which opens up the way for OH formation (Equation (3)). Most probably, the slow decrease of the sum of 1,4-BQ and 1,4-H2Q concentrations is caused by OH initiated transformation (k1,4-BQ •OH = 1.2 × 10⁹ M−1 s−1 [95] (Equation (4); k1,4-H2Q + •OH = 5.2 × 10⁹ M−1 s−1 [96] (Equation (5)) (Figure 7d).
Sulfonamides react fast not only with OH but also eaq. Mezyk et al. investigated the kinetics and efficiencies of OH and eaq based reactions to the transformation of four different sulfa drugs (sulfamethazine, sulfamethizole, sulfamethoxazole, and sulfamerazine) [97]. The rate constants of OH based oxidation (7.8–8.5 × 10⁹ M−1 s−1) and degradation efficiencies were similar (changed from 35% to 53%). The rate constants of reduction with the eaq (1.0–2.1 × 10¹⁰ M−1 s−1) was even higher and varied within small ranges, but the corresponding degradation efficiency resulted in highly different values from 0.5% to 71%. They proposed that OH adds predominantly to the sulfanilic acid ring, while reaction with eaq occurs at different reaction sites of the different heterocyclic rings. The higher transformation rate of SMT and SMP, for ZnO than TiO2 is probably due to their direct reaction with photogenerated charges. Although the significant contribution of direct charge transfer to the conversion is a possible way to explain the difference of transformation rates observed between TiO2 and ZnO, it is difficult to interpret the behavior of SMP in the case of TiO2/LED398nm by this way considering that the number of photogenerated charges is much higher for LED365nm.

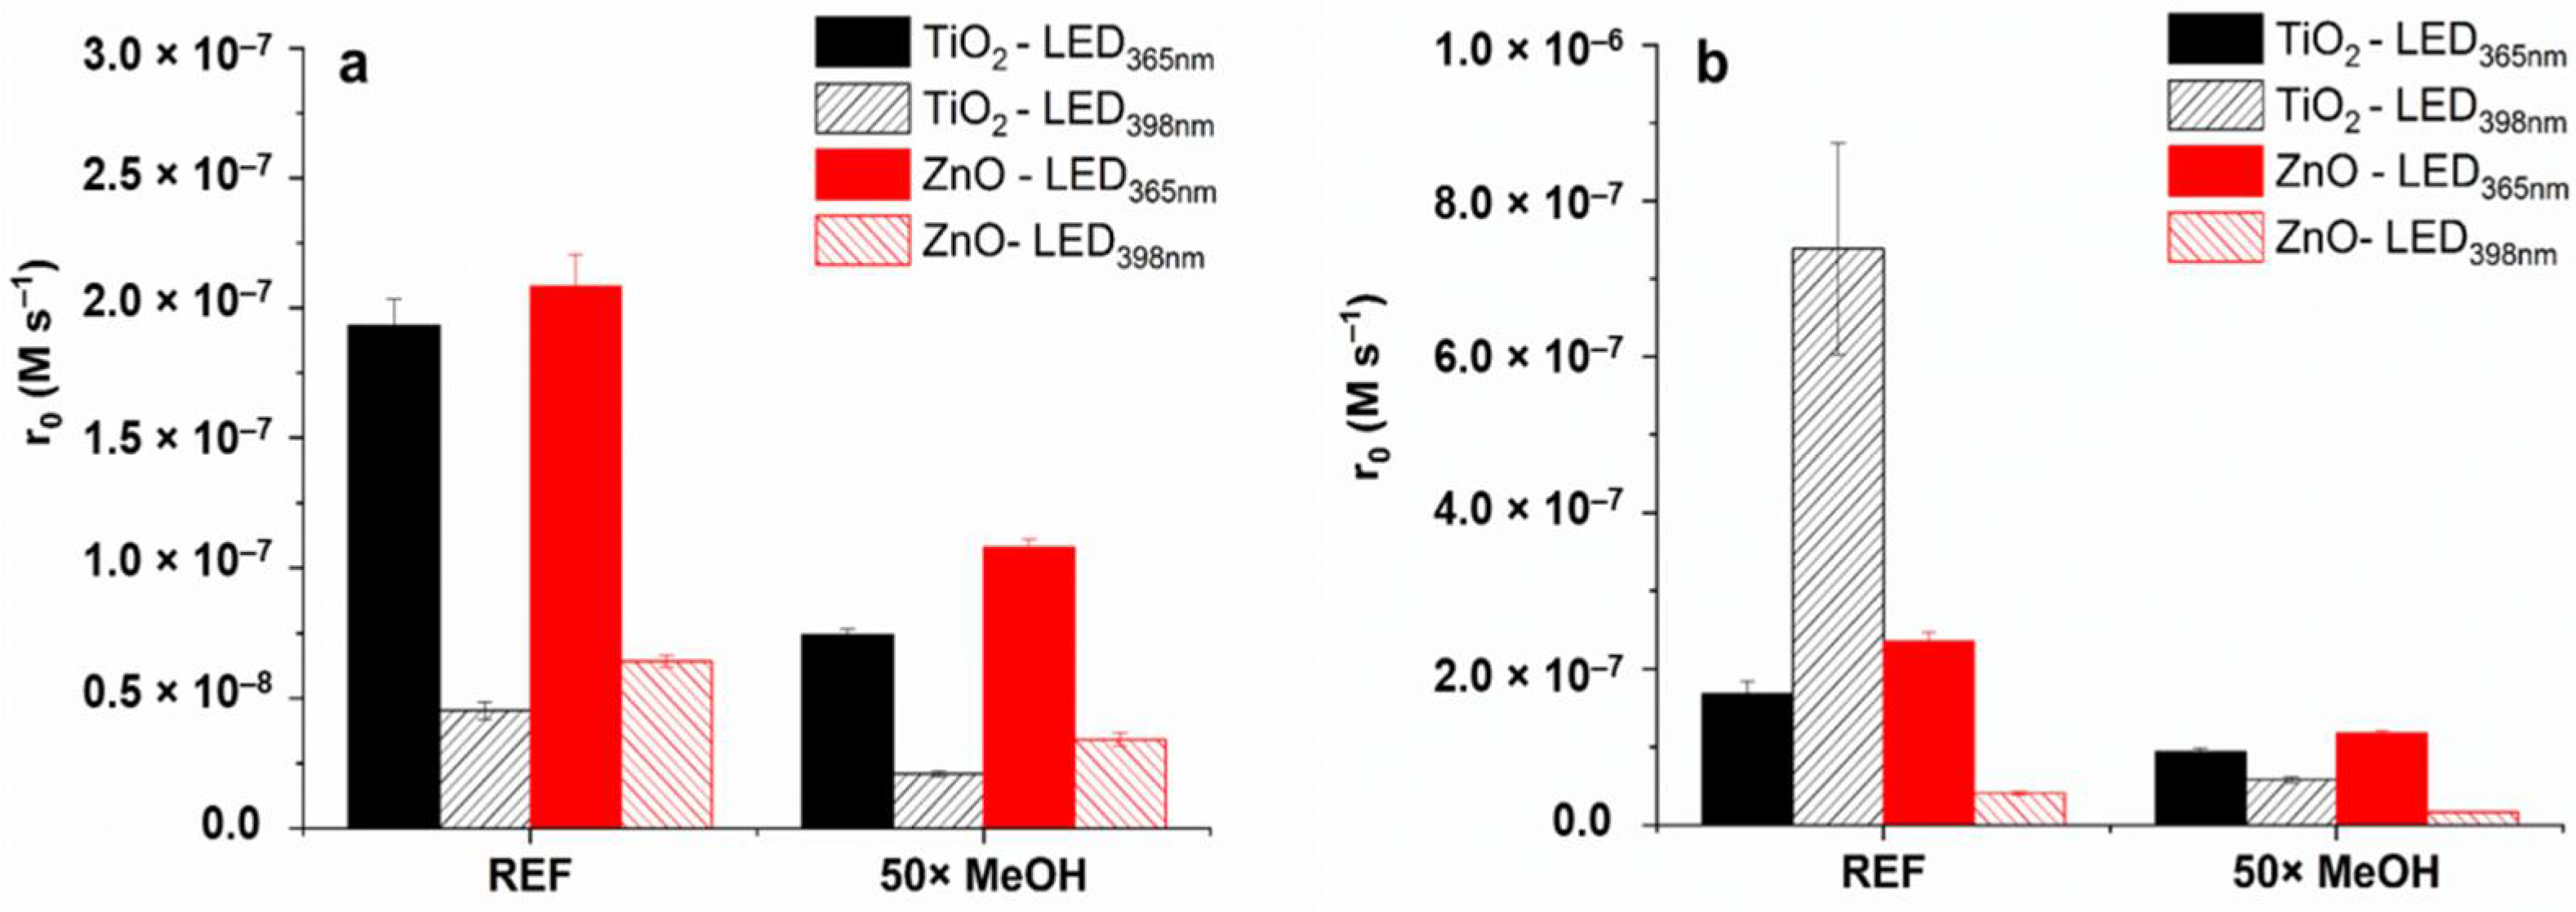
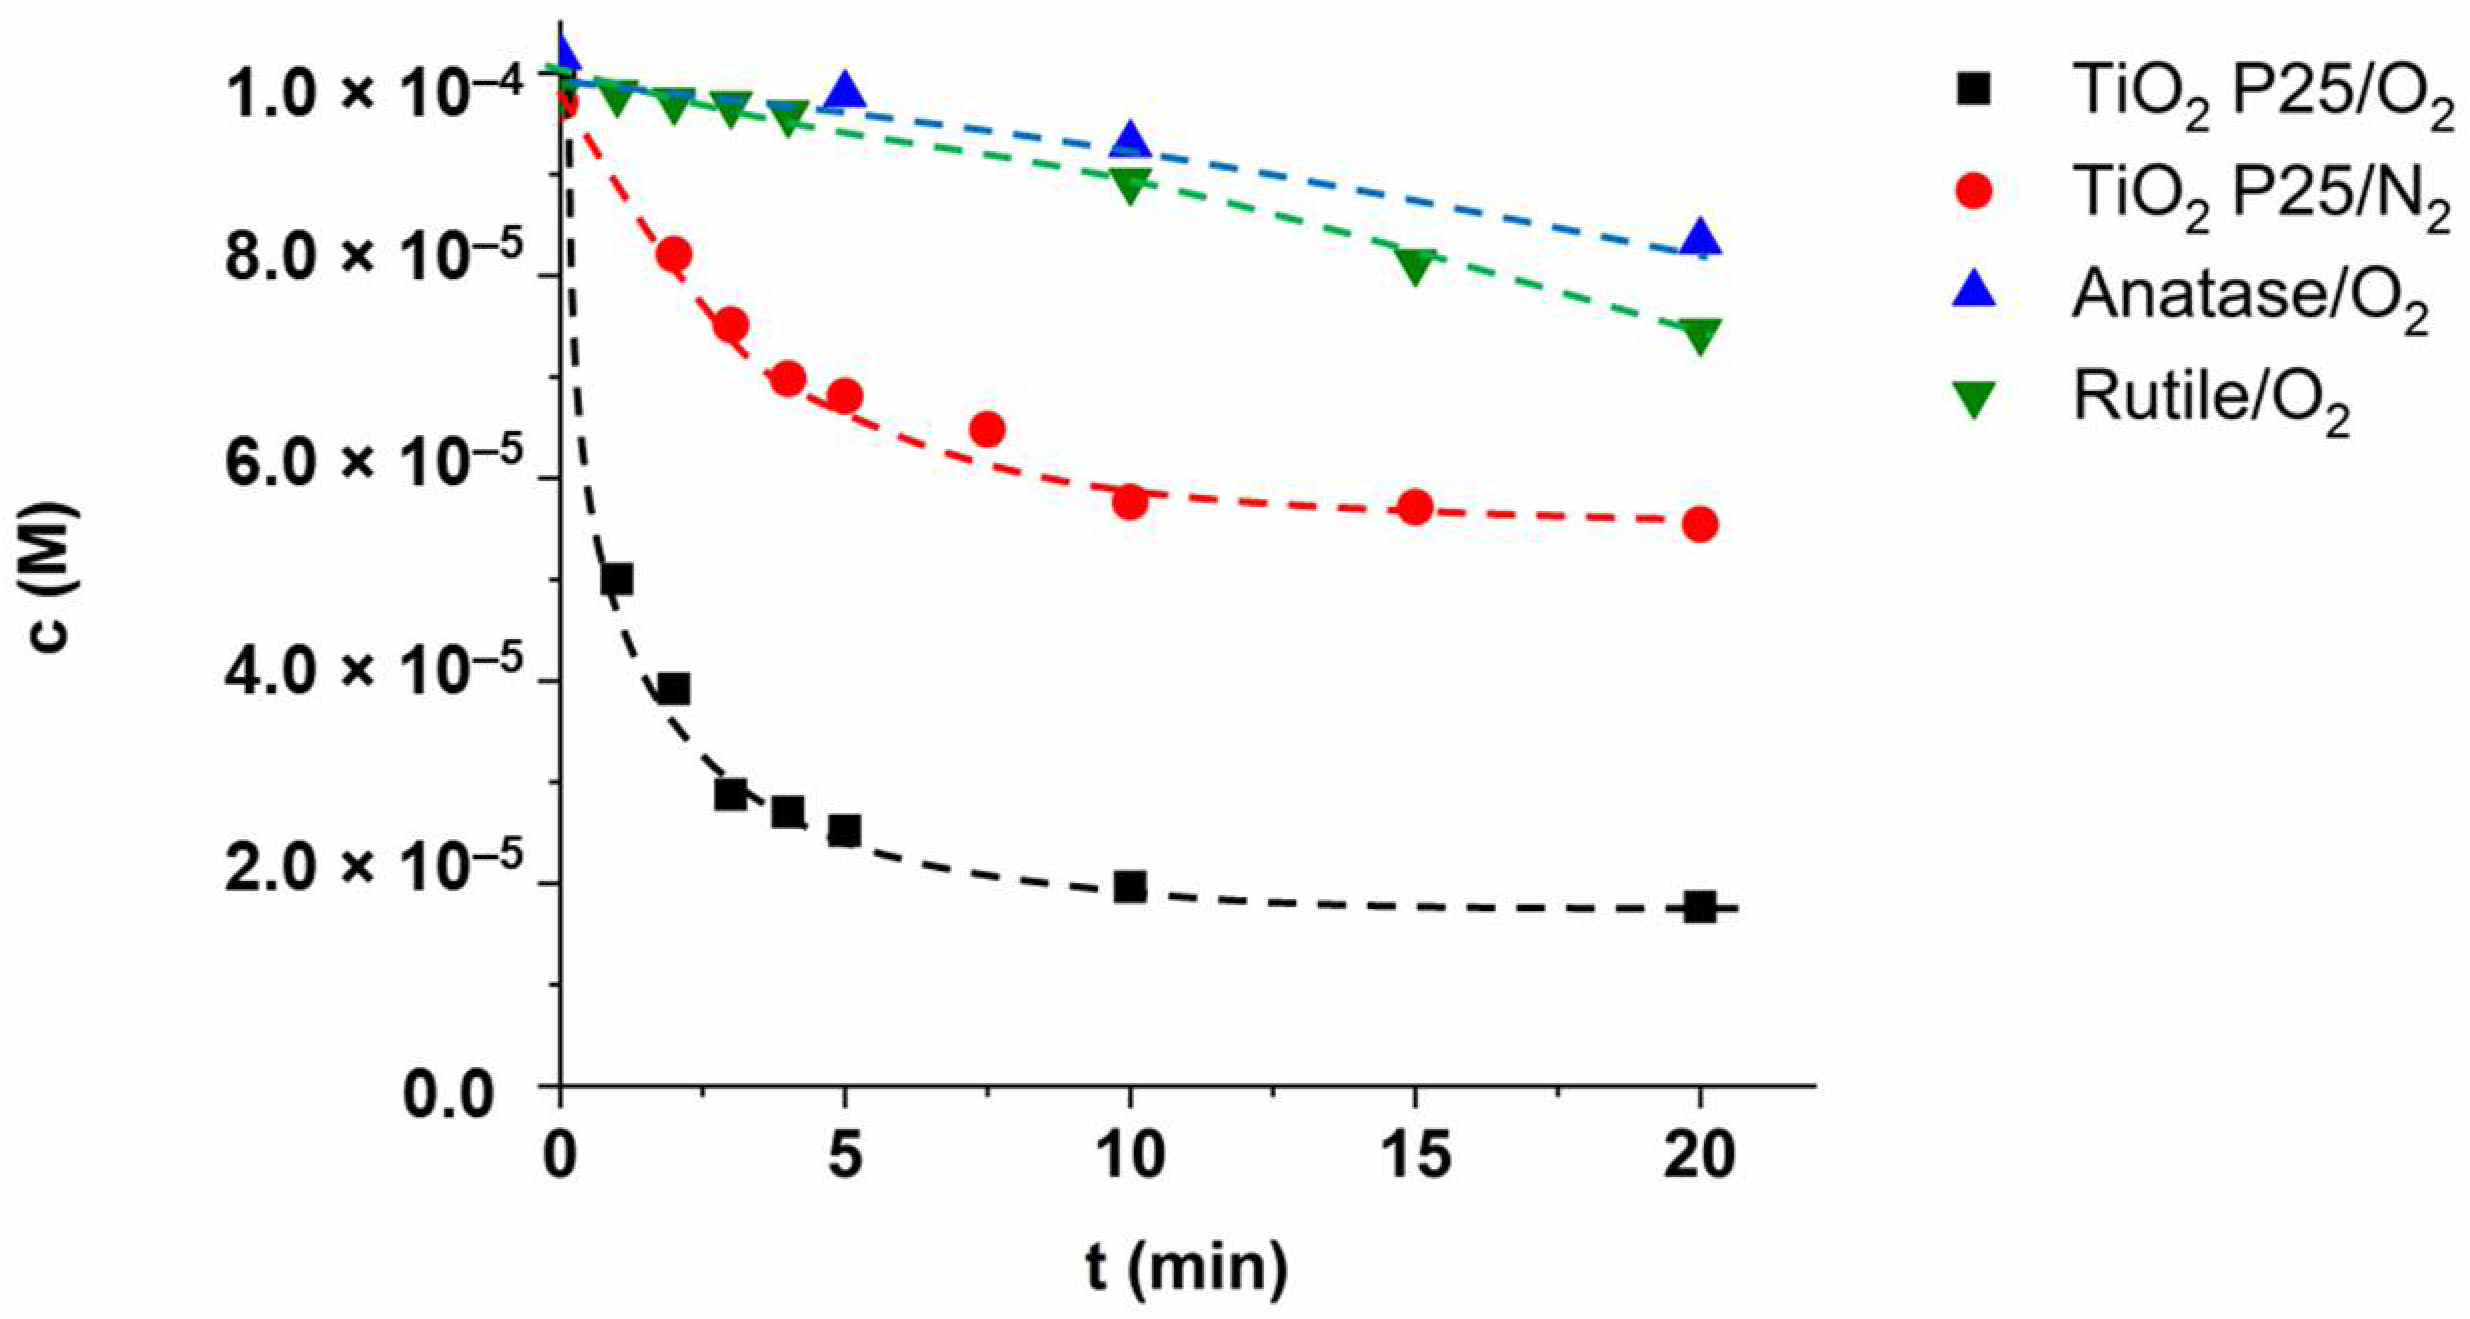
3.6. Reaction Mechanism—Effect of Radical Scavenger, Dissolved O2, and the Quality of TiO2

Sulfonamides react fast with OH (kSMT + •OH = 8.3 × 10⁹ M−1 s−1 [97]); thus, the effect of methanol (MeOH) as OH-scavenger (kMeOH + •OH = 9.7 × 10⁸ M−1 s−1 [98]) was investigated. The addition of 2.5 × 10⁻³ M MeOH to 1.0 × 10⁻⁴ M SMT or SMP scavenges more than 70% of OH reduced the transformation rates to about half in each case (Figure 8) for TiO2/LED398nm, the SMP transformation was decreased to a similar value than TiO2/LED365nm or ZnO/LED365nm. MeOH can also be used as a hVB+ scavenger [82,99,100]; therefore, it might prevent the direct oxidation of SMP, but this is not a likely explanation in this case. The direct energy transfer is supposed to be the main reason for the photocatalytic isomerization of trans-caffeic acid in TiO2 suspension [26]. The addition of MeOH completely inhibited the transformation in that case; the effect was much larger than expected based on the radical scavenging capacity of MeOH, similar to its effect on SMP transformation for TiO2/LED398nm.
Both energy transfer and direct charge transfer could increase the conversion rate, change the reaction pathway, and alter the quality of the primary intermediate. The unique behavior of SMP for TiO2/LED398nm needed further investigation to clarify since the effect of MeOH was not enough for its proper interpretation, although its high impact indirectly confirmed the role of direct energy transfer.
In O2 containing suspension, eCB reacts with molecular O2, which is a source of the ROS formation. The further transformation of O2•− creates a possibility to the OH-formation via H2O2, while in O2-free suspension OH formation is limited to the reaction of H2O/OH with hVB+. In the O2-free suspension, the initial conversion of SMP is slower but still very significant, especially since most organic compounds are not converted at all without O2. The shape of the kinetic curves is similar in both O2-free and aerated suspension: after 45% and 75% removal of SMP, its further transformation became very slow, almost negligible (Figure 9). In both cases, the main intermediate forms via desulfonation, the concentration of hydroxylated products is negligible. The transformation in O2-free suspension via direct charge transfer can take place if SMP could behave as eCB scavenger instead of O2, and both oxidation and reduction of SMP can happen similar to the double electron transfer suggested for the formation of singlet oxygen by Nosaka et al. [21]. Thus, two processes are possible: one is the oxidation and reduction of SMP taking place parallel when different parts of the molecule react with eCB and hVB+ or the direct energy transfer, when excited photocatalysts particles transfer energy to SMP, which is finally transformed. If the reaction with ROS or direct charge transfer process is primarily responsible for transforming an organic compound, its conversion is generally negligible in O2-free suspension. However, the rapid desulfonation of SMP in an O2-free suspension confirms that the energy transfer is primarily responsible for its conversion. Of course, the contribution of the reactions with the formed ROS in the presence of O2 are not negligible.
After 5 and 10 min, there is a “breaking point” on the kinetic curves; after that, the SMP transformation is inhibited, especially in O2 containing suspension. The energy transfer can take place via a different mechanism. In the case of “trivial energy transfer”, SMP absorbs the photon emitted by the excited semiconductor. Unlike the trivial mechanism, Förster and Dexter energy transfers are radiationless processes and strongly depend on the distance of the acceptor from the semiconductor. No electron exchange between acceptor and donor occurs when Förster mechanism takes place, while Dexter energy transfer mechanism occurs when simultaneously two electrons move in opposite directions without net charge exchange. The formed SO32−/SO42− species and other ions and organic intermediates can adsorb on the TiO2 surface [101]. The change of catalysts surface can impede the access to the surface and thus energy transfer via Förster or Dexter mechanism. Moreover, the poisoning of the catalyst surface can also reduce efficiency [102].
The synergistic effect between the two crystal phases resulting in enhanced charge separation and photocatalytic activity was proved by several authors [32,33,103]. Under 398 nm irradiation, mainly the rutile phase excited (Figure 1b), the photogenerated eCB can migrate to the anatase phase, inhibiting the recombination of photogenerated charges [104]. Although heterojunction is controversial, the great activity of P25 is undoubted. For determining whether the unique behavior of the SMP is manifested in the case of anatase or rutile phase or characteristic only to the P25, we examined the conversion of SMP in the presence of pure anatase and rutile phase. But only a slow transformation occurred (Figure 9). The intensive desulfonation was not observed. Mainly hydroxylated products formed indicating a OH based reaction pathway in the case of anatase and rutile.
From this, it can be concluded that the unique transformation of SMP is only possible for TiO2 P25 and is most likely a consequence of the energy transfer, which takes place in this particular case, using P25 photocatalyst and 398 nm radiation. However, the role of direct charge transfer cannot be excluded, and in O2-containing suspensions, the OH-based reaction is likely to contribute to the transformation and mineralization of the products.

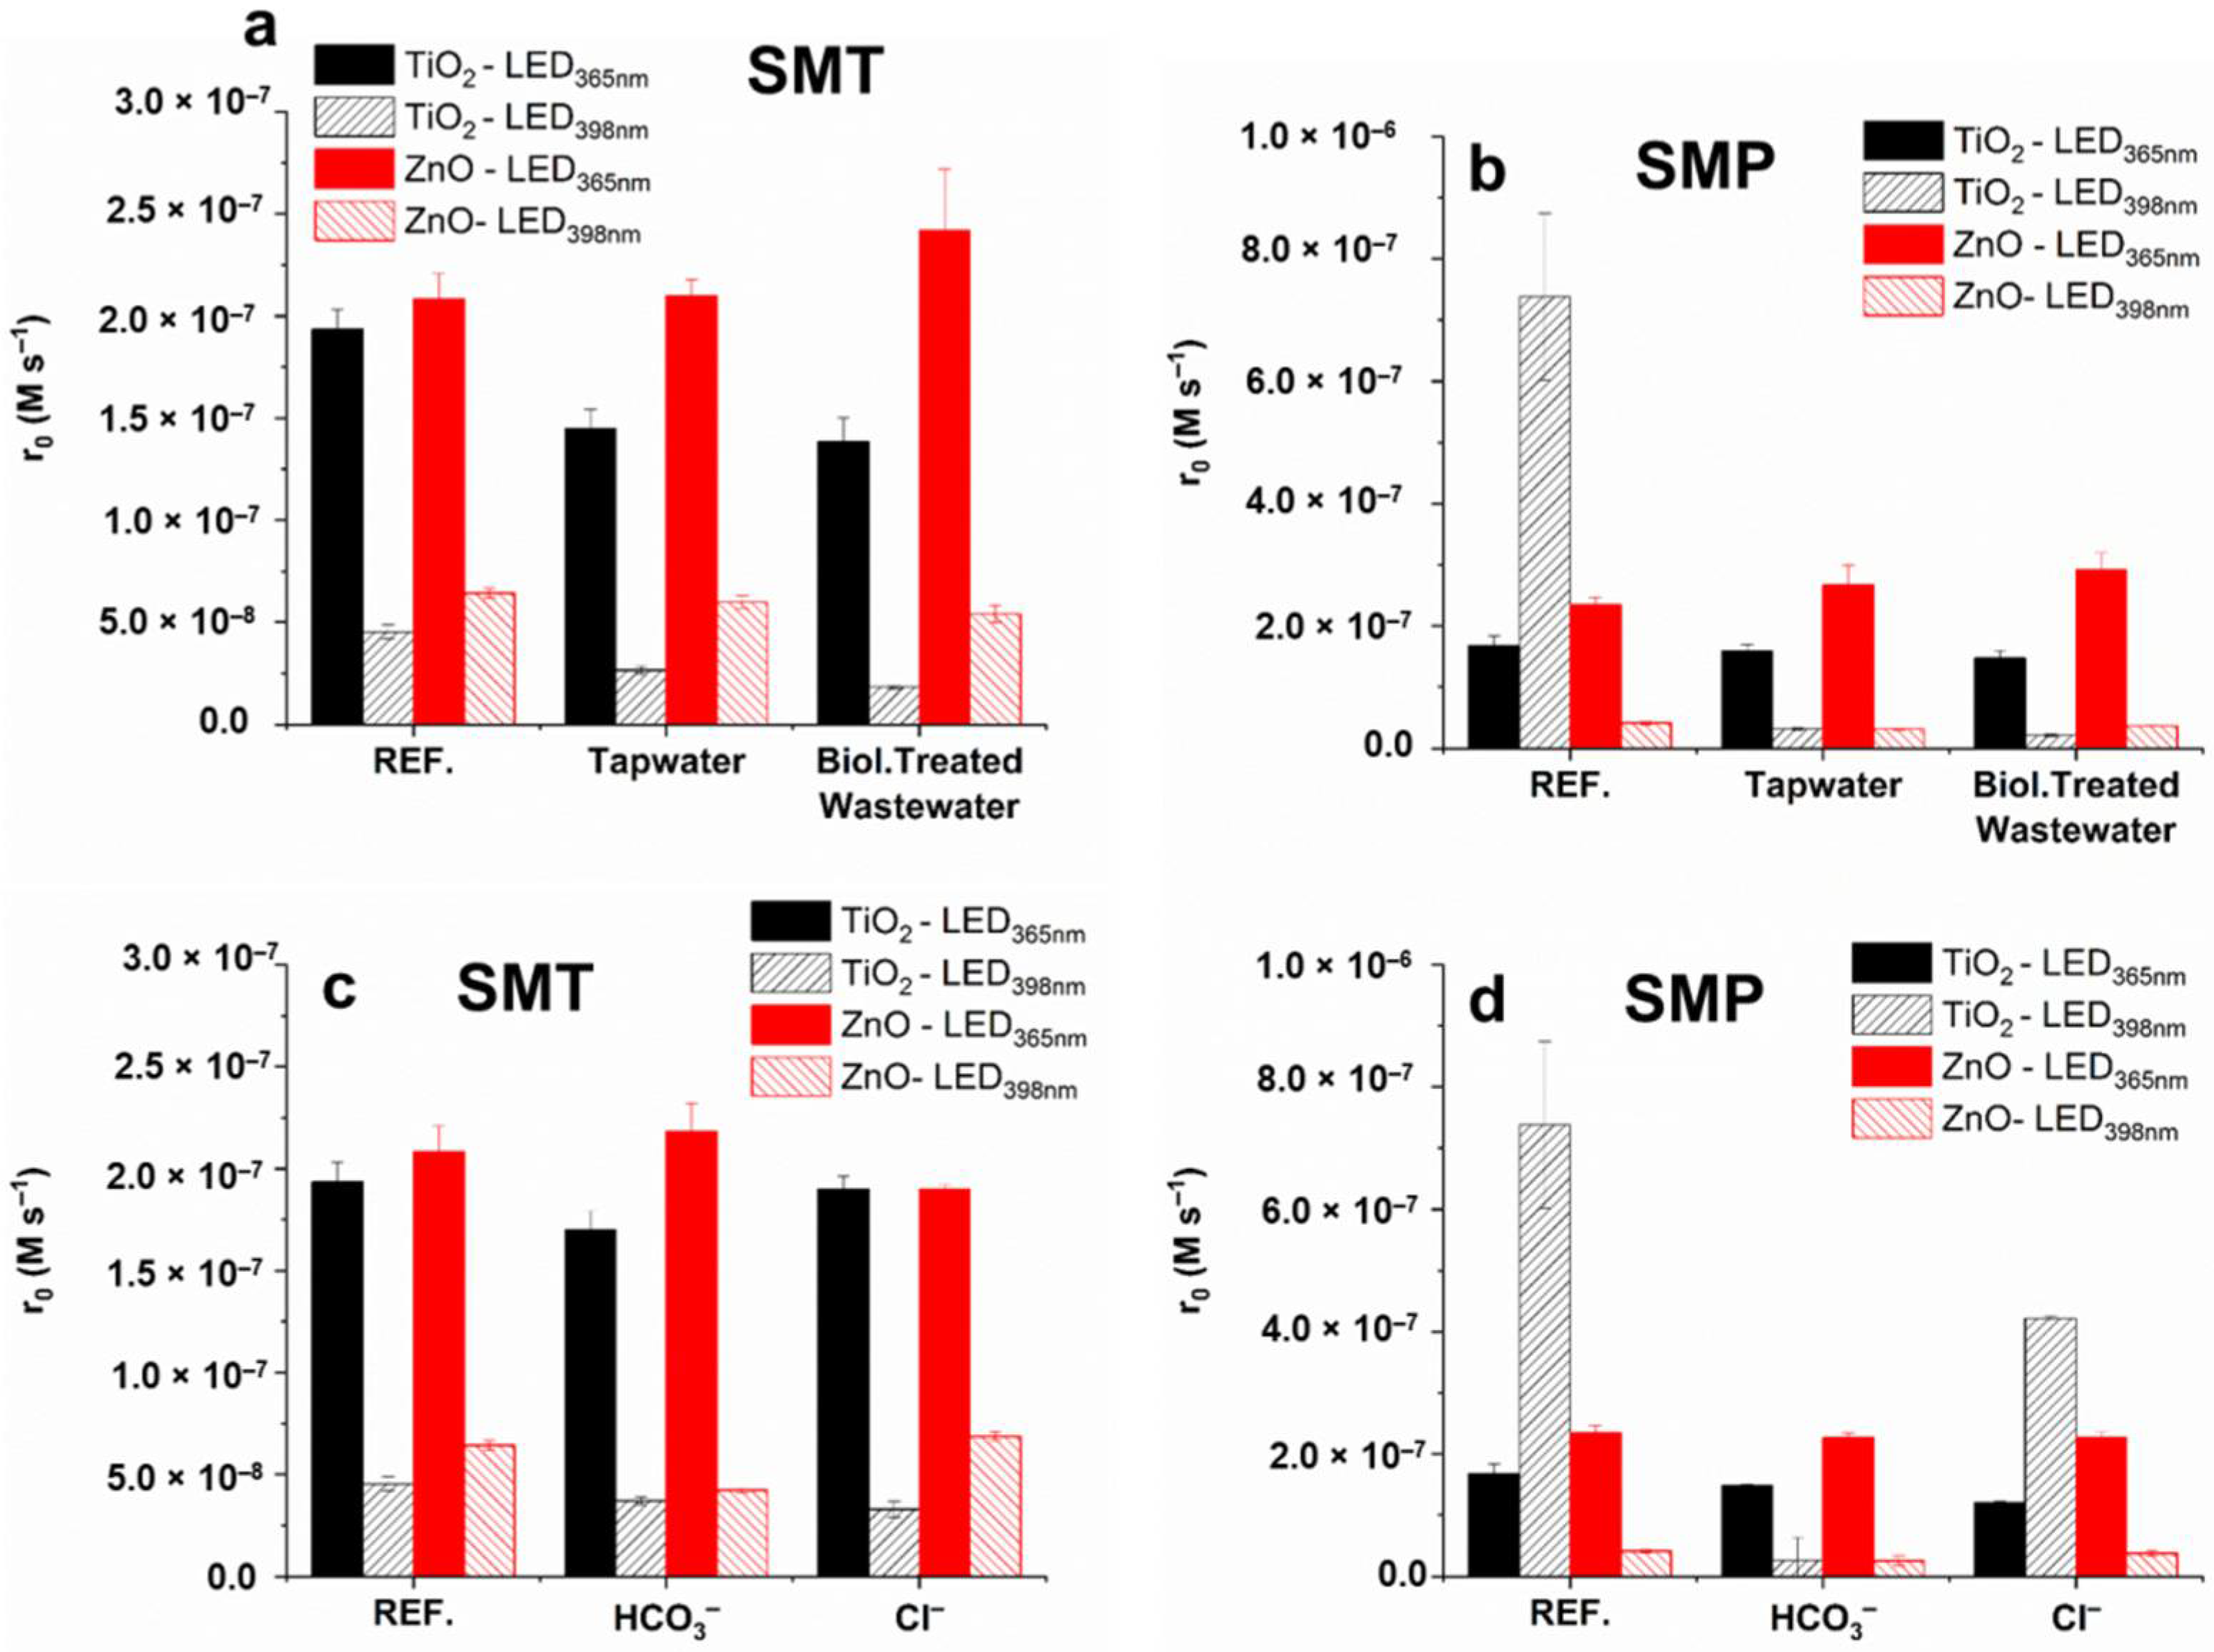
3.7. Effect of Matrices on the Removal of Sulfonamides

Experiments were performed with SMT and SMP in two water matrices: tapwater with a low organic and high inorganic content, and biologically treated and filtered domestic wastewater (BTWW) with higher organic and inorganic content (Table S2). For investigation of the inorganic components’ effect, transformation rates were determined in suspensions containing the two most abundant anions, Cl (120 mg dm−3) and HCO3 (525 mg dm−3). The concentration of the anions was set to the values measured in the biologically treated wastewater (Table S2).
For SMT, the inhibition effect of matrices was negligible when ZnO photocatalyst was applied, while for TiO2 decreased by 25 and 50% using LED365nm and LED398nm, respectively (Figure 10a,b). The negative effect of HCO3 was more pronounced for ZnO (decrease by 34%) than TiO2, while the effect of Cl is not significant (Figure 10a). A more enhanced inhibition by the matrices was observed in the case of LED398nm. For SMP, similar observations can be made, except TiO2/LED398nm, when both matrices and HCO3 inhibited the SMP transformation completely (Figure 10b,d). Even Cl is inhibited the conversion, while it had no effect in other cases (Figure 10d).
HCO3 is a well-known OH scavenger, but its reaction rate constant is relatively low (kHCO3 + OH = 1.0 × 10⁻⁷ M−1 s−1 [98]); therefore, it cannot effectively compete for OH with the sulfonamides. HCO3 also reported as an efficient scavenger of hVB+, resulting in the formation of carbonate radicals (CO3•−) [61,105] on the surface of TiO2. The formed CO3•− is a more selective oxidant than OH, but sulfonamides, especially SMP, are reported to react with it with a high reaction rate constant (kSMT + CO3•− = 4.37 × 10⁸ M−1 s−1, kSMP + CO3•− = 8.71 × 10⁸ M−1 s−1 [106]). The negligible effect of HCO3 during most of the measurements, and the relatively low effect of the matrices on the transformation rates might be due to the reaction of sulfonamides with formed CO3•−.
The Cl does not react with hVB+, and generally has a negligible effect on photocatalytic activity using TiO2 [61]. It may react with OH with a high reaction rate (k = 4.3 × 10⁹ M−1 s−1 [107]) to form chlorine radicals, but at neutral and alkaline pH the backward reaction leading to the reformation of OH is favored [62]. In the case of ZnO, adsorption of Cl on the surface can promote the separation of photogenerated charges, leading to higher photocatalytic efficiency [108]. Its significantly negative effect can be observed only for SMP, using TiO2/LED398nm process. The transformation of SMP using TiO2 and LED398nm is most likely caused by the energy transfer—with some contribution of the charge transition—which is especially sensitive to the surface conditions.

4. Conclusions

Heterogeneous photocatalysis is generally considered to be based primarily on electron transfer reactions at the surface of the irradiated semiconductor. Besides radical-based reactions and direct charge transfer, attention recently moved towards photocatalytic syntheses, requiring selective transformation. Some examples have been reported in the literature when the transformation is due to the energy transfer between excited semiconductor as energy donor, and results in selective transformation of organic substances.
The present work compares the efficiency of the commercially available photocatalysts, TiO2 and ZnO irradiated with 365 nm or 398 nm. Two sulfonamide antibiotics, SMT and SMP, were used to compare the efficiency of the photocatalysts under 398 and 365 nm radiation. The results showed that, besides OH-based reaction, the direct charge transfer contributes to the transformation even in the case of ZnO. Consequently, the transformation was faster when ZnO was applied; however, TiO2 was more efficient in mineralization. The unique behavior, an exceptionally fast transformation of SMP was observed, in the case of TiO2/LED398nm process, in contrast to the other cases when 365 nm light was more efficient than 398 nm light. The transformation of SMP was fast in both O2 containing and O2-free TiO2 suspensions and takes place via desulfonation, while in other cases, mainly hydroxylated products form. The effect of reaction parameters confirmed that a quite rarely observed direct energy transfer between the excited state P25 and SMP is likely responsible for this unique behavior; however, the role of direct charge transfer cannot be excluded completely.
Our results have highlighted that “non-conventional” mechanisms can occur in exceptional cases during heterogeneous photocatalysis (even in the case of the well-known photocatalyst, such as TiO2), and the effect of wavelength is also worth investigating. The presented results may contribute to further studies on the application of photocatalysts, either in the selective removal of organic pollutants or in the field of organic chemical synthesis.

Supplementary Materials

The following supporting information can be downloaded at: https://www.mdpi.com/article/10.3390/ma15010049/s1, Figure S1: The schematic figure of the photoreactors (a: LED365nm, b: LED398nm); Figure S2: The peak area (HPLC-DAD) of the products of SMT transformation as a function of irradiation time; Figure S3: The peak area (HPLC-DAD) of the products of SMP transformation as a function of irradiation time; Figure S4: The transformation of organic nitrogen and sulfur to inorganic ions during the photocatalytic removal of SMT (Mineralization(%) = concentration of given ion divided by the organic N-content or S-content of the starting solution); Figure S5: The transformation of organic nitrogen and sulfur to inorganic ions during the photocatalytic removal of SMP (Mineralization(%) = concentration of given ion divided by the organic N-content or S-content of the starting solution); Table S1: The list of used chemicals, their distributors and purity; Table S2: The measured, relevant parameters of the real water matrices.

Author Contributions

M.N.: experimental work, visualization, writing and editing the initial draft; L.F.: experimental work and editing; G.B.: ionchromatography measurement; G.K.: XRD and DRS measurement; K.H.: review and evaluation; T.A.: conceptualization; formulating and managing research goals and work, evaluating results, writing—review & editing. All authors have read and agreed to the published version of the manuscript.

Funding

Tünde Alapi acknowledges the support of the János Bolyai Research Scholarship of the Hungarian Academy of Sciences. The work was financed by the New National Excellence Program of the Ministry for Innovation and Technology (ÚNKP-21-4-SZTE-494, and ÚNKP-21-5-SZTE-594) and the National Research, Development and Innovation Office-NKFI Fund OTKA, project number FK132742.

Data Availability Statement

The data is included in the article or Supplementary Material.

Conflicts of Interest

The authors declare no conflict of interest.

References

  1. Tacconelli, E.; Carrara, E.; Savoldi, A.; Harbarth, S.; Mendelson, M.; Monnet, D.L.; Pulcini, C.; Kahlmeter, G.; Kluytmans, J.; Carmeli, Y.; et al. Discovery, Research, and Development of New Antibiotics: The WHO Priority List of Antibiotic-Resistant Bacteria and Tuberculosis. Lancet Infect. Dis. 2018, 18, 318–327. [Google Scholar] [CrossRef]
  2. Falowo, A.B.; Akimoladun, O.F. Veterinary drug residues in meat and meat products: Occurrence, detection and implications. In Veterinary Medicine and Pharmaceuticals; Bekoe, S.O., Saravanan, M., Eds.; IntechOpen: London, UK, 2020. [Google Scholar] [CrossRef] [Green Version]
  3. Tacic, A.; Nikolic, V.; Nikolic, L.; Savic, I. Antimicrobial Sulfonamide Drugs. Adv. Technol. 2017, 6, 58–71. [Google Scholar] [CrossRef] [Green Version]
  4. Klauson, D.; Romero Sarcos, N.; Krichevskaya, M.; Kattel, E.; Dulova, N.; Dedova, T.; Trapido, M. Advanced Oxidation Processes for Sulfonamide Antibiotic Sulfamethizole Degradation: Process Applicability Study at ppm Level and Scale-down to ppb Level. J. Environ. Chem. Eng. 2019, 7, 103287. [Google Scholar] [CrossRef]
  5. Wang, J.; Chu, L.; Wojnárovits, L.; Takács, E. Occurrence and Fate of Antibiotics, Antibiotic Resistant Genes (ARGs) and Antibiotic Resistant Bacteria (ARB) in Municipal Wastewater Treatment Plant: An Overview. Sci. Total Environ. 2020, 744, 140997. [Google Scholar] [CrossRef]
  6. Mendiola-Alvarez, S.Y.; Palomino-Cabello, C.; Hernández-Ramírez, A.; Turnes-Palomino, G.; Guzmán-Mar, J.L.; Hinojosa-Reyes, L. Coupled Heterogeneous Photocatalysis Using a P-TiO2-AFe2O3 Catalyst and K2S2O8 for the Efficient Degradation of a Sulfonamide Mixture. J. Photochem. Photobiol. A Chem. 2020, 394, 112485. [Google Scholar] [CrossRef]
  7. Li, P.; Guo, M.; Wang, Q.; Li, Z.; Wang, C.C.C.; Chen, N.; Wang, C.C.C.; Wan, C.; Chen, S. Controllable Synthesis of Cerium Zirconium Oxide Nanocomposites and Their Application for Photocatalytic Degradation of Sulfonamides. Appl. Catal. B Environ. 2019, 259, 118107. [Google Scholar] [CrossRef]
  8. Estrada-Flórez, S.E.; Serna-Galvis, E.A.; Torres-Palma, R.A. Photocatalytic vs. Sonochemical Removal of Antibiotics in Water: Structure-Degradability Relationship, Mineralization, Antimicrobial Activity, and Matrix Effects. J. Environ. Chem. Eng. 2020, 8, 104359. [Google Scholar] [CrossRef]
  9. Wu, C.H.; Kuo, C.Y.; Dong, C.D.; Chen, C.W.; Lin, Y.L. Removal of Sulfonamides from Wastewater in the UV/TiO2 System: Effects of PH and Salinity on Photodegradation and Mineralization. Water Sci. Technol. 2019, 79, 349–355. [Google Scholar] [CrossRef] [PubMed]
  10. Zhang, J.; Li, J.; Su, H.; Zhao, Y.; Zeng, X.; Hu, M.; Xiao, W.; Mao, X. H-Bonding Effect of Oxyanions Enhanced Photocatalytic Degradation of Sulfonamides by g-C3N4 in Aqueous Solution. J. Hazard. Mater. 2019, 366, 259–267. [Google Scholar] [CrossRef]
  11. Song, Y.; Tian, J.; Gao, S.; Shao, P.; Qi, J.; Cui, F. Photodegradation of Sulfonamides by G-C3N4 under Visible Light Irradiation: Effectiveness, Mechanism and Pathways. Appl. Catal. B Environ. 2017, 210, 88–96. [Google Scholar] [CrossRef]
  12. Chen, P.; Zhang, Q.; Zheng, X.; Tan, C.; Zhuo, M.; Chen, T.; Wang, F.; Liu, H.; Liu, Y.; Feng, Y.; et al. Phosphate-Modified m-Bi2O4 Enhances the Absorption and Photocatalytic Activities of Sulfonamide: Mechanism, Reactive Species, and Reactive Sites. J. Hazard. Mater. 2020, 384, 121443. [Google Scholar] [CrossRef]
  13. Wang, W.; Tian, J.; Zhu, Z.; Zhu, C.; Liu, B.; Hu, C. Insight into Quinolones and Sulfonamides Degradation, Intermediate Product Identification and Decomposition Pathways with the Assistance of Bi2MoO6/Bi2WO6/MWCNTs Photocatalyst. Process Saf. Environ. Prot. 2021, 147, 527–546. [Google Scholar] [CrossRef]
  14. Zhu, W.; Sun, F.; Goei, R.; Zhou, Y. Facile Fabrication of RGO-WO3 Composites for Effective Visible Light Photocatalytic Degradation of Sulfamethoxazole. Appl. Catal. B Environ. 2017, 207, 93–102. [Google Scholar] [CrossRef]
  15. Yang, C.C.; Huang, C.L.; Cheng, T.C.; Lai, H.T. Inhibitory Effect of Salinity on the Photocatalytic Degradation of Three Sulfonamide Antibiotics. Int. Biodeterior. Biodegrad. 2015, 102, 116–125. [Google Scholar] [CrossRef]
  16. Kaniou, S.; Pitarakis, K.; Barlagianni, I.; Poulios, I. Photocatalytic Oxidation of Sulfamethazine. Chemosphere 2005, 60, 372–380. [Google Scholar] [CrossRef] [PubMed]
  17. Baran, W.; Sochacka, J.; Wardas, W. Toxicity and Biodegradability of Sulfonamides and Products of Their Photocatalytic Degradation in Aqueous Solutions. Chemosphere 2006, 65, 1295–1299. [Google Scholar] [CrossRef]
  18. Ahmed, S.; Rasul, M.G.; Brown, R.; Hashib, M.A. Influence of Parameters on the Heterogeneous Photocatalytic Degradation of Pesticides and Phenolic Contaminants in Wastewater: A Short Review. J. Environ. Manag. 2011, 92, 311–330. [Google Scholar] [CrossRef] [PubMed] [Green Version]
  19. Younis, S.A.; Kim, K.H. Heterogeneous Photocatalysis Scalability for Environmental Remediation: Opportunities and Challenges. Catalysts 2020, 11, 1109. [Google Scholar] [CrossRef]
  20. Bellardita, M.; Ceccato, R.; Dirè, S.; Loddo, V.; Palmisano, L.; Parrino, F. Energy Transfer in Heterogeneous Photocatalysis. Subst. Int. J. Hist. Chem. 2019, 3, 49–57. [Google Scholar] [CrossRef]
  21. Nosaka, Y.; Daimon, T.; Nosaka, A.Y.; Murakami, Y. Singlet Oxygen Formation in Photocatalytic TiO2 Aqueous Suspension. Phys. Chem. Chem. Phys. 2004, 6, 2917–2918. [Google Scholar] [CrossRef]
  22. Jańczyk, A.; Krakowska, E.; Stochel, G.; Macyk, W. Singlet Oxygen Photogeneration at Surface Modified Titanium Dioxide. J. Am. Chem. Soc. 2006, 128, 15574–15575. [Google Scholar] [CrossRef] [PubMed]
  23. Buchalska, M.; Łabuz, P.; Bujak, Ł.; Szewczyk, G.; Sarna, T.; Maćkowski, S.; Macyk, W. New Insight into Singlet Oxygen Generation at Surface Modified Nanocrystalline TiO2– the Effect of near-Infrared Irradiation. J. Chem. Soc. Dalt. Trans. 2013, 42, 9468–9475. [Google Scholar] [CrossRef]
  24. Ciriminna, R.; Parrino, F.; De Pasquale, C.; Palmisano, L.; Pagliaro, M. Photocatalytic Partial Oxidation of Limonene to 1,2 Limonene Oxide. Chem. Commun. 2018, 54, 1008–1011. [Google Scholar] [CrossRef]
  25. Parrino, F.; Fidalgo, A.; Palmisano, L.; Ilharco, L.M.; Pagliaro, M.; Ciriminna, R. Polymers of Limonene Oxide and Carbon Dioxide: Polycarbonates of the Solar Economy. ACS Omega 2018, 3, 4884–4890. [Google Scholar] [CrossRef] [PubMed] [Green Version]
  26. Parrino, F.; Di Paola, A.; Loddo, V.; Pibiri, I.; Bellardita, M.; Palmisano, L. Photochemical and Photocatalytic Isomerization of Trans-Caffeic Acid and Cyclization of Cis-Caffeic Acid to Esculetin. Appl. Catal. B Environ. 2016, 182, 347–355. [Google Scholar] [CrossRef]
  27. Srikant, V.; Clarke, D.R. On the Optical Band Gap of Zinc Oxide. J. Appl. Phys. 1998, 83, 5447–5451. [Google Scholar] [CrossRef]
  28. Kafizas, A.; Wang, X.; Pendlebury, S.R.; Barnes, P.; Ling, M.; Sotelo-Vazquez, C.; Quesada-Cabrera, R.; Li, C.; Parkin, I.P.; Durrant, J.R. Where Do Photogenerated Holes Go in Anatase:Rutile TiO2? A Transient Absorption Spectroscopy Study of Charge Transfer and Lifetime. J. Phys. Chem. A 2016, 120, 715–723. [Google Scholar] [CrossRef]
  29. Rohilla, S.; Gupta, A.; Kumar, V.; Kumari, S.; Petru, M.; Amor, N.; Noman, M.T.; Dalal, J. Excellent Uv-light Triggered Photocatalytic Performance of Zno.SiO2 Nanocomposite for Water Pollutant Compound Methyl Orange Dye. Nanomaterials 2021, 11, 2548. [Google Scholar] [CrossRef] [PubMed]
  30. Ohno, T.; Sarukawa, K.; Tokieda, K.; Matsumura, M. Morphology of a TiO2 Photocatalyst (Degussa, P-25) Consisting of Anatase and Rutile Crystalline Phases. J. Catal. 2001, 203, 82–86. [Google Scholar] [CrossRef]
  31. Datye, A.K.; Riegel, G.; Bolton, J.R.; Huang, M.; Prairie, M.R. Microstructural Characterization of a Fumed Titanium Dioxide Photocatalyst. J. Solid State Chem. 1995, 115, 236–239. [Google Scholar] [CrossRef]
  32. Bickley, R.I.; Gonzalez-Carreno, T.; Lees, J.S.; Palmisano, L.; Tilley, R.J.D. A Structural Investigation of Titanium Dioxide Photocatalysts. J. Solid State Chem. 1991, 92, 178–190. [Google Scholar] [CrossRef]
  33. Hurum, D.C.; Agrios, A.G.; Gray, K.A.; Rajh, T.; Thurnauer, M.C. Explaining the Enhanced Photocatalytic Activity of Degussa P25 Mixed-Phase TiO2 Using EPR. J. Phys. Chem. B 2003, 107, 4545–4549. [Google Scholar] [CrossRef]
  34. MacDonald, I.R.; Howe, R.F.; Zhang, X.; Zhou, W. In Situ EPR Studies of Electron Trapping in a Nanocrystalline Rutile. J. Photochem. Photobiol. A Chem. 2010, 216, 238–243. [Google Scholar] [CrossRef]
  35. MacDonald, I.R.; Rhydderch, S.; Holt, E.; Grant, N.; Storey, J.M.D.; Howe, R.F. EPR Studies of Electron and Hole Trapping in Titania Photocatalysts. Catal. Today 2012, 182, 39–45. [Google Scholar] [CrossRef]
  36. Jiang, X.; Manawan, M.; Feng, T.; Qian, R.; Zhao, T.; Zhou, G.; Kong, F.; Wang, Q.; Dai, S.; Pan, J.H. Anatase and Rutile in Evonik Aeroxide P25: Heterojunctioned or Individual Nanoparticles? Catal. Today 2018, 300, 12–17. [Google Scholar] [CrossRef]
  37. Ohtani, B.; Prieto-Mahaney, O.O.; Li, D.; Abe, R. What Is Degussa (Evonic) P25? Crystalline Composition Analysis, Reconstruction from Isolated Pure Particles and Photocatalytic Activity Test. J. Photochem. Photobiol. A Chem. 2010, 216, 179–182. [Google Scholar] [CrossRef] [Green Version]
  38. Prieto-Mahaney, O.O.; Murakami, N.; Abe, R.; Ohtani, B. Correlation between Photoeatalytic Activities and Structural and Physical Properties of Titanium(IV) Oxide Powders. Chem. Lett. 2009, 38, 238–239. [Google Scholar] [CrossRef]
  39. Ide, Y.; Inami, N.; Hattori, H.; Saito, K.; Sohmiya, M.; Tsunoji, N.; Komaguchi, K.; Sano, T.; Bando, Y.; Golberg, D.; et al. Remarkable Charge Separation and Photocatalytic Efficiency Enhancement through Interconnection of TiO2 Nanoparticles by Hydrothermal Treatment. Angew. Chem. Int. Ed. 2016, 55, 3600–3605. [Google Scholar] [CrossRef]
  40. Zhang, H.; Chen, G.; Bahnemann, D.W. Photoelectrocatalytic Materials for Environmental Applications. J. Mater. Chem. 2009, 19, 5089–5121. [Google Scholar] [CrossRef]
  41. Deng, X.; Chen, Y.; Wen, J.; Xu, Y.; Zhu, J.; Bian, Z. Polyaniline-TiO2 Composite Photocatalysts for Light-Driven Hexavalent Chromium Ions Reduction. Sci. Bull. 2020, 65, 105–112. [Google Scholar] [CrossRef] [Green Version]
  42. Tang, B.; Chen, H.; Peng, H.; Wang, Z.; Huang, W. Graphene Modified TiO2 Composite Photocatalysts: Mechanism, Progress and Perspective. Nanomaterials 2018, 8, 105. [Google Scholar] [CrossRef] [Green Version]
  43. Qin, R.; Meng, F.; Khan, M.W.; Yu, B.; Li, H.; Fan, Z.; Gong, J. Fabrication and Enhanced Photocatalytic Property of TiO2-ZnO Composite Photocatalysts. Mater. Lett. 2019, 240, 84–87. [Google Scholar] [CrossRef]
  44. Kumari, S.; Malik, S.; Kumar, S.; Dalal, J.; Dahiya, S.; Ohlan, A.; Punia, R.; Maan, A.S. Excellent Photoelectrical Properties of ZnO Thin Film Based on ZnO /Epoxy-Resin Ink for UV-Light Detectors. AIP Conf. Proc. 2019, 2142, 120004. [Google Scholar] [CrossRef]
  45. Dossin Zanrosso, C.; Piazza, D.; Lansarin, M.A. PVDF/ZnO Composite Films for Photocatalysis: A Comparative Study of Solution Mixing and Melt Blending Methods. Polym. Eng. Sci. 2020, 60, 1146–1157. [Google Scholar] [CrossRef]
  46. Mirikaram, N.; Pérez-molina, Á.; Morales-torres, S.; Salemi, A.; Maldonado-hódar, F.J.; Pastrana-martínez, L.M. Photocatalytic Perfomance of Zno-graphene Oxide Composites towards the Degradation of Vanillic Acid under Solar Radiation and Visibleled. Nanomaterials 2021, 11, 1576. [Google Scholar] [CrossRef]
  47. Raha, S.; Mohanta, D.; Ahmaruzzaman, M. Novel CuO/Mn3O4/ZnO Nanocomposite with Superior Photocatalytic Activity for Removal of Rabeprazole from Water. Sci. Rep. 2021, 11, 15187. [Google Scholar] [CrossRef] [PubMed]
  48. Thangadurai, P.; Beura, R.; Kumar, J.S. Nanomaterials with different morphologies for photocatalysis. In Green Photocatalysts; Naushad, M., Rajendran, S., Lichfouse, E., Eds.; Springer: Berlin/Heidelberg, Germany, 2020; ISBN 9783540228608. [Google Scholar]
  49. Yang, H.; Li, G.; An, T.; Gao, Y.; Fu, J. Photocatalytic Degradation Kinetics and Mechanism of Environmental Pharmaceuticals in Aqueous Suspension of TiO2: A Case of Sulfa Drugs. Catal. Today 2010, 153, 200–207. [Google Scholar] [CrossRef]
  50. Mirzaei, A.; Yerushalmi, L.; Chen, Z.; Haghighat, F.; Guo, J. Enhanced Photocatalytic Degradation of Sulfamethoxazole by Zinc Oxide Photocatalyst in the Presence of Fluoride Ions: Optimization of Parameters and Toxicological Evaluation. Water Res. 2018, 132, 241–251. [Google Scholar] [CrossRef] [PubMed]
  51. Náfrádi, M.; Hernadi, K.; Kónya, Z.; Alapi, T. Investigation of the Efficiency of BiOI/BiOCl Composite Photocatalysts Using UV, Cool and Warm White LED Light Sources-Photon Efficiency, Toxicity, Reusability, Matrix Effect, and Energy Consumption. Chemosphere 2021, 280, 130636. [Google Scholar] [CrossRef] [PubMed]
  52. Khan, J.A.; Sayed, M.; Khan, S.; Shah, N.S.; Dionysiou, D.D.; Boczkaj, G. Advanced oxidation processes for the treatment of contaminants of emerging concern. In Contaminants of Emerging Concern in Water and Wastewater; Hernandez-Maldonado, A., Blaney, L., Eds.; Elsevier Inc.: Amsterdam, The Netherlands, 2019; ISBN 9780128135617. [Google Scholar]
  53. Bertagna Silva, D.; Buttiglieri, G.; Babić, S. State-of-the-Art and Current Challenges for TiO2/UV-LED Photocatalytic Degradation of Emerging Organic Micropollutants. Environ. Sci. Pollut. Res. 2021, 28, 103–120. [Google Scholar] [CrossRef] [PubMed]
  54. Jo, W.K.; Tayade, R.J. New Generation Energy-Efficient Light Source for Photocatalysis: LEDs for Environmental Applications. Ind. Eng. Chem. Res. 2014, 53, 2073–2084. [Google Scholar] [CrossRef]
  55. Tokode, O.; Prabhu, R.; Lawton, L.A.; Robertson, P.K.J. UV LED Sources for Heterogeneous Photocatalysis. Handb. Environ. Chem. 2015, 35, 159–179. [Google Scholar] [CrossRef] [Green Version]
  56. Eskandarian, M.R.; Choi, H.; Fazli, M.; Rasoulifard, M.H. Effect of UV-LED Wavelengths on Direct Photolytic and TiO2 Photocatalytic Degradation of Emerging Contaminants in Water. Chem. Eng. J. 2016, 300, 414–422. [Google Scholar] [CrossRef]
  57. Biancullo, F.; Moreira, N.F.F.; Ribeiro, A.R.; Manaia, C.M.; Faria, J.L.; Nunes, O.C.; Castro-Silva, S.M.; Silva, A.M.T. Heterogeneous Photocatalysis Using UVA-LEDs for the Removal of Antibiotics and Antibiotic Resistant Bacteria from Urban Wastewater Treatment Plant Effluents. Chem. Eng. J. 2019, 367, 304–313. [Google Scholar] [CrossRef]
  58. Takeda, K.; Fujisawa, K.; Nojima, H.; Kato, R.; Ueki, R.; Sakugawa, H. Hydroxyl Radical Generation with a High Power Ultraviolet Light Emitting Diode (UV-LED) and Application for Determination of Hydroxyl Radical Reaction Rate Constants. J. Photochem. Photobiol. A Chem. 2017, 340, 8–14. [Google Scholar] [CrossRef]
  59. Taghavi, M.; Ghaneian, M.T.; Ehrampoush, M.H.; Tabatabaee, M.; Afsharnia, M.; Alami, A.; Mardaneh, J. Feasibility of Applying the LED-UV-Induced TiO2/ZnO-Supported H3PMo12O40 Nanoparticles in Photocatalytic Degradation of Aniline. Environ. Monit. Assess. 2018, 190, 188. [Google Scholar] [CrossRef] [PubMed]
  60. Khademalrasool, M.; Farbod, M.; Talebzadeh, M.D. The Improvement of Photocatalytic Processes: Design of a Photoreactor Using High-Power LEDs. J. Sci. Adv. Mater. Devices 2016, 1, 382–387. [Google Scholar] [CrossRef] [Green Version]
  61. Farner Budarz, J.; Turolla, A.; Piasecki, A.F.; Bottero, J.Y.; Antonelli, M.; Wiesner, M.R. Influence of Aqueous Inorganic Anions on the Reactivity of Nanoparticles in TiO2 Photocatalysis. Langmuir 2017, 33, 2770–2779. [Google Scholar] [CrossRef] [PubMed]
  62. Bouanimba, N.; Laid, N.; Zouaghi, R.; Sehili, T. A Comparative Study of the Activity of TiO2 Degussa P25 and Millennium PCs in the Photocatalytic Degradation of Bromothymol Blue. Int. J. Chem. React. Eng. 2018, 16, 1–19. [Google Scholar] [CrossRef]
  63. Serrà, A.; Philippe, L.; Perreault, F.; Garcia-Segura, S. Photocatalytic Treatment of Natural Waters. Reality or Hype? The Case of Cyanotoxins Remediation. Water Res. 2021, 188, 116543. [Google Scholar] [CrossRef]
  64. Tufail, A.; Price, W.E.; Mohseni, M.; Pramanik, B.K.; Hai, F.I. A Critical Review of Advanced Oxidation Processes for Emerging Trace Organic Contaminant Degradation: Mechanisms, Factors, Degradation Products, and Effluent Toxicity. J. Water Process Eng. 2021, 40, 101778. [Google Scholar] [CrossRef]
  65. Kudlek, E.; Dudziak, M.; Bohdziewicz, J. Influence of Inorganic Ions and Organic Substances on the Degradation of Pharmaceutical Compound in Water Matrix. Water 2016, 8, 532. [Google Scholar] [CrossRef] [Green Version]
  66. Guillard, C.; Puzenat, E.; Lachheb, H.; Houas, A.; Herrmann, J.M. Why Inorganic Salts Decrease the TiO2 Photocatalytic Efficiency. Int. J. Photoenergy 2005, 7, 641208. [Google Scholar] [CrossRef] [Green Version]
  67. Šojić Merkulov, D.V.; Lazarević, M.J.; Despotović, V.N.; Banić, N.D.; Finčur, N.L.; Maletić, S.P.; Abramović, B.F. The Effects of Inorganic Anions and Organic Matter on Mesotrione (Callisto®) Removal from Environmental Waters. J. Serbian Chem. Soc. 2017, 82, 343–355. [Google Scholar] [CrossRef]
  68. Lado Ribeiro, A.R.; Moreira, N.F.F.; Li Puma, G.; Silva, A.M.T. Impact of Water Matrix on the Removal of Micropollutants by Advanced Oxidation Technologies. Chem. Eng. J. 2019, 363, 155–173. [Google Scholar] [CrossRef] [Green Version]
  69. Hatchard, C.G.; Parker, C.A. A New Sensitive Chemical Actinometer-II. Potassium Ferrioxalate as a Standard Chemical Actinometer. Proc. R. Soc. London Ser. A Math. Phys. Sci. 1956, 235, 518–536. [Google Scholar] [CrossRef]
  70. Zuccheri, T.; Colonna, M.; Stefanini, I.; Santini, C.; Di Gioia, D. Bactericidal Activity of Aqueous Acrylic Paint Dispersion for Wooden Substrates Based on TiO2 Nanoparticles Activated by Fluorescent Light. Materials 2013, 6, 3270–3283. [Google Scholar] [CrossRef]
  71. Hassellöv, M.; Readman, J.W.; Ranville, J.F.; Tiede, K. Nanoparticle Analysis and Characterization Methodologies in Environmental Risk Assessment of Engineered Nanoparticles. Ecotoxicology 2008, 17, 344–361. [Google Scholar] [CrossRef]
  72. White, L.; Koo, Y.; Yun, Y.; Sankar, J. TiO2 Deposition on AZ31 Magnesium Alloy Using Plasma Electrolytic Oxidation. J. Nanomater. 2013, 2013, 11. [Google Scholar] [CrossRef] [Green Version]
  73. Thamaphat, K.; Limsuwan, P.; Ngotawornchai, B. Phase Characterization of TiO2 Powder by XRD and TEM. Agric. Nat. Resour. 2008, 42, 357–361. [Google Scholar]
  74. Arefi, M.R.; Rezaei-Zarchi, S. Synthesis of Zinc Oxide Nanoparticles and Their Effect on the Compressive Strength and Setting Time of Self-Compacted Concrete Paste as Cementitious Composites. Int. J. Mol. Sci. 2012, 13, 4340–4350. [Google Scholar] [CrossRef]
  75. Yi, Z.; Wang, J.; Jiang, T.; Tang, Q.; Cheng, Y. Photocatalytic Degradation of Sulfamethazine in Aqueous Solution Using Zno with Different Morphologies. R. Soc. Open Sci. 2018, 5, 171457. [Google Scholar] [CrossRef] [Green Version]
  76. Zhu, G.; Sun, Q.; Wang, C.; Yang, Z.; Xue, Q. Removal of Sulfamethoxazole, Sulfathiazole and Sulfamethazine in Their Mixed Solution by UV/H2O2 Process. Int. J. Environ. Res. Public Health 2019, 16, 1797. [Google Scholar] [CrossRef] [PubMed] [Green Version]
  77. Shah, S.; Hao, C. Quantum Chemical Investigation on Photodegradation Mechanisms of Sulfamethoxypyridazine with Dissolved Inorganic Matter and Hydroxyl Radical. J. Environ. Sci. 2017, 57, 85–92. [Google Scholar] [CrossRef]
  78. Guo, C.; Xu, J.; Wang, S.; Zhang, Y.; He, Y.; Li, X. Photodegradation of Sulfamethazine in an Aqueous Solution by a Bismuth Molybdate Photocatalyst. Catal. Sci. Technol. 2013, 3, 1603–1611. [Google Scholar] [CrossRef]
  79. Yang, L.; Shi, Y.; Li, J.; Fang, L.; Luan, T. Transformation of Aqueous Sulfonamides under Horseradish Peroxidase and Characterization of Sulfur Dioxide Extrusion Products from Sulfadiazine. Chemosphere 2018, 200, 164–172. [Google Scholar] [CrossRef]
  80. Boreen, A.L.; Arnold, W.A.; McNeill, K. Triplet-Sensitized Photodegradation of Sulfa Drugs Containing Six-Membered Heterocyclic Groups: Identification of an SO2 Extrusion Photoproduct. Environ. Sci. Technol. 2005, 39, 3630–3638. [Google Scholar] [CrossRef]
  81. Ge, L.; Zhang, P.; Halsall, C.; Li, Y.; Chen, C.E.; Li, J.; Sun, H.; Yao, Z. The Importance of Reactive Oxygen Species on the Aqueous Phototransformation of Sulfonamide Antibiotics: Kinetics, Pathways, and Comparisons with Direct Photolysis. Water Res. 2019, 149, 243–250. [Google Scholar] [CrossRef]
  82. Park, S.; Kim, H.J.; Kim, J.S.; Yoo, K.; Lee, J.C.; Anderson, W.A.; Lee, J.H. Photocatalytic Reduction of Nitrate in Wastewater Using ZnO Nanopowder Synthesized by Solution Combustion Method. J. Nanosci. Nanotechnol. 2007, 7, 4069–4072. [Google Scholar] [CrossRef] [PubMed]
  83. Løgager, T.; Sehested, K. Formation and Decay of Peroxynitric Acid: A Pulse Radiolysis Study. J. Phys. Chem. 1993, 97, 10047–10052. [Google Scholar] [CrossRef]
  84. Náfrádi, M.; Farkas, L.; Alapi, T.; Hernádi, K.; Kovács, K.; Wojnárovits, L.; Takács, E. Application of Coumarin and Coumarin-3-Carboxylic Acid for the Determination of Hydroxyl Radicals during Different Advanced Oxidation Processes. Radiat. Phys. Chem. 2020, 170, 108610. [Google Scholar] [CrossRef]
  85. Ishibashi, K.I.; Fujishima, A.; Watanabe, T.; Hashimoto, K. Detection of Active Oxidative Species in TiO2 Photocatalysis Using the Fluorescence Technique. Electrochem. Commun. 2000, 2, 207–210. [Google Scholar] [CrossRef]
  86. Zhang, J.; Nosaka, Y. Quantitative Detection of OH Radicals for Investigating the Reaction Mechanism of Various Visible-Light TiO2 Photocatalysts in Aqueous Suspension. J. Phys. Chem. C 2013, 117, 1383–1391. [Google Scholar] [CrossRef]
  87. Zhang, J.; Nosaka, Y. Generation of OH Radicals and Oxidation Mechanism in Photocatalysis of WO3 and BiVO4 Powders. J. Photochem. Photobiol. A Chem. 2015, 303–304, 53–58. [Google Scholar] [CrossRef]
  88. Černigoj, U.; Štangar, U.L.; Trebše, P.; Sarakha, M. Determination of Catalytic Properties of TiO2 Coatings Using Aqueous Solution of Coumarin: Standardization Efforts. J. Photochem. Photobiol. A Chem. 2009, 201, 142–150. [Google Scholar] [CrossRef]
  89. Baxter, J.B.; Schmuttenmaer, C.A. Conductivity of ZnO Nanowires, Nanoparticles, and Thin Films Using Time-Resolved Terahertz Spectroscopy. J. Phys. Chem. B 2006, 110, 25229–25239. [Google Scholar] [CrossRef] [PubMed]
  90. Meulenkamp, E.A. Electron Transport in Nanoparticulate ZnO Films. J. Phys. Chem. B 1999, 103, 7831–7838. [Google Scholar] [CrossRef]
  91. Sachs, M.; Pastor, E.; Kafizas, A.; Durrant, J.R. Evaluation of Surface State Mediated Charge Recombination in Anatase and Rutile TiO2. J. Phys. Chem. Lett. 2016, 7, 3742–3746. [Google Scholar] [CrossRef] [Green Version]
  92. Tang, J.; Durrant, J.R.; Klug, D.R. Mechanism of Photocatalytic Water Splitting in TiO2. Reaction of Water with Photoholes, Importance of Charge Carrier Dynamics, and Evidence for Four-Hole Chemistry. J. Am. Chem. Soc. 2008, 130, 13885–13891. [Google Scholar] [CrossRef] [PubMed]
  93. Fónagy, O.; Szabó-Bárdos, E.; Horváth, O. 1,4-Benzoquinone and 1,4-Hydroquinone Based Determination of Electron and Superoxide Radical Formed in Heterogeneous Photocatalytic Systems. J. Photochem. Photobiol. A Chem. 2021, 407, 113057. [Google Scholar] [CrossRef]
  94. Henderson, M.A.; Shen, M. Electron-Scavenging Chemistry of Benzoquinone on TiO2(110). Top. Catal. 2017, 60, 440–445. [Google Scholar] [CrossRef]
  95. Adams, G.E.; Michael, B.D. Pulse Radiolysis of Benzoquinone and Hydroquinone. Semiquinone Formation by Water Elimination from Trihydroxycyclohexadienyl Radicals. Trans. Faraday Soc. 1967, 63, 1171–1180. [Google Scholar] [CrossRef]
  96. Al-Suhybani, A.A.; Hughes, G. Pulse Radiolysis of Hydroquinone Solutions in the Presence of N2O and O2. Isot. Isot. Environ. Heal. Stud. 1985, 21, 208–210. [Google Scholar] [CrossRef]
  97. Mezyk, S.P.; Neubauer, T.J.; Cooper, W.J.; Peller, J.R. Free-Radical-Induced Oxidative and Reductive Degradation of Sulfa Drugs in Water: Absolute Kinetics and Efficiencies of Hydroxyl Radical and Hydrated Electron Reactions. J. Phys. Chem. A 2007, 111, 9019–9024. [Google Scholar] [CrossRef]
  98. Buxton, G.V.; Greenstock, C.L.; Helman, W.P.; Ross, A.B. Critical Review of Rate Constants for Reactions of Hydrated Electrons, Hydrogen Atoms and Hydroxyl Radicals (OH/O−in Aqueous Solution. J. Phys. Chem. Ref. Data 1988, 17, 513–886. [Google Scholar] [CrossRef] [Green Version]
  99. Nguyen, V.N.H.; Amal, R.; Beydoun, D. Effect of Formate and Methanol on Photoreduction/Removal of Toxic Cadmium Ions Using TiO2 Semiconductor as Photocatalyst. Chem. Eng. Sci. 2003, 58, 4429–4439. [Google Scholar] [CrossRef]
  100. Zhang, J.; Nosaka, Y. Photocatalytic Oxidation Mechanism of Methanol and the Other Reactants in Irradiated TiO2 Aqueous Suspension Investigated by OH Radical Detection. Appl. Catal. B Environ. 2015, 166–167, 32–36. [Google Scholar] [CrossRef]
  101. Baltrusaitis, J.; Jayaweera, P.M.; Grassian, V.H. Sulfur Dioxide Adsorption on TiO2 Nanoparticles: Influence of Particle Size, Coadsorbates, Sample Pretreatment, and Light on Surface Speciation and Surface Coverage. J. Phys. Chem. C 2011, 115, 492–500. [Google Scholar] [CrossRef]
  102. Langhammer, D.; Kullgren, J.; Österlund, L. Photoinduced Adsorption and Oxidation of SO2on Anatase TiO2(101). J. Am. Chem. Soc. 2020, 142, 21767–21774. [Google Scholar] [CrossRef]
  103. Mi, Y.; Weng, Y. Band Alignment and Controllable Electron Migration between Rutile and Anatase TiO2. Sci. Rep. 2015, 5, 11482. [Google Scholar] [CrossRef] [PubMed] [Green Version]
  104. Nosaka, Y.; Nosaka, A.Y. Reconsideration of Intrinsic Band Alignments within Anatase and Rutile TiO2. J. Phys. Chem. Lett. 2016, 7, 431–434. [Google Scholar] [CrossRef] [PubMed]
  105. Kaabeche, O.N.E.H.; Zouaghi, R.; Boukhedoua, S.; Bendjabeur, S.; Sehili, T. A Comparative Study on Photocatalytic Degradation of Pyridinium-Based Ionic Liquid by TiO2 and ZnO in Aqueous Solution. Int. J. Chem. React. Eng. 2019, 17, 11482. [Google Scholar] [CrossRef]
  106. Wojnárovits, L.; Takács, E. Rate Constants of Sulfate Radical Anion Reactions with Organic Molecules: A Review. Chemosphere 2019, 220, 1014–1032. [Google Scholar] [CrossRef]
  107. Jayson, G.G.; Parsons, B.J.; Swallow, A.J. Some Simple, Highly Reactive, Inorganic Chlorne Derivatives in Aqueous Solution. J. Chem. Soc. Faraday Trans. 1 Phys. Chem. Condens. Phases 1973, 69, 1597–1607. [Google Scholar]
  108. Maji, T.K.; Bagchi, D.; Kar, P.; Karmakar, D.; Pal, S.K. Enhanced Charge Separation through Modulation of Defect-State in Wide Band-Gap Semiconductor for Potential Photocatalysis Application: Ultrafast Spectroscopy and Computational Studies. J. Photochem. Photobiol. A Chem. 2017, 332, 391–398. [Google Scholar] [CrossRef]
Figure 1. The UV-Vis emission spectra of the LEDs (a), the diffuse reflectance spectra and bandgap energies of TiO2 and ZnO (b), and the Tauc plot originated from DRS spectra for calculation of band gap energies of TiO2 (c) and ZnO (d).
Materials 15 00049 g001
Figure 2. The N2 adsorption-desorption isotherms (a) with corresponding pore-size distribution according to the BJH model (inset), and the XRD patterns of TiO2 and ZnO (b).
Materials 15 00049 g002
Figure 3. The effect of photocatalyst concentration on the initial transformation rate of SMT (a) and SMP (b).
Materials 15 00049 g003
Figure 4. The concentration and TOC content of SMT (a,c) and SMP (b,d) during treatments.
Materials 15 00049 g004
Figure 5. The proposed primary stable products of SMT and SMP transformation during heterogeneous photocatalysis.
Materials 15 00049 g005
Figure 6. Change of ecotoxicity of the SMT (a) and SMP (b) solutions as a function of treatment time.
Materials 15 00049 g006
Figure 7. The concentration of COU and 7-HC (a,b) in aerated suspensions and the concentration of 1,4-BQ and 1,4-H2Q (c,d) in oxygen-free suspensions ((a,c): LED365nm; (b,d): LED398nm).
Materials 15 00049 g007
Figure 8. The effect of 2.5 × 10⁻³ M MeOH on the initial transformation rate of SMT (a) and SMP (b).
Materials 15 00049 g008
Figure 9. The concentration of SMP in aerated and O2-free suspensions using different TiO2 photocatalysts and LED398nm.
Materials 15 00049 g009
Figure 10. The initial reaction rates of SMT (a,c) and SMP (b,d) determined in purified water (REF), real water matrices (tapwater and biologically treated domestic wastewater), and in the presence of Cl (120 mg dm−3) and HCO3 (525 mg dm−3).
Materials 15 00049 g010
Table 1. The initial transformation rates of SMT and SMP and the apparent quantum efficiencies (Φ) of the related processes.
TiO2ZnO
SMTSMPSMTSMP
r0SMT
(mol dm−3 s−1)
ΦSMTr0SMP
(mol dm−3 s−1)
ΦSMPr0 SMT
(mol dm−3 s−1)
ΦSMTr0SMP
(mol dm−3 s−1)
ΦSMP
LED365nm1.93 × 10−77.0 × 10−31.68 × 10−76.1 × 10−32.08 × 10−77.6 × 10−32.35 × 10−78.5 × 10⁻³
LED398nm4.53 × 10−89.7 × 10−47.38 × 10−71.6 × 10−26.43 × 10−81.4 × 10−34.12 × 10−88.8 × 10⁻⁴
Table 2. The initial transformation rates of target substances (r0COU and r01,4-BQ), the initial formation rate of their primary products (r07-HC and r01,4-H2Q), and the apparent quantum efficiency (Φ) of the related processes.
TiO2ZnO
COU → 7-HC
r0COU
(mol dm−3 s−1)
ΦCOUr07-HC
(mol dm−3 s−1)
Φ7-HCr0COU
(mol dm−3 s−1)
ΦCOUr07-HC
(mol dm−3 s−1)
Φ7-HC
LED365nm1.53 × 10−75.5 × 10−34.1 × 10−91.5 × 10−41.54 × 10−73.2 × 10−32.88 × 10−90.6 × 10⁻⁴
LED398nm3.80 × 10−80.8 × 10−31.5 × 10−90.3 × 10−45.18 × 10−81.1 × 10−31.29 × 10−90.3 × 10⁻⁴
1,4-BQ → 1,4-H2Q
r0BQ
(mol dm−3 s−1)
Φ1,4-BQr01,4-H2Q
(mol dm−3 s−1)
Φ1,4-H2Qr0BQ
(mol dm−3 s−1)
Φ1,4-BQr01,4-H2Q
(mol dm−3 s−1)
Φ1,4-H2Q
LED365nm2.78 × 10−61.0 × 10−12.61 × 10−69.5 × 10−23.12 × 10−61.1 × 10−12.47 × 10−68.9 × 10⁻²
LED398nm8.88 × 10−71.9 × 10−27.61 × 10−71.5 × 10−21.19 × 10−62.6 × 10−28.07 × 10−71.7 × 10⁻²
Publisher’s Note: MDPI stays neutral with regard to jurisdictional claims in published maps and institutional affiliations.

