Change of Acoustic Emission Characteristics during Temperature Induced Transition from Twinning to Dislocation Slip under Compression in Polycrystalline Sn


Abstract
:1. Introduction
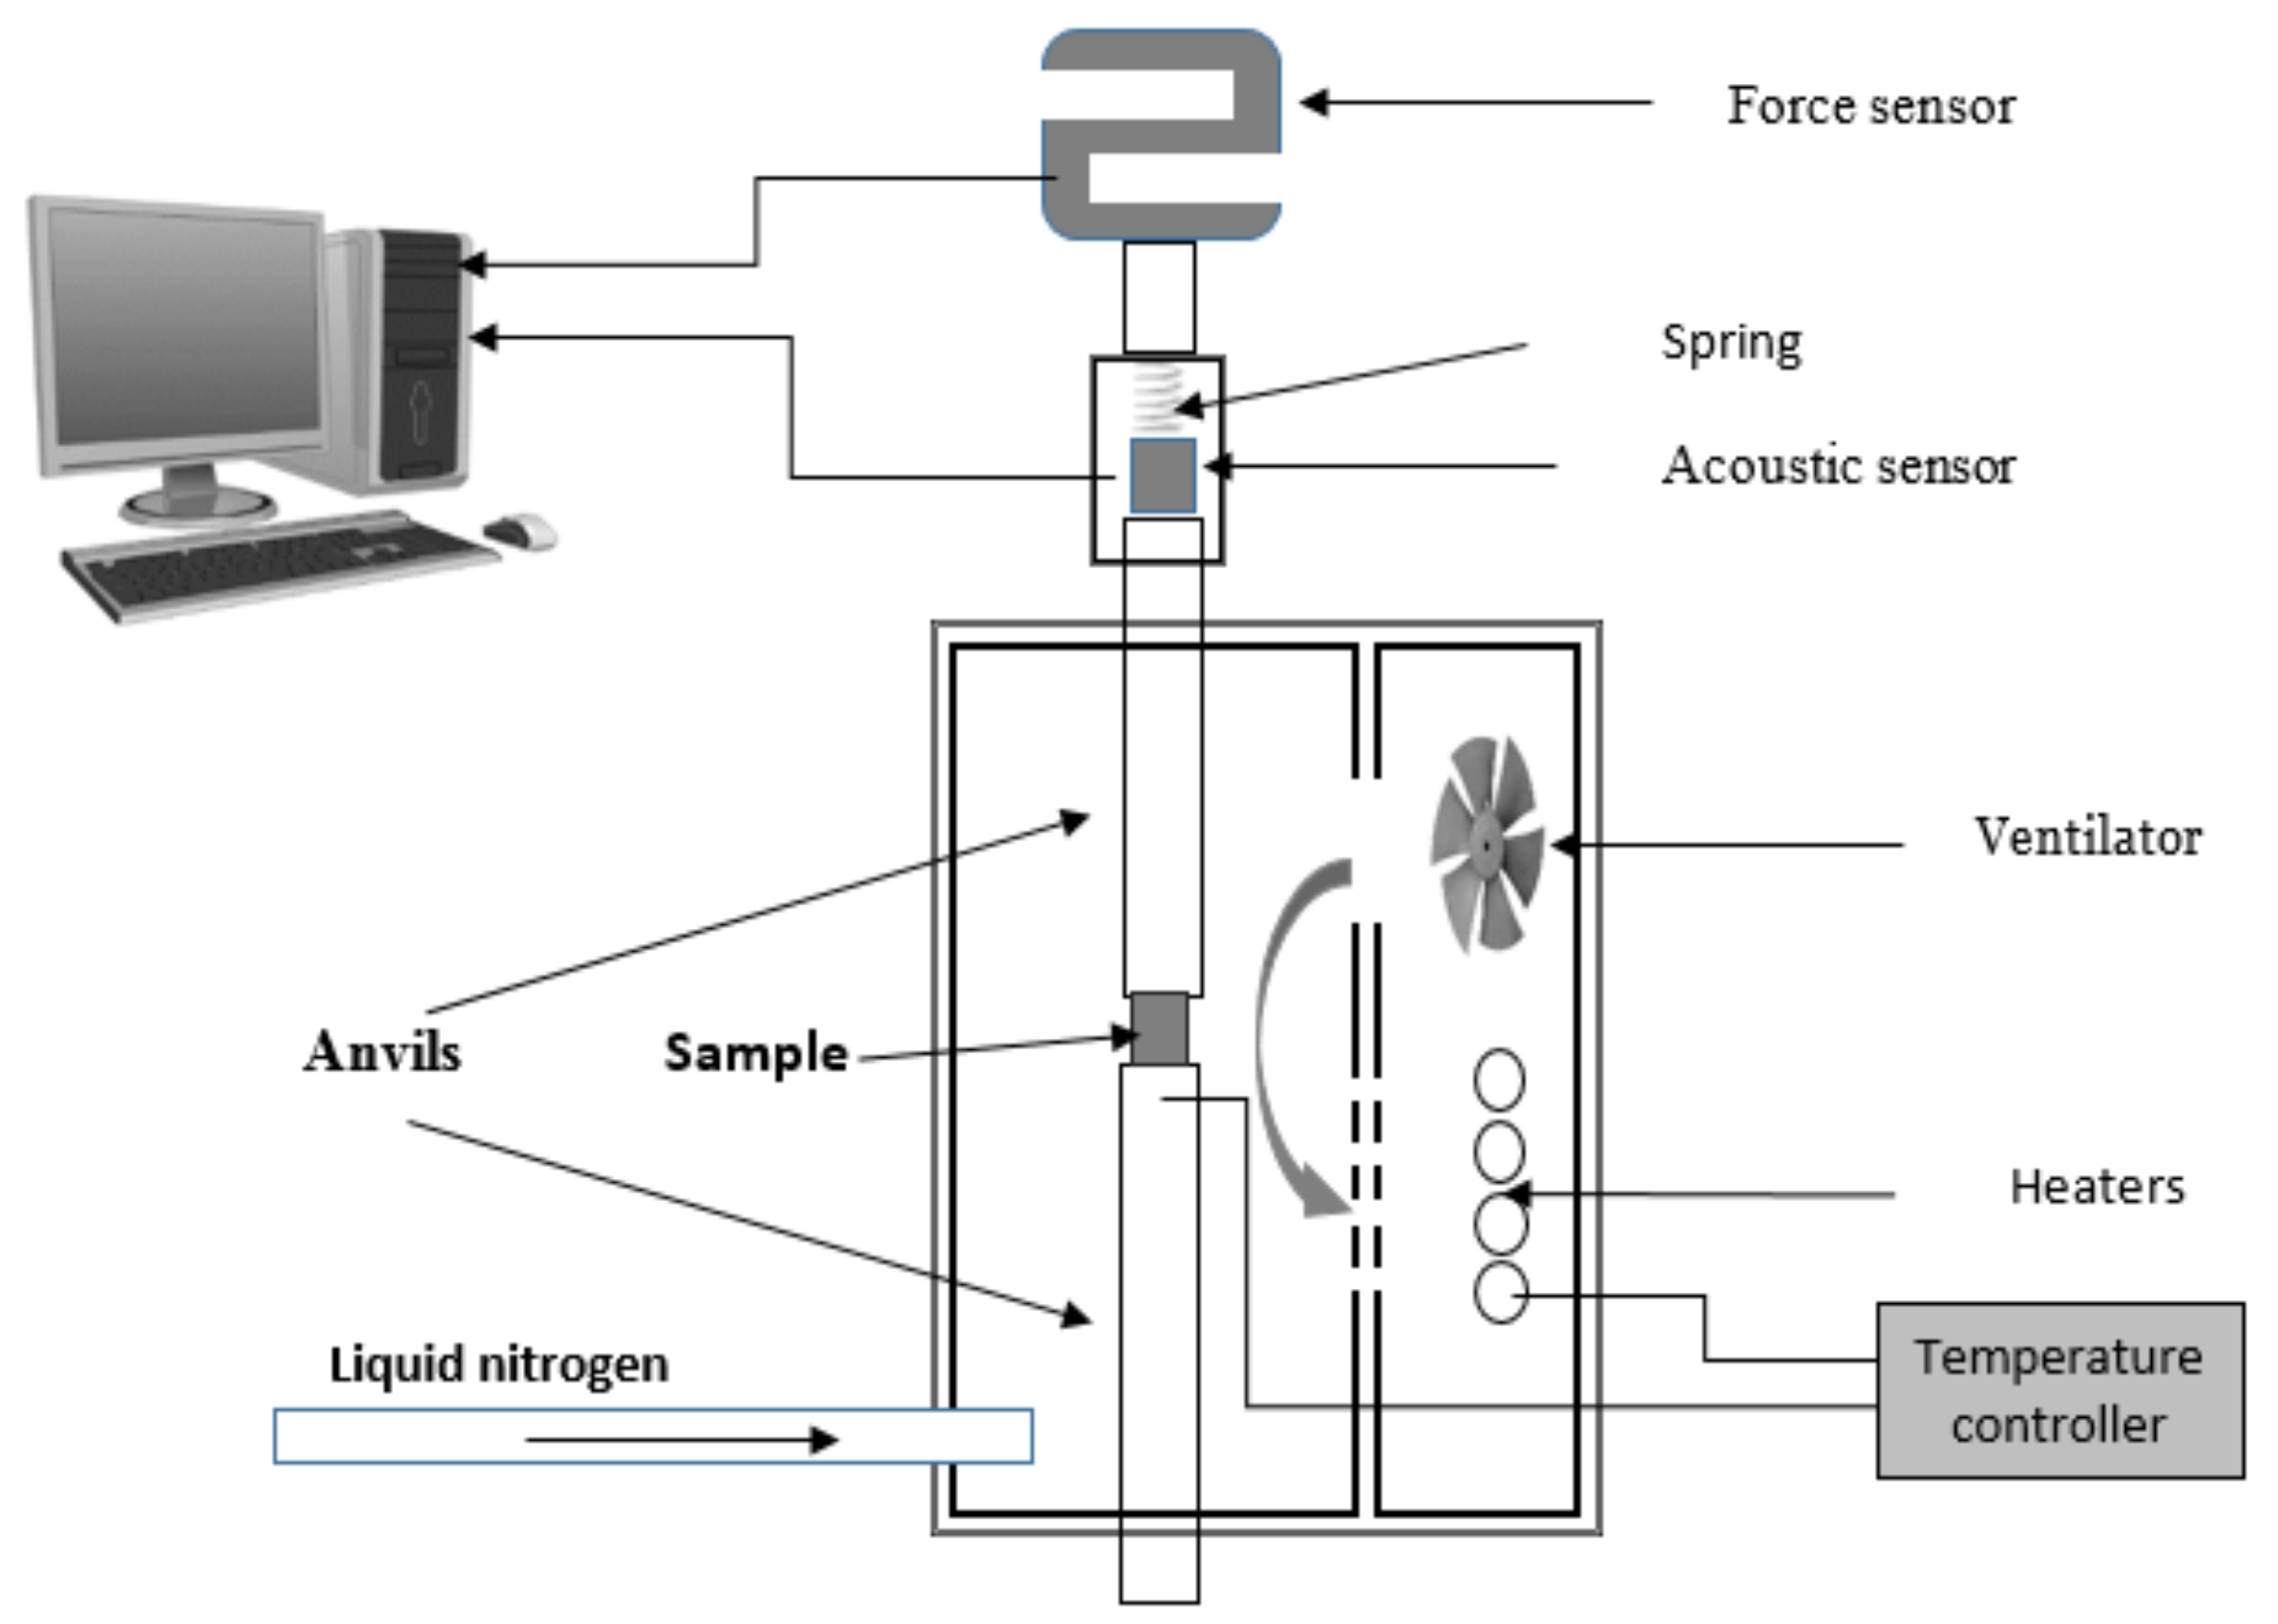
2. Experimental
3. Results and Discussion
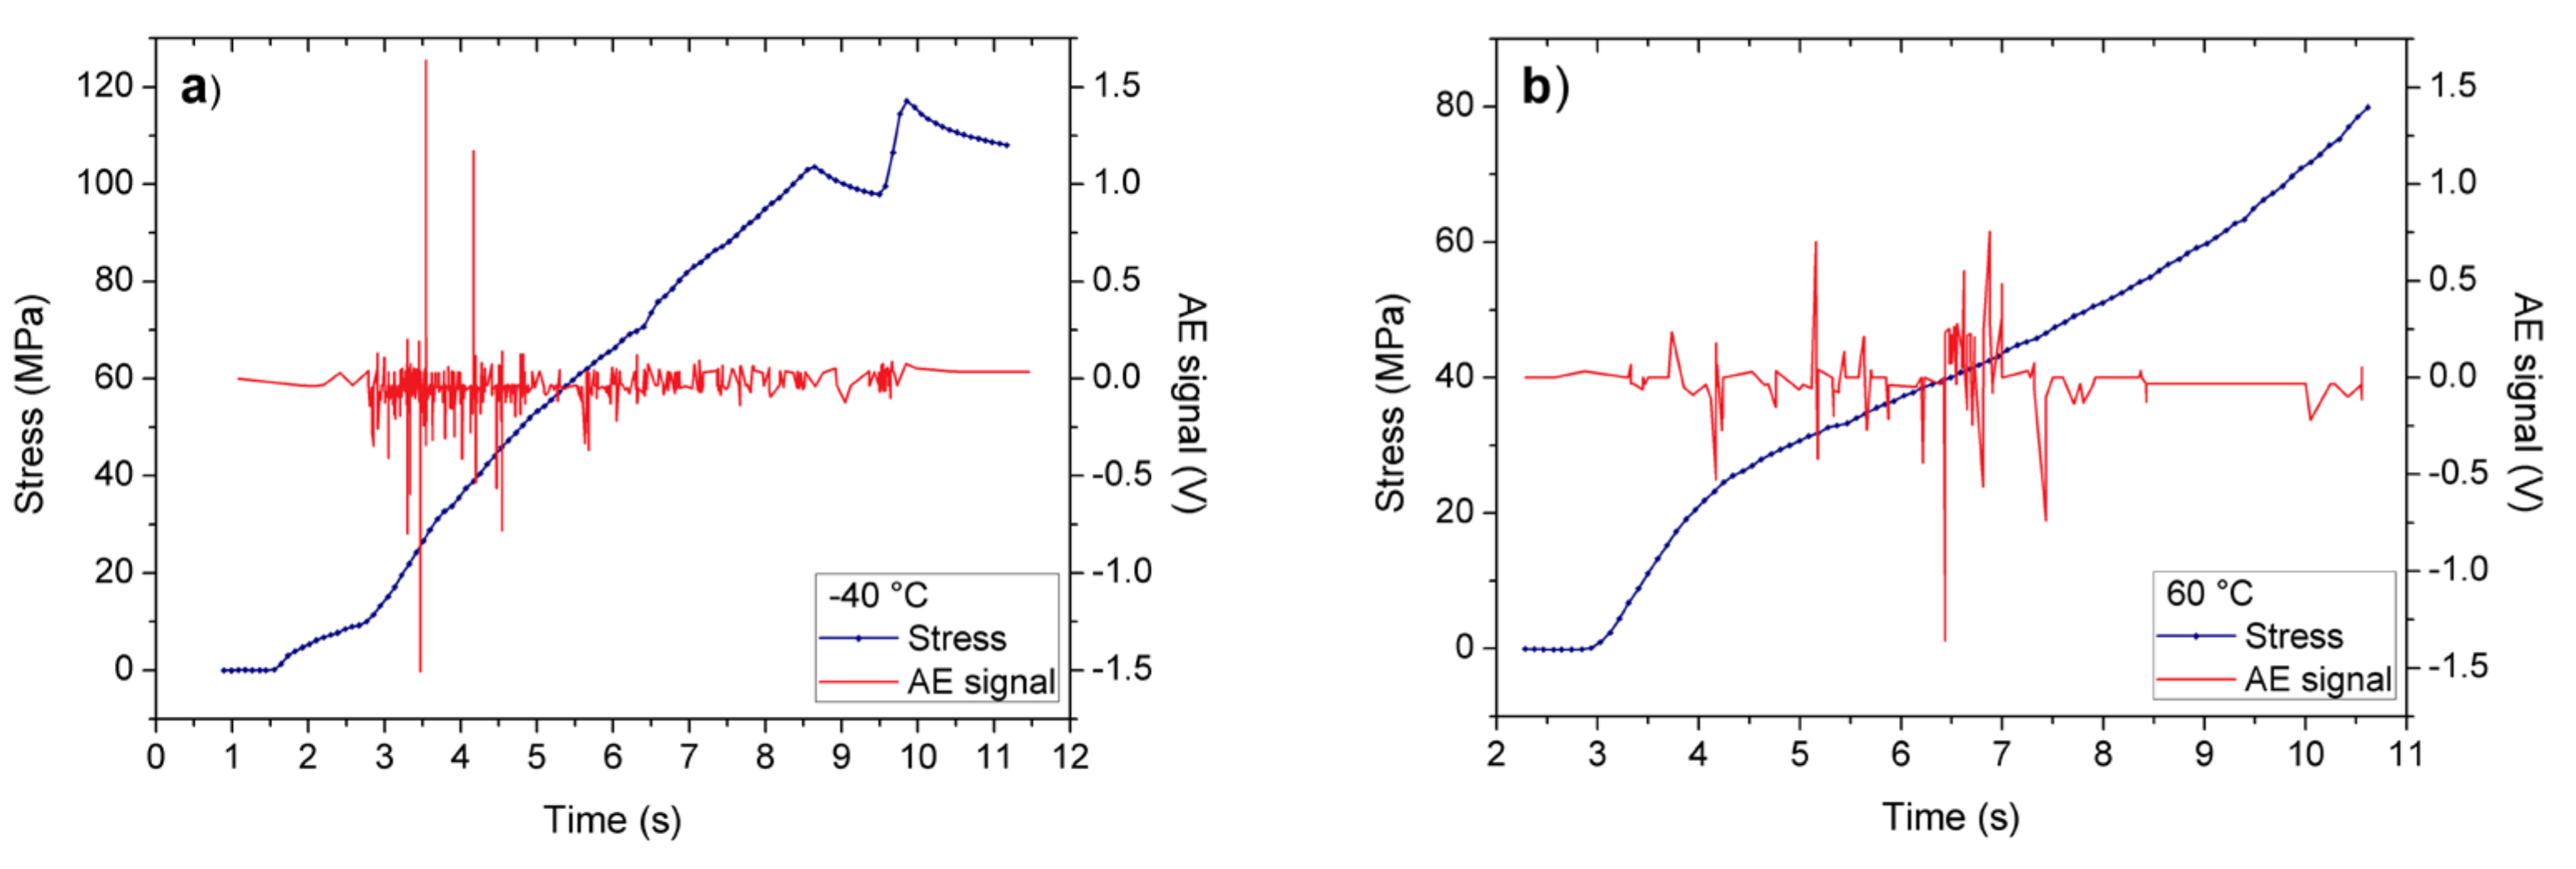
3.1. Results at = 0.15 s−1 Deformation Rate
3.2. Results at Lower Driving Rates
3.3. Effect of Distortion of the AE Signals Caused by “Ringing” of the Sample and AE Device during the Propagation of the Acoustic Waves
3.4. Possible Fine Refinements of Data Analysis
4. Conclusions
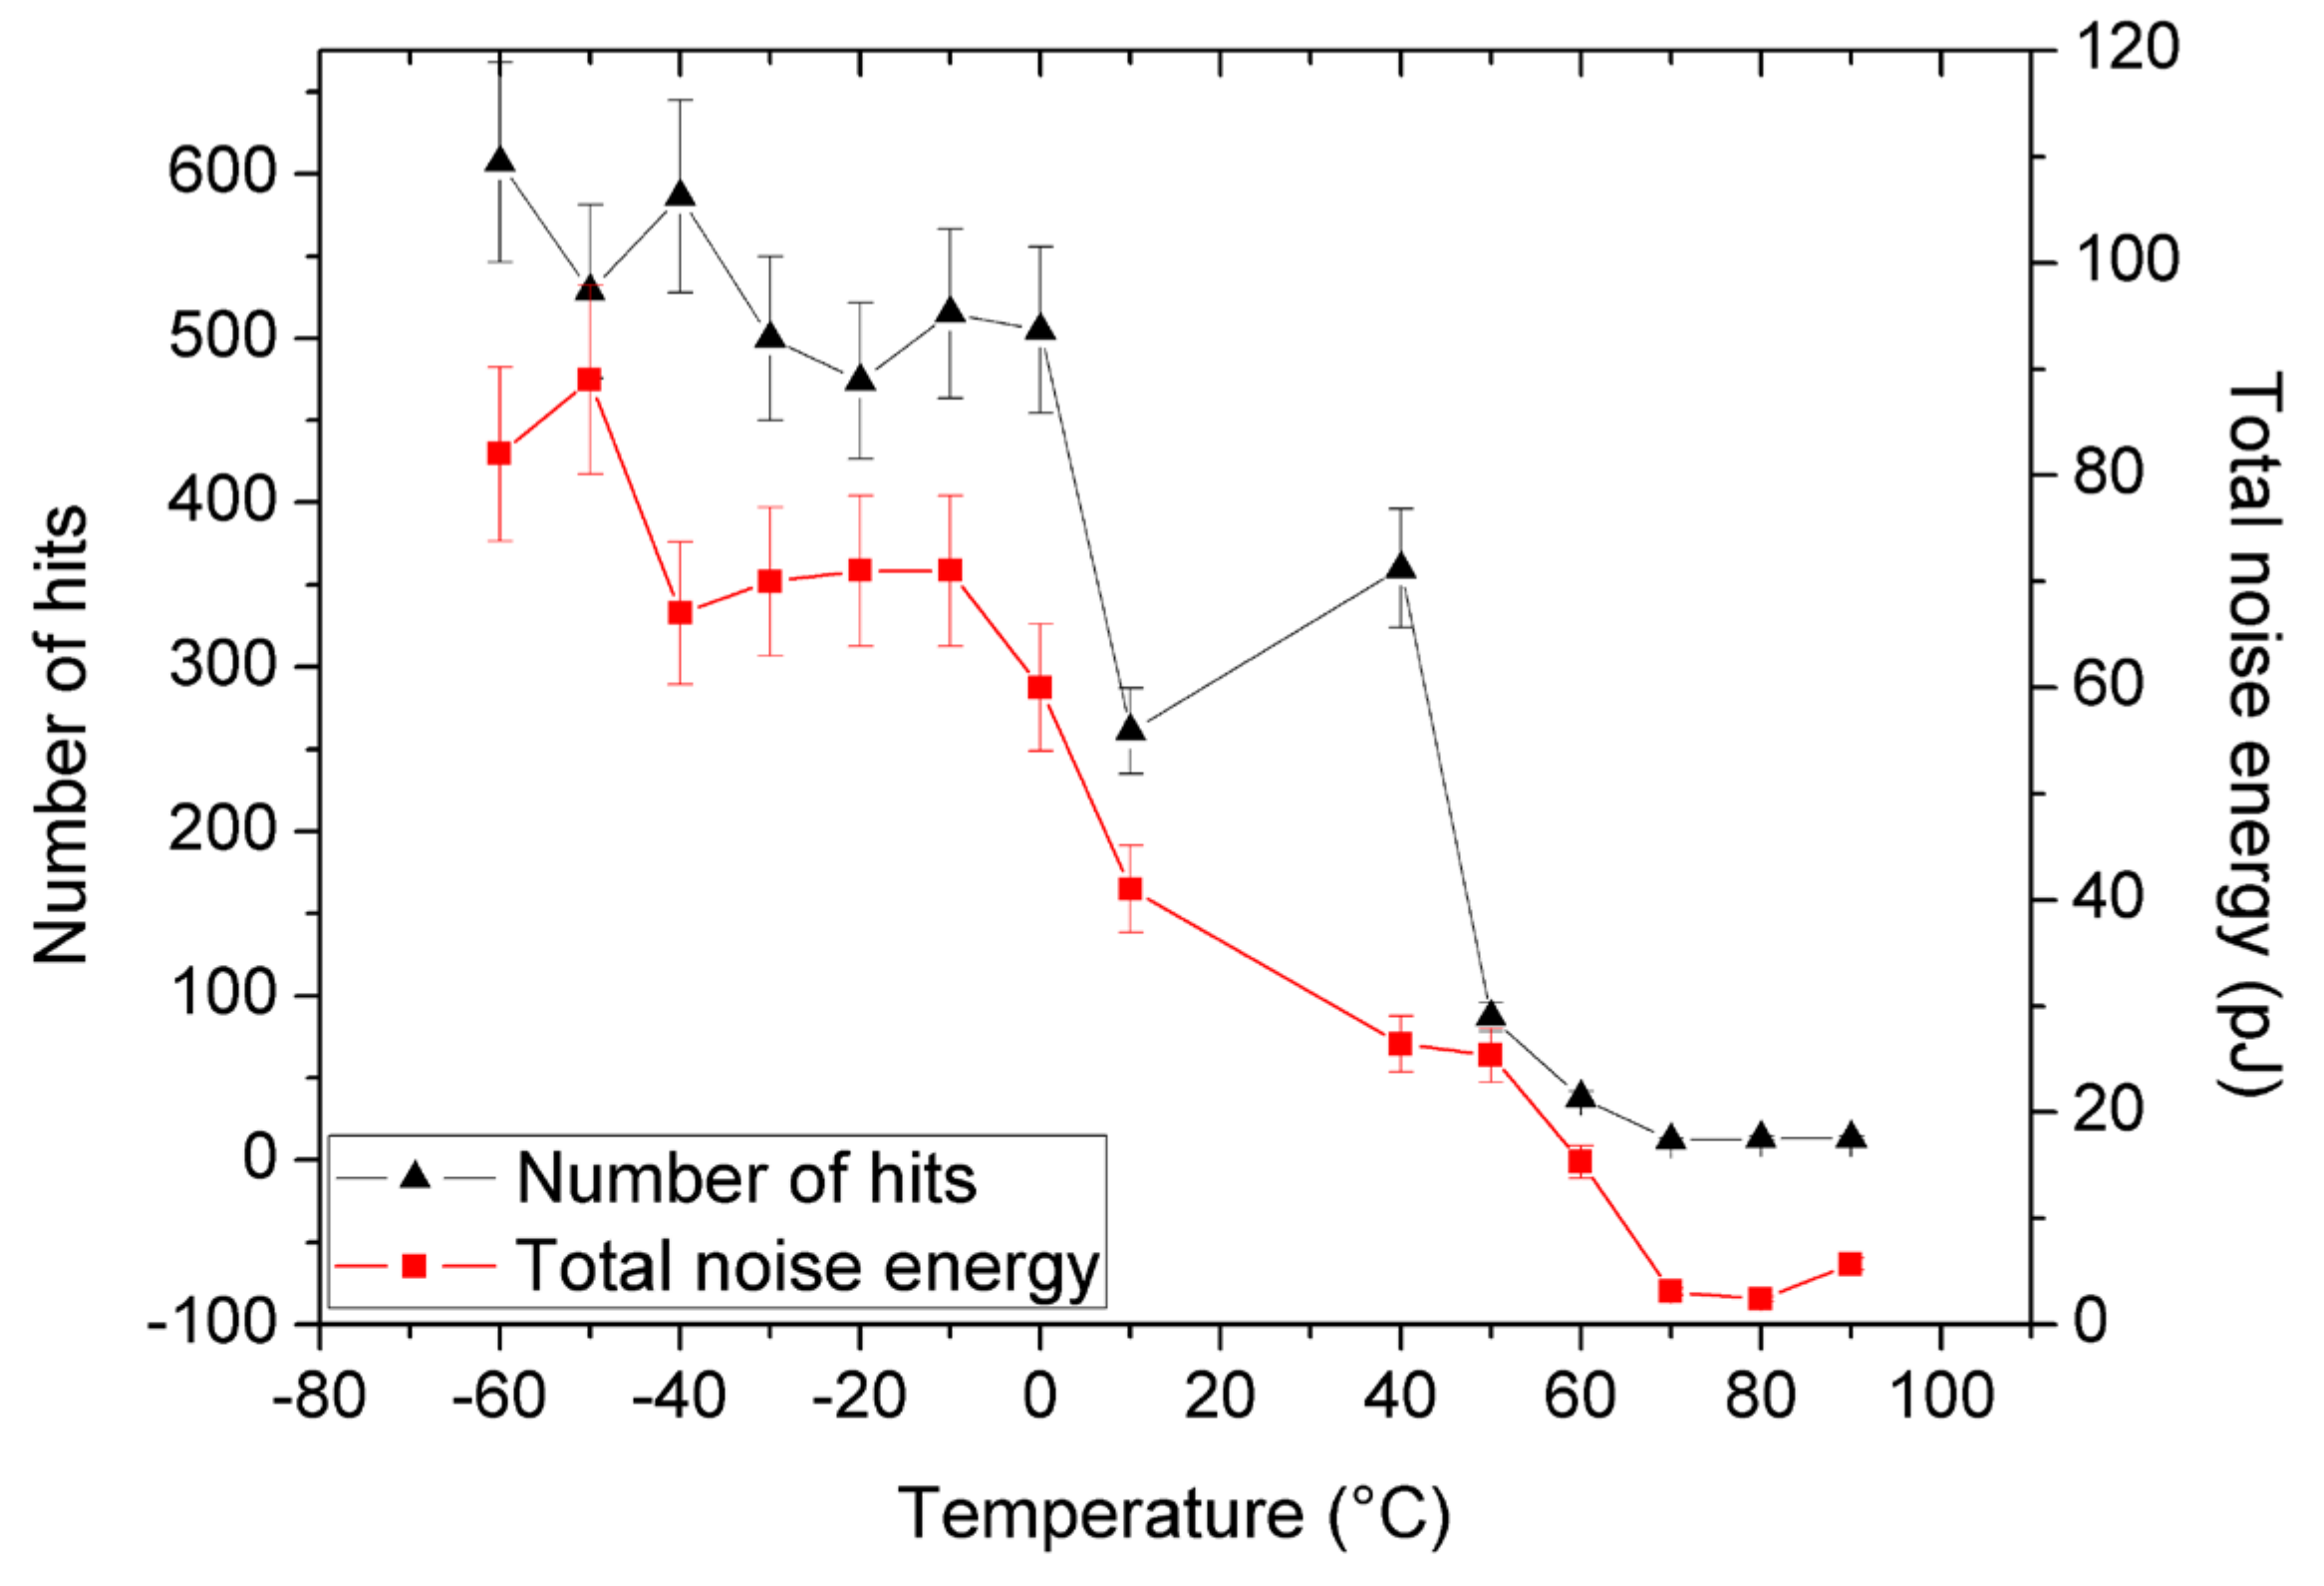
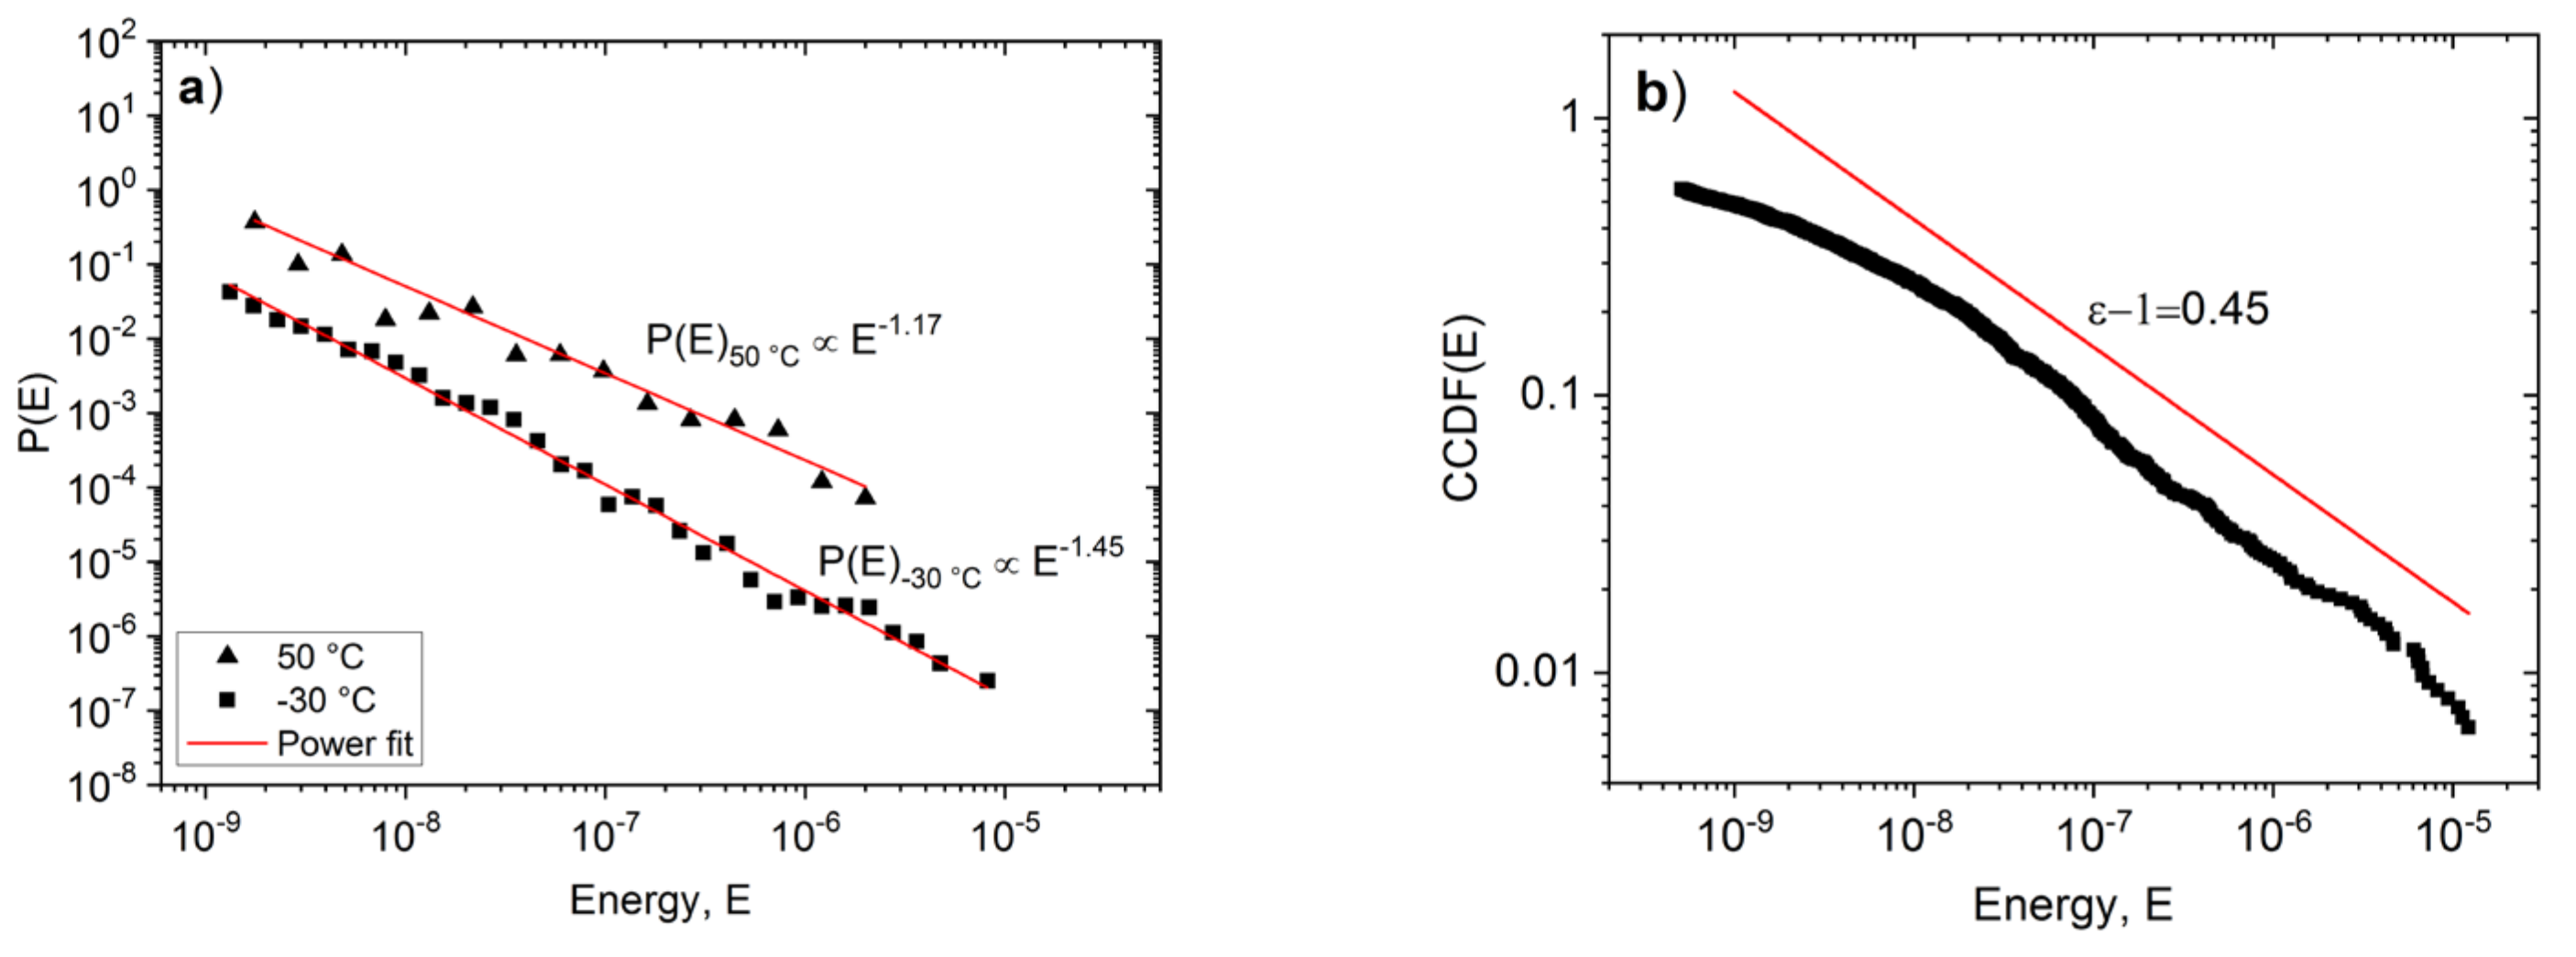
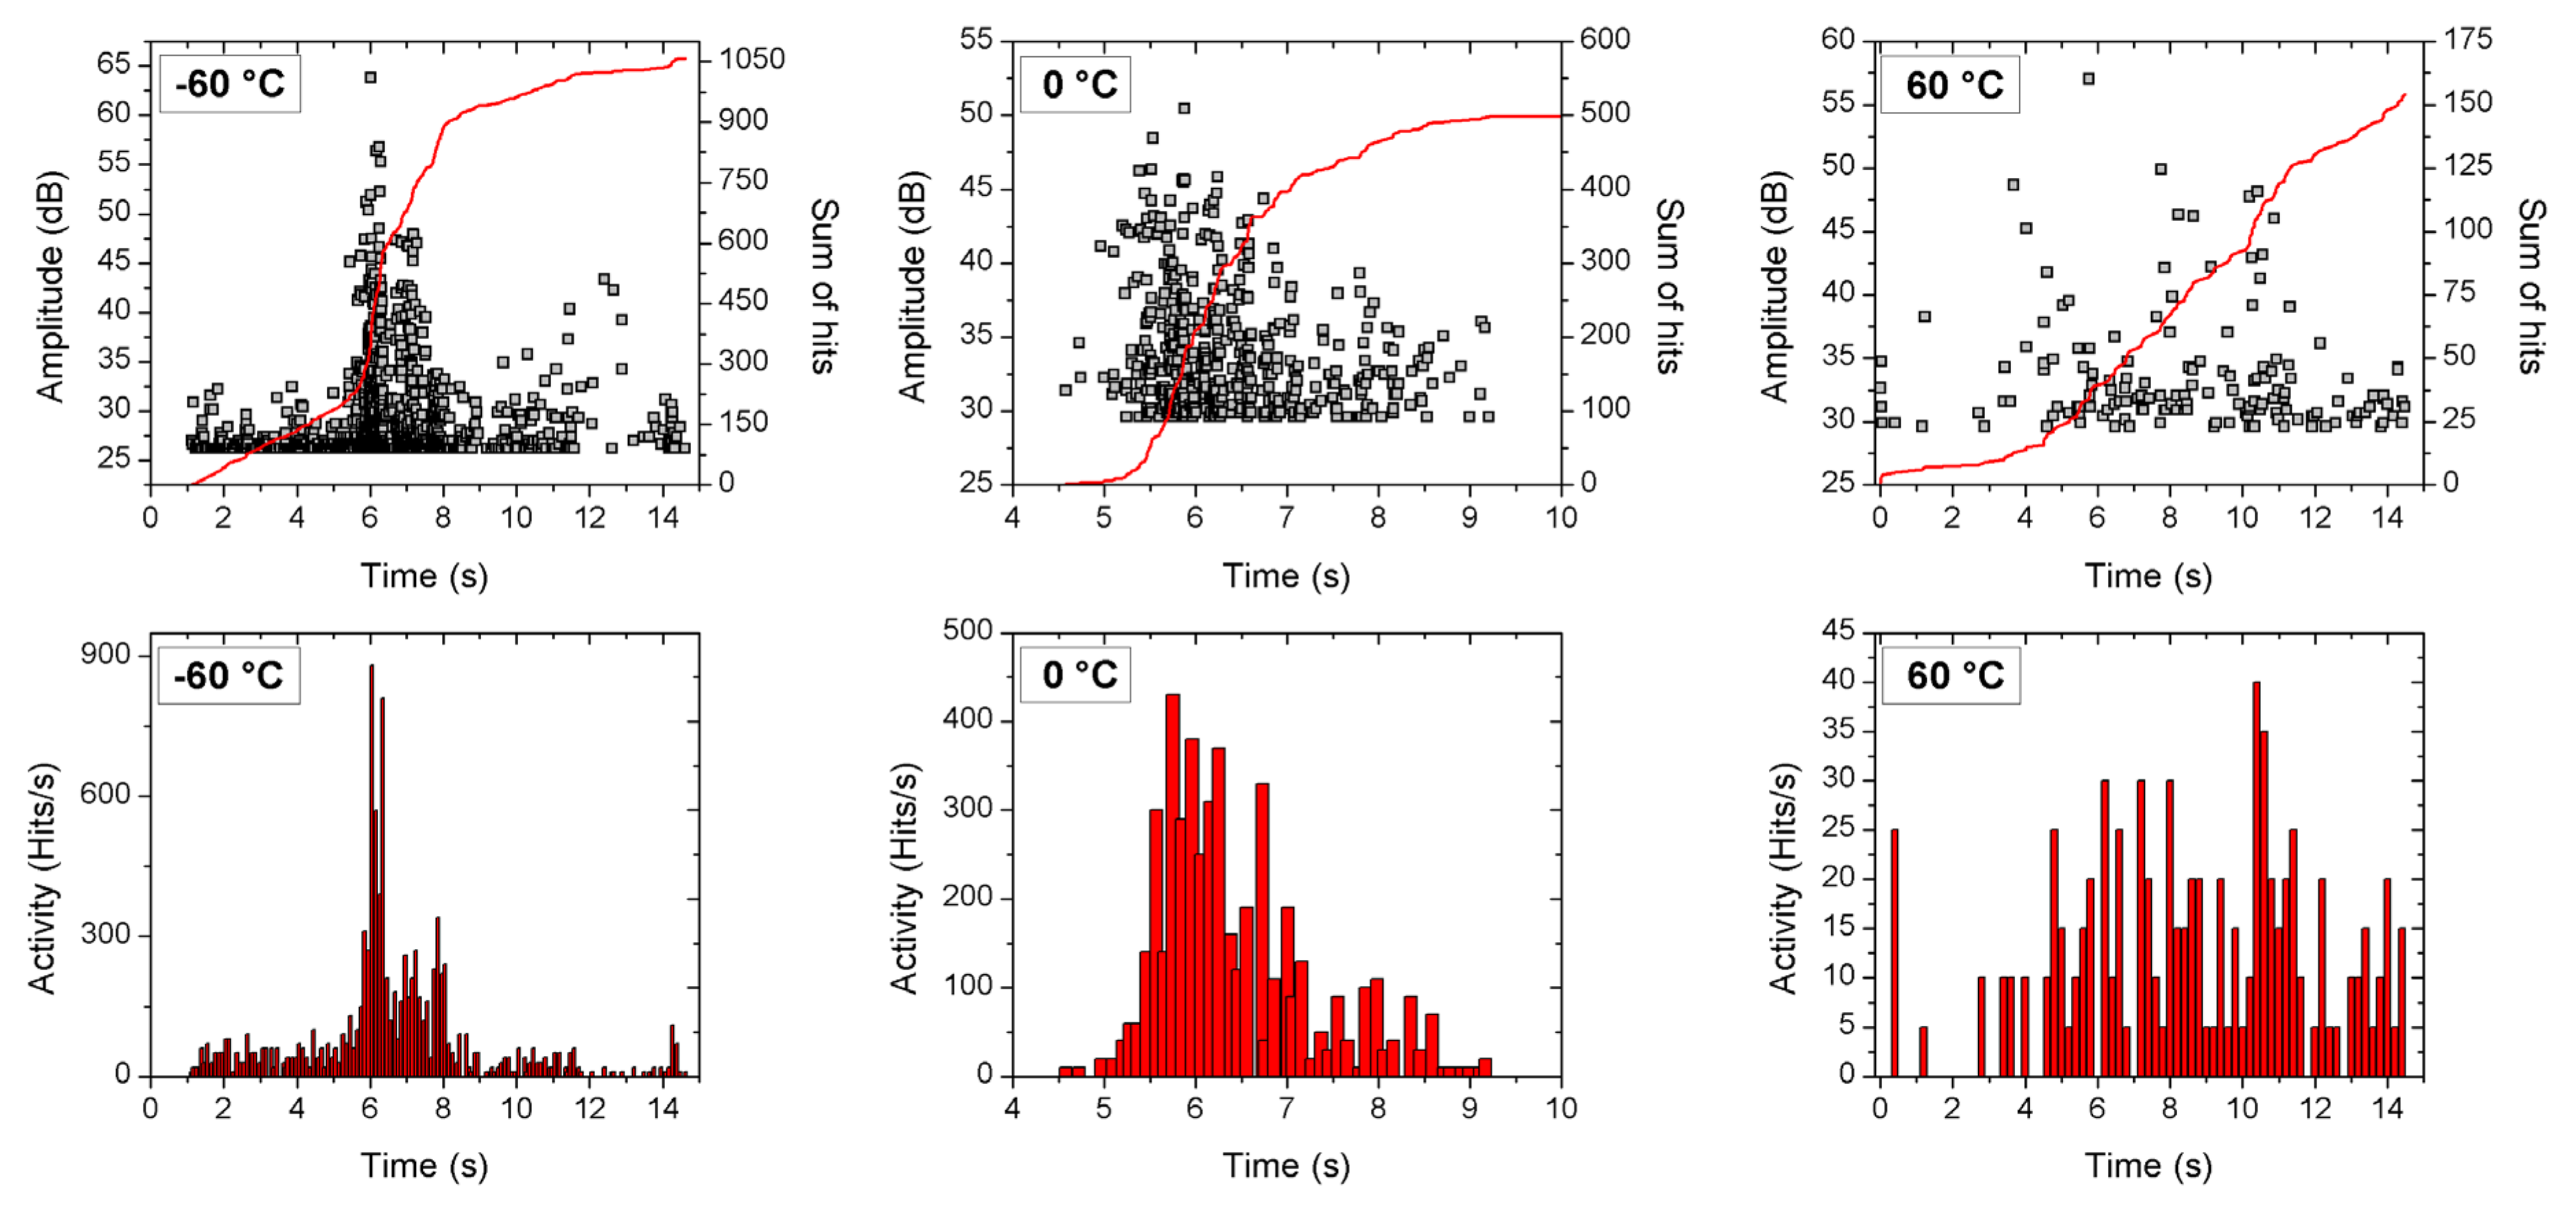
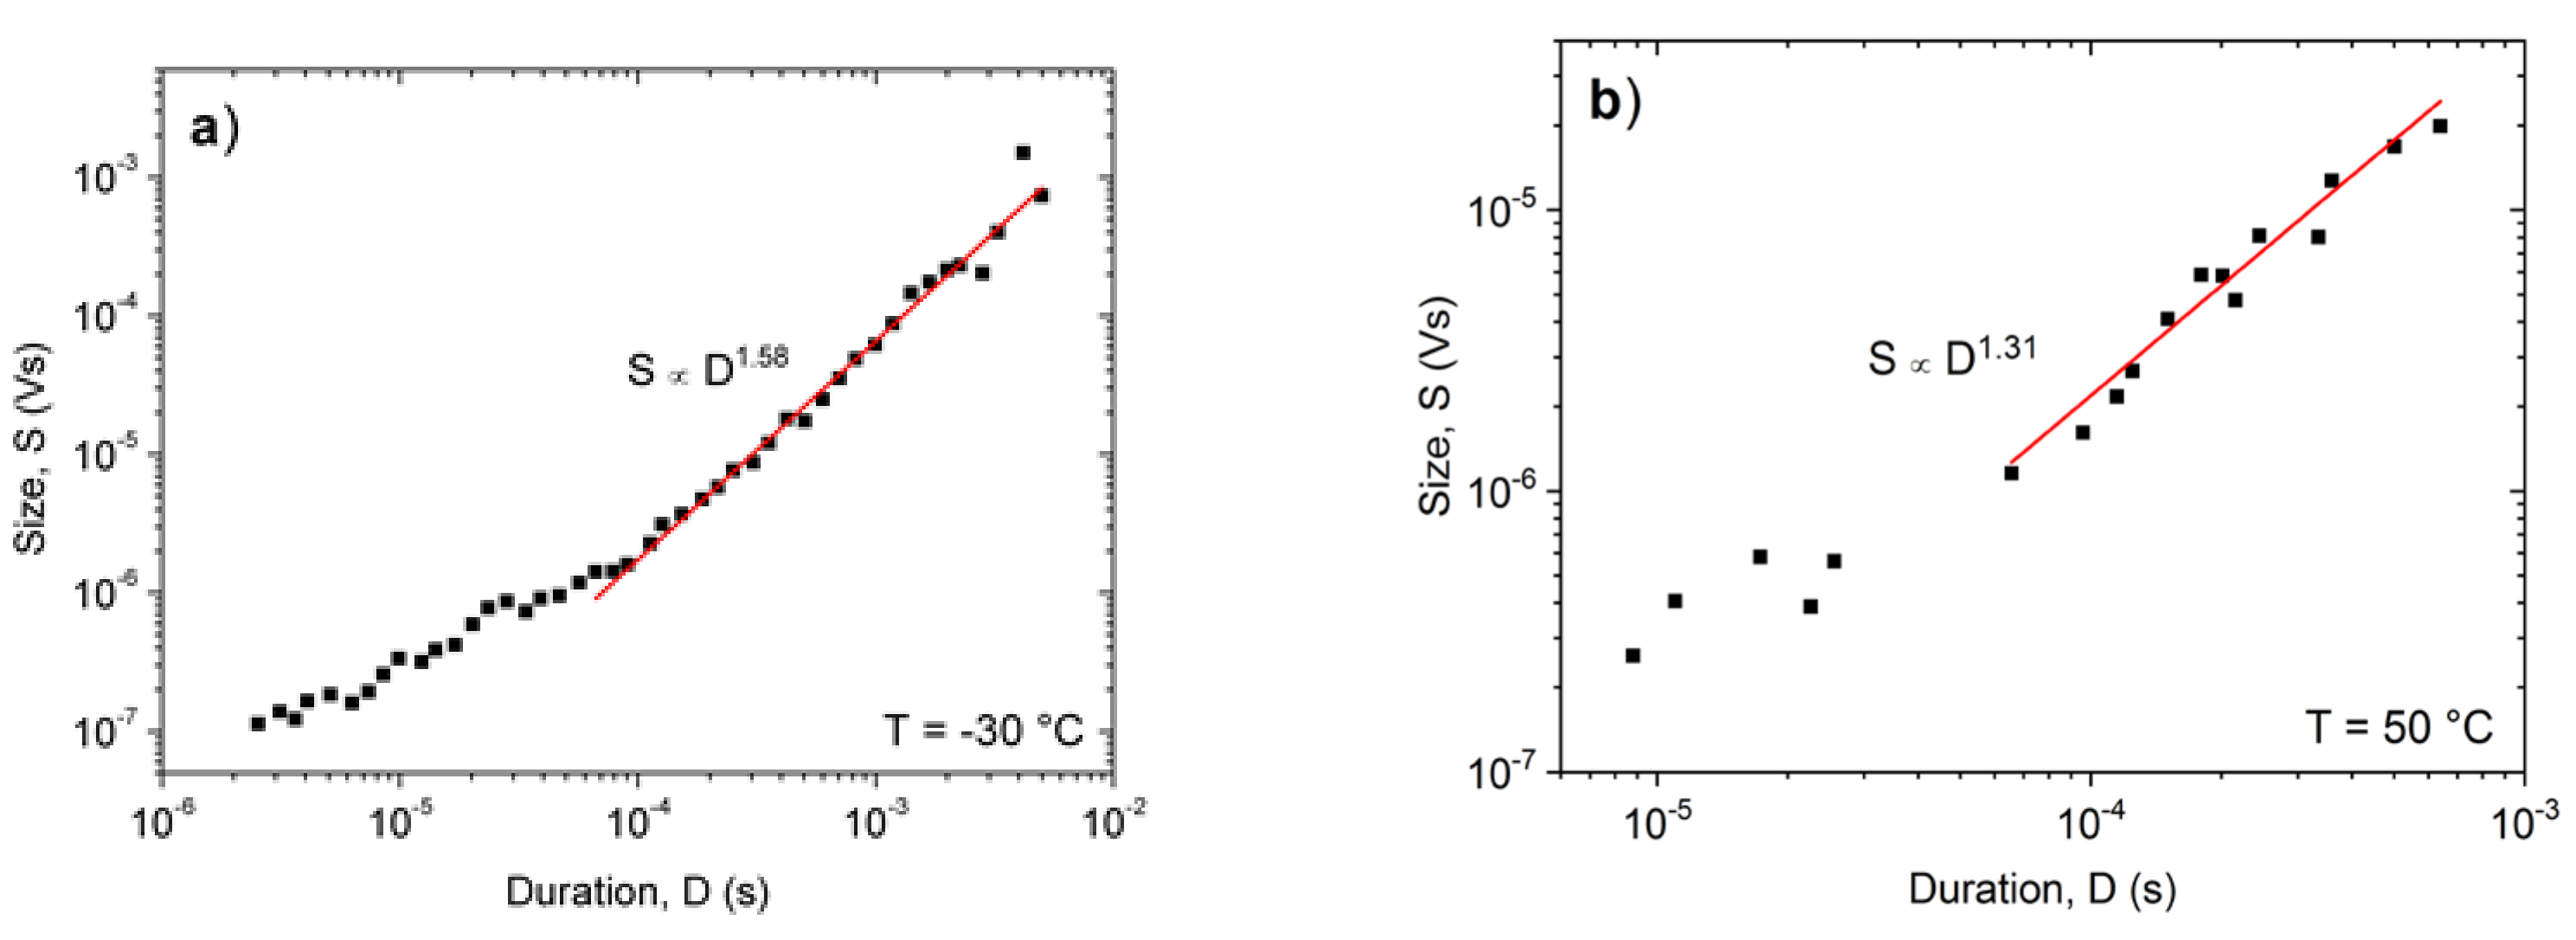
- It has been illustrated that the characteristics of AE show a systematic dependence as the function of temperature when there is a transition from a twinning to a dislocation slip mechanism. The total noise energy decreases by about two orders of magnitude during the transition between the two deformation mechanisms, and the exponents of the probability density functions decrease with increasing time (Figure 7). For example, here the energy exponent decreased from 1.45 ± 0.05 to 1.00 ± 0.15 (see also Table 1), respectively.
- It was determined that the γ parameter (as a parameter, characterizing the universality classes) was practically independent of the driving rate, illustrating that changing the driving rate, in the experimental range investigated here at a fixed temperature, did not caused a change in the deformation mechanism. The approximate values of γ, calculated from the exponents of the other scaling relations (see Equations (2)–(4)) are in good agreement with each other.
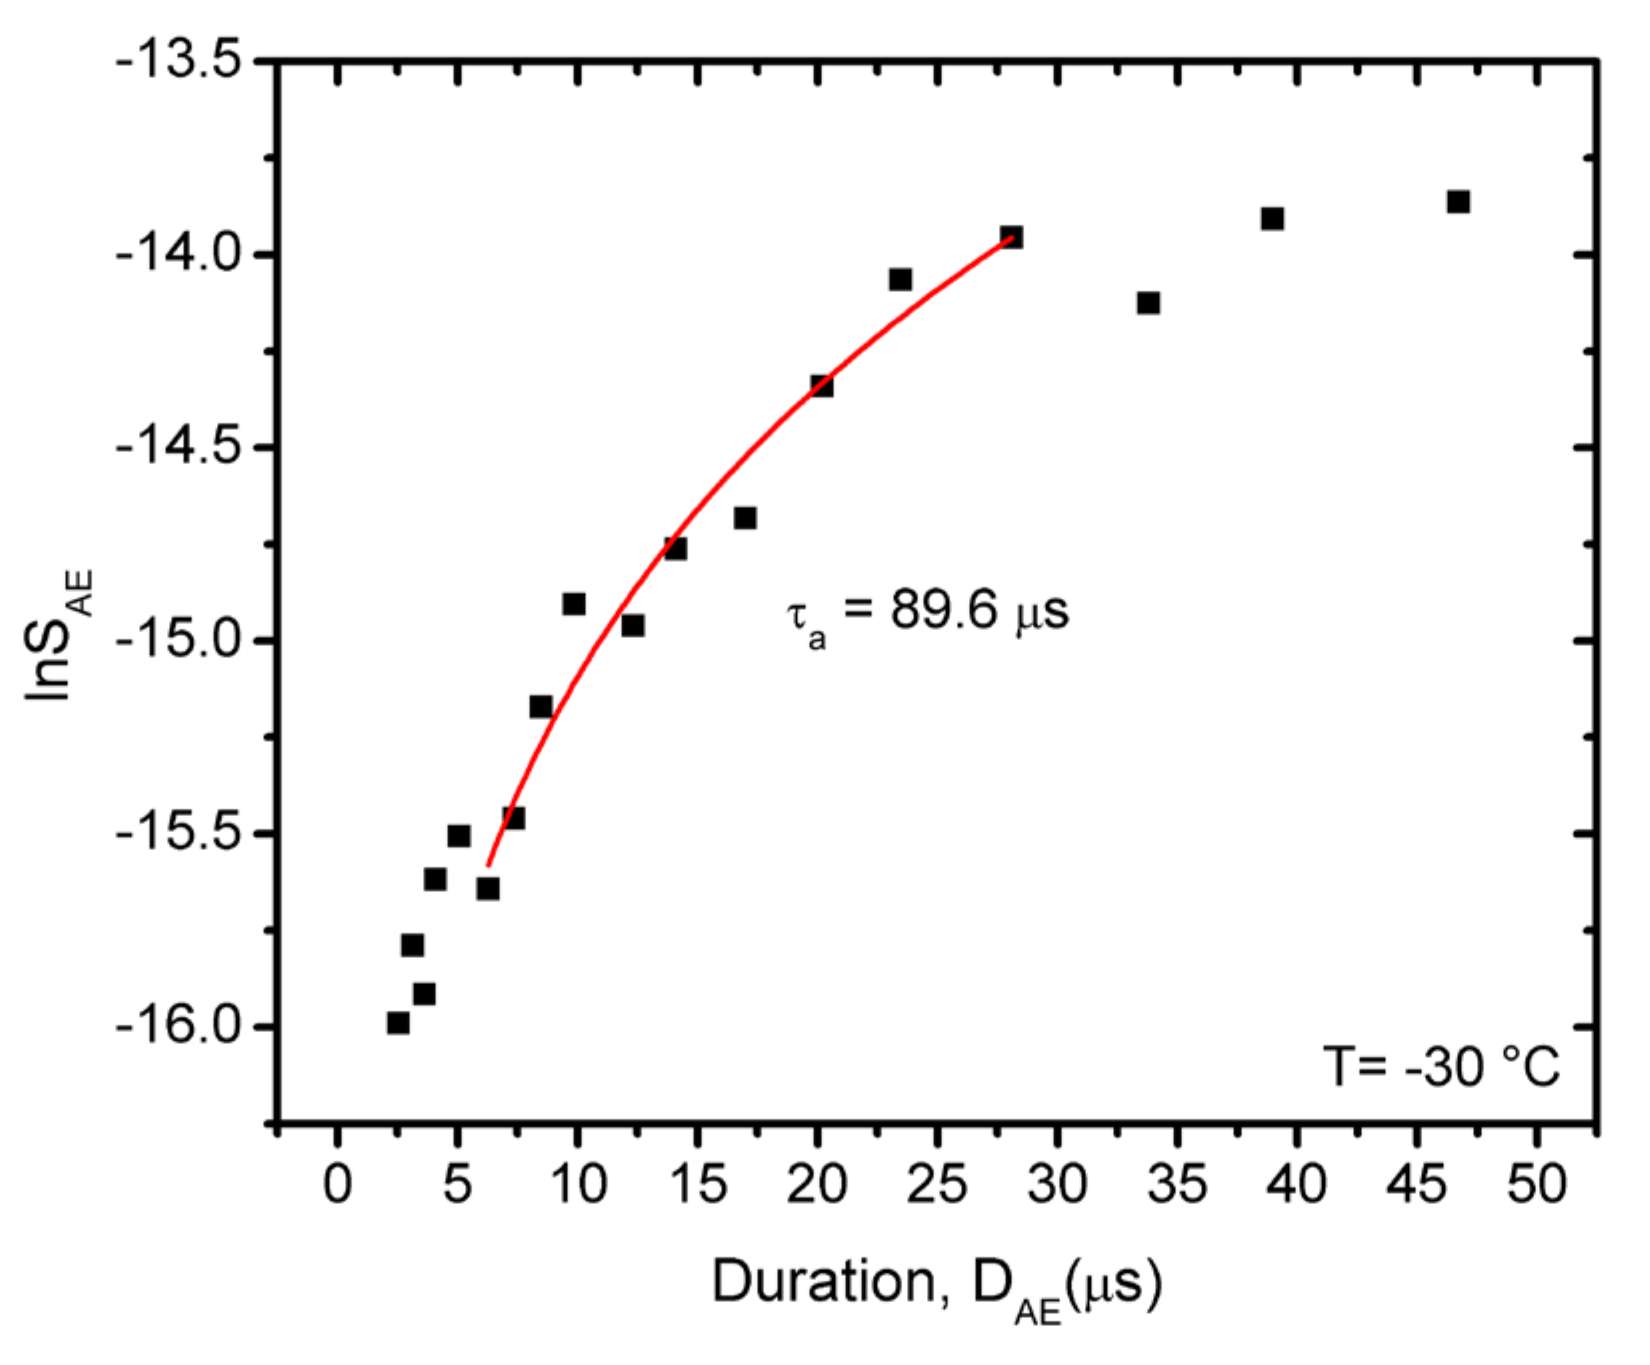
- From the analysis of the distortion effect of the AE detection system, it was determined that the scaling Equations (2)–(4) indeed showed a curvature as predicted by earlier analysis of this effect [29,30,31,47,48]. This analysis was performed on measurements carried out at the low temperatures, where the AE activity was high enough to allow such an analysis. The parts belonging to large values of the duration times can be approximated by straight lines as predicted by Equations (2)–(4); for the average value of γ we obtained γ = 1.78. From parts at short duration times, the average attenuation time of the elastic waves was estimated as τa ≅ 70 μs.
Author Contributions
Funding
Institutional Review Board Statement
Informed Consent Statement
Data Availability Statement
Conflicts of Interest
References
- Mo, C.; Wisner, B.; Cabal, M.; Hazeli, K.; Ramesh, K.T.; El Kadiri, H.; Al-Samman, T.; Molodov, K.D.; Molodov, D.A.; Kontsos, A. Acoustic emission of deformation twinnng in magnesium. Materials 2016, 9, 662. [Google Scholar] [CrossRef] [PubMed] [Green Version]
- Richeton, T.; Dobron, P.; Chmelik, F.; Weiss, J.; Louchet, F. On the critical character of plasticity in metallic single crystals. Mat. Sci. Eng. A 2006, 424, 190–195. [Google Scholar] [CrossRef] [Green Version]
- Miguel, M.-C.; Vespignani, A.; Zapperi, S.; Weiss, J.; Grasso, J.R. Intermittent dislocation flow in viscoplastic deformation. Nature 2001, 410, 667–671. [Google Scholar] [CrossRef] [PubMed] [Green Version]
- Máthis, K.; Csiszár, G.; Capek, J.; Gubicza, J.; Clausen, B.; Lukas, P.; Vinogradov, A.; Agnew, S.R. Effect of the loading mode on the evolution of the deformation mechanisms in randomly textured magnesium polycrystals—Comparison of experimental and modeling results. Int. J. Plast. 2015, 72, 127–150. [Google Scholar] [CrossRef] [Green Version]
- Drozdenko, D.; Bohen, J.; Chmelik, F.; Lukas, P.; Dobron, P. Acoustic emission study on the activity of slip and twin mechanisms during compression testing of magnesium single crystals. Mater. Sci. Eng. A 2016, 650, 20–27. [Google Scholar] [CrossRef] [Green Version]
- Vinogradov, A.; Vasilev, E.; Linderov, M.; Merson, D. In situ observations of the kinetics of twinning–detwinning and dislocation slip in magnesium. Mat. Sci. Eng. A 2016, 676, 351–360. [Google Scholar] [CrossRef]
- Vinogradov, A.; Orlov, D.; Danyuk, A.; Estrin, Y. Deformation mechanisms underlying tension–compression asymmetry in magnesium alloy ZK60 revealed by acoustic emission monitoring. Mater. Sci. Eng. A 2015, 621, 243–251. [Google Scholar] [CrossRef]
- Vinogradov, A.; Orlov, D.; Danyuk, A.; Estrin, Y. Effect of grain size on the mechanisms of plastic deformation in wrought Mg–Zn–Zr alloy revealed by acoustic emission measurements. Acta Mater. 2013, 61, 2044–2056. [Google Scholar] [CrossRef]
- Vinogradov, A.; Danyuk, A.V.; Merson, D.L.; Yasnikov, L.S. Probing elementary dislocation mechanisms of local plastic deformation by the advanced acoustic emission technique. Scripta Mater. 2018, 151, 53–56. [Google Scholar] [CrossRef] [Green Version]
- Spark, G.; Maas, R. Shapes and velocity relaxation of dislocation avalanches in Au and Nb microcrystals. Acta Mater. 2018, 152, 86–95. [Google Scholar] [CrossRef] [Green Version]
- Knezevic, M.; Zecevic, M.; Beyerlein, I.J.; Bingert, J.F.; McCabe, R.J. Strain rate and temperature effects on the selection of primary and secondary slip and twinning systems in HCP Zr. Acta Mater. 2015, 88, 55–73. [Google Scholar] [CrossRef] [Green Version]
- Heiple, C.R.; Carpenter, S.H. Acoustic emission produced by deformation of metals and alloys—A review. J. Acoust. Emiss. 1987, 6, 177–204. [Google Scholar]
- Chapuis, A.; Driver, H. Temperature dependency of slip and twinning in plane strain compressed magnesium single crystals. Acta Mater. 2011, 59, 1986–1994. [Google Scholar] [CrossRef]
- Zecevic, M.; Knezevic, M.; Beyerlein, I.J.; Tomé, C.N. An elasto-plastic self-consistent model with hardening based on dislocation density, twinning and de-twinning: Application to strain path changes in HCP metals. Mater. Sci. Eng. A 2015, 638, 262–274. [Google Scholar] [CrossRef] [Green Version]
- Kumal, M.A.; Beyerlein, I.J. Influence of plastic properties on the grain size effect on twinning in Ti and Mg. Mater. Sci. Eng. A 2020, 771, 138644. [Google Scholar] [CrossRef]
- Zaiser, M. Scale invariance in plastic flow of crystalline solids. Adv. Phys. 2006, 55, 185–245. [Google Scholar] [CrossRef]
- Salje, E.K.; Dahmen, K.A. Crackling noise in disordered materials. Annu. Rev. Condens. Matter. Phys. 2014, 5, 233–254. [Google Scholar] [CrossRef]
- Richeton, T.; Weiss, J.; Louchet, F. Dislocation avalanches: Role of temperature, grain size and strain hardening. Acta Mater. 2005, 53, 4463–4471. [Google Scholar] [CrossRef]
- Richeton, T.; Weiss, J.; Louchet, F.; Dobron, P.; Chmelik, F. Critical character of plasticity from AE experiments in hcp and fcc metals. Kovove Mater. 2007, 45, 149–152. [Google Scholar]
- Dimiduk, D.M.; Woodward, C.; LeSar, L.; Uchic, M.D. Scale-Free Intermittent Flow in Crystal Plasticity. Science 2006, 312, 1188–1190. [Google Scholar] [CrossRef] [Green Version]
- Lebyodkin, M.A.; Shashkov, I.V.; Lebedkina, T.A.; Mathis, K.; Dobron, P.; Chmelik, F. Role of superposition of dislocation avalanches in the statistics of acoustic emission during plastic deformation. Phys. Rev. E 2013, 88, 0422402. [Google Scholar] [CrossRef]
- Weiss, J.; Ben Rhouma, W.; Richeton, T.; Dechanel, S.; Louchet, F.; Truskinovky, L. From Mild to Wild Fluctuations in Crystal Plasticity. Phys. Rev. Lett. 2015, 114, 105504. [Google Scholar] [CrossRef]
- Setna, J.P.; Bierbaum, M.K.; Dahmen, K.A.; Goodrich, C.P.; Greer, J.R.; Hayden, L.X.; Ken-Dobias, J.P.; Lee, E.D.; Liarte, D.B.; Ni, X.; et al. Deformation of Crystals: Connections with Statistical Physics. Annu. Rev. Mater. Res. 2017, 47, 217–246. [Google Scholar] [CrossRef] [Green Version]
- Le Blanc, M.; Angheluta, L.; Dahmen, K.; Goldenfeld, N. Universal fluctuations and extreme statistics of avalanches near the depinning transition. Phys. Rev. E 2013, 87, 022126. [Google Scholar] [CrossRef] [Green Version]
- Papanikolaou, S.; Bohn, F.; Sommer, R.L.; Durin, G.; Zapperi, S.; Setna, J.P. Universality beyond power laws and the average avalanche shape. Nat. Phys. 2011, 7, 316–320. [Google Scholar] [CrossRef] [Green Version]
- Laurson, L.; Illa, X.; Santucci, S.; Tallakstad, K.T.; Maloy, K.J.; Alava, M.J. Evolution of the average avalanche shape with the universality class. Nat. Commun. 2013, 4, 2927. [Google Scholar] [CrossRef] [Green Version]
- Durin, G.; Bohn, F.; Correa, M.A.; Sommer, R.L.; Le Doussal, P.; Weise, K.J. Quantitative Scaling of Magnetic Avalanches. Phys. Rev. Lett. 2016, 117, 087201. [Google Scholar] [CrossRef] [PubMed] [Green Version]
- Dobrinevski, A.; Le Doussal, P.; Wiese, K.J. Statistics of avalanches with relaxation and Barkhausen noise: A solvable model. Phys. Rev. E 2013, 88, 032106. [Google Scholar] [CrossRef] [PubMed] [Green Version]
- Vu, C.-C.; Weiss, J. Asymmetric Damage Avalanche Shape in Quasibrittle Materials and Subavalanche (Aftershock) Clusters. Phys. Rev. Lett. 2020, 125, 105502. [Google Scholar] [CrossRef]
- Baro, J.; Dahmen, K.A.; Davidsen, J.; Planes, A.; Castillo, P.O.; Nataf, G.F.; Salje, E.K.H.; Vives, E. Experimental Evidence of Accelerated Seismic Release without Critical Failure in Acoustic Emissions of Compressed Nanoporous Materials. Phys. Rev. Lett. 2018, 120, 245501. [Google Scholar] [CrossRef] [PubMed] [Green Version]
- Casals, B.; Dahmen, K.A.; Gou, B.; Rooke, S.; Salje, E.K.H. The duration-energy-size enigma for acoustic emission. Sci. Rep. 2021, 11, 5590. [Google Scholar] [CrossRef]
- Tóth, L.Z.; Szabó, S.; Daróczi, L.; Beke, L. Calorimetric and acoustic emission study of martensitic transformation in single-crystalline Ni2MnGa alloys. Phys. Rev. B 2014, 90, 224103. [Google Scholar] [CrossRef] [Green Version]
- Tóth, L.Z.; Daróczi, L.; Szabó, S.; Beke, D.L. Simultaneous investigation of thermal, acoustic, and magnetic emission during martensitic transformation in single-crystalline Ni2MnGa. Phys. Rev. B 2016, 93, 144108. [Google Scholar] [CrossRef] [Green Version]
- Ludwig, B.; Strothkaemper, C.; Klemradt, U.; Moya, X.; Mañosa, L.; Vives, E.; Planes, A. An acoustic emission study of the effect of a magnetic field on the martensitic transition in Ni2MnGa. Appl. Phys. Lett. 2009, 94, 121901. [Google Scholar] [CrossRef]
- Rosinberg, M.L.; Vives, E. Metastability, Hysteresis, Avalanches, and Acoustic Emission: Martensitic Transitions in Functional Materials. In Disorder and Strain Induced Complexity in Functional Materials; Kakeshita, T., Fukuda, T., Saxena, A., Planes, A., Eds.; Springer Series in Materials Science; Springer: Berlin/Heidelberg, Germany, 2012; Volume 148, pp. 249–272. ISBN 978-3-642-20943-7. [Google Scholar] [CrossRef]
- Planes, A.; Mañosa, L.; Vives, E. Acoustic emission in martensitic transformations. J. Alloys Compd. 2013, 577, S699–S704. [Google Scholar] [CrossRef]
- Bonnot, E.; Vives, E.; Mañosa, L.; Planes, A.; Romero, R. Acoustic emission and energy dissipation during front propagation in a stress-driven martensitic transition. Phys. Rev. B 2008, 78, 094104. [Google Scholar] [CrossRef]
- Sagasta, F.; Benavent-Climent, A.; Roldán, A.; Gallego, A. Correlation of Plastic Strain Energy and Acoustic Emission Energy in Rei forced Concrete Structures. Appl. Sci. 2016, 6, 84. [Google Scholar] [CrossRef] [Green Version]
- White, E.P.; Enquist, B.J.; Green, J.L. On estimating the exponent of power-law frequency distributions. Ecology 2008, 89, 905–912. [Google Scholar] [CrossRef] [PubMed] [Green Version]
- Clauset, A.; Shalizi, C.R.; Newman, M.E. Power-Law Distributions in Empirical Data. SIAM Rev. 2009, 51, 661–703. [Google Scholar] [CrossRef] [Green Version]
- Mathis, K.; Chmelik, F. Exploring Plastic Deformation of Metallic Materials by the Acoustic Emission Techniques. In Acoustic Emission; Sikorski, W., Ed.; InTech: Rijeka, Croatia, 2012; pp. 23–48. ISBN 978-953-51-0056-0. [Google Scholar]
- Sethna, J.P.; Dahmen, K.; Kartha, S.; Krumhansl, J.A.; Roberts, B.W.; Shore, J.D. Hysteresis and hierarchies: Dynamics of disorder-driven first-order phase transformations. Phys. Rev. Lett. 1993, 70, 3347–3350. [Google Scholar] [CrossRef] [Green Version]
- Kuntz, M.C.; Sethna, J.P. Noise in disordered systems: The power spectrum and dynamic exponents in avalanche models. Phys. Rev. B 2000, 62, 11699–11708. [Google Scholar] [CrossRef] [Green Version]
- Sethna, J.P.; Dahmen, K.A.; Myers, C.R. Crackling noise. Nature 2001, 410, 242–250. [Google Scholar] [CrossRef] [Green Version]
- Dahmen, K.A.; Ben-Zion, Y.; Uhl, J.T. Micromechanical Model for Deformation in Solids with Universal Predictions for Stress-Strain Curves and Slip Avalanches. Phys. Rev. Lett. 2009, 102, 175501. [Google Scholar] [CrossRef] [PubMed] [Green Version]
- Dobrinevski, A.; Le Doussal, P.; Wiese, K.J. Avalanche shape and exponents beyond mean-field theory. EPL Europhys. Lett. 2014, 108, 66002. [Google Scholar] [CrossRef] [Green Version]
- Friedman, N.; Jennings, A.T.; Tsekenis, G.; Kim, J.-Y.; Tao, M.; Uhl, J.T.; Greer, J.R.; Dahmen, K.A. Statistics of Dislocation Slip Avalanches in Nanosized Single Crystals Show Tuned Critical Behavior Predicted by a Simple Mean Field Model. Phys. Rev. Lett. 2012, 109, 095507. [Google Scholar] [CrossRef] [PubMed]
- Baro, J. Avalanches in Out of Equilibrium Systems: Statistical Analysis of Experiments and Simulations. Ph.D. Thesis, University of Barcelona, Barcelona, Spain, 2018. [Google Scholar]
- Vives, E.; Baro, J.; Planes, A. From Labquakes in Porous Materials to Earthquakes. In Avalanches in Functional Materials and Geophysics; Salje, E.K.H., Saxena, A., Planes, A., Eds.; Springer: Berlin/Heidelberg, Germany, 2017; pp. 31–58. [Google Scholar] [CrossRef]
- Salje, E.K.H.; Planes, A.; Vives, E. Analysis of crackling noise using the maximum-likelihood method: Power-law mixing and exponential damping. Phys. Rev. E 2017, 96, 042122. [Google Scholar] [CrossRef]
- Chen, Y.; Ding, X.; Fang, D.; Sun, J.; Salje, E.K.H. Acoustic Emission from Porous Collapse and Moving Dislocations in Granular Mg-Ho Alloys under Compression and Tension. Sci. Rep. 2019, 9, 1330. [Google Scholar] [CrossRef]
- Pomponi, E.; Vinogradov, A. A real-time approach to acoustic emission clustering. Mech. Syst. Signal Process. 2013, 40, 791–804. [Google Scholar] [CrossRef]
- Vinogradov, A.; Lazarev, A.; Linderov, M.; Weidner, A.; Biermann, H. Kinetics of deformation processes in high-alloyed cast transformation-induced plasticity/twinning-induced plasticity steels determined by acoustic emission and scanning electron microscopy: Influence of austenite stability on deformation mechanisms. Acta Mater. 2013, 61, 2434–2449. [Google Scholar] [CrossRef]
- Shaira, M.; Godin, N.; Guy, P.; Vanel, L.; Courbon, J. Evaluation of the strain-induced martensitic transformation by acoustic emission monitoring in 304L austenitic stainless steel: Identification of the AE signature of the martensitic transformation and power-law statistics. Mater. Sci. Eng. A 2008, 492, 392–399. [Google Scholar] [CrossRef]
- Beke, D.L.; Daróczi, L.; Tóth, L.Z.; Bolgár, M.K.; Samy, N.M.; Hudák, A. Acoustic Emissions during Structural Changes in Shape Memory Alloys. Metals 2019, 9, 58. [Google Scholar] [CrossRef] [Green Version]
- Chen, Y.; Gou, B.; Fu, W.; Chen, C.; Ding, X.; Sun, J.; Salje, E.K.H. Fine structures of acoustic emission spectra: How to separate dislocation movements and entanglements in 316L stainless steel. Appl. Phys. Lett. 2020, 117, 262901. [Google Scholar] [CrossRef]
- Papanikolaou, S.; Dimiduk, D.M.; Choi, W.; Setna, J.P.; Uchic, M.D.; Woodward, C.F.; Zapperi, S. Quasi-periodic events in crys-talline plasticity and the self-organized avalache oscillator. Nature 2012, 490, 517. [Google Scholar] [CrossRef] [PubMed] [Green Version]


| ε | τ | |
|---|---|---|
| Twinning (low temperatures) | 1.45 ± 0.05 | 1.9 ± 0.1 |
| Dislocation slip (high temperatures) | 1.20 ± 0.15 | 1.0 ± 0.3 |
| Driving Rates at T = −10 °C (1/s) | ε | γ from S versus D (Equation (2)) |
|---|---|---|
| 0.005 | 1.10 | 1.77 |
| 0.010 | 1.14 | 1.63 |
| 0.015 | 1.20 | 2.05 |
| 0.025 | 1.30 | 1.79 |
| 0.15 (at −30 °C) | 1.45 | 1.58 |
| average | - | 1.76 |
| T (°C) | S versus D | E versus D | A versus D | Average Values at High and Low T | |||
|---|---|---|---|---|---|---|---|
| Average | Average | Average | |||||
| −30 | 1.58 | 1.70 | 1.84 | 1.86 | 1.88 | 1.77 | 1.78 |
| ) | 1.79 | 2.10 | 1.60 | ||||
| 0 | 1.58 | 1.60 | 1.96 | ||||
| 25 | 1.85 | 1.87 | 1.63 | ||||
| 50 | 1.36 | 1.39 | 1.26 | 1.30 | – * | – * | 1.35 |
| 80 | 1.42 | 1.34 | – * | ||||
Publisher’s Note: MDPI stays neutral with regard to jurisdictional claims in published maps and institutional affiliations. |
© 2021 by the authors. Licensee MDPI, Basel, Switzerland. This article is an open access article distributed under the terms and conditions of the Creative Commons Attribution (CC BY) license (https://creativecommons.org/licenses/by/4.0/).
Share and Cite
Daróczi, L.; Elrasasi, T.Y.; Arjmandabasi, T.; Tóth, L.Z.; Veres, B.; Beke, D.L. Change of Acoustic Emission Characteristics during Temperature Induced Transition from Twinning to Dislocation Slip under Compression in Polycrystalline Sn. Materials 2022, 15, 224. https://doi.org/10.3390/ma15010224
Daróczi L, Elrasasi TY, Arjmandabasi T, Tóth LZ, Veres B, Beke DL. Change of Acoustic Emission Characteristics during Temperature Induced Transition from Twinning to Dislocation Slip under Compression in Polycrystalline Sn. Materials. 2022; 15(1):224. https://doi.org/10.3390/ma15010224
Chicago/Turabian StyleDaróczi, Lajos, Tarek Yousif Elrasasi, Talaye Arjmandabasi, László Zoltán Tóth, Bence Veres, and Dezső László Beke. 2022. "Change of Acoustic Emission Characteristics during Temperature Induced Transition from Twinning to Dislocation Slip under Compression in Polycrystalline Sn" Materials 15, no. 1: 224. https://doi.org/10.3390/ma15010224
APA StyleDaróczi, L., Elrasasi, T. Y., Arjmandabasi, T., Tóth, L. Z., Veres, B., & Beke, D. L. (2022). Change of Acoustic Emission Characteristics during Temperature Induced Transition from Twinning to Dislocation Slip under Compression in Polycrystalline Sn. Materials, 15(1), 224. https://doi.org/10.3390/ma15010224