
Hydration–Strength–Workability–Durability of Binary, Ternary, and Quaternary Composite Pastes


Abstract
:1. Introduction
2. Materials and Methods
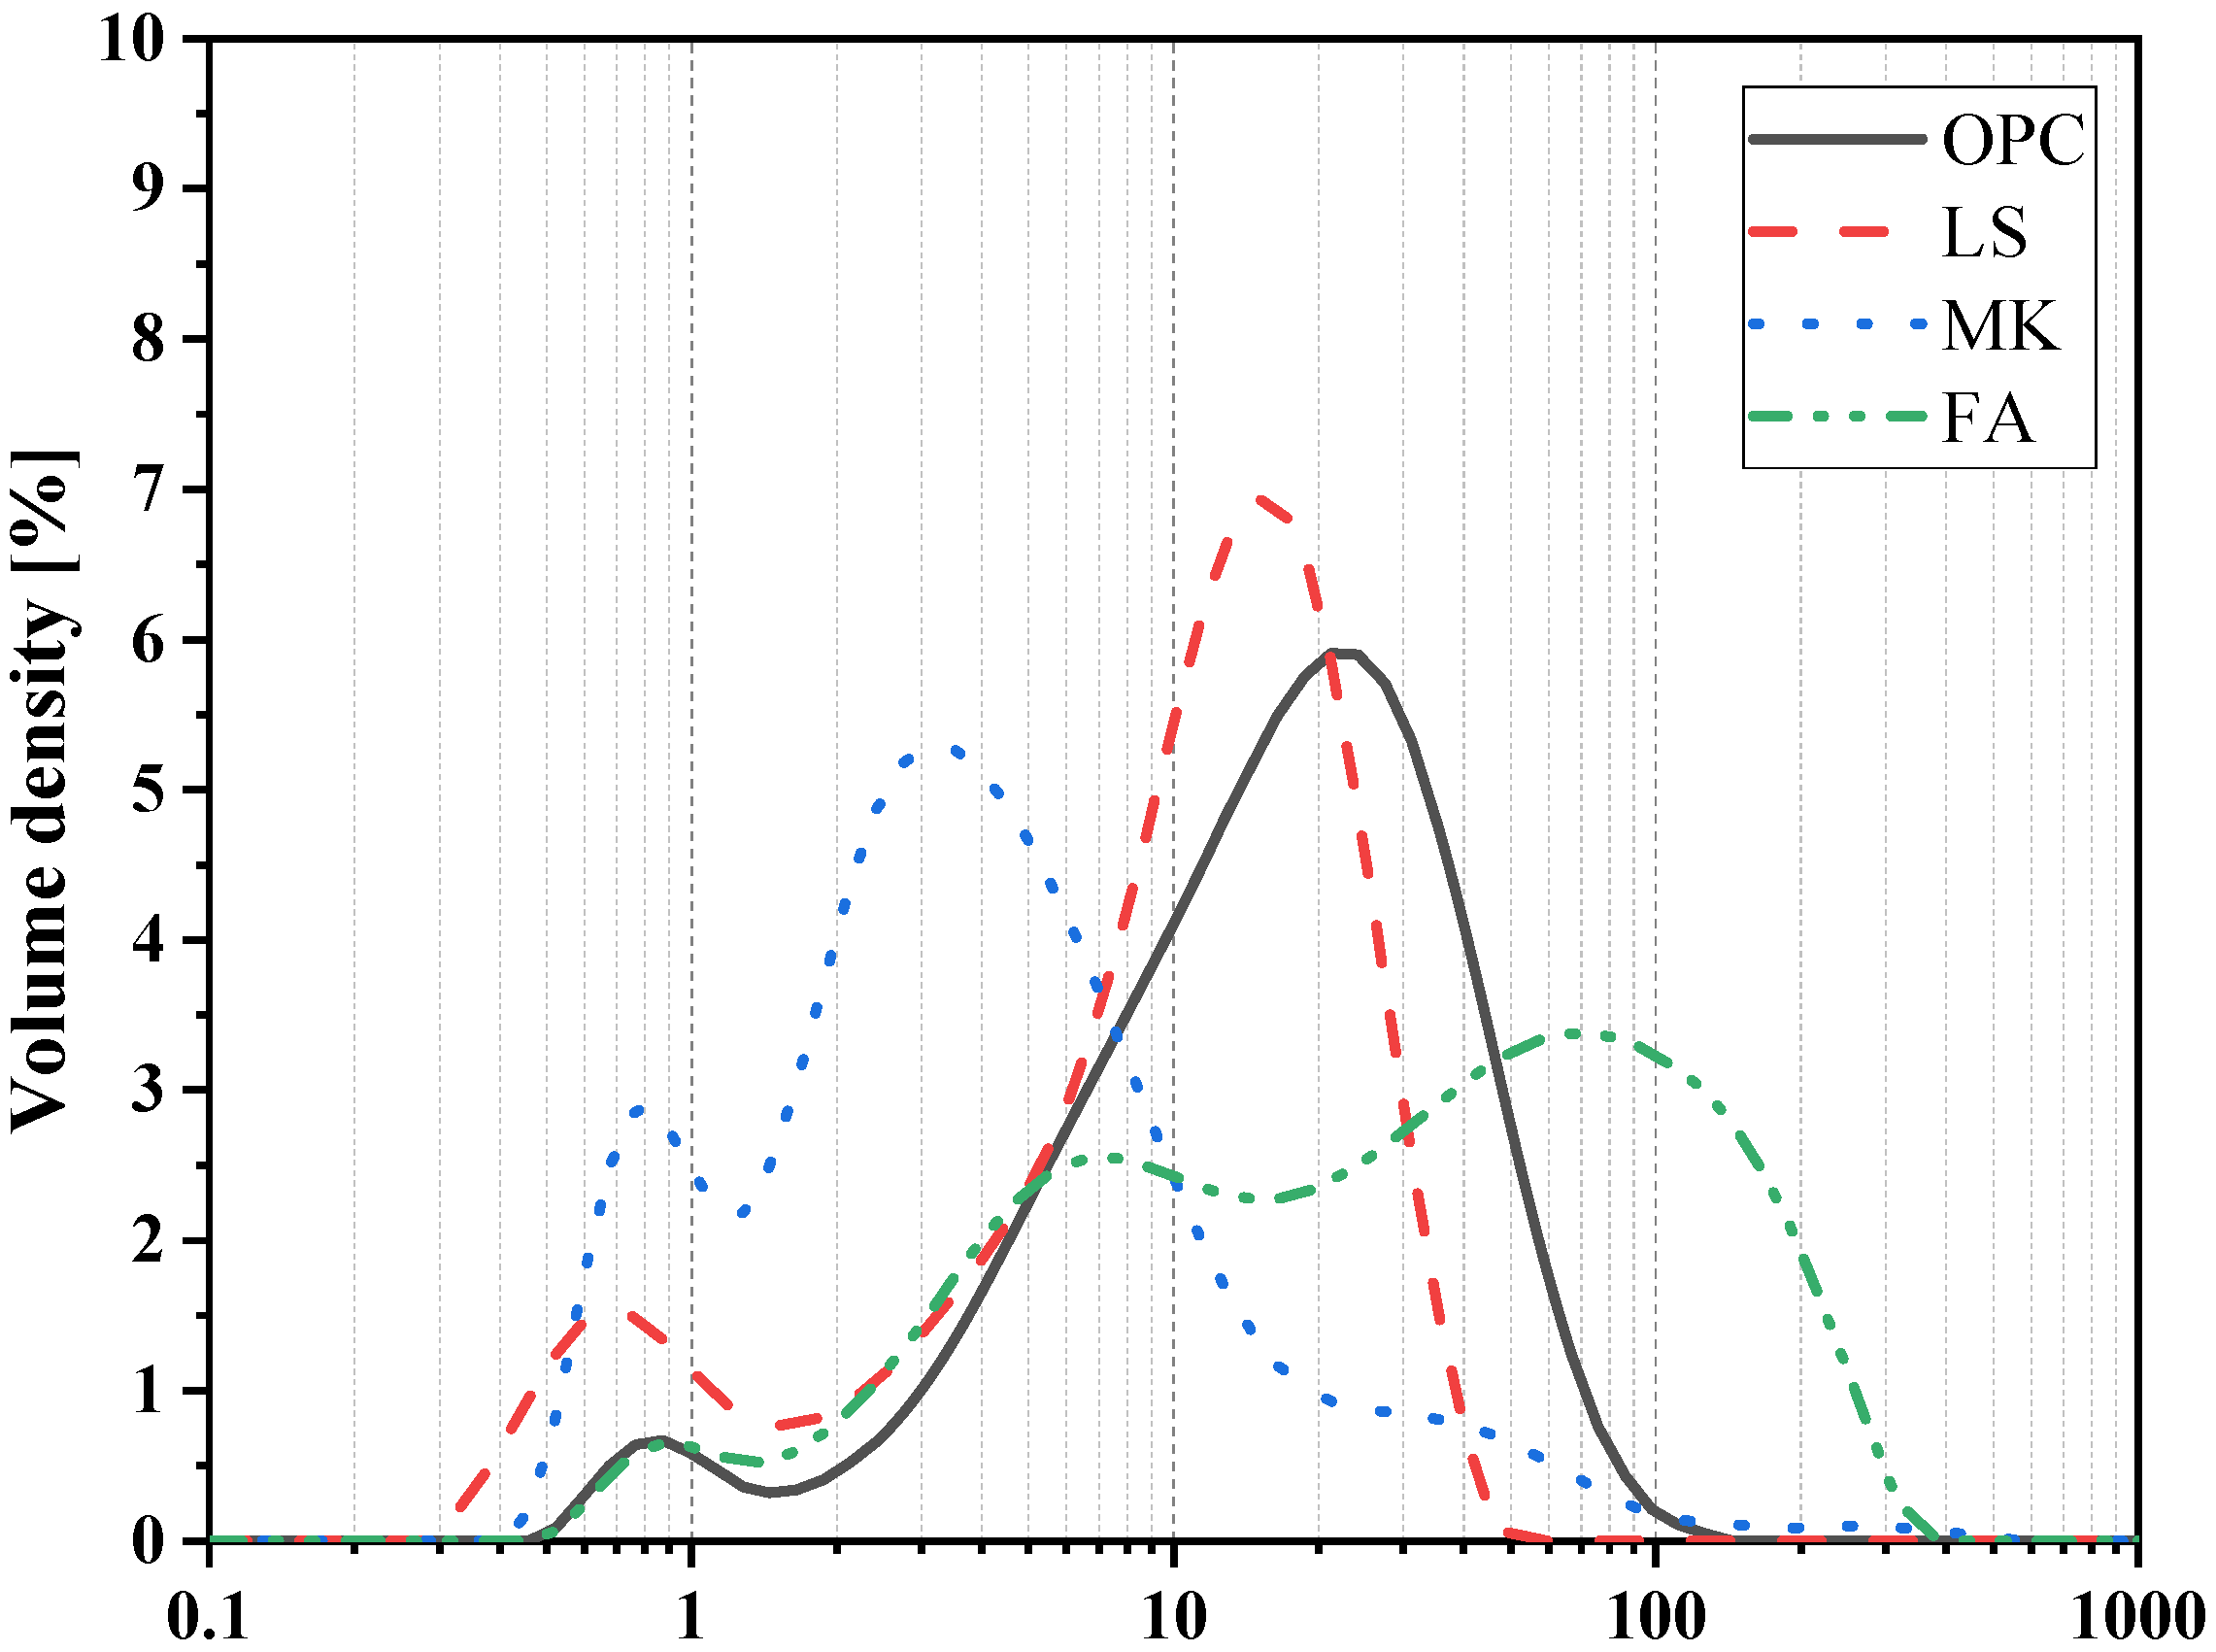
2.1. Materials Characterization
2.2. Mixed Design and Preparation
2.3. Experimental Methods
2.3.1. Workability Test
2.3.2. Heat of Hydration
2.3.3. Ultrasonic Pulse Velocity
2.3.4. Compressive Strength
2.3.5. Surface Resistivity
2.3.6. XRD and FTIR
3. Results
3.1. Workability Test
3.2. Heat of Hydration
3.3. Compressive Strength
3.4. Ultrasonic Pulse Velocity
3.5. Surface Resistivity
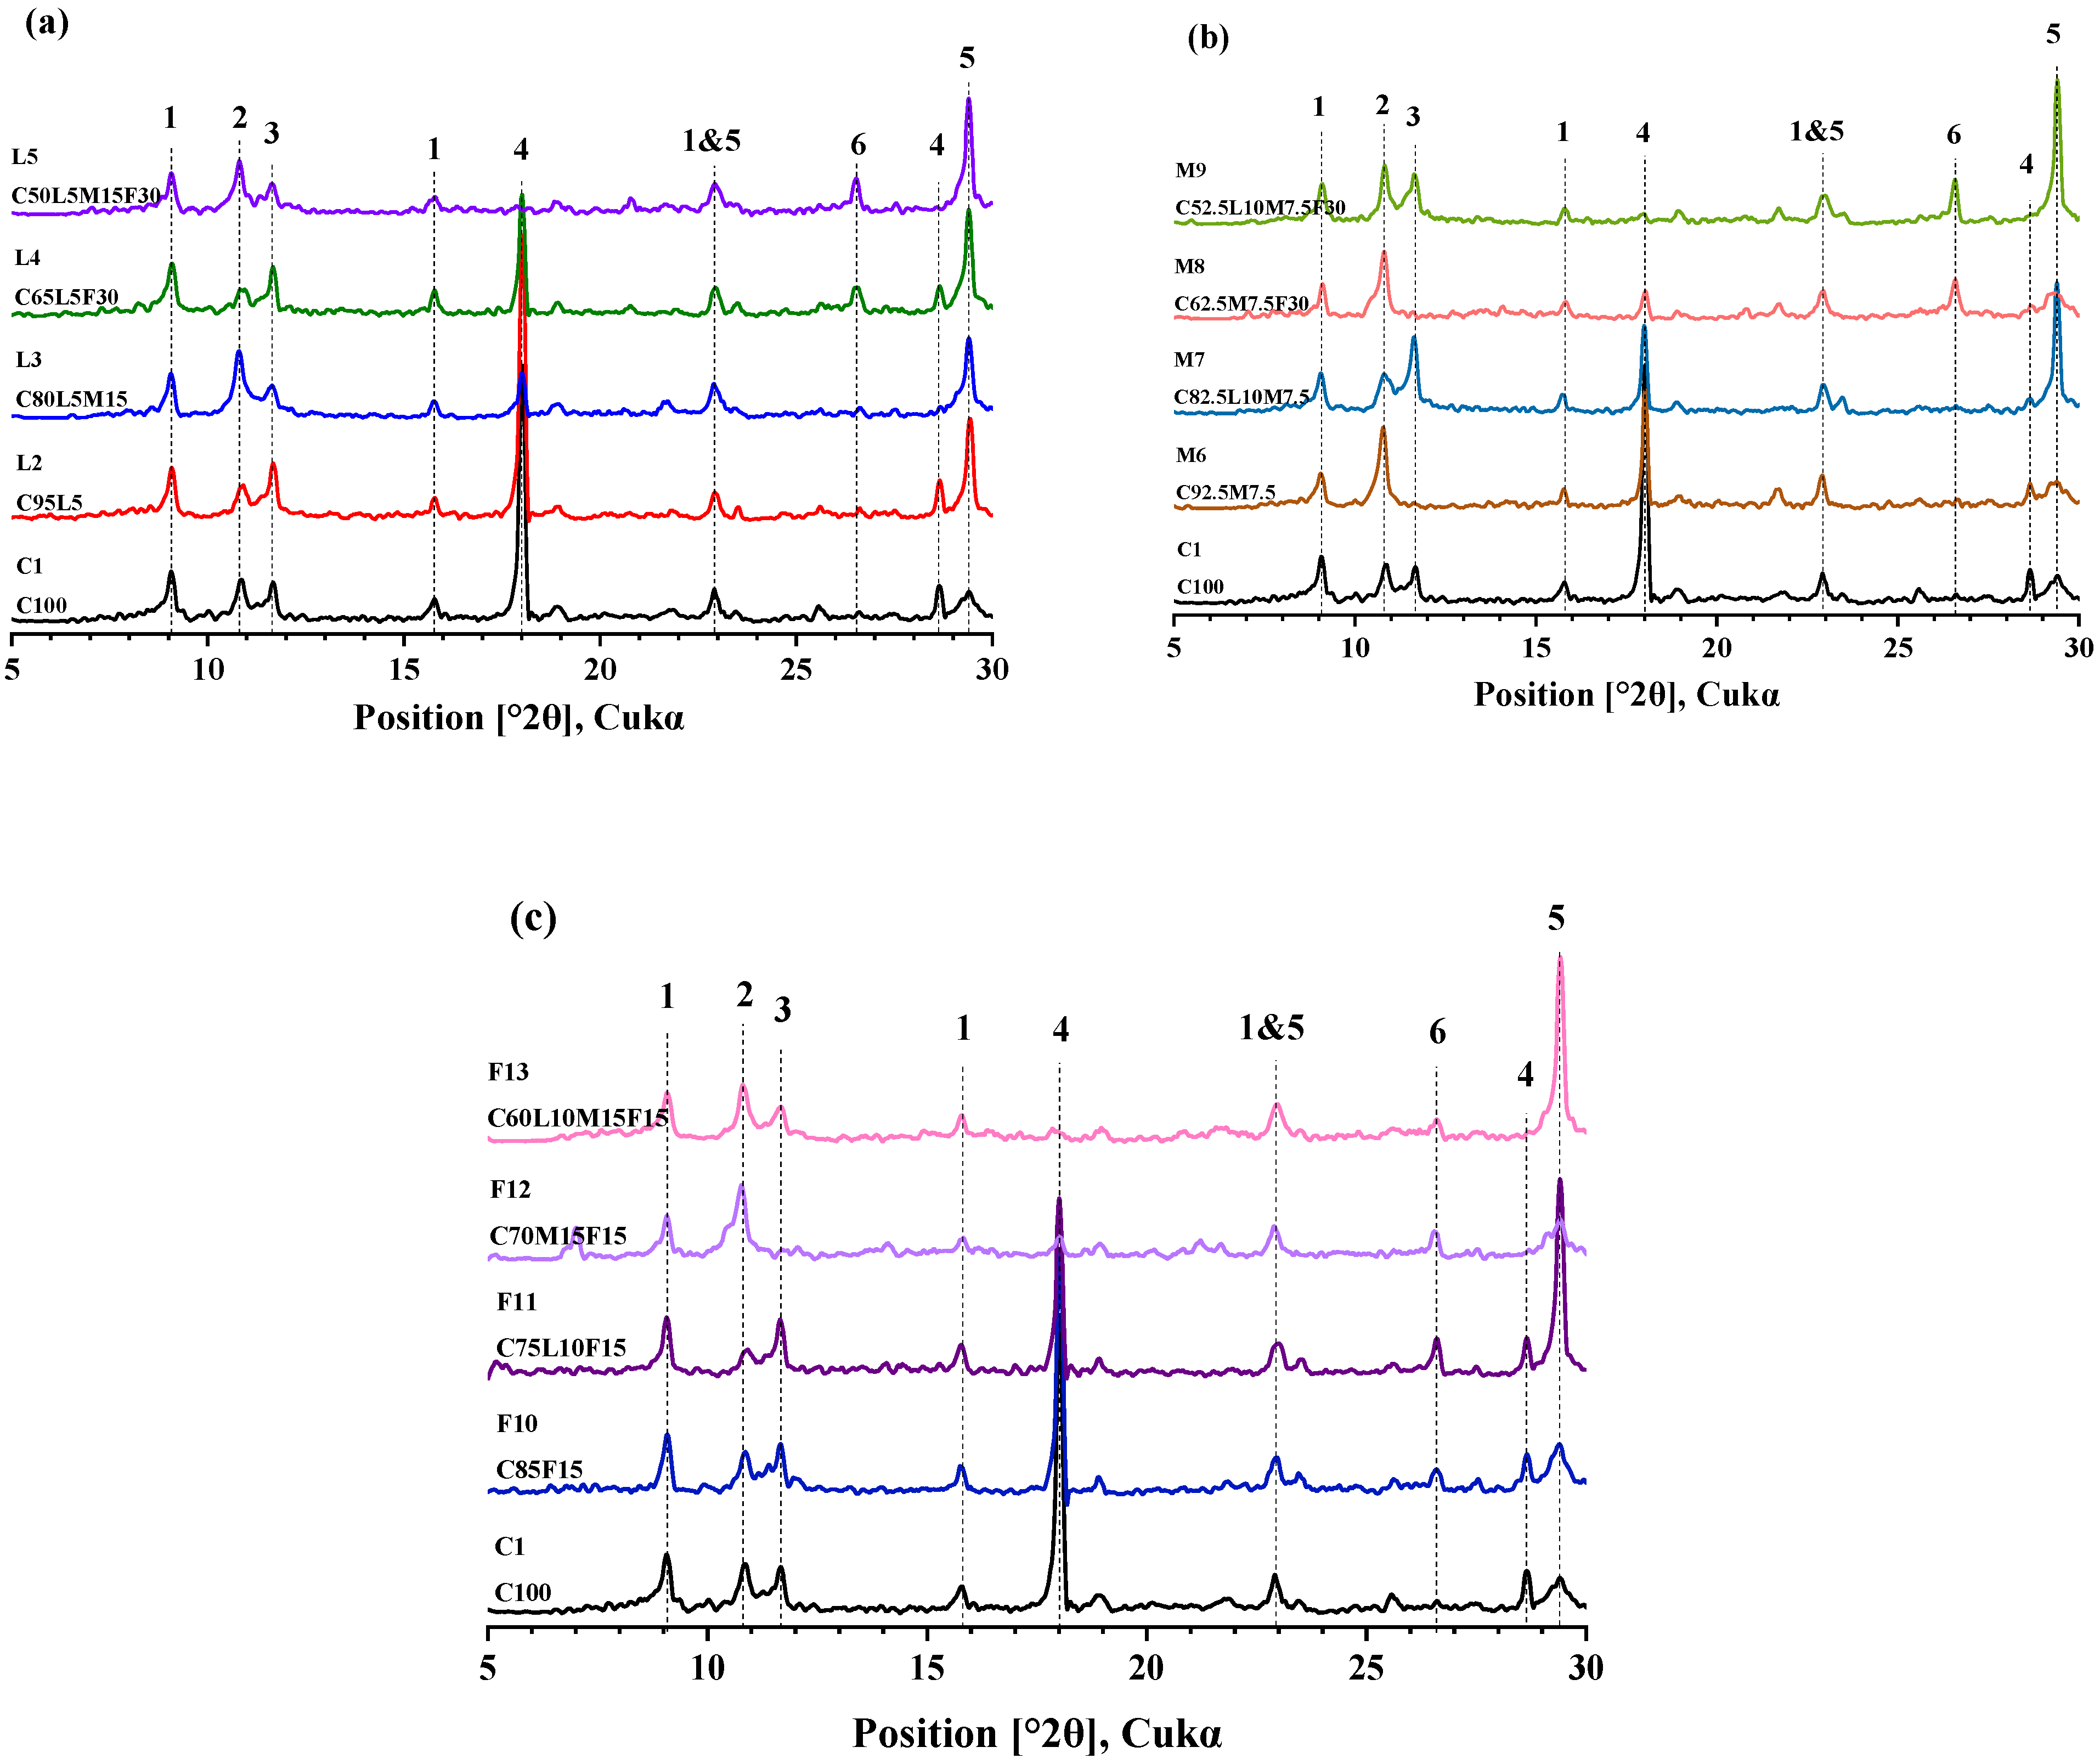
3.6. XRD
3.7. ATR-FTIR
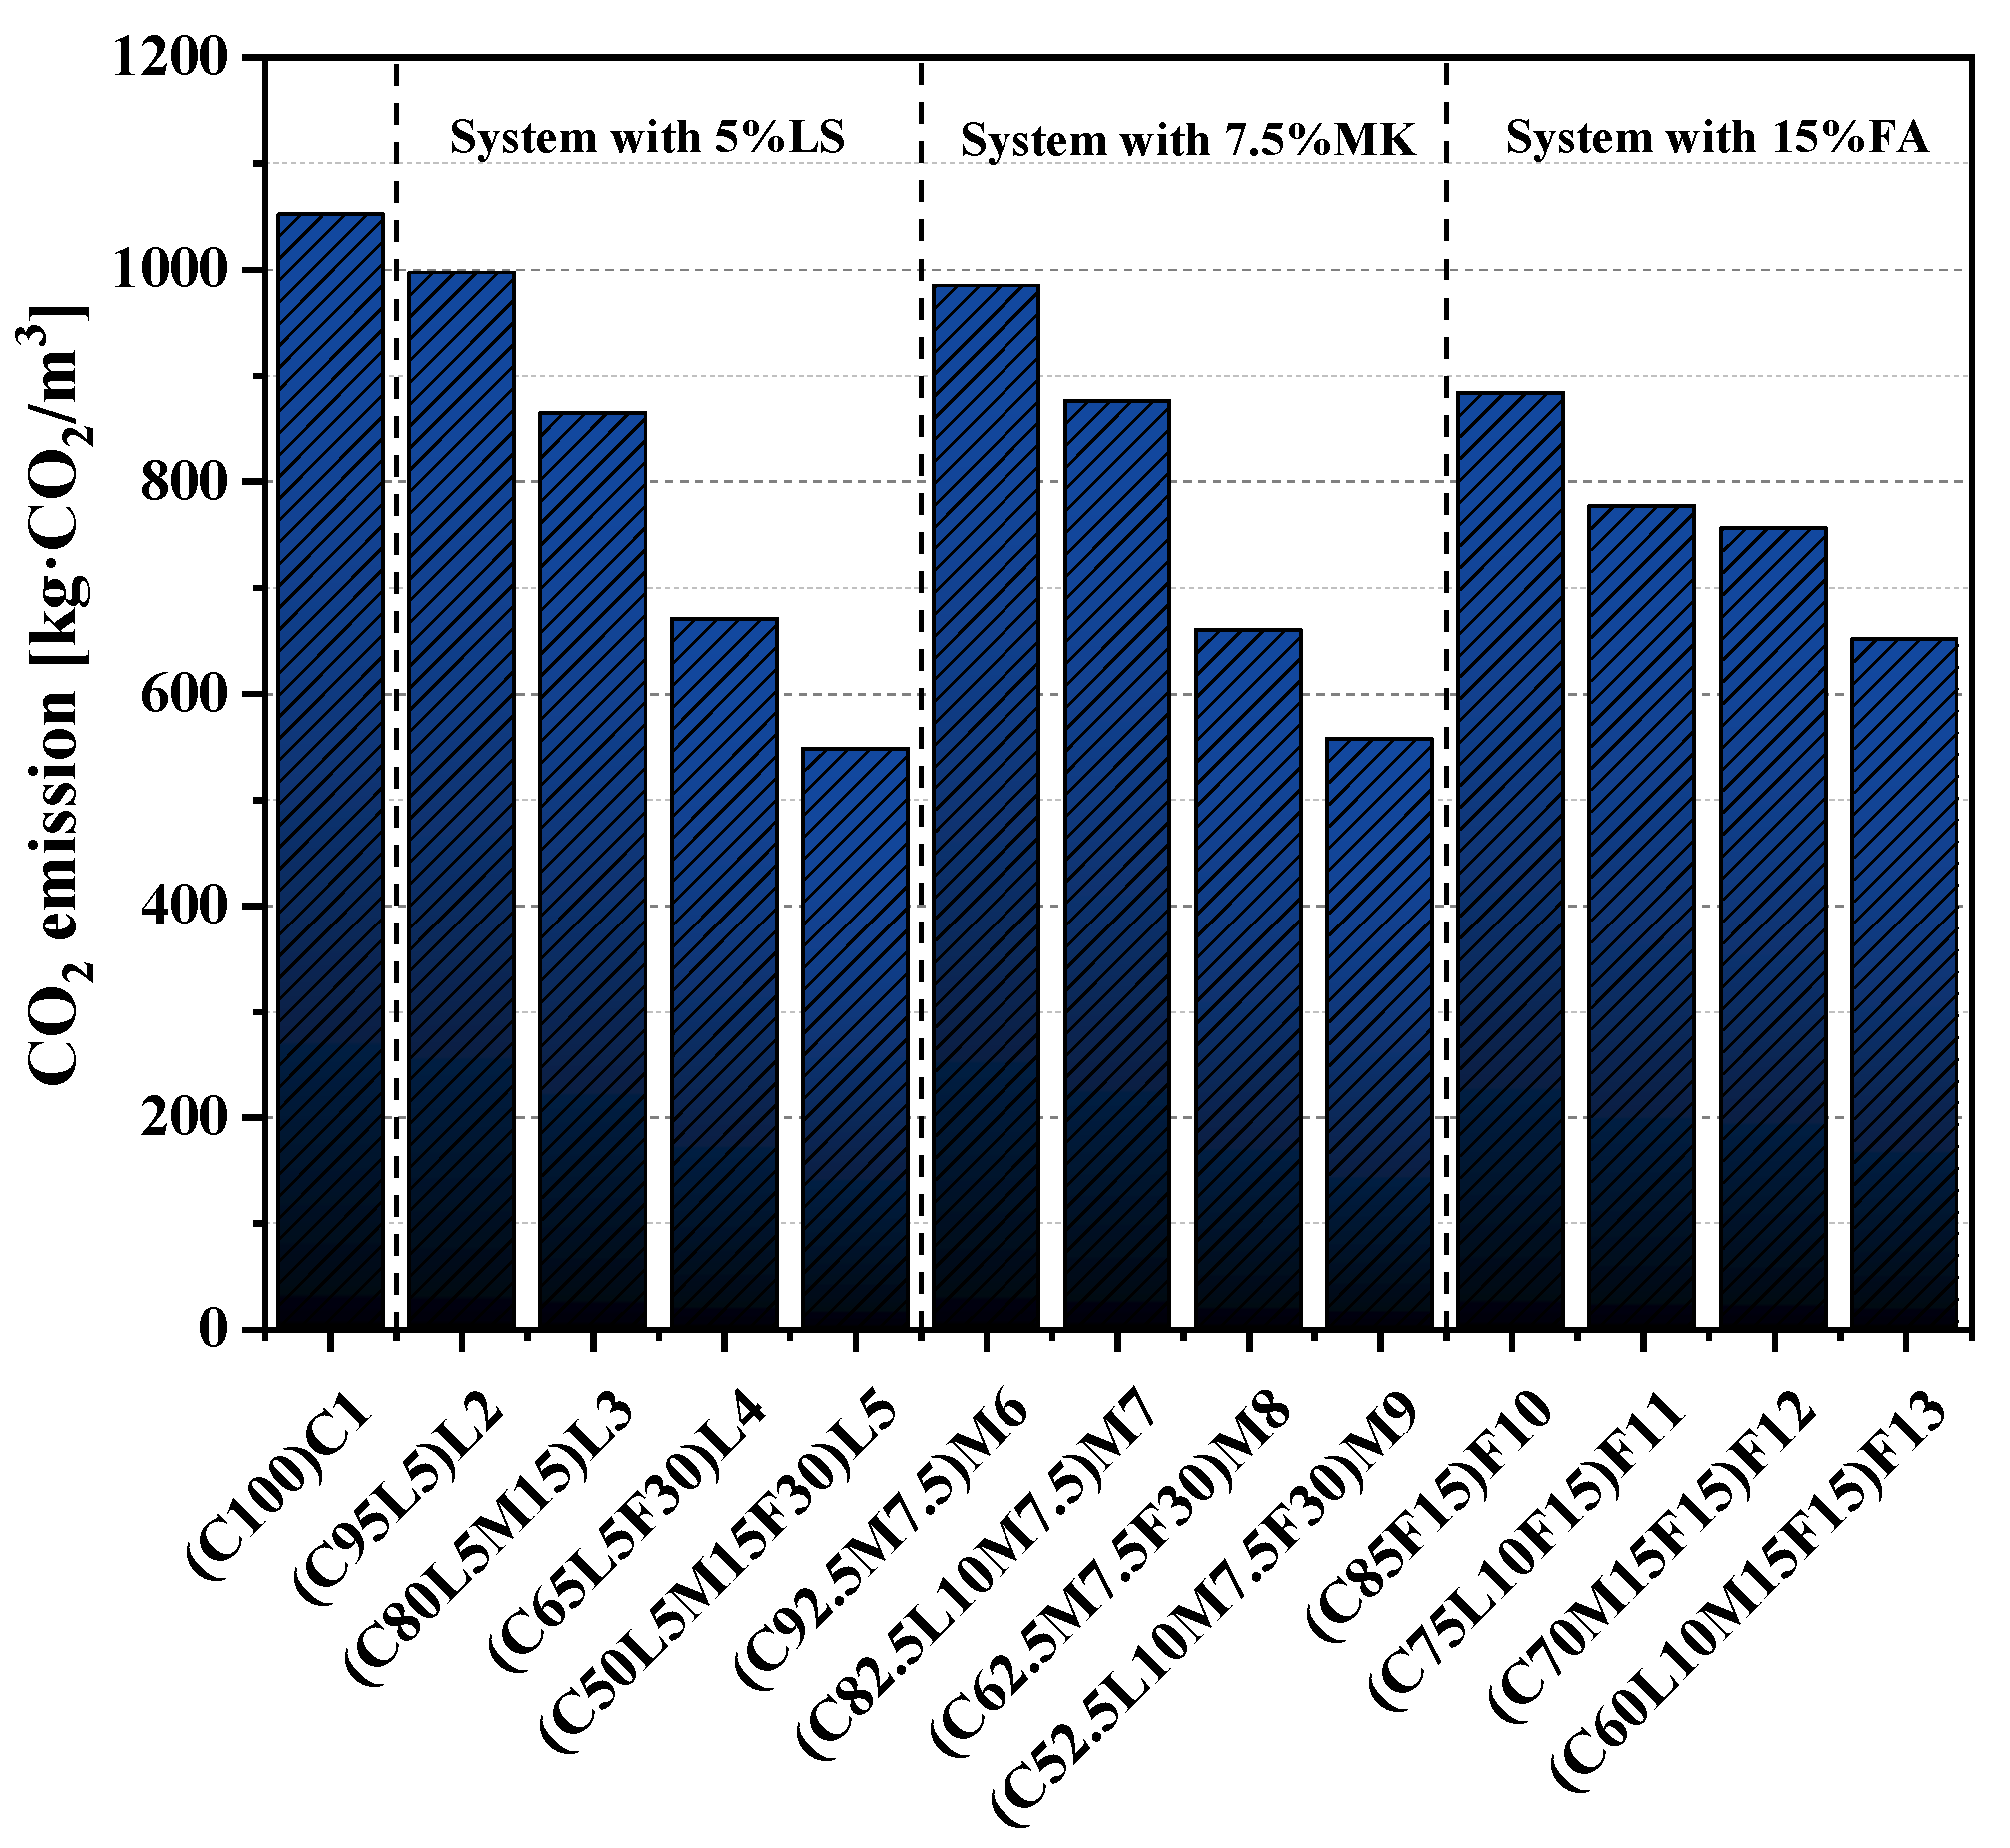
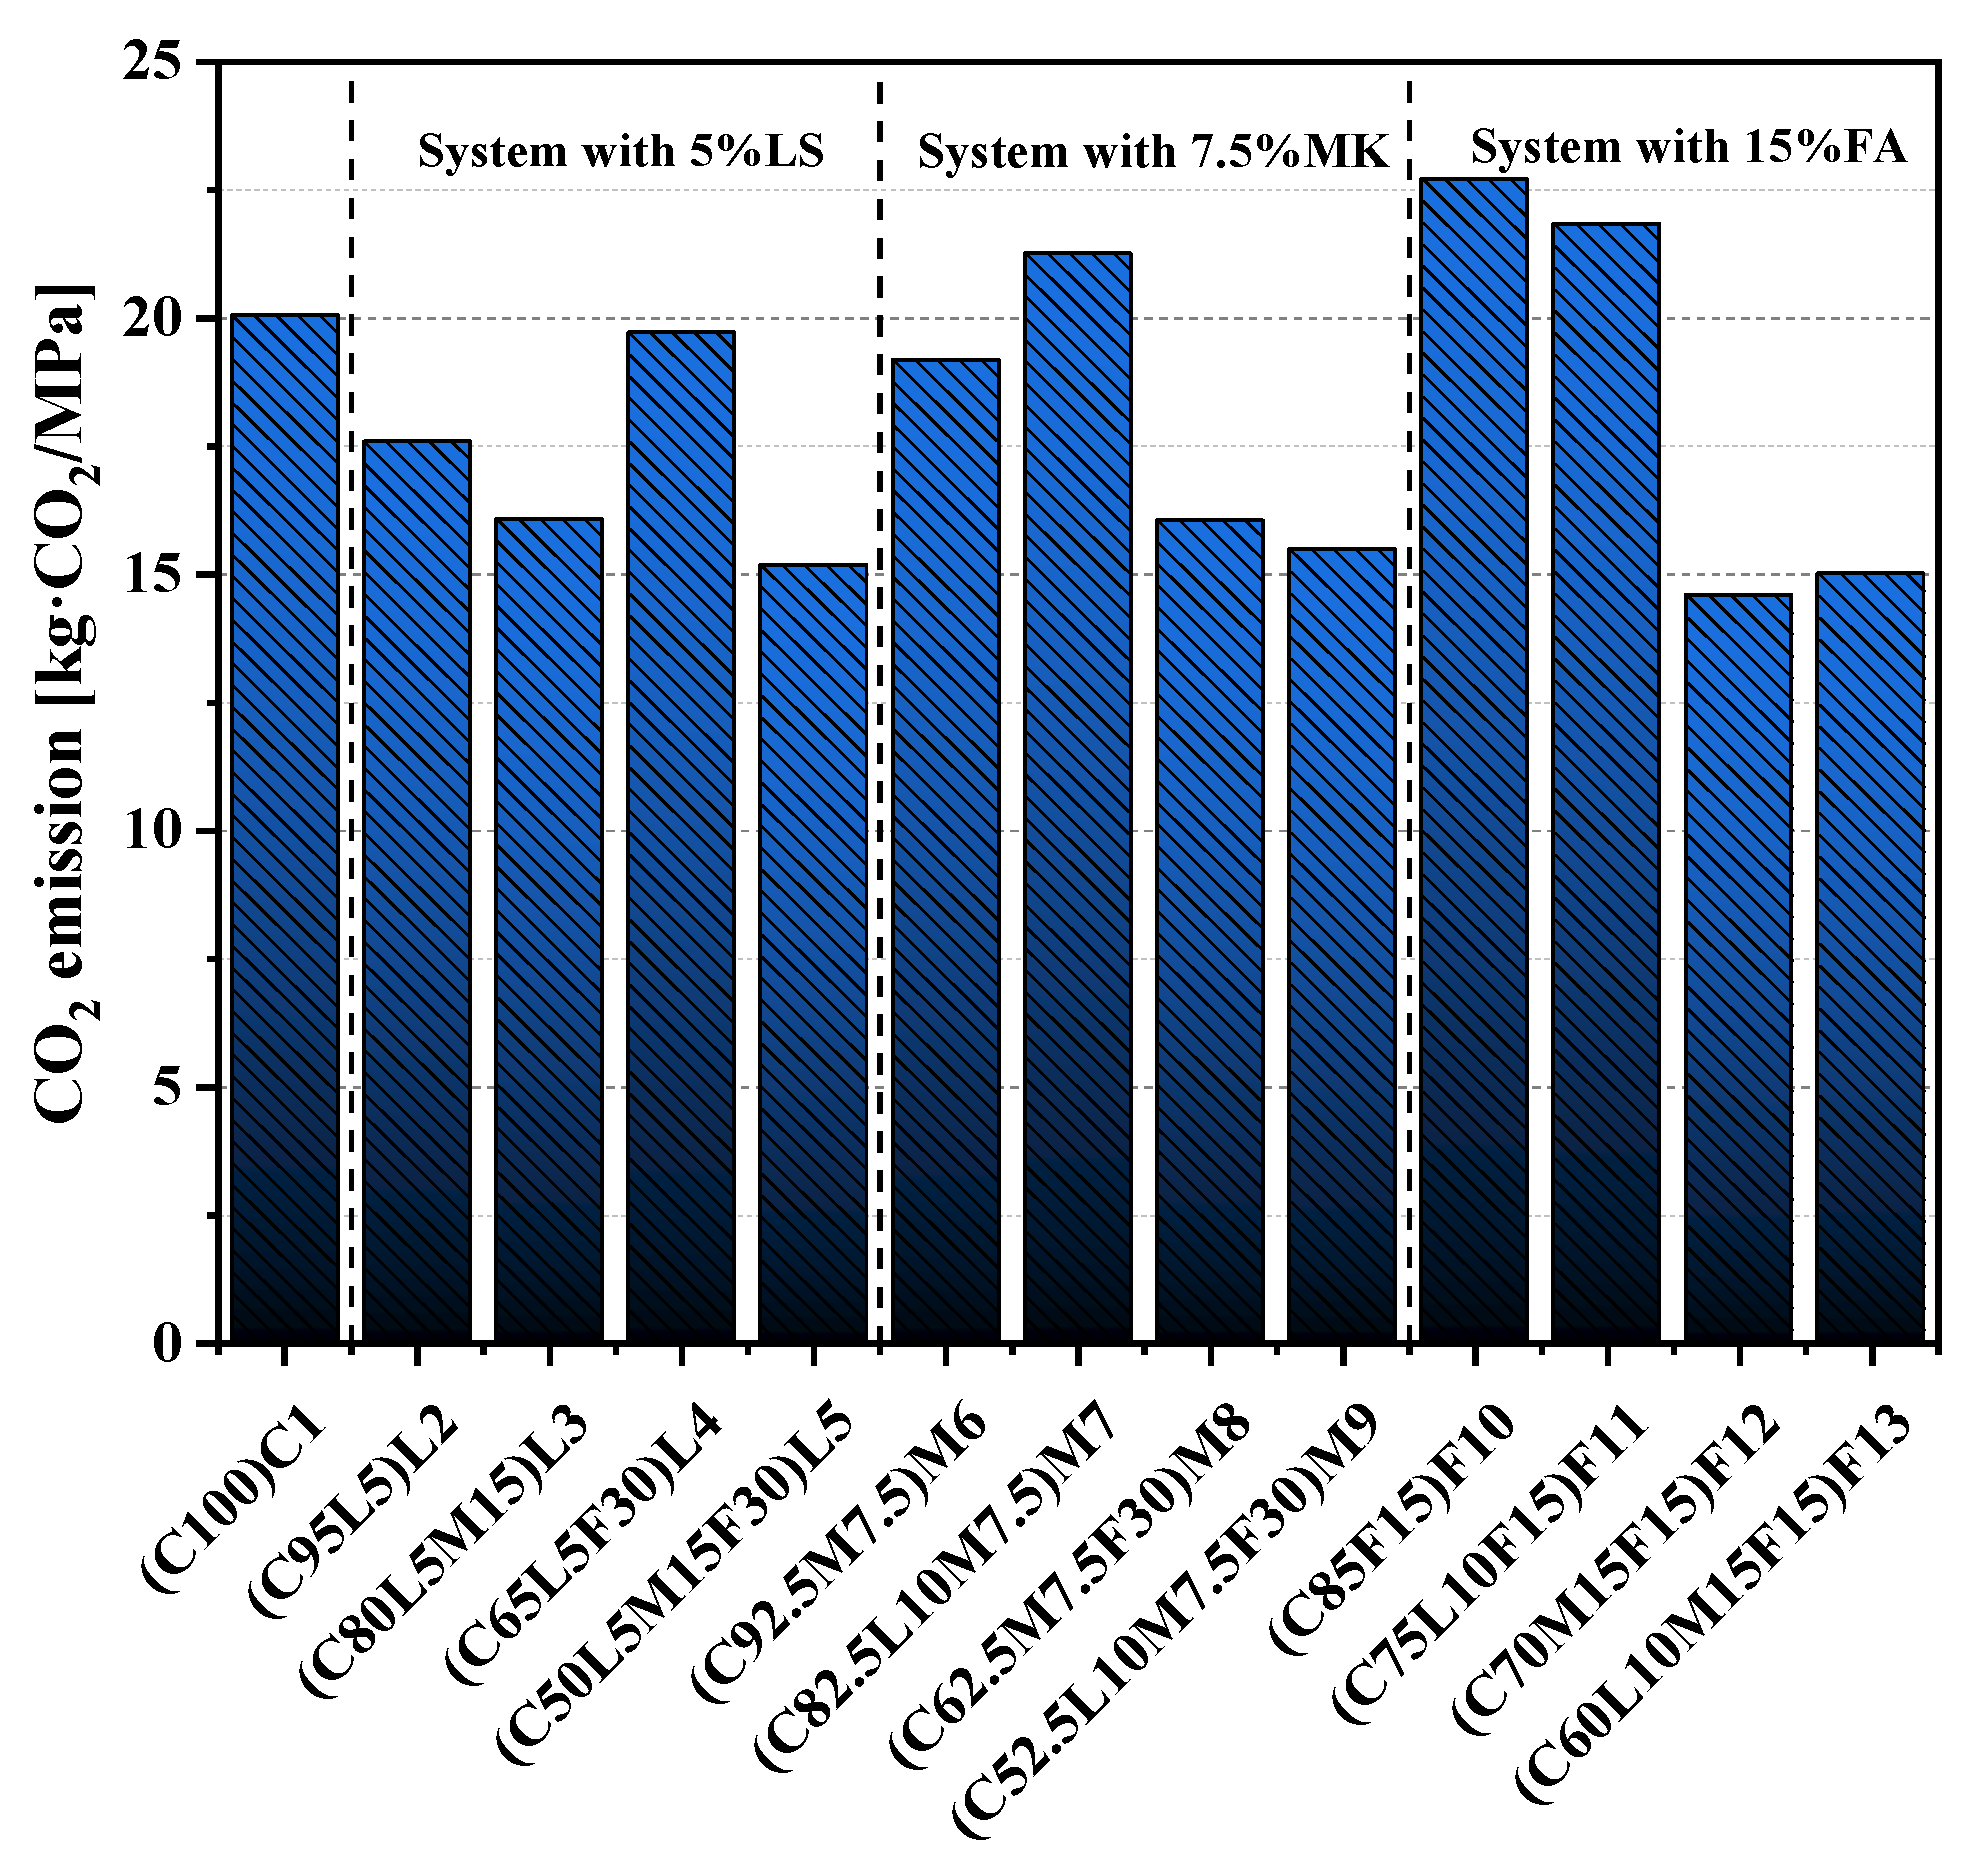
3.8. CO2 Emissions
4. Discussions
4.1. Correlation Analysis
4.2. Sustainability Analysis
5. Conclusions
- (1)
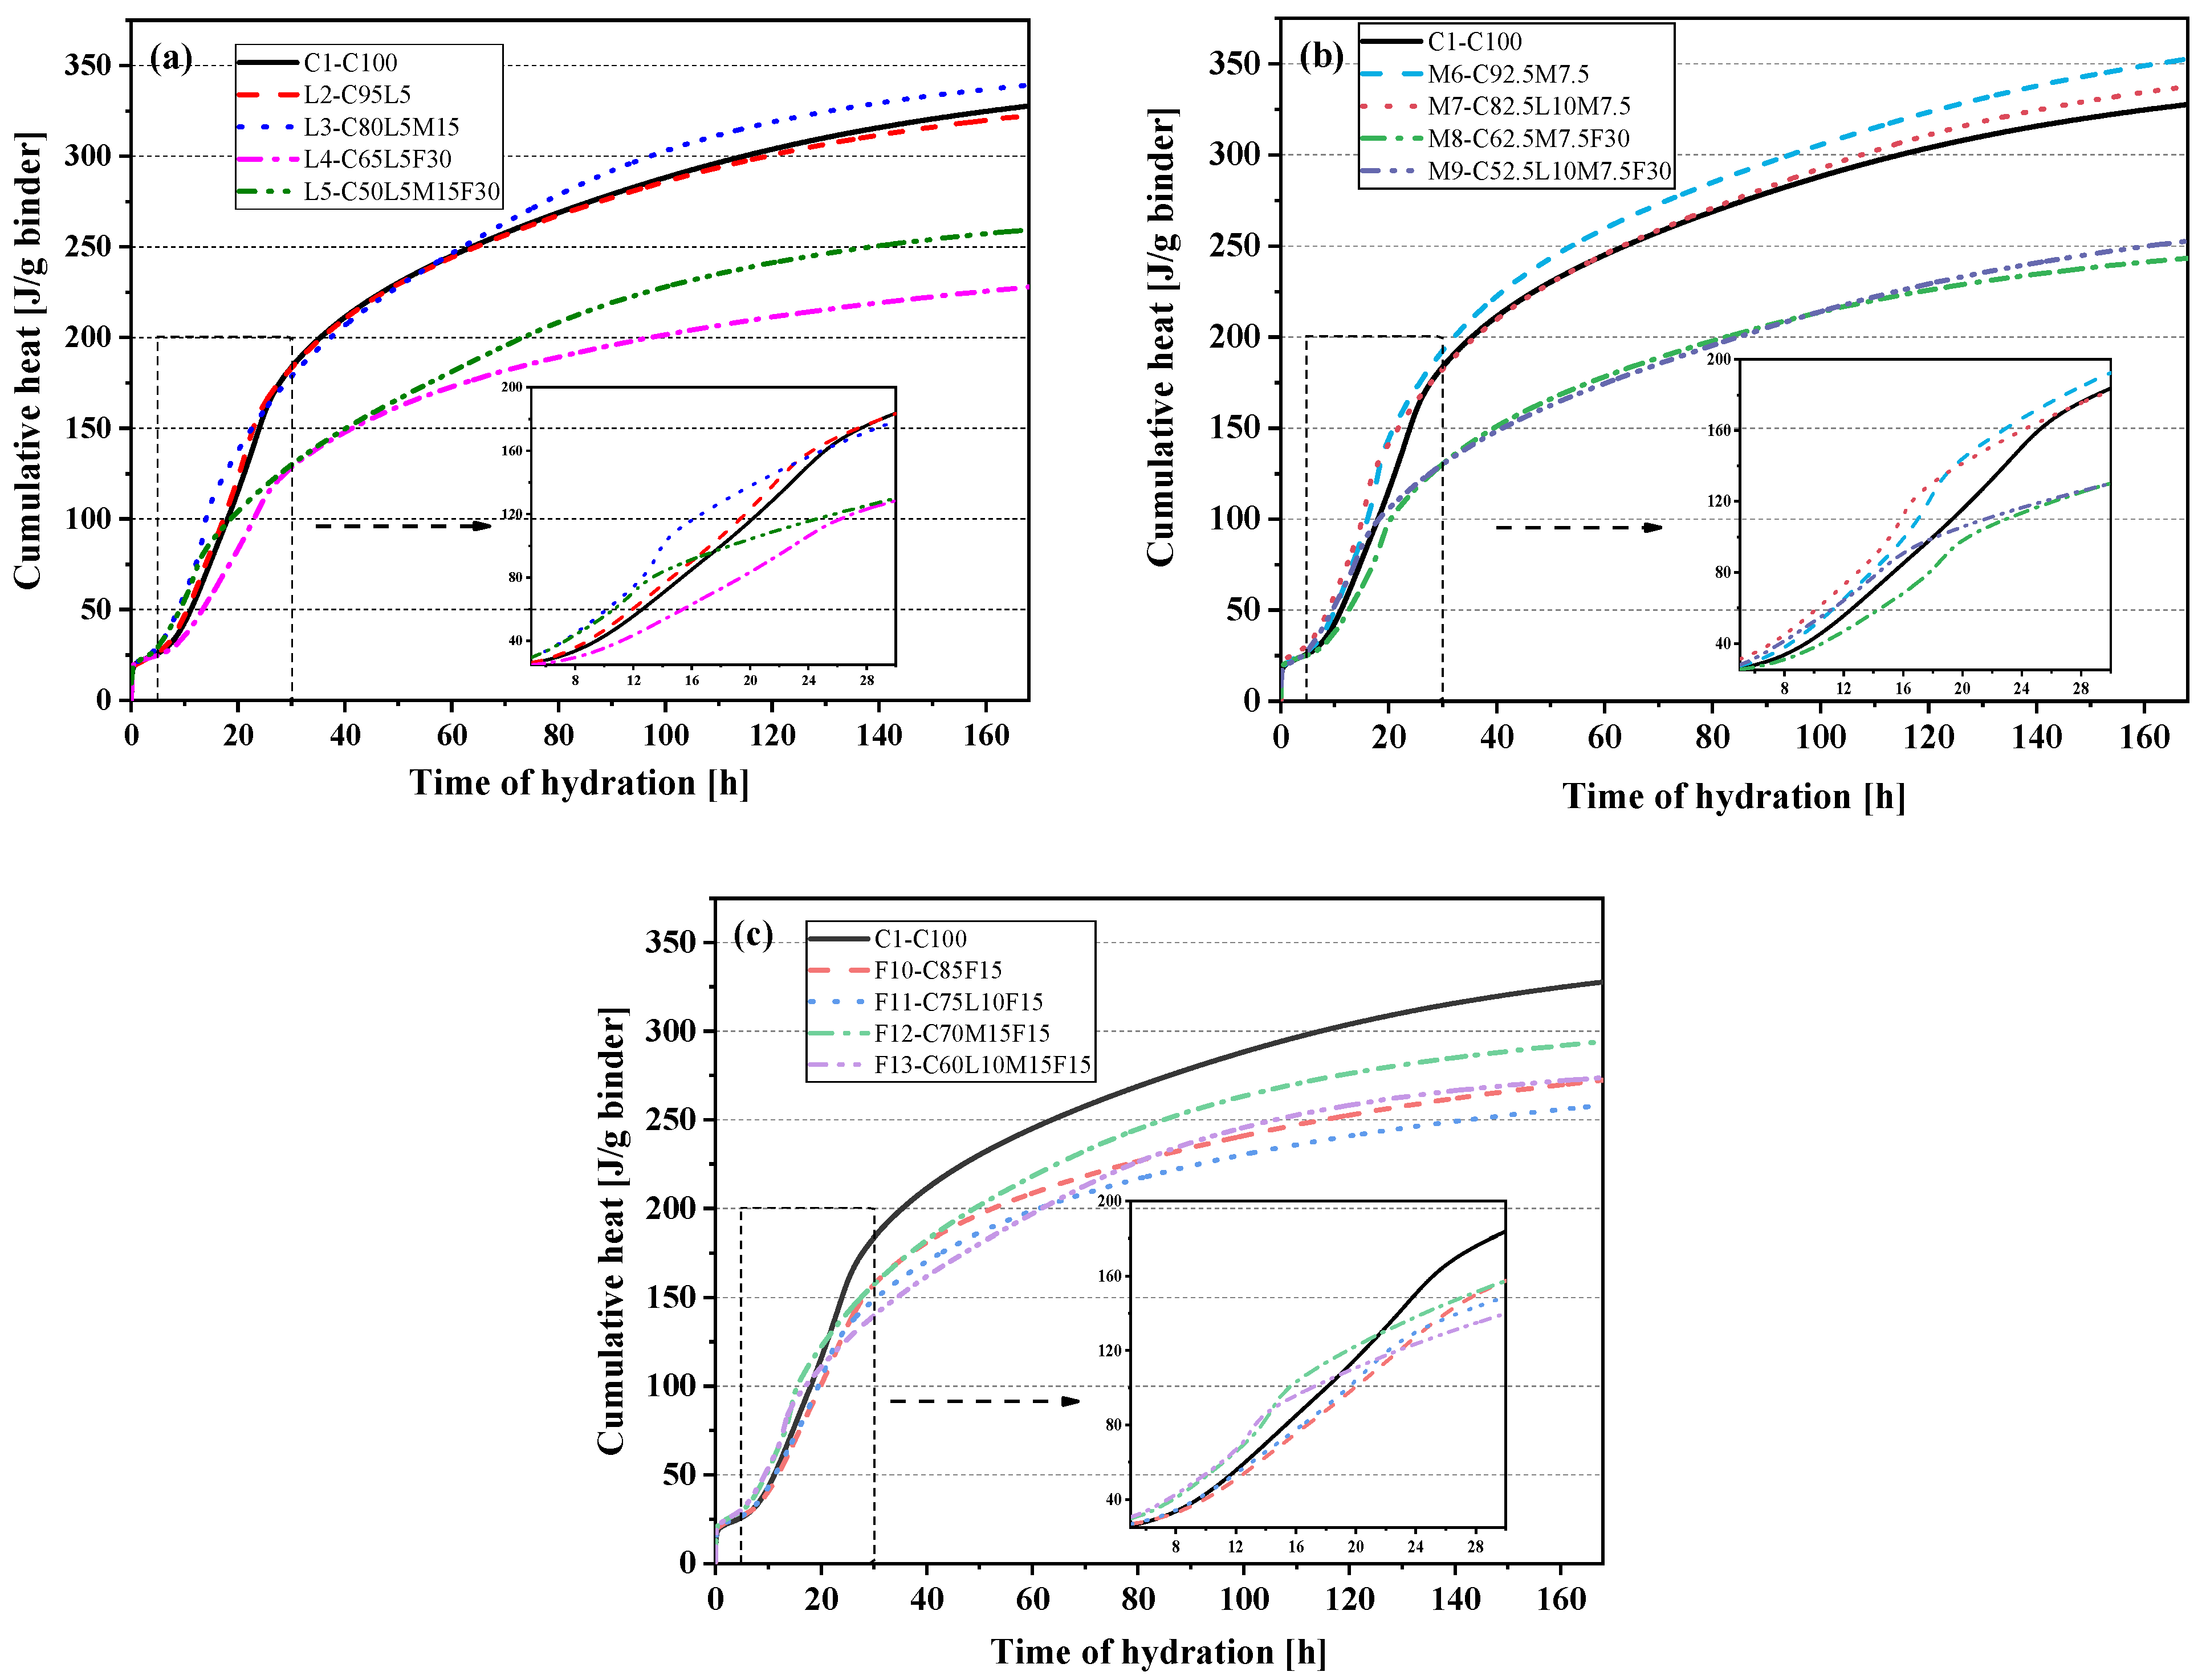
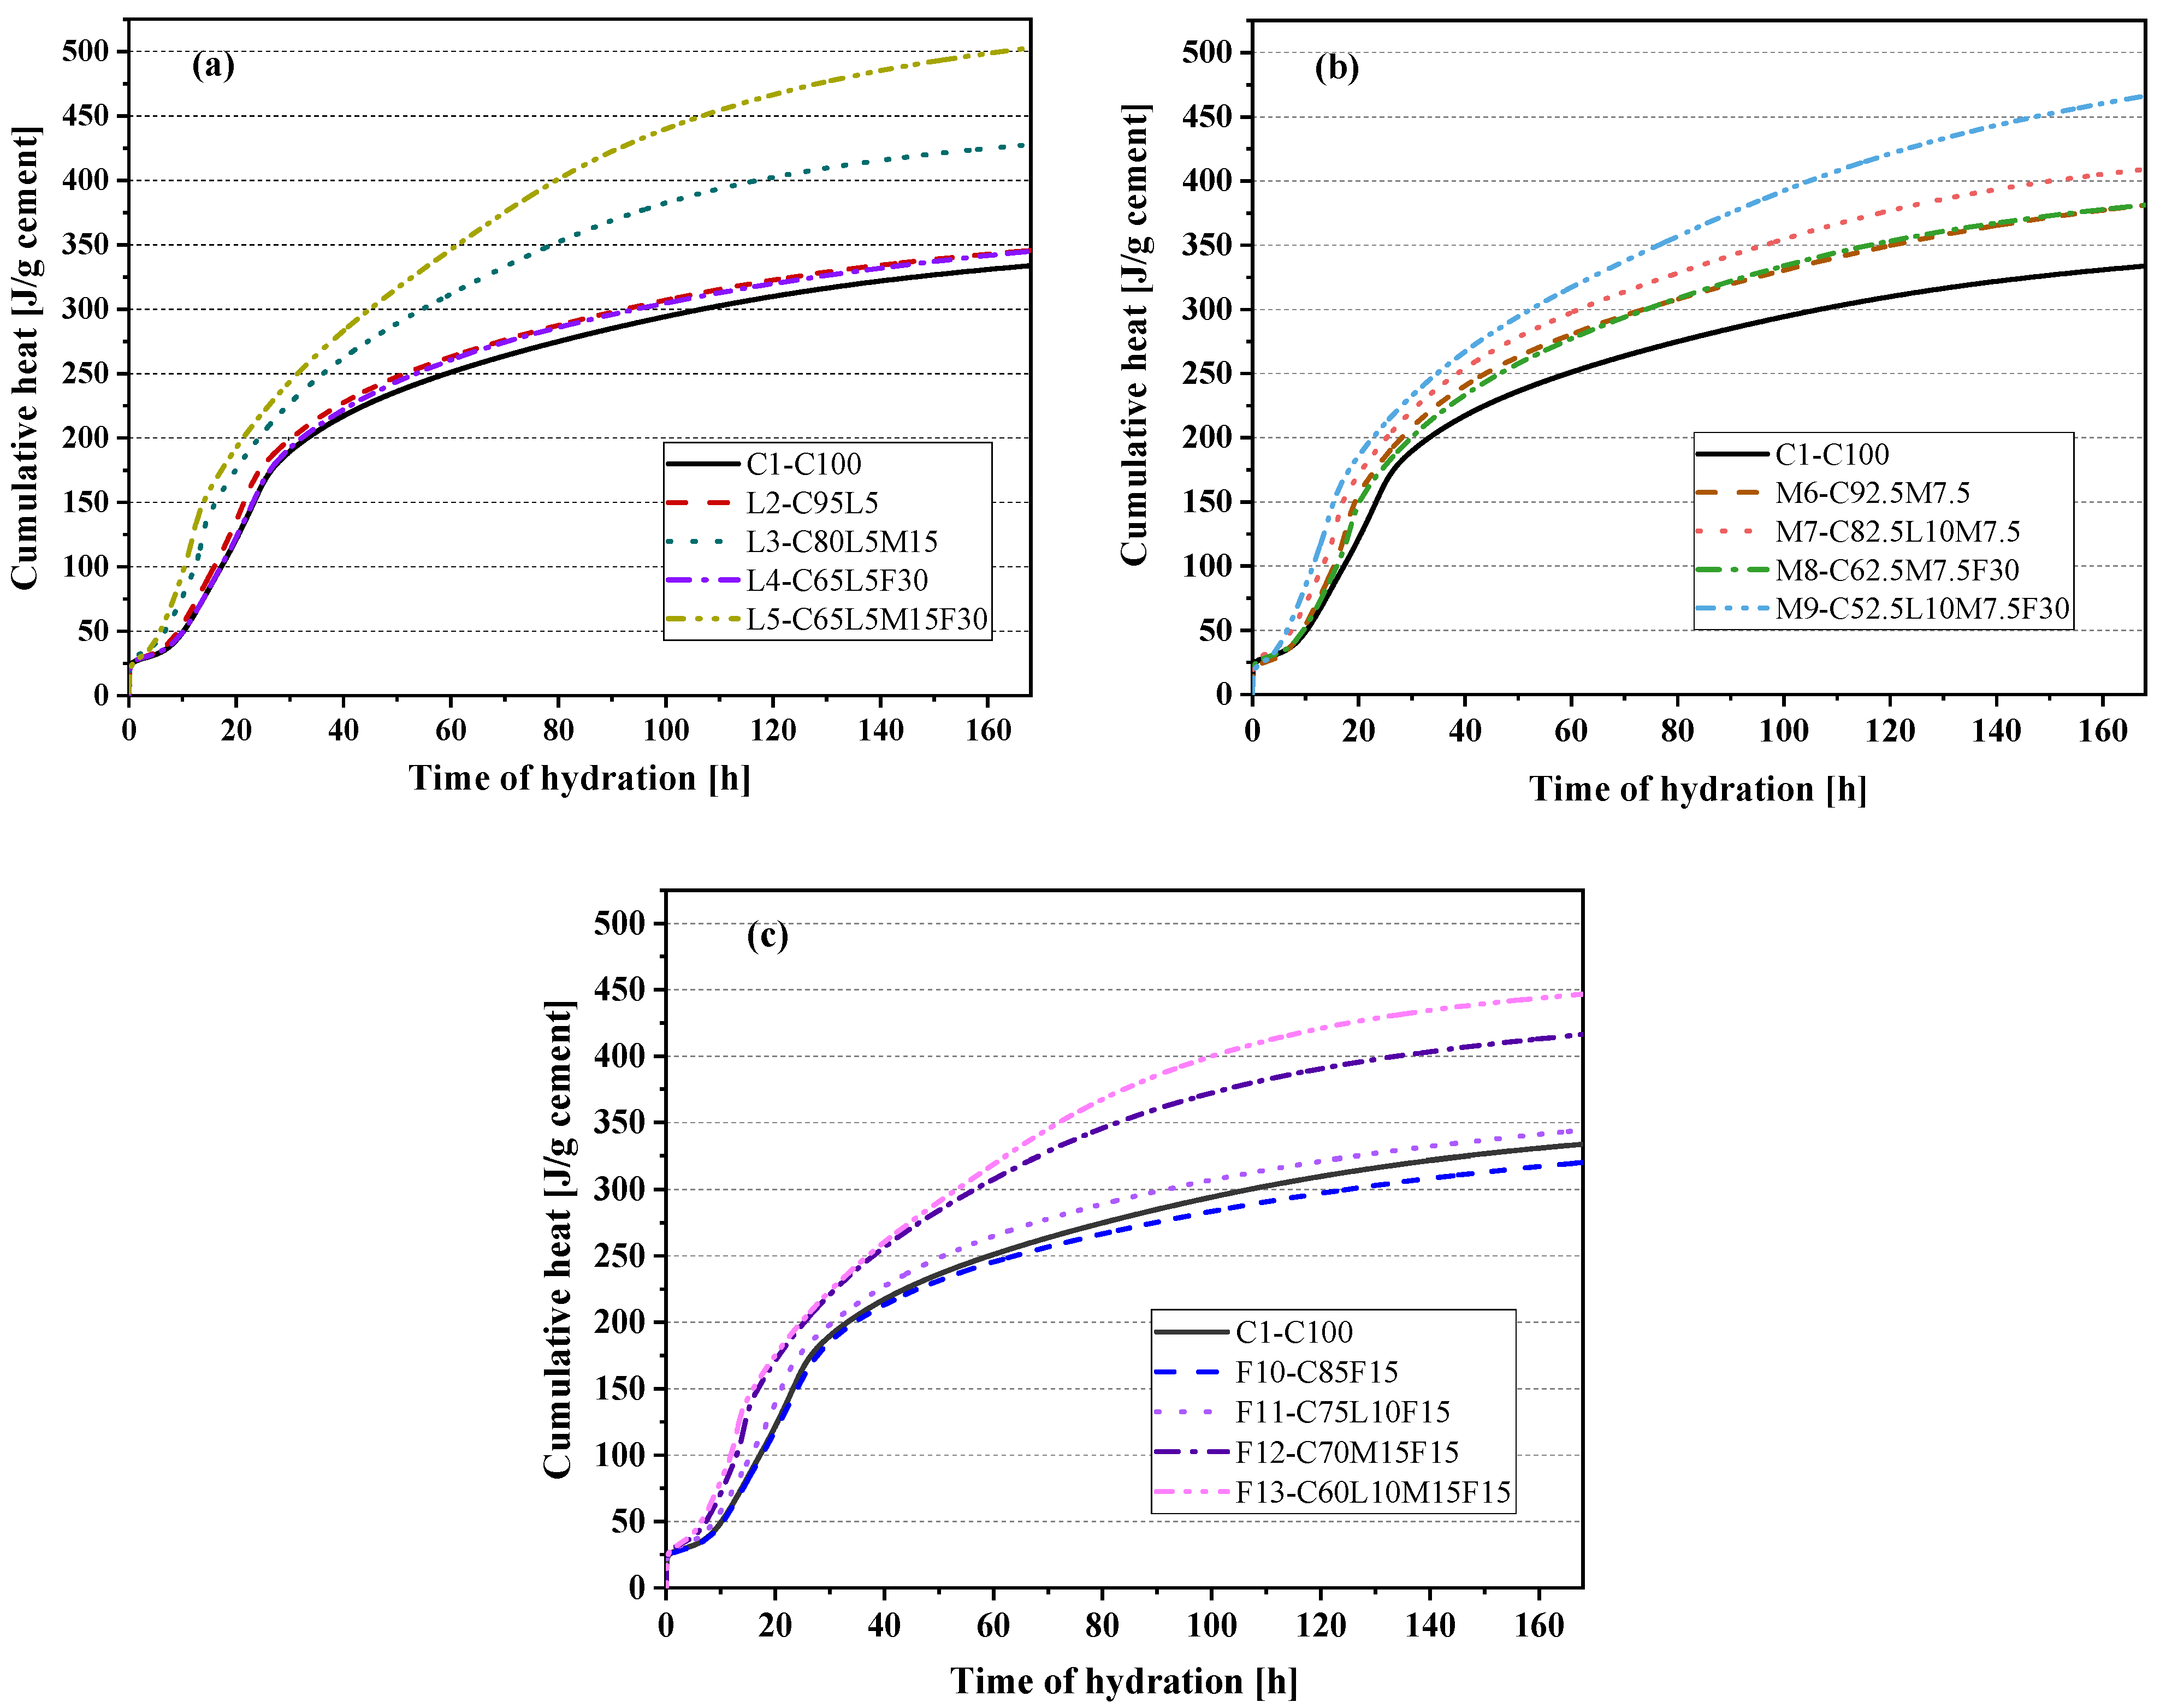
- Fly ash can effectively reduce the accumulated heat of hydration of the blended paste. The cumulative heat and compressive strength also showed an excellent linear relationship (Pearson’s correlation coefficient of 0.95).
- (2)
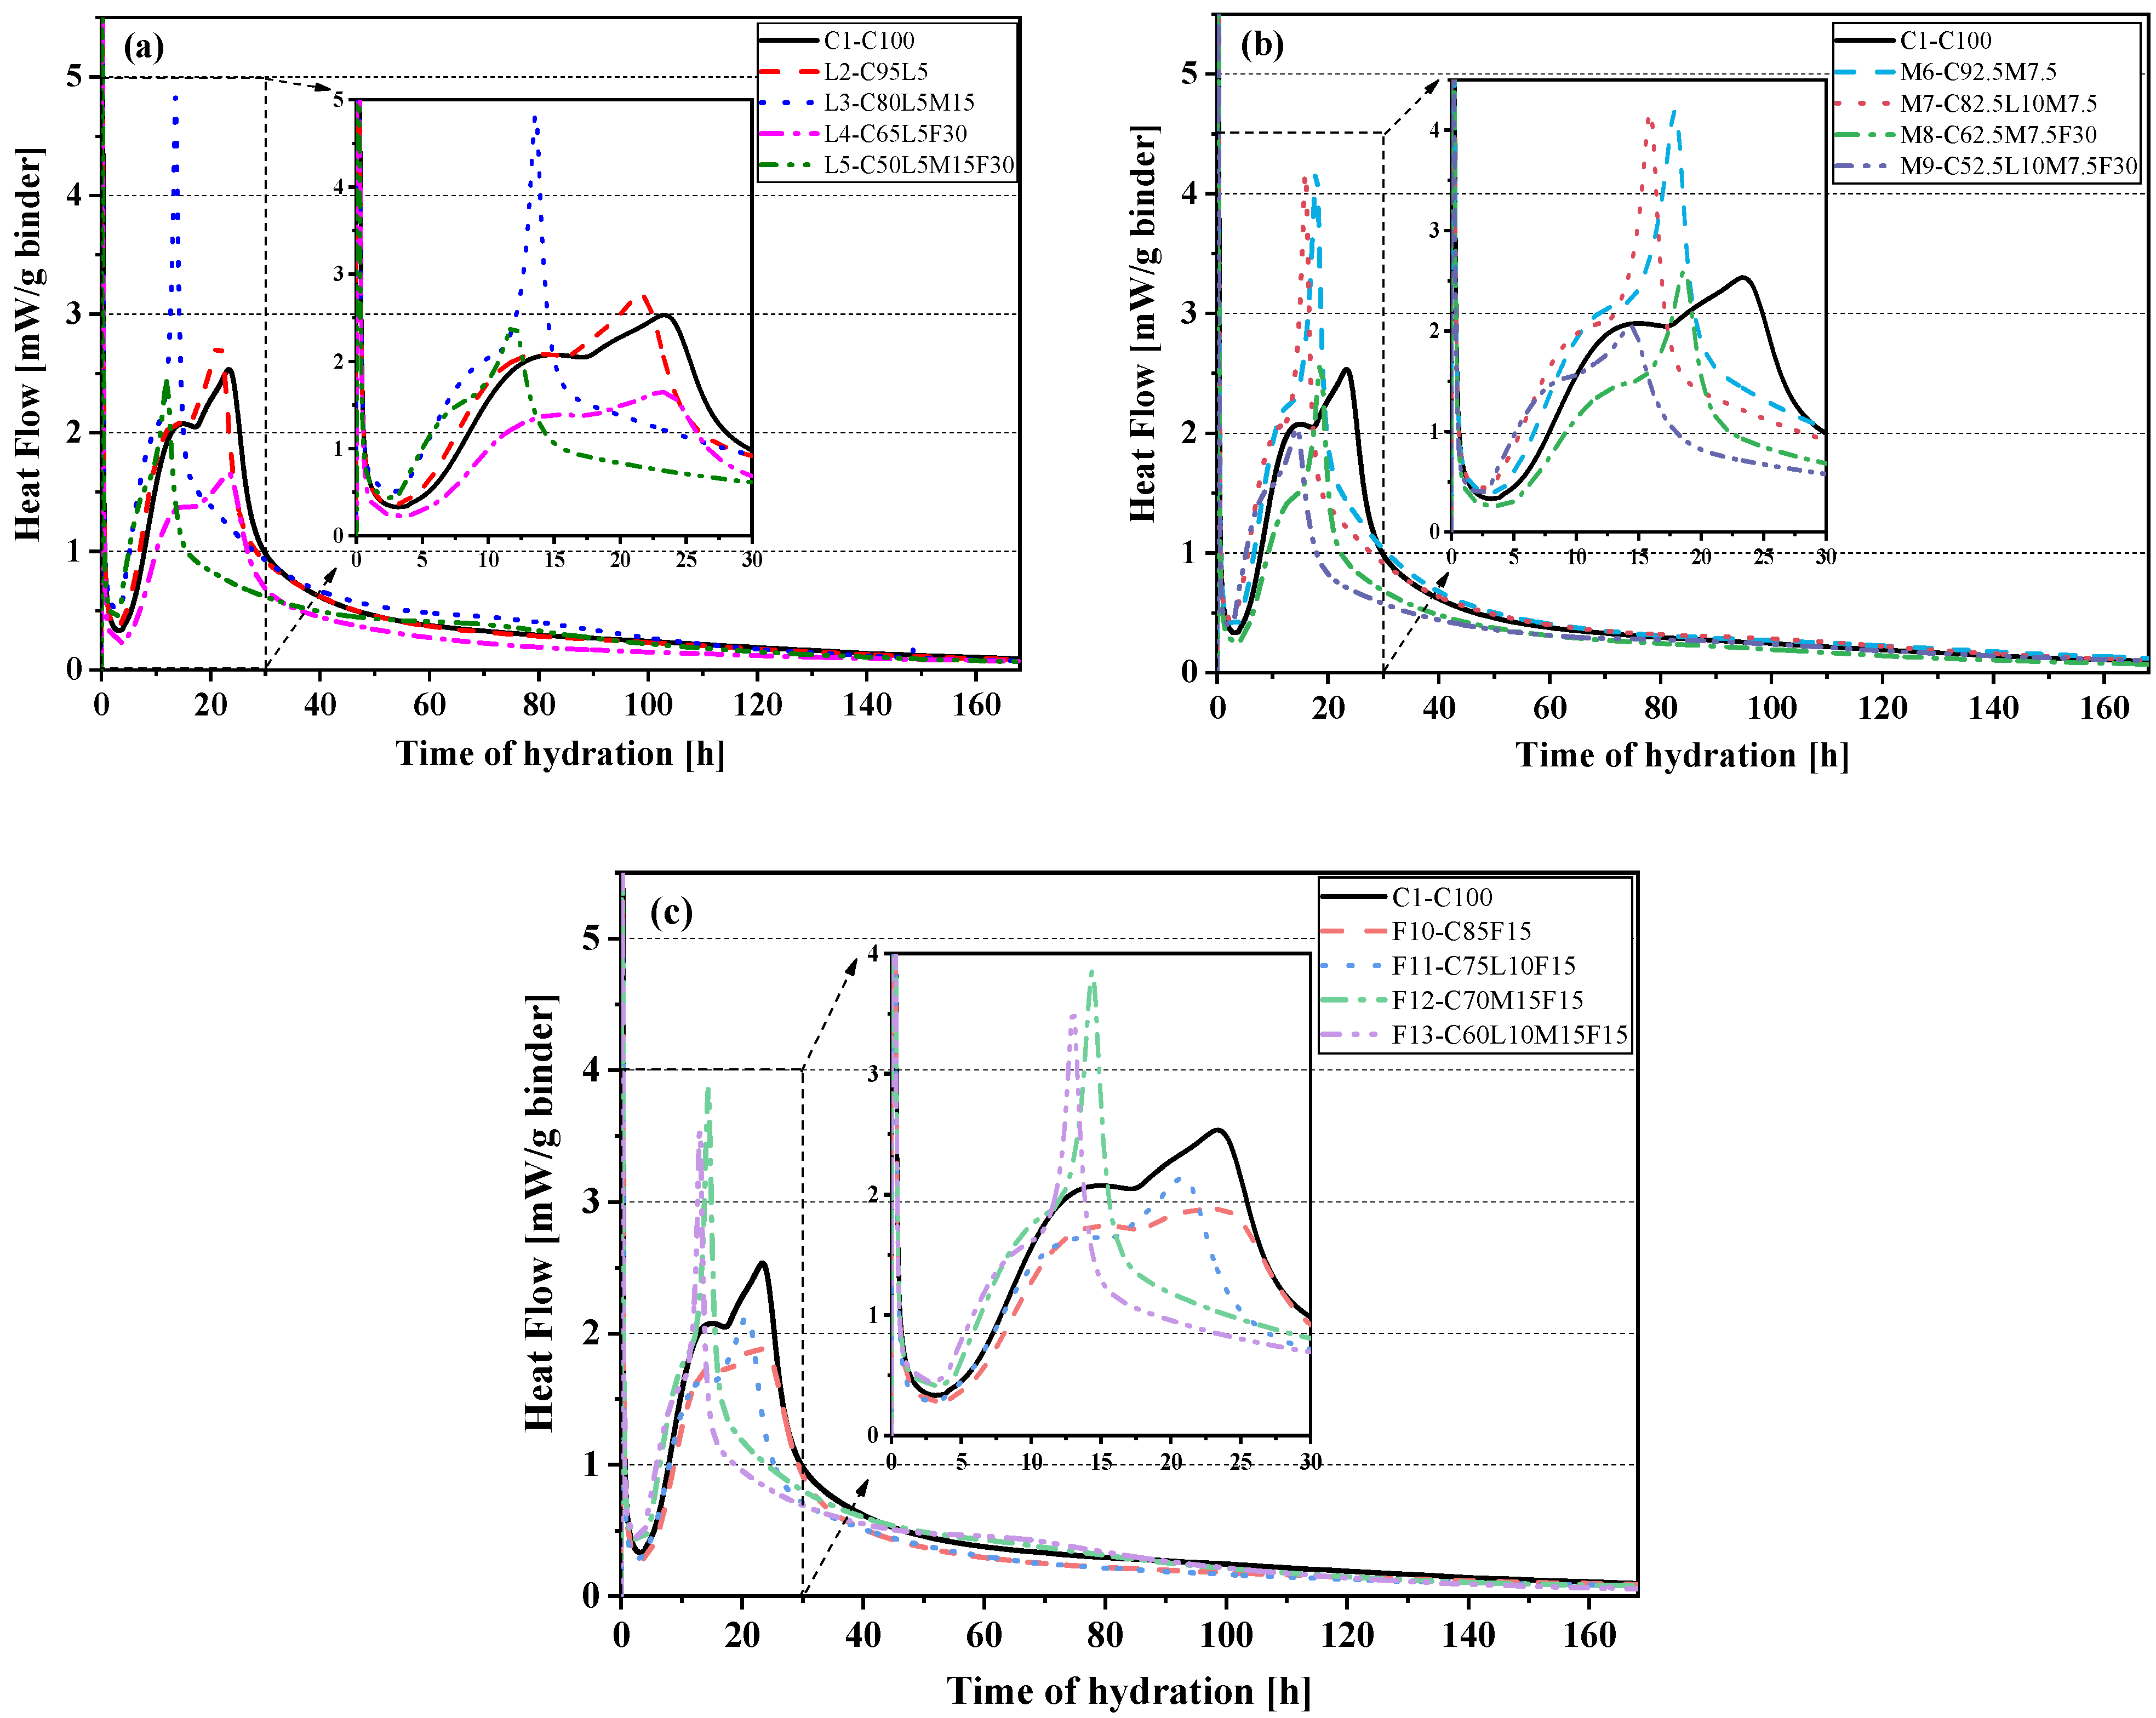
- The heat flow curve of the blended pastes L3, L5, and F13 showed a reaction peak caused by carboaluminate (Hc and Mc) production at about 60 h, which rapidly increases the accumulated heat release, also at 60 h.
- (3)
- The nucleation effect of limestone powder is helpful for improvement of early-age strength. LS and MK have a synergic effect for strength development. Too much FA substitution lowers compressive strength.
- (4)
- The addition of alternative materials was the main factor affecting the ultrasonic pulse velocity. In addition, the ultrasonic pulse velocity had a strong correlation with the compressive strength; Pearson’s correlation coefficient was 0.96.
- (5)
- The surface resistivity test results found that the quaternary-blended paste had a very significant positive effect on the durability of concrete. At 28 days, the quaternary-blended pastes L5 and F13 reached 299 and 295 KΩ·cm, respectively.
- (6)
- The combined analysis of XRD and FTIR confirmed that when limestone powder is added, aluminate can preferentially consume calcium carbonate to form Hc and Mc. Furthermore, the presence of aluminate was more conducive to Hc’s formation.
- (7)
- After standardizing the compressive strength and CO2 emissions, we found that the normalized CO2 emissions of the quaternary-blended pastes were less than that of the pure cement paste. Therefore, the quaternary-blended pastes had an obvious positive role in sustainable development.
Author Contributions
Funding
Institutional Review Board Statement
Informed Consent Statement
Data Availability Statement
Conflicts of Interest
References
- He, Z.; Zhu, X.; Wang, J.; Mu, M.; Wang, Y. Comparison of CO2 emissions from OPC and recycled cement production. Constr. Build. Mater. 2019, 211, 965–973. [Google Scholar] [CrossRef]
- Schöler, A.; Lothenbach, B.; Winnefeld, F.; Zajac, M. Hydration of quaternary Portland cement blends containing blast-furnace slag, siliceous fly ash and limestone powder. Cem. Concr. Compos. 2015, 55, 374–382. [Google Scholar] [CrossRef]
- Lee, H.-S.; Lim, S.-M.; Wang, X.-Y. Optimal Mixture Design of Low-CO2 High-Volume Slag Concrete Considering Climate Change and CO2 Uptake. Int. J. Concr. Struct. Mater. 2019, 13, 56. [Google Scholar] [CrossRef]
- Schneider, M.; Romer, M.; Tschudin, M.; Bolio, H. Sustainable cement production—present and future. Cem. Concr. Res. 2011, 41, 642–650. [Google Scholar] [CrossRef]
- Duan, L.; Hu, W.; Deng, D.; Fang, W.; Xiong, M.; Lu, P.; Li, Z.; Zhai, C. Impacts of reducing air pollutants and CO2 emissions in urban road transport through 2035 in Chongqing, China. Environ. Sci. Ecotechnol. 2021, 8, 100125. [Google Scholar] [CrossRef]
- Di Filippo, J.; Karpman, J.; DeShazo, J.R. The impacts of policies to reduce CO2 emissions within the concrete supply chain. Cem. Concr. Compos. 2019, 101, 67–82. [Google Scholar] [CrossRef]
- Skibsted, J.; Snellings, R. Reactivity of supplementary cementitious materials (SCMs) in cement blends. Cem. Concr. Res. 2019, 124, 105799. [Google Scholar] [CrossRef]
- Yang, K.-H.; Jung, Y.-B.; Cho, M.-S.; Tae, S.-H. Effect of supplementary cementitious materials on reduction of CO2 emissions from concrete. J. Clean. Prod. 2015, 103, 774–783. [Google Scholar] [CrossRef]
- Harrison, E.; Berenjian, A.; Seifan, M. Recycling of waste glass as aggregate in cement-based materials. Environ. Sci. Ecotechnol. 2020, 4, 100064. [Google Scholar] [CrossRef]
- Juenger, M.C.G.; Siddique, R. Recent advances in understanding the role of supplementary cementitious materials in concrete. Cem. Concr. Res. 2015, 78, 71–80. [Google Scholar] [CrossRef]
- Adu-Amankwah, S.; Zajac, M.; Stabler, C.; Lothenbach, B.; Black, L. Influence of limestone on the hydration of ternary slag cements. Cem. Concr. Res. 2017, 100, 96–109. [Google Scholar] [CrossRef]
- De Weerdt, K.; Kjellsen, K.O.; Sellevold, E.; Justnes, H. Synergy between fly ash and limestone powder in ternary cements. Cem. Concr. Compos. 2011, 33, 30–38. [Google Scholar] [CrossRef]
- Thongsanitgarn, P.; Wongkeo, W.; Chaipanich, A. Hydration and compressive strength of blended cement containing fly ash and limestone as cement replacement. J. Mater. Civ. Eng. 2014, 26, 04014088. [Google Scholar] [CrossRef]
- Du, H.; Pang, S.D. High-performance concrete incorporating calcined kaolin clay and limestone as cement substitute. Constr. Build. Mater. 2020, 264, 120152. [Google Scholar] [CrossRef]
- Dhandapani, Y.; Sakthivel, T.; Santhanam, M.; Gettu, R.; Pillai, R.G. Mechanical properties and durability performance of concretes with Limestone Calcined Clay Cement (LC3). Cem. Concr. Res. 2018, 107, 136–151. [Google Scholar] [CrossRef]
- Jin, D.; Wang, J.; You, L.; Ge, D.; Liu, C.; Liu, H.; You, Z. Waste cathode-ray-tube glass powder modified asphalt materials: Preparation and characterization. J. Clean. Prod. 2021, 314, 127949. [Google Scholar] [CrossRef]
- Cai, Q.; Ma, B.; Jiang, J.; Wang, J.; Shao, Z.; Hu, Y.; Qian, B.; Wang, L. Utilization of waste red gypsum in autoclaved aerated concrete preparation. Constr. Build. Mater. 2021, 291, 123376. [Google Scholar] [CrossRef]
- Yang, S.; Lee, H. Coefficient of Thermal Expansion of RCA Concrete Made by Equivalent Mortar Volume. Appl. Sci. 2021, 11, 8214. [Google Scholar] [CrossRef]
- Lehner, P.; Ghosh, P.; Konečný, P. Statistical analysis of time dependent variation of diffusion coefficient for various binary and ternary based concrete mixtures. Constr. Build. Mater. 2018, 183, 75–87. [Google Scholar] [CrossRef]
- ASTM C305-20. Standard Practice for Mechanical Mixing of Hydraulic Cement Pastes and Mortars of Plastic Consistency; ASTM International: West Conshohocken, PA, USA, 2020. [Google Scholar]
- Choi, M.S.; Lee, J.S.; Ryu, K.S.; Koh, K.-T.; Kwon, S.H. Estimation of rheological properties of UHPC using mini slump test. Constr. Build. Mater. 2016, 106, 632–639. [Google Scholar] [CrossRef]
- Han, Y.; Lin, R.; Wang, X.-Y. Performance of sustainable concrete made from waste oyster shell powder and blast furnace slag. J. Build. Eng. 2022, 47, 103918. [Google Scholar] [CrossRef]
- Lin, R.S.; Wang, X.Y.; Lee, H.S.; Cho, H.K. Hydration and Microstructure of Cement Pastes with Calcined Hwangtoh Clay. Materials 2019, 12, 458. [Google Scholar] [CrossRef] [Green Version]
- ASTM C597-16. Standard Test Method for Pulse Velocity Through Concrete; ASTM International: West Conshohocken, PA, USA, 2016. [Google Scholar]
- ASTM C349-18. Standard Test Method for Compressive Strength of Hydraulic-Cement Mortars (Using Portions of Prisms Broken in Flexure); ASTM International: West Conshohocken, PA, USA, 2018. [Google Scholar]
- Ghosh, P.; Tran, Q. Influence of parameters on surface resistivity of concrete. Cem. Concr. Compos. 2015, 62, 134–145. [Google Scholar] [CrossRef]
- AASHTO T 358. Standard Method of Test for Surface Resistivity Indication of Concrete’s Ability to Resist Chloride Ion Penetration; American Association of State Highway and Transportation Officials: Washington, DC, USA, 2015. [Google Scholar]
- Lin, R.-S.; Han, Y.; Wang, X.-Y. Macro–meso–micro experimental studies of calcined clay limestone cement (LC3) paste subjected to elevated temperature. Cem. Concr. Compos. 2021, 116, 103871. [Google Scholar] [CrossRef]
- Lin, R.-S.; Wang, X.-Y.; Zhang, G.-Y. Effects of Quartz Powder on the Microstructure and Key Properties of Cement Paste. Sustainability 2018, 10, 3369. [Google Scholar] [CrossRef] [Green Version]
- Vance, K.; Kumar, A.; Sant, G.; Neithalath, N. The rheological properties of ternary binders containing Portland cement, limestone, and metakaolin or fly ash. Cem. Concr. Res. 2013, 52, 196–207. [Google Scholar] [CrossRef]
- Jiang, D.; Li, X.; Lv, Y.; Zhou, M.; He, C.; Jiang, W.; Liu, Z.; Li, C. Utilization of limestone powder and fly ash in blended cement: Rheology, strength and hydration characteristics. Constr. Build. Mater. 2020, 232, 117228. [Google Scholar] [CrossRef]
- Mehdipour, I.; Razzaghi, M.S.; Amini, K.; Shekarchi, M. Effect of mineral admixtures on fluidity and stability of self-consolidating mortar subjected to prolonged mixing time. Constr. Build. Mater. 2013, 40, 1029–1037. [Google Scholar] [CrossRef]
- Li, Z.; Lu, D.; Gao, X. Analysis of correlation between hydration heat release and compressive strength for blended cement pastes. Constr. Build. Mater. 2020, 260, 120436. [Google Scholar] [CrossRef]
- Lee, H.-S.; Wang, X.-Y. Hydration Model and Evaluation of the Properties of Calcined Hwangtoh Binary Blends. Int. J. Concr. Struct. Mater. 2021, 15, 1–15. [Google Scholar] [CrossRef]
- Thongsanitgarn, P.; Wongkeo, W.; Chaipanich, A.; Poon, C.S. Heat of hydration of Portland high-calcium fly ash cement incorporating limestone powder: Effect of limestone particle size. Constr. Build. Mater. 2014, 66, 410–417. [Google Scholar] [CrossRef]
- Vance, K.; Aguayo, M.; Oey, T.; Sant, G.; Neithalath, N. Hydration and strength development in ternary portland cement blends containing limestone and fly ash or metakaolin. Cem. Concr. Compos. 2013, 39, 93–103. [Google Scholar] [CrossRef]
- De Matos, P.R.; Junckes, R.; Graeff, E.; Prudêncio, L.R., Jr. Effectiveness of fly ash in reducing the hydration heat release of mass concrete. J. Build. Eng. 2020, 28, 101063. [Google Scholar] [CrossRef]
- Zunino, F.; Scrivener, K. The reaction between metakaolin and limestone and its effect in porosity refinement and mechanical properties. Cem. Concr. Res. 2021, 140, 106307. [Google Scholar] [CrossRef]
- Mo, Z.; Gao, X.; Su, A. Mechanical performances and microstructures of metakaolin contained UHPC matrix under steam curing conditions. Constr. Build. Mater. 2021, 268, 121112. [Google Scholar] [CrossRef]
- Wang, X.-Y. Analysis of Hydration and Optimal Strength Combinations of Cement-Limestone-Metakaolin Ternary Composite. Adv. Mater. Sci. Eng. 2019, 2019, 1–13. [Google Scholar] [CrossRef] [Green Version]
- Bilal, H.; Chen, T.; Ren, M.; Gao, X.; Su, A. Influence of silica fume, metakaolin & SBR latex on strength and durability performance of pervious concrete. Constr. Build. Mater. 2021, 275, 122124. [Google Scholar]
- Lothenbach, B.; Le Saout, G.; Gallucci, E.; Scrivener, K. Influence of limestone on the hydration of Portland cements. Cem. Concr. Res. 2008, 38, 848–860. [Google Scholar] [CrossRef]
- Li, G.; Zhao, X. Properties of concrete incorporating fly ash and ground granulated blast-furnace slag. Cem. Concr. Compos. 2003, 25, 293–299. [Google Scholar] [CrossRef]
- Sujjavanich, S.; Suwanvitaya, P.; Chaysuwan, D.; Heness, G. Synergistic effect of metakaolin and fly ash on properties of concrete. Constr. Build. Mater. 2017, 155, 830–837. [Google Scholar] [CrossRef]
- Rao, S.K.; Sravana, P.; Rao, T.C. Experimental studies in Ultrasonic Pulse Velocity of roller compacted concrete pavement containing fly ash and M-sand. Int. J. Pavement Res. Technol. 2016, 9, 289–301. [Google Scholar] [CrossRef] [Green Version]
- Dhandapani, Y.; Santhanam, M. Assessment of pore structure evolution in the limestone calcined clay cementitious system and its implications for performance. Cem. Concr. Compos. 2017, 84, 36–47. [Google Scholar] [CrossRef]
- Tang, J.; Wei, S.; Li, W.; Ma, S.; Ji, P.; Shen, X. Synergistic effect of metakaolin and limestone on the hydration properties of Portland cement. Constr. Build. Mater. 2019, 223, 177–184. [Google Scholar] [CrossRef]
- Qin, L.; Gao, X.; Su, A.; Li, Q. Effect of carbonation curing on sulfate resistance of cement-coal gangue paste. J. Clean. Prod. 2021, 278, 123897. [Google Scholar] [CrossRef]
- Lin, R.-S.; Lee, H.-S.; Han, Y.; Wang, X.-Y. Experimental studies on hydration–strength–durability of limestone-cement-calcined Hwangtoh clay ternary composite. Constr. Build. Mater. 2020, 269, 121290. [Google Scholar] [CrossRef]
- Sabir, B.B.; Wild, S.; Bai, J. Metakaolin and calcined clays as pozzolans for concrete: A review. Cem. Concr. Compos. 2001, 23, 441–454. [Google Scholar] [CrossRef]
- Lin, R.-S.; Park, K.-B.; Wang, X.-Y.; Zhang, G.-Y. Increasing the early strength of high-volume Hwangtoh–cement systems using bassanite. J. Build. Eng. 2020, 30, 101317. [Google Scholar] [CrossRef]
- Richard, T.; Mercury, L.; Poulet, F.; d’Hendecourt, L. Diffuse reflectance infrared Fourier transform spectroscopy as a tool to characterise water in adsorption/confinement situations. J. Colloid. Interface Sci. 2006, 304, 125–136. [Google Scholar] [CrossRef]
- Ylmén, R.; Jäglid, U.; Steenari, B.-M.; Panas, I. Early hydration and setting of Portland cement monitored by IR, SEM and Vicat techniques. Cem. Concr. Res. 2009, 39, 433–439. [Google Scholar] [CrossRef]
- Shao, J.; Gao, J.; Zhao, Y.; Chen, X. Study on the pozzolanic reaction of clay brick powder in blended cement pastes. Constr. Build. Mater. 2019, 213, 209–215. [Google Scholar] [CrossRef]
- Li, L.G.; Kwan, A.K.H. Adding limestone fines as cementitious paste replacement to improve tensile strength, stiffness and durability of concrete. Cem. Concr. Compos. 2015, 60, 17–24. [Google Scholar] [CrossRef]
- Miller, S.A.; John, V.M.; Pacca, S.A.; Horvath, A. Carbon dioxide reduction potential in the global cement industry by 2050. Cem. Concr. Res. 2018, 114, 115–124. [Google Scholar] [CrossRef]
- Trtnik, G.; Kavcic, F.; Turk, G. Prediction of concrete strength using ultrasonic pulse velocity and artificial neural networks. Ultrasonics 2009, 49, 53–60. [Google Scholar] [CrossRef] [Green Version]
- Wang, C.-C.; Wang, H.-Y. Assessment of the compressive strength of recycled waste LCD glass concrete using the ultrasonic pulse velocity. Constr. Build. Mater. 2017, 137, 345–353. [Google Scholar] [CrossRef]
- Mandal, T.; Tinjum, J.M.; Edil, T.B. Non-destructive testing of cementitiously stabilized materials using ultrasonic pulse velocity test. Transp. Geotech. 2016, 6, 97–107. [Google Scholar] [CrossRef]


| Chemical Compositions | OPC | LS | MK | FA |
|---|---|---|---|---|
| SiO2 | 20.6 | - | 52.1 | 50.3 |
| Al2O3 | 4.74 | 0.19 | 45.2 | 20.52 |
| Fe2O3 | 2.66 | - | 0.253 | 7.87 |
| CaO | 62.3 | 59.14 | 0.302 | 9.97 |
| K2O | 0.957 | - | 0.08 | 1.53 |
| MgO | 2.59 | 0.41 | - | 3.13 |
| Na2O | - | - | - | 0.92 |
| TiO2 | 0.291 | - | 0.514 | 0.87 |
| SO3 | 2.51 | - | - | 0.301 |
| LOI a | 2.57 | 39.52 | 0.989 | 3.925 |
| OPC | LS | MK | FA | |
|---|---|---|---|---|
| d50 (μm) | 17.8 | 11.6 | 3.84 | 30.6 |
| Specific gravity | 3.14 | 2.74 | 2.50 | 2.35 |
| Mixed No. | OPC (wt.%) | LS (wt.%) | MK (wt.%) | FA (wt.%) | OPC (kg/m3) | LS (kg/m3) | MK (kg/m3) | FA (kg/m3) |
|---|---|---|---|---|---|---|---|---|
| Control specimen | ||||||||
| C1(C100) | 100 | 0 | 0 | 0 | 1223.3 | - | - | - |
| System with 5% LS | ||||||||
| L2(C95L5) | 95 | 5 | 0 | 0 | 1158.77 | 60.99 | - | - |
| L3(C80L5M15) | 80 | 5 | 15 | 0 | 961.29 | 60.08 | 180.24 | - |
| L4(C65L5F30) | 65 | 5 | 0 | 30 | 762.68 | 58.67 | - | 352.01 |
| L5(C50L5M15F30) | 50 | 5 | 15 | 30 | 578.28 | 57.83 | 173.48 | 346.97 |
| System with 7.5% MK | ||||||||
| M6(C92.5M7.5) | 92.5 | 0 | 7.5 | 0 | 1123.05 | - | 91.06 | - |
| M7(C82.5L10M7.5) | 82.5 | 10 | 7.5 | 0 | 995.89 | 120.72 | 90.54 | - |
| M8(C62.5M7.5F30) | 62.5 | 0 | 7.5 | 30 | 730.08 | - | 87.61 | 350.44 |
| M9(C52.5L10M7.5F30) | 52.5 | 10 | 7.5 | 30 | 609.88 | 116.17 | 87.13 | 348.5 |
| System with 15% FA | ||||||||
| F10(C85F15) | 85 | 0 | 0 | 15 | 1019.59 | - | - | 179.93 |
| F11(C75L10F15) | 75 | 10 | 0 | 15 | 894.54 | 119.27 | - | 178.91 |
| F12(C70M15F15) | 70 | 0 | 15 | 15 | 827.37 | - | 177.29 | 177.29 |
| F13(C60L10M15F15) | 60 | 10 | 15 | 15 | 705.22 | 117.54 | 176.3 | 176.3 |
| Raw Material Limestone | OPC | LS | MK | FA |
|---|---|---|---|---|
| CO2 emission factor (kg·CO2/kg) | 0.86 | 0.008 | 0.21 | 0.04 |
Publisher’s Note: MDPI stays neutral with regard to jurisdictional claims in published maps and institutional affiliations. |
© 2021 by the authors. Licensee MDPI, Basel, Switzerland. This article is an open access article distributed under the terms and conditions of the Creative Commons Attribution (CC BY) license (https://creativecommons.org/licenses/by/4.0/).
Share and Cite
Han, Y.; Oh, S.; Wang, X.-Y.; Lin, R.-S. Hydration–Strength–Workability–Durability of Binary, Ternary, and Quaternary Composite Pastes. Materials 2022, 15, 204. https://doi.org/10.3390/ma15010204
Han Y, Oh S, Wang X-Y, Lin R-S. Hydration–Strength–Workability–Durability of Binary, Ternary, and Quaternary Composite Pastes. Materials. 2022; 15(1):204. https://doi.org/10.3390/ma15010204
Chicago/Turabian StyleHan, Yi, Seokhoon Oh, Xiao-Yong Wang, and Run-Sheng Lin. 2022. "Hydration–Strength–Workability–Durability of Binary, Ternary, and Quaternary Composite Pastes" Materials 15, no. 1: 204. https://doi.org/10.3390/ma15010204
APA StyleHan, Y., Oh, S., Wang, X.-Y., & Lin, R.-S. (2022). Hydration–Strength–Workability–Durability of Binary, Ternary, and Quaternary Composite Pastes. Materials, 15(1), 204. https://doi.org/10.3390/ma15010204